Article

In Situ EPR Characterization of a Cobalt Oxide Water Oxidation Catalyst at Neutral pH

1
Max-Planck-Institut für Chemische Energiekonversion, Stiftstr. 34-36, 45470 Mülheim an der Ruhr, Germany
2
Research School of Chemistry, The Australian National University, Canberra, ACT 2601, Australia
*
Authors to whom correspondence should be addressed.
Present address: Department of Chemistry and Chemical Biology, TU Dortmund University, D-44227 Dortmund, Germany.
Catalysts 2019, 9(11), 926; https://doi.org/10.3390/catal9110926
Submission received: 7 October 2019 / Revised: 31 October 2019 / Accepted: 31 October 2019 / Published: 6 November 2019
(This article belongs to the Special Issue Spectroscopy in Catalysis)

Abstract

:
Here we report an in situ electron paramagnetic resonance (EPR) study of a low-cost, high-stability cobalt oxide electrodeposited material (Co-Pi) that oxidizes water at neutral pH and low over-potential, representing a promising system for future large-scale water splitting applications. Using CW X-band EPR we can follow the film formation from a Co(NO3)2 solution in phosphate buffer and quantify Co uptake into the catalytic film. As deposited, the film shows predominantly a Co(II) EPR signal, which converts into a Co(IV) signal as the electrode potential is increased. A purpose-built spectroelectrochemical cell allowed us to quantify the extent of Co(II) to Co(IV) conversion as a function of potential bias under operating conditions. Consistent with its role as an intermediate, Co(IV) is formed at potentials commensurate with electrocatalytic O2 evolution (+1.2 V, vs. SHE). The EPR resonance position of the Co(IV) species shifts to higher fields as the potential is increased above 1.2 V. Such a shift of the Co(IV) signal may be assigned to changes in the local Co structure, displaying a more distorted ligand field or more ligand radical character, suggesting it is this subset of sites that represents the catalytically ‘active’ component. The described spectroelectrochemical approach provides new information on catalyst function and reaction pathways of water oxidation.

Graphical Abstract

1. Introduction

The Nocera catalyst [1], a self-healing [2], cobalt/phosphate derivative (Co-Pi), formed in situ from a CoII solution under oxygen evolution potentials represents a promising system for future large-scale water splitting applications coupled to the production of hydrogen as fuel [3]. The Co-Pi catalyst can be deposited at oxidizing potentials from an aqueous solution of a cobalt salt in potassium phosphate buffer on a variety of conducting surfaces including glassy carbon, carbon felt, silicon, and ZnO photoanodes [4,5,6]. It has an overpotential of about 200–300 mV at 1 mA/cm2 comparable to RuO2, one of the most efficient metal oxide catalysts at present. The catalyst is particularly robust and can operate in brine and river water, suggesting that it is not inhibited by naturally occurring concentrations of other ions [7]. Integration of the Co-Pi catalyst with silicon-based semiconductors in a solar water-splitting cell has also been reported [8]. It is expected that deposition of the film involves oxidation from Co(II) to Co(III), while further oxidation presumably generates Co(IV) oxo species from which O2 is produced [9]. Related Co-based catalysts can be deposited using various electrolytes, such as borate (Co-Bi), fluoride, sulfate, etc. [10].
The groups of Dau and Nocera have studied its short-range order using in situ Co K-edge X-ray absorption spectroscopy of frozen Co-Pi catalyst electrodes [11,12]. X-ray absorption near edge structure (XANES) and extended X-ray absorption fine structure (EXAFS) spectroscopy data assign the oxidation state and the ligand field of the deposited Co to be predominantly in the EPR silent 3+ state with near-octahedral, oxygen coordination. Co–Co and Co–O distances suggest the film represents clusters of complete (Co4O4) and/or incomplete (Co3O4) cobalt-oxo cubanes, or corner and edge sharing molecular cobaltate clusters [12]. Alternative models, which include counter-ions, suggested the Co-Pi film contains tile-shaped Co10O32 units with cations (e.g., K+), anions (e.g., HPO42−) and water filling the space in between these tiles [13]. A recent synchrotron-based X-ray grazing incidence diffraction (GID) study of the Co-Pi films combined with atomic force microscopy (AFM) revealed aggregations of Co-Pi nanoparticles resulting in a highly porous film morphology, with the electrolyte anions present within the films as shown by Fourier transform infrared (FT-IR) spectroscopy [14]. In later measurements the nature of the anion was shown to modulate the conductivity of the film [15]. While the location and mechanism of O—O bond formation have been probed by differential electrochemical mass spectrometry coupled with 18O isotope labeling [16], the precise details remain under debate. Current literature favors a radical coupling mechanism between two surface/terminal Co-oxyl radicals [17,18].
There is general consensus that Co(IV) species are key reaction intermediates in the water oxidation. Co(IV), a d7 ion, is an EPR-active species in both its high-spin (4T1) and low-spin (2E) forms, and this method has been previously applied to a series of Co(IV) containing model complexes and minerals [19,20,21,22,23,24,25,26,27,28,29,30] including the Nocera catalyst. Ex situ EPR spectroscopy confirms that the net oxidation state of the Co ions of the film increases at potentials required for water oxidation catalysis. Using CW X-band EPR spectroscopy the group of Britt [31] identified a low-spin (S = 1/2) Co(IV) species centered at geff = 2.27. This finding was later confirmed by EPR studies in Co-oxide catalyst films prepared in borate, fluoride and other buffers [10]. Depending on the buffer solution and the applied potential, Co(IV) g-values ranging from 2.2 to 2.4 have been observed. In borate buffer it was found that the effective g-values slightly shift to higher resonance fields (corresponding to smaller g-values) upon increasing the applied potential during film formation with concomitant signal broadening. Co(IV) species in Co-oxide films bear a resemblance to the EPR signal seen for a tetranuclear Co(III)3Co(IV) cubane complex [Co4O4(C5H5N)4(CH3CO2)4]+ [32]. In this simpler model system multi-frequency/multi-resonance X- and Q-band EPR data show that the spin of the unpaired electron is delocalized over all four cobalt centers as well as partially over the ligands. This delocalization is reflected by an axial g-tensor [33]. Co(IV) species in Co-oxide films, on the contrary, exhibit rhombic g-tensors with significantly larger g-anisotropy as compared to their Co(III)3Co(IV) counterparts. This discrepancy was rationalized by a much more localized electron spin density on one Co center [33].
In all of these studies, measurements were conducted after manually removing the catalytic film from the electrode, drying, and freezing the sample in an EPR tube. This approach assumes that the oxidation state and the local structure of the catalytic sites remain unchanged after removal of the film. More reliable quantitative information on catalyst structures and oxidation states can be extracted from in situ EPR measurements on intact films on electrodes with applied potential. However, such measurements require dedicated spectroelectrochemical cells that can be inserted in an EPR resonator. In this study we employ a purpose-built spectroelectrochemical cell in order to preserve the oxidation state of the electrolyzed catalytic film for the EPR investigation. This is achieved by flash freezing the cell in liquid nitrogen while the potential is applied on the working electrode. Our cell design overcomes many of the problems encountered in performing EPR in tandem with electrochemistry. We demonstrate that our approach allows for quantification of Co(II) and Co(IV) states in electrodeposited Co-oxide films under applied potential bias. In addition, potential-dependent shifts of the EPR resonance are observed. Possible structural changes in the local Co structure inducing these shifts of the EPR resonance are discussed.

2. Results and Discussion

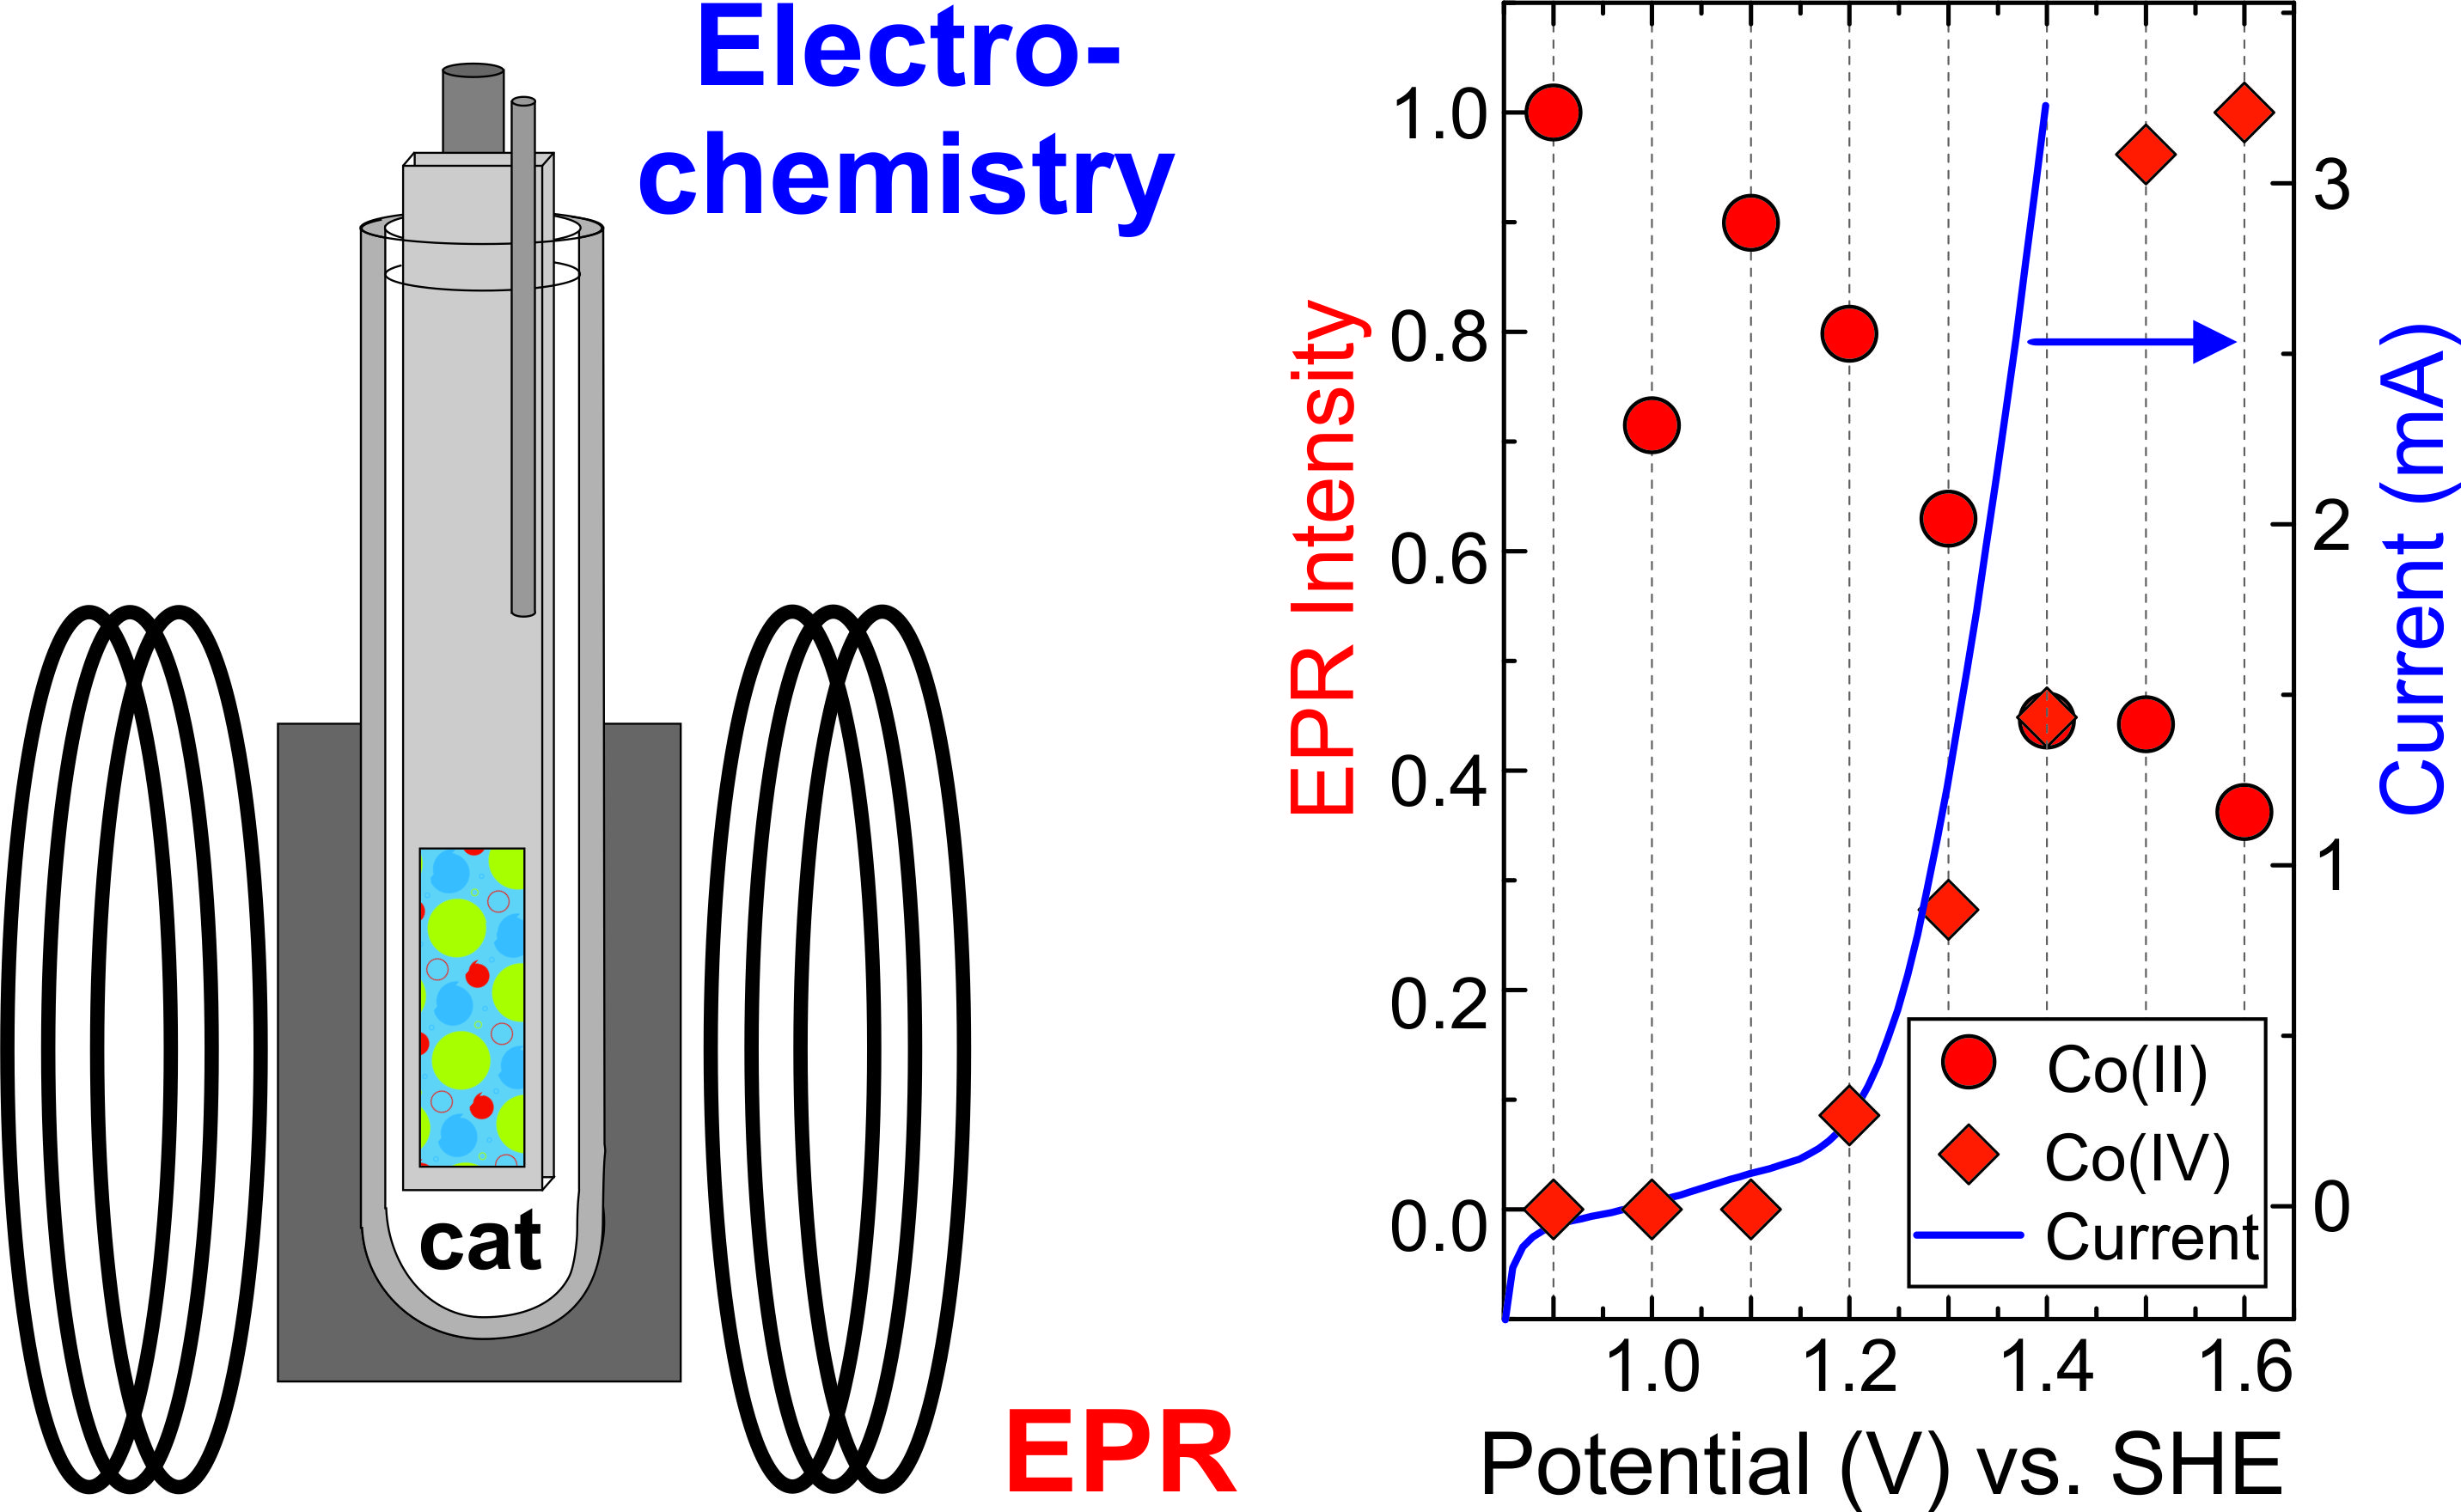
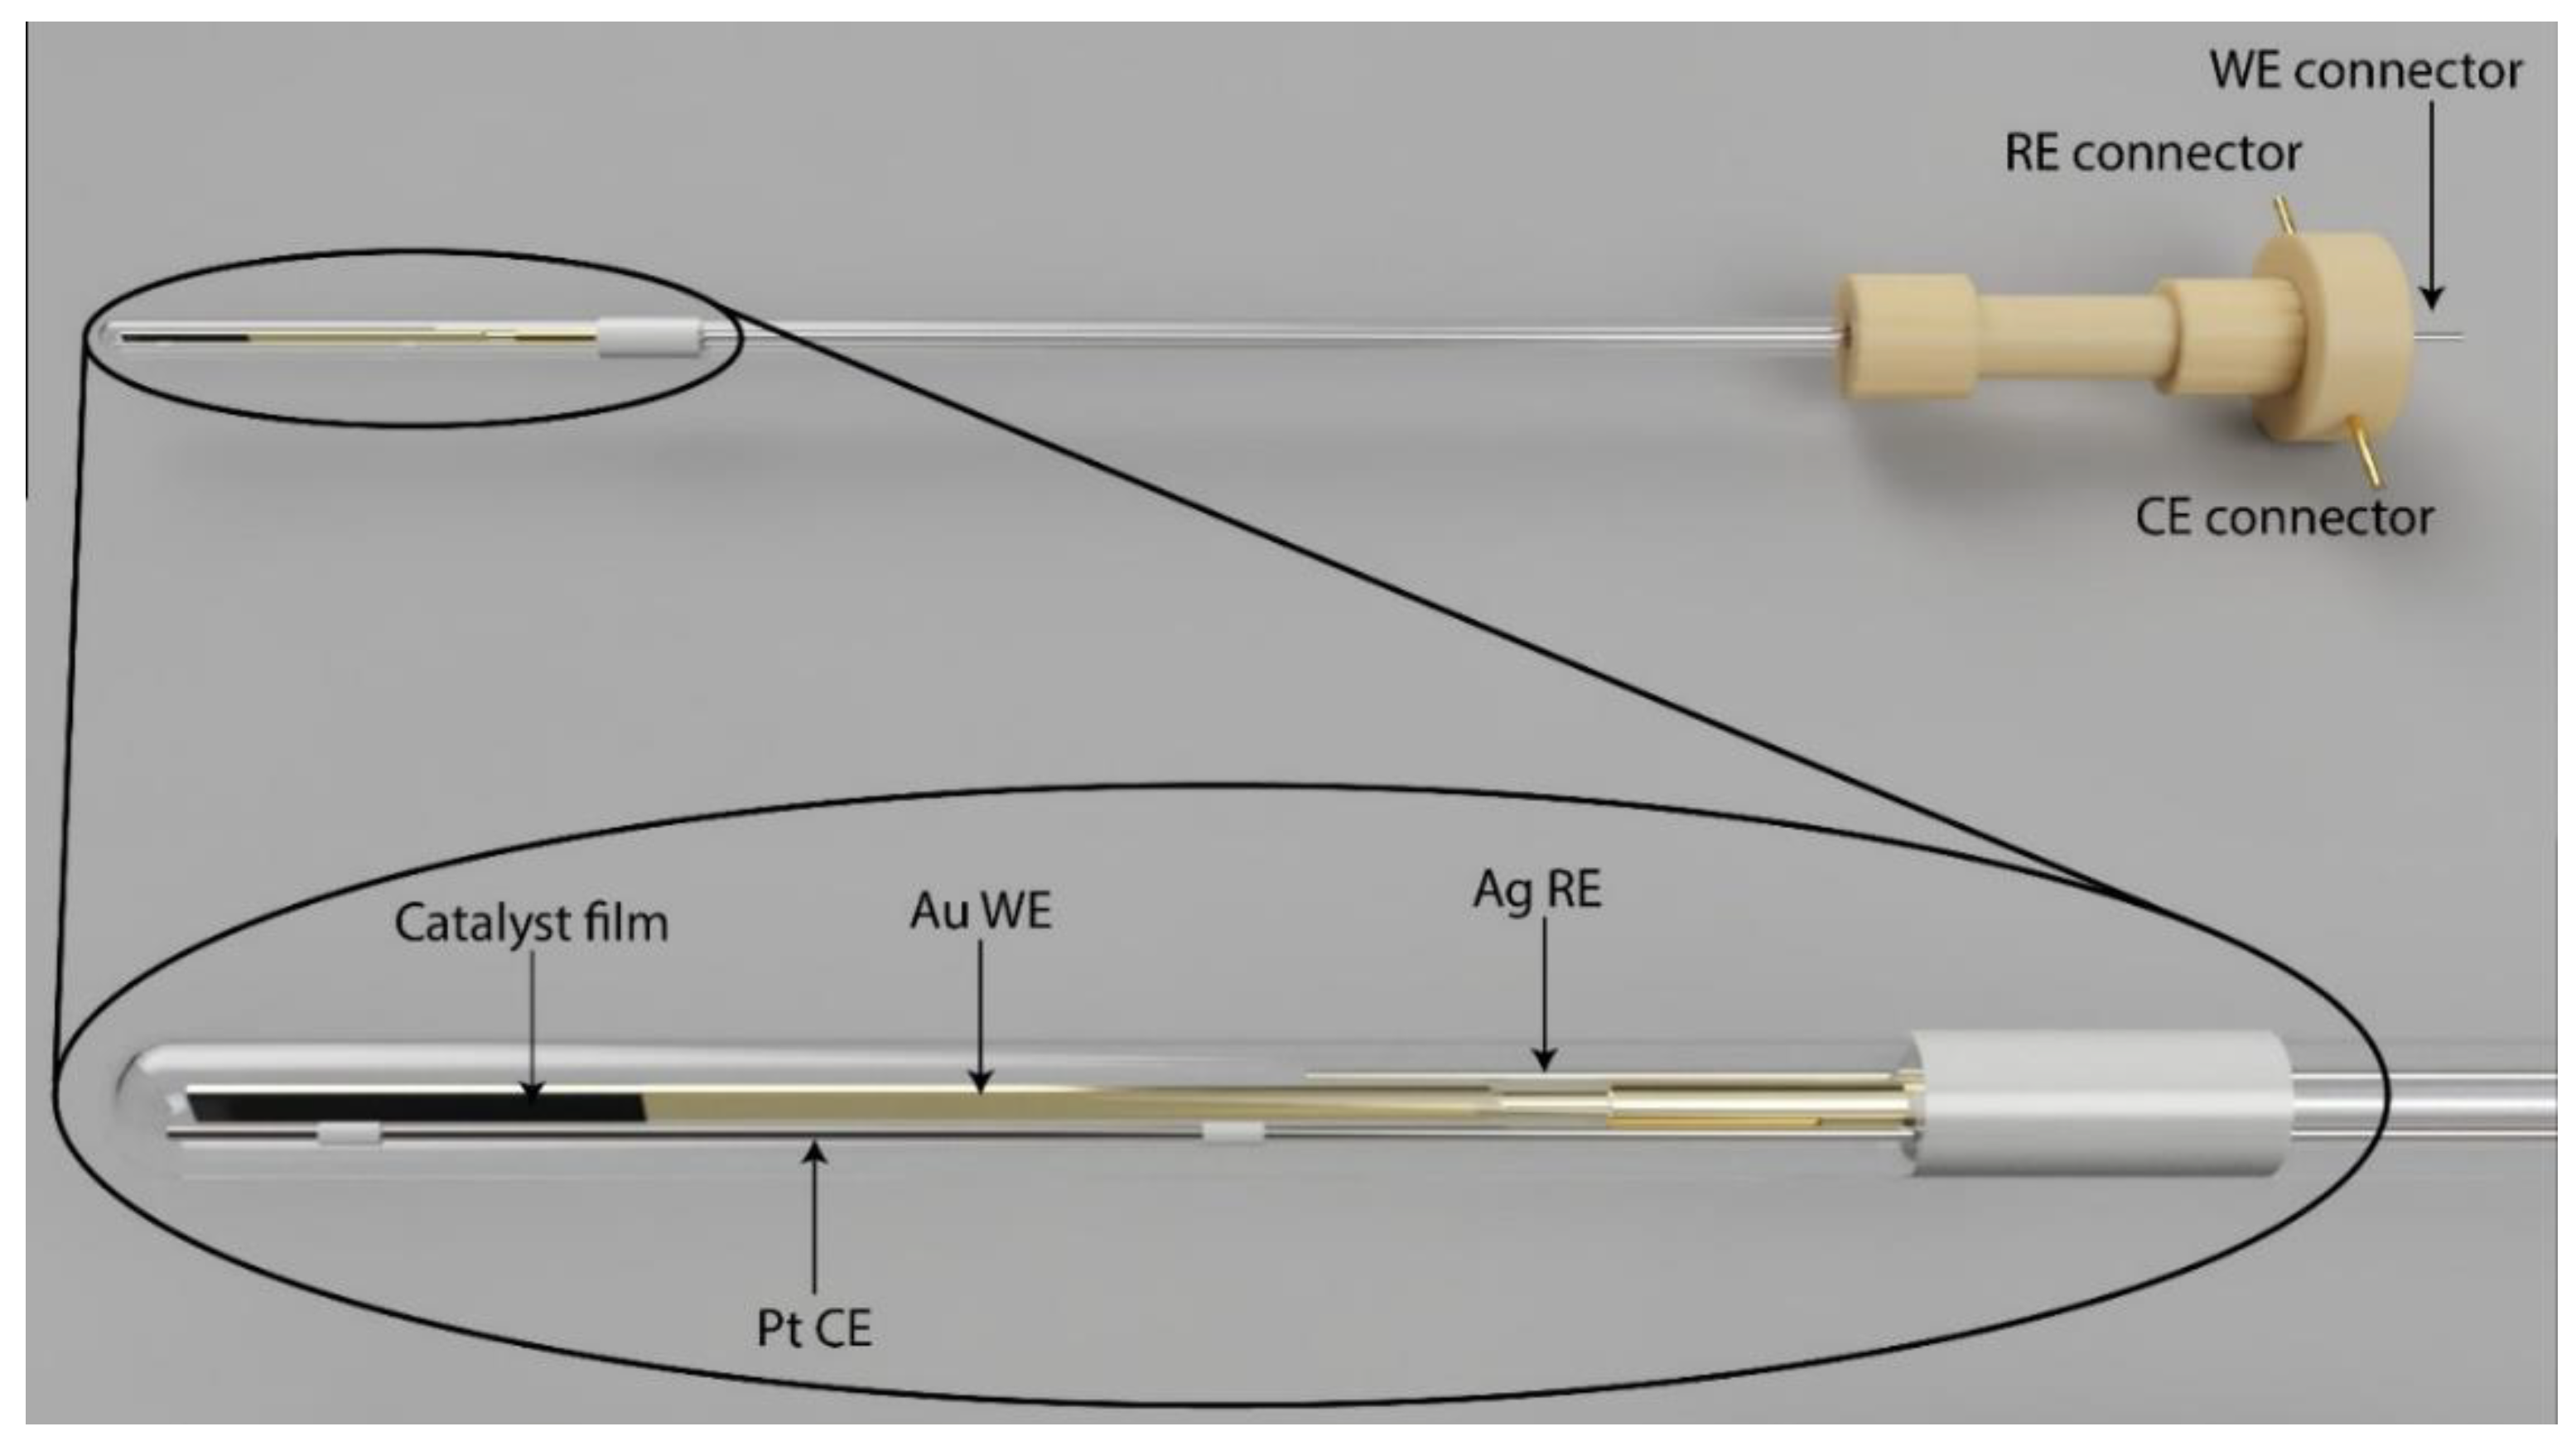
2.1. Performance of the Spectroelectrochemical Cell

The measurement of catalysts interfaced with conducting electrodes poses a series of challenges when using EPR spectroscopy. EPR measurements are conducted in EPR resonators that separate the magnetic field component (B1), inducing the EPR signal, from the electric component (E1) of the electromagnetic radiation. The conductive electrode with the electrodeposited film has to be positioned in the maximum of B1 but should be separated in space from E1. In addition, the solvent (water) also strongly dampens microwaves (MW) in the liquid phase. Both these issues are typically solved by using very small electrodes/sample geometries, which inevitably lead to a reduction of the EPR signal. Our solution to this problem was to use instead a large gold (Au) electrode within a standard X-band EPR tube frozen under operating conditions (applied bias) and measured at low temperature. These conditions were necessary as both EPR signatures (Co(II), Co(IV)) of the film are broad and can only be observed at cryogenic temperatures. Fortunately, the presence of a large conducting electrode did not dramatically change the performance of the EPR resonator, i.e., did not lead to a loss in sensitivity. However, we do note that other choices for the electrode (e.g., glassy carbon) in the chosen configuration did not allow measurement of the Co film. We also note that it is important to load the EPR tube in the same way (Au plate parallel/perpendicular to the applied magnetic field, B0) for quantitative results and that artifacts stemming from the choice of materials for connections, electrodes, etc. can be observed. Note too that the Pt counter electrode needed to be inserted all the way to the bottom of the cell in order to obtain a homogeneously applied potential on the working electrode and maximize the conversion of Co(II) to Co(IV).

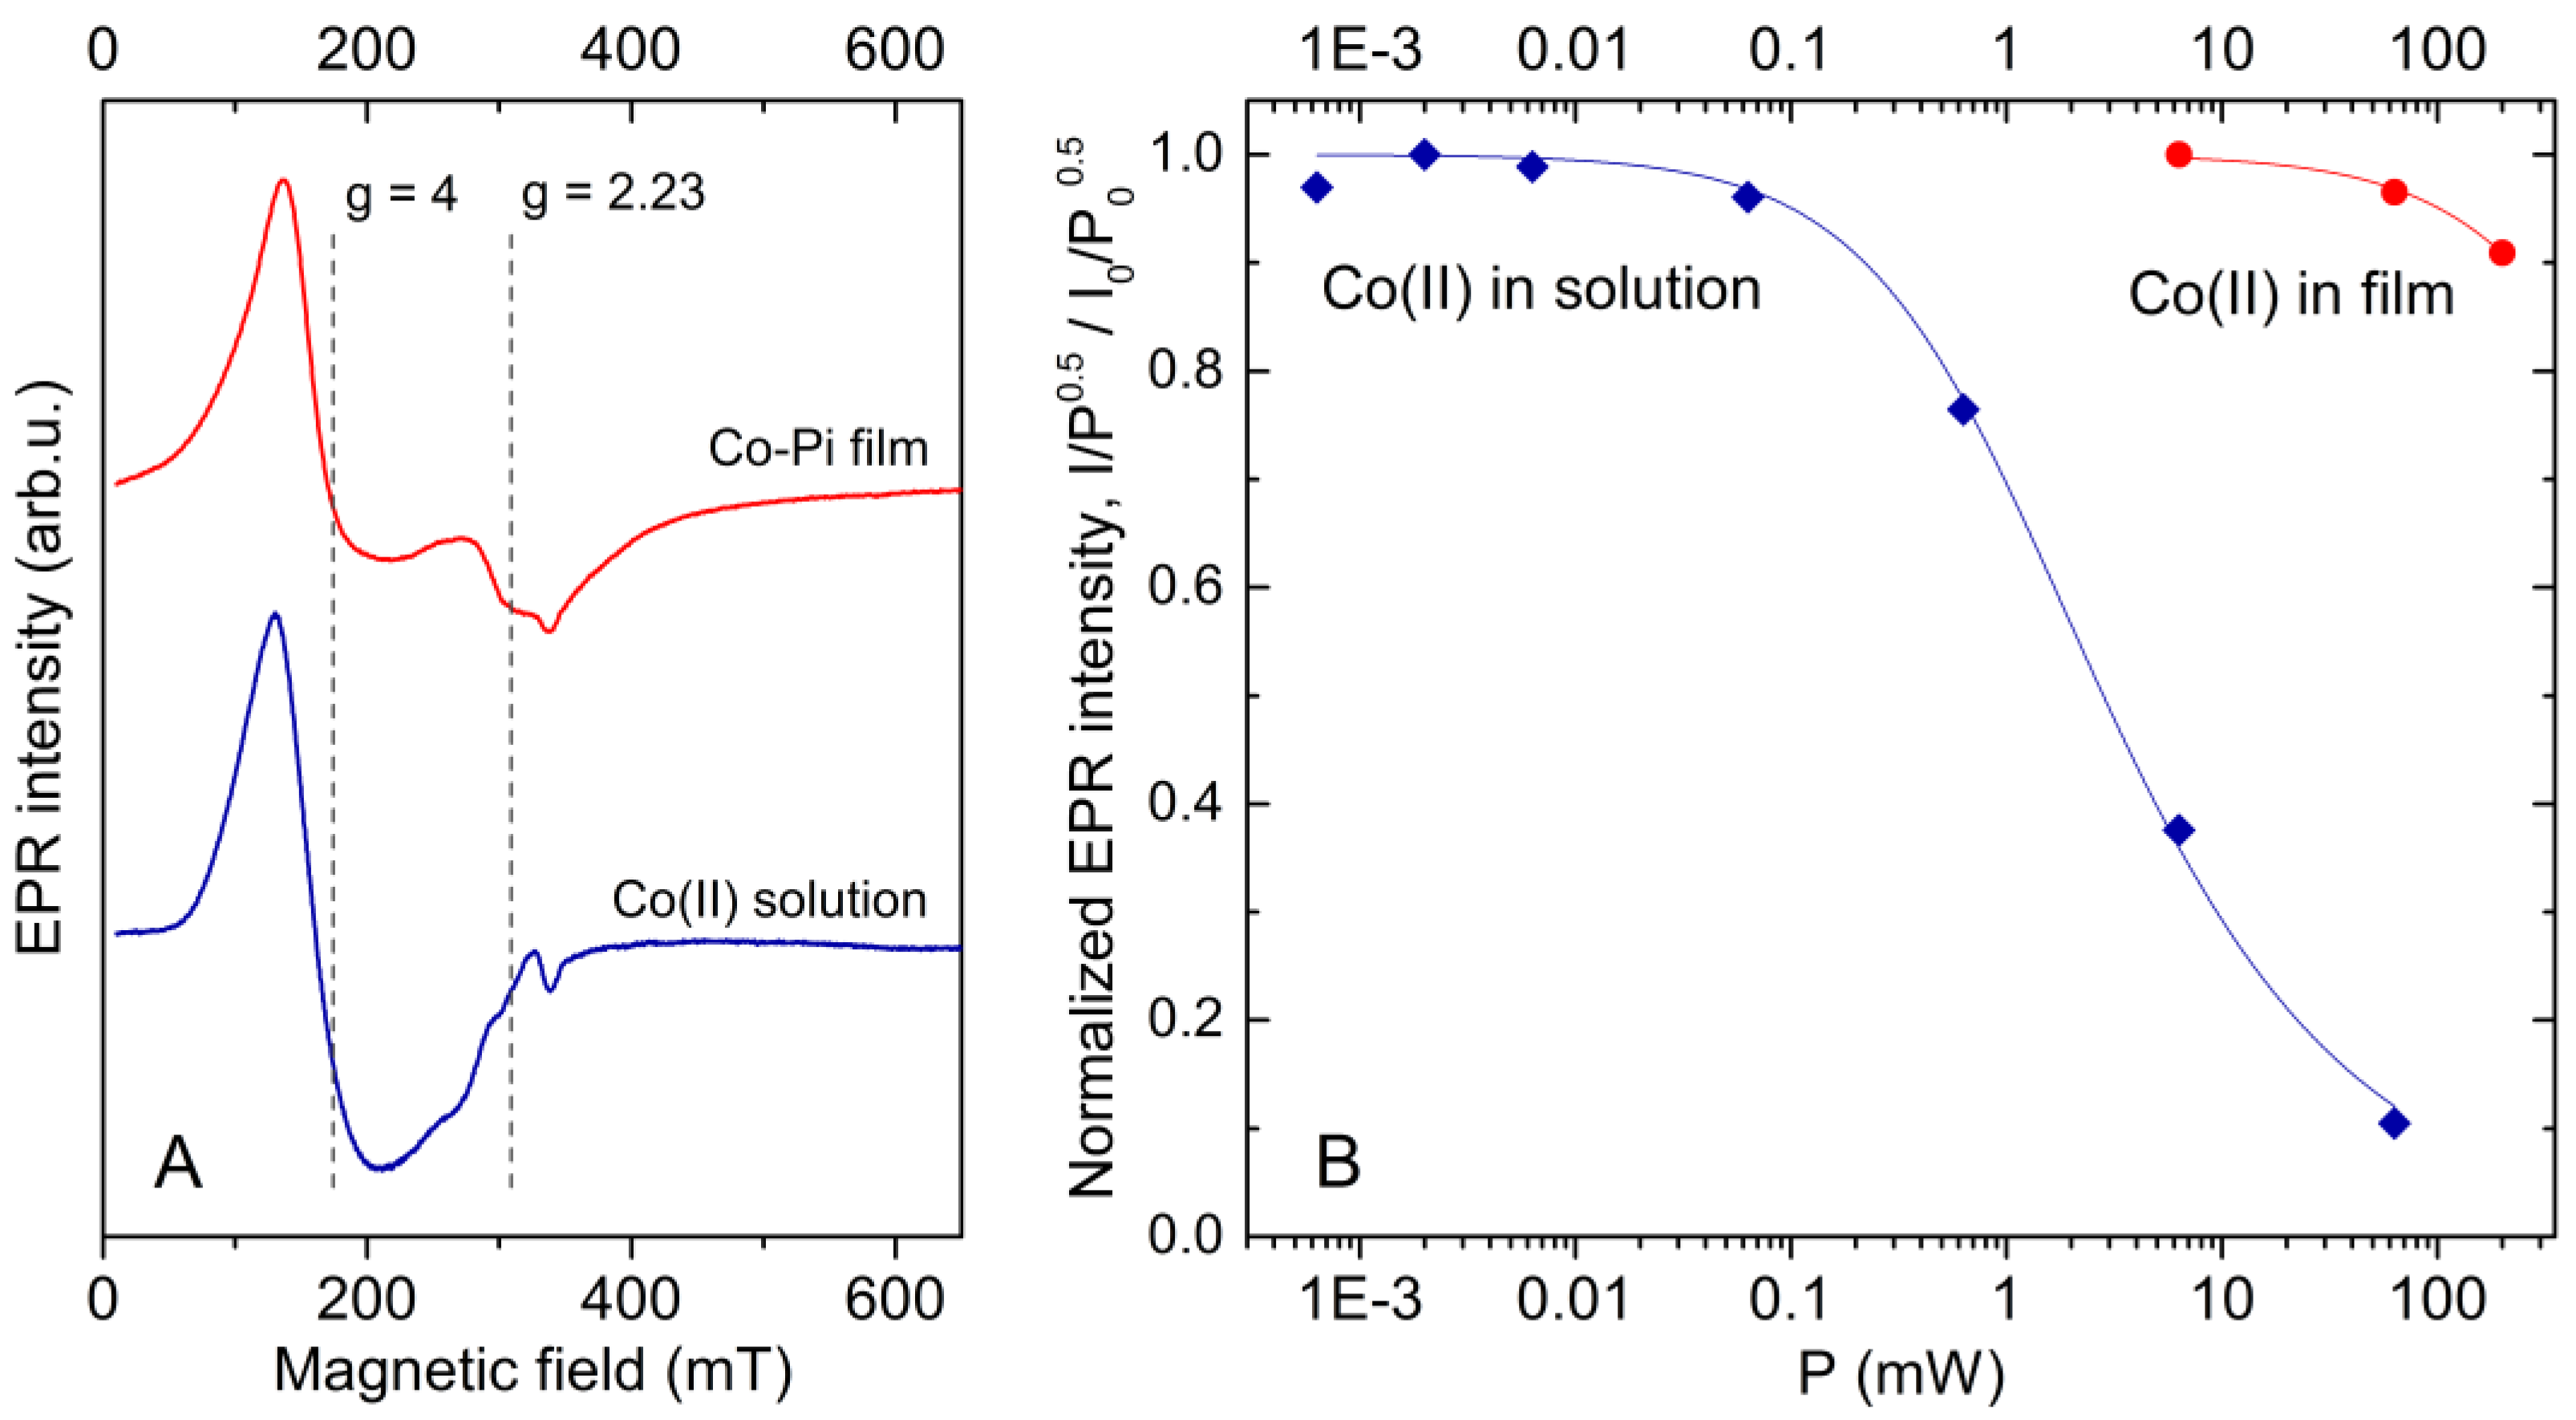
2.2. Co(II) EPR Signature

CW X-band EPR spectra of as-deposited catalytic films show a broad, featureless EPR signal at g ≈ 4, typical for Co(II) in octahedral coordination environment, with S = 3/2 and large positive zero field splitting (see Figure 1). In our set-up EPR measurements were performed in a cell containing both the Co-based film and Pi electrolyte solution. For a quantitative analysis of the paramagnetic Co states in the electrodeposited film, EPR signals from Co in the solution need to be discriminated from those in the film. Comparison of EPR spectra of the cell containing a film-covered electrode and of an aqueous 1 mM Co(NO3)2 solution in 0.1 M Pi electrolyte is shown in Figure 1A. The line shapes are fairly similar, making it impossible to quantify a possible admixture of the film and solution signals on this basis. However, it was found that the two types of Co(II) species show very different relaxation properties. In the film, the Co(II) species relaxes fast, with its EPR intensity growing as the square root of the applied microwave power (PMW) over the available range (see Figure 1B). In contrast, Co(II) in solution saturates above PMW = 0.1 mW at T = 5 K. Thus, by measuring at high power, of the order of PMW = 50 mW, the Co(II) content of the film could be ascertained, through suppressing the residual Co(II) population in solution.

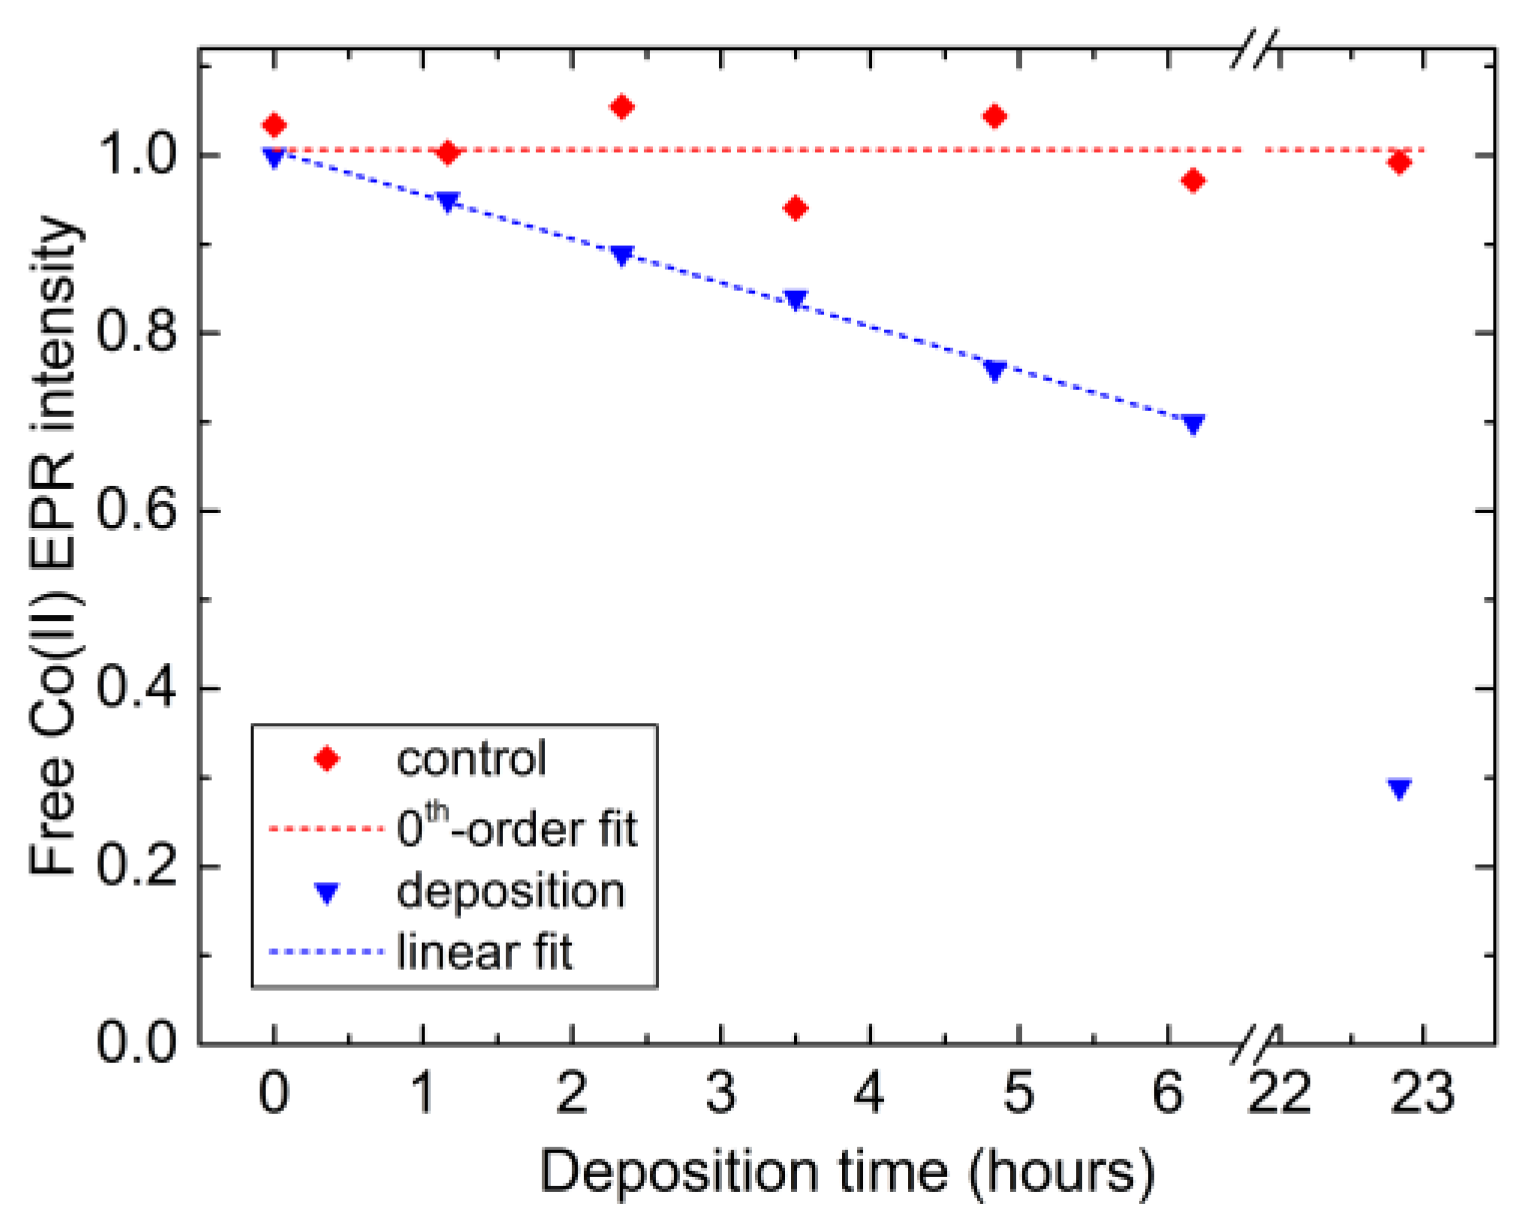
2.3. Co Uptake during the Electrodeposition

EPR was used to quantify Co uptake from a 0.5 mM Co(NO3)2 electrolyte solution into the Co-Pi film during the deposition. Aliquots of the solution were taken from the cell at several time points, and the decrease of the Co(II) concentration in solution was monitored as a function of deposition duration (see Figure 2). Simultaneously, aliquots of a control cobalt nitrate solution in Pi electrolyte were analyzed to track the Co(II) intensity in the absence of electrolysis. The same two EPR tubes were used for all time points to minimize errors in Co(II) quantification. The initial decrease in the Co(II) population is linear with time, amounting to a loss of about 22 μg of Co per hour. The loss rate decreases over time. Upon 23 h of deposition, about 70% of the Co ions initially present in solution have incorporated into the film. No change in the Co(II) EPR intensity was observed for the control solution.

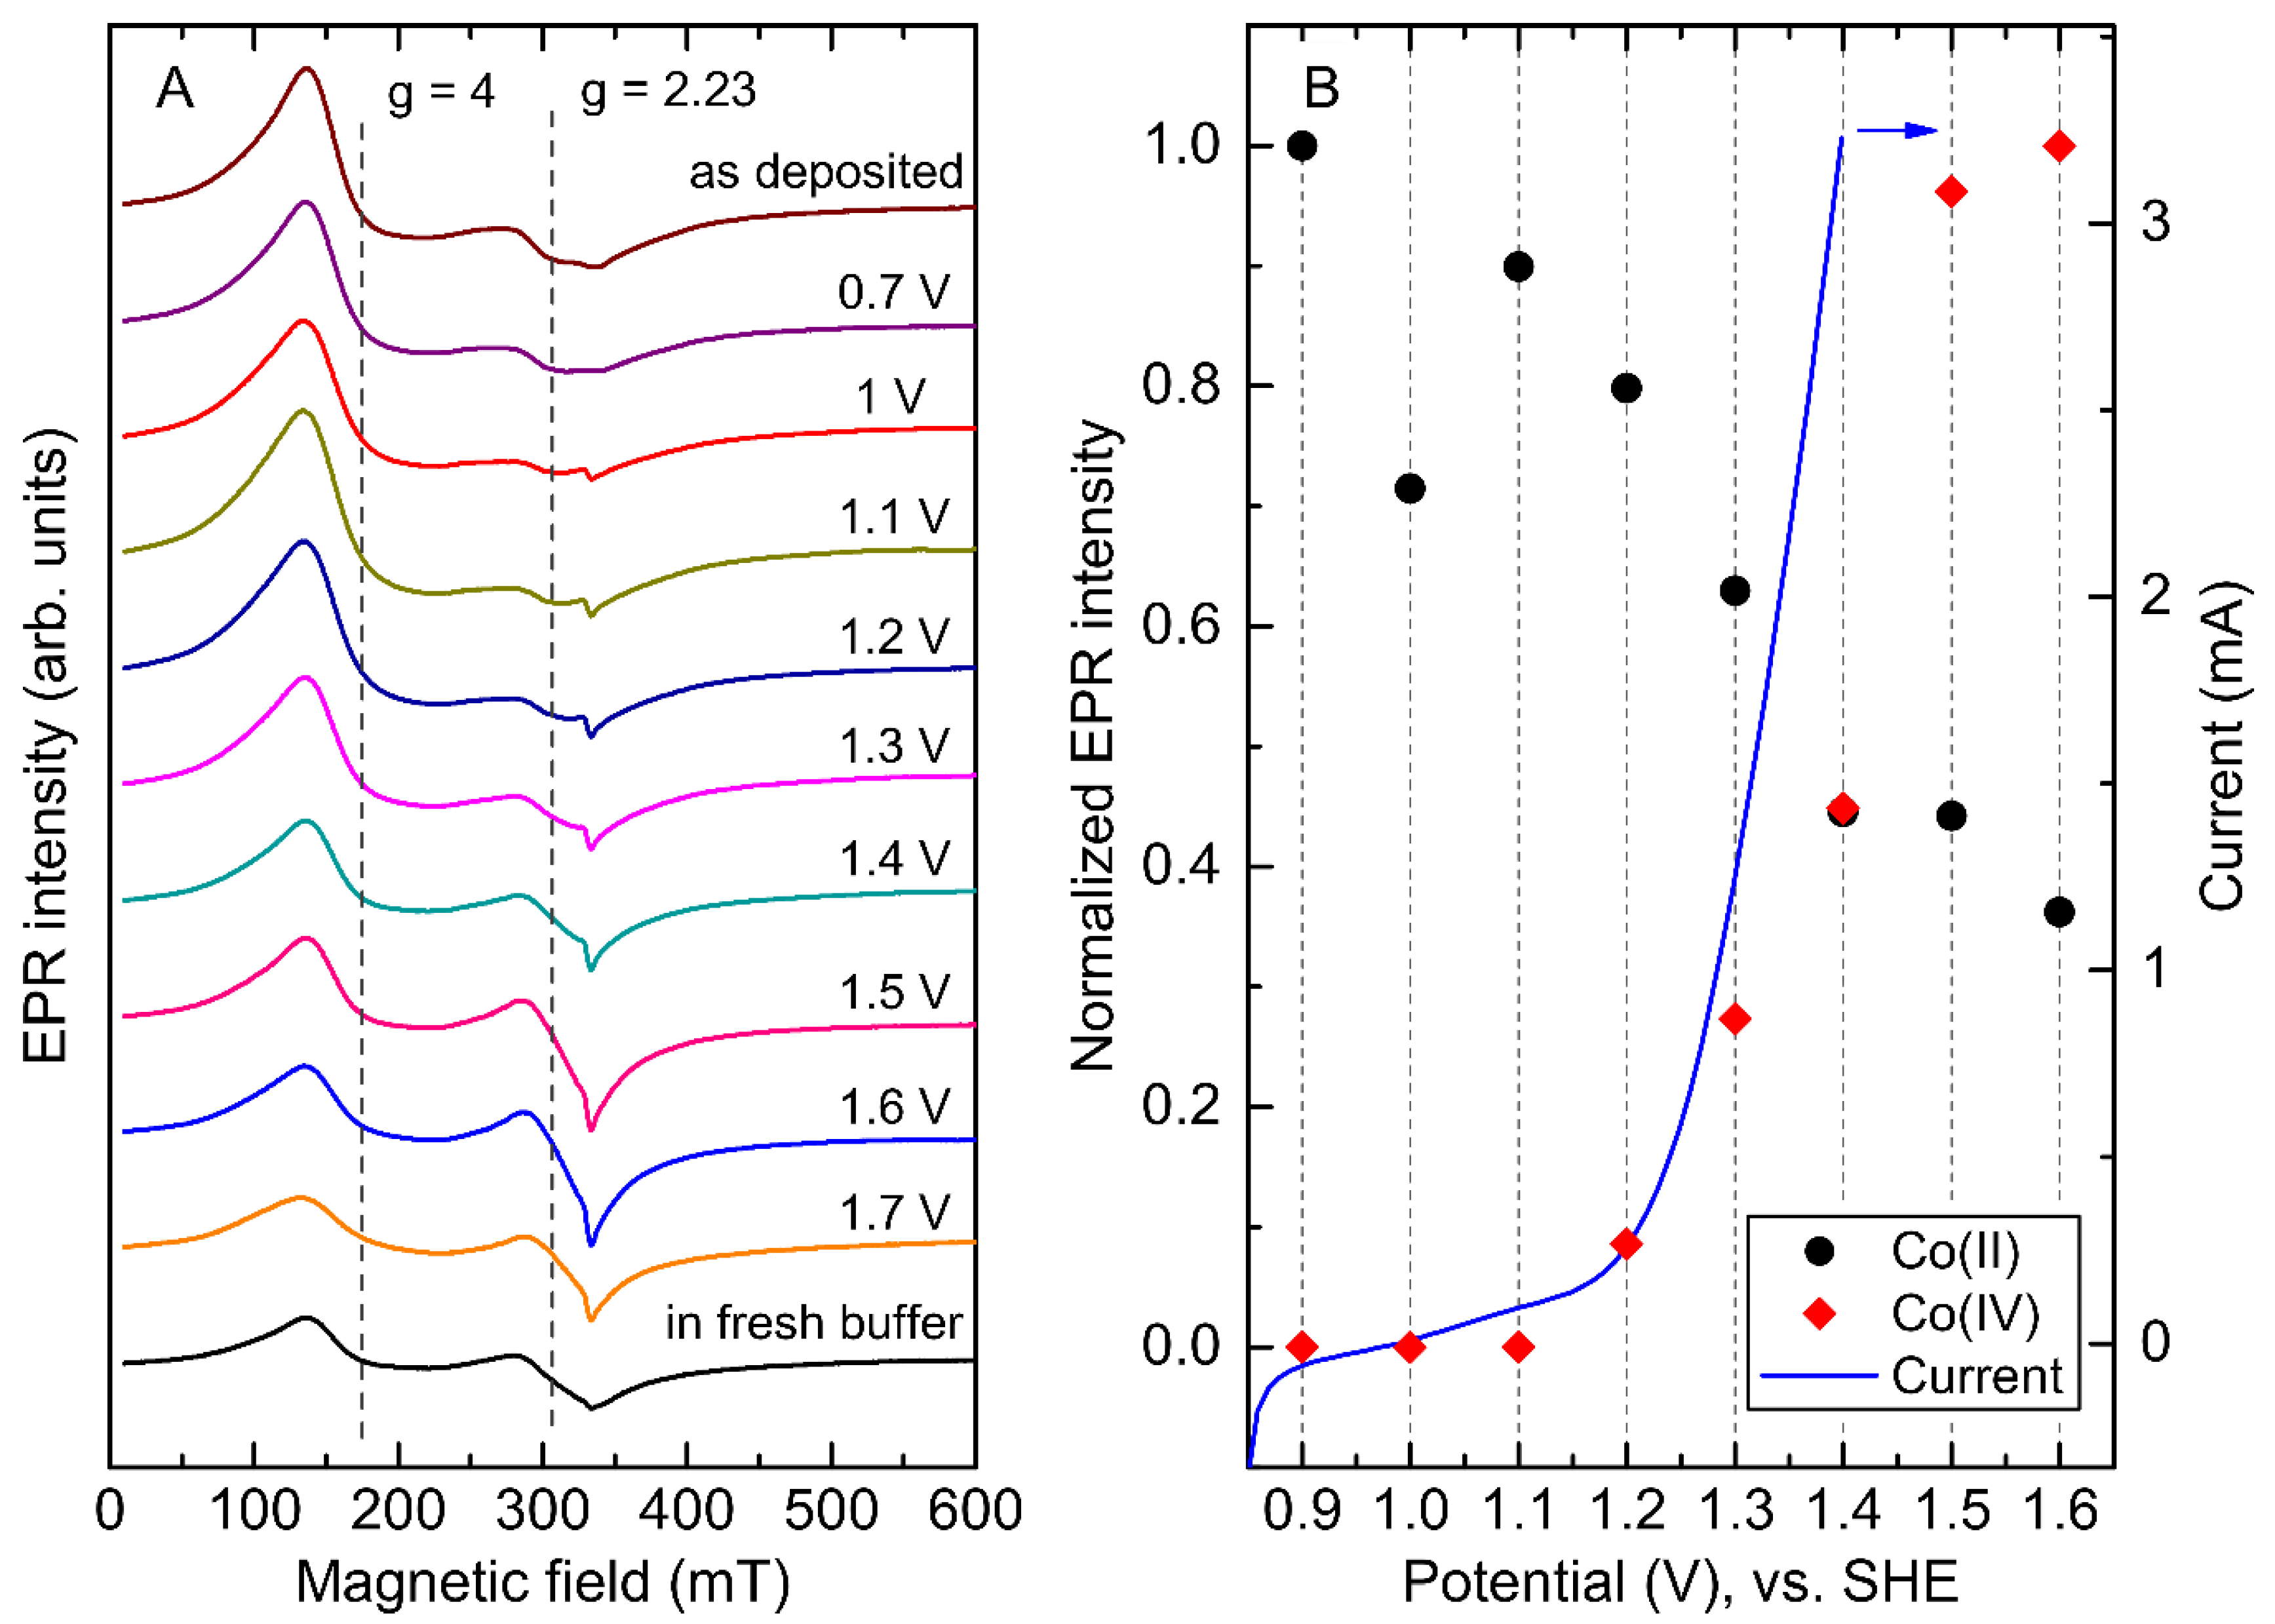
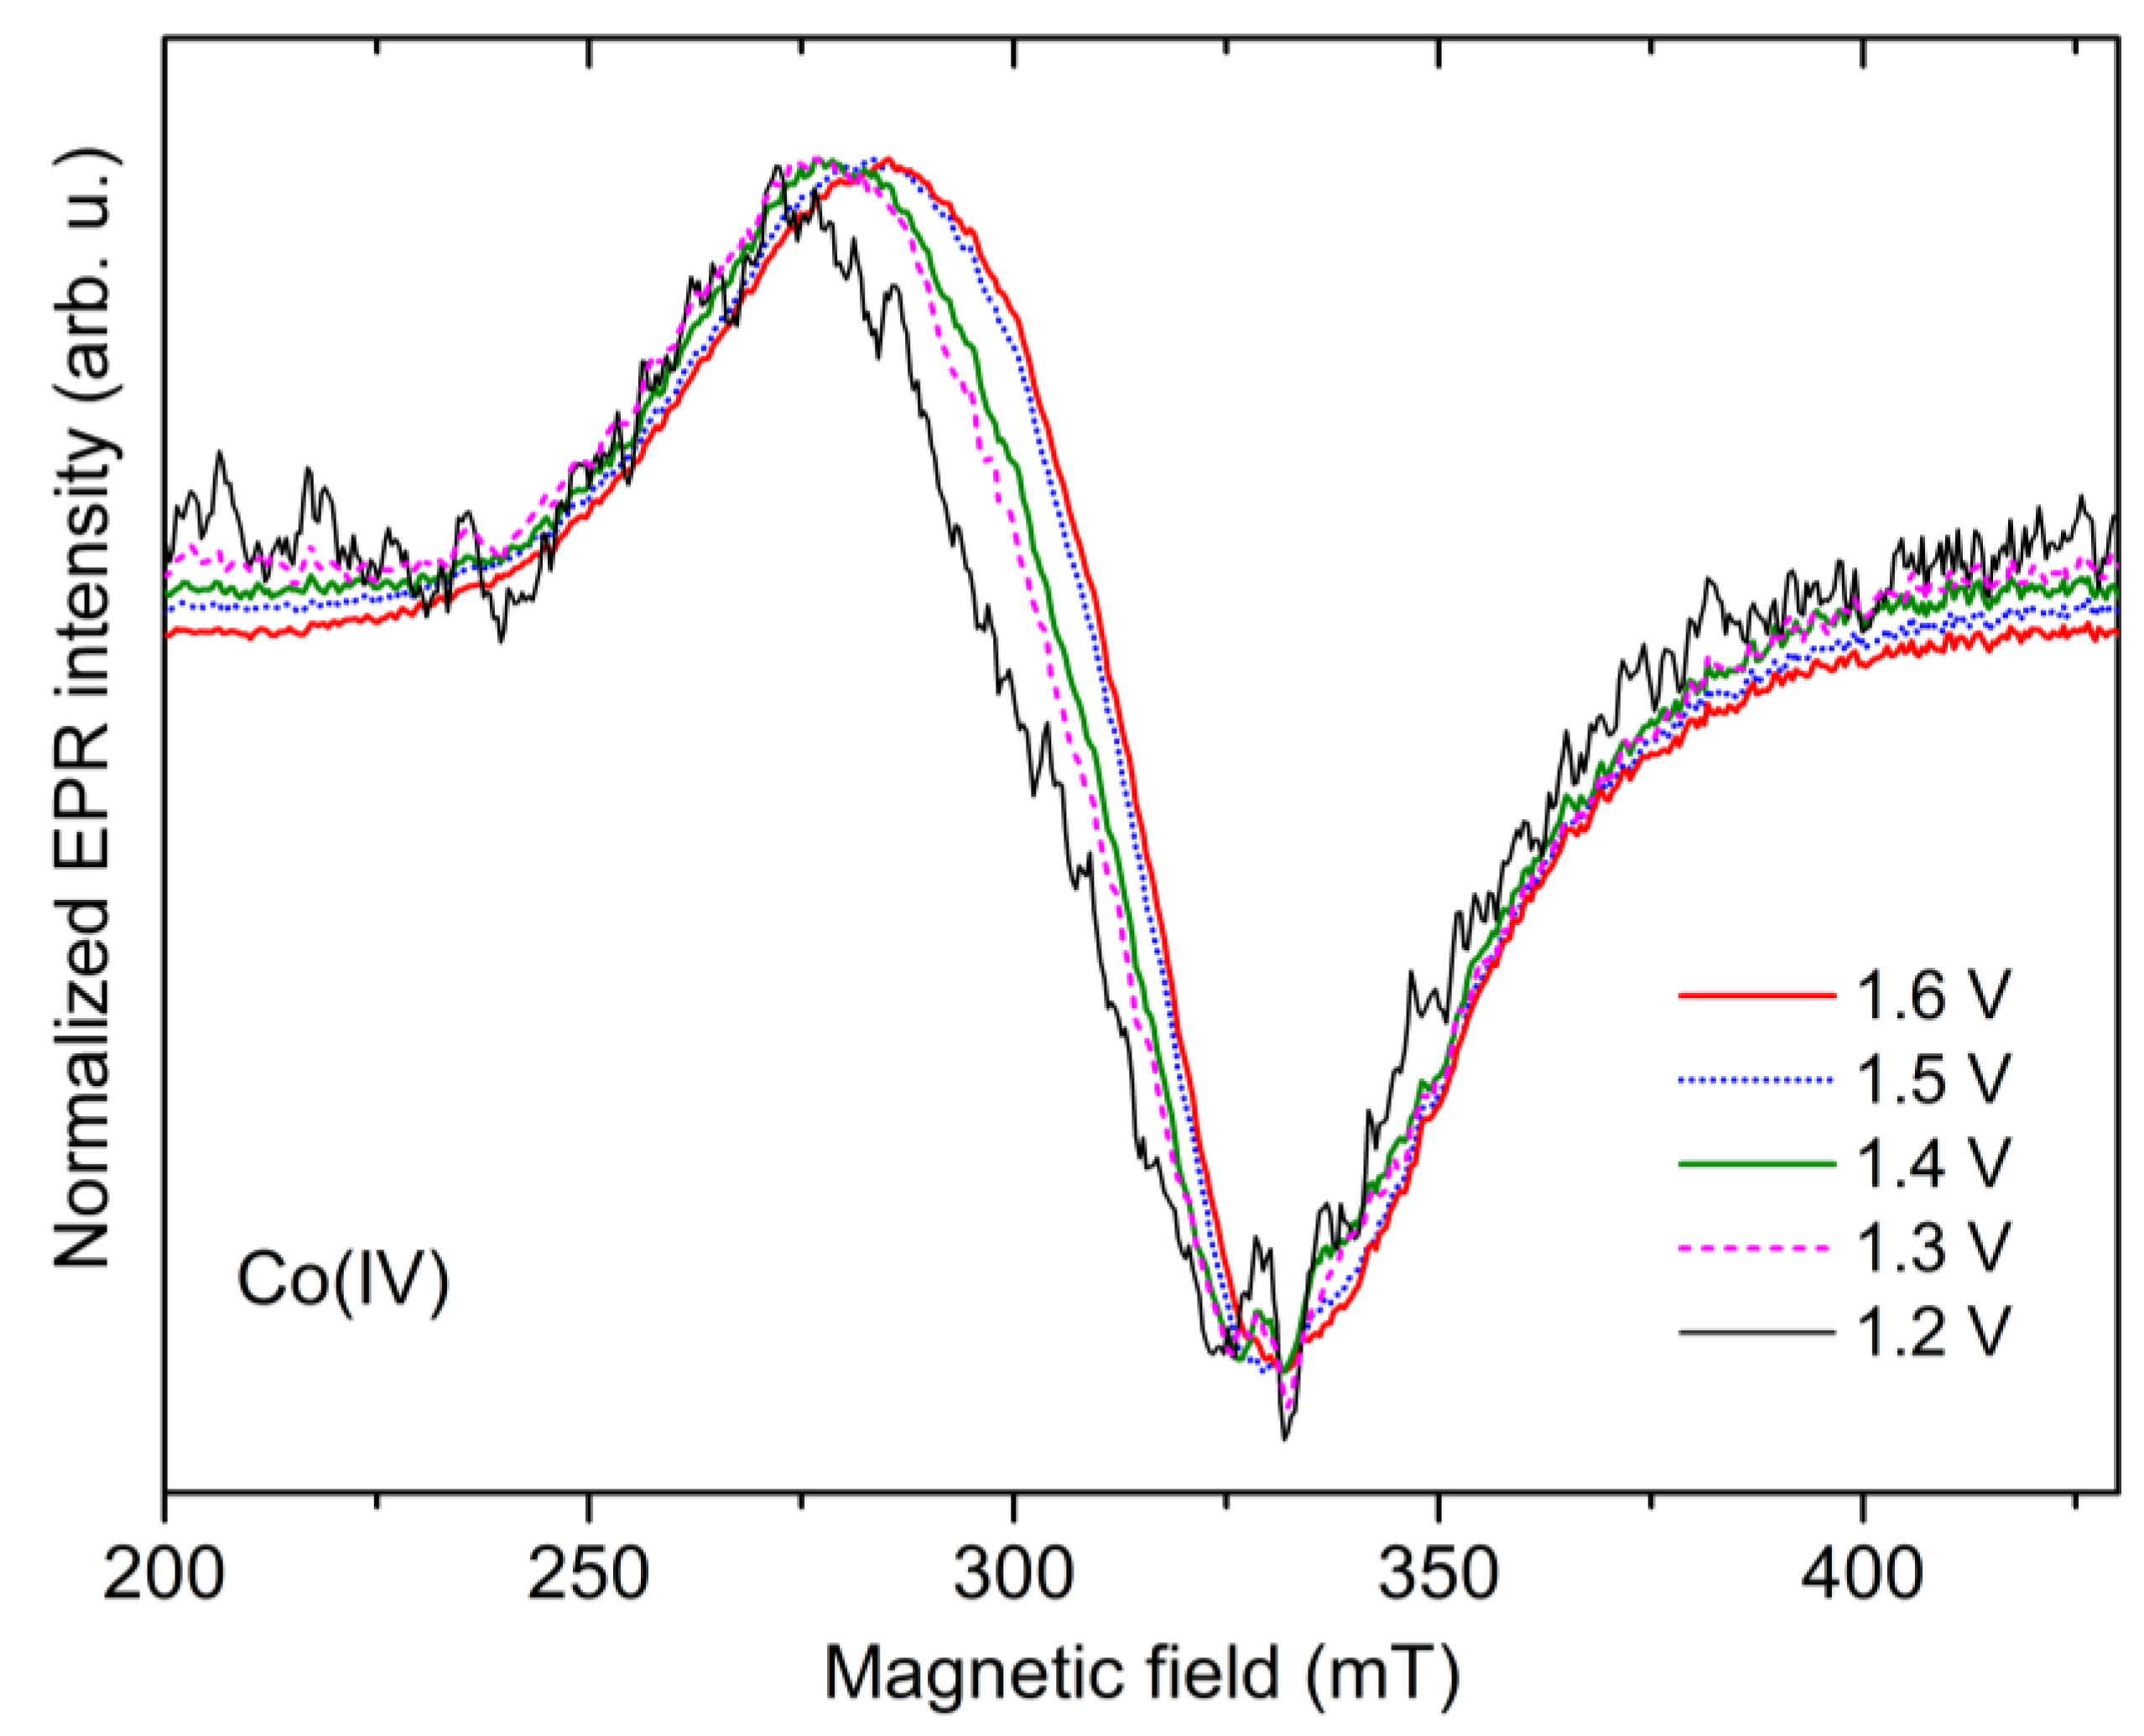
2.4. Potential Dependence of the Co-Pi EPR Spectrum

In order to determine changes in the oxidation state and local structure of paramagnetic Co sites in the film as a function of the potential, the Co-Pi Au electrode was placed inside the spectroelectrochemical cell and electrolyzed at increasing potentials (Figure 3). Linear scan voltammetry shows an oxidation current starting at potentials more positive than +1.2 V, with a subtle pre-catalytic wave at 1.1 V previously assigned to the Co(II)/Co(III) couple, similarly to what has been described earlier (Figure 3B) [1]. Changes in the low-temperature EPR spectrum of the film are shown in Figure 3A. For potentials in the range of 0.7 to 1.2 V the EPR signal is dominated by the broad Co(II) signal. The Co(II) signal intensity varies by ≈25%, possibly due to changes in the B1 field distribution and cavity Q-factor after reinsertion of the spectroelectrochemical cell. For voltages below 1.2 V, an additional asymmetric EPR signal with a crossing point at g ≈ 2.06 and a broad component at g ≈ 2.27 was observed. This signal was assigned to a square planar Cu(II)-Pi complex in the electrolyte solution. The copper presumably leaches from the connector to the Au electrode into the electrolyte solution. Its intensity significantly drops when the electrolyte is exchanged (bottom trace in Figure 3 and Figure S1) and it is also present in electrolyte solutions separated from the cell (Figure S2). Based on this assignment, the Cu EPR signal was not further considered in the discussion of the Co films. When subjecting the film to electrolysis above the threshold of water oxidation catalysis (>1.2 V), an additional EPR signal at g ≈ 2.23 with a line width of ≈50 mT becomes apparent. This new EPR signal continues to grow with increasing potentials, while the Co(II) signal decreases. Based on its spectral position and line shape, the signal can be clearly assigned to a low-spin Co(IV) species.
The increase in the Co(IV) EPR intensity is concomitant with an increase in the water oxidation rate (Figure 3B). The highest achievable Co(IV) EPR intensity was limited by physical deterioration of the Co-Pi films at oxidation potentials higher than ≈1.5 V, presumably due to excessive release of O2—bubbles forming on the surface of the electrode leading to disintegration of the Co-Pi film. As parts of a Co-Pi film broke off and fell from the electrode during catalysis, EPR intensities of both Co(II) and Co(IV) signals dropped due to the material loss. The effect is best seen in the 1.7 V EPR spectrum, which was excluded from further analysis. Interestingly, this was accompanied by a slight broadening of the Co(II) EPR feature, possibly demonstrating changes in the surroundings for a part of the Co(II) population. Exchanging the Pi electrolyte solution was followed by the restoration of the initial Co(II) line shape (Figure S1).
The g-factor and line width of the Co(IV) signal match those observed by McAlpin et al. [31]. In this previous work the Co-Pi material was scraped off of an electrode surface and moved into an EPR tube prior to freezing, potentially leading to modification of the catalyst. This is avoided in our set-up where the film-modified electrode is left intact and frozen under the operating conditions of the cell. As both methods yield similar results, the overall Co oxidation level of the Co-Pi film must remain unchanged following its removal from the electrode.
The amount of Co(IV) formed at high potentials varied depending on the film thickness. Thick films show much stronger Co(IV) signals, indicating that the Co(IV) is not only located on the film surface, but also in the bulk. This finding is in accordance with the proposed layered structure of the electrodeposited Co-oxide films [10].
In addition, our in situ experiment resolves subtle changes in the position and shape of the Co(IV) resonance as a function of applied potential (Figure 4). As the potential increases, the precise crossing point of the Co(IV) signal shifts to higher fields, while the peak-to-peak width decreases (see Table 1). Both effects were found to become more pronounced on average with an increase in film thickness.
A shift of the Co(IV) effective g-factor from 2.39 to 2.29 with increasing potential bias was observed in an ex situ EPR study on electro-deposited Co-oxide catalyst films by Gerken et al. [10] This shift was rationalized by an increase of spin-spin couplings, due to a decreased average distance between the Co(IV) sites. Importantly this shift was coupled with an increase in the linewidth, as would be expected in the case of increased intermolecular interactions, which is the opposite of what is seen in this study. Furthermore, in the present case the increase of Co(IV) population in the films is accompanied by a strong decrease of paramagnetic Co(II), which could be expected to even reduce couplings between Co spins in the film. Therefore, alternative reasons for the observed changes in the EPR line position and shape need to be considered. A possible explanation are changes in the local Co environment leading to changes in the Co(IV) g-anisotropy. It was shown recently that the line shape of the Co(IV) signal in electrodeposited Co-oxide films is largely determined by its g-tensor anisotropies [33]. The g-tensor has three components (g1, g2, g3), which represent the canonical values (different chemical environments) of the species. g-anisotropy is induced by spin-orbit coupling (SOC). This leads to a shift of the EPR signal away from the free electron g-value (ge = 2.0023) and the three individual g-values spreading apart, which in this instance would manifest in terms of changes in the peak-to-peak width of the signal. We speculate that the reduction in width of the signal and the shift towards ge indicate that the Co(IV) sites formed at high potential:
(i)
display larger crystal field splitting parameters, reducing the mixing via SOC within the d-orbital manifold; or
(ii)
the spin density migrates from the Co(IV) metal to its ligands, which again will reduce the overall SOC owing to the inclusion of lighter atoms.
The first option (i) suggests that the high-potential Co(IV) subset has a more distorted ligand field, or alternatively can be described as a ‘defect like’ site, and represent binding sites of substrate water. Alternatively, option (ii) instead suggests that the high-potential Co(IV) subset may have some ligand radical character, consistent with a radical coupling type O–O bond formation mechanism [34]. The challenge moving forward is to better isolate this subpopulation, potentially by moving to higher microwave frequencies and to extend these measurements to pulsed methodologies such as electron-nuclear double resonance (ENDOR). These will allow the spin density distribution across the film to be obtained, revealing if indeed catalyst oxidation is in part ligand centered.

3. Materials and Methods

3.1. Electrochemical Measurements

All electrochemical experiments were carried out aerobically at ambient temperature using a PARSTAT MC potentiostat/galvanostat from Princeton Applied Research. Electrolyte solutions were prepared using purified water (18 MΩ·cm resistivity) obtained from the Milli-Q system. 22Co(NO3)2·6H2O (99.999%), K2HPO4 and KH2PO4 (99.9%) were used as received from Sigma-Aldrich (Sigma-Aldrich, St. Louis, MO, USA). Gold electrodes were prepared from a gold wire pressed-flat into a plate of dimensions (approximately: 2 mm × 0.2 mm × 50 mm) which could easily fit within an X-band EPR tube. The design of a spectroelectrochemical cell used for the potential-dependent EPR of Co-Pi films is shown in Figure 5. It consists of a Pt counter electrode parallel to the gold working electrode. An AgCl plated Ag wire is used as reference electrode. Electrode potentials were converted to the standard hydrogen electrode (SHE) scale using ESHE = EAg/AgCl + 0.2 V. Linear sweep voltammetry (LSV) measurements were performed at 1 mV/s inside the EPR spectroelectrochemical cell.

3.2. Synthesis of Catalyst Films

Co-Pi films were electrodeposited on Au working electrodes from a 0.5 or 1 mM solution of Co(NO3)2·6H2O in Chelex-demetalated 0.1 M potassium phosphate (Pi electrolyte) at pH 7.0 by bulk electrolysis. Ag/AgCl was used as a reference electrode and a Pt wire as the counter electrode. Prior to the deposition, Au electrodes were cleaned with aqua regia and submerged in the solution by ≈1.5 cm. The deposition was done at a constant potential of 0.9 V vs. Ag/AgCl, where the water oxidation rate is negligible. The deposition time was varied between 3 and 24 h. Upon deposition, catalyst films were rinsed with water, allowed to dry in air and subsequently moved to the EPR spectroelectrochemical cell for potential-dependent EPR measurements.

3.3. Potential Dependence

Potentials in the range of 0.7 to 1.7 V were applied in 0.1 V increments to the Au electrode with the catalytic film fully submerged into the Co-free Pi electrolyte. Following each step (7 min at a constant potential), the EPR spectroelectrochemical cell was frozen in liquid nitrogen, with the potential still applied during freezing to preserve the catalyst oxidation state. Upon conclusion of the low-temperature EPR measurement, the spectroelectrochemical cell was slowly thawed and immediately connected to the potentiostat for the next step in the potential dependence.

3.4. EPR Spectroscopy

X-Band CW EPR measurements were performed using a Bruker E500 spectrometer equipped with a Bruker ER 4116DM resonator (Bruker BioSpin, Rheinstetten, BW, Germany), Oxford Instruments ESR 935 cryostat and ITC503 temperature controller (Oxford Instruments, Abingdon, Eng., UK). Microwave power PMW was in the range of 6 to 65 mW. Magnetic field modulation and temperature were 7.5 G and 5 K, respectively.

4. Conclusions

A custom-made in situ spectroelectrochemical EPR cell was employed to monitor oxidation state and structural changes in electrodeposited Co-Pi catalyst films vs. an externally applied potential bias. Above a potential of 1.1 V a Co(IV) EPR signal was observed. The intensity of this EPR resonance further increased with increasing potential, concomitant with an increase in the water oxidation rate. In addition, the Co(IV) EPR signal was found to shift to higher resonance fields at rising potentials, with its peak-to-peak width decreasing. Changes in the Co(IV) EPR line position and shape were tentatively assigned to structure induced changes of the spin-orbit coupling. Our findings are in accordance with previous ex situ EPR experiments on similar catalysts, which involved removal of the catalyst material from an electrode prior to EPR measurements. This strongly invasive step is avoided in the chosen in situ approach, which clearly reduces ambiguity as compared to earlier studies. A further extension of the arsenal of in situ EPR experiments towards pulse EPR and hyperfine spectroscopies is underway in our laboratories. The application of a novel in situ spectroelectrochemical EPR cell to a highly relevant Co thin film catalyst sets the basis for these experiments and application to other heterogeneous catalysts.

Supplementary Materials

The following are available online at https://www.mdpi.com/2073-4344/9/11/926/s1, Figure S1: Bottom two traces of Figure 3A: EPR spectra of a Co-Pi modified Au electrode electrolyzed at the highest applied potential of 1.7 V, recorded before (top) and after (bottom) the electrolyte solution exchange. PMW = 63 mW, T = 5 K, Figure S2: EPR spectra of the electrolyte solution used in the titration series measured at several MW power levels. The narrow g ≈ 2.1 line is found in the solution measured separately from the cell, Figure S3: (A) The loss of the Co(II) species and (B) the increase in the Co(IV) EPR intensity as a function of applied potential above the water oxidation threshold.

Author Contributions

Conceptualization, O.R. and N.C.; methodology, O.R. and Y.K.; software, Y.K.; validation, Y.K., O.R., N.C. and A.S.; formal analysis, Y.K. and O.R.; investigation, O.R., N.C. and Y.K.; resources, O.R., A.S. and W.L.; data curation, O.R. and A.S.; writing—original draft preparation, Y.K., O.R., N.C., W.L. and A.S.; writing—review and editing, Y.K., O.R., N.C., W.L. and A.S.; visualization, Y.K., O.R. and A.S.; supervision, O.R., A.S. and W.L.; project administration, O.R., A.S. and W.L.; funding acquisition, W.L.

Funding

This research received funding through the Deutsche Forschungsgemeinschaft (DFG) Cluster of Excellence RESOLV (EXC1069) and the Australian Research Council (FT140100834).

Acknowledgments

This research was funded by the Max Planck Society, the Cluster of Excellence RESOLV (EXC1069) from the Deutsche Forschungsgemeinschaft (DFG) and by the Australian Research Council (FT140100834). The authors thank Christoph Laurich (MPI CEC) for the construction of the electrochemical cell.

Conflicts of Interest

The authors declare no conflict of interest.

References

  1. Kanan, M.W.; Nocera, D.G. In situ formation of an oxygen-evolving catalyst in neutral water containing phosphate and Co(2+). Science 2008, 321, 1072–1075. [Google Scholar] [CrossRef] [PubMed]
  2. Lutterman, D.A.; Surendranath, Y.; Nocera, D.G. A Self-Healing Oxygen-Evolving Catalyst. J. Am. Chem. Soc. 2009, 131, 3838–3839. [Google Scholar] [CrossRef] [PubMed]
  3. Lubitz, W.; Reijerse, E.J.; Messinger, J. Solar water-splitting into H2 and O2: Design principles of photosystem II and hydrogenases. Energy Environ. Sci. 2008, 1, 15–31. [Google Scholar] [CrossRef]
  4. Kanan, M.W.; Surendranath, Y.; Nocera, D.G. Cobalt-phosphate oxygen-evolving compound. Chem. Soc. Rev. 2009, 38, 109–114. [Google Scholar] [CrossRef] [PubMed]
  5. Pijpers, J.J.H.; Winkler, M.T.; Surendranath, Y.; Buonassisi, T.; Nocera, D.G. Light-induced water oxidation at silicon electrodes functionalized with a cobalt oxygen-evolving catalyst. Proc. Natl. Acad. Sci. USA 2011, 108, 10056–10061. [Google Scholar] [CrossRef] [PubMed] [Green Version]
  6. Steinmiller, E.M.P.; Choi, K.-S. Photochemical deposition of cobalt-based oxygen evolving catalyst on a semiconductor photoanode for solar oxygen production. Proc. Natl. Acad. Sci. USA 2009, 106, 20633–20636. [Google Scholar] [CrossRef] [Green Version]
  7. Esswein, A.J.; Surendranath, Y.; Reece, S.Y.; Nocera, D.G. Highly active cobalt phosphate and borate based oxygen evolving catalysts operating in neutral and natural waters. Energy Environ. Sci. 2011, 4, 499–504. [Google Scholar] [CrossRef]
  8. Reece, S.Y.; Hamel, J.A.; Sung, K.; Jarvi, T.D.; Esswein, A.J.; Pijpers, J.J.H.; Nocera, D.G. Wireless Solar Water Splitting Using Silicon-Based Semiconductors and Earth-Abundant Catalysts. Science 2011, 334, 645–648. [Google Scholar] [CrossRef] [Green Version]
  9. Surendranath, Y.; Kanan, M.W.; Nocera, D.G. Mechanistic Studies of the Oxygen Evolution Reaction by a Cobalt-Phosphate Catalyst at Neutral pH. J. Am. Chem. Soc. 2010, 132, 16501–16509. [Google Scholar] [CrossRef]
  10. Gerken, J.B.; McAlpin, J.G.; Chen, J.Y.C.; Rigsby, M.L.; Casey, W.H.; Britt, R.D.; Stahl, S.S. Electrochemical Water Oxidation with Cobalt-Based Electrocatalysts from pH 0–14: The Thermodynamic Basis for Catalyst Structure, Stability, and Activity. J. Am. Chem. Soc. 2011, 133, 14431–14442. [Google Scholar] [CrossRef]
  11. Risch, M.; Khare, V.; Zaharieva, I.; Gerencser, L.; Chernev, P.; Dau, H. Cobalt-Oxo Core of a Water-Oxidizing Catalyst Film. J. Am. Chem. Soc. 2009, 131, 6936–6937. [Google Scholar] [CrossRef] [PubMed]
  12. Kanan, M.W.; Yano, J.; Surendranath, Y.; Dinca, M.; Yachandra, V.K.; Nocera, D.G. Structure and Valency of a Cobalt-Phosphate Water Oxidation Catalyst Determined by in Situ X-ray Spectroscopy. J. Am. Chem. Soc. 2010, 132, 13692–13701. [Google Scholar] [CrossRef] [PubMed]
  13. Dau, H.; Limberg, C.; Reier, T.; Risch, M.; Roggan, S.; Strasser, P. The Mechanism of Water Oxidation: From Electrolysis via Homogeneous to Biological Catalysis. ChemCatChem 2010, 2, 724–761. [Google Scholar] [CrossRef]
  14. Liu, Y.; Nocera, D.G. Spectroscopic Studies of Nanoparticulate Thin Films of a Cobalt-Based Oxygen Evolution Catalyst. J. Phys. Chem. C 2014, 118, 17060–17066. [Google Scholar] [CrossRef]
  15. Brodsky, C.N.; Bediako, D.K.; Shi, C.; Keane, T.P.; Costentin, C.; Billinge, S.J.L.; Nocera, D.G. Proton–Electron Conductivity in Thin Films of a Cobalt–Oxygen Evolving Catalyst. ACS Appl. Energy Mater. 2019, 2, 3–12. [Google Scholar] [CrossRef]
  16. Ullman, A.M.; Brodsky, C.N.; Li, N.; Zheng, S.-L.; Nocera, D.G. Probing Edge Site Reactivity of Oxidic Cobalt Water Oxidation Catalysts. J. Am. Chem. Soc. 2016, 138, 4229–4236. [Google Scholar] [CrossRef] [PubMed]
  17. Li, X.; Siegbahn, P.E.M. Water Oxidation Mechanism for Synthetic Co–Oxides with Small Nuclearity. J. Am. Chem. Soc. 2013, 135, 13804–13813. [Google Scholar] [CrossRef]
  18. Brodsky, C.N.; Hadt, R.G.; Hayes, D.; Reinhart, B.J.; Li, N.; Chen, L.X.; Nocera, D.G. In situ characterization of cofacial Co(IV) centers in Co4O4 cubane: Modeling the high-valent active site in oxygen-evolving catalysts. Proc. Natl. Acad. Sci. USA 2017, 114, 3855. [Google Scholar] [CrossRef]
  19. Buffat, B.; Demazeau, G.; Pouchard, M.; Dance, J.M.; Hagenmuller, P. Stabilization of tetravalent cobalt in an isolated six-coordinated site of an oxide lattice: A magnetic and ESR characterization. J. Solid State Chem. 1983, 50, 33–40. [Google Scholar] [CrossRef]
  20. Townsend, M.G.; Hill, O.F. Tetravalent cobalt ion in alpha-Al2O3. Trans. Faraday Soc. 1965, 61, 2597–2602. [Google Scholar] [CrossRef]
  21. Van Zee, R.J.; Hamrick, Y.M.; Li, S.; Weltner, W. Cobalt, rhodium, and iridium dioxide molecules and Walsh-type rules. J. Phys. Chem. 1992, 96, 7247–7251. [Google Scholar] [CrossRef]
  22. Warda, S.A.; Massa, W.; Reinen, D.; Hu, Z.W.; Kaindl, G.; de Groot, F.M.F. The ordered K2NiF4-type structure of mixed crystals La2-xSrxLi1/2Co1/2O4 (x < 0.5) and the electronic properties of the constituting Co-III and Co-IV ions. J. Solid State Chem. 1999, 146, 79–87. [Google Scholar]
  23. Dimitrou, K.; Brown, A.D.; Concolino, T.E.; Rheingold, A.L.; Christou, G. Mixed-valence, tetranuclear cobalt(III, IV) complexes: Preparation and properties of Co4O4(O2CR)(2)(bpy) (4) (3+) salts. Chem. Commun. 2001, 1284–1285. [Google Scholar] [CrossRef]
  24. Harmer, J.; Van Doorslaer, S.; Gromov, I.; Broring, M.; Jeschke, G.; Schweiger, A. A pulse EPR and ENDOR investigation of the electronic structure of a sigma-carbon-bonded cobalt(IV) corrole. J. Phys. Chem. B 2002, 106, 2801–2811. [Google Scholar] [CrossRef]
  25. Adamian, V.A.; D’souza, F.; Licoccia, S.; Di Vona, M.L.; Tassoni, E.; Paolesse, R.; Boschi, T.; Kadish, K.M. Synthesis, Characterization, and Electrochemical Behavior of (5,10,15-Tri-X-phenyl-2,3,7,8,12,13,17,18-octamethylcorrolato)cobalt(III) Triphenylphosphine Complexes, Where X = p-OCH3, p-CH3, p-Cl, m-Cl, o-Cl, m-F, or o-F. Inorg. Chem. 1995, 34, 532–540. [Google Scholar] [CrossRef]
  26. Webster, R.D.; Heath, G.A.; Bond, A.M. Voltammetric, EPR and UV-VIS-NIR spectroscopic studies associated with the characterisation of electrochemically generated tris(dithiocarbamato)cobalt(IV) complexes in dichloromethane. J. Chem. Society-Dalton Trans. 2001, 3189–3195. [Google Scholar] [CrossRef]
  27. Collins, T.J.; Powell, R.D.; Slebodnick, C.; Uffelman, E.S. Stable highly oxidizing cobalt complexes of macrocyclic ligands. J. Am. Chem. Soc. 1991, 113, 8419–8425. [Google Scholar] [CrossRef]
  28. Halpern, J.; Topich, J.; Zamaraev, K.I. Electron paramagnetic resonance spectra and electronic structures of organobis(dimethylglyoximato)cobalt(IV) complexes. Inorg. Chim. Acta 1976, 20, L21–L24. [Google Scholar] [CrossRef]
  29. Topich, J.; Halpern, J. Organobis(dioximato)cobalt(IV) complexes: Electron paramagnetic resonance spectra and electronic structures. Inorg. Chem. 1979, 18, 1339–1343. [Google Scholar] [CrossRef]
  30. Nikitaeva, G.A.; Nikitaev, A.T.; Zamaraev, K.I.; Sigan, A.L.; Levitin, I.Y.; Volpin, M.E. ESR spectra and electronic structure of the oxidized forms of alkyl-bis (salicylidenato) ethylenediaminecobalt. J. Struct. Chem. 1978, 19, 243–247. [Google Scholar] [CrossRef]
  31. McAlpin, J.G.; Surendranath, Y.; Dinca, M.; Stich, T.A.; Stoian, S.A.; Casey, W.H.; Nocera, D.G.; Britt, R.D. EPR Evidence for Co(IV) Species Produced During Water Oxidation at Neutral pH. J. Am. Chem. Soc. 2010, 132, 6882–6883. [Google Scholar] [CrossRef] [PubMed]
  32. Chakrabarty, R.; Bora, S.J.; Das, B.K. Synthesis, structure, spectral and electrochemical properties, and catalytic use of cobalt(III)-Oxo cubane clusters. Inorg. Chem. 2007, 46, 9450–9462. [Google Scholar] [CrossRef] [PubMed]
  33. McAlpin, J.G.; Stich, T.A.; Ohlin, C.A.; Surendranath, Y.; Nocera, D.G.; Casey, W.H.; Britt, R.D. Electronic Structure Description of a Co(III)(3)Co(IV)O(4) Cluster: A Model for the Paramagnetic Intermediate in Cobalt-Catalyzed Water Oxidation. J. Am. Chem. Soc. 2011, 133, 15444–15452. [Google Scholar] [CrossRef] [PubMed]
  34. Siegbahn, P.E.M. Theoretical Studies of O–O Bond Formation in Photosystem II. Inorg. Chem. 2008, 47, 1779–1786. [Google Scholar] [CrossRef] [PubMed]
Figure 1. (A) X-band CW electron paramagnetic resonance (EPR) spectra of a cobalt oxide (Co-Pi) catalyst film electrodeposited at 0.9 V from an aqueous 1 mM Co(NO3)2 solution in 0.1 M Pi electrolyte (red) and Co(II) in the starting solution (blue) measured at T = 5 K and PMW = 6.3 mW. (B) Normalized EPR intensity of Co(II) in the Co-Pi film (red circles) and electrolyte solution (blue diamonds) as a function of PMW with T = 5 K. Simulations obtained using (1 + P/P1/2)−0.5 are shown with solid lines, with best fit P1/2 values of 1 ± 0.2 mW for the solution and 945 ± 35 mW for the film species.
Catalysts 09 00926 g001
Figure 2. EPR intensity of free Co(II) in the electrolyte solution as a function of the electrodeposition duration (blue triangles) and in control solution (red diamonds). The blue dashed line represents a linear fit of the Co(II) intensity change during the first 6 h of deposition (if interpolated further, the linear fit reaches zero after approximately 20 h); red dashed line shows a zeroth-order polynomial fit of the control solution EPR intensity.
Catalysts 09 00926 g002
Figure 3. (A) X-band CW EPR spectra of a Co-Pi modified working Au electrode electrolyzed at increasing potentials; PMW = 63 mW, T = 5 K. (B) The loss of the Co(II) species (black circles) and the increase in the Co(IV) intensity (red diamonds) as a function of applied potential are shown. The increase in the Co(IV) population in the film coincides with the water oxidation (blue line; linear scan voltammetry at 1 mV/s measured in the EPR spectroelectrochemical cell).
Catalysts 09 00926 g003
Figure 4. Change in the line shape and spectral position of the Co(IV) species as a function of applied potential. Isolation of the Co(IV) EPR line was achieved by a scaled subtraction of the Co(II) spectral feature of the 1.1 V spectrum from the higher-potential spectra, followed by polynomial background correction.
Catalysts 09 00926 g004
Figure 5. Scheme of the spectroelectrochemical cell (top) used in this study with a zoomed view of the electrodes (bottom). The cell was filled until the electrolyte reaches the reference electrode. Au WE refers to gold working electrode; Pt CE to platinum counter electrode and Ag RE, to silver reference electrode.
Catalysts 09 00926 g005
Table 1. Co(IV) line shape parameters vs. applied potential for a Co-Pi film electrodeposited for 22 h at 1.1 V (vs. SHE).
Potential (V)Peak-to-Peak Line Width (mT)Effective g-Factor
1.253.9(5)2.316(6)
1.352.7(4)2.270(3)
1.449.6(4)2.257(3)
1.547.3(4)2.227(3)
1.647.6(4)2.217(3)

