Article

Fischer-Tropsch Synthesis: Cd, In and Sn Effects on a 15%Co/Al2O3 Catalyst

1
Center for Applied Energy Research, University of Kentucky, 2540 Research Park Drive, Lexington, KY 40511, USA
2
NASA Glenn Research Center, 21000 Brookpark Rd., Cleveland, OH 44135, USA
3
NSLS, Brookhaven National Lab., Brookhaven Ave., Upton, NY 11973, USA
*
Author to whom correspondence should be addressed.
Current address: Department of Chemical Engineering and Biomedical Engineering/Department of Mechanical Engineering, University of Texas at San Antonio, 1 UTSA Circle, San Antonio, TX 78249, USA.
Current address: Asbury University, One Macklem Drive, Wilmore, KY 40390, USA.
§
Decreased.
Catalysts 2019, 9(10), 862; https://doi.org/10.3390/catal9100862
Submission received: 30 August 2019 / Revised: 1 October 2019 / Accepted: 11 October 2019 / Published: 16 October 2019
(This article belongs to the Special Issue Iron and Cobalt Catalysts)

Abstract

:
The effects of 1% of Cd, In and Sn additives on the physicochemical properties and Fischer-Tropsch synthesis (FTS) performance of a 15% Co/Al2O3 catalyst were investigated. The fresh and spent catalysts were characterized by BET, temperature programmed reduction (TPR), H2-chemisorption, NH3 temperature programmed desorption (TPD), X-ray absorption near edge spectroscopy (XANES), and X ray diffraction (XRD). The catalysts were tested in a 1 L continuously stirred tank reactor (CSTR) at 220 °C, 2.2 MPa, H2/CO = 2.1 and 20–55% CO conversion. Addition of 1% of Cd or In enhanced the reduction degree of 15%Co/Al2O3 by ~20%, while addition of 1% Sn slightly hindered it. All three additives adversely impacted Co dispersion by 22–32% by increasing apparent Co cluster size based on the H2-chemisorption measurements. However, the decreased Co active site density resulting from the additives did not result in a corresponding activity loss; instead, the additives decreased the activity of the Co catalysts to a much greater extent than expected, i.e., 82–93%. The additional detrimental effect on catalyst activity likely indicates that the Cd, In and Sn additives migrated to and covered active sites during reaction and/or provided an electronic effect. XANES results showed that oxides of the additives were present during the reaction, but that a fraction of metal was also likely present based on the TPR and reaction testing results. This is in contrast to typical promoters that become metallic at or below ~350 °C, such as noble metal promoters (e.g., Pt, Ru) and Group 11 promoters (e.g., Ag, Au) on Co catalysts in earlier studies. In the current work, all three additives remarkably increased CH4 and CO2 selectivities and decreased C5+ selectivity, with the Sn and In additives having a greater effect. Interestingly, the Cd, In, or Sn additives were found to influence hydrogenation and isomerization activities. At a similar conversion level (i.e., in the range of 40–50%), the additives significantly increased 2-C4 olefin content from 3.8 to 10.6% and n-C4 paraffin from 50 to 61% accompanied by decreases in 1-C4 olefin content from 48 to 30%. The Sn contributed the greatest impact on the secondary reactions of 1-olefins, followed by the In and Cd. NH3-TPD results suggest enhanced acid sites on cobalt catalysts resulting from the additives, which likely explains the change in selectivities for the different catalysts.

1. Introduction

Supported cobalt catalysts have received renewed attention in converting natural gas to liquid fuels (GTL) due to their high activity, high selectivity toward heavier hydrocarbons and excellent stability in long term operation. A large number of studies in past decades have focused on developing various supported Co catalysts aimed at high productivity of heavier hydrocarbons and good stability. Al2O3, SiO2, and TiO2 supports have been commonly used since the energy crisis of the 1970s. Because the reducibility and dispersion of cobalt, which remarkably affect Fischer-Tropsch synthesis (FTS) performance of cobalt catalysts, are closely related to the interaction between the support and cobalt, appropriate reduction additives such as noble metals (e.g., Pt, Ru, and Re) or Group 11 metals (e.g., Au, Ag), structural modifiers (e.g., Zr, Ce, K, Mn), or a high Co loading (e.g., >20%) are used to overcome the strong interaction issue, consequently leading to increased productivity [1,2,3,4,5,6,7,8,9,10,11,12,13,14,15,16,17,18,19,20,21,22,23,24,25]. Additives may also provide additional benefits by producing hydrocarbons with a desired product spectrum, thus significantly decreasing the catalyst cost. Generally, cobalt-based catalysts are reduced at 350 °C under hydrogen for several hours to activate cobalt metal sites. Under this standard reduction scheme, Co/Al2O3 catalysts were found to have a limited reducibility but a relatively higher Co dispersion due to the strong interaction between the support and cobalt oxides [3,4,5,6,7,8], whereas Co/SiO2 and Co/TiO2 catalysts usually exhibited higher reducibility but with a lower Co dispersion because of the weaker interactions between the support and cobalt oxides [3,4]. Therefore, additive effect studies have been an important topic ever since the discovery of FTS in the 1920s.
The impact of noble metal additives (e.g., Pt, Ru, Re and Pd) having an atomically equivalent loading as that of 0.5% by weight Pt, has been researched carefully in order to understand the catalyst structure-performance relationships [4,6,7,16,17]. It was found that all noble metal additives significantly improved the Co reduction degree in 25%Co/Al2O3 from 55 to 68–72% and increased Co dispersion from 5.5 to 9–10% [7], which was likely through a H2 dissociation and spillover mechanism [3,14]. The increased Co site density due to the reduction promoting capability of the noble metal additives led to a near doubling of the FTS activity in comparison with the unpromoted cobalt catalyst. However, Pd was an exception; Pd addition resulted in nearly unchanged FTS activity, and it accelerated the deactivation rate of the cobalt catalyst.
The noble metal additives were also found to alter hydrocarbon selectivity in different ways. At atomically equivalent loadings to 0.5% by weight Pt and about 50% conversion, the Ru and Re additives improved C5+ selectivity and suppressed methane formation, while the Pd additive prohibitively worsened selectivities by increasing the formation of methane and light hydrocarbons at the expense of losing heavier hydrocarbons [7]; Pt also tended to worsen the selectivities, but this effect was only slight. Further studies by XANES/EXAFS indicated different structures of the noble metal additives. Both Pd-Pd and Pd-Co coordination were found in the spent Pd-Co catalysts, but for the other promoted catalysts (Pt, Re, and Ru-which performed significantly better than the Pd promoted one), only coordination from the additive to Co was detected by EXAFS [6,16]. Thus, the small Pd particles or Pd patches were deemed to be responsible in part for losses in catalyst performance.
The effect of Group 11 metals (e.g., Cu, Ag, and Au with a loading range of 0.5–5.0%) on 15%Co/Al2O3 catalysts have been also investigated with the aim of (1) finding a substitute for Pt and (2) possibly lowering light gas selectivity, thus potentially reducing the costs of the cobalt catalyst and process [5]. It was found that all levels of Group 11 metals improved the reducibility of cobalt oxides (50 to 70–90%), leading to improved catalyst activity and stability especially for Ag and low levels of Au. At a similar CO conversion level of ca. 50%, the addition of less than 1.5% or 2.8% Ag not only improved the CO rate, but also improved the selectivity towards heavier hydrocarbons relative to the unpromoted cobalt catalyst (81 to 83%). However, Cu (>0.5%) and higher loadings of Au significantly poisoned the cobalt catalyst and remarkably promoted CH4 formation (9 to 21%) in comparison to the unpromoted cobalt catalyst. This could be due to Cu metal being present on the Co surface and blocking Co sites and affecting the relative hydrogenation rates. Similar to the Pd additive effect addressed previously, EXAFS results revealed only Co-Co and Me-Me (Me = Cu, Ag and Au) structures in the cobalt catalysts after the standard H2 reduction. This study suggested that Ag is a promising potential additive as a substitute for the Pt that is used for commercial cobalt catalysts due to the better FTS performance of the Ag-Co catalyst and lower price compared with Au.
The effect of up to 5% Zr structural modifier on 25%Co/Al2O3 catalysts has been studied using wide and narrow pore Al2O3 supports (Puralox HP14/150 and Catalox 150) [8]. The cobalt catalyst prepared with the wide pore support was found to perform much better than the cobalt prepared with the narrow pore Al2O3. The addition of Zr made further improvement of performance of both cobalt catalysts by facilitating Co reduction or reducing cobalt cluster size, but the Zr additive slightly increased CH4 selectivity of the cobalt catalysts supported on a wide pore alumina.
In addition to the important additives reviewed above, other additives such as V, Mg and Ce [15,18,19], K [15], Cr, Ti, Mn, and Mo [9,20,21], Nb [22] and P [23] have been also studied. These additives served as structural or electronic additives to modify cobalt catalyst behavior. Most of them at low loadings were reported to enhance cobalt reduction and dispersion, and promoted activity and selectivity toward heavier hydrocarbons for cobalt catalysts.
According to this large number of additive effect studies, some of them such as Ag and Zr showed great benefits to the performance of the cobalt catalyst and are promising steps toward a potential replacement for Pt. Efforts continue to find potential substitutes for Pt additive and to better understand structure-performance relationships. In this work, we explore the effects of the Group 12–14 elements as potential additives and based on our success with Ag, have selected the Row 5 elements Cd, In, and Sn. The effect of these additives on physiochemical properties and FTS performance of 15%Co/Al2O3 catalysts were carefully studied using various characterization and testing techniques.

2. Results and Discussion

2.1. BET and Porosity Measurements

BET and porosity results of unpromoted and 1%Cd, 1%In, and 1%Sn catalysts are summarized in Table 1. BET of Catalox SBA 150 γ-Al2O3 is 149 m2/g [6,7,8,16,17,25]. After loading 15% Co, BET surface area decreased to 116 m2/g. A weight % loading of 15% is equivalent to ca. 20% by weight of Co3O4. If the support is the only contributor to the surface area, then the area of the 15%Co/Al2O3 catalysts should be 0.8 × 150 m2/g = 120 m2/g, which is close to the experimental values listed in Table 1. Thus, no significant decrease in surface area was observed due to pore blocking by Co oxide particles. The addition of 1%Cd, 1%In, and 1%Sn further decreased the BET of SBA 150 supported catalysts to 110, 111 and 115 m2/g, respectively. The pore volume (0.31 cm3/g) and the pore size (radius = 4.7 nm) remained nearly unchanged for the unpromoted and the three promoted 15% Co/Al2O3 catalysts, which were lower than those of the SBA-150 support (0.5 cm3/g and 5.4 nm from [8]). The results further suggest that the addition of Co and the Cd, In and Sn additives did not significantly block the pores of the alumina support.

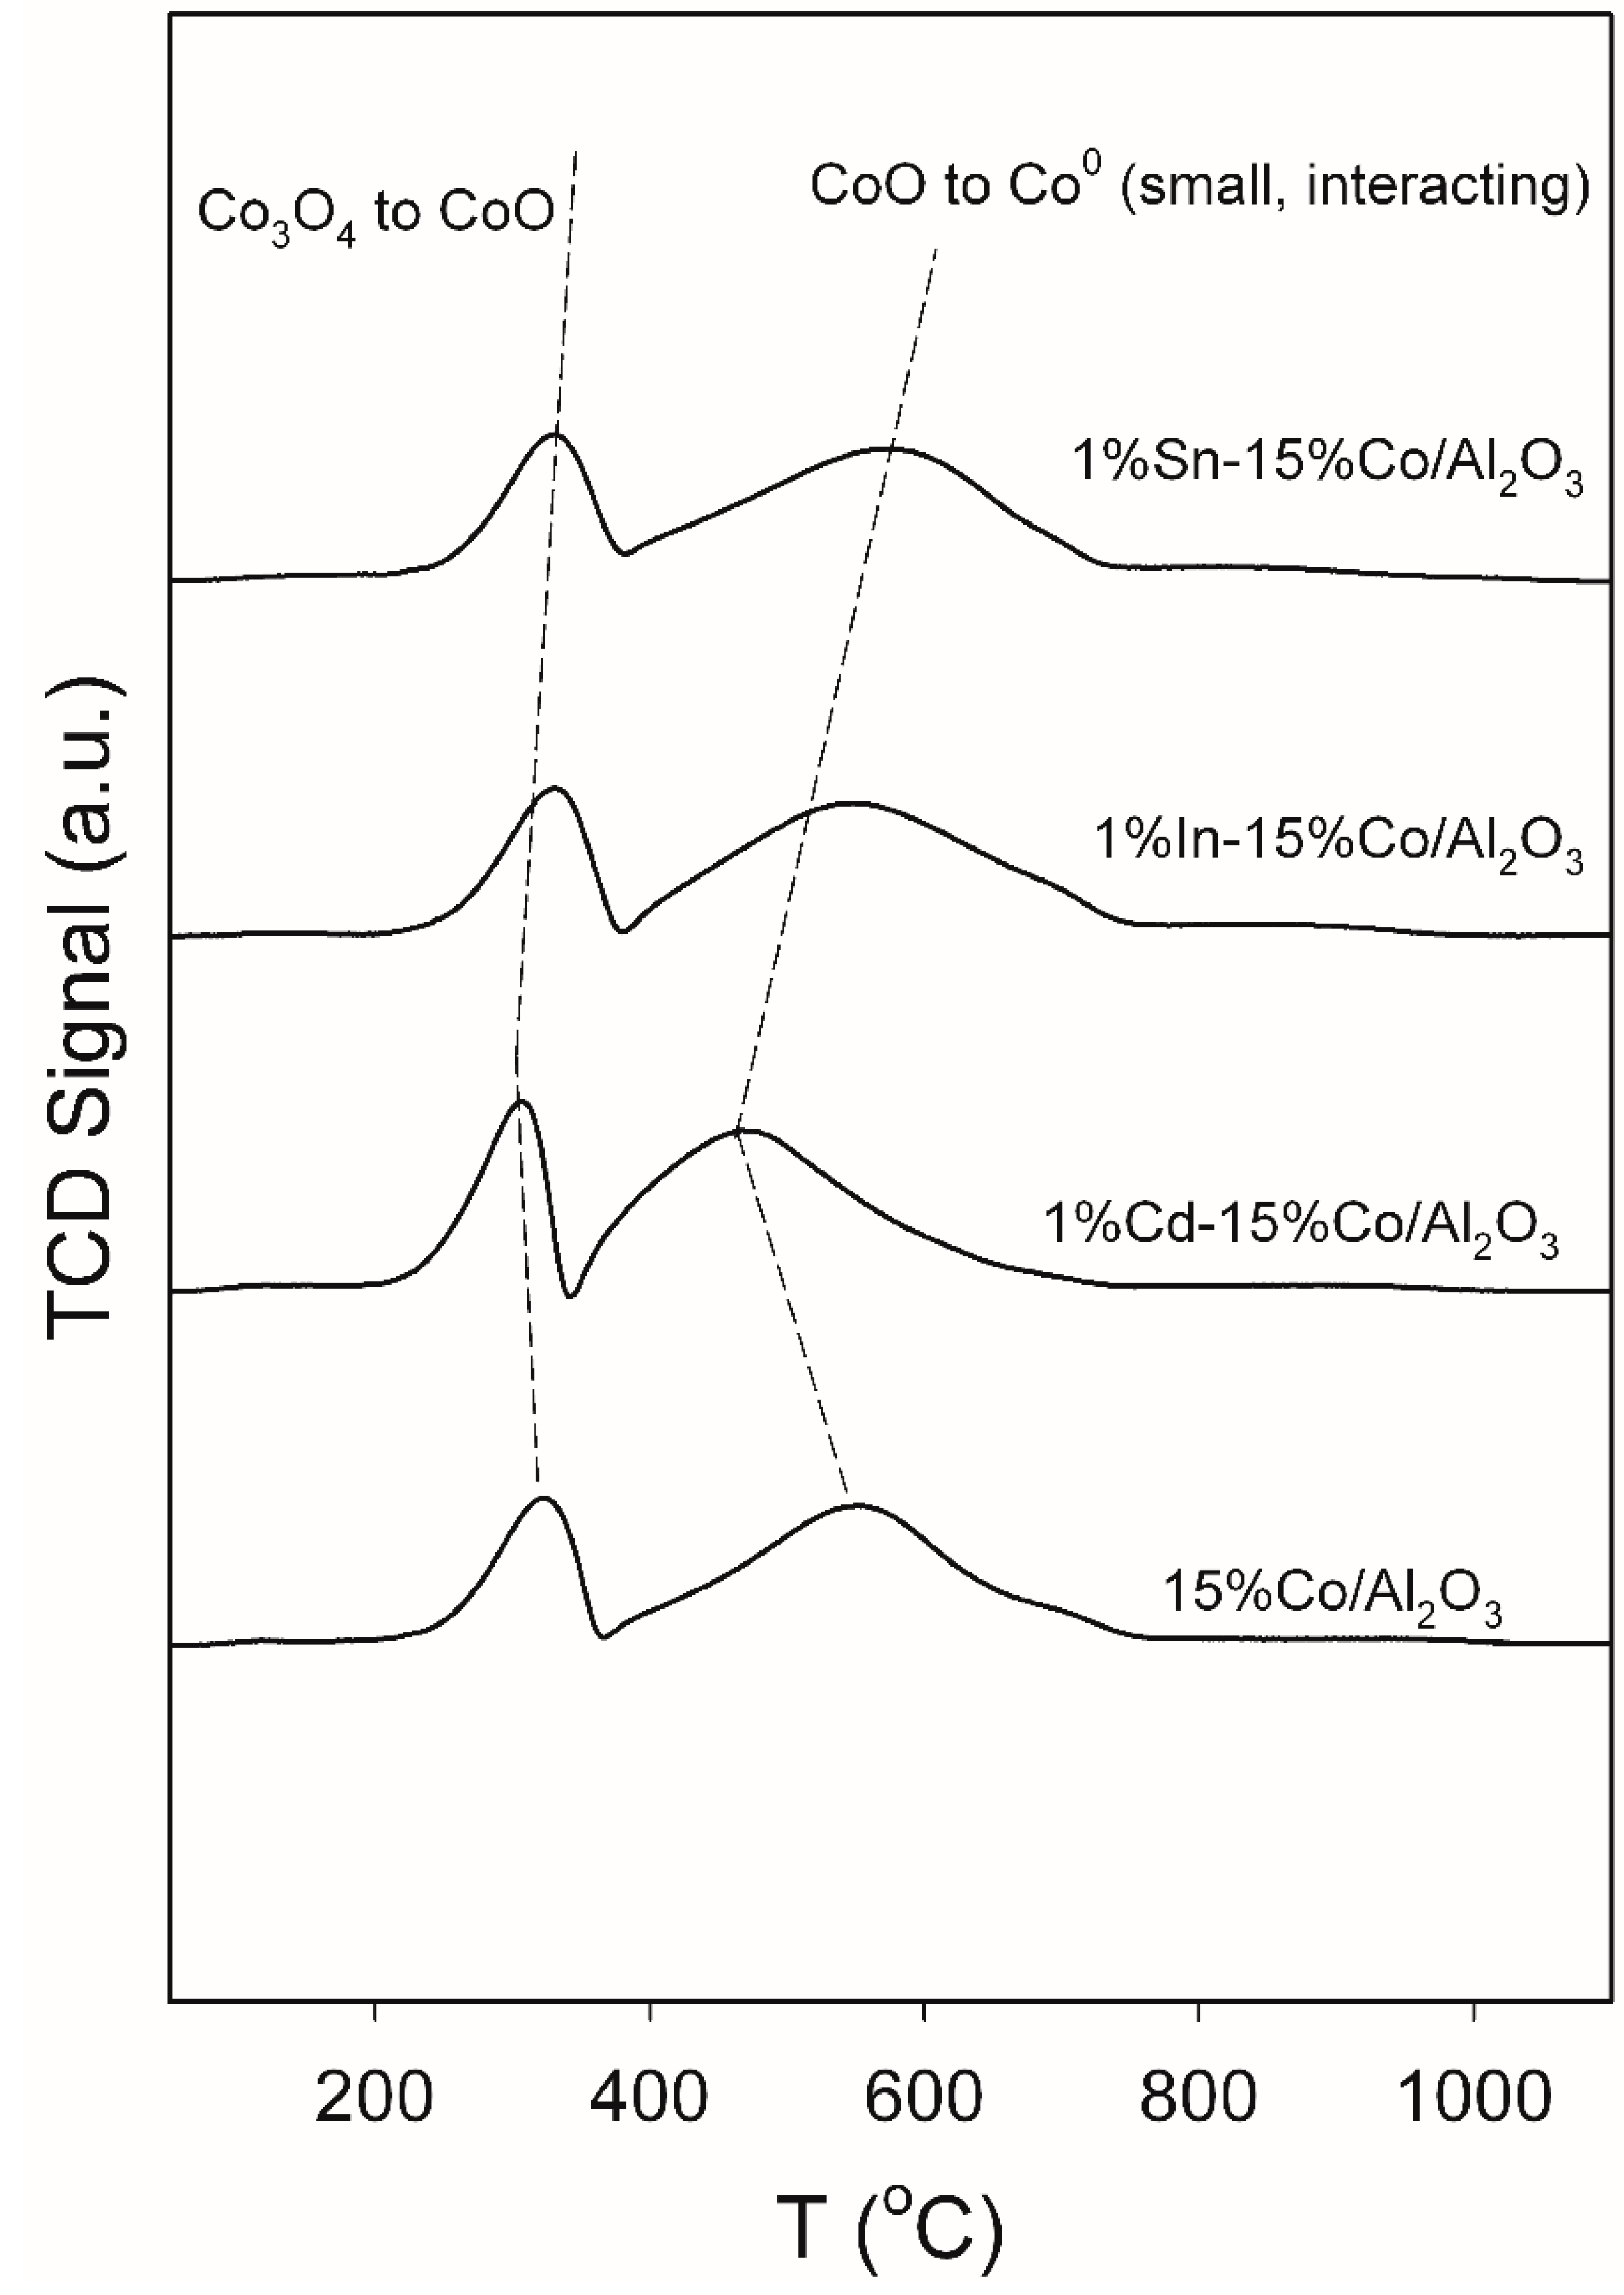
2.2. TPR and Hydrogen Chemisorption/Pulse Reoxidation

TPR profiles of the unpromoted and 1%Cd, 1%In, and 1%Sn cobalt catalysts are presented in Figure 1. Two peaks occurred at the temperature ranges of 220–380 °C and 400–700 °C, which represent the standard two-step reduction of cobalt: Co3O4 + H2 → 3CoO + H2O and 3CoO + 3H2 → Co0 + 3H2, where the second step consumes three times as much hydrogen as the first step. The broad high temperature peak for the reduction of CoO to Co0 indicated strong interactions between CoO and the alumina support. It is interesting that the addition of 1%Cd, 1%In and 1% Sn did not significantly change the temperature for the first reduction step of Co3O4 to CoO, and the peak temperature for the unpromoted and three promoted cobalt catalysts remained at 320–330 °C (Figure 1). However, the addition of 1% Cd shifted the second reduction peak to lower temperature by 80 °C relative to the unpromoted 15%Co/Al2O3 catalyst (540 vs. 460 °C), and thus, as the atomic number of the additive is increased, the broad reduction peak occurs at higher temperatures, e.g., 535 °C for In and 570 °C for Sn, which indicated that only Cd and, to a lesser extent, In, facilitated reduction of CoO; on the other hand, Sn addition slightly hindered the reduction of CoO.
H2 chemisorption and oxygen titration results are also shown in Table 1. The cobalt reduction degree increased from 48.5% to 57–59% for the 1%Cd and 1% In promoted cobalt catalysts, but it slightly decreased to 46% for the 1%Sn promoted catalyst, as compared to that of the unpromoted catalyst. This could be due to the formation of cobalt-additive coordination, as this was shown for the noble metals by EXAFS and suggested for the Group 11 metal Cu based on chemisorption results [4,5,6,16,17]. The reduction results as determined by H2 chemisorption pulse re-oxidation are in agreement with the TPR results above. In terms of the TPR and H2 chemisorption/pulse oxidation results, it is likely that the Cd, In and Sn additives are highly dispersed on the catalyst surface, with a fraction strongly interacting with the support and resulting in little reduction (consistent with the XANES results in the next section which showed the presence of oxides), while a fraction was likely metallic and/or coordinated with Co to increase cobalt reduction. Interestingly, the hydrogen chemisorption/pulse reoxidation results show that all Cd, In, and Sn additives lowered cobalt site densities compared with the unpromoted catalyst, with H2 desorption amounts decreased from 57 to 37–53%. Assuming the desorption of hydrogen comes only from the surface of Co0, the “apparent” average cluster size is increased for the Cd, In and Sn promoted catalysts (11 to 14–16 nm). However, more likely, the decreased cobalt site density by Cd, In and Sn could arise by (1) the additives being located on the cobalt surface and covering some cobalt sites, or (2) blocking of pores. However, the BET results discussed above tend to rule out the latter explanation. That is, it is likely that the Co particles remained the same size but that Cd, In and Sn addition blocked surface sites.

2.3. NH3 TPD Study of Cd, In and Sn Promoted Catalysts

The NH3-TPD profiles of the unpromoted and the Cd, In and Sn promoted 15%/Al2O3 catalysts are shown in Figure 2. Two types of acidic sites (weak and mild to strong) are clearly identified with the corresponding NH3 desorption peaks present at ca. 90 °C and 200–260 °C, respectively. For the unpromoted cobalt catalyst, the first NH3 desorption peak is more intense than the second one, indicating the unpromoted cobalt catalyst surface was mainly covered by the weak acid sites (likely L sites). In the case of adding 1%Cd, the NH3 desorption amounts in both peaks increased greatly, but the first peak area exhibited a greater change, implying that addition of Cd resulted in a greater fraction of weak acid sites. However, for the In-promoted cobalt catalyst, the first NH3 desorption peak shows only a slight increase in the intensity, but the second one became more intense; moreover, the second peak slightly shifted to lower temperatures (i.e., 240 vs. 260 °C). Thus, addition of 1%In primarily promoted the strong acid sites. Interestingly, the Sn promoted cobalt catalyst displayed a similar NH3-TPD profile to that of the In promoted cobalt catalyst, suggesting a similar acid site density (e.g., B-sites) on the Sn and In promoted cobalt catalysts. However, the second peak moved to even lower temperatures relative to the Cd promoted and unpromoted cobalt catalysts. It can be observed that the higher the atomic number, the lower the peak temperature (i.e., 220 °C for the In-Co and 200 °C for the Sn-Co catalysts). The total amount of NH3 desorbed follows the order: Cd (119.3 µmol/g) > In (110.5 µmol/g) > Sn (104 µmol/g) > unpromoted (73.2 µmol/g).

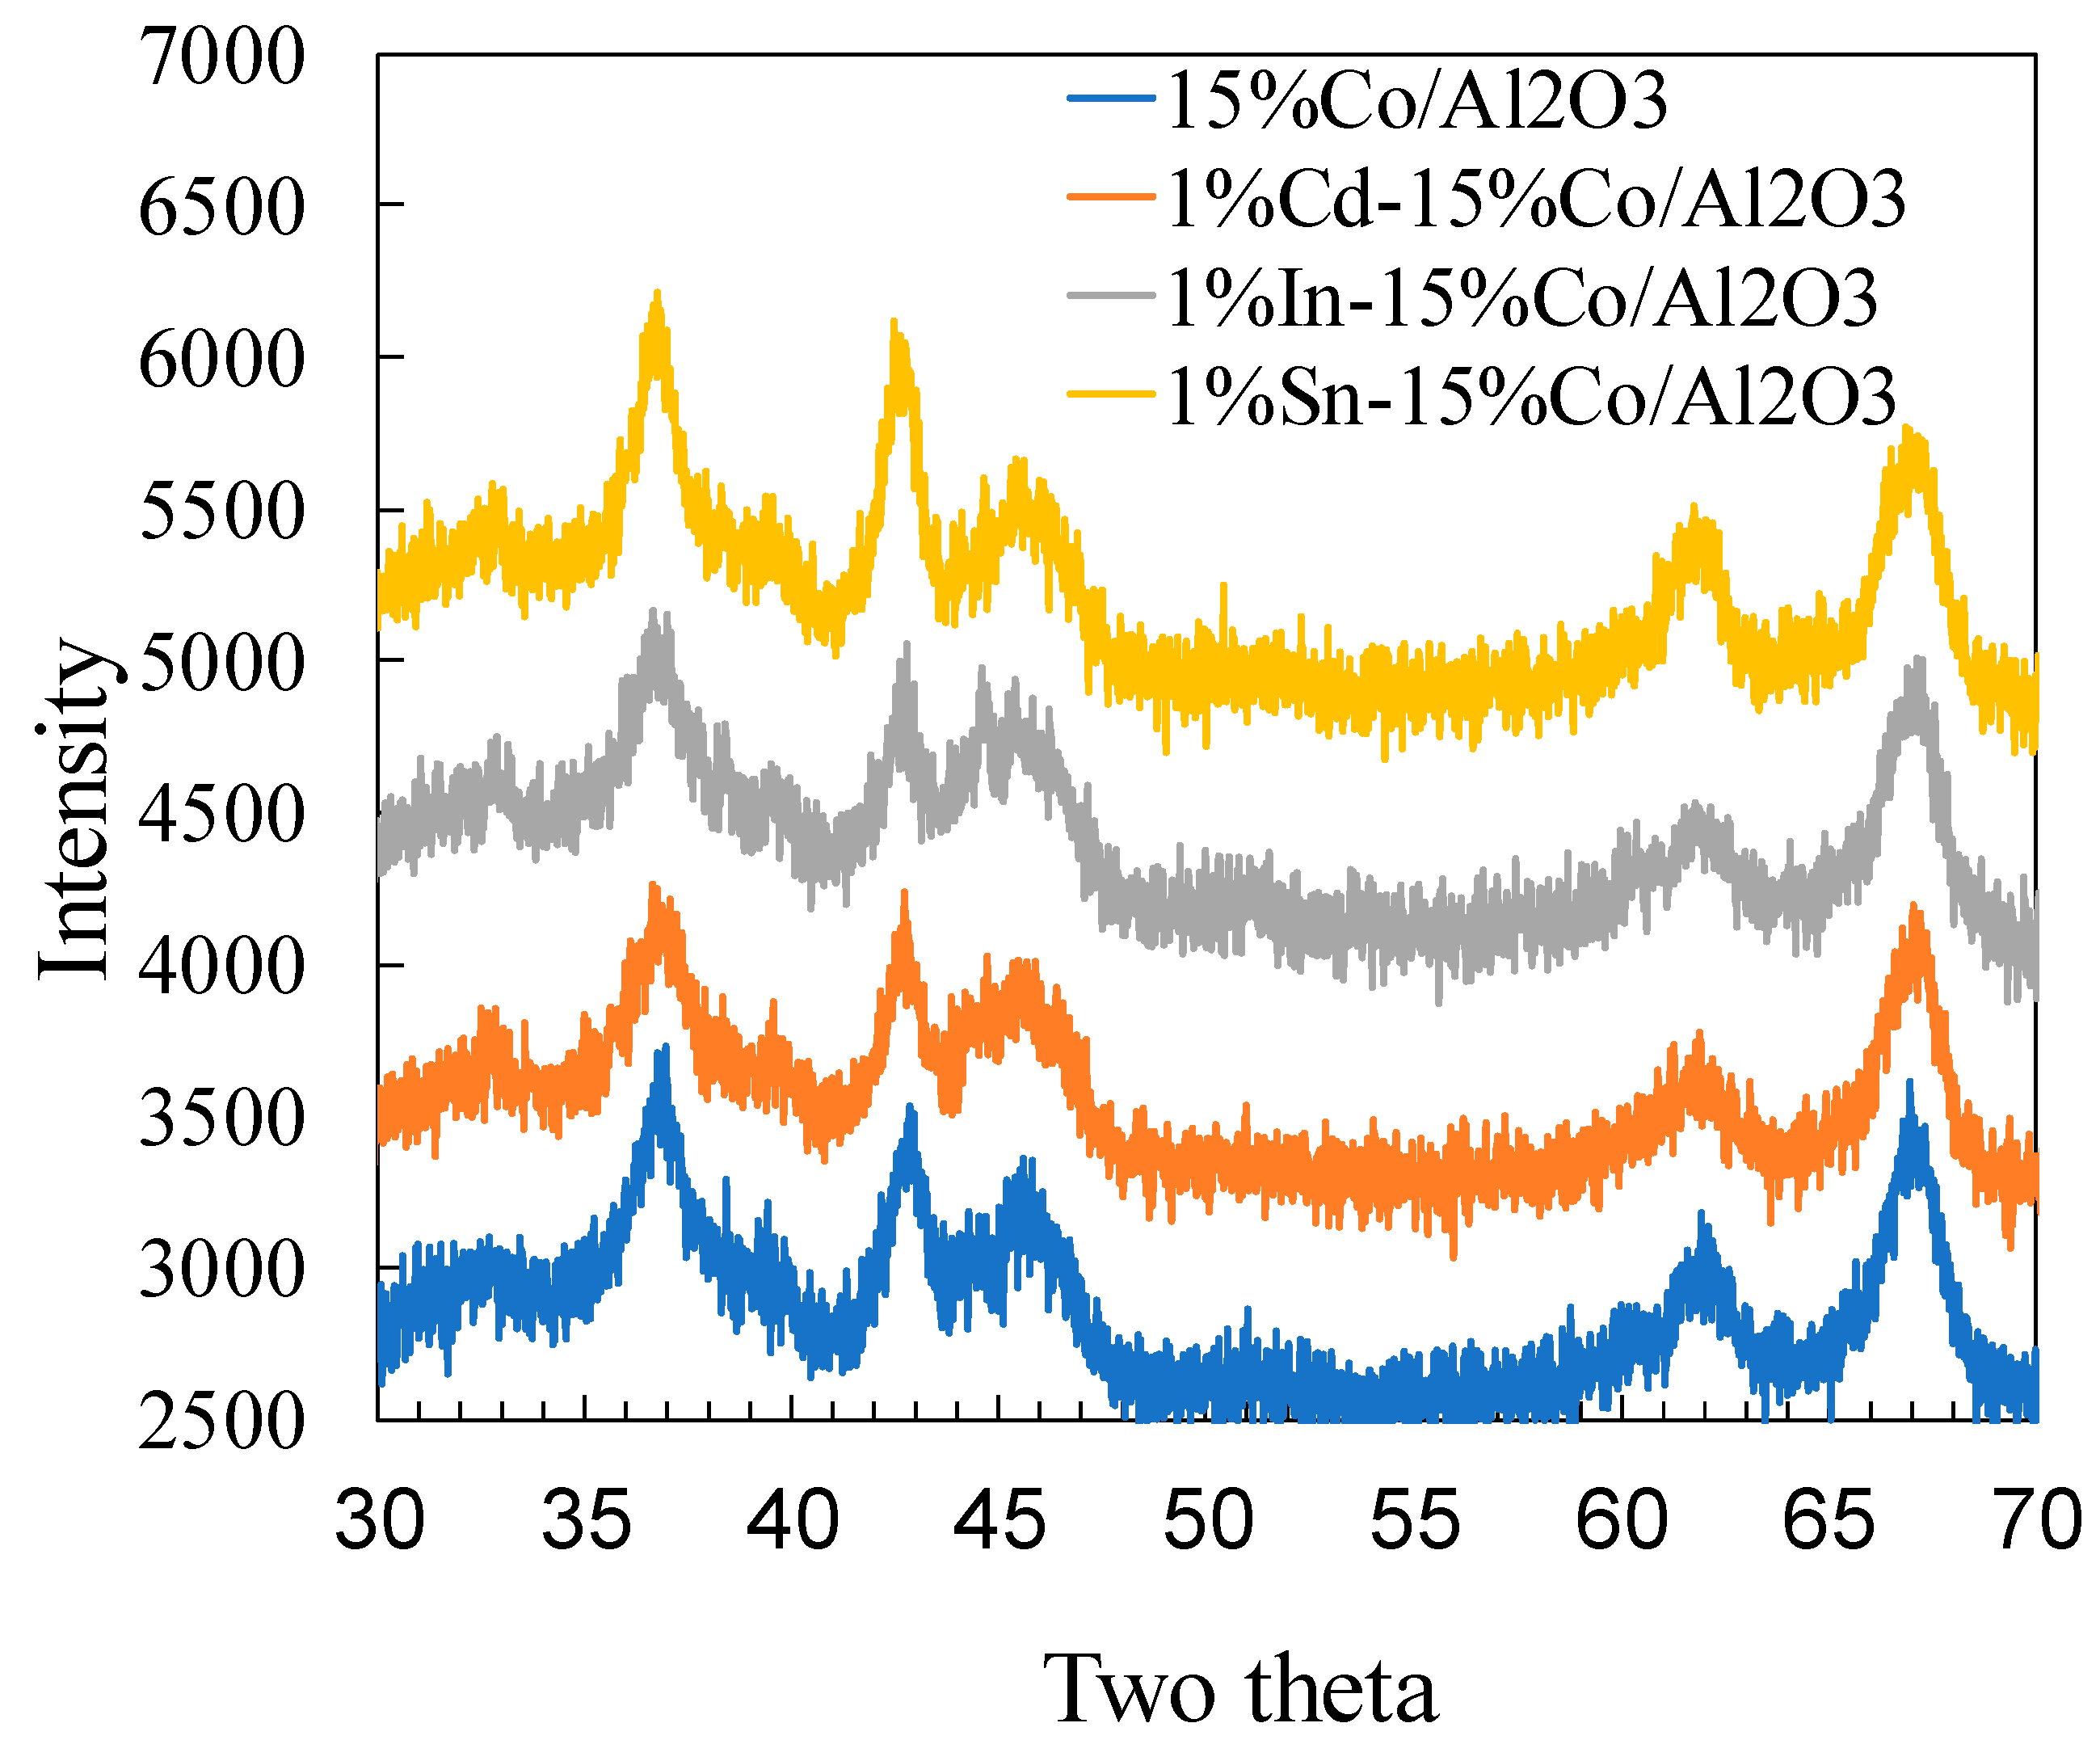
2.4. XRD Study of Unpromoted and Cd, In and Sn Promoted Cobalt Catalysts

The XRD spectra of the four reduced cobalt catalysts are depicted in Figure 3. The unpromoted and the Cd, In and Sn promoted cobalt catalysts show similar XRD patterns in the 2θ range of 30°–70°. Five intense reflections are observed at 2θ of 36.9° and 61.9°, 42.9°, and 45.9°, 67°, representing the characteristic peaks of cobalt oxide, Co, and alumina, respectively. Interestingly, regardless of whether the unpromoted catalyst was used, or whether additives were used, the intensities for each peak for the four different cobalt catalysts are quite similar, suggesting that average cobalt cluster sizes are similar. Based on the Scherrer equation, cobalt cluster size for the unpromoted and Cd, In and Sn calculated at the 2θ of 42.9° are 12.7 nm, 11.4 nm, 12.5 nm and 11.1 nm, respectively, which suggests that addition of Cd, In and Sn on the cobalt catalyst only slightly decreased the cobalt cluster size, if at all. This result is not consistent with the H2-chemisorption results, which suggest an apparent increased Co cluster size with the addition of Cd, In and Sn. The discrepancy strongly suggests that the additives cover some surfaces of cobalt nanoparticles or block pores of the support. However, the latter reason can be excluded based on the BET results as discussed in Section 2.1.

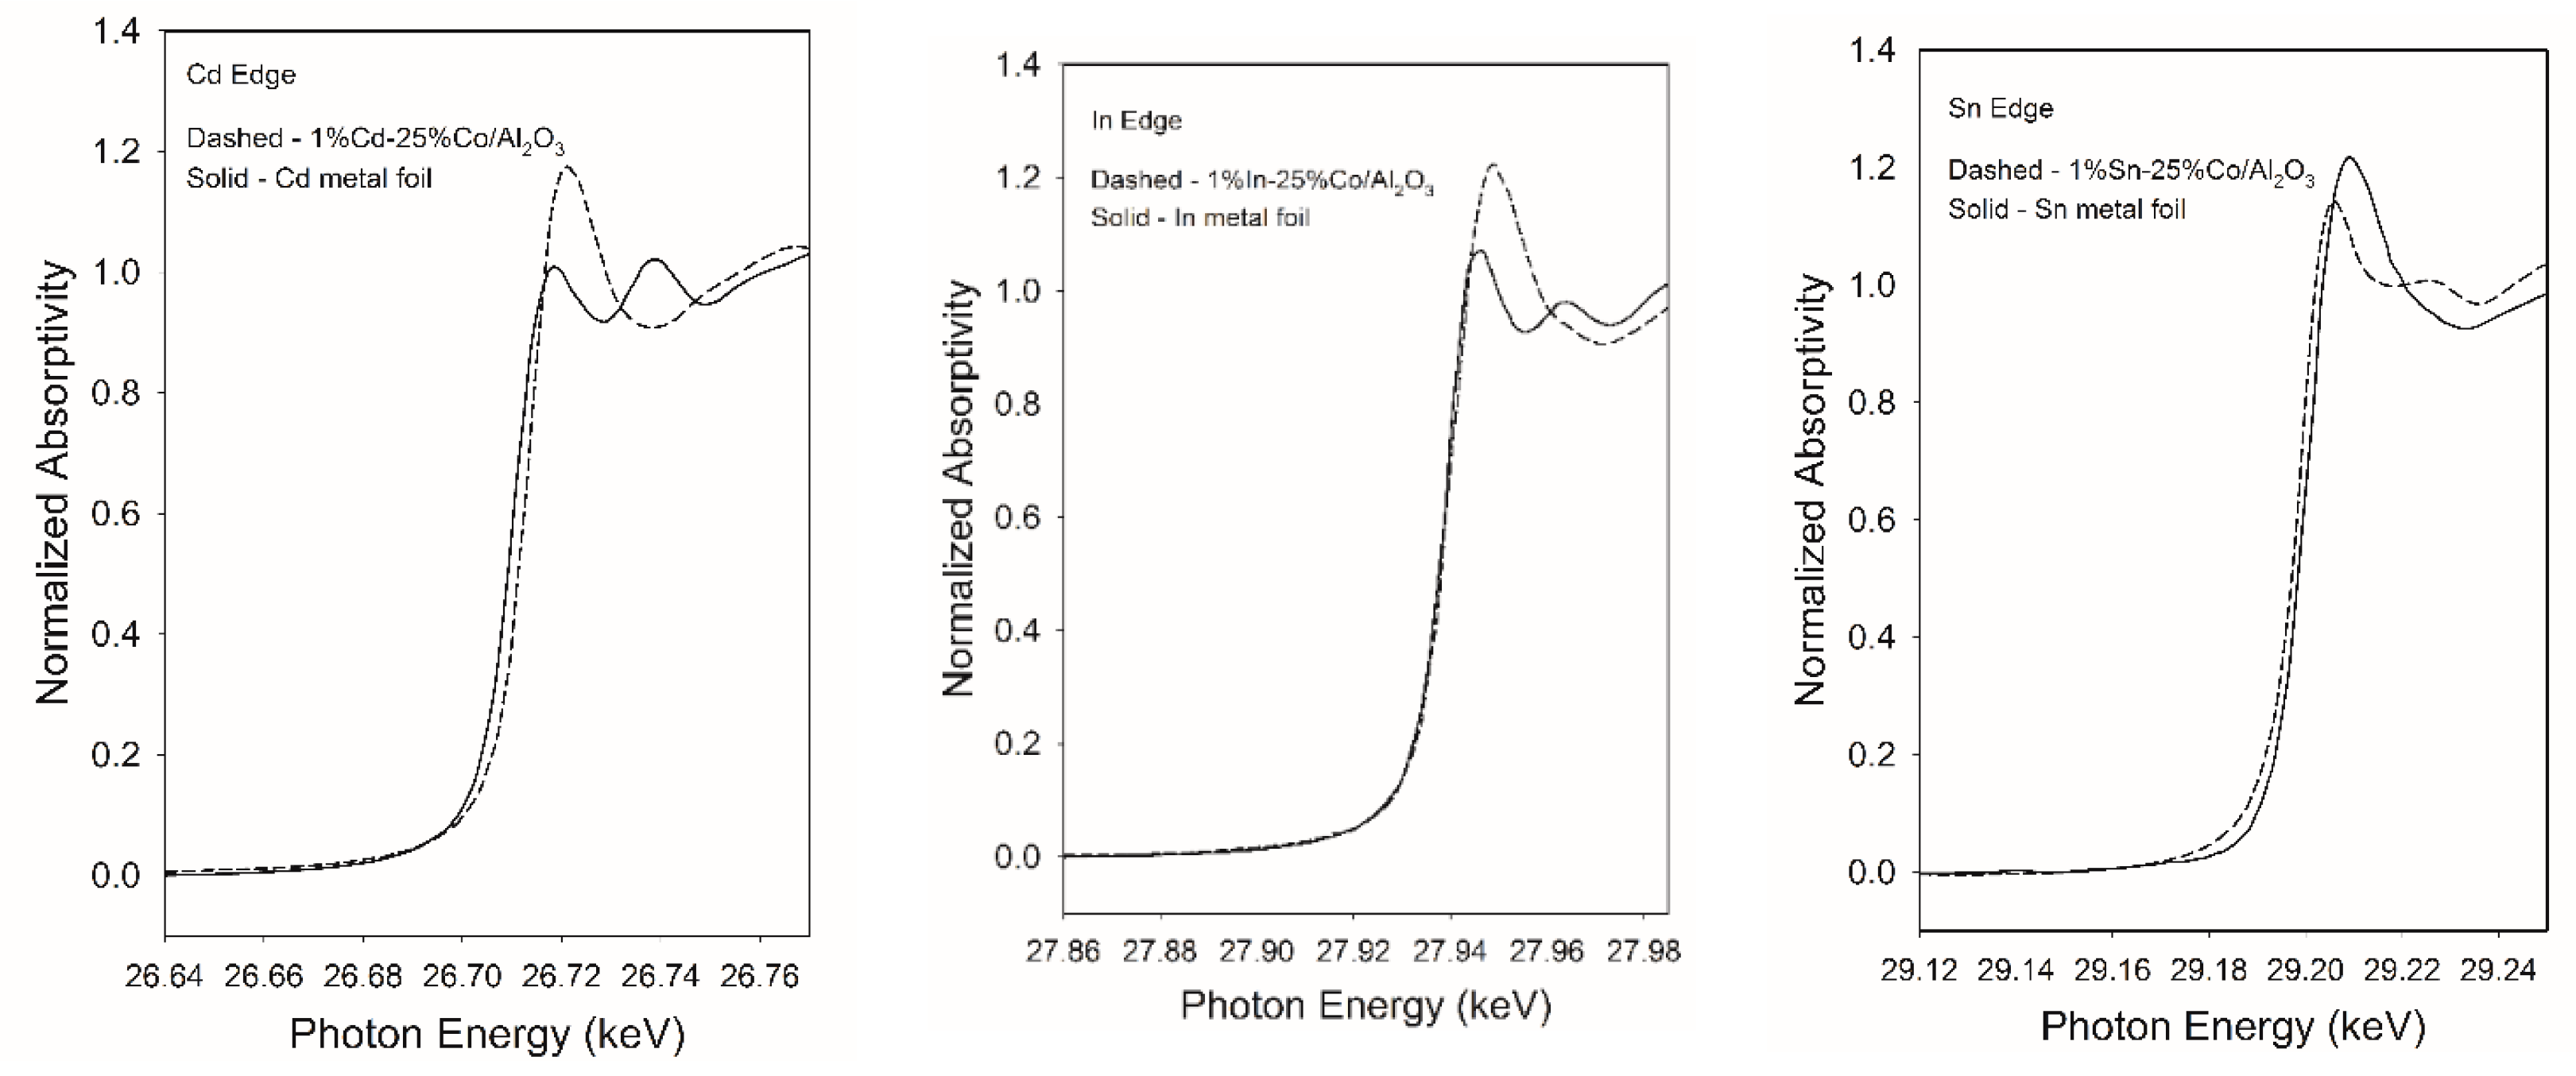
2.5. XANES Study of Cd, In and Sn Promoted Catalysts

To explore the electronic structure of the Cd, In, and Sn additives by XANES, 1%Cd, 1%In and 1%Sn supported on high cobalt loading (25%) catalysts were used because the additives had a greater effect on the more highly loaded Co catalysts. After the catalysts were reduced ex-situ, the cobalt catalysts were transferred to a 1L-CSTR under inert gas where 3000 Polywax was previously charged and melted. In this way the in-situ state of the Cd, In and Sn additives in the catalyst following H2 activation were able to be reviewed by XANES. Figure 4 shows the XANES spectra of 1%Cd-25%Co/Al2O3 (left), 1%In-25%Co/Al2O3 (middle) and 1%Sn-25%Co/Al2O3 (right), respectively, along with the spectra of reference Cd, In and Sn metal foils. The results show that metal oxides were observed for the three additives after activation. This result is different from the results of the noble metal additives Pt, Pd, and Ru [6,16,17] and Group 11 metals (Cu, Ag, and Pt) studied previously [4,5,6,17], in which only the metallic state rather than the oxidized state was found for the additives by XANES/EXAFS.

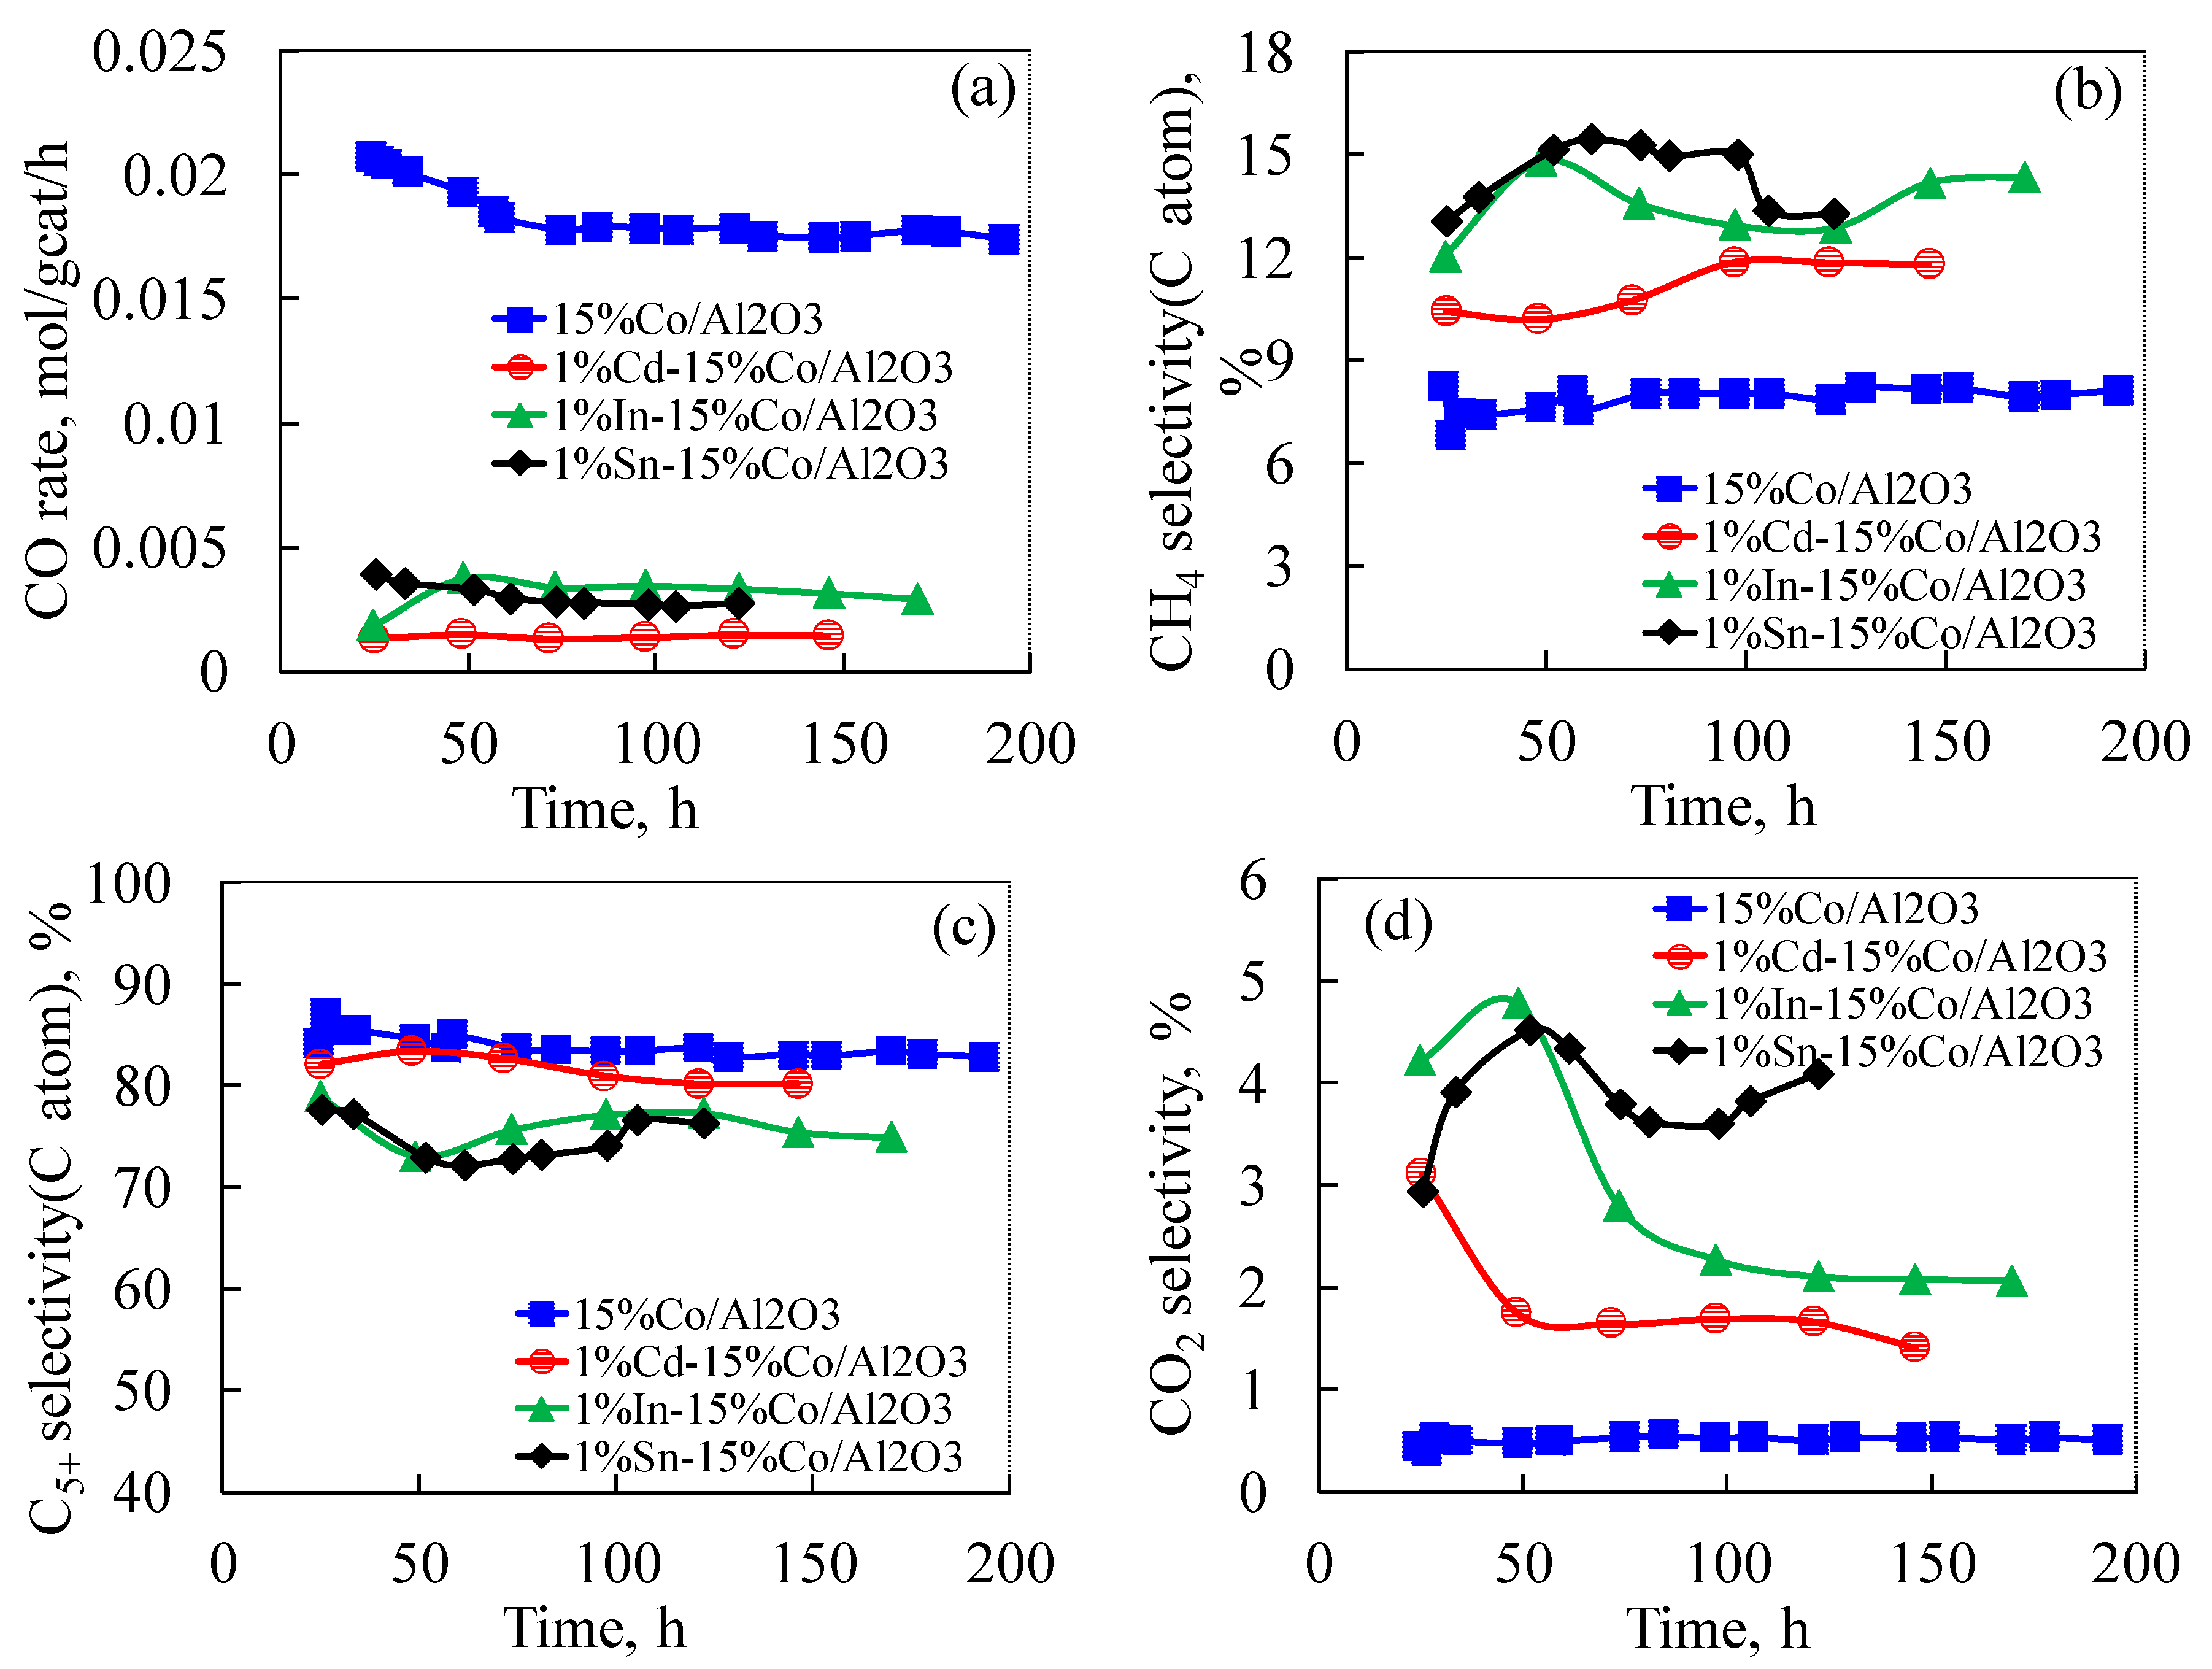
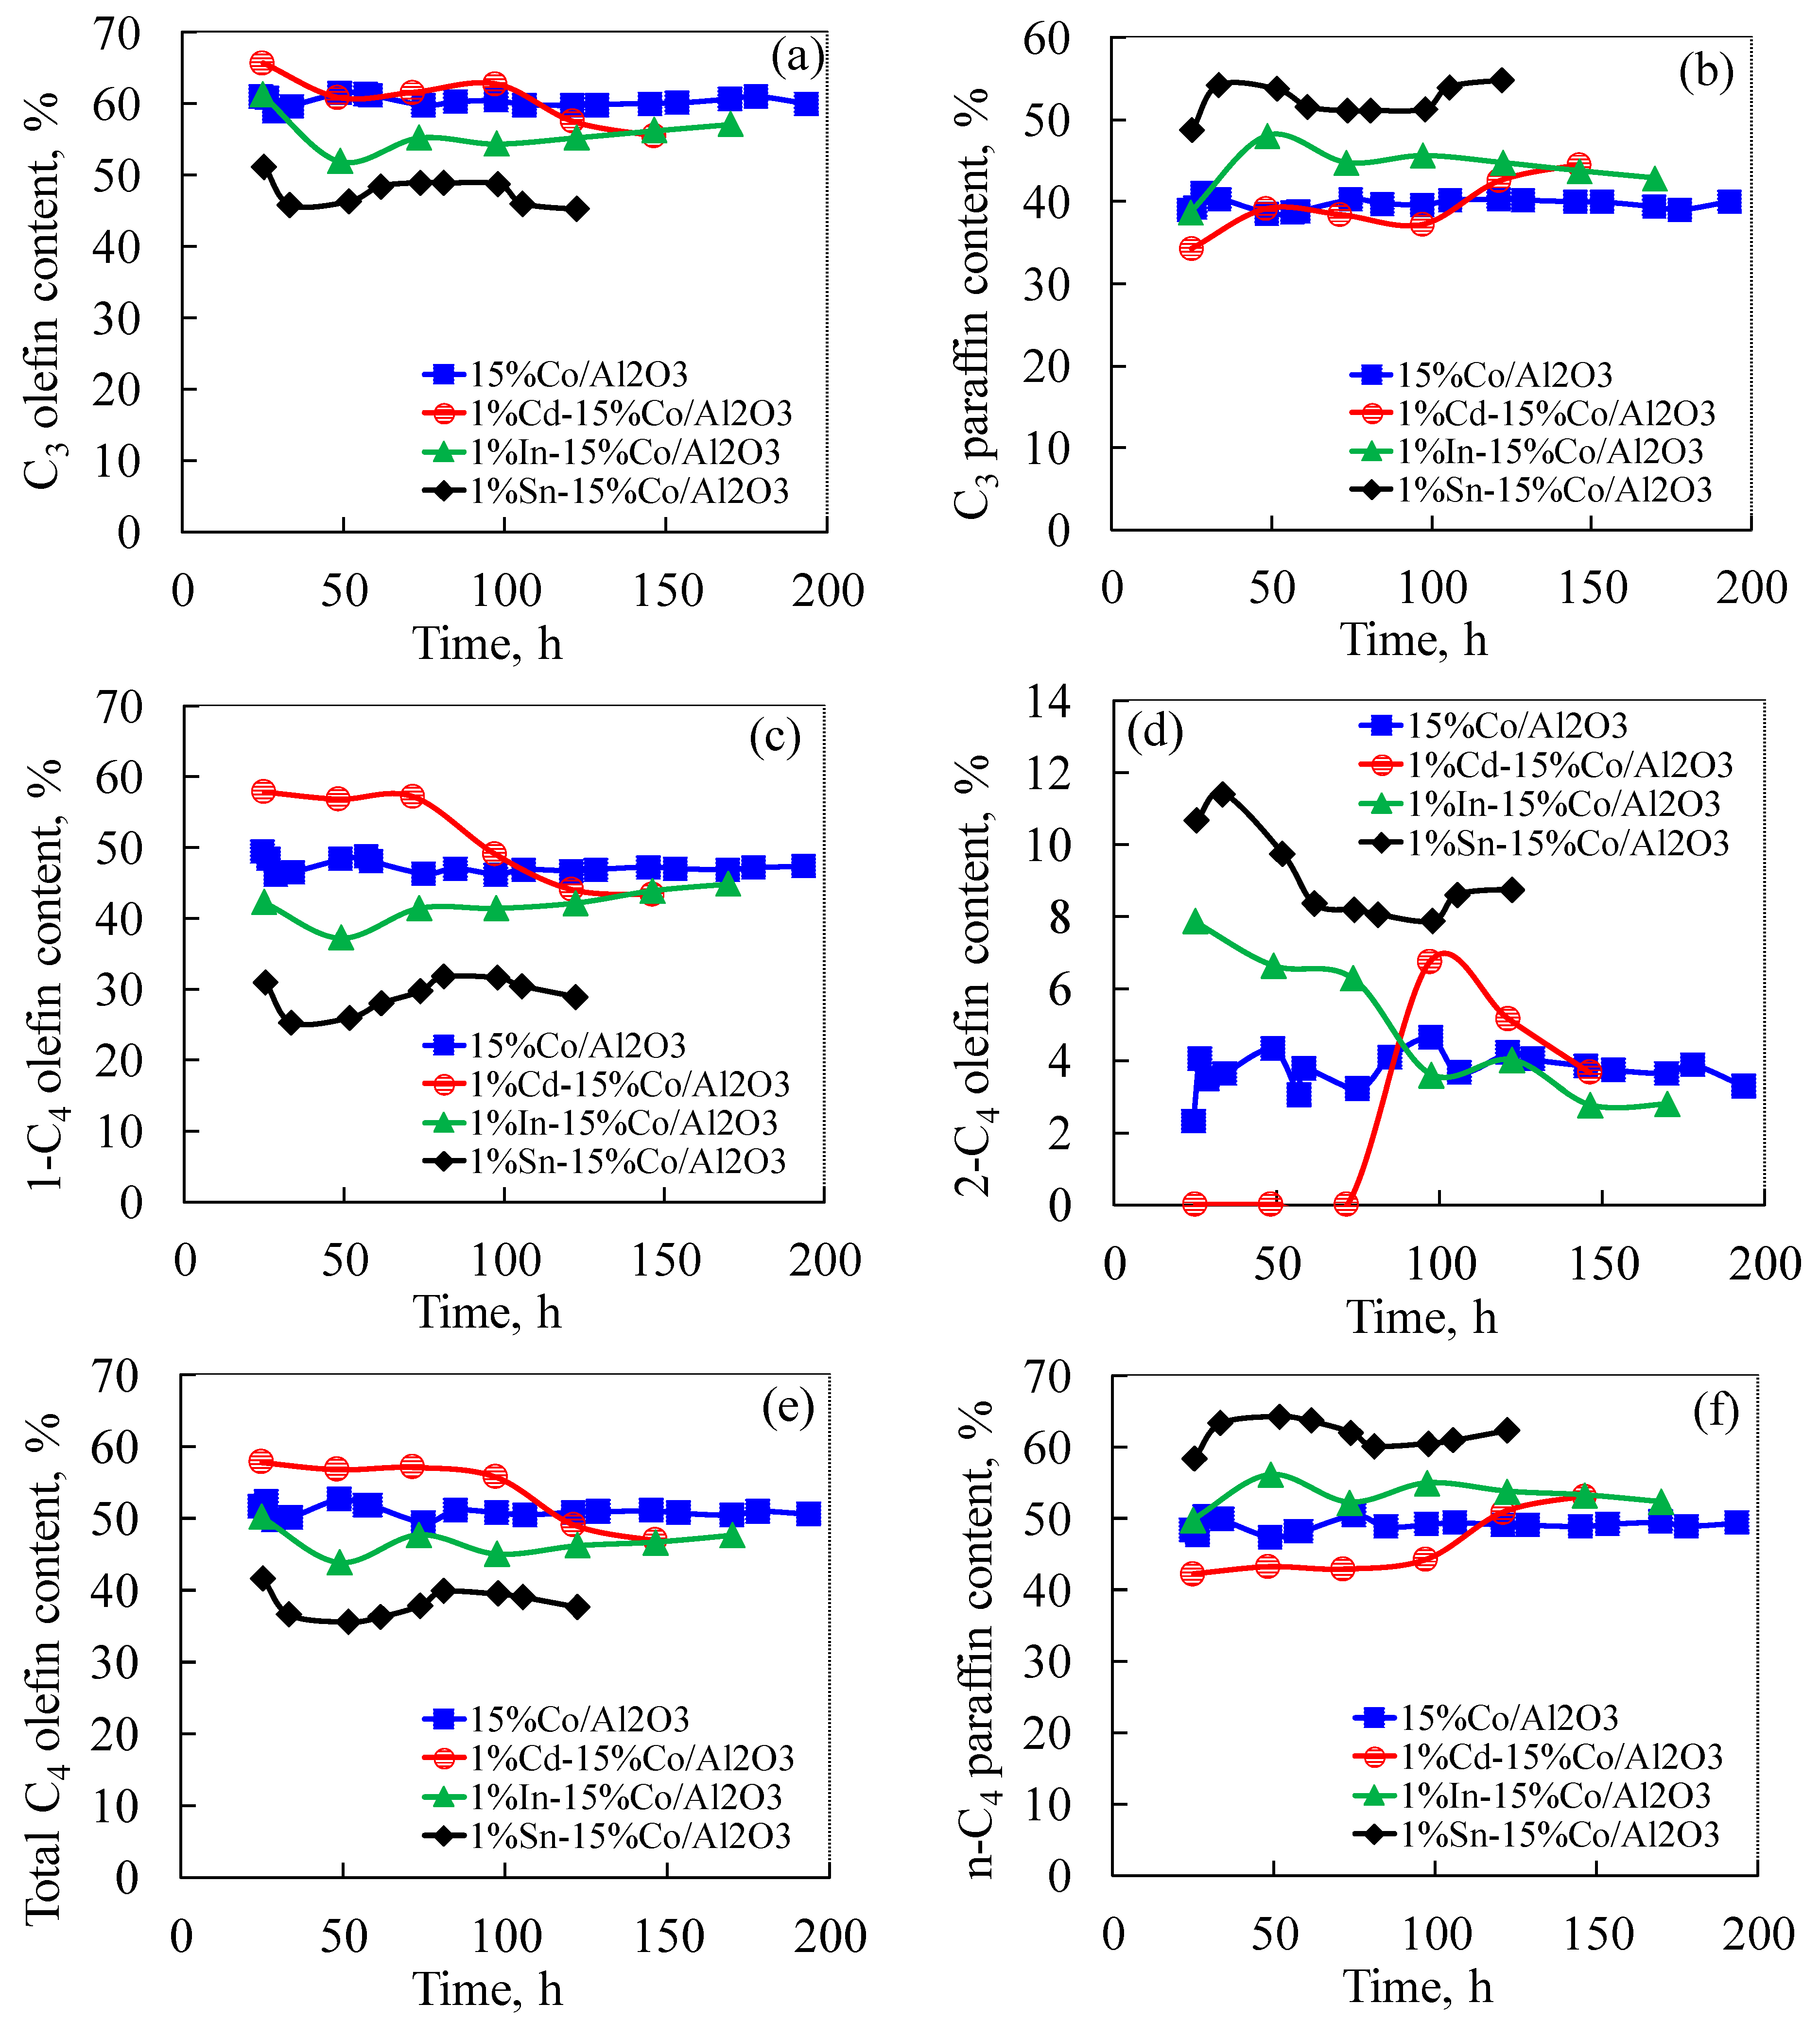
2.6. Effect of Cd, In and Sn Additives on Fischer-Tropsch Synthesis

The effects of 1%Cd, 1%In and 1%Sn additives and time on CO rate, CH4, C5+ and CO2 selectivities are shown in Figure 5a–d and Table 2. The promoted catalysts were running at 20–30% CO conversion in the first ca. 50 h; afterwards, CO conversion was adjusted to the 40–50% level in order to better compare catalyst selectivities. The CO rate for the unpromoted catalyst was 0.022 mol/g-cat/h. The addition of 1%Cd, 1%In or 1%Sn additive drastically decreased the catalyst activity to 0.0015, 0.004 and 0.003 mol/g-cat/h, respectively, corresponding to very high rate loss percentages of 93%, 82% and 86% for the Cd, In and Sn additives, respectively. After adjusting CO conversion to 40–50% level after 50 h, the unpromoted cobalt catalyst and 1%Cd promoted catalyst displayed better stability, and the CO rate over the next time period of 100–150 h remained at ca. 0.017 mol/gcat/h for the unpromoted catalyst and ca. 0.0015 mol/gcat/h for the Cd promoted catalyst. However, the In and Sn promoted catalysts were slowly deactivating with time, with CO rate changes from 0.004 to 0.0028 mol/gcat/h and from 0.003 to 0.0025 mol/gcat/h for the In and Sn promoted catalysts, respectively. The significant decreases in cobalt catalyst activity caused by the additives are not consistent with the changes in the H2 chemisorption results as discussed in Table 1. In re-examining the H2 desorption results, the H:Co ratio is assumed to be 1:1, where “Co” refers to surface Co0 atoms. The addition of 1%Cd, 1%In and 1%Sn only led to cobalt site density decreases of 8.2%, 20.4% and 36.1%, respectively. Thus, it was expected to have similar activity losses percentages for the promoted catalysts, since the change in FT activity has been generally consistent with changes in H2 chemisorption capacities of cobalt catalysts resulting from different loadings of Pt, Re, Ru, Ag, and Au, and even Zr additives [5,6,7,8,16,17]. The activity of the Cd, In and Sn promoted catalysts being 3 to 10 times lower than the expected results strongly suggests that other reasons may account for the lowering in catalyst activity. During an investigation of Group 11 additives (i.e., the coinage metals–Cu, Ag, and Au), while all the additives facilitated cobalt oxide reduction, only the Ag and Au additives increased the catalyst activity on a per g of catalyst basis. All the catalysts had higher metal site densities by H2-TPD relative to the unpromoted 15%Co/Al2O3 catalyst, but Cu decreased catalyst activity; however, the difference in the adverse effects of the Cu additive were much less pronounced than that of the Cd, In and Sn additives in this study. Thus, H2-TPD only reports metal site density, and in the case of Cu, Cu0 was likely on the surface of the cobalt particles so that, while it on the one hand promoted reduction of cobalt oxides, it decreased the cobalt surface site density by blocking sites on the surface. However, BET results do not suggest pore blocking by cobalt and the additives.
Another possibility, however, is that the catalysts have the active site density as measured by chemisorption after activation, but that the site density is decreased due to reoxidation once FTS is started. A previous study of Co catalysts in an in-situ EXAFS/XANES flow cell by Huffman et al. [24], reported that Co catalysts promoted with K were much more susceptible to reoxidation (i.e., even at low conversion) compared to catalysts having no K, which only oxidized under high H2O partial pressure at high conversion. However, carefully examining the FTS activity data as shown in Figure 5a, the Cd, In and Sn promoted cobalt catalysts did not deactivate in the first 50 h; instead, the activities slowly increased with time for all cases. Therefore, rapid reoxidation of cobalt particles facilitated by Cd, In and Sn additives is only a possible explanation if it occurred prior to measurement of the first point.
According to the above discussion, blocking of pores by the additives can be excluded; thus, it was not a cause for the unexpected low activity of the promoted cobalt catalysts; the fast oxidation of cobalt particles is uncertain. The formation of M-Co (M = Cd, In and Sn) coordination or alloying can also be ruled out, because if this were the case, the H2 chemisorption/pulse re-oxidation results would show similar large differences between the unpromoted and the promoted cobalt catalysts-i.e., ~90%, but this was not observed. Furthermore, the XRD experiment did not show Co-M alloys peaks. Based on the XRD results, addition of Cd, In and Sn on the cobalt catalyst should have led to slightly increased cobalt site density by decreasing cobalt cluster size; thus, the most likely reason that explains the unexpected low activity for the Cd, In and Sn promoted catalysts is that the additives covered cobalt sites and poisoned the surfaces of the cobalt catalysts. Larger Sn atoms might contribute more significantly to cobalt site poisoning, resulting in the lowest catalyst activity. However, an electronic effect of the additives such as Cd, In and Sn on catalyst performance cannot be excluded. Additional study is needed to clarify the assumption.
From Table 2 and Figure 5b,c, CH4 selectivity for the unpromoted 15%Co/Al2O3 catalyst is 7.4% at 50% CO conversion, but it increased dramatically to about 10.5%, 13.8% and 13.5% for the 1%Cd, and 1%In or 1%Sn promoted catalysts, respectively. This caused corresponding drops in C5+ selectivity to ca. 82.7 %, 75.3, and 76.6%. Thus, the In and Sn additives have a greater impact on increasing CH4 and suppressing heavier hydrocarbon formation relative to Cd. The greater increase in CH4 and light hydrocarbon selectivities for the In and Sn promoted cobalt catalysts than that of Cd is likely associated with a greater density of strong acid sites on the two cobalt catalysts as determined by NH3-TPD (Figure 2). This conclusion is further evidenced by the In and Sn promoted cobalt catalysts having similar amounts of strong acid sites (located after 200 °C) and displaying essentially the same hydrocarbon selectivities at about 50% CO conversion, i.e., CH4 selectivity 13.5–13.8%, C2–C4 selectivity 10–11% and C5+ selectivity 74–75%. It is likely that the strong acid sites on the surface of cobalt promoted H2 adsorption and promoted methane and light hydrocarbon formation.
The addition of 1%Cd, 1%In or 1%Sn additives also led to significantly increased CO2 selectivity (0.5 to 2–5%). The significant changes in catalyst selectivity also indicated that species other than metallic Co are present in the catalyst, since metallic cobalt does not possess intrinsic water-gas shift (WGS) activity. Note that higher WGS activity leads to higher methane selectivity, since WGS promotes the formation of hydrogen. The XANES results showed that the Cd, In and Sn additives were present in oxidized form after reduction. It is well known that a synergy between a partially reducible oxide and a metal results in WGS activity, and this might explain the higher CO2 selectivity during FTS.
The effects of 1%Cd, 1%In and 1%Sn additives and time on the contents of propylene, propane, 1-butene, 2-butene, total butene and butane are shown in Figure 6a–f, respectively. Table 3 also summarized mean values of these parameters at different time ranges. At 40–50% CO conversion level, C3 olefin content for the unpromoted 15%Co/Al2O3 catalyst was 60.7%. Doping 1%Cd, 1%In and 1%Sn to the catalyst decreased C3 olefin content to 58.6%, 53.9%, and 46%, respectively, but C3 paraffin content increased to 41.4%, 46.1% and 48.9% from 39.3% (Table 3, Figure 6a,b). Moving to C4 hydrocarbons, precisely the same trend is observed at 40–50% CO conversion. The Cd, In and Sn additives resulted in decreases in 1-C4 olefin selectivity to 45.4%, 40.1% and 25.6%, respectively, from 48.1% as compared to the unpromoted catalyst. This also led to a measurable increase in 2-C4 olefin content to 5.2%, 5.5%, 10.7% from 3.5% and C4 paraffin contents to 49.4%, 54.4%, 63.9% from 48.4%, respectively (Table 3 and Figure 6c–f). The results are interesting, as they clearly indicate that the Cd, In and Sn additives enhanced the hydrogenation and isomerization of 1-olefin reactions on the cobalt catalysts. The extent of these secondary reactions increased with increases in the atomic number of the additive. The Sn apparently is the most effective one among all three additives to greatly increase the hydrogenation and isomerization reactions. As discussed in terms of the TPR and XANES results, a fraction of the additives might be in a metallic state, while the remaining additive may be highly dispersed and strongly interacting with the support or cobalt surface, which are in oxide form and/or Co-M (M=Cd, In and Sn) coordinated states. Thus, it is postulated that addition of Cd, In and Sn to the cobalt catalyst likely creates new acid sites on catalyst surface, leading to a higher activity of secondary reactions of olefins relative to the unpromoted cobalt catalyst. This hypothesis is consistent with the NH3-TPD results as discussed in Section 3.3, which indicated a greater abundance of mild acid sites on the Sn-Co catalyst occurring at low temperature (200 °C) relative to the Cd and In promoted cobalt catalysts. Much higher 2-C4 olefin content for the Sn-Co catalyst suggests that mild acid sites are more active for the secondary reaction of olefins.
In our previous studies, Pd and Pt were found to increase CH4 (8–12%) and suppress heavier hydrocarbon formation (83–76%); and, Pd displayed much higher hydrogenation and isomerization activities (1-C4 olefin: 47–25%, 2-C4 olefin: 7–14.8%) [7,16]. Thus, the impact of Sn on the formation of olefins and paraffins resembles that of Pd.
The Cd, In and Sn elements used as additives to modify FTS cobalt catalyst performance have been scarcely reported. However, some studies have employed them (e.g., as bimetallics such as Pt-In, Pt-Sn) for other associated reactions. Cho et al. [26] reported that Sn supported on a mesoporous zeolite (3Dom-I MFI) offered significant improvements for the isomerization of C5 and C6 sugars such as xylose and glucose. Srinivasan et al. [27] found that Sn at different loadings changed the activity and aromatics selectivity of Sn-Pt/Al2O3 for n-octane conversion. Passos et al. [28] studied In-Pt/Al2O3, and Sn-Pt/Al2O3 bimetallic catalysts for cyclohexane dehydrogenation, methylcyclopentane hydrogenolysis, and n-heptane conversion. It was found that after the catalyst was reduced by 1.5%H2/Ar at 500 °C for 30 min., 50–80% In and 25–50% Sn was in a zero-valent state in the bimetallic system. During the methylcyclopentane hydrogenolysis and n-heptane conversion reactions at 500 °C, the In and Sn additives were reported to decrease the activity of the Pt/Al2O3 catalyst, which was explained by the In and Sn additives diluting Pt active sites on catalyst. Furthermore, addition of In or Sn led to decreases in the selectivity of hydrogenolysis, and an increase in the selectivity for dehydrogenation and aromatization products, but Sn was reported to greatly enhance the isomerization activity for the Pt/Al2O3 catalyst in the conversion of n-heptane. Coleto et al. [29] studied the transformation of 1-pentene, and 1-hexene over bimetallic Pt-Re/Al2O3, Pt-Sn/Al2O3 and Pt-Ge/Al2O3 catalysts. The Pt-Sn/Al2O3 catalyst was also reported to have high hydrogenation activity to n-pentane at low temperature (200 °C), while high isomerization activity was observed at the expense of hydrogenation at a high temperature of 500 °C, which is consistent with the study of Passos et al. [28]. The investigation showed by comparing with the result of the Al2O3 support that the double bond shift and skeletal isomerization of olefins are both acid-catalyzed reactions, while hydrogenation sites are metallic in nature. Thus, the hydrogenation sites and isomerization likely changed with temperature, with higher temperatures yielding more acid sites for the Pt-Sn catalyst. Mazzieri et al. [30] reported the same role of Sn in increasing isomerization activity for the reaction of naphtha reforming over a trimetallic Pt-Re-Sn catalyst supported on chlorided Al2O3. In this study, the improvements in secondary reactions of 1-olefins observed with the addition of Group 12, Group 13 and Group 14 elements (i.e., Cd, In and Sn) are consistent with the studies of Coleto et al. [26] and Passos et al. [28], which suggests that the additives not only boosted the hydrogenation rate of olefins, but they also produced new acid sites for isomerization, for example possibly as MOx, M-Co (M = Cd, In and Sn).

3. Experimental

3.1. Catalyst Preparation

The unpromoted 15%Co/Al2O3 catalysts and 1% Cd, 1% In and 1%Sn promoted cobalt catalysts were prepared by the slurry phase impregnation (SPI) method, as previously described in [3,4,5,6,7,8,16,17,25]. Catalox SBA 150 -Al2O3 was used as the catalyst support. The salts used for the Cd and In were nitrates, while SnCl2 served as the salt for Sn. The additives were incorporated into the catalyst by incipient wetness impregnation (IWI) following the addition of cobalt. The catalysts were calcined in air for 4 h at 350 °C.

3.2. BET Surface Area and Porosity Measurements

A Micromeritics 3-Flex system was used to measure BET surface area and porosity characteristics. Before testing, the temperature was slowly increased to 160 °C; then, a vacuum was pulled for at least 12 h until the sample pressure was approximately 50 mTorr. The BJH method was employed to determine the average pore diameter and pore volume. Additionally, pore size distribution was obtained as a function of pore diameter via the correlation dV/d(log D).

3.3. Temperature Programmed Reduction

Temperature programmed reduction (TPR) was carried out with a Zeton Altamira AMI-200 unit (Pittsburgh, PA, USA) with a flow rate of 30 cm3/min of 10%H2/Ar. The heating rate was 5 °C/min from 50 °C to 1100 °C, with a final 30 min hold.

3.4. Hydrogen Chemisorption/Pulse Reoxidation

Chemisorption with hydrogen was conducted in a Zeton Altamira AMI-200 unit using a thermal conductivity detector (TCD). The mass of the catalyst was ~0.220 g. Each catalyst was reduced at 350 °C for 10 h in 30 cm3/min of 33%H2 in He and the temperature was decreased to 100 °C. Argon was flowed to remove any physisorbed species and the temperature was increased back to 350 °C in argon to desorb the chemisorbed hydrogen. The temperature programmed desorption peaks were integrated and the # of moles of hydrogen evolved was calculated.
After TPD of hydrogen, pulses of pure O2 in He were sent to oxidize the catalyst. The extent of reduction was determined on the assumption that Co0 reoxidized to Co3O4. Uncorrected % dispersion assumes (erroneously) complete reduction while corrected % dispersion includes the extent of reduction:
%Duc = (# of Co0 atoms on surface × 100%)/(total # Co atoms)
%Dc = (# of Co0 atoms on surface × 100%)/[(total # Co atoms)(fraction reduced)]

3.5. NH3 Temperature Programmed Desorption

A microreactor loaded with ca. 200 mg of powder catalyst was employed to analyze the acid sites on the surface of the catalyst by means of NH3-TPD. A total flow rate of 50 sccm was used for NH3 adsorption and desorption with effluent gases being analyzed with a quadrupole mass spectrometer (QMS 200, Pfeiffer Vacuum, Asslar, Germany). The catalysts were first reduced at 350 °C in a flow of 10% H2 in He for 2 h, followed by the gas mixture being replaced with pure He for purging and cooling prior to NH3 adsorption at 40 °C. When the catalyst was saturated with NH3 by flowing 2000 ppm NH3 in N2 (ca. 30 min), the He flow was switched back again for purging at 40 °C in order to remove weakly adsorbed NH3 (ca. 30 min). The temperature-programmed desorption was then carried out in He at 50 cc/min using a ramp rate of 10 °C/min up to 600 °C.

3.6. X-ray Absorption Near Edge Spectroscopy (XANES)

X-ray absorption near edge spectroscopy was carried out using transmission mode in the vicinity of the Cd, In, and Sn K-edges at the National Synchrotron Light Source (NSLS) at Brookhaven National Laboratory, Upton, New York, Beamline X18-b. The beamline utilized a Si (111) channel-cut monochromator. The catalysts were prepared and activated in the same way as if conducting a reaction test except that following treatment in hydrogen, the catalyst was cooled so that it became fixed in the solid startup wax. Samples were made into self-supporting disks. XANES spectra were analyzed using WinXAS software [31] by comparing the spectra qualitatively once normalized.

3.7. X-ray Diffraction (XRD)

X-ray diffraction (XRD) on powder samples was performed for freshly reduced cobalt catalysts at room temperature using a Rigaku Diffractometer (DMAX-B, Tokyo, Japan) operating with Cu Kα radiation (1.54 Å), in order to identify cobalt structure and cluster size. All cobalt catalyst samples were reduced at 350 °C by 25%H2/He for 15 h followed by passivation using 1%O2/N2 gas mixture prior to conducting the XRD measurement.

3.8. Catalytic Activity Testing

Catalyst reaction tests were carried out using a continuously stirred tank reactor (CSTR, PPI, Fort Worth, TX, USA)) that makes use of a mag drive stirrer with turbine impeller, gas-inlet outlet lines with a stainless steel (SS) fritted filter (7 µm) placed outside the reactor. To withdraw wax, a stainless steel tube with a 2 micron fritted filter was placed below the liquid level of the reactor. Mass flow controllers controlled the H2 and CO flow rates. Reactant gases were thoroughly mixed prior to the reactor. CO was scrubbed of iron carbonyls using lead oxide-alumina. Reactants entered the CSTR below the impeller, which had a stirring speed of 750 rpm. Temperature was well controlled by a temperature controller.
The amount of catalyst used was 12–18 g in the size range of 45–90 µm. The catalyst was first reduced ex-situ in a tubular reactor at 350 °C at 1 atm for 15 h using a gas mixture of H2/He (60 NL/h) with a volume ratio of 1:3. Reduced catalyst was transferred by forcing the catalyst out with N2 to the CSTR, which held 315 g of melted Polywax 3000. The reactor was weighed prior to and following catalyst transfer. The transferred catalyst was further exposed to pure hydrogen (30 NL/h) for another 10 h at 230 °C to ensure reduction, prior to commencing FTS.
FTS reaction conditions were 220 °C, 2.2 MPa, H2/CO = 2.1. Space velocity was controlled to achieve a CO conversion of 50%. Reaction products were continuously removed from the reactor head space and sent to two collection vessels, a trap maintained at 100 °C and a trap held at 0 °C. Uncondensed vapor was decreased to atmospheric pressure. Gas flow was measured by a wet test meter and the gas was analyzed using online gas chromatography. Accumulated liquids in the CSTR were removed daily through a 2 micron sintered metal filter. CO conversion was determined on the basis of GC data using a micro-GC equipped with thermal conductivity detectors. Wax, oil and the water phase products were also collected and analyzed by three different gas chromatographs. To investigate the effect of Group 12–14 elements, Cd, In and Sn were selected from Row 5 based on our earlier success with Ag as an additive. The activity and product selectivities (e.g., CH4, C5+, CO2, 1-olefin, 2-olefin and paraffin) of unpromoted 15%Co/Al2O3 catalysts and 1% of Cd-, In, and Sn- supported cobalt catalysts were studied at a reference CO conversion of about 40–50%.

4. Conclusions

TPR and hydrogen chemisorption/pulse reoxidation results showed that only a fraction of Cd, In and Sn was reduced. NH3-TPD results indicated that addition of Cd, In and Sn promoted mild to strong acid sites, which might be responsible for the enhancement of hydrogenation of 1-olefin during the FTS. Cd and In were found to promote CoO reduction to Co0, while Sn slightly hindered it, resulting in more unreduced cobalt than the other two additives. The XANES results showed oxidized states for the Cd, In and Sn additives after the catalysts were activated at 350 °C by H2. The TPR, XANES and reaction results suggest that M-M, MxOy and M-Co coordination (M refers Cd, In and Sn) may be present in the catalysts. XRD results showed only a slight decrease in cobalt cluster size with addition of 1% of Cd, In or Sn.
The FTS reaction was carried out on all research catalysts at 220 °C, 2.2 MPa, H2/CO = 2.1 and 25–50% CO conversion using a 1-L CSTR for about 200 h. Space velocity was adjusted if needed during testing. Addition of 1% the additives resulted in 3 to 10 fold activity losses relative to the unpromoted cobalt in comparison to the expected activity losses in terms of the decreases in cobalt sites as determined by H2 chemisorption capacities. The significant catalyst activity losses were explained based on the additives covering and poisoning cobalt and possible electronic effects resulting from the interaction of the additives.
Addition of Cd, In or Sn greatly modified the selectivity of the cobalt catalyst. All the additives remarkably promoted the formation of methane, light hydrocarbons and CO2, and suppressed heavier hydrocarbon formation. However, addition of Cd, In and Sn greatly improved secondary reactions of 1-olefins. The extent of the improvement increased with increasing atomic number (Cd < In < Sn). The selectivity changes are linked with acid sites on the cobalt catalysts, which were found to be promoted by the additives, while a fraction of reduced additives in the metallic phase might improve the rate of hydrogenation during FTS. It is concluded that mild to strong acid sites on the cobalt catalysts (i.e., In-Co and Sn-Co) enhanced H2 adsorption to a greater extent and promoted methane and light hydrocarbon selectivities, while mild acid sites on the cobalt catalysts (i.e., Sn-Co), enhanced the isomerization reaction of 1-olefins to a greater extent relative to other types of acid sites on the cobalt catalyst.

Author Contributions

Conceptualization, W.M., G.J., B.H.D., writing—original draft preparation, W.M., G.J., writing—review and editing, J.L.S.K., B.H.D., investigation, W.M., G.J., W.D.S., Y.J., S.D.H., resources, J.L.S.K., B.H.D, S.K., supervision, G.J., J.L.S.K., B.H.D., project administration, J.L.S.K., B.H.D., funding acquisition, G.J., B.H.D., formal analysis, W.M., G.J., W.D.S., Y.J., S.D.H., S.K., data curation, W.D.S., S.K., visualization, G.J., B.H.D., validation, W.M., W.D.S., Y.J., S.D.H., reaction testing, W.M., catalyst preparation, G.J., catalyst characterization, G.J., Y.J., S.D.H., product analysis, W.D.S., synchrotron beamline operation, S.K.

Funding

This research was funded by NASA (grant number NNX11A175A) and the Commonwealth of Kentucky. The APC was funded by UK-CAER.

Acknowledgments

This paper is dedicated to the late Professor Burtron H. Davis.

Conflicts of Interest

The authors declare no conflict of interest.

References

  1. Espinoza, R.L.; van Berge, P.J.; Bolder, F.H. Catalysts. U.S Patent 5,733,839, 31 March 1998. [Google Scholar]
  2. van Berge, P.J.; Barradas, S.; van de Loosdrecht, J.; Visagie, J.L. Advances in the cobalt catalyzed Fischer-Tropsch synthesis. Erdoel Erdgas Kohle 2001, 117, 138–142. [Google Scholar]
  3. Jacobs, G.; Das, T.K.; Zhang, Y.; Li, J.; Racoillet, G.; Davis, B.H. Fischer-Tropsch synthesis: Support, loading and promoter effects on the reducibility of cobalt catalysts. Appl. Catal. A Gen. 2002, 233, 263–281. [Google Scholar] [CrossRef]
  4. Jacobs, G.; Ji, Y.; Davis, B.H.; Cronauer, D.C.; Kropf, A.J.; Marshall, C.L. Fischer-Tropsch synthesis: Temperature programmed EXAFS/XANES investigation of the influence of support type, cobalt loading, and noble metal promoter addition to the reduction behavior of cobalt oxide particles. Appl. Catal. A Gen. 2007, 333, 177–191. [Google Scholar] [CrossRef]
  5. Jacobs, G.; Ribeiro, M.C.; Ma, W.; Ji, Y.; Khalid, S.; Sumodjo, P.T.A.; Davis, B.H. Group 11 (Cu, Ag, Au) promotion of 15%Co/Al2O3 Fischer-Tropsch catalysts. Appl. Catal. A: Gen. 2009, 361, 137–151. [Google Scholar] [CrossRef]
  6. Jacobs, G.; Ma, W.; Davis, B.H. Influence of reduction promoters on stability of cobalt/γ-alumina Fischer-Tropsch synthesis catalysts. Catalysts 2014, 4, 49–76. [Google Scholar] [CrossRef]
  7. Ma, W.; Jacobs, G.; Keogh, R.A.; Bukur, D.B.; Davis, B.H. Fischer-Tropsch synthesis: Effect of Pd, Pt, Re, and Ru noble metal promoters on the activity and selectivity of a 25%Co/Al2O3 catalyst. Appl. Catal. A Gen. 2012, 437–438, 1–9. [Google Scholar] [CrossRef]
  8. Ma, W.; Jacobs, G.; Gao, P.; Jermwongratanachai, T.; Shafer, W.D.; Pendyala, V.R.R.; Chia, H.Y.; Klettlinger, J.L.S.; Davis, B.H. Fischer-Tropsch synthesis: Pore size and Zr promotional effects on the activity and selectivity of 25%Co/Al2O3 catalysts. Appl. Catal. A Gen. 2014, 475, 314–324. [Google Scholar] [CrossRef]
  9. Chonco, Z.H.; Nabaho, D.; Claeys, M.; van Steen, E. The role of reduction promoters in Fischer-Tropsch catalysts for the production of liquid fuels. In Proceedings of the 23rd Meeting of the North American Catalysis Society, Louisville, KY, USA, 2–7 June 2013. [Google Scholar]
  10. Hilmen, A.M.; Schanke, D.; Holmen, A. TPR study of the mechanism of rhenium promotion of alumina-supported cobalt Fischer-Tropsch catalysts. Catal. Lett. 1996, 38, 143–147. [Google Scholar] [CrossRef]
  11. Cook, K.M.; Perez, H.D.; Bartholomew, C.H.; Hecker, W.C. Effect of promoter deposition order on platinum-, ruthenium-, or rhenium-promoted cobalt Fischer-Tropsch catalysts. Appl. Catal. A Gen. 2014, 482, 275–286. [Google Scholar] [CrossRef]
  12. Vada, S.; Hoff, A.; Ådnanes, E.; Schanke, D.; Holmen, A. Fischer-Tropsch synthesis on supported cobalt catalysts promoted by platinum and rhenium. Top. Catal. 1995, 2, 155–162. [Google Scholar] [CrossRef]
  13. Cook, K.M.; Hecker, W.C. Reducibility of alumina-supported cobalt Fischer-Tropsch catalysts: Effects of noble metal type, distribution, retention, chemical state, bonding, and influence on cobalt crystallite size. Appl. Catal. A Gen. 2012, 449, 69–80. [Google Scholar] [CrossRef]
  14. Jacobs, G.; Chaney, J.A.; Patterson, P.M.; Das, T.K.; Maillot, J.C.; Davis, B.H. Fischer-Tropsch synthesis: Study of the promotion of Pt on the reduction property of Co/Al2O3 catalysts by in situ EXAFS of Co K and Pt LIII edges and XPS. J. Synchrotron Radiat. 2004, 11, 414–422. [Google Scholar] [CrossRef]
  15. Ma, W.; Ding, Y.J.; Lin, L.W. Fischer-Tropsch Synthesis over Activated-Carbon-Supported Cobalt Catalysts: Effect of Co Loading and Promoters on Catalyst Performance. Ind. Eng. Chem. Res. 2004, 43, 2391–2398. [Google Scholar] [CrossRef]
  16. Jacobs, G.; Ma, W.; Gao, P.; Todic, B.; Bhatelia, T.; Bukur, D.B.; Khalid, S.; Davis, B.H. Fischer-Tropsch Synthesis: Differences Observed in Local Atomic Structure and Selectivity with Pd Compared to Typical Promoters (Pt, Re, Ru) of Co/Al2O3 Catalysts. Top. Catal. 2012, 55, 811–817. [Google Scholar] [CrossRef]
  17. Jermwongratanachai, T.; Jacobs, G.; Ma, W.; Shafer, W.D.; Gnanamani, M.K.; Gao, P.; Kitiyanan, B.; Davis, B.H.; Klettlinger, J.L.S.; Yen, C.H.; et al. Studies on the regeneration of sulfur-poisoned NOx storage and reduction catalysts, including a Ba composite oxide. Appl. Catal. A Gen. 2013, 464–465, 165–180. [Google Scholar] [CrossRef]
  18. Guerrero-Ruiz, A.; Sepulveda-Escribano, A.; Rodriguez-Ramos, I. Carbon monoxide hydrogenation over carbon supported cobalt or ruthenium catalysts. Promoting effects of magnesium, vanadium and cerium oxides. Appl. Catal. A Gen. 1994, 120, 71–83. [Google Scholar] [CrossRef]
  19. Zhang, Y.; Xiong, H.; Liew, K.Y.; Li, J. Effect of magnesia on alumina-supported cobalt Fischer-Tropsch synthesis catalysts. J. Mol. Catal. 2005, 237, 172–181. [Google Scholar] [CrossRef]
  20. Kikuchi, E.; Sorita, R.; Takahashi, H.; Matsuda, T. Catalytic performances of cobalt-based ultrafine particles prepared by chemical reduction in slurry-phase Fischer-Tropsch synthesis. Appl. Catal. A Gen. 1999, 186, 121–128. [Google Scholar] [CrossRef]
  21. Van der Riet, M.; Hutchings, G.J.; Copperthwaite, R.G. Selective formation of C3 hydrocarbons from carbon monoxide and hydrogen using cobalt-manganese oxide catalysts. J. Chem. Soc. Chem. Commun. 1986, 10, 798–799. [Google Scholar] [CrossRef]
  22. Mendes, F.M.T.; Perez, C.A.C.; Noronha, F.B.; Schmal, M. TPSR of CO hydrogenation on Co/Nb2O5/Al2O3 catalysts. Catal. Today 2005, 101, 45–50. [Google Scholar] [CrossRef]
  23. Gnanamani, M.K.; Jacobs, G.; Graham, U.M.; Pendyala, V.R.R.; Martinelli, M.; MacLennan, A.; Hu, Y.; Davis, B.H. Effect of sequence of P and Co addition over silica for Fischer-Tropsch synthesis. Appl. Catal. A Gen. 2017, 538, 190–198. [Google Scholar] [CrossRef]
  24. Huffman, G.P.; Shah, N.; Zhao, J.M.; Huggins, F.E.; Hoost, T.E.; Halvorsen, S.; Goodwin, J.G. In situ XAFS investigation of K-promoted Co catalysts. J. Catal. 1995, 151, 17–25. [Google Scholar] [CrossRef]
  25. Ma, W.; Jacobs, G.; Keogh, R.A.; Yen, C.H.; Klettlinger, J.L.S.; Davis, B.H. Fischer-Tropsch synthesis: Effect of Pt promoter on activity, selectivities to hydrocarbons and oxygenates, and kinetic parameters over 15%Co/Al2O3. In Synthetic Liquids Production and Refining; Klerk, A.D., King, D.L., Eds.; American Chemical Society: Washington, DC, USA, 2011; pp. 127–153. [Google Scholar]
  26. Cho, H.J.; Dornath, P.; Fan, W. Synthesis of Hierarchical Sn-MFI as Lewis Acid Catalysts for Isomerization of Cellulosic Sugars. ACS Catal. 2014, 4, 2029–2037. [Google Scholar] [CrossRef]
  27. Srinivasan, R.; Rice, L.A.; Davis, B.H. Electron microdiffraction study of platinum-tin-alumina reforming catalysts. J. Catal. 1991, 129, 257–268. [Google Scholar] [CrossRef]
  28. Passos, F.B.; Aranda, D.A.G.; Schmal, M. Characterization and catalytic activity of bimetallic Pt-In/Al2O3 and Pt-Sn/Al2O3 catalysts. J. Catal. 1998, 178, 478–488. [Google Scholar] [CrossRef]
  29. Coleto, I.; Roldan, R.; Jimenez-Sanchidrian, C.; Gomez, J.P.; Romero-Salguero, F.J. Transformation of α-olefins over Pt-M (M = Re, Sn, Ge) supported chlorinated alumina catalysts. Fuel 2007, 86, 1000–1007. [Google Scholar] [CrossRef]
  30. Mazzieri, V.A.; Grau, J.M.; Vera, C.R.; Yori, J.C.; Parera, J.M.; Pieck, C.L. Role of Sn in Pt-Re-Sn/Al2O3-Cl catalysts for naphtha reforming. Catal. Today 2005, 107–108, 643–650. [Google Scholar] [CrossRef]
  31. Ressler, T. WinXAS: A program for X-ray absorption spectroscopy data analysis under MS-Windows. J. Synchrotron Radiat. 1998, 5, 118–122. [Google Scholar] [CrossRef]
Figure 1. TPR profiles of, moving upward, 15%Co/Al2O3, 1%Cd-15%Co/Al2O3, 1%In-15%Co/Al2O3, and 1%Sn-15%Co/Al2O3. Catalysts prepared by SPI using 150 m2/g γ-Al2O3.
Catalysts 09 00862 g001
Figure 2. NH3–TPD profile of unpromoted and Cd, In and Sn promoted 15%Co/Al2O3 catalysts.
Catalysts 09 00862 g002
Figure 3. XRD patterns unpromoted and Cd, In and Sn promoted 15%Co/Al2O3 catalysts.
Catalysts 09 00862 g003
Figure 4. XANES spectra of 1%Cd-25%Co/Al2O3 (left), 1%In-25%Co/Al2O3 (middle) and 1%Sn-25%Co/Al2O3 (right) compared to the reference Cd, In and Sn metal foils.
Catalysts 09 00862 g004
Figure 5. Change in (a) CO rate, (b) CH4 selectivity, (c) C5+ selectivity and (d) CO2 olefin selectivity over unpromoted and Cd, In and Sn promoted 15%Co/Al2O3 catalysts. Reaction conditions: 220 °C, 2.2 MPa, H2/CO = 2.1, XCO = 40–50%.
Catalysts 09 00862 g005
Figure 6. Change of (a) C3 olefin selectivity, (b) C3 paraffin selectivity, (c) 1-C4 olefin selectivity, (d) 2-C4 olefin selectivity, (e) total-C4 olefin selectivity and (f) C4 paraffin selectivity with time over npromoted and Cd, In and Sn promoted 15%Co/Al2O3 catalysts. Reaction conditions: 220 °C, 2.2 MPa, H2/CO = 2.1, XCO = 40–50%.
Catalysts 09 00862 g006
Table 1. Results of BET surface area and H2 chemisorption pulse re-oxidation.
Support/CatalystBET SAPore Volume (BJH Adsorp)Average Pore Radius (BJH Adsorp)H2 DesorbedCo Reduction DegreeApparent Corrected Co DisperionApparent Corrected Average Co Diamter
(m2/g)(cm3/g)(nm)(µmol/gcat)(%)(%)(nm)
15% Co/Al2O3-150116.20.30964.7257.348.59.2811.1
1%Cd 15% Co/Al2O3110.40.30244.7552.658.87.1914.3
1%In 15% Co/Al2O3111.60.30534.7345.656.66.3416.3
1%Sn 15% Co/Al2O3115.00.30514.6836.646.26.2313.8
Table 2. Activity and selectivity of unpromoted and Cd, In, Sn and Pt promoted 15%Co/Al2O3 catalysts (a).
TOSCO ConversionGHSVH2/COSelectivity (C atom %)CO2 Selectivity
(hrs)(%)(NL/gcat/h)CH4C2-C4C5+(%)
15%Co/Al2O3-150
11–5748–512.782.107.447.0285.540.47
59–19350–522.442.108.008.6383.370.52
1%Cd-15%Co/Al2O3-150
25–7218–200.502.1010.456.8882.672.17
97–14638–400.262.1011.507.3981.111.59
1%In-15%Co/Al2O3-150
49–9747–520.502.1013.7710.9575.283.28
146–17040–440.502.1014.2510.5975.162.07
1%Sn-15%Co/Al2O3-150
25.327.071.002.1013.059.3177.642.93
33–5247–510.512.2713.469.9876.564.21
74–98370.512.1714.5611.3474.093.83
106–122470.472.1114.0610.9275.013.59
(a) Reaction conditions: 220 °C, 2.2 MPa, and H2/CO = 2.1.
Table 3. Olefins and paraffins contents of unpromoted and Cd, In, Sn and Pt promoted 15%Co/Al2O3 catalysts (a).
TOSCOOlefin Content (%)Total C4 OlefinParaffin Content (%)
(hrs)conv. (%)1-C22-C31-C42-C4Content (%)C2C3C4
15%Co/Al2O3-150
11–5748–517.4360.6748.093.4751.5692.5739.3348.44
59–19350–527.3860.2446.963.8350.7992.6239.7649.21
1%Cd-15%Co/Al2O3-150
25–7218–2027.8962.7257.250.0057.2572.1137.2842.75
97–14638–4013.1858.5945.435.1950.6286.8241.4149.38
1%In-15%Co/Al2O3-150
49–9747–525.5253.8740.065.5145.5794.4846.1354.43
146–17040–446.7956.6844.422.7847.2093.2143.3252.80
1%Sn-15%Co/Al2O3-150
25.327.0710.6151.2330.9010.6941.5989.3948.7758.41
33–5247–519.3046.0725.5710.5836.1590.7053.9363.85
74–98378.3747.7828.789.0337.8191.6352.2262.19
106–122477.3047.5930.108.5338.6392.7052.4161.37
Reaction conditions: 220 °C, 2.2 MPa, and H2/CO = 2.1. C4 olefin selectivity, % = 100 × rates of all C4 olefins/rates of all C4 hydrocarbons; 1-C4 olefin selectivity, % = 100 × rate of 1-C4 olefin/rates of all C4 hydrocarbons; 2-C4 olefin selectivity, % = 100 × rate of 2-C4 olefin/rates of all C4 hydrocarbons.

