Article

Active Component Migration and Catalytic Properties of Nitrogen Modified Composite Catalytic Materials

1
Institute of Power Source and Eco-Materials Science, Hebei University of Technology, Tianjin 300130, China
2
Key Laboratory of Special Functional Materials for Ecological Environment and Information, Hebei University of Technology, Ministry of Education, Tianjin 300130, China
*
Author to whom correspondence should be addressed.
Catalysts 2018, 8(4), 125; https://doi.org/10.3390/catal8040125
Submission received: 2 February 2018 / Revised: 7 March 2018 / Accepted: 16 March 2018 / Published: 21 March 2018
(This article belongs to the Special Issue Catalytic Oxidation of Methane)

Abstract

:
During the catalytic combustion reaction of methane, the migration of the active species on surface facilitates the catalytic reaction, and the element doping can improve the redox performance of the catalyst. Nitrogen-modified perovskite type composite catalysts were prepared by hydrothermal method and then characterized by X-ray diffractometer (XRD), scanning electron microscopy (SEM), Brunauer-Emmett-Teller (BET), temperature-programmed reductions (TPR), and X-ray photoelectron spectra (XPS). The results revealed that nitrogen sources (urea, biuret, melamine, carbohydrazide, and semicarbazide hydrochloride) and nitrogen source addition changed the catalytic performance in physical and chemical properties, the migration of reactive species and the catalytic performance. When the addition amount of semicarbazide hydrochloride was three times that of LaCoO3, the composite catalysts had high Co3+/Co2+ (1.39) and Oads/Olat (15.18) and showed the best catalytic performance: the temperatures that are required for achieving methane conversion of 50% and 90% were 277 and 360 °C, which are more effective than noble metal oxides. Moreover, the in situ diffuse reflectance infrared fourier transform spectroscopy (DRIFTS) were applied to elucidate the efficient for CH4 removal and also can further explain the surface reaction mechanism of the composite catalyst during the methane catalytic combustion.

Graphical Abstract

1. Introduction

Catalytic methane (CH4) oxidation is an attractive reaction from both scientific research and practical application as it is not only a model reaction for evaluating catalytic performance, but also an effective technology for removing CH4 from devices. From the viewpoint of catalysis, the core problem is searching for catalysts that are efficient for the reaction.
Chen et al. reported recent achievement in the heterogeneous catalysts for methane combustion. The review investigated noble metal-based catalysts and metal oxide catalysts, including single metal oxides, perovskites, spinels, and hexaaluminates. Moreover, Kinetic aspects, mechanisms, and the latest studies concerning density functional theory modelling are also discussed in the review [1]. Noble metals are active for CH4 oxidation, but are rare and expensive [2,3,4,5,6]. Perovskite oxides are potential alternatives of noble metals in applications as CH4, due to their high thermal and structural stability, which enables a stable activity. For the perovskite catalyst, conditions have great influence on methane combustion. Benedetto et al. investigated the role of operating pressure on methane conversion and the effect of pressure on the catalytic combustion of methane on a perovskite-based monolith, both through experiment and numerical [7,8]. Parting from the test conditions, active components and structure of the materials also play outstanding effect of methane combustion. Arandiyan et al. compared La0.7Ce0.3CoO3 and three-dimensionally highly ordered macroporous multifunctional (3DOM-m) La0.7Ce0.3CoO3, and concluded that 3DOM-m La0.7Ce0.3CoO3 catalyst exhibited high catalytic activity for methane combustion due to its larger surface area, better low-temperature reducibility, higher oxygen adsorption species concentration, higher surface-to-volume ratio, and unique nanovoid 3DOM-m structure [9].
Perovskite oxides as oxygen reduction reaction catalysts perform the strong lattice oxygen mobility, oxygen, and active cobalt element migration in its structure, all of which lead to attractive catalytic properties [10,11,12]. Huang et al. prepared the La0.75Sr0.25MnO3 nanofiber and reported that a great abundance of Mn4+ ions was beneficial for the generation of more oxygen vacancies [13]. During the oxidation process, the presence of surface oxygen vacancies serving as active sites improved the dissociative adsorption of oxygen atoms and increased the oxygen exchange rate. All of these were favor the interaction with CO or CH4 molecules. Ritzmann et al. uncover the fundamental details that govern oxygen diffusivity in LaCoO3, confirming that the spin state of the Co3+ ions critically influences oxygen transport in LaCoO3 [14]. Therefore, it can increase the surface oxygen content of perovskite type catalysts obtaining a high specific surface area to enhanced catalytic activity [15]. Arandiyan et al. synthesized high-surface-area yAg/3DOM La0.6Sr0.4MnO3 catalysts by the dimethoxytetraethylene giycol (DMOTEG)-assisted gas-bubbling reduction method. The 3.63 wt % Ag/3DOM La0.6Sr0.4MnO3 catalyst showed better catalytic activity for methane combustion attributing to its larger surface area, higher oxygen adspecies concentration, and unique nanovoid 3DOM structure [16].
In addition, the structural defects or electronic defects can also be induced by the addition of non-metallic elements in the oxide sites or in the lattice gap [17]. For example, the nitrogen addition of perovskite type oxides can make the N3+ into the crystal structure, which caused the formation of oxygen defects (oxygen vacancies) for the loss of O2−, or promoting the increased of catalyst surface high valence metal ion content. Hua et al. prepared the nitrogen doped La2Ti2O7 catalyst by sintering in high temperature of ammonia (NH3), and the study revealed that the N3+ doped into the La2Ti2O7 crystal structure increased the content of Ti4+ valence, and the adsorption of OH on the surface of the catalyst [18].
In the process of methane oxidation, surface oxygen vacancies can promote the adsorption of free oxygen atoms as reactive sites, and increase the exchange rate of oxygen. The surface oxygen species with higher activity at a low temperature can promote the reaction of methane or methyl group. A high proportion of surface oxygen species is very advantageous to methane catalytic combustion.
It is noteworthy that graphene oxide (GO) has a very large specific surface area and rich oxygen groups. The oxygen groups can form chemical bonds with polar molecules to facilitate composites with other metal oxides to prepare composite materials with different properties [19,20]. Studies have shown that GO as catalytic carrier can inhibit the agglomeration of materials, increase the specific surface area, and participate in the catalytic reaction as an oxidant [21,22]. Zahed et al. reported the role of thiolated graphene support on (AgNPs/GOSH) catalyst. Thiolated graphene oxide provides a uniform distribution and stabilization of AgNPs, and prevents aggregation and leaching of the immobilized AgNPs [23]. Wang et al. reporeted that the La1−xSrxMnO3 particles grew dispersedly on GO layer, and GO can enhance the adsorption of oxygen groups on the surface of the catalysts. The light-off temperature dropped 70 °C compare to non-GO coated samples [21].
In this work, we evaluated the effects of nitrogen sources and nitrogen source addition perovskite type composite catalysts in physical and chemical properties, the migration of reactive species, and the catalytic performance. Catalytic tests show that semicarbazide hydrochloride is the best nitrogen source with high catalytic performance. Moreover, the in situ DRIFTS were applied to elucidate the efficient for CH4 removal and the results can further explain the surface reaction mechanism of the composite catalysts during the methane catalytic combustion. The stable activity of composite catalysts for CH4 oxidation suggests that nitrogen modified composite catalysts materials is a feasible strategy to design industrial catalyst for low-temperature CH4 oxidation, thus avoiding the use of noble metals.

2. Results and Discussion

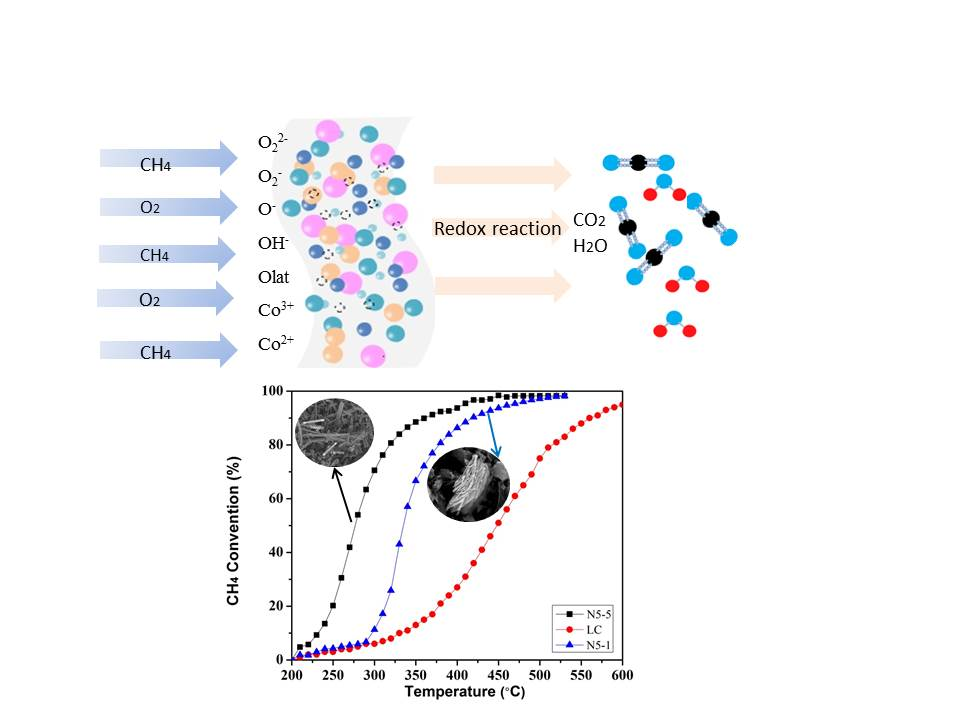
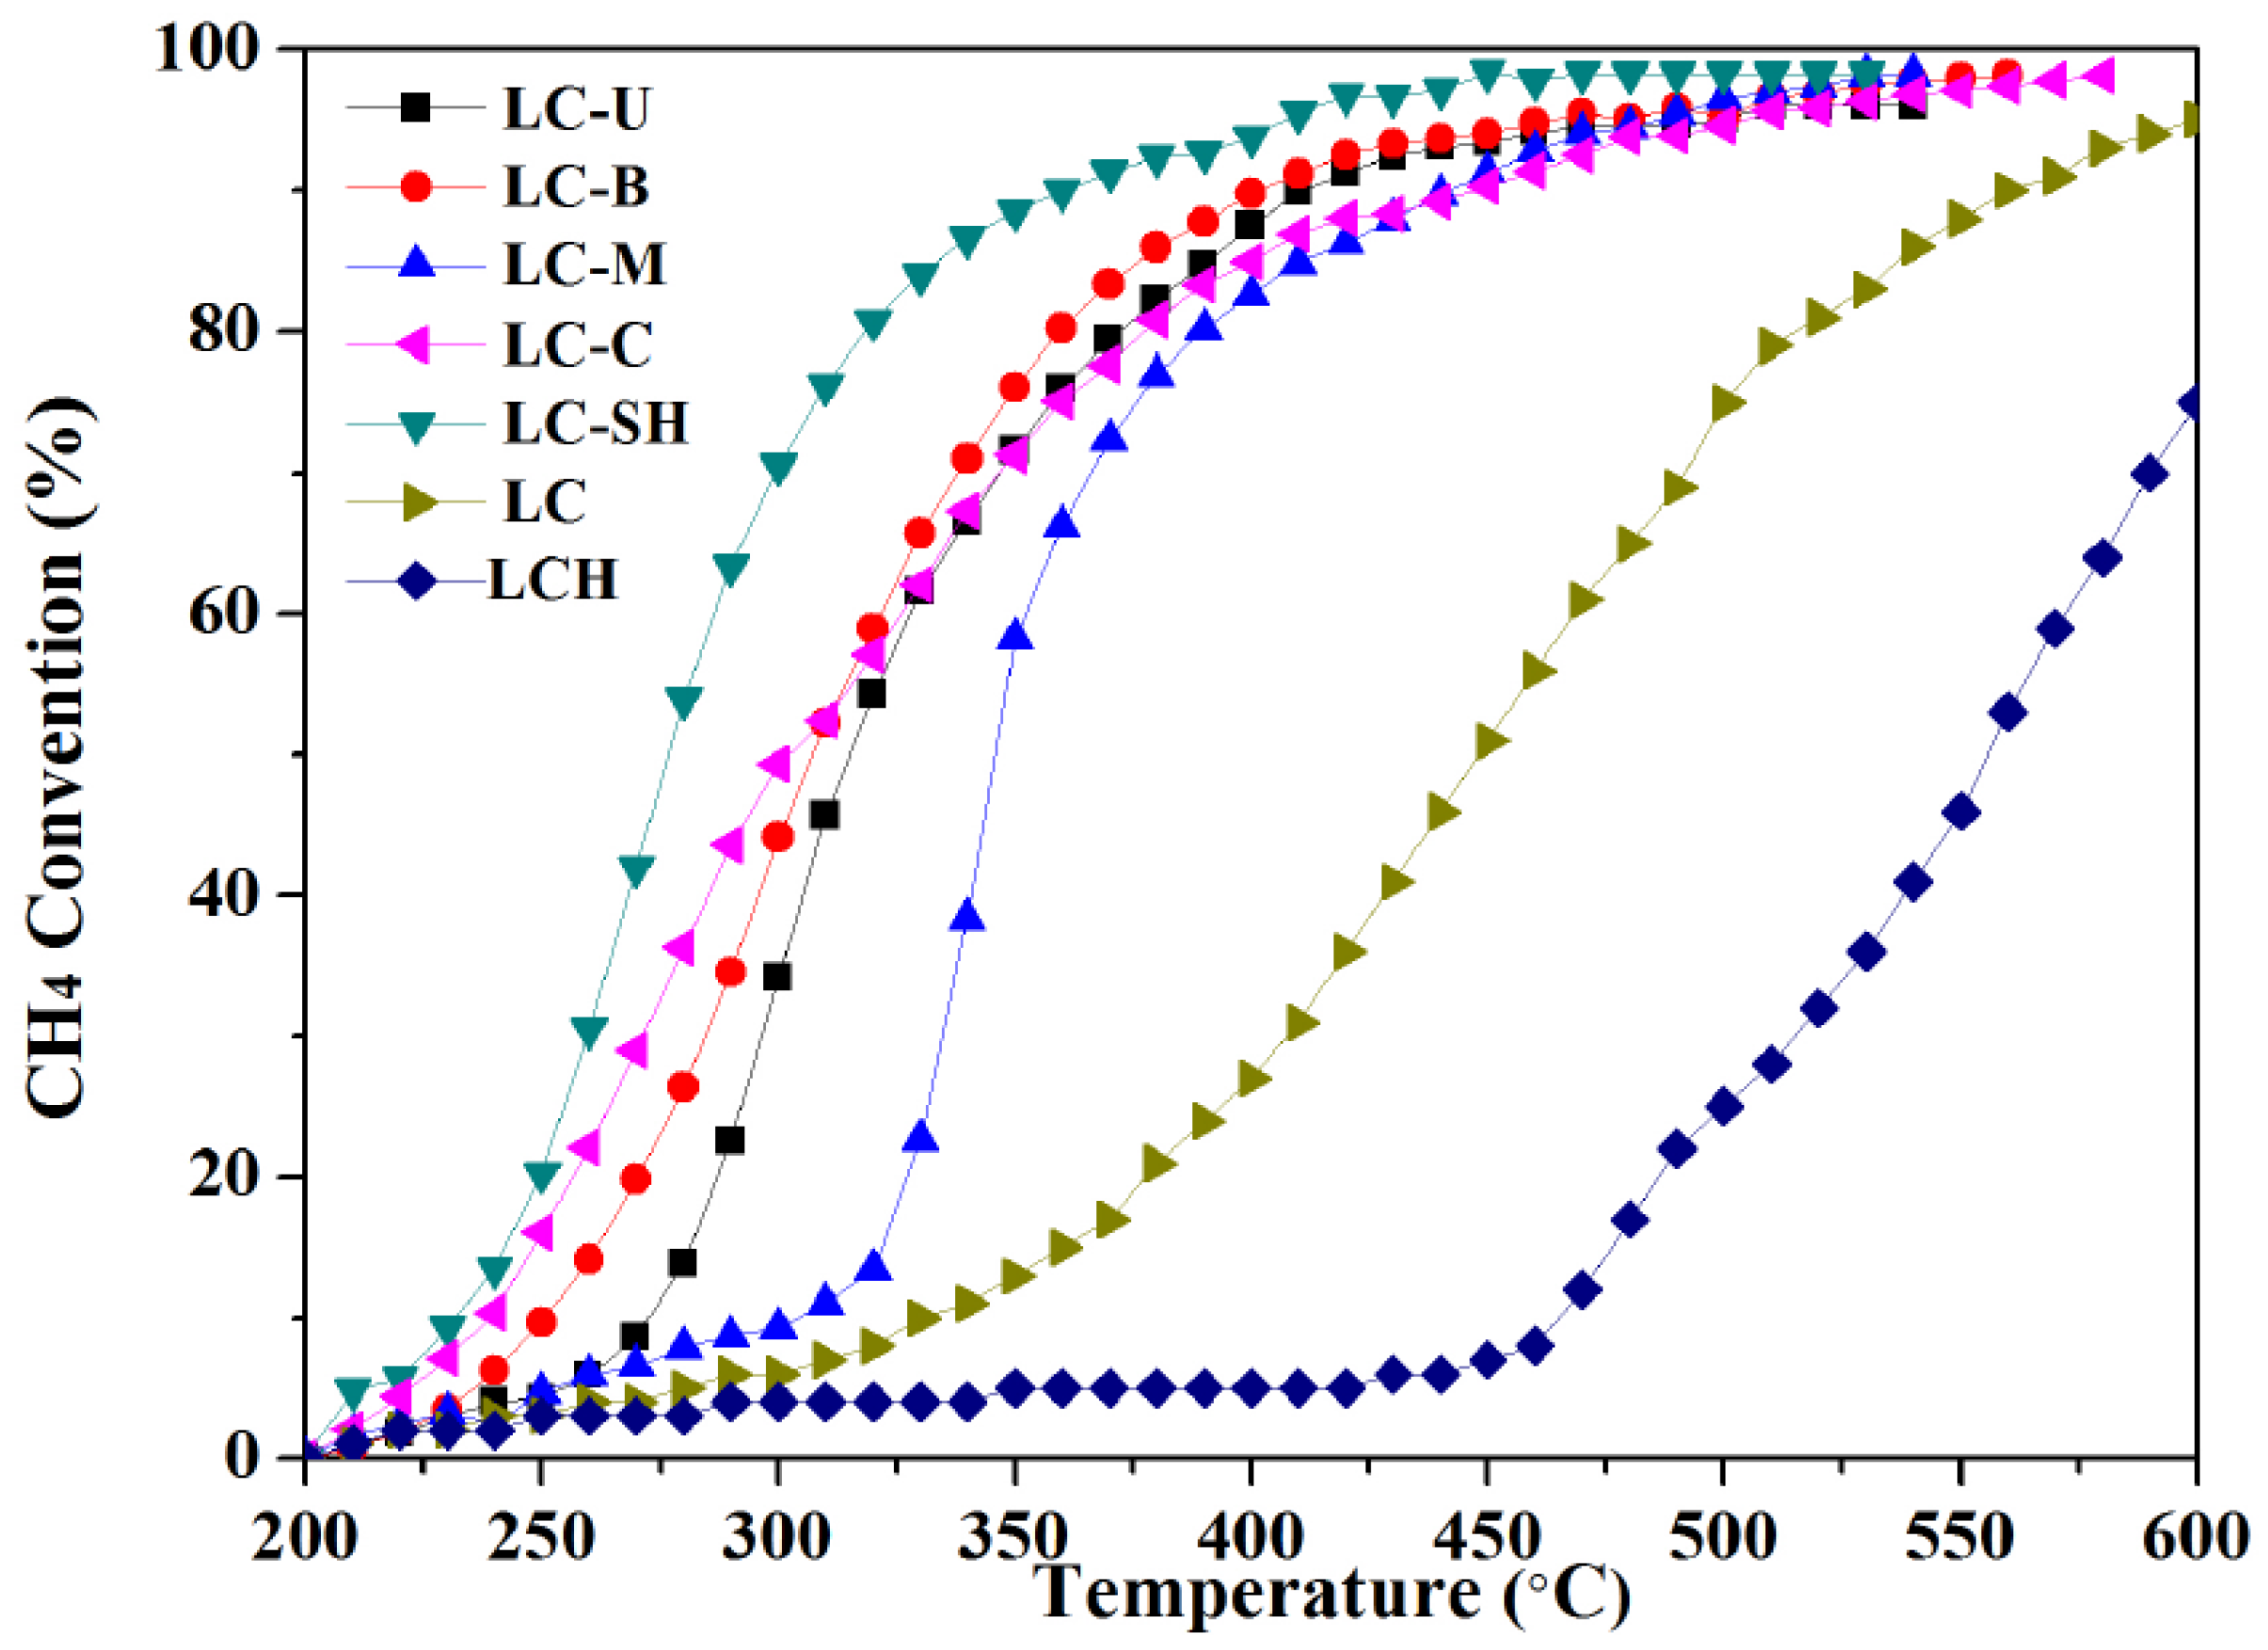
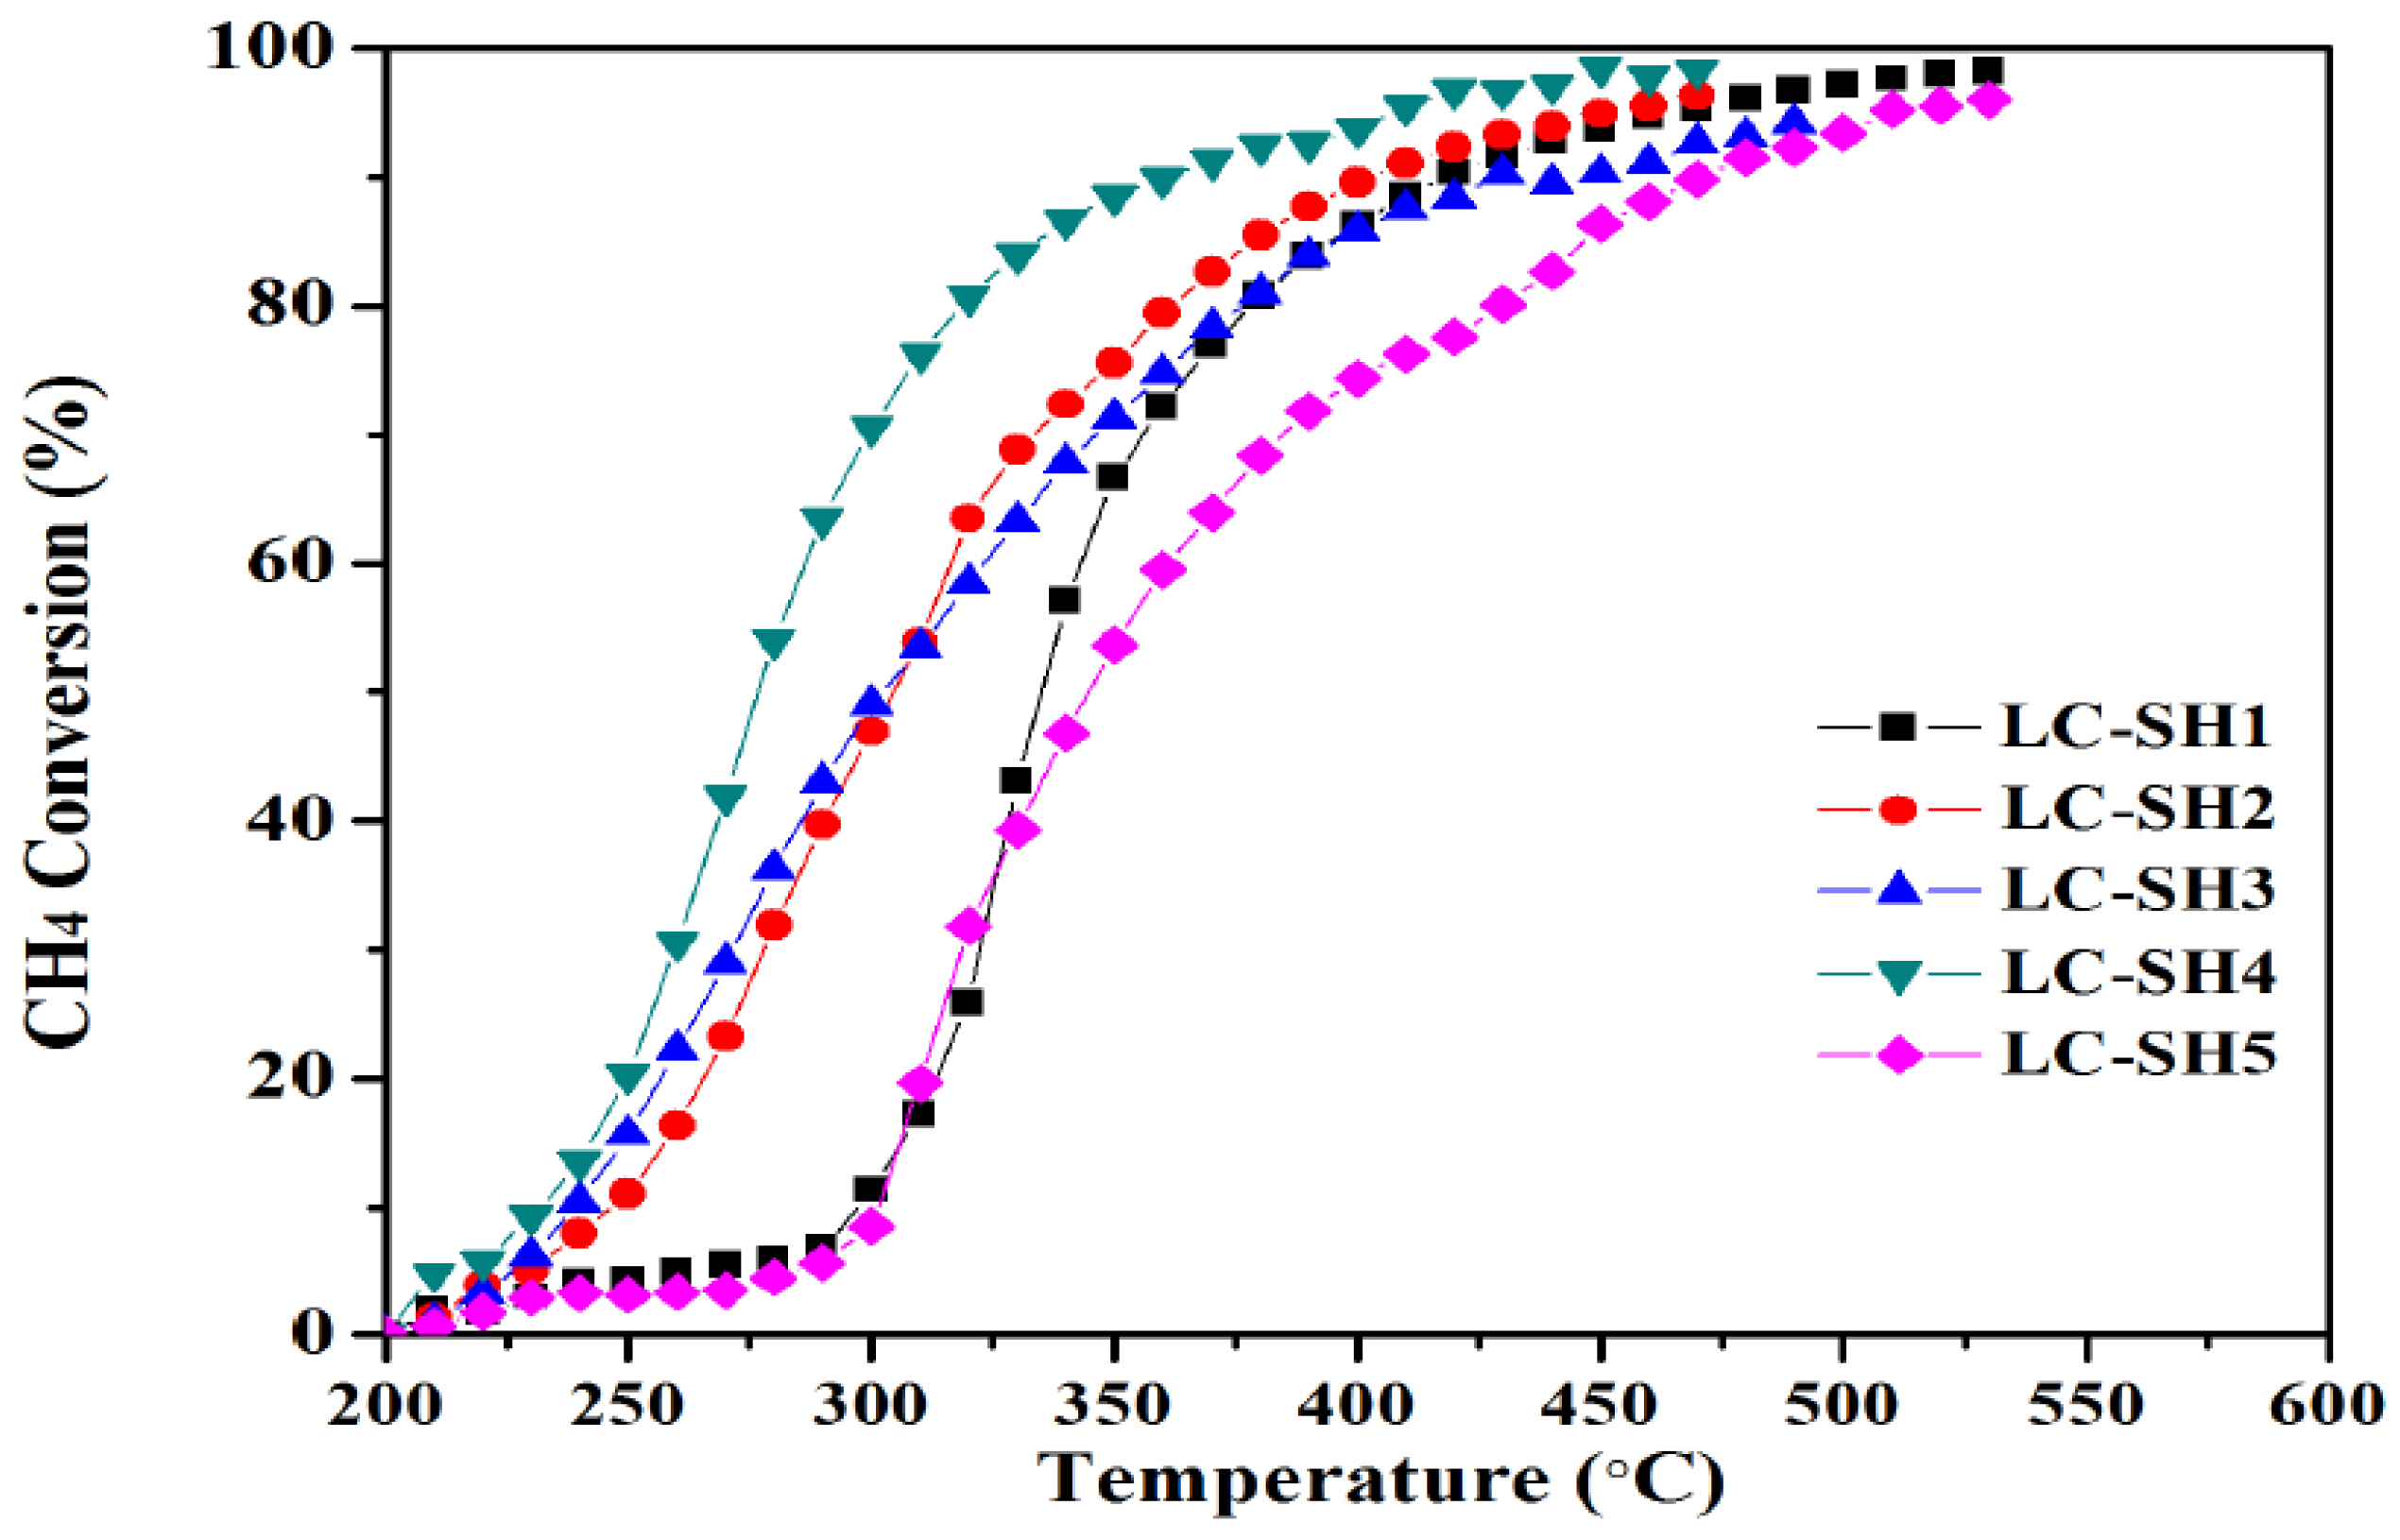
2.1. Catalytic Performance

Catalytic activity data for methane combustion are shown in Figure 1. By expressing the activity through the light-off temperature (T50), at which 50% of methane conversion is reached, and the complete transform temperature (T90), at which 90% of methane conversion is reached, nitrogen modified composite catalysts have lower T50 and T90 than single LaCoO3 (LC) or LaCo3OH (LCH). Nitrogen-modified perovskite type composite catalysts with urea, biuret, melamine, carbohydrazide, and semicarbazide hydrochloride were named as LC-U, LC-B, LC-M, LC-C, and LC-SH, respectively. The T50 of LC-U, LC-B, LC-M, LC-C and LC-SH are 315, 307, 345, 302 and 277 °C, each dropped 133, 141, 103, 146 and 171 °C in contrast to that of LC (448 °C). The T90 of LC-U, LC-B, LC-M, LC-C and LC-SH are 411, 401, 441, 447 and 360 °C, each dropped 149, 159, 119, 113 and 200 °C, in contrast to that of LC (560 °C), respectively. The catalytic activity of nitrogen modified composite catalyst was obviously better than that of untreated LC and LCH.
Figure 2 shows the methane conversion curves of the different nitrogen sources .Catalysts with different nitrogen source addition (0.75, 1.5, 2.25, 3, and 3.75 times) of LC were named as LC-SH1, LC-SH2, LC-SH3, LC-SH4, and LC-SH5, respectively. The T50 of LC-SH1, LC-SH2, LC-SH3, LC-SH4 and LC-SH5 are 335, 305, 302, 277 and 350 °C, The T90 of LC-SH1, LC-SH2, LC-SH3, LC-SH4 and LC-SH5 are 418, 402, 428, 360 and 470 °C. When the amount of nitrogen added is three times of LC, the catalyst has the best catalytic activity.

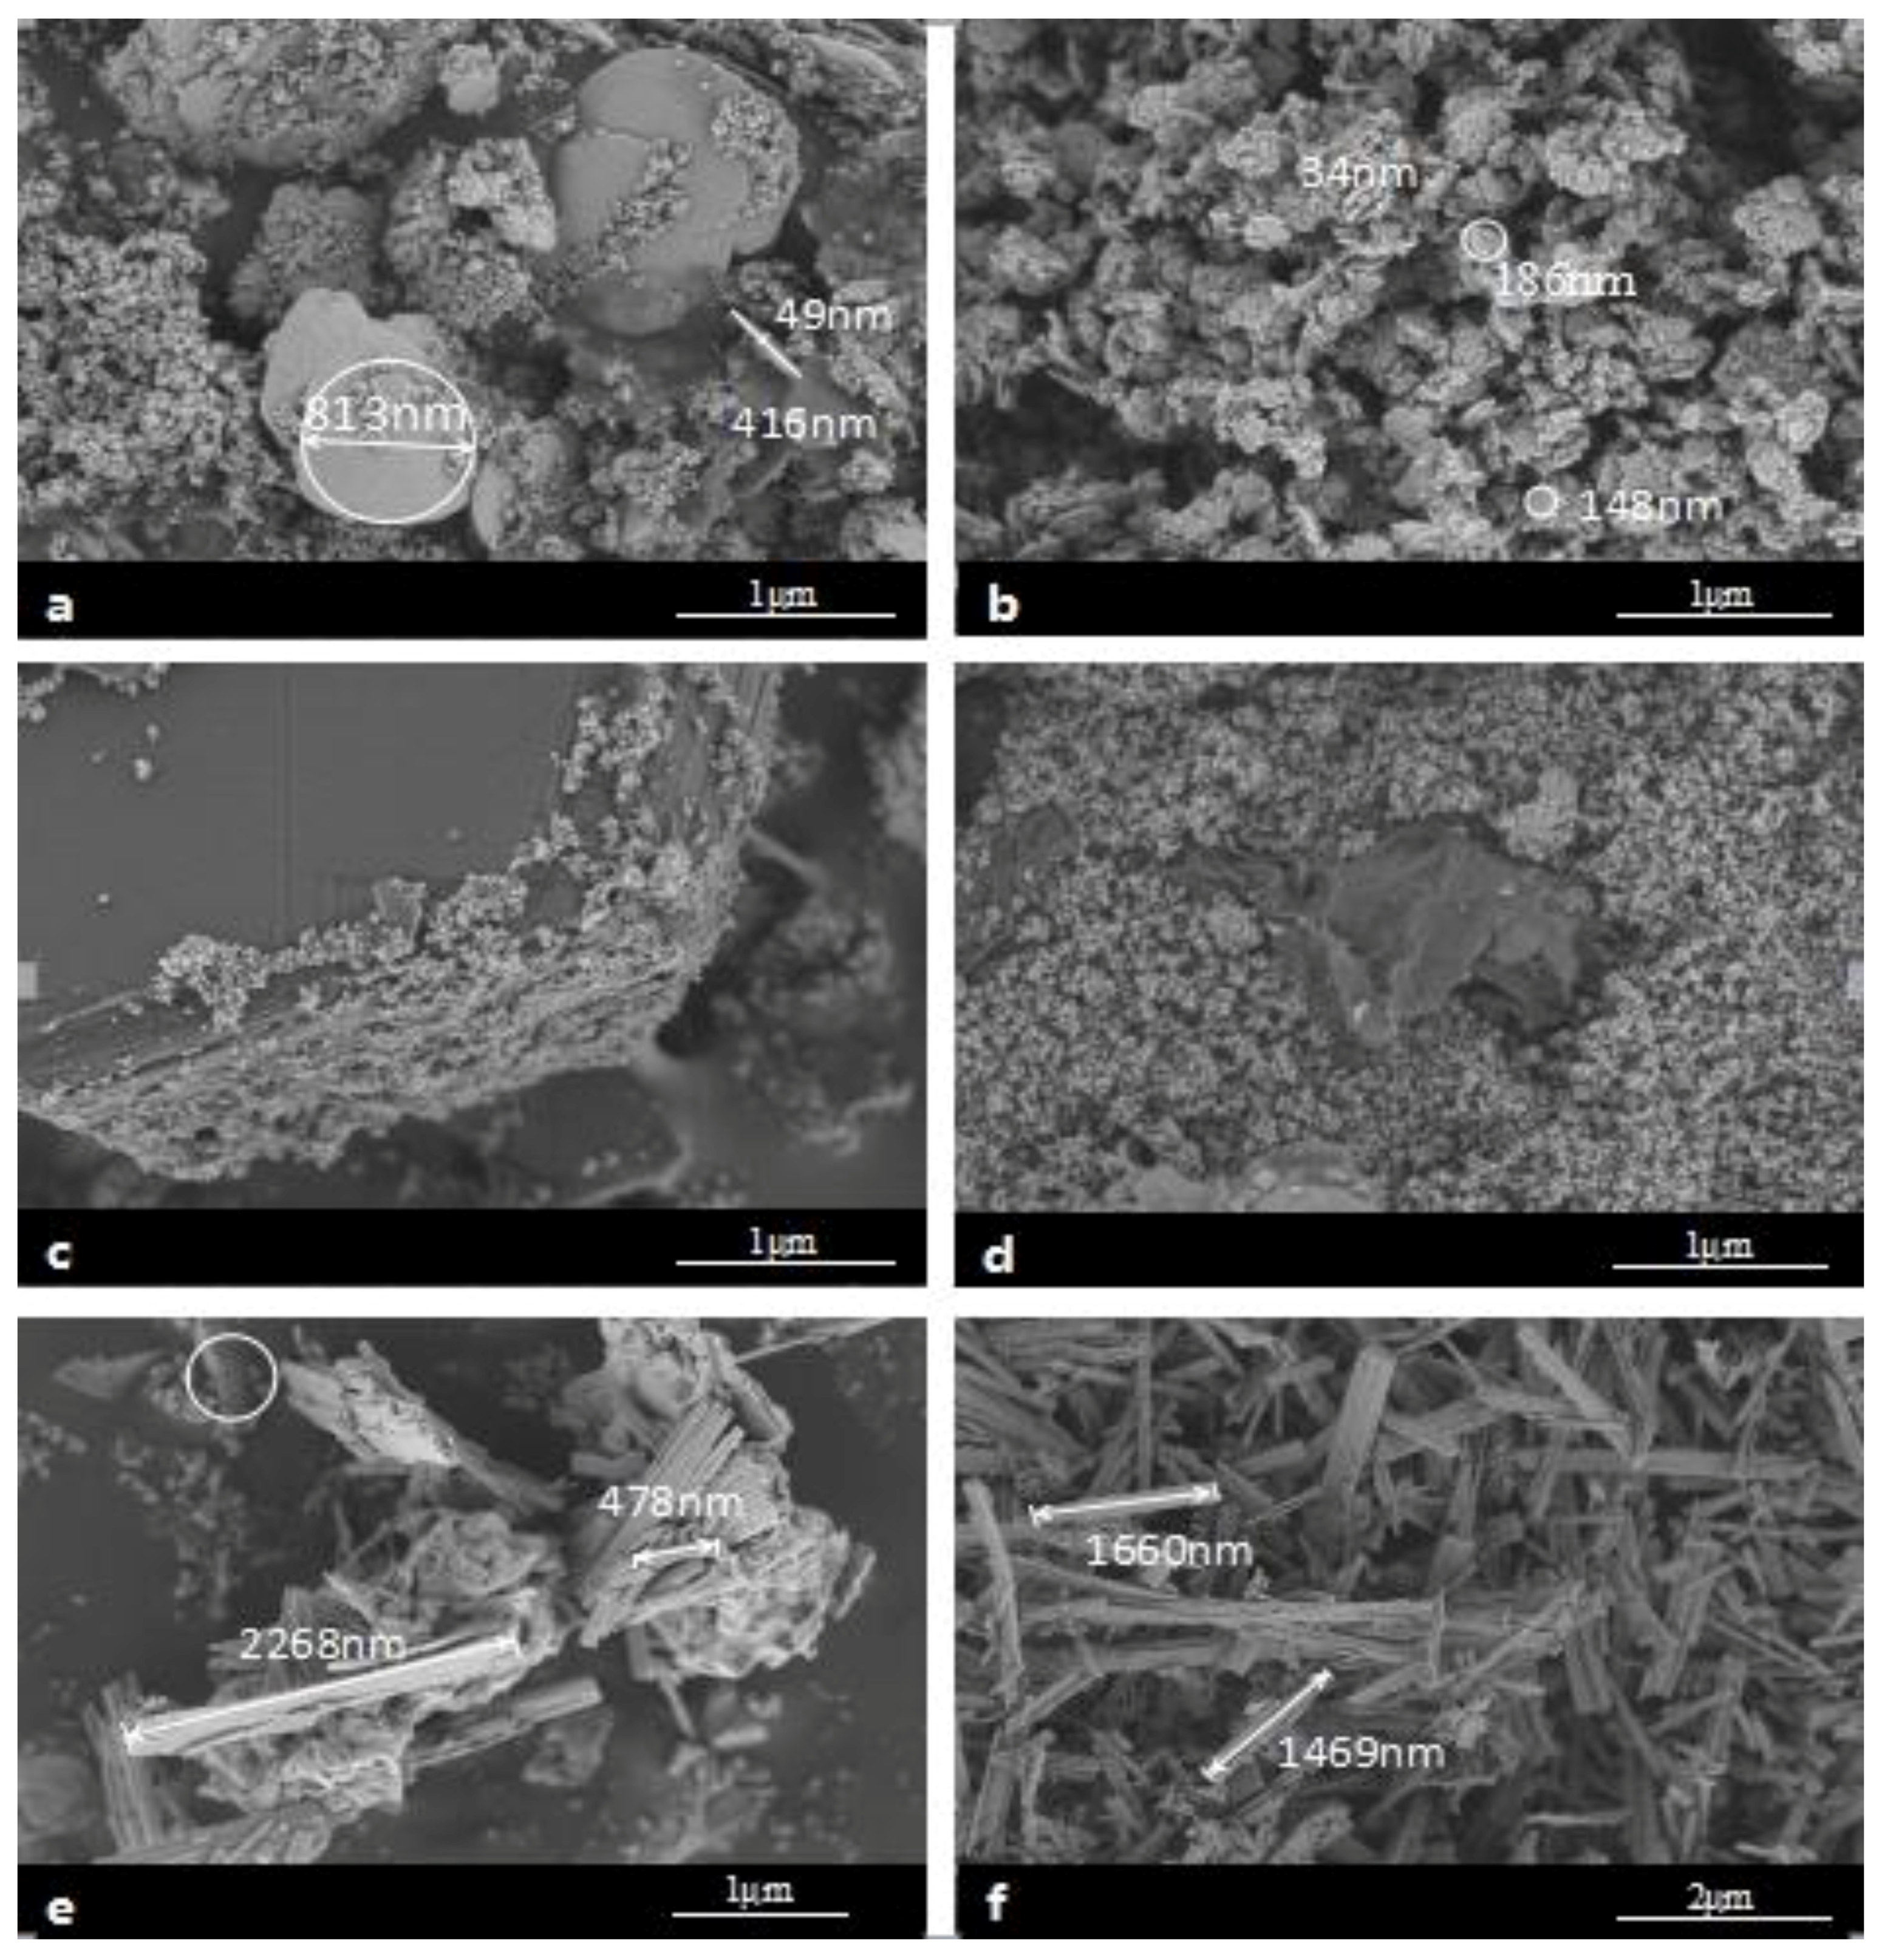
2.2. Physical Characterization

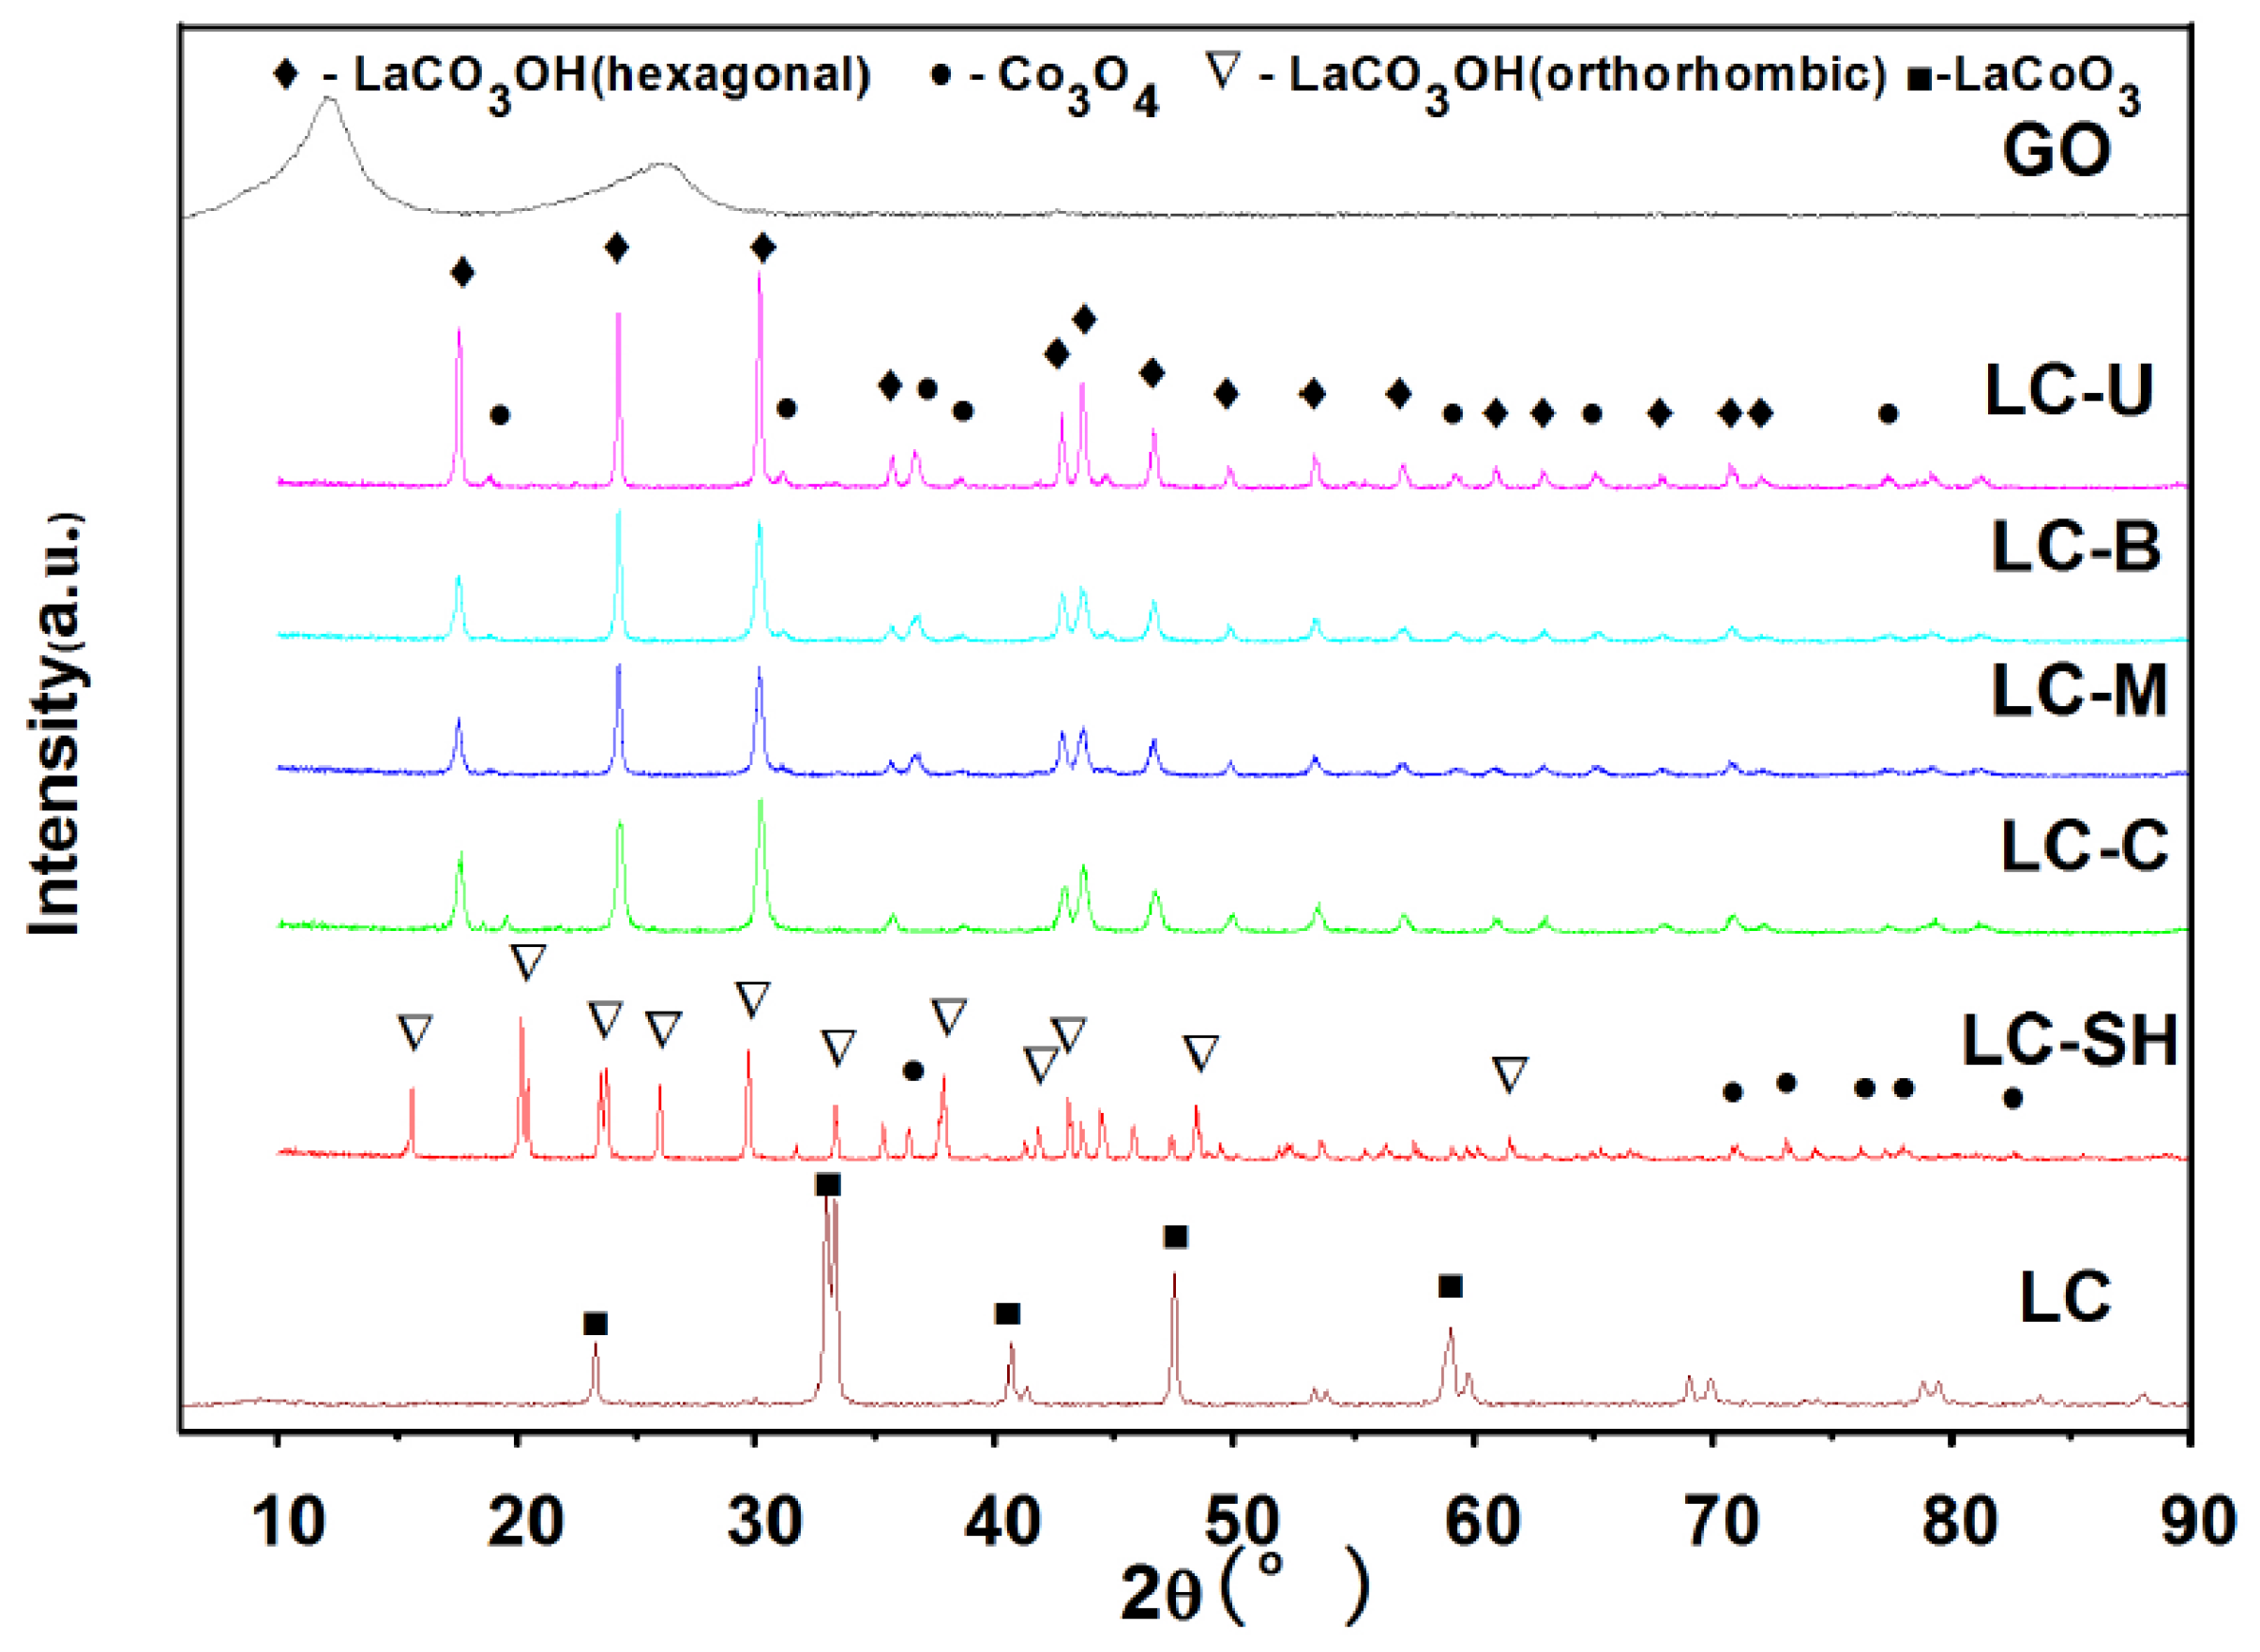
2.2.1. Modified Catalysts of Different Nitrogen Sources

As shown in Figure 3 that the hexagonal crystal system LaCO3OH (JCPDS 26-0815) is formed in LC-U, LC-B, LC-M, LC-C samples and Co3O4 (JCPDS 80-1541) is found in LC-U, LC-B, LC-M, but the orthorhombic crystal system LaCO3OH (JCPDS 49-0981) and Co3O4 (JCPDS 74-2120) are formed in LC-SH. In addition, the LaCoO3 (JCPDS 25-1060) is formed in LC. Attributed to the small amount of added GO, the corresponding diffraction peaks are not found in the XRD spectra of the five samples.
Moreover, BET specific surface areas of the resulting materials were determined by LC-B physisorption and the values are shown in Table 1, with a trend of LC-SH > LC-B > LC-U > LC-M > LC-C > LC, which is closely related to its morphology. Figure 4 displays SEM images of LC-U, LC-B, LC-M, LC-C, LC-SH samples. When combined with XRD analysis, the circular-sheet belongs to LaCO3OH (diameter 400–900 nm; thickness 30–50 nm) of hexagonal crystal system, while the small particles of Co3O4 tend to be stacked in layers between the sandwich structure or attached to the surface of the sandwich structure in Figure 4a. The contact area of the sandwich structure is beneficial to the catalytic activity of methane catalytic combustion reaction. The structure in LC-B is similar to that of LC-U, apart from the circular-sheet size of the LC-B, which is smaller and more homogeneous than these of LC-U; hence, the specific surface area of LC-B (14.87 m2/g) is higher than that of LC-U (12.00 m2/g). Regarding the large particle size of LC-M and LC-C, a sandwich structure has not been formed. In combination with XPS analysis, the surface nitrogen content of LC-M is 18.7%, assuming that melamine has not been completely involved in the reaction and deposited on the surface of composite catalysts material. As can be seen from the Figure 4e,f, the morphology of orthorhombic crystal system LaCO3OH is fibrous and a small amount of which is stacked to form a bar structure with porous microstructure. In combination with BET, the porous structure has a larger specific surface area and is more favorable for catalytic reaction than the sandwich structure.

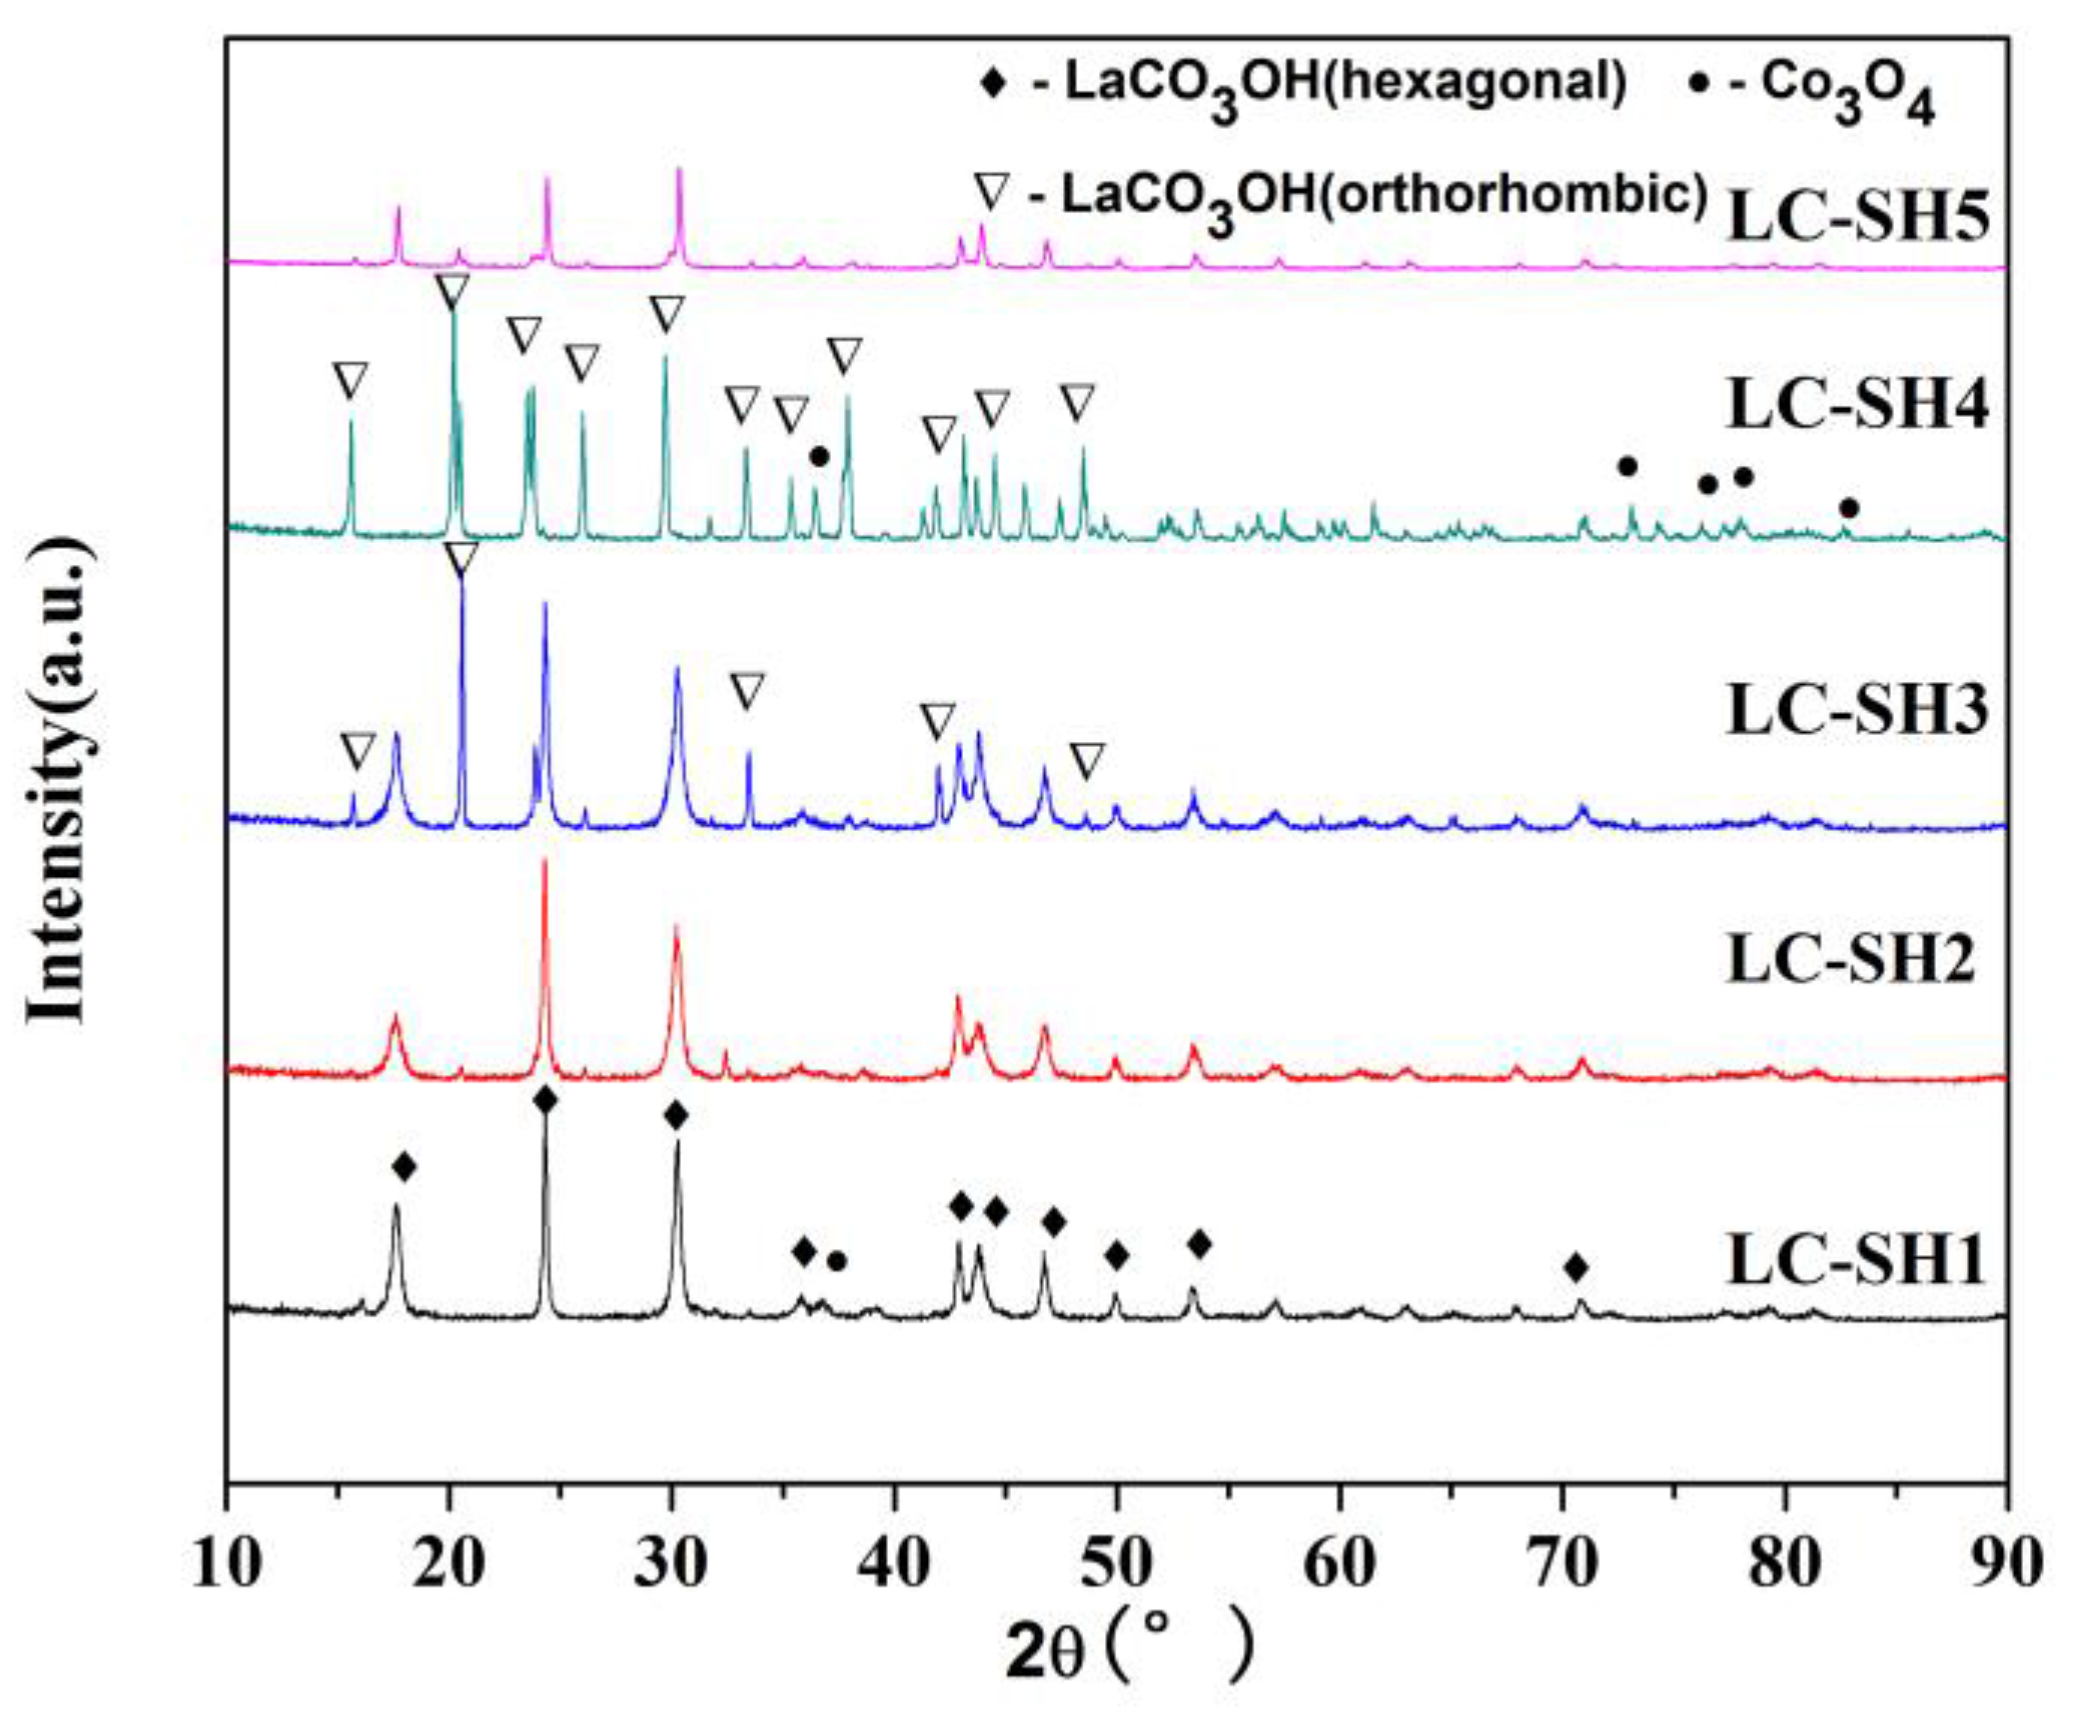
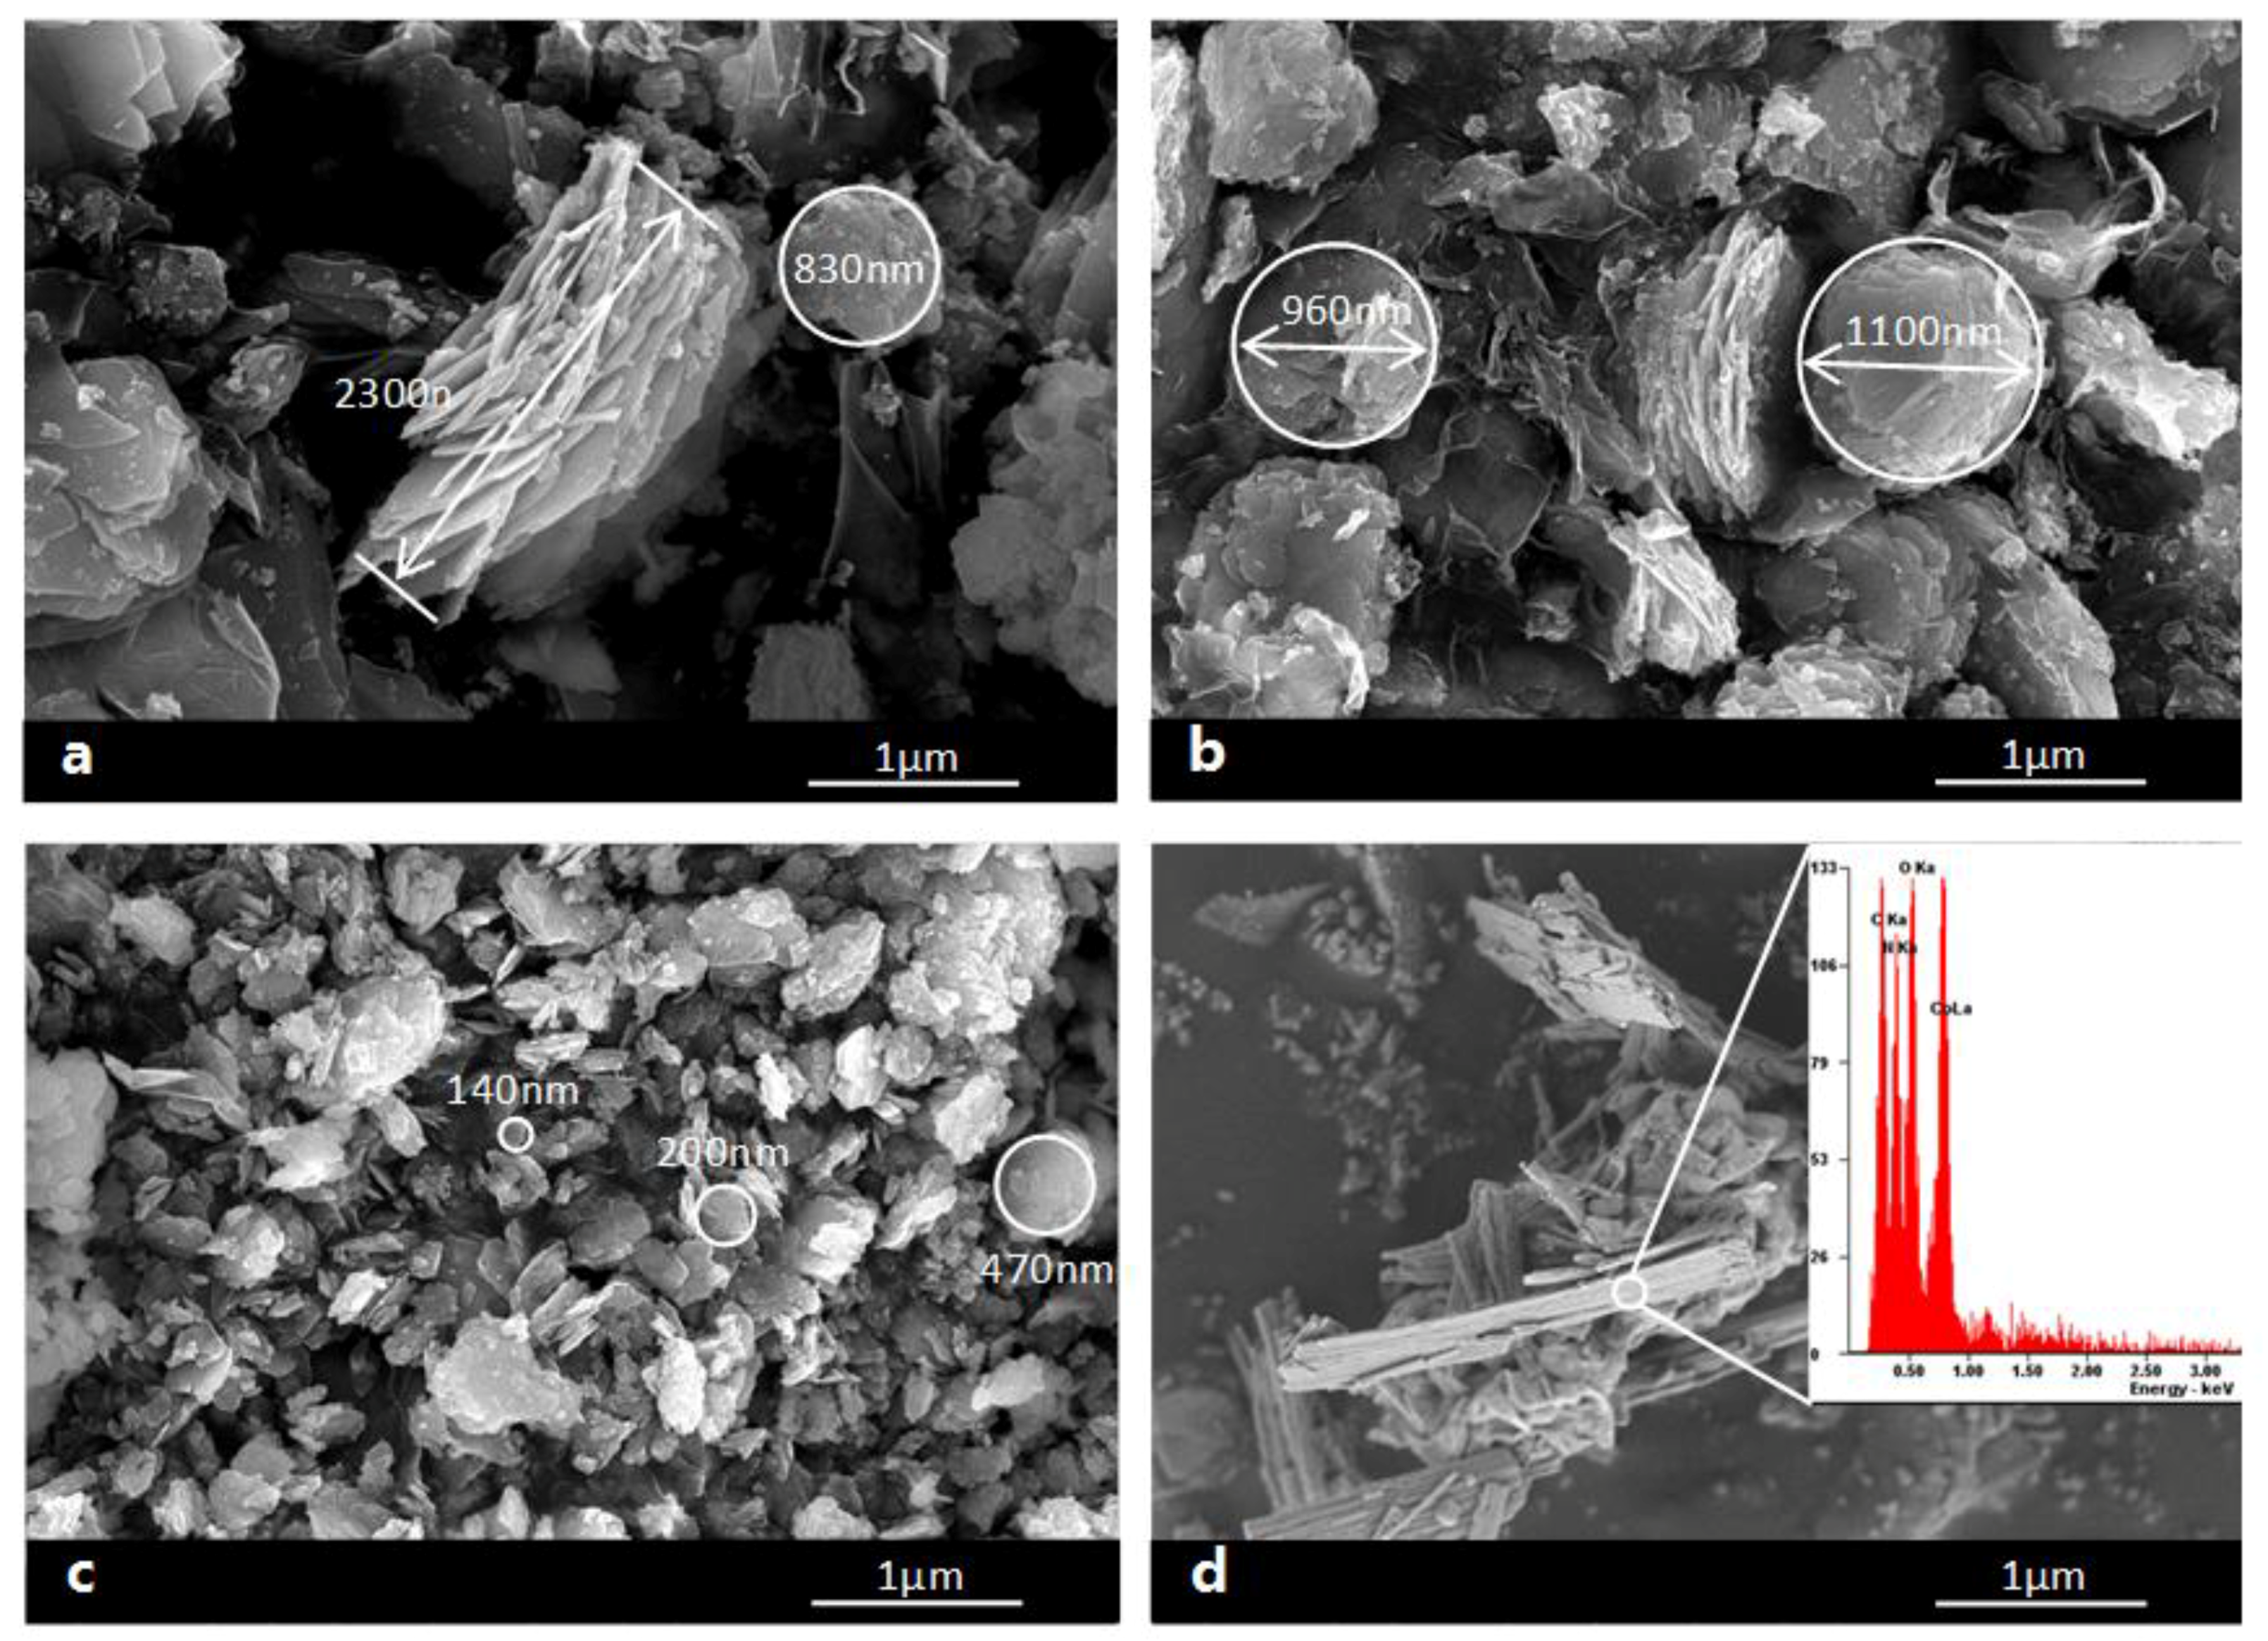
2.2.2. Modified Catalysts of Different Added Amount Nitrogen Sources

XRD patterns in Figure 5 indicate that the orthorhombic phase LaCO3OH gradually appeared and the hexagonal crystal system LaCO3OH weakened with more addition of the nitrogen source. Finally, LC-SH4 contains pure orthorhombic phase LaCO3OH (JCPDS, 49-0981) and Co3O4 (JCPDS 74-2120) phase.
Table 2 shows that the specific surface area of LC-SH2 is higher than that of LC-SH1 because the former has smaller particle size for the same cockscomb structure layer sheets, as shown in Figure 6a,b. The lamellar films number of LC-SH3 is obviously decreased, and the particle size was also decreased. Therefore, the specific surface area increases to 20.37 m2/g. It is inferred that LC-SH4 has the higher catalytic activity, because the phase change leads to the change of crystal growth orientation, and the specific surface area of the multichannel rod-shaped structure increases obviously (26.45 m2/g), all of which are consistent with catalytic performance test. When considering that the catalytic activity of LC-SH5 is lowest of the five samples, SEM, TPR, and XPS of LC-SH5 are not referred below.
Figure 6 shows the SEM images of the composite catalysts material. It can be clearly seen that the LC-SH1 and LC-SH2 have larger lamellae, looser structure, and larger particles than these of others. The particle size of LC-SH3 decreases rapidly with the number of stacked sheet reduced, presumably because the sample size is small or some lamellar stacking details covered after spraying treatment. However, the morphology of LC-SH4 changes into rod-shaped and fibers. The porous rod-shaped structure represents the thorhombic phase by XRD analysis. LC-SH4 is also formed a small amount of Co3O4 phase that cannot be distinguish from the morphology, so the energy spectrum is analyzed in small circle regional of Figure 6d and the content of each element is shown in Table 2. The scanning energy spectrum proves the existence of the Co element. Regarding to the ratio of Co/O is about 0.47, slightly less than 0.75 of Co3O4, the oxygen element not only exists in Co3O4, but also in other functional groups. In addition, N elements are found, indicating that nitrogen doping is successfully performed on the surface of the composite catalysts by hydrothermal treatment.

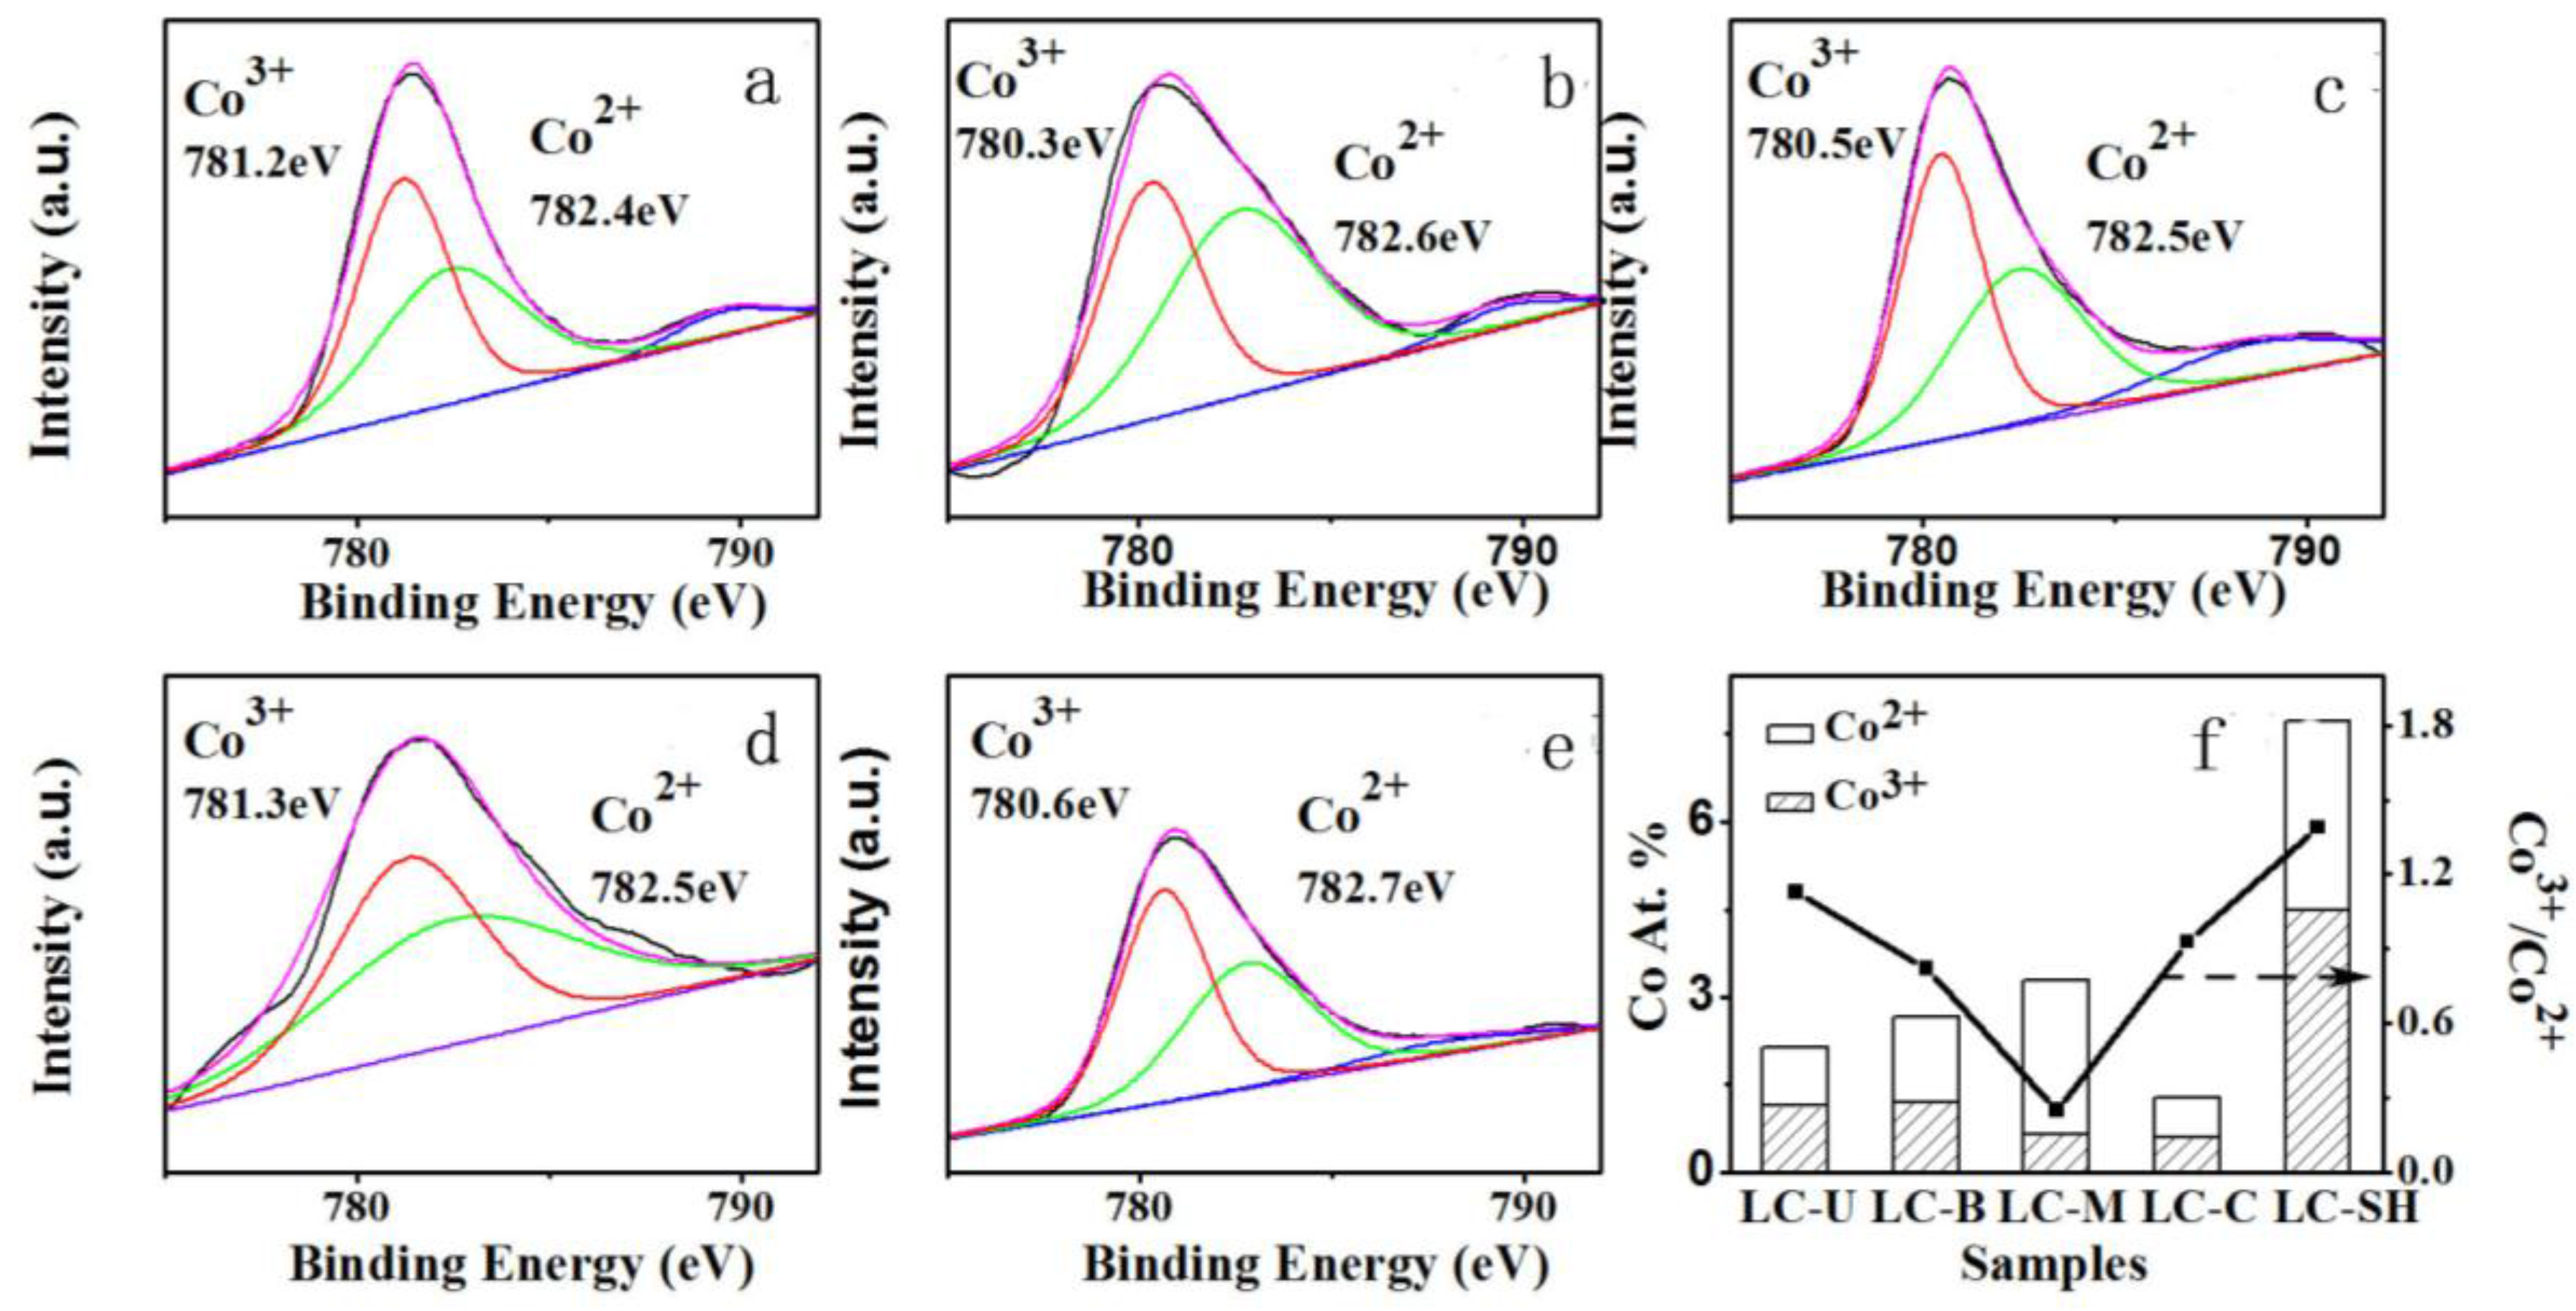
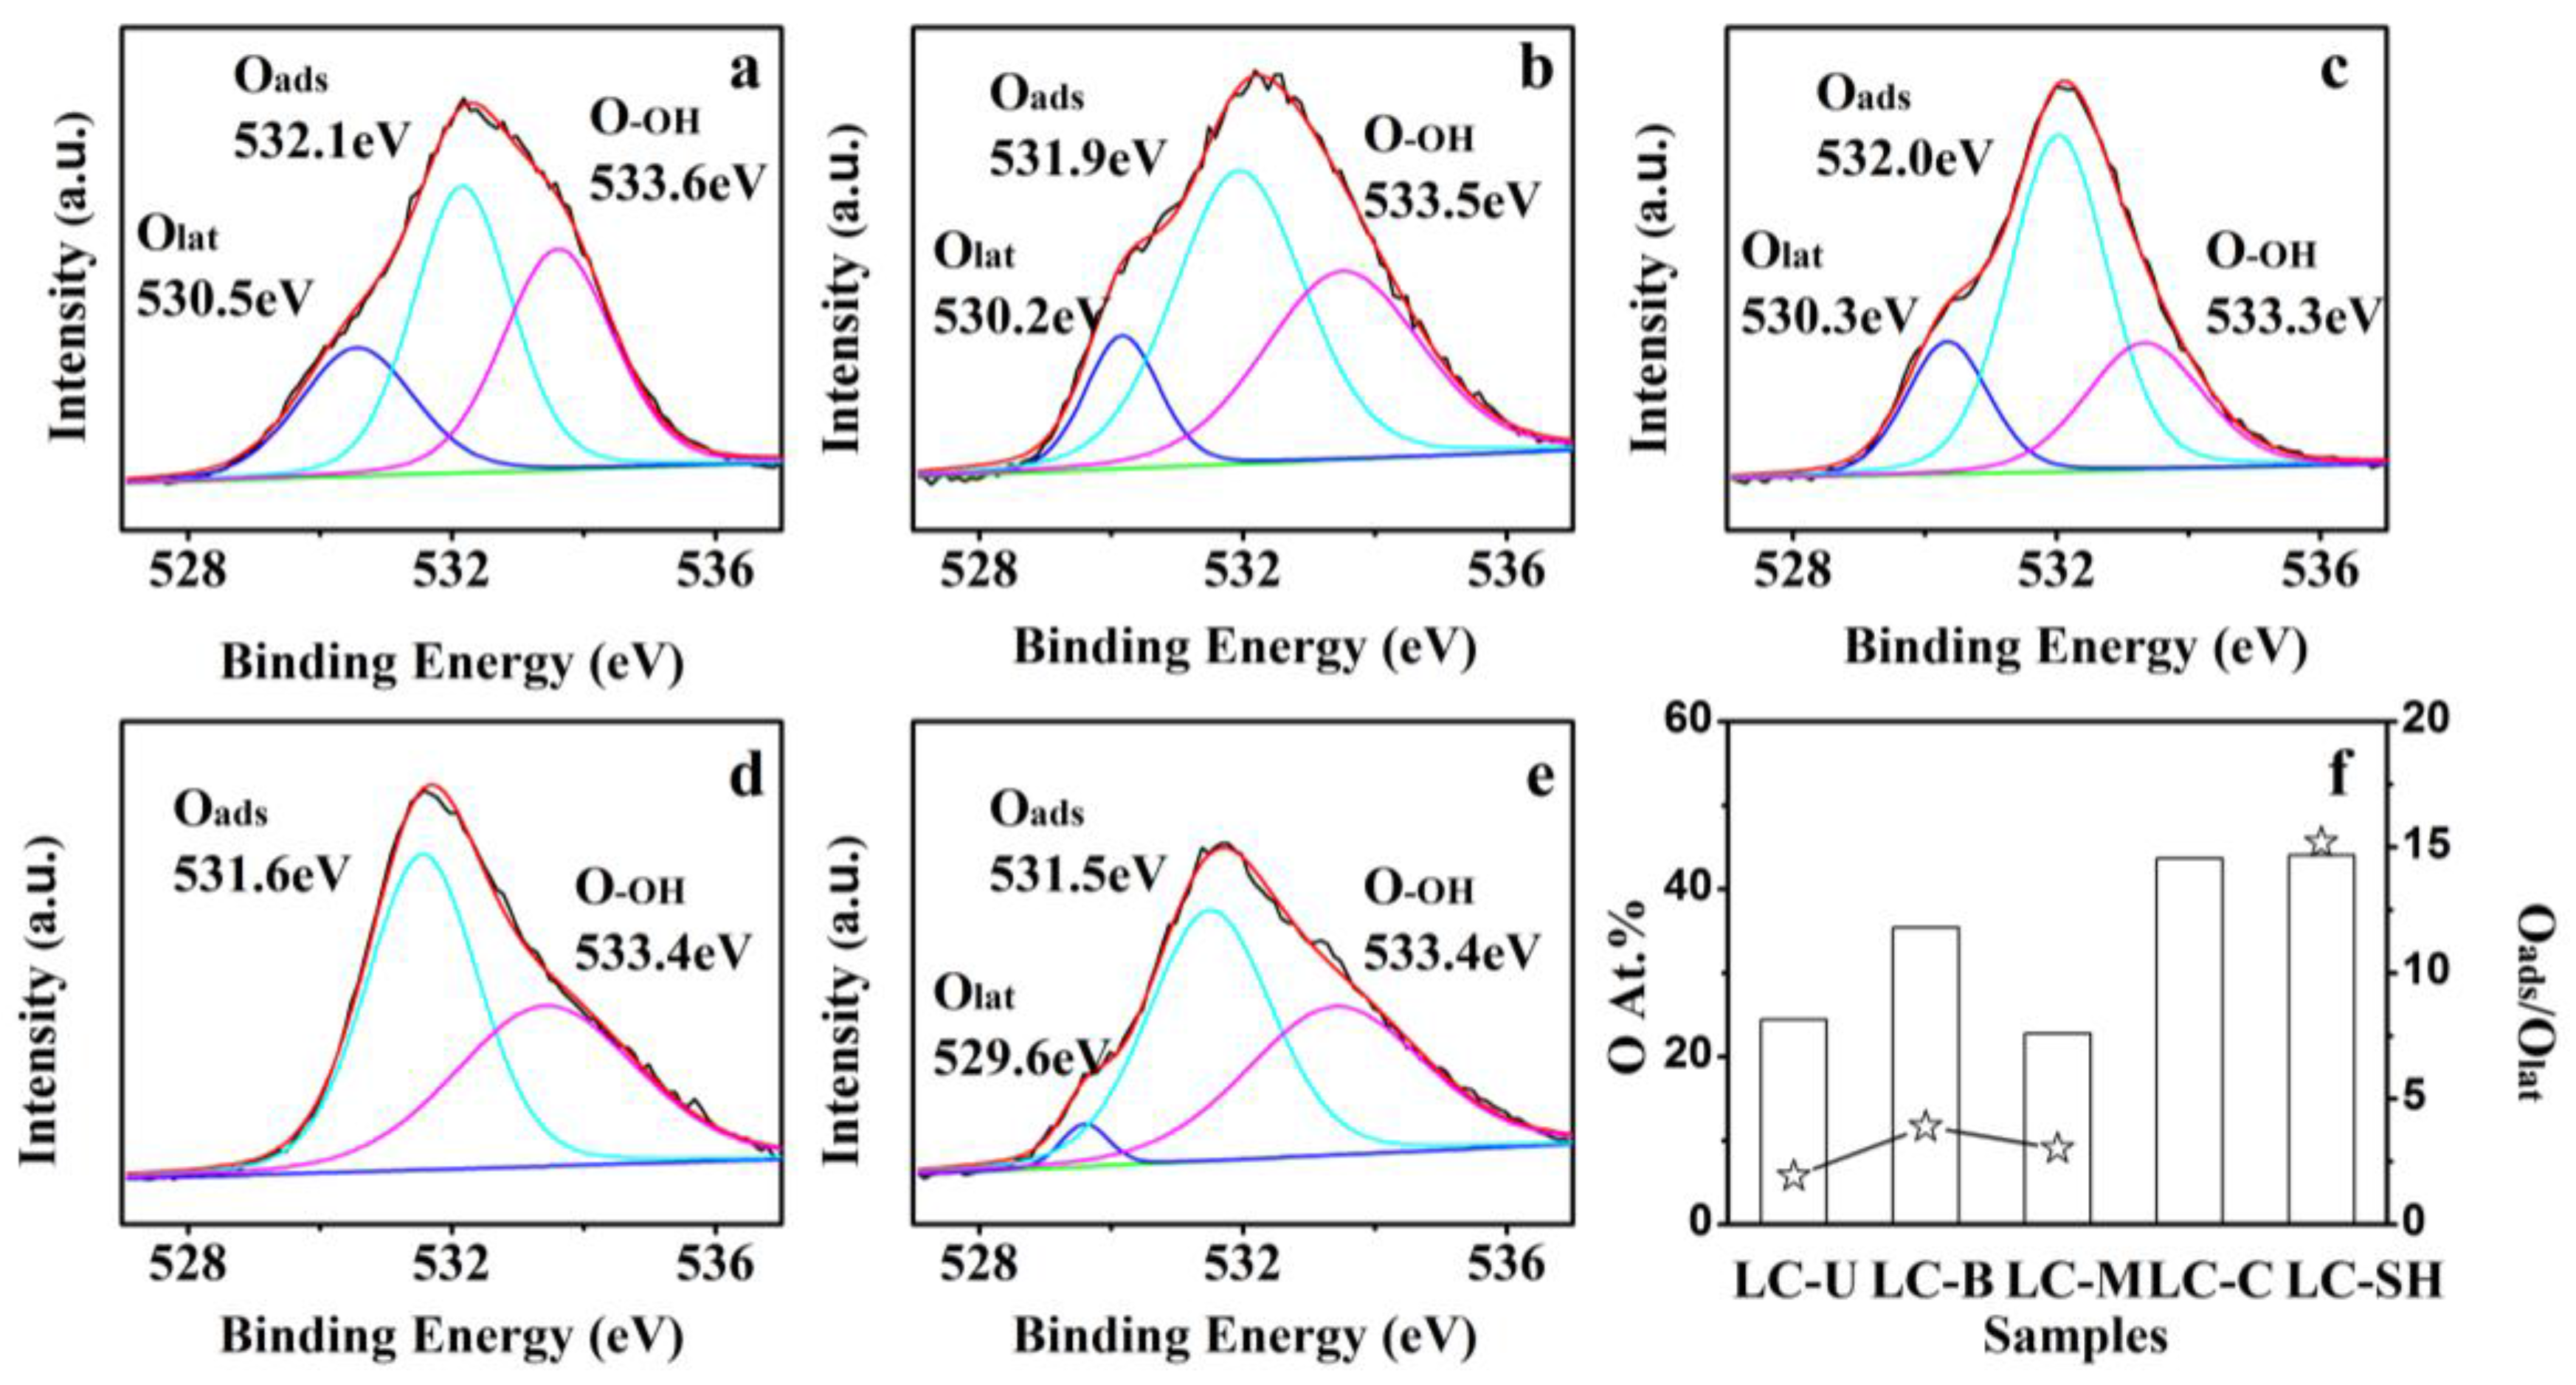
2.3. The Surface Composition of Composite Catalytic Materials

2.3.1. Modified Catalysts of Different Nitrogen Sources

Table 3 displays the determined surface concentration (atomic %) of the Modified catalysts of different nitrogen sources. The relative percent of differential valence states of Co and O are calculated from the ratios of peak areas of XPS spectra, and are displayed in Figure 7 and Figure 8.
As shown in Figure 7, each sample has an asymmetric Co 2p3/2 (~781, eV) signal, which divided into two peaks, as high-valence Co3+ 2p3/2 centered at 780.5 eV and low-valence Co2+ 2p3/2 at 782.5 eV [24]. The surface Co element is shown in Figure 7f. The percentage of Co on LC-SH’s surface is 7.73%, which is 2 to 7 times than that of the other four samples. A high proportion of Co3+/Co2+ displays better catalytic performance of catalyst because more Co3+ can be reduced to Co2+ in low temperature [25]. Co 2p3/2 moves toward low binding energy, indicating the formation of high valence Co and more oxygen vacancies [25,26]. When comparing the five composite catalysts materials, the Co3+/Co2+ ratio of LC-SH is the highest, which is 1.2 to 5.6 times than that of the other four samples. The high content of Co and high proportion of Co3+/Co2+ in the surface are beneficial to the catalytic oxidation reaction, which is consistent with the result of H2-TPR and the catalytic oxidation reaction test.
Figure 8 shows XPS peak spectra of O1s for each sample is wide and asymmetrical, which can be fitted with three peaks, corresponding to the lattice oxygen (Olat) at 529.6~530.5 eV; the oxygen chemically adsorbed on oxygen vacancy (Oabs) at 531.5~532.1 eV mainly corresponding to the O2, O22−, or O, formed by chemisorption on the surface of the sample; the hydroxyl group at 533.3~533.6 eV, corresponding mainly to water molecules that are adsorbed on the sample surface as well as carbonate species.
It can be seen from Figure 8f, LC-SH has the highest proportion of surface oxygen content (O At. %) than that of all the samples. Generally, catalysts with high proportion of surface oxygen species can promote the reaction of methane combustion at low temperatures [27]. The higher ratio of adsorbed oxygen to lattice oxygen (Oabs/Olat) on the catalytic material surface is, the more the surface active oxygen vacancies are. The surface active oxygen vacancies is favorable the oxidation of methane or methyl groups [28]. In comparison with five different nitrogen sources modified composite catalysts, the order of Oabs/Olat ratio is LC-SH > LC-B > LC-M > LC-U (LC-C: Olat = 0, Oabs = 531.6 eV), and LC-SH has the highest oxygen species content on the surface, as well as the best catalytic activity. It is worth noting that the surface oxygen content of LC-M is higher than that of LC-U, but the Co3+/Co2+ and the surface of the Co and catalytic activity of methane are significantly lower than that of LC-U, indicating the synergy of the surface oxygen species and the high valence cobalt species plays an important role for the catalytic reaction in the catalytic process.

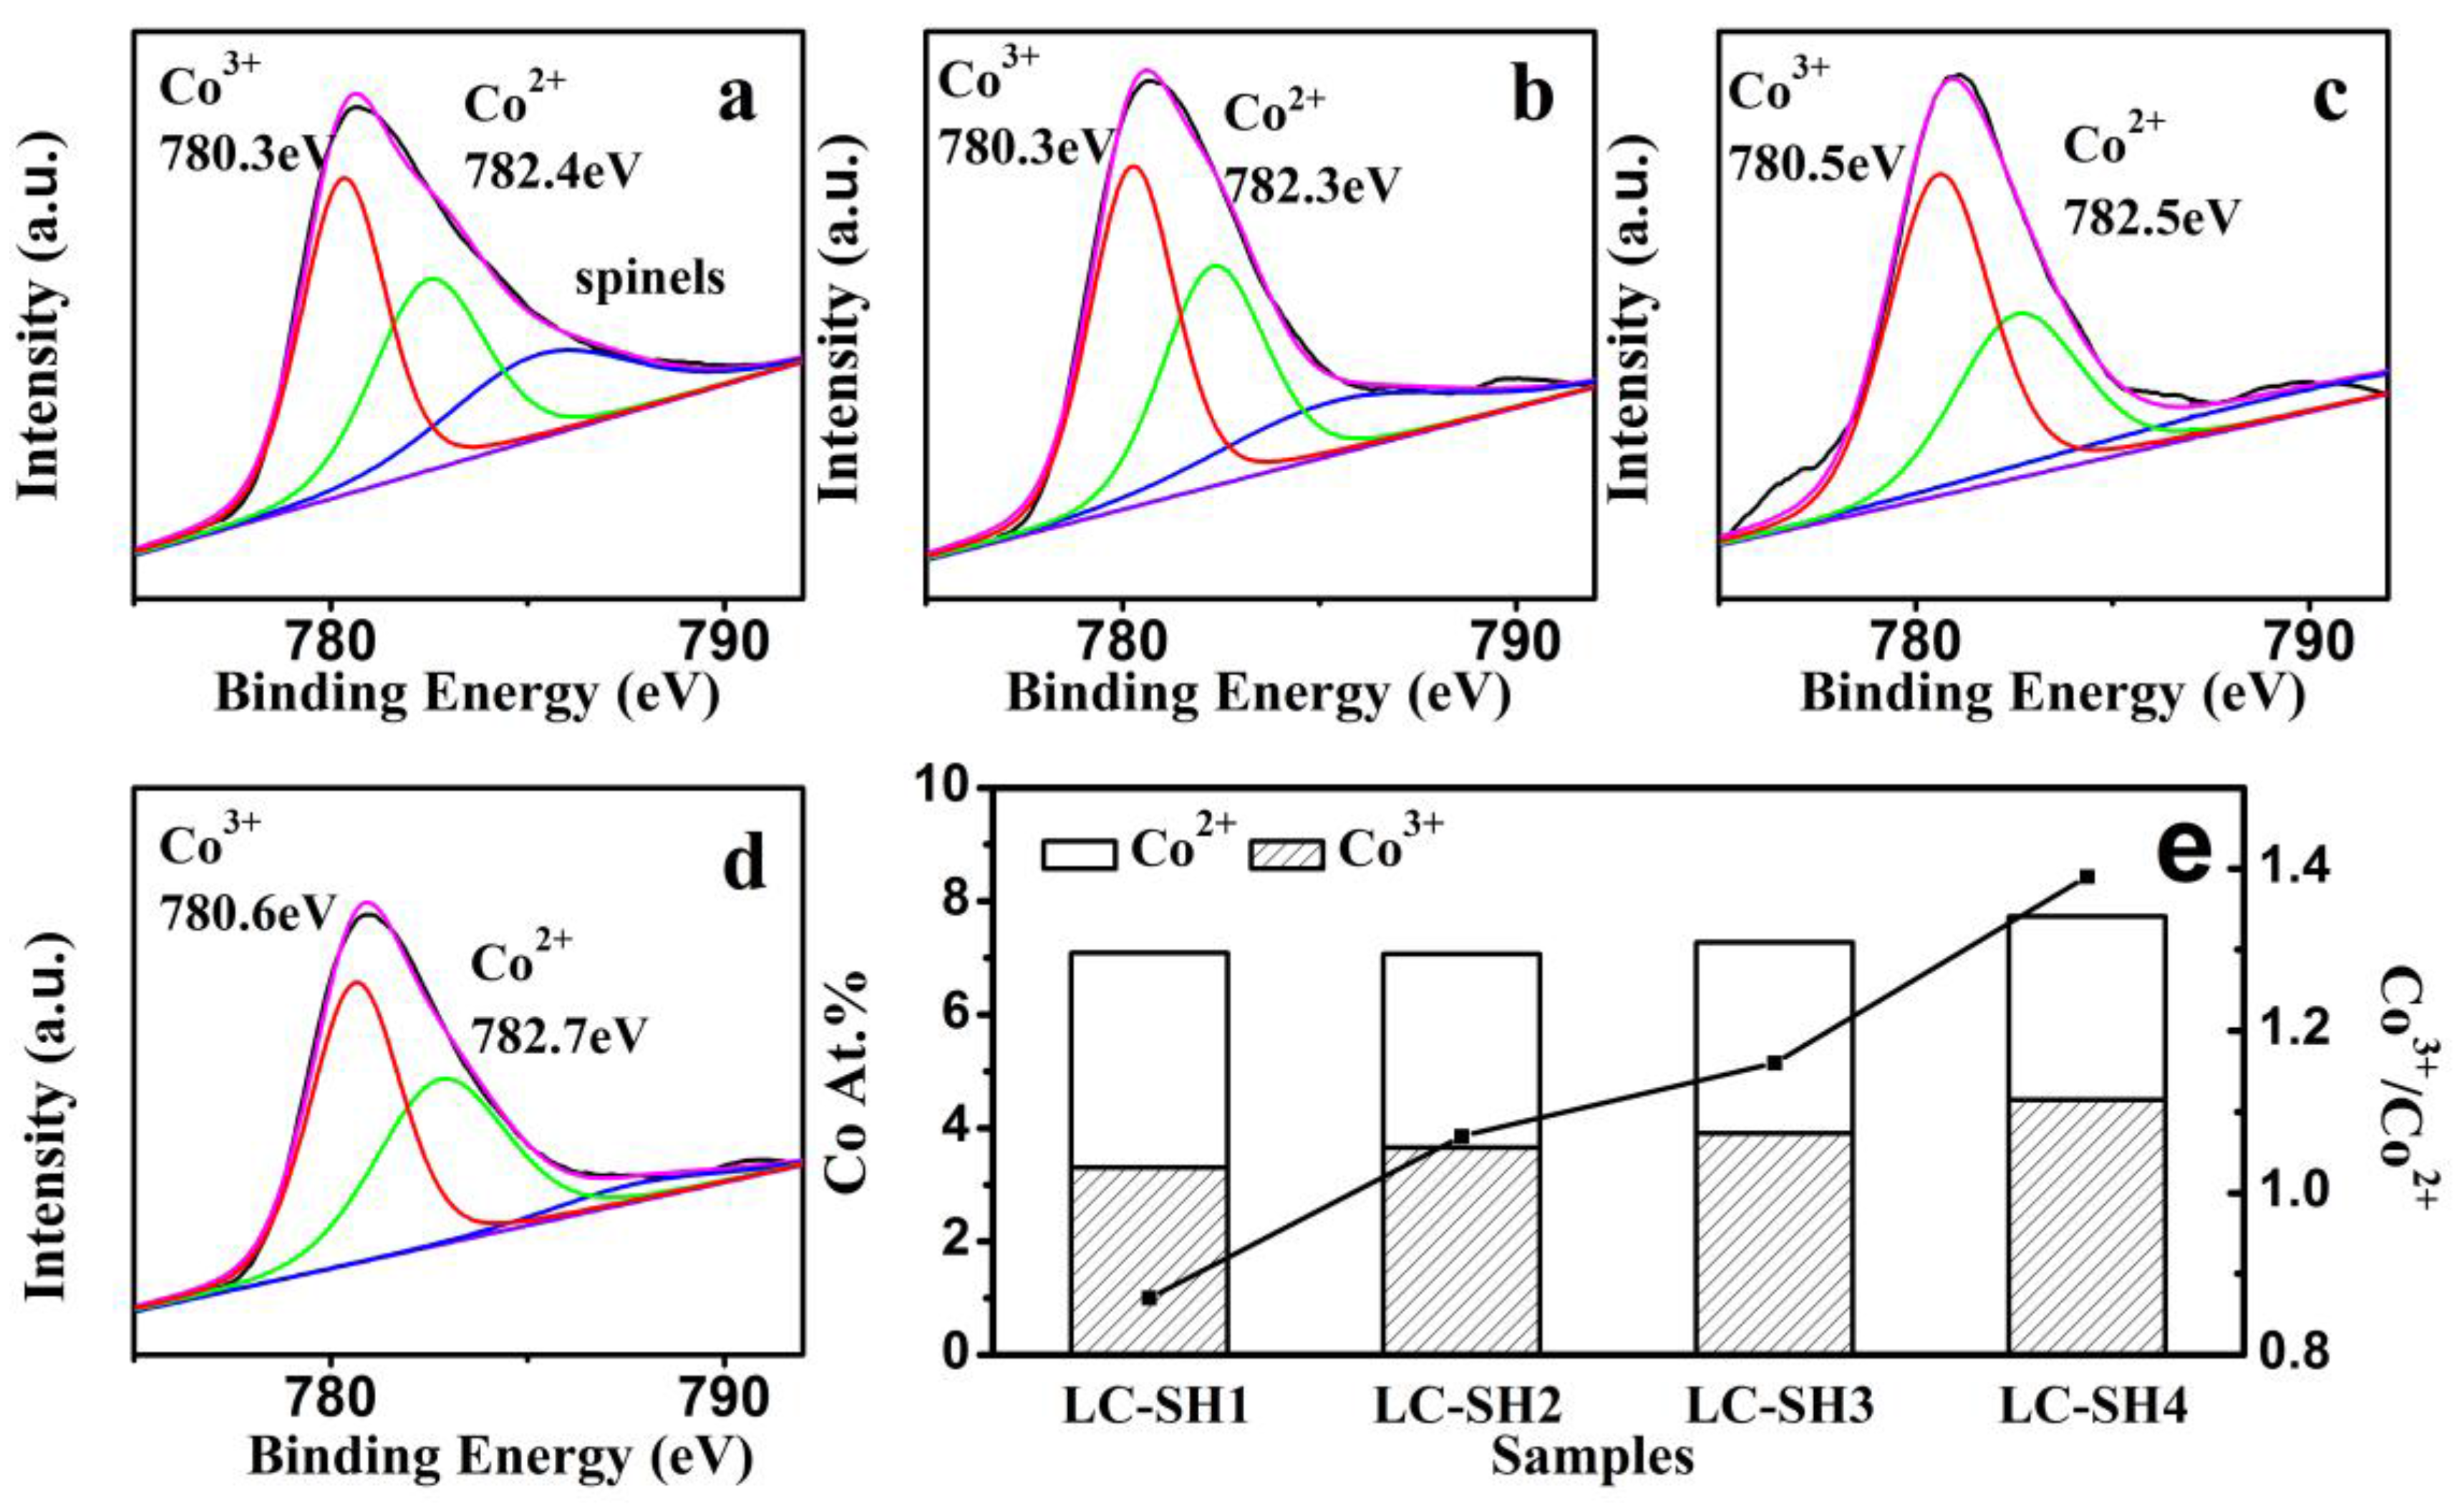
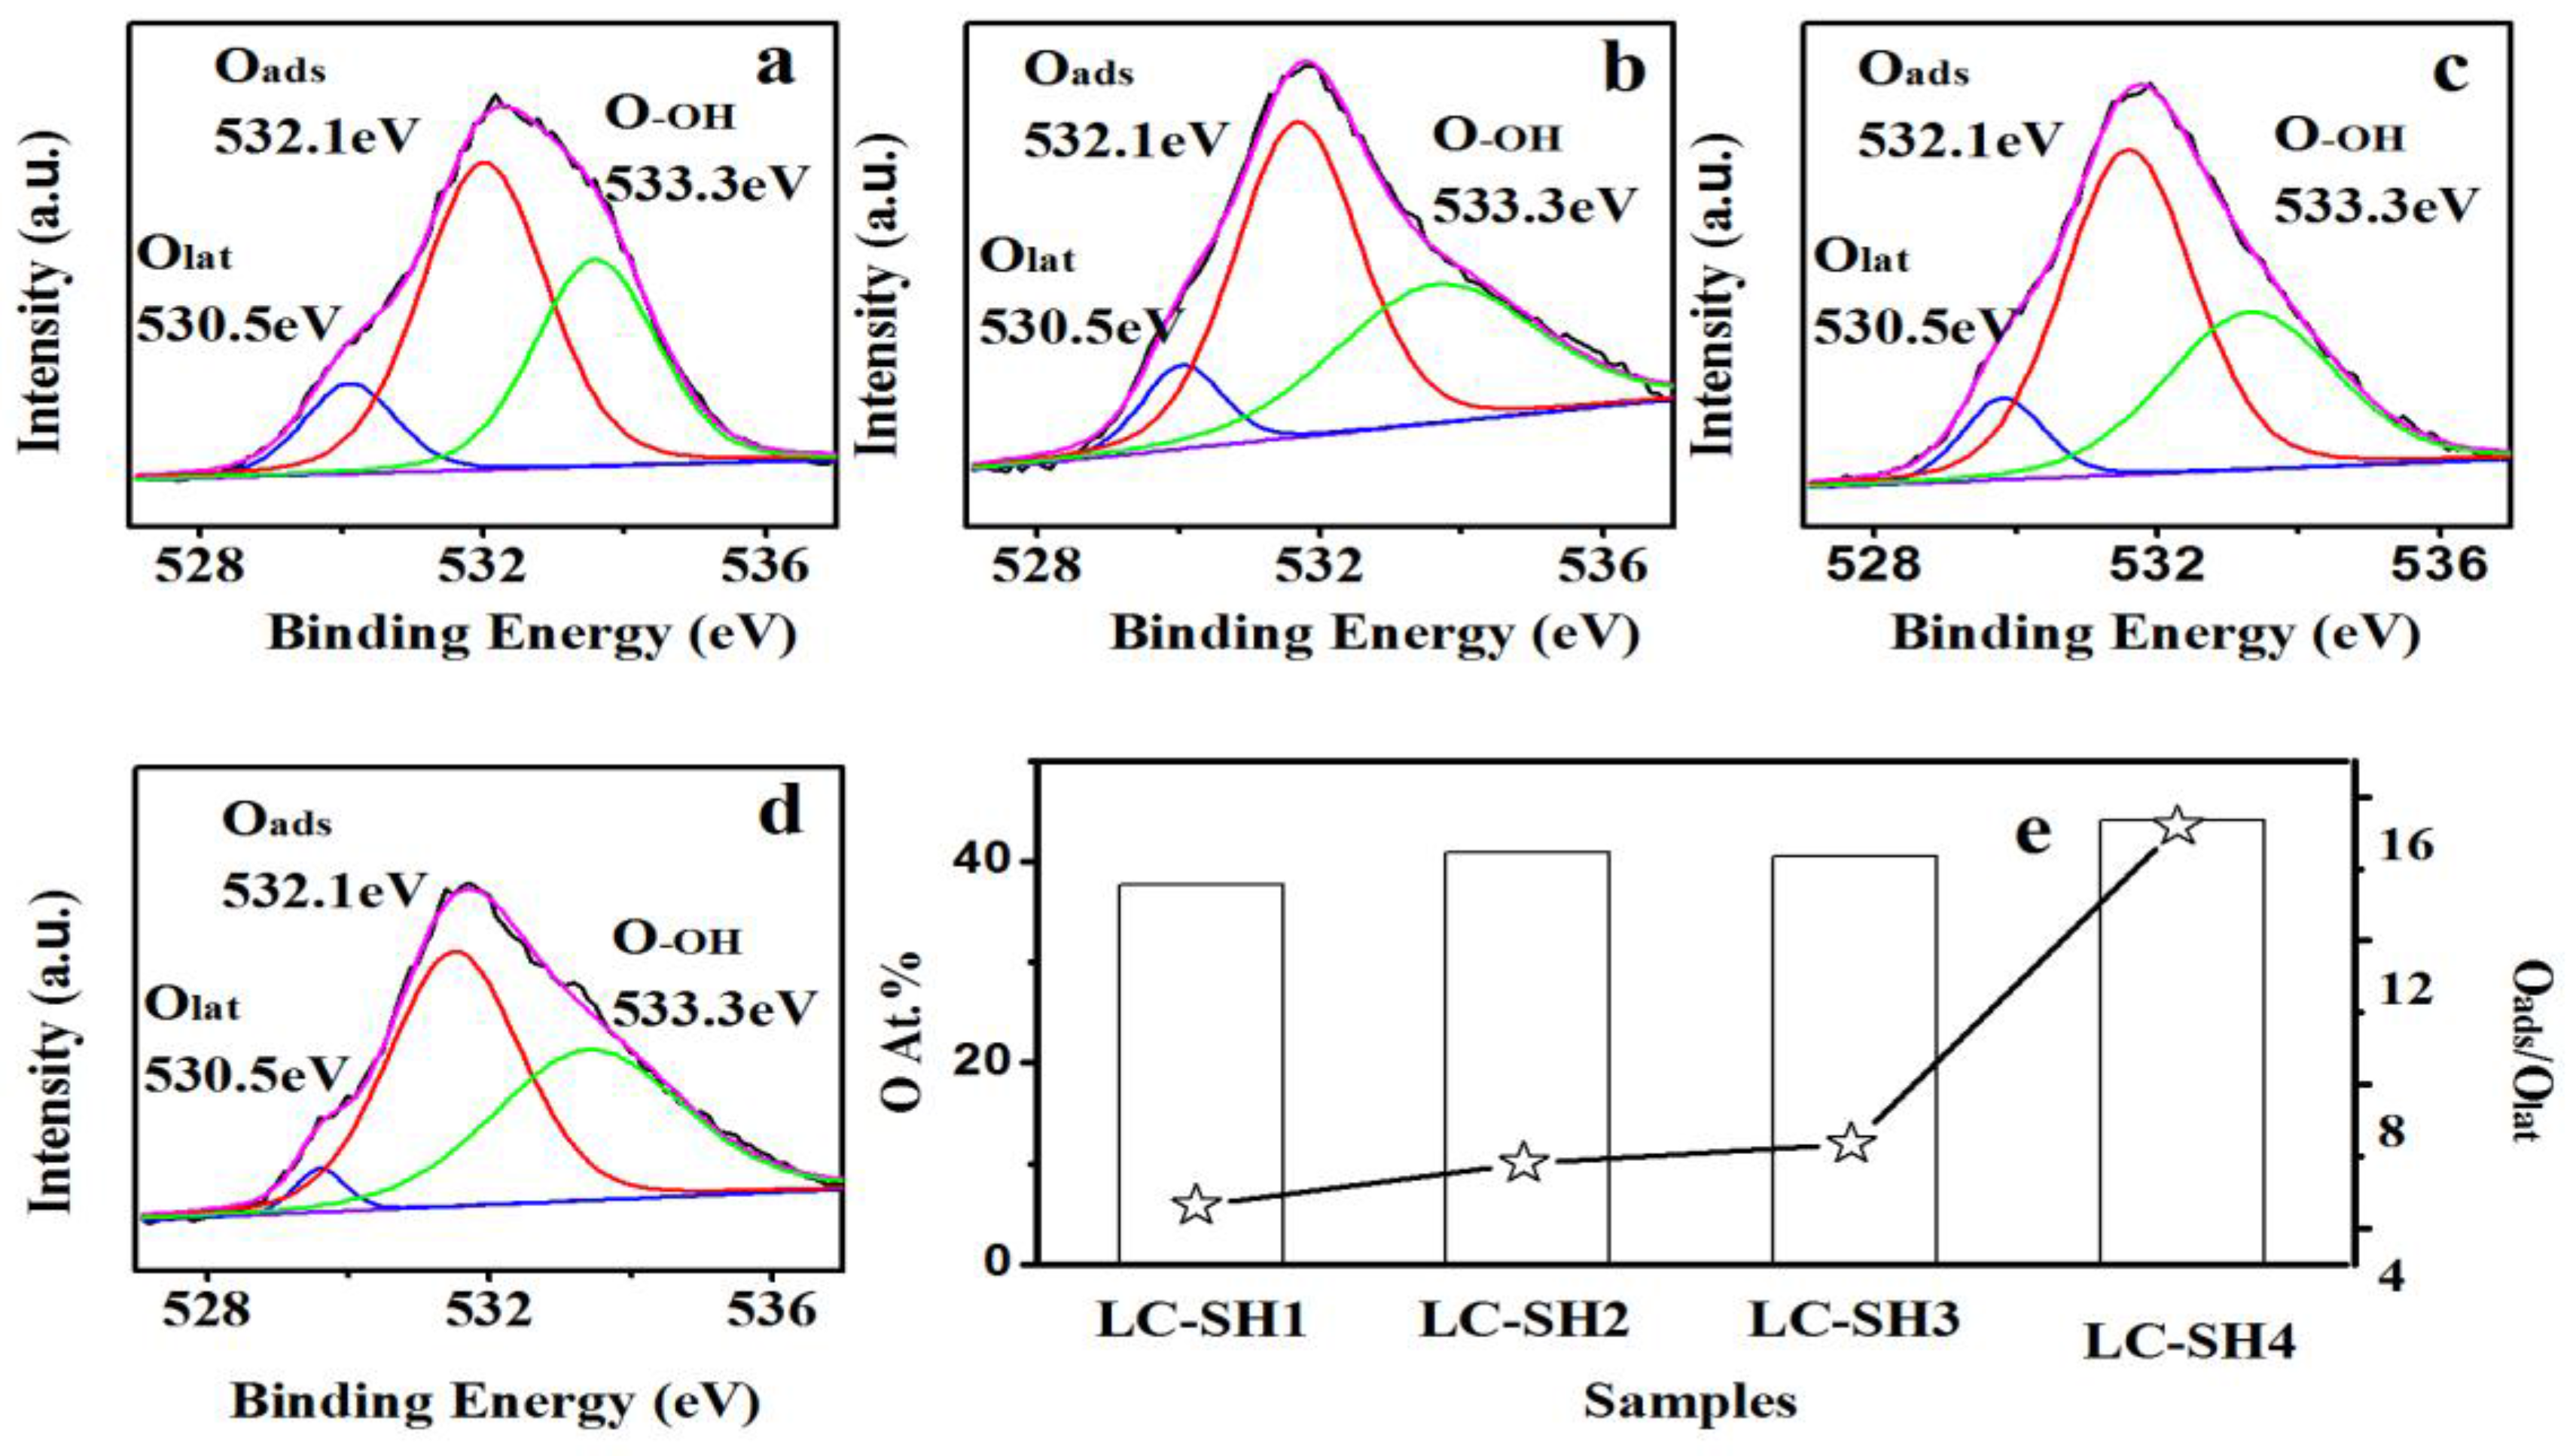
2.3.2. Modified Catalyst of Different Added Amount Nitrogen Source
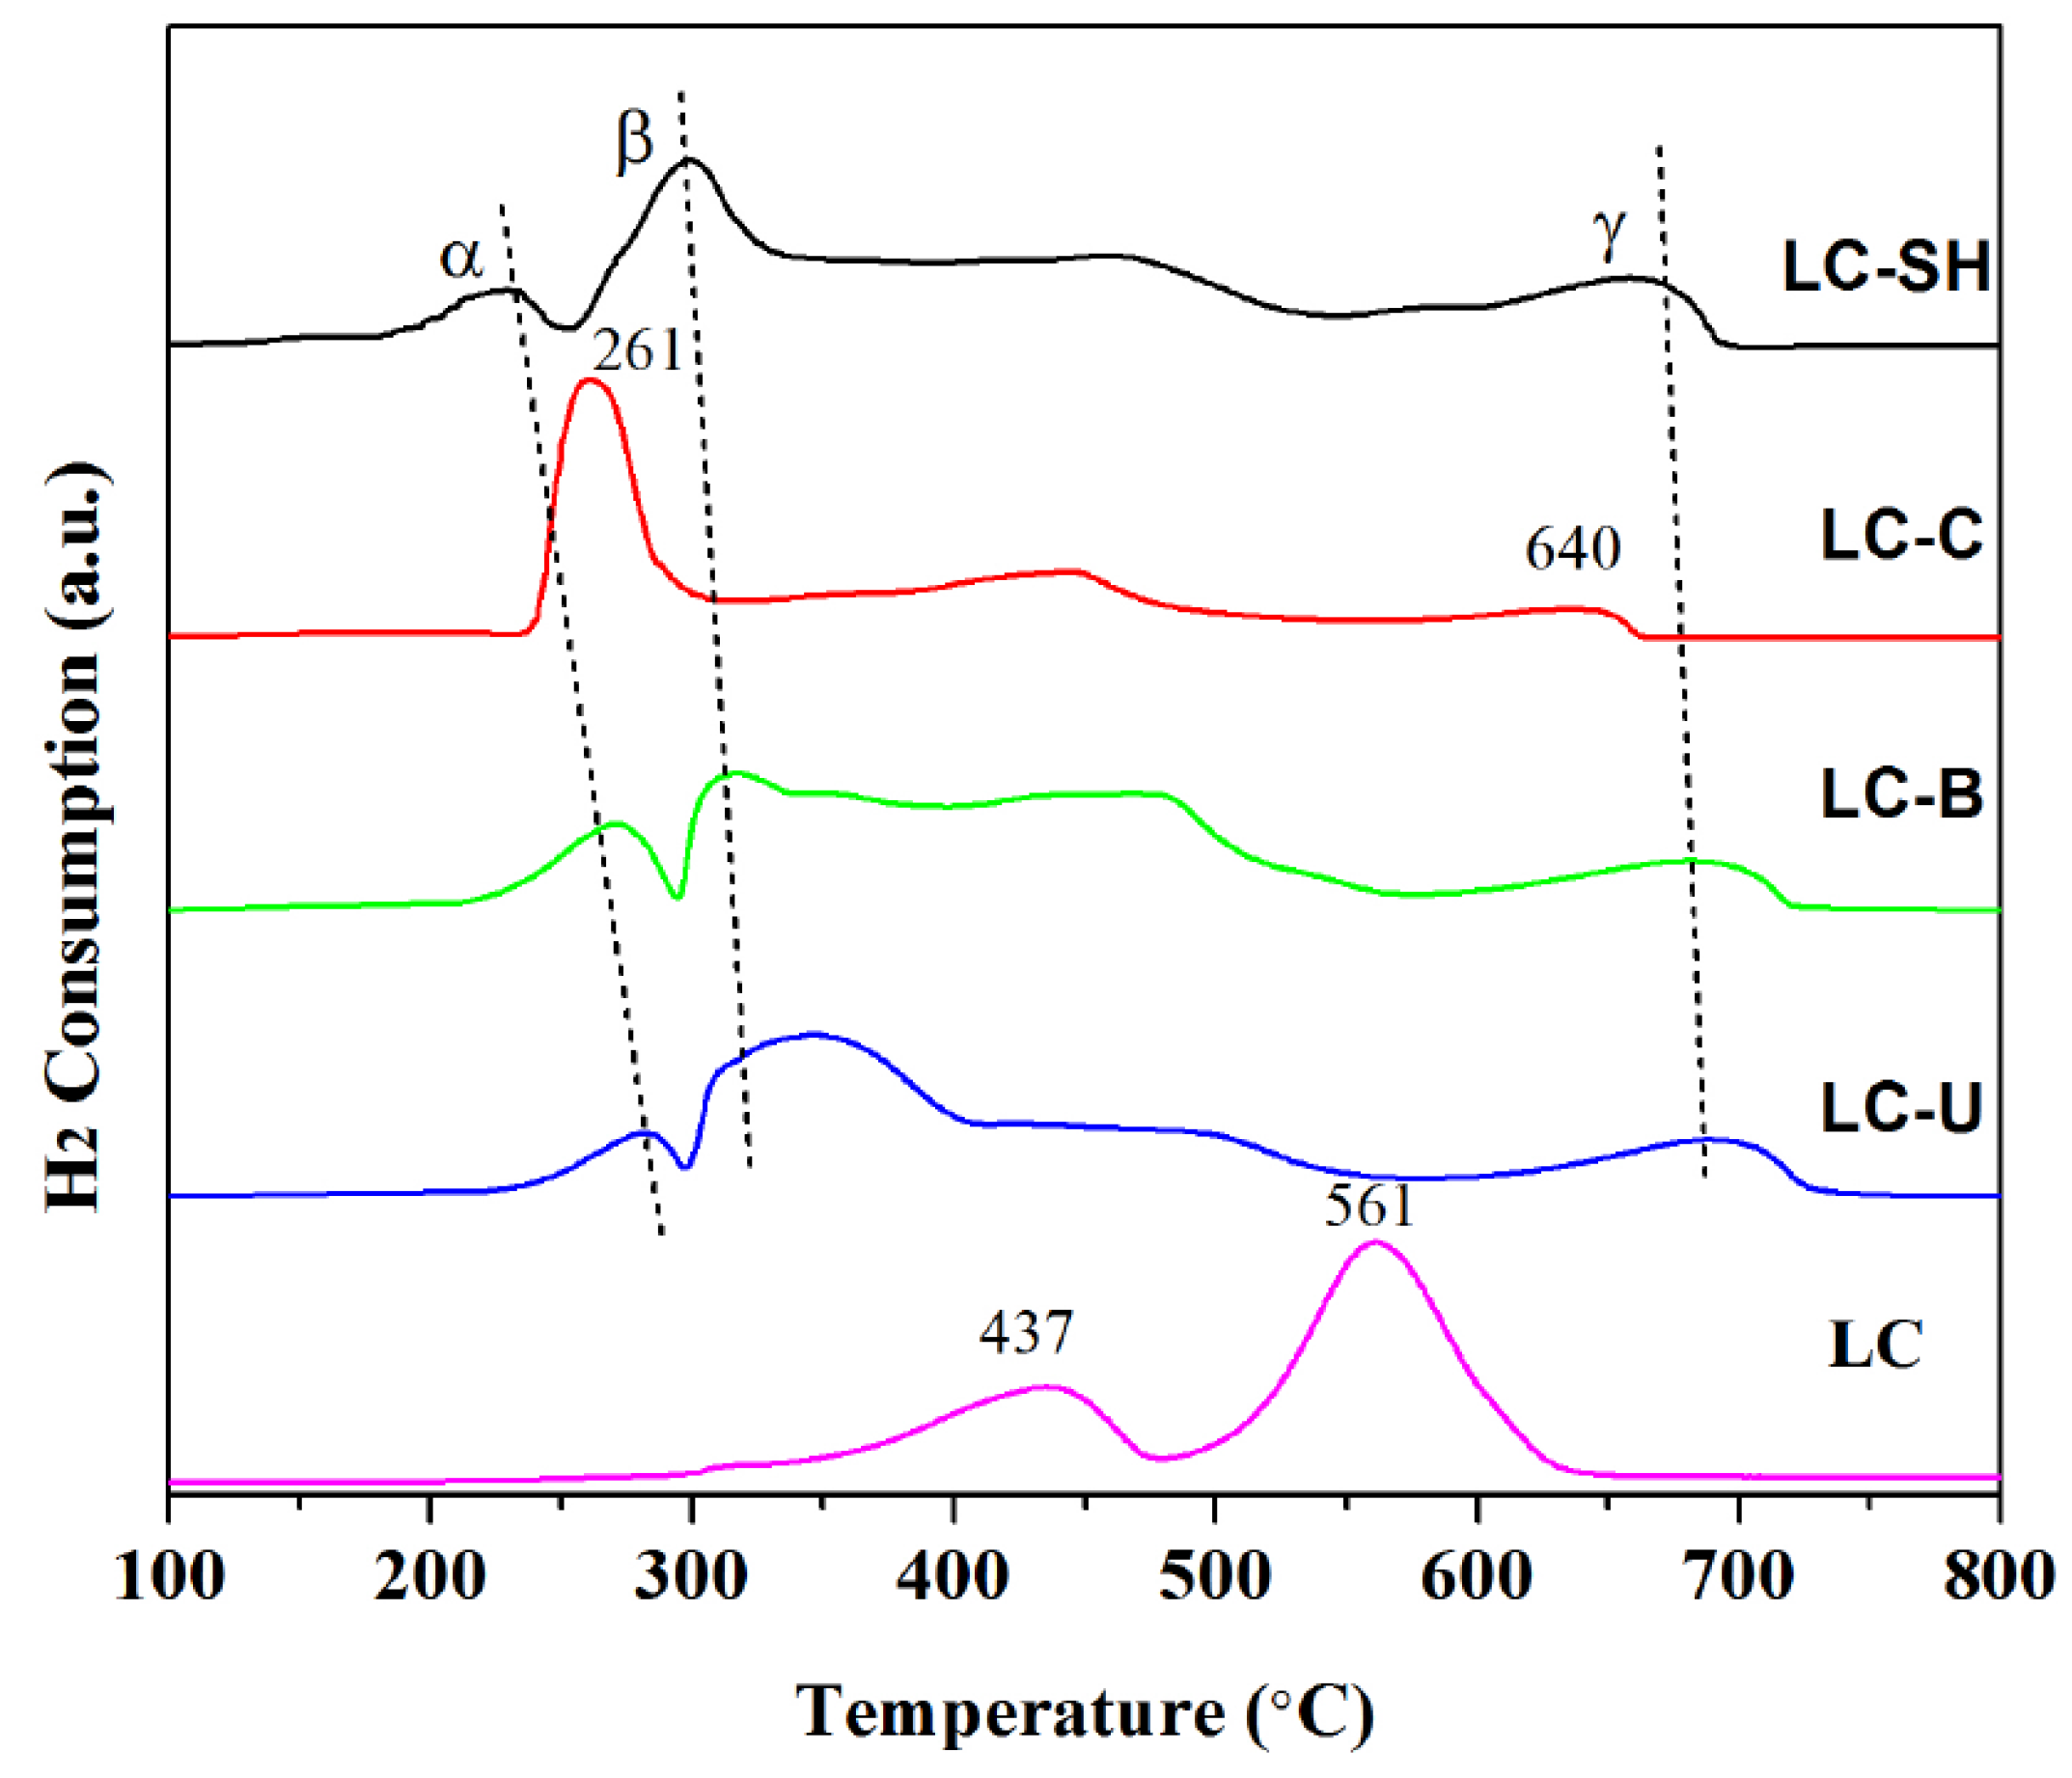
Table 4 displays the determined surface concentration (atm. %) of the catalysts with different amounts of nitrogen. The relative percent of differential valence states of Co and O are calculated from the ratios of peak areas of XPS spectra, and displays in Figure 9 and Figure 10.
The Co 2p3/2 (~780.8 eV) spectra of the semicarbazide hydrochloride modified composite catalyst is shown in Figure 9, which is divided into 780.5 eV, 782.5 eV, and the companied weak peak at 786 eV, corresponding to Co3+ 2p3/2, Co2+ 2p3/2, and spinel structure with Co3O4, respectively [29]. The calculated results are shown that content of Co and Co3+/Co2+ increased with the increase of the amount of semicarbazide hydrochloride. Hence, the Co element shifted to the surface by the action of nitrogen source, and gradually changed to the high valence state, forming more oxygen vacancies as the same time [30,31]. More addition of semicarbazide hydrochloride is beneficial to form more surface active species Co3O4, which is favorable for the catalytic oxidation reaction. This result is consistent with the results of H2-TPR and methane catalytic performance test.
Figure 10 shows the O 1s (~532.2 eV) spectra. It can be seen from the peak data, different amounts of semicarbazide hydrochloride added to modify the surface of the composite catalysts material oxygen content is different. On the other hand, it is found that the atomic ratio of Oabs/Olat for all the samples increases in order of LC-SH4 > LC-SH3 > LC-SH2 > LC-SH1, indicating that the surface oxygen vacancy of LC-SH4 is particularly prominent.

2.4. Reducibility

Combined with SEM, BET, XPS, and the catalytic activity of methane test results, the morphology and catalytic activity of LC-M is not very satisfied with the requirement, and the catalyst modified with melamine cannot significantly to improve the catalytic performance. Thus, the redox property of LC-M is not analyzed in this section.
In Figure 11, LC has two reduction peaks, the one is the low temperature peaks of 300~500 °C, the other is the high temperature peaks of 500~700 °C, corresponding to Co3+ reduction to Co2+ and Co2+ reduction to Co0, respectively. When the temperature is less than 600 °C in the high temperature region, the perovskite structure collapses in the process of oxidation and reduction, which shows that the poor high-temperature stability of LC [32]. The reduction curves of LC-U, LC-B, and LC-SH are approximately the same, and the reduction temperature is slightly different. The reduction curve can also be divided into two parts: In low temperature region, 200~400 °C is mainly caused by catalytic adsorption of oxygen on the surface and active species Co3O4, the high temperature region is mainly for the reduction of C4+ in LaCO3OH.
The low temperature peaks are 2 reduction peaks (α and β). The α peak represents the composite catalysts material. The surface of the Co3O4 is reduced to CoO, the beta peak represents independent Co3O4, and CoO is further reduced to Co0 [33]. The peak position and peak area in the low temperature region indicate the oxygen activity and the active oxygen content of the composite catalyst. The peak position of the low temperature is shifted towards a lower temperature, indicating a better redox performance. The beta peak of three samples was wide, mainly owing to the particle size not being uniform during the hydrothermal. The beta peak has large temperature span, but the corresponding hydrogen consumption is large. In the high temperature region, the gamma reduction peak represents the reduction of C4+ on the surface of LaCO3OH with the main phase structure collapsing, and the higher the temperature of the gamma peak is, the more stable the sample structure is. Reduction of the LC-C include low temperature peak 250–300 °C and peak 640 °C high temperature; the temperature peak area is larger than LC-SH, but the peak position is higher; High temperature peak took place in 640 °C, indicating that the stability is weaker than others, but stronger than LC.
Figure 12 shows the H2-TPR patterns of the composite catalysts materials modified with different amounts of semicarbazide hydrochloride. The α peak mainly represents the reduction of Co3+ to Co2+ at the interface, and β represents the reduction of Co2+ to Co0, and the gamma peak represents the reduction of C4+ in LaCO3OH. With the increase of nitrogen source, the position of α, β reduction peak shifted to low temperature, indicating that the addition of semicarbazide hydrochloride increased the catalytic activity of composite catalyst. When compared with hydrogen consumption, LC-SH has the highest hydrogen consumption at low temperature.

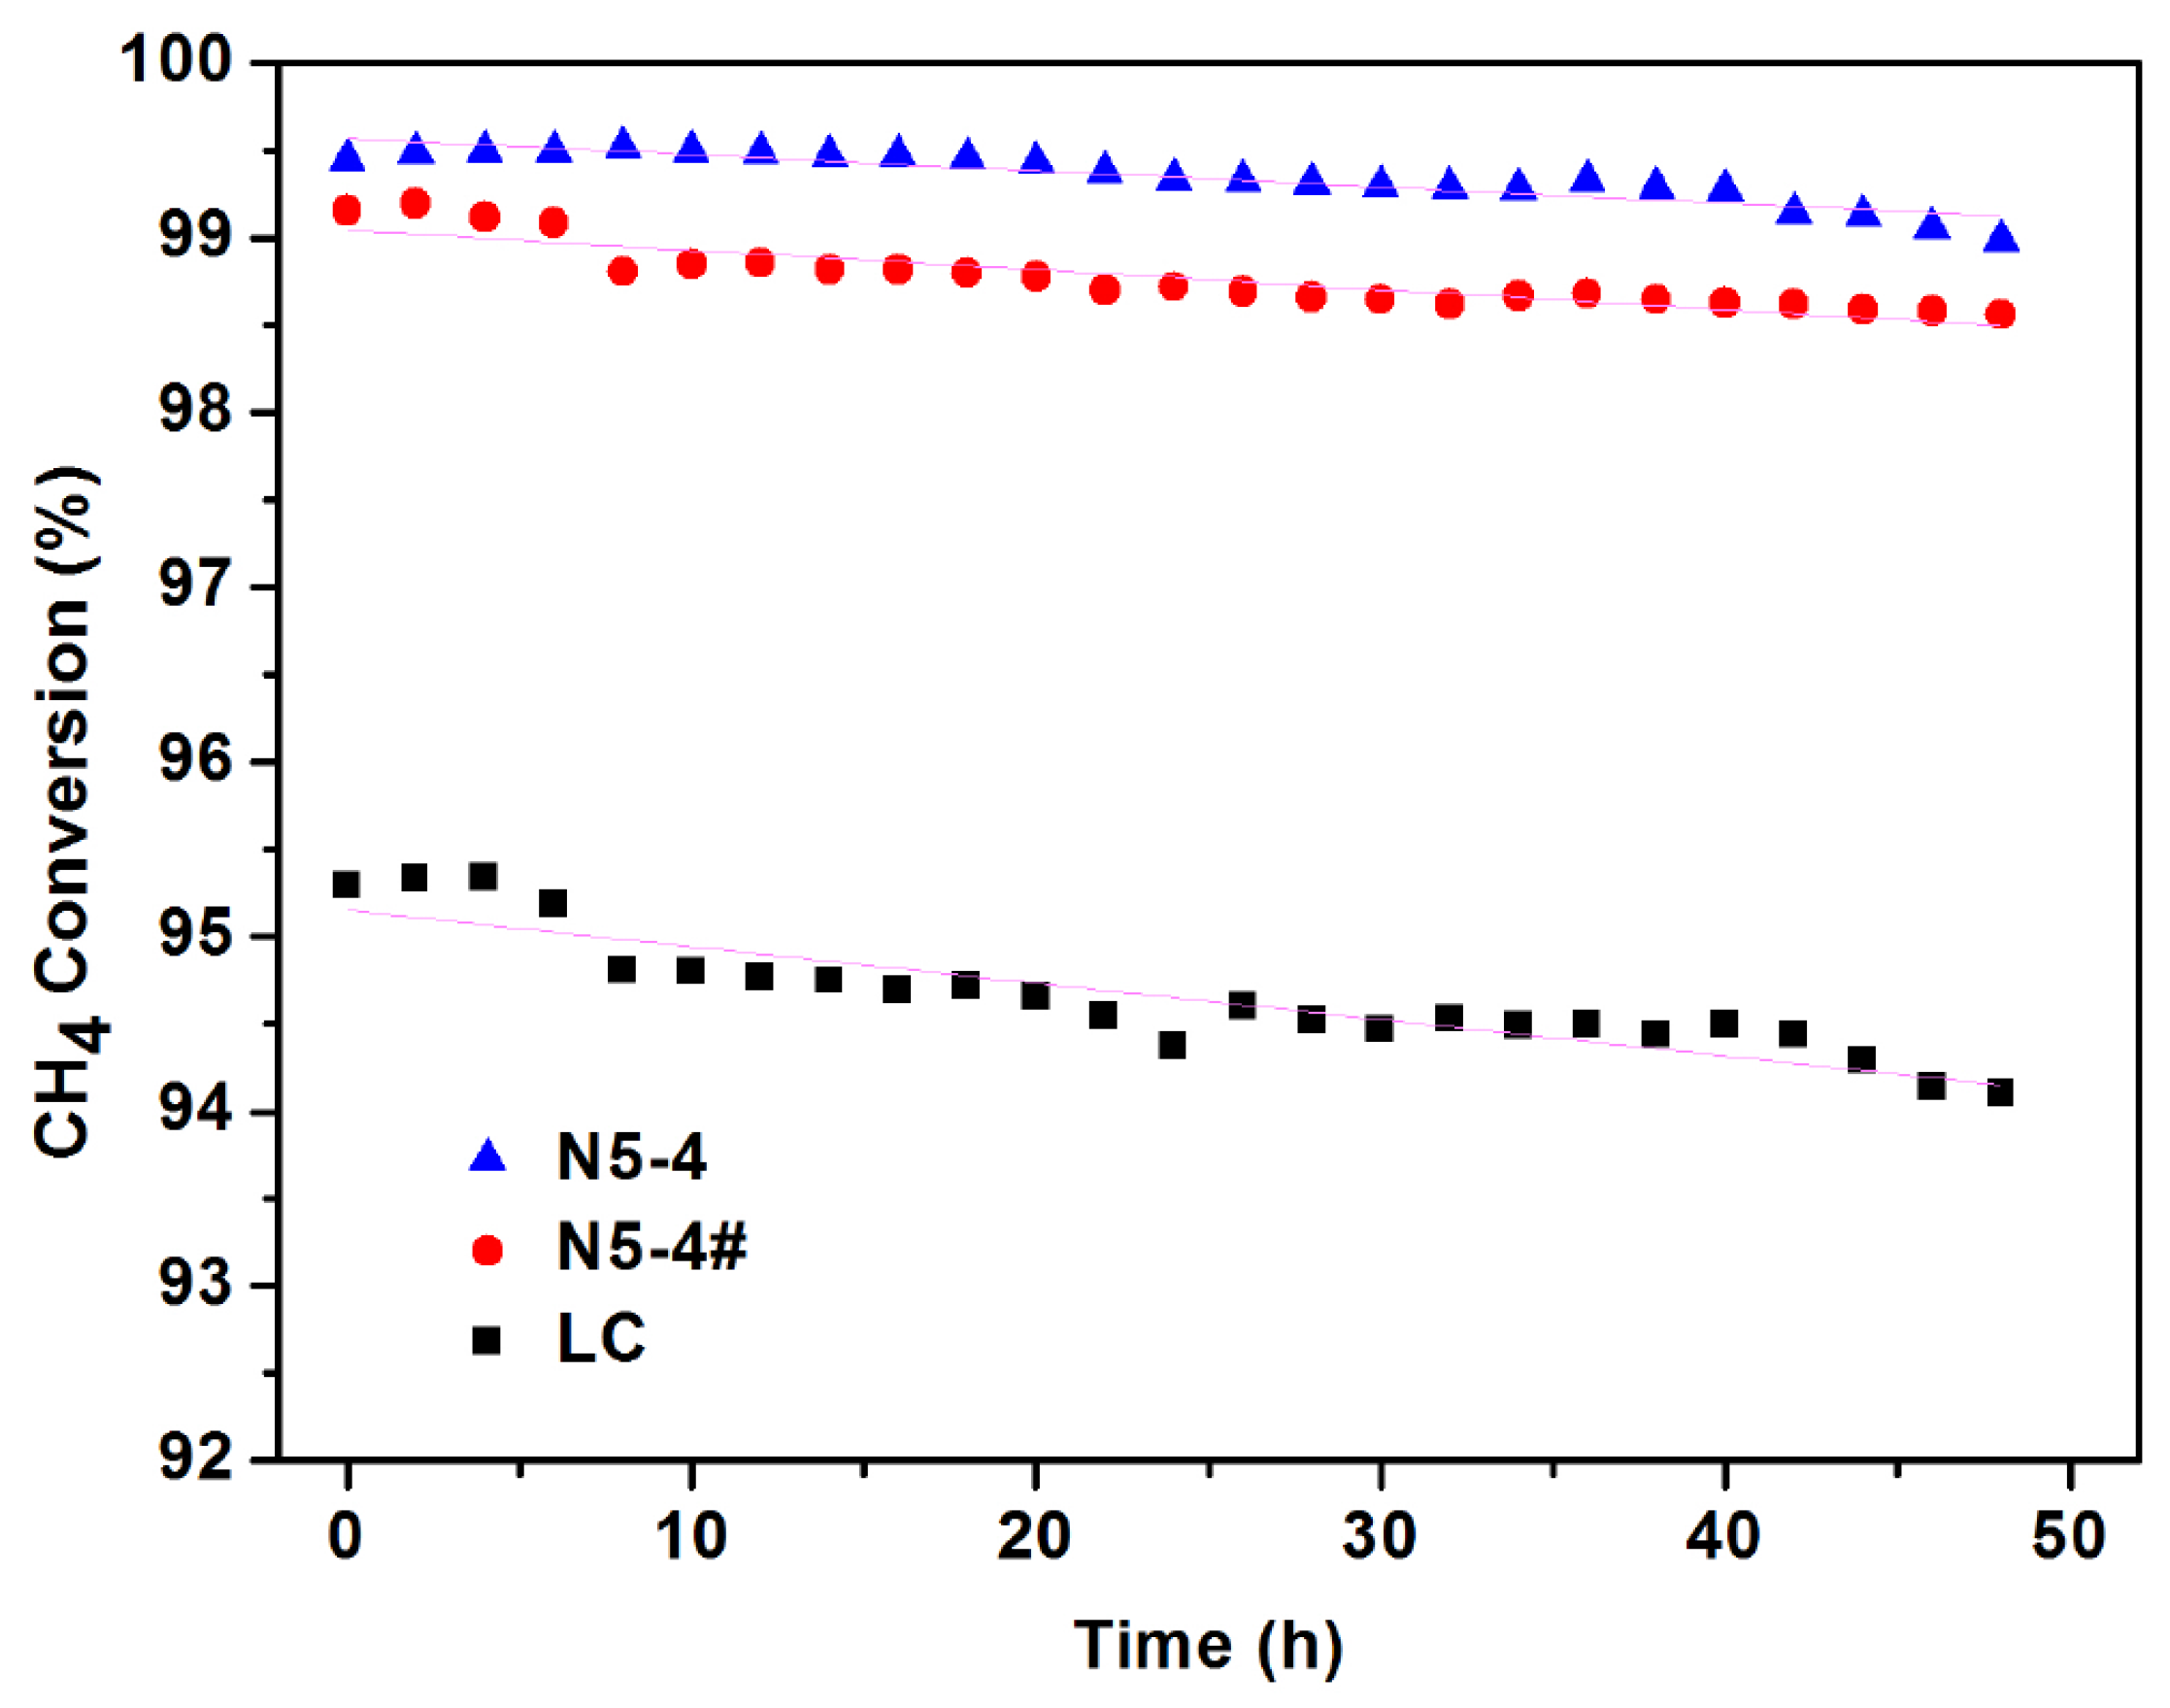
2.5. Catalyst Stability Test

Perform a 48 h stability test on LC, LC-SH4, and LC-SH4# that graphene free contrasting to LC-SH4. In order to investigate the influence of graphene oxide on the thermal stability of catalytic composite materials, the stability test results of three kinds of catalytic materials is shown in Figure 13, the fitting formulas are as follows:
LC: η = 95.152 − 0.021 T
LC-SH4#: η = 99.047 − 0.012 T
LC-SH4: η = 99.570 − 0.009 T
η: the methane conversion rate, T: the extension of test time at 600 °C.
With the extension of test time, the catalytic activity of methane decreased in three kinds of catalytic materials, but the degree of reduction was different. The methane conversion rates of LC, LC-SH4, and LC-SH4# were obviously decreased by 1.01%, 0.43%, and 0.58% after 48 h when compared with the original rates, respectively. It is obviously that LC-SH4 has higher catalytic activity and thermal stability, mainly because the nitrogen modification changes the crystal structure of the catalytic material particles resulting in smaller active component particle size and more uniform scattered. The addition of GO can improve the catalytic activity, which is mainly because the special structure of the large specific surface area of the GO is beneficial to the dispersion of the catalytic material and to prevent the agglomeration at high temperature.
High temperature sintering agglomeration is the main reason for the high temperature stability of the catalytic material. Table 5 also shows that the nitrogen modification and the addition of graphene can improve the thermal stability of the catalytic material during LC-SH4 hydrothermal treatment.

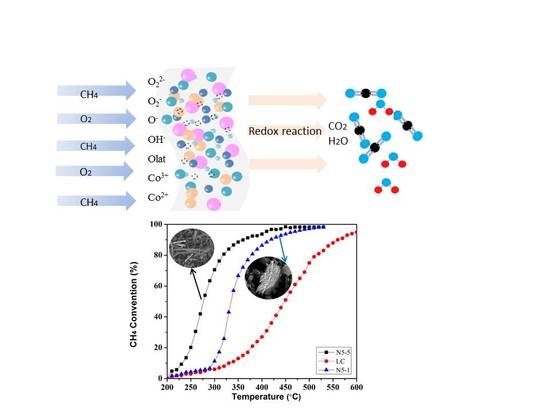
2.6. Mechanism Analysis

2.6.1. Preparation Mechanism

Based on the above studies, we can predict the complex reaction of LaCoO3, GO, and nitrogen in the hydrothermal process.
On the one hand, La3+ and Co3+ ions are leached from LaCoO3 during hydrothermal process. Semicarbazide hydrochloride generates large amounts of NH3 and CO2NH3 and CO2 in solution gradually produce CO32− and OH. LaCO3OH further forms with La3+, CO32−, and OH. As the following reaction:
NH3 + H2O → 2OH + NH4+
2OH + CO2 → CO32− + H2O
La3++ CO32− + OH → LaCO3OH
With the increase of the addition amount, the morphology of LaCO3OH changed from sheet to rod [34,35].
On the other hand, the smaller and more dispersed Co3O4 gradually appeared in the mixed solution and grew uniformly. LaCO3OH and Co3O4 gradually attached to the GO.

2.6.2. Reaction Mechanism

Figure 14 reported the DRIFT spectra of surface species maintained in a flow of CH4 and O2 through the LC-SH4 catalyst. In the case of CH4 and O2, the adsorption peaks (3016 and 1304 cm−1) of CH4 were observed at lower temperatures, and their strength gradually increases with the increasing temperature, indicating that the oxidation rate of CH4 increases gradually. At a low temperature, it follows that the weak absorption peak at around 1550 cm−1 is attributed to the asymmetric stretching vibration of the adsorbed formate (formyl). With the increase of temperature, the peak migrates to 1507 cm−1 and the peak intensity strengthens, which can be attributed to the adsorption of carbonate (formyl) asymmetric stretching vibration. At the same time, a weak absorption peak appears at 1083 cm−1, indicating that the transition from formate to carbonate is related to the change of cobalt valence ions. A negative peak were observed in the range between 2400–2200 cm−1 at low temperature, whereas a more obvious broad absorption peak at 300 °C corresponding to an asymmetric stretching vibration peak of CO2, indicating that CO2 is generated during the reaction. The absorption peak (−870 cm−1) can be attributed to the superoxide species O2− formed by the adsorption of O2 on the surface of the catalyst. After the appearance of superoxide species, the CO2 peak was enhanced, indicating that the superoxide species played a key role in the methane oxidation process. The absorption peaks at 3445 cm−1 and 3590 cm−1 are gradually strengthened, which is attributed to the hydroxyl stretching vibration peaks of the catalyst surface and the multiple coordination, presumed to be generated in the reaction water or hydroxyl adsorption on the catalyst surface.
To sum up, in the process of methane catalytic reaction, the surface reactions of composite catalysts are as follows:
CH4 move to the surface of the composite catalysts by heat and reacts with the surface oxygen species to form a methyl group adsorbed on the surface and form oxygen vacancies simultaneously:
CH4 + Oads → (-CH3)ads + (-OH)ads + *
The adsorbed methyl is further oxidized by surface oxygen species to form formate, while oxygen vacancies are generated continuously:
(-CH3)ads + Oads → (-CO)ads + (-OH)ads + *
A part of formate is directly oxidized to CO2 and desorbed from the surface of the composite catalysts into the gas phase:
(-CO)ads + Oads → CO2 + *
As the temperature increases, other formate species change into adsorbed carbonate species, which eventually produce CO2 and H2O into the gas phase:
(-CO)ads + Oads → (-CO3)ads + (-OH)ads + *
(-CO)ads + Co3+ → (-CO3)ads + Co2+ + *
(-CO)ads + Co2+ → (-CO3)ads + Co0 + *
(-CO3)ads + Oads → CO2 + *
(-OH)ads + Oads → H2O + *
During the whole reaction process, oxygen vacancies adsorb oxygen in the gas to form surface oxygen. At the same time, the lattice oxygen moves to the surface to form surface oxygen, and the low valence cobalt is oxidized by gas-phase oxygen to form a high valence state:
* + O2 → Oads
Oads ↔ Olat
Co0 + O2 → Co2+
Co2+ + O2 → Co3+
Note: *—oxygen vacancies, ads—adsorbed states, lat—attics.

3. Experimental

3.1. Catalyst Preparation

LaCoO3 perovskite catalyst was synthesized by the citric acid sol-gel method and named as LC [36]. Stoichiometric amounts of metal nitrates(La(NO3)3·6H2O, Co(NO3)2·6H2O)and citric acid were mixed in an aqueous solution .The solution was stirring at 80 °C until the formation of wet gel, and the wet gel let stand at room temperature for 24 h. The aged wet gel was dried overnight and crushed and calcinated in the muffle furnace at 700 °C for 5 h. As a catalytic activity comparison, LaCo3OH was synthesized by a one-step hydrothermal method, named as LCH [33].
GO was prepared by the modified Hummers method [37]. Nitrogen-modified perovskite type composite catalysts with different nitrogen sources (urea, biuret, melamine, carbohydrazide, and semicarbazide hydrochloride; m(semicarbazide hydrochloride)/m(LC) = 3, as-prepared catalysts with the same nitrogen element adding were named as LC-U, LC-B, LC-M, LC-C, and LC-SH, respectively) or different nitrogen source addition (0.75, 1.5, 2.25, 3, and 3.75 times of LC, as-prepared catalysts were named as LC-SH1, LC-SH2, LC-SH3, LC-SH4, and LC-SH5, respectively) and LC were synthesized by the hydrothermal synthesis.
For nitrogen-modified perovskite type composite catalysts, a certain amount of graphene oxide dissolved in 60 mL deionized water with ultrasonic dispersion for 30 min; the certain proportion of lanthanum cobaltate and nitrogen sources were slowly added to the graphene suspension with ultrasonic and stirring for 30 min at room temperature; Then the obtained mixture solution was transferred to a 200 mL Teflon-lined stainless-steel autoclave and and deionized water was added until the volum of Teflon-lined was 80% .The autoclave was kept at 180 °C for 24 h; the catalyst slurry was filtered to obtain filter cake, using deionized water repeated washing until pH = 7; the filter cake was dried at 80 °C overnight. That is nitrogen-modified perovskite type composite catalysts.

3.2. Catalyst Characterization

The crystal structure and composition of the catalysts were performed on an X-ray diffractometer (XRD, BRUKER D8 FOCUS, Bruker Biosciences Corporation, Billerica, MA, USA) with Cu Kα radiation (λ = 1.540598 Å) at a scan speed of 3°·min−1. The morphology of catalysts was studied by scanning electron microscopy (SEM, Hitachi S-4800, Hitachi Limited, Tokyo, Japan) using accelerating voltages of 10 kV. The specific surface area was examined on the Brunauer-Emmett-Teller (BET) method by N2 adsorption in an ASAP-2010 specific surface area analyser (Micromeritics Instrument Ltd, Norcross, GA, USA). X-ray photoelectron spectra (XPS) measurements were determined by K-Alpha spectrometer (Thermo Fisher Scientific, Waltham, MA, USA), using Al Kα radiation as the X-ray source. Hydrogen temperature-programmed reductions (H2-TPR) of the catalysts were conducted on a Micromeritics Company Auto Chem. II 2920 (Micromeritics Instrument Ltd., Norcross, GA, USA), equipped with a thermal conductivity detector(TCD) detector, temperature from room temperature to 1000 °C, heating rate 10 °C min−1.

3.3. Catalytic Evaluation

The catalytic oxidation reaction of CH4 was carried out by the self-built atmospheric continuous reaction device. The feed gas (1% methane, 99% air, CH4/O2 = 4.8%) was passed through 100 mg catalyst (particle size 0.35–0.50 mm). For the activity tests, 100 mg catalyst was used with a weight hourly space velocity (WHSV) = 10,000 mL·g−1·h−1. Prior to the activity test, the catalysts were kept with the feed gas by heating to 200 °C at a heating rate of 10 °C/min for 1.5 h. The activities were measured by heating from 200–600 °C at a heating rate of 1 °C /min. The reactants and reaction products were alternately analyzed by GC7900 gas chromatography online, equipped with hydrogen flame (FID), high pure N2 as carrier gas. The column oven temperature is 190 °C, injector temperature is 200 °C, and the detector temperature is 200 °C. The conversion of methane was evaluated based on the calculation formula, as follows:
η = (SCH4 − S′CH4)/SCH4
SCH4 and S′CH4 refer to CH4 concentrations in the feed and effluent stream, respectively.

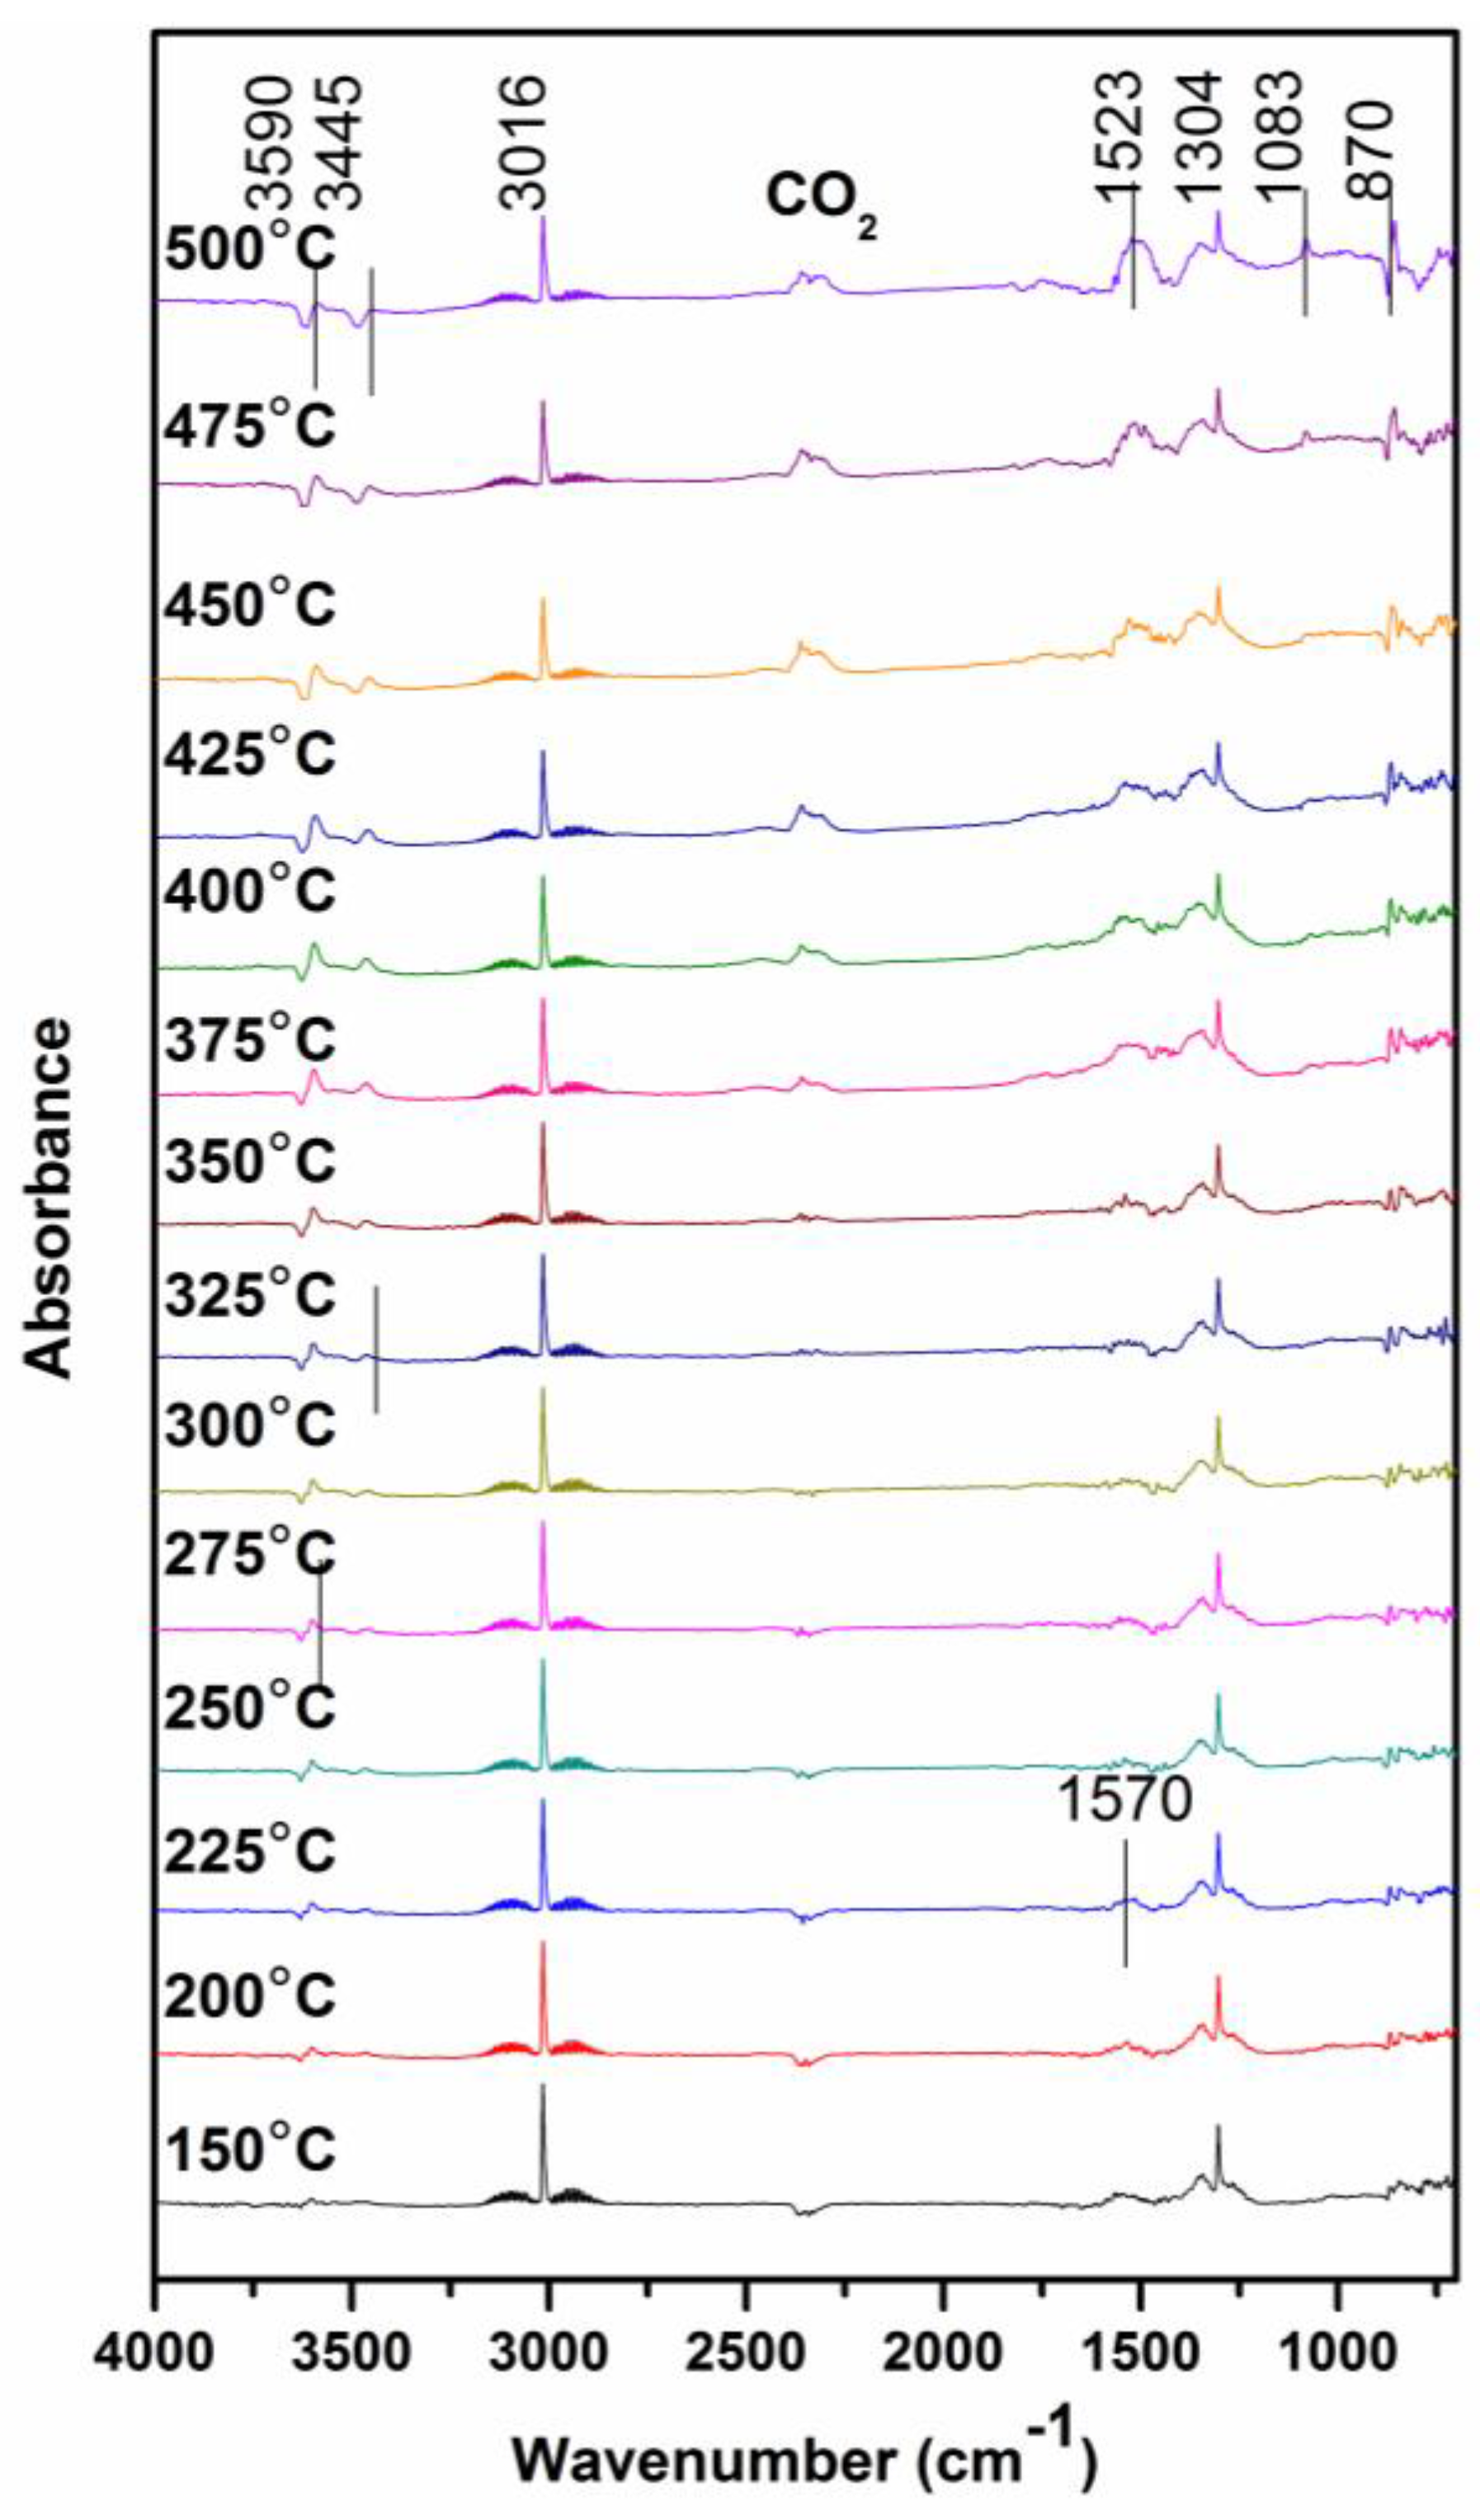
3.4. In Situ FITR Spectroscopy

Spectra were recorded using a TENSOR II Fourier infrared spectrometer (Bruker Biosciences Corporation, Billerica, MA, USA) equipped with the liquid N2 cooled a photoconductive (MCT) detector. Spectra were obtained with a resolution of 4 cm−1 and by averaging 16 scans. In situ diffuse reflection FTIR spectra were collected during 150~500 °C with every 25 °C. The steady state test conditions are as follows: An appropriate amount of catalyst powder is loaded into an infrared reaction cell. Then, the loaded sample was pre-treated at 400 °C in N2 for 1h aiming to remove surface impurities. The background spectrum was of the sample after cooling to 150 °C in N2. Adsorption of CH4 + O2 was achieved by following 100 mL/min of 1% CH4 and 5% O2 (Nitrogen as equilibrium gas) over the sample pellet for 20 min. The temperature was increased from 150–500 °C at a heating rate of 1 °C/min. In situ diffuse reflection FTIR spectra were collected during 150~500 °C, with every 25 °C.

4. Conclusions

The composite catalysts have been prepared by the hydrothermal method of which the different kinds of nitrogen sources and the addition amount have important influences on the physical and chemical properties.
When the addition amount of semicarbazide hydrochloride is three times of LaCoO3, the morphology of the catalysts changes from lamellar to fibrous structures and the catalysts display high surface oxygen content (44.06%), high Co3+/Co2+ (1.39), Oads/Olat (15.18), and the best catalytic performance: the temperatures required for achieving methane conversion of 50% and 90% are 277 and 360 °C, respectively. The stability test shows that the semicarbazide hydrochloride modification can effectively improve the stability of the composite catalysts.
Moreover, the in situ DRIFTS were applied to elucidate the efficient for CH4 removal and can also further explain the surface reaction mechanism of the composite catalysts during the methane catalytic combustion. Adsorbed formates are formed through the reaction of methane molecules and the surface oxygen species of the composite catalysts material; then, adsorbed carbonate is formed through the reaction of adsorbed formates and the surface active cobalt. The product continues to be oxidized to form CO2 and a large amount of oxygen vacancies; oxygen vacancy change to a new surface active oxygen via the migration of adsorption gas phase oxygen and lattice oxygen to the surface.

Acknowledgments

This work described above was financially supported by national key R&D Program of China (NO.: 2017YFB0310802).

Author Contributions

Miaomiao Li and Peng Gui conceived and designed the experiments; Peng Gui and Luning Zheng performed the experiments; Miaomiao Li and Jiaang Li analyzed the data; Miaomiao Li wrote the paper. Gang Xue and Jinsheng Liang instructed experimental design and article writing.

Conflicts of Interest

The authors declare no conflict of interest.

References

  1. Chen, J.H.; Arandiyan, H.; Gao, X.; Li, J.H. Recent advances in catalysts for methane combustion. Catal. Surv. Asia 2015, 19, 140–171. [Google Scholar] [CrossRef]
  2. Li, X.Y.; Liu, Y.X.; Deng, J.G.; Xie, S.H.; Zhao, X.T.; Zhang, Y.; Zhang, K.F.; Arandiyan, H.; Guo, G.S.; Dai, H.X. Enhanced catalytic performance for methane combustion of 3DOM CoFe2O4 by co-loading MnOx and Pd–Pt alloy nanoparticles. Appl. Surf. Sci. 2017, 403, 590–600. [Google Scholar] [CrossRef]
  3. Zuo, X.L.; Rui, Z.H.; Ji, B. Core-shell NiO@PdO nanoparticles supported on alumina as an advanced catalyst for methane oxidation. ACS Catal. 2017, 403, 590–600. [Google Scholar]
  4. Xu, P.; Wu, Z.X.; Deng, J.G.; Liu, Y.X.; Xie, S.H.; Guo, G.S.; Dai, H.X. Catalytic performance enhancement by alloying Pd with Pt on ordered mesoporous manganese oxide for methane combustion. Chin. J. Catal. 2017, 38, 92–105. [Google Scholar] [CrossRef]
  5. Tacchino, S.; Vella, L.D.; Specchia, S. Catalytic combustion of CH4 and H2 into micro-monoliths. Catal. Today 2010, 157, 440–445. [Google Scholar] [CrossRef]
  6. Gholami, R.; Alyani, M.; Smith, K.J. Deactivation of Pd catalysts by water during low temperature methane oxidation relevant to natural gas vehicle converters. Catalysts 2015, 5, 561–594. [Google Scholar] [CrossRef]
  7. Benedetto, A.D.; Landi, G.; Sarli, V.D. Methane catalytic combustion under pressure. Catal. Today 2012, 197, 206–213. [Google Scholar] [CrossRef]
  8. Barbato, P.S.; Benedetto, A.D.; Sarli, V.D. High-pressure methane combustion over a perovskite catalyst. Ind. Eng. Chem. Res. 2012, 51, 7547–7558. [Google Scholar] [CrossRef]
  9. Arandiyan, H.; Scott, J.; Yuan, W. Meso-molding three-dimensional macroporous perovskites: A new approach to generate high-performance nanohybrid catalysts. ACS Appl. Mater. Interfaces 2016, 8, 2457–2463. [Google Scholar] [CrossRef] [PubMed] [Green Version]
  10. Zhao, K.; He, F.; Huang, Z.; Zheng, A.Q.; Li, H.B.; Zhao, Z.L. La1−xSrxFeO3 perovskites as oxygen carriers for the partial oxidation of methane to syngas. Chin. J. Catal. 2014, 35, 1196–1205. [Google Scholar] [CrossRef]
  11. Xue, G.; Zhao, Y.; Liang, J.S.; Yuan, Y.K.; Wang, S.F.; Chen, D. Properties of La0.9Sr0.1MnO3 and tourmaline compound catalytic materials for methane combustion. J. Rare Earths 2014, 32, 837–841. [Google Scholar] [CrossRef]
  12. Peña, M.A.; Fierro, J.L.G. Chemical structures and performance of perovskite oxides. Chem. Rev. 2001, 101, 1981–2017. [Google Scholar] [CrossRef] [PubMed]
  13. Huang, K.; Chu, X.F.; Feng, W.C.; Zhou, C.P.; Wu, X.F.; Yuan, L.; Feng, S.H. Catalytic behavior of electrospinning synthesized La0.75Sr0.25MnO3, nanofibers in the oxidation of CO and CH4. Chem. Eng. J. 2014, 244, 27–32. [Google Scholar] [CrossRef]
  14. Ritzmann, A.; Pavone, M.; Munozgarcia, A.; Keith, J.; Carter, E. Ab initio DFT+U analysis of oxygen transport in LaCoO3: The effect of Co3+ magnetic states. J. Mater. Chem. A 2014, 2, 8060–8074. [Google Scholar] [CrossRef]
  15. Sadykov, V.A.; Sazonova, N.N.; Bobin, A.S.; Bobin, V.S.; Muzykantov, V.S.; Gubanova, E.L.; Alikina, G.M.; Lukashevich, A.I.; Rogov, V.A.; Ermakova, E.N.; et al. Partial oxidation of methane on Pt-supported lanthanide doped ceria–zirconia oxides: Effect of the surface/lattice oxygen mobility on catalytic performance. Catal. Today 2011, 169, 125–137. [Google Scholar] [CrossRef]
  16. Arandiyan, H.; Dai, H.; Deng, J. Dual-templating synthesis of three-dimensionally ordered macroporous La0.6Sr0.4MnO3-supported Ag nanoparticles: Controllable alignments and super performance for the catalytic combustion of methane. Chem. Commun. 2013, 49, 10748–10750. [Google Scholar] [CrossRef] [PubMed]
  17. Yu, Z.B.; Yin, L.C.; Xie, Y.P.; Liu, G.; Ma, X.L.; Cheng, H.M.; Yu, Z.; Yin, L.C.; Xie, Y. Crystallinity-dependent substitutional nitrogen doping in ZnO and its improved visible light photocatalytic activity. J. Colloid Interface Sci. 2013, 400, 18–23. [Google Scholar] [CrossRef] [PubMed]
  18. Hua, Z.L.; Zhang, X.Y.; Bai, X.; Lv, L.L.; Ye, Z.F.; Huang, X. Nitrogen-doped perovskite-type La2Ti2O7 decorated on graphene composites exhibiting efficient photocatalytic activity toward bisphenol A in water. J. Colloid Interface Sci. 2015, 450, 45–53. [Google Scholar] [CrossRef] [PubMed]
  19. Shen, J.; Li, T.; Shi, M. Polyelectrolyte-assisted one-step hydrothermal synthesis of Ag-reduced graphene oxide composite and its antibacterial properties. Mater. Sci. Eng. C 2012, 32, 2042–2047. [Google Scholar] [CrossRef]
  20. Gao, W.; Majumder, M.; Alemany, L.B. Engineered graphite oxide materials for application in water purification. ACS Appl. Mater. Interfaces 2011, 3, 1821–1826. [Google Scholar] [CrossRef] [PubMed]
  21. Wang, S.; Xue, G.; Liang, J. Promotional effect of graphite oxide on surface properties and catalytic performance of La1−xSrxMnO3, (x = 0,0.1) for methane combustion. Catal. Commun. 2014, 45, 39–43. [Google Scholar] [CrossRef]
  22. Long, Y.; Zhang, C.; Wang, X. Oxidation of SO2 to SO3 catalyzed by graphene oxide foams. J. Mater. Chem. 2011, 21, 13934–13941. [Google Scholar] [CrossRef]
  23. Zahed, B.; Hosseini-Monfared, H. A comparative study of silver-graphene oxide nanocomposites as a recyclable catalyst for the aerobic oxidation of benzyl alcohol: Support effect. Appl. Surf. Sci. 2015, 328, 536–547. [Google Scholar] [CrossRef]
  24. Nie, R.F.; Shi, J.J.; Du, W.C.; Ning, W.S.; Hou, Z.Y.; Xiao, F.S. A sandwich N-doped graphene/Co3O4 hybrid: An efficient catalyst for selective oxidation of olefins and alcohols. J. Mater. Chem. A 2013, 1, 9037–9045. [Google Scholar] [CrossRef]
  25. Djinović, P.; Črnivec, I.G.O.; Erjavec, B.; Albin, P. Influence of active metal loading and oxygen mobility on coke-free dry reforming of Ni-Co bimetallic catalysts. Appl. Catal. B Environ. 2012, 125, 259–270. [Google Scholar] [CrossRef]
  26. Ji, K.M.; Dai, H.X.; Deng, J.G.; Li, X.W.; W, Y.; Gao, B.Z.; Bai, G.M.; Au, C.T. A comparative study of bulk and 3DOM-structured Co3O4, Eu0.6Sr0.4FeO3, and Co3O4/Eu0.6Sr0.4FeO3: Preparation, characterization, and catalytic activities for toluene combustion. Appl. Catal. A Gen. 2012, 447, 41–48. [Google Scholar] [CrossRef]
  27. Royer, S.; Duprez, D.; Kaliaguine, S. Oxygen mobility in LaCoO3 perovskites. Catal. Today 2006, 112, 99–102. [Google Scholar] [CrossRef]
  28. Huang, L.; Bassir, M.; Kaliaguine, S. Reducibility of Co3+ in perovskite-type LaCoO3 and promotion of copper on the reduction of Co3+ in perovskite-type oxides. Appl. Surf. Sci. 2005, 243, 360–375. [Google Scholar] [CrossRef]
  29. Wu, Z.X.; Deng, J.G.; Liu, Y.X.; Xie, S.H.; Jiang, Y.; Zhao, X.T.; Yang, J.; Arandiyan, H.; Guo, G.S.; Dai, H.X. Three-dimensionally ordered mesoporous Co3O4-supported Au–Pd alloy nanoparticles: High-performance catalysts for methane combustion. J. Catal. 2015, 332, 13–24. [Google Scholar] [CrossRef]
  30. Lu, J.; Song, J.J.; Niu, H.; Pan, L.; Zhang, X.W.; Wang, L.; Zou, J.J. Periodic density functional theory study of ethylene hydrogenation over Co3O4 (111) surface: The critical role of oxygen vacancies. Appl. Surf. Sci. 2016, 371, 61–66. [Google Scholar] [CrossRef]
  31. Li, H.F.; Lu, G.Z.; Qiao, D.S.; Wang, Y.Q.; Guo, Y.; Guo, Y.L. Catalytic methane combustion over Co3O4/CeO2 composite oxides prepared by modified citrate sol-gel method. Catal. Lett. 2011, 141, 452–458. [Google Scholar] [CrossRef]
  32. Petkovic, L.M.; Utgikar, V.; Rashkeev, S.N. Structural stability and catalytic activity of lanthanum-based perovskites. J. Phys. Chem. C 2011, 115, 8709–8715. [Google Scholar] [CrossRef]
  33. Pan, B.; Xie, Q.H.; Wang, H.M.; Wang, X.X. Synthesis and photocatalytic hydrogen production of a novel photocatalyst LaCO3OH. J. Mater. Chem. A 2013, 1, 6629–6634. [Google Scholar] [CrossRef]
  34. Han, Z.H.; Guo, N.; Tang, K.B. Hydrothermal crystal growth and characterization of cerium hydroxycarbonates. J. Cryst. Growth 2000, 219, 315–318. [Google Scholar] [CrossRef]
  35. Han, Z.; Yang, Q.; Lu, G.Q. Crystalline lanthanum hydroxycarbonates with controlled phases and varied morphologies prepared on non-crystalline substrates. J. Solid State Chem. 2004, 177, 3709–3714. [Google Scholar] [CrossRef]
  36. Ivanov, D.V.; Sadovskaya, E.M.; Pinaeva, L.G.; Isupova, L.A. Influence of oxygen mobility on catalytic activity of La-Sr-Mn-O composites in the reaction of high temperature LC-BO decomposition. J. Catal. 2009, 267, 5–13. [Google Scholar] [CrossRef]
  37. Hummers, W.S.; Offeman, R.E. Preparation of graphitic oxide. J. Am. Chem. Soc. 1958, 80, 1339. [Google Scholar] [CrossRef]
Figure 1. Effects of different nitrogen sources on catalytic activity of catalysts.
Catalysts 08 00125 g001
Figure 2. Effects of different amounts of nitrogen on catalytic activity of catalysts.
Catalysts 08 00125 g002
Figure 3. X-ray diffractometer (XRD) pattern of catalysts with different nitrogen sources.
Catalysts 08 00125 g003
Figure 4. Scanning electron microscopy (SEM) photos of catalysts with different nitrogen sources. (a) LC-U; (b) LC-B; (c) LC-M; (d) LC-C; (e) and, (f) LC-SH.
Catalysts 08 00125 g004
Figure 5. XRD pattern of catalysts with different amounts of nitrogen.
Catalysts 08 00125 g005
Figure 6. SEM Photo of catalysts with different amounts of nitrogen. (a) LC-SH-1; (b) LC-SH-2; (c) LC-SH-3; and, (d) LC-SH-4.
Catalysts 08 00125 g006
Figure 7. Co 2p X-ray photoelectron spectra (XPS) spectra of catalysts with different nitrogen sources. (a) LC-U; (b) LC-B; (c) LC-M; (d) LC-C; and, (e) LC-SH.
Catalysts 08 00125 g007
Figure 8. O 1s XPS spectra of catalysts with different nitrogen sources. (a) LC-U; (b) LC-B; (c) LC-M; (d) LC-C; and, (e) LC-SH.
Catalysts 08 00125 g008
Figure 9. Co 2p XPS spectra of catalysts with different amounts of nitrogen. (a) LC-SH1; (b) LC-SH2; (c) LC-SH3; and, (d) LC-SH4.
Catalysts 08 00125 g009
Figure 10. O 1s XPS spectra of catalysts with different amounts of nitrogen. (a) LC-SH1; (b) LC-SH2; (c) LC-SH3; and, (d) LC-SH4.
Catalysts 08 00125 g010
Figure 11. Hydrogen temperature-programmed reductions (H2-TPR) figures of catalysts with different nitrogen sources.
Catalysts 08 00125 g011
Figure 12. H2-TPR figures of catalysts with different amounts of nitrogen sources.
Catalysts 08 00125 g012
Figure 13. The stability test of LC, LC-SH-4, and LC-SH-4#.
Catalysts 08 00125 g013
Figure 14. In situ DRIFTS spectra of micro steady state.
Catalysts 08 00125 g014
Table 1. Brunauer-Emmett-Teller (BET) results of catalysts with different nitrogen sources.
SamplesSpecific Surface Area (m2/g)Pore Volume (cm3/g)Average Pore Size (nm)
LC10.110.0178.86
LC-U12.000.0309.91
LC-B14.870.0369.27
LC-M10.370.0429.82
LC-C10.370.0469.86
LC-SH26.450.1299.89
Table 2. BET results of catalysts with different amounts of nitrogen.
SamplesSpecific Surface Area (m2/g)Pore Volume (cm3/g)Average Pore Size (nm)
LC-SH-112.620.0898.94
LC-SH-215.780.0997.73
LC-SH-320.370.1048.90
LC-SH-426.450.1299.89
LC-SH-510.130.0747.14
Table 3. Surface atomic concentration of catalysts with different nitrogen sources.
SamplesLa (%)Co (%)O (%)C (%)
LC-U1.972.7531.5163.77
LC-B3.282.6734.0659.99
LC-M1.754.8633.5858.99
LC-C6.881.2745.7146.14
LC-SH43.555.7335.4155.31
Table 4. Surface atomic concentration of the catalysts with different amounts of nitrogen.
SamplesLa (%)Co (%)O (%)C (%)
LC-SH16.807.0940.9145.20
LC-SH25.667.0740.5746.71
LC-SH35.851.8737.6854.60
LC-SH43.555.7335.4155.31
Table 5. BET results of LC, LC-SH-4, and LC-SH-4# (fresh and used).
SamplesSpecific Surface Area (m2/g)Pore Volume (cm3/g)Average Pore Size (nm)
LC-fresh10.110.0178.86
LC-used4.460.0039.87
LC-SH4-fresh26.450.1299.89
LC-SH4-used24.670.09110.09
LC-SH4#-fresh21.000.08111.77
LC-SH4#-used19.380.03312.13

