Review

Kinetic Modeling of Catalytic Olefin Cracking and Methanol-to-Olefins (MTO) over Zeolites: A Review

by
Sebastian Standl
1,2,* and
Olaf Hinrichsen
1,2
1
Department of Chemistry, Technical University of Munich, Lichtenbergstraße 4, 85748 Garching near Munich, Germany
2
Catalysis Research Center, Technical University of Munich, Ernst-Otto-Fischer-Straße 1, 85748 Garching near Munich, Germany
*
Author to whom correspondence should be addressed.
Catalysts 2018, 8(12), 626; https://doi.org/10.3390/catal8120626
Submission received: 2 November 2018 / Revised: 26 November 2018 / Accepted: 27 November 2018 / Published: 5 December 2018

Abstract

:
The increasing demand for lower olefins requires new production routes besides steam cracking and fluid catalytic cracking (FCC). Furthermore, less energy consumption, more flexibility in feed and a higher influence on the product distribution are necessary. In this context, catalytic olefin cracking and methanol-to-olefins (MTO) gain in importance. Here, the undesired higher olefins can be catalytically converted and, for methanol, the possibility of a green synthesis route exists. Kinetic modeling of these processes is a helpful tool in understanding the reactivity and finding optimum operating points; however, it is also challenging because reaction networks for hydrocarbon interconversion are rather complex. This review analyzes different deterministic kinetic models published in the literature since 2000. After a presentation of the underlying chemistry and thermodynamics, the models are compared in terms of catalysts, reaction setups and operating conditions. Furthermore, the modeling methodology is shown; both lumped and microkinetic approaches can be found. Despite ZSM-5 being the most widely used catalyst for these processes, other catalysts such as SAPO-34, SAPO-18 and ZSM-23 are also discussed here. Finally, some general as well as reaction-specific recommendations for future work on modeling of complex reaction networks are given.

1Introduction3
2Theoretical Background5
2.1Thermodynamics . . . . . . . . . . . . . . . . . . . . . . . . . . . . . . . . . . . . . . . . .5
2.2Kinetic Modeling . . . . . . . . . . . . . . . . . . . . . . . . . . . . . . . . . . . . . . . . .8
2.3Zeolites . . . . . . . . . . . . . . . . . . . . . . . . . . . . . . . . . . . . . . . . . . . . . . .12
2.4Reaction Mechanisms . . . . . . . . . . . . . . . . . . . . . . . . . . . . . . . . . . . . . . .13
2.4.1Olefin Cracking . . . . . . . . . . . . . . . . . . . . . . . . . . . . . . . . . . . . . .13
2.4.2Methanol-to-Olefins . . . . . . . . . . . . . . . . . . . . . . . . . . . . . . . . . . .14
3Kinetic models for Olefin Cracking16
3.1Studies Focusing on Olefin Interconversion over ZSM-5 . . . . . . . . . . . . . . . . . . .19
3.1.1Epelde et al.: Eight- and Five-Lump Approach for C 4 = Feeds at Elevated Partial Pressures . . . . . . . . . . . . . . . . . . . . . . . . . . . . . . . . . . . . . . . . . .19
3.1.2Ying et al.: Eight-Lump Model for Arbitrary Olefin Feeds Including Side Product Formation . . . . . . . . . . . . . . . . . . . . . . . . . . . . . . . . . . . . . . . . .22
3.1.3Huang et al.: Six-Lump Approach for Arbitrary Olefin Feeds Including LH and HW Types of Mechanism . . . . . . . . . . . . . . . . . . . . . . . . . . . . . . . .24
3.1.4Summary . . . . . . . . . . . . . . . . . . . . . . . . . . . . . . . . . . . . . . . .26
3.2Studies Focusing on Feed Olefin Consumption over ZSM-5 . . . . . . . . . . . . . . . . .27
3.2.1Borges et al.: Three-Lump Approach for Oligomerization of C 2 = to C 4 = Feed Olefins27
3.2.2Oliveira et al.: 17-Lump Model for C 2 = to C 4 = Feeds Considering Heterogeneity in Acid Sites . . . . . . . . . . . . . . . . . . . . . . . . . . . . . . . . . . . . . . . .28
3.2.3Summary . . . . . . . . . . . . . . . . . . . . . . . . . . . . . . . . . . . . . . . .30
3.3Microkinetic Study over ZSM-5 . . . . . . . . . . . . . . . . . . . . . . . . . . . . . . . . .30
3.3.1von Aretin et al.: Model for Arbitrary Olefin Feeds Considering all Interconversion Steps with Maximum Carbon Number of Twelve . . . . . . . . .30
3.3.2Summary . . . . . . . . . . . . . . . . . . . . . . . . . . . . . . . . . . . . . . . .32
3.4Study Elucidating the Peculiarities over SAPO-34 . . . . . . . . . . . . . . . . . . . . . .32
3.4.1Zhou et al.: Eight-Lump Model for C 2 = to C 4 = Feeds Considering Side Product Formation . . . . . . . . . . . . . . . . . . . . . . . . . . . . . . . . . . . . . . . . .32
3.4.2Summary . . . . . . . . . . . . . . . . . . . . . . . . . . . . . . . . . . . . . . . .34
3.5Other Studies . . . . . . . . . . . . . . . . . . . . . . . . . . . . . . . . . . . . . . . . . . .34
4Kinetic Models for Methanol-to-Olefins without Olefin Co-Feed35
4.1Studies with Lumped Oxygenates over ZSM-5 . . . . . . . . . . . . . . . . . . . . . . . .38
4.1.1Menges and Kraushaar-Czarnetzki: Six-Lump Approach Focusing on Lower Olefins Production . . . . . . . . . . . . . . . . . . . . . . . . . . . . . . . . . . . .38
4.1.2Jiang et al.: Eight-Lump Model Including Side Product Formation . . . . . . . .39
4.1.3Summary . . . . . . . . . . . . . . . . . . . . . . . . . . . . . . . . . . . . . . . .41
4.2Studies with Differentiated Reactivity of Methanol and Dimethyl Ether over ZSM-5 . .41
4.2.1Gayubo et al.: Four-Lump Approach Analyzing the Inhibiting Effect of Water Adsorption . . . . . . . . . . . . . . . . . . . . . . . . . . . . . . . . . . . . . . . .41
4.2.2Aguayo et al.: Seven-Lump Model for Significant Side Product Formation and Resulting Interconversion Reactions . . . . . . . . . . . . . . . . . . . . . . . . . .43
4.2.3Pérez-Uriarte et al.: Eleven-Lump Approach for Dimethyl Ether Feeds . . . . . .46
4.2.4Summary . . . . . . . . . . . . . . . . . . . . . . . . . . . . . . . . . . . . . . . .49
4.3Microkinetic Studies over ZSM-5 . . . . . . . . . . . . . . . . . . . . . . . . . . . . . . . .49
4.3.1Park and Froment: Analysis of First C-C Bond Formation Mechanisms . . . . . .49
4.3.2Kumar et al.: Implementation of Aromatic Hydrocarbon Pool . . . . . . . . . . .51
4.3.3Summary . . . . . . . . . . . . . . . . . . . . . . . . . . . . . . . . . . . . . . . .52
4.4Studies with Significant Deactivation Effects over SAPO-34, SAPO-18 and ZSM-22 . . .52
4.4.1Gayubo et al.: Six- and Five-Lump Approach with and without Differentiation in Side Products over SAPO-34 . . . . . . . . . . . . . . . . . . . . . . . . . . . . .52
4.4.2Ying et al.: Seven-Lump Model with Subsequent Fitting of Deactivation Parameters over SAPO-34 . . . . . . . . . . . . . . . . . . . . . . . . . . . . . . . .55
4.4.3Chen et al.: Seven-Lump Model with Simultaneous Fitting of Deactivation Parameters over SAPO-34 . . . . . . . . . . . . . . . . . . . . . . . . . . . . . . . .57
4.4.4Alwahabi and Froment: Microkinetic Implementation over SAPO-34 . . . . . . .59
4.4.5Gayubo et al.: Four- and Five-Lump Approach Including Deactivation Parameters over SAPO-18 . . . . . . . . . . . . . . . . . . . . . . . . . . . . . . . .59
4.4.6Kumar et al.: Microkinetic Implementation over ZSM-22 . . . . . . . . . . . . . .61
4.4.7Summary . . . . . . . . . . . . . . . . . . . . . . . . . . . . . . . . . . . . . . . .62
4.5Other Studies . . . . . . . . . . . . . . . . . . . . . . . . . . . . . . . . . . . . . . . . . . .63
5Kinetic Models for Methanol-to-Olefins with Olefin Co-Feed63
5.1Huang et al.: Eight-Lump Approach Extending the Olefin Cracking Model to Methanol-to-Olefins . . . . . . . . . . . . . . . . . . . . . . . . . . . . . .65
5.2Wen et al.: Ten-Lump Model Being Valid for ZSM-5 Powder and for ZSM-5 on Stainless Steel Fibers . . . . . . . . . . . . . . . . . . . . . . . . . . . . . . . . . . . . . . . . . . . . .67
5.3Summary . . . . . . . . . . . . . . . . . . . . . . . . . . . . . . . . . . . . . . . . . . . . . .69
5.4Other Studies . . . . . . . . . . . . . . . . . . . . . . . . . . . . . . . . . . . . . . . . . . .70
6Concluding Remarks and Outlook70
References75

1. Introduction

Propene is one of the crucial building blocks originating from the petrochemical industry [1]. After ethene, it is the second most-produced crude oil derivative [2]. In 2014, its global demand was quantified as 89 × 106 t [2]. Around 90% of the worldwide supply is produced via fluid catalytic cracking (FCC) or steam cracking [3], the latter being the process with the highest energy demand in the chemical industry [4]. Besides the economic disadvantages, the enormous CO 2 emissions represent another problem [5,6]. Moreover, the high-temperature process allows almost no product adjustment and the shift from higher feedstocks to ethane as feed further reduces C 3 yields [7]. In FCC, propene is a byproduct because this process is aimed at gasoline production [8].
An increase in propene demand is predicted [9,10]; see, for example, a recent review from Blay et al. [3]. Thus, alternative catalytic processes are necessary. Cracking of higher olefins [3], methanol-to-hydrocarbons (MTH) [11], olefin metathesis [12,13], propane dehydrogenation [14,15], oxidative dehydrogenation of propane [16] or ethene-to-propene [3,17] are amongst the most prominent alternative processes.
Kinetic modeling is an indispensable tool for assessing reaction kinetics, heat management, product distribution and reactor performance [18,19]. The application range of kinetic models depends on their complexity: many different strategies exist between the simplest approach, a power-law model and the highest level of detail, a microkinetic model. Models with less complexity are created relatively quickly and do not require much computational power, but they are restricted in terms of their possible applications. On the other hand, the preparation of a microkinetic model is time-consuming and complicated, but it can be used to gain insight into intermediates and preferred reaction pathways, for extrapolation, transfer to other systems and optimization of both catalysts and the process [18,20,21].
When dealing with hydrocarbon conversion over zeolites as catalytic materials, reaction networks are extremely large because of the many different isomers. This is why kinetic modeling of these processes is challenging; without suitable assumptions, derivations and simplifications, no reasonable solutions can be achieved. Nevertheless, the importance of such models is especially high because propene, which is the desired compound in many processes, is an intermediate and not a final product.
This review focuses on the kinetic modeling of two important alternative pathways for propene production: cracking of higher olefins and methanol-to-olefins (MTO) as a special case of MTH. Most studies were performed on either ZSM-5 or SAPO-34, but other zeolite types are also discussed. All examples presented here are deterministic kinetic models and involve three essential features: gathering of experimental data, creation of a reaction network that leads to the model equations and fitting of the kinetic parameters by comparing the modeled results with the obtained data. Although both catalysts and experimental details are mentioned, the emphasis of this review is on the modeling methodology: How is the reaction network created? Which assumptions are made? How many and what types of compounds are included? Is there any mechanistic background considered in deriving the rate equations? How is the adsorption process treated? Which software is used for parameter estimation? Are any details of the numeric routine given? How many fitting responses and parameters are necessary?
To the best of our knowledge, such an overview does not exist for the two processes mentioned above. Indeed, two reviews of MTO kinetic models do exist, namely those of by Khadzhiev et al. [22] and by Keil [23] are available. The latter, however, was published in 1999; since then, both mechanistic understanding of the reaction and computational power have developed rapidly leading to the proposal of a variety of new models. On the other hand, the work by Khadzhiev et al. [22] from 2015 is a useful overview of various kinetic MTO studies, but only a few models are selected. Furthermore, the focus is not on the underlying reaction networks and modeling methodologies. Especially for MTO, there is a wide range of options for representing the reactivity using a model. This review should elucidate that almost every literature study is unique because of different assumptions and methodologies. For this reason, we attempt to establish some general advantages and disadvantages of the approaches in the concluding remarks, ending with a suggestion on the choice of methodology and the suitability of assumptions.
The criteria mentioned above mean that numerous studies are excluded from this review. Firstly, all kinetic approaches published before 2000 are ignored. Apart from the fact that they have already been discussed in the helpful review of Keil [23], most of these examples focus not on MTO, but on methanol-to-gasoline (MTG) where temperatures are lower to increase the yield of the gasoline fraction. In addition to the first kinetic description by Chen and Reagan [24], this includes the models of Chang [25], Ono and Mori [26], Mihail et al. [27,28], Schipper and Krambeck [29], Sedrán et al. [30,31], Schönfelder et al. [32] and Bos et al. [33]. Noteworthy are the comparably large reaction network in [27,28] and the elevated temperatures in [32,33] which are within the MTO range. In addition to the mentioned review of Keil [23], some of the models are compared in [30,34].
Secondly, first principle and ab initio studies are not covered because no actual fitting to experimental data is performed. Nevertheless, this theory gives important insight into mechanistic details which is why some examples should be mentioned here. Where zeolite chemistry is concerned, there are many publications by the van Speybroeck group. In addition to reviews about the theory [35] and MTO [36,37], several aspects of the MTO reactivity are investigated in detail: for example, the influence of adsorption effects [38] and especially of water [38,39], the methylation of aromatics [38,40], the methylation of olefins [41,42] and the formation as well as the reactivity of surface methyl groups [43] are analyzed. Furthermore, general mechanistic details [39,44] and the relationship between catalyst properties, the morphology of the catalyst and product compositions can be elucidated [45]. Similar investigations exist for the cracking of paraffins [46,47] and olefins [48,49,50] using different zeolites.
Thirdly, publications with kinetic parameters resulting from simple Arrhenius plots without any underlying reaction network are not discussed here.
Fourthly, no hydrocracking is reviewed here as some steps of the underlying chemistry are different. For example, initial physisorption on the catalytic surface takes place with a paraffin and not with an olefin. Next, the catalyst is bifunctional in hydrocracking, meaning that the first reaction step leads to a dehydrogenation of the paraffin. From now on, the surface reactions of the resulting olefin are comparable to the mechanisms in olefin cracking. Finally, the product olefin is hydrogenated yielding the corresponding paraffin. In ideal hydrocracking, all hydrogen assisted steps at the metal phase are assumed to be quasi-equilibrated, so the kinetically relevant reactions are comparable to the ones in olefin cracking. However, there are also conditions where this ideal scenario is not realized. In the literature, several microkinetic studies for hydrocracking using the single-event methodology are available [51,52,53,54,55,56,57,58,59,60,61,62,63,64,65,66,67,68]. Other approaches are possible and useful especially for complex feeds such as a Fischer–Tropsch product mixture or vacuum gas oil [69,70,71,72,73,74].
Fifthly, alternative approaches such as the stochastic method by Shahrouzi et al. [75] are ignored because they are too different to be compared with deterministic models.
In summary, this review presents and compares kinetic models for olefin cracking and MTO with the emphasis on reaction network complexity and methodology. This overview should help in finding suitable approaches for the particular requirements of future studies.

2. Theoretical Background

As mentioned in Section 1, the focus of this review is the comparison of kinetic modeling methodologies in order to find suitable solutions for future studies of complex hydrocarbon conversion. For this reason, the theoretical part is restricted to the most important facts without going into details. The cited literature should be referred to for more detailed information about kinetic modeling fundamentals, zeolites and underlying reaction mechanisms because these topics are discussed only in brief.

2.1. Thermodynamics

In contrast to the other topics of this section, thermodynamics are broadly analyzed here for several reasons. Many kinetic models require thermodynamic data, e.g., for the calculation of equilibrated or backward reactions. A correct implementation of equilibrium constants is crucial for the model performance; thus, the underlying theory and calculation procedures should be shown in the following. The results are compared with literature correlations. Thermodynamic equilibrium distributions are evaluated for olefin cracking as well as MTO. This is helpful as first step in order to find intermediate and stable products. Finally, insight into the influence of typical reaction conditions on equilibrium distributions might help in understanding overall reactivity. Thermodynamic equilibria are obtained by minimization of the total Gibb’s free energy G t T (see Equation (1)) [76,77,78]:
G t T = j μ j T n j ,
with μ j T = μ j T + R T ln f j f j .
Equation (1) yields an absolute value in joules, equal to the sum of all considered species j with their chemical potential μ j T given as a molar value multiplied by the number of moles n j of compound j when equilibrium is reached. In this state, the total number of moles n t may differ from the initial value, thus n t is not constant. For an ideal gas, the fugacity f j equals the partial pressure p j , whereas f j is equivalent to a well-defined standard pressure p . According to IUPAC [79], p is set equal to 105 Pa . Although a standard temperature T is defined as 273.15 K , the superscript for thermo-physical properties only relates to the standard pressure [79]. The standard chemical potential μ j T in Equation (2) is equal to the standard Gibb’s energy of formation Δ f G T . Thus, the relation in Equation (3) is obtained,
μ j T = Δ f G j T + R T ln p t p + R T ln n j n t .
When the total pressure p t equals the standard pressure p , the term in the middle of Equation (3) can be omitted. Values of Δ f G T are tabulated in standard references [80], in several collections published by Alberty [81,82,83,84,85,86,87,88,89,90,91,92,93,94,95] or they can be calculated using group additivity methods [96,97,98,99,100,101,102,103]. According to the Gibbs–Helmholtz equation [76], Δ f G T remains a function of temperature. When no suitable values are found in literature, Δ f G T can be calculated via Equation (4). Since no standard entropy of formation exists, the sum over all elements e l must be subtracted from S j T ; the former value is obtained by multiplying the standard entropy of the respective element S e l T by the number of atoms N e l , j which are part of compound j.
Δ f G j T = Δ f H j T T S j T e l N e l , j S e l T ,
with Δ f H j T = Δ f H j ( 298.15 K ) + 298.15 K T c p , j ( T ) d T ,
and S j T = S j ( 298.15 K ) + 298.15 K T c p , j ( T ) T d T .
The temperature dependence of the heat capacity can be described via polynomial approximations [104,105]. For this review, Δ f G T values as a function of temperature are extracted from literature for ethene ( C 2 = ) to octenes ( C 8 = ) [88], for methanol [91] and for water [80]. These are fitted to a second degree polynomial using polyfit within MATLAB. With the resulting coefficients, Δ f G T can be evaluated for each desired temperature. For dimethyl ether (DME), heat capacity values from [106] are fitted with the same routine. In combination with Δ f H ( 298.15 K ) from [107] and S ( 298.15 K ) from [108] as well as heat capacity and S ( 298.15 K ) values for carbon, hydrogen and oxygen from [80], Δ f G T is calculated with the help of Equations (5) and (6). Two cases are analyzed here: a mixture of ethene to octenes and the system methanol/DME/water. These should represent the olefin cracking case and the MTO feed, respectively. The resulting equilibria as a function of temperature can be seen in Figure 1. They are obtained by minimizing Equation (1) using fmincon in MATLAB. Here, the sqp algorithm is applied which yields stable solutions independent of the starting values for the molar composition.
Figure 1a shows a clear trend towards lower olefins at high temperatures. For an MTO feed, the equimolar fraction of DME and water decreases when the temperature is raised. During the conversion of methanol to DME and water, the number of moles remains constant, which is why a change in pressure does not effect the equilibrium. On the other hand, the influence of pressure on the olefin distribution is depicted in Figure 2a for a characteristic cracking temperature of 650 K.
It is obvious that thermodynamics favor the generation of higher olefins when the total pressure is increased. Figure 2b summarizes the results for the desired product propene: for maximum yields, the pressure should be as low and the temperature as high as possible. However, the optimum conditions taken from Figure 2 deviate from an applicable industrial case. Usually, the equilibrated olefin distribution does not depict the process, because propene is an intermediate product here. This makes a proper description of reaction kinetics inevitable.
In this context, the thermodynamic equilibrium constant K TD of the system methanol/DME/water is especially important because it can be incorporated into a model, e.g., to describe the equilibrated feed. In general, this value is accessible via the Gibb’s free energy of reaction Δ r G T [76]. This relation is shown in Equation (7) using the exothermic reaction 2 MeOH DME + H 2 O as an example,
K TD = exp Δ r G T R T = p DME p H 2 O p MeOH 2 .
In the following, some literature correlations for this constant are shown. Figure 3 compares these approaches with our own solution from Figure 1.
Figure 3 shows that only the correlation published by Aguayo et al. [109] closely matches the solution derived from thermodynamics. This correlation is represented by Equation (8):
K TD = exp 9.76 + 3200 K T + 1.07 ln T K 6.57 × 10 4 T K + 4.90 × 10 8 T 2 K 2 + 6050 K 2 T 2 .
In the high temperature range, i.e., above 600 K , the correlations of Tavan and Hasanvandian [113] and Diep and Wainwright [111] also yield satisfying results (see Equations (9) and (10), respectively):
K TD = exp 4019 K T + 3.707 ln T K 2.783 × 10 3 T K + 3.8 × 10 7 T 2 K 2 65610 K 3 T 3 26.64 ,
K TD = exp 2835.2 K T + 1.675 ln T K 2.39 × 10 4 T K 0.21 × 10 6 T 2 K 2 13.360 .
By contrast, use of the correlations of Given [112] and Hayashi and Moffat [110] shown in Equations (11) and (12), respectively, is recommended only for temperatures not significantly greater than 400 K ,
K TD = exp 30564   J   mol 1 R T 4.8 ,
K TD = exp ( 6836 K T + 3.32 ln T K 4.75 × 10 4 T K 1.1 × 10 7 T 2 K 2 10.92 4.1868 J   mol 1 K 1 R ) .
The correlations of Gayubo et al. [114], Schiffino and Merrill [115] and Khademi et al. [116] are not shown here because their application leads to high deviation from the results in Figure 3. The equations of Gayubo et al. [114] and Hayashi and Moffat [110] are of the same form, but different values are used by the former group [114]. The authors refer to the review by Spivey [117] who used the equation by Hayashi and Moffat [110] with the original values.

2.2. Kinetic Modeling

A kinetic model describes the relation between rate r l of a certain reaction l and the concentration of one or several reactants i [18,118,119,120,121]. The latter can be expressed as partial pressure p i , as mole concentration per volume C i , as mole fraction y i , or as mass fraction w i . In the following, a subscript C in p C i , y C i and w C i means that only carbon containing species are considered. The value y C i of a certain compound is determined by multiplying its number of carbon atoms by the number of molecules of this type and comparing this value with the total number of carbon atoms.
In this review, only those models are investigated where the influence of transport phenomena can be neglected. According to the seven steps of heterogeneous catalysis [122], the description is then simplified to adsorption, surface reaction and desorption. Adsorption is an exothermic step, in which the reactant interacts with the catalyst. It is divided into physisorption and chemisorption [123]. The former describes an undirected, unselective and comparably weak interaction, often with the catalyst surface, which is mainly caused by van der Waals forces. The chemisorption is highly selective and is formed for example through a chemical bond between reactant and active center. Here, the adsorption enthalpy is significantly higher compared to physisorption [123]. The reverse process to adsorption is desorption. From thermodynamics, it follows that high pressures and low temperatures favor adsorption. There are different strategies for describing these effects mathematically. A common approach is the Langmuir (L) isotherm in Equation (13), which depends on the temperature T [118,124],
θ i T = K i ads T p i 1 + K i ads T p i ,
with the relative coverage θ i of species i on the catalyst surface and a specific adsorption equilibrium constant K i ads . In the form of Equation (13), an underlying assumption is that adsorption and desorption are quasi-equilibrated. Furthermore, a uniform surface, no interaction between adsorbed species, monolayer adsorption and non-dissociative adsorption are assumed. In addition to the Langmuir isotherm, other approaches also exist [125].
In the following, typical kinetic expressions are introduced: power law, Langmuir, Langmuir–Hinshelwood (LH), Eley–Rideal (ER) and Hougen–Watson (HW). It should be underlined that for these examples, the surface reaction is assumed to be the slowest step, whereas all sorption processes are treated as quasi-equilibrated. Although this is a common scenario, conditions where adsorption or desorption becomes kinetically relevant are also possible. In the following, non-dissociative and competing adsorption of all species is assumed, thereby deviating from the classical formulations of the kinetic expressions found in the literature. At this point, it is important to mention that there is no unique mechanism for any of the preceding kinetic expressions because the resulting equation always depends on the assumptions. This is why all kinetic equations in this review are denoted as type of a certain mechanism.
The simplest way to construct a kinetic model is using power law expressions [124,126]. Equation (14) is typical of a monomolecular reaction:
r l = k l p i κ .
Here, the rate constant k l as well as the reaction order κ are unknown. They can be obtained by fitting the model to experimental data [63]. The reaction order does not need to correspond to the stoichiometric coefficient of species i in step l. Especially in power law models, the former value is often determined as a purely empirical value without any physical meaning.
The level of detail is increased by choosing one of the following basic mechanistic approaches. When such a scheme is applied, the reactions are assumed to be elementary in most cases, meaning that the reaction order equals the stoichiometric coefficient.
For monomolecular reactions, the adsorption of the reactant can be described via an L type of isotherm which leads to the kinetic description in Equation (15) [119,124,127]:
r l = k l K i ads p i 1 + j K j ads p j .
A similar description is obtained for bimolecular reactions where both reactants i and v must be adsorbed before the reaction takes place. The approach in Equation (16) is often referred to as an LH type of mechanism [120,124]:
r l = k l K i ads p i K v ads p v 1 + j K j ads p j 2 .
In the classical LH expression, which is frequently shown, only the two reactants are included for the inhibiting adsorption term in the denominator. In contrast, Equation (16) considers all adsorbing species in the system which is closer to the HW type of mechanism [120,121,127,128]. The latter usually consists of three parts, describing the reaction kinetics (rate constant), the potential (concentrations as well as difference from the thermodynamic equilibrium, if applicable) and inhibition through competing adsorption. Equation (17) describes an example of a monomolecular reversible reaction of reactant i which leads to the two products v and w. Because both reactants of the backward step adsorb before reaction, it is a combination of LH and HW types of mechanism. The equilibrium constant can either be calculated from thermodynamics ( K TD ) or estimated as an unknown parameter ( K l ):
r l = k l K i ads p i k l K K v ads p v K w ads p w 1 + j K j ads p j .
A bimolecular reaction where only one of the reactants i has to be adsorbed while the second compound v reacts directly from the gas phase is known as an ER type of mechanism [121] (see Equation (18)), again with a combination of an HW type of mechanism:
r l = k l K i ads p i p v 1 + j K j ads p j .
Besides the description via relative, i.e., dimensionless, quantities for the coverage, absolute concentration values of adsorbed surface species can be applied by multiplying θ i by the total concentration of acid sites. For the well-defined zeolites, this value is usually known. Consequently, the rate and equilibrium constants remain as unknown parameters.
The temperature dependence of the rate constants is expressed via the Arrhenius approach in Equation (19) [121] which introduces the activation energy E a :
k = A exp E a R T .
The coherence given by Eyring [129] is shown in modified form [130] in Equation (20). The preexponential factor A contains the Boltzmann constant k B , the Planck constant h and the entropy change from reactant to transition state Δ S . Furthermore, the value Δ ν resembles the difference in number of moles between activated complex and reactant state; it is required to correctly relate activation enthalpy and energy,
k = k B T h exp Δ S R exp 1 Δ ν exp E a R T .
Usually, both preexponential factor and activation energy must be estimated. Reparameterization according to Equation (21) is often performed to reduce the correlation between these two values [63,131]:
k = k ref exp E a R 1 T 1 T ref = A ref exp E a R T ref exp E a R 1 T 1 T ref .
Alternatively, the approach in Equation (22) can be used [132]:
k = exp ln A ref E a R T ref E a R 1 T 1 T ref .
The reference temperature T ref should be within the investigated range and is often chosen as the average, although detailed guidelines for its proper estimation exist [131,133].
Another option is to additionally consider the temperature dependence of the preexponential factor (see Equation (23)):
k = A ref T T ref exp E a R T ref exp E a R 1 T 1 T ref .
The preexponential factor of a reaction can also be calculated prior to the fitting process to reduce the number of unknown parameters [19,51,134]. For this purpose, reliable assumptions for the entropy change Δ S are required [18].
During estimation of adsorption or reaction equilibrium constants, reparameterization is applicable in a manner analogous to that shown in Equation (24) [63,128]:
K = K ref exp Δ H R 1 T 1 T ref .
Again, the reference value can be written within the exponential function, as it is done in Equation (25) [132]:
K = exp Δ S R Δ H R T ref Δ H R 1 T 1 T ref
For kinetic models, it is crucial to differentiate the rate r l of a reaction step l from the net rate of production R i of a certain species i [120]. The latter is obtained by summing up all reaction rates where the compound i is consumed or produced. Each rate must be multiplied by the stoichiometric coefficient ν l i of i in step l, as shown in Equation (26):
R i = l ν l i r l .
From these remarks, it follows that stoichiometry should be considered for three points: for the formulation of reaction rates (2C 4 = to C 8 = instead of C 4 = to C 8 = ), for the reaction order as long as elementary reactions are assumed ( p C 4 = 2 instead of p C 4 = ) and for the net rate of production ( 2 k l p C 4 = 2 instead of k l p C 4 = 2 ). However, in this review, it is shown that approaches deviating from this suggestion exist, which nevertheless can still yield a model with high agreement, although it is purely empirical.
The net rate of production is required to obtain the molar flow rate F i of a certain species i along the reactor. For this, integration over the catalyst mass W is performed. If not further specified, Equation (27) for a one-dimensional, pseudo-homogeneous, isothermal plug flow reactor applies for all examples in this review [121]:
d F i d W = R i .
An objective function compares the difference between modeled and measured output [54,121]. Several values are suitable, for example, molar flow rates, mass flow rates or mole fractions. The latter option is chosen for the example in Equation (28) where y j , k characterizes the experimental and y ^ j , k the modeled mole fraction, respectively. In this common approach, the objective function equals the sum of squared residuals S S Q which should be minimized during parameter estimation [54]; a more generalized least-squares criterion can be found in [121],
S S Q = k N Exp j N Res ω j y j , k y ^ j , k 2 .
Evaluation is performed with all experimental data points N Exp and all fitting responses N Res . The latter value comprises all species j which should be used for parameter estimation; however, this need not match the number of lumps in the event that one or several lumps are to be explicitly excluded during fitting. In combination with the number of estimated parameters N Par of the model, its degree of freedom d o f can be calculated according to Equation (29):
d o f = N Exp N Res N Par .
Equation (28) contains a weighting factor ω j which is accessible through replicate experiments: these lead to the experimental errors whose covariance matrix can be inverted, thereby leading to ω j which equals the diagonal elements [121]. Without replicate experiments, the necessary values can be obtained via Equation (30) [54] using the molar flow rate F j ,
ω j = k N Exp F j , k 1 j N Res k N Exp F j , k 1 .
It is explicitly highlighted below if other approaches are used to calculate the weighting factor.

2.3. Zeolites

Originally, the term zeolite referred solely to aluminosilicates consisting of SiO 4 and AlO 4 units. In the meantime, other materials with similar structural features have been included in the definition. All have a common crystalline and tetrahedral structure [135]. Two of their properties are especially important in the context of catalysis. Firstly, they have well-defined channels and intersections whose cross sections are often within the range of molecular size. Through this, a shape selectivity during reactions is achieved: the small openings can prevent certain molecules from entering or leaving the channels while the pore structure also influences the reaction transition states [136]. Secondly, they contain acid sites which is why they are also called solid acids. Brønsted acidity arises when aliovalent cations such as Al 3 + and Si 4 + are connected via oxygen [135]. The resulting negativity of the framework is balanced by additional cations. The incorporation of H + creates a Brønsted acid hydroxyl group situated between aluminum and silicon. The oxygen itself acts as a Lewis base by providing electrons for the non-fully coordinated metal cations. The latter are typical Lewis acid sites, either within the framework or as extra-framework cations [137]. For industrial use, zeolites are often mixed with binders which provide a mesoporous surrounding of the crystals. This can also affect the catalytic performance [138,139]. The resulting extrudates are then formed to the desired pellet shape.
Within a zeolite crystal, the tetrahedral units represent the primary building units. Their systematic arrangement leads to a block consisting of several tetrahedra which is referred to as a secondary building unit (SBU) [135]. The SBU is characteristic of a certain zeolite because it is found periodically within the framework. A three-letter code is used to differentiate the various frameworks [140]. Another important property is the channel opening which is defined by the number of cations: a ten-membered ring means that the opening is formed by ten cations connected via ten oxygen atoms. Eight-, ten- and twelve-membered rings are classified into small-, medium- and large-pore zeolites, respectively [135]. The Structure Commission of the International Zeolite Association presents an overview of the different zeolites online [141]. Details about morphology, synthesis and characterization can be found elsewhere [135,136,137,140,142]. Here, only the four examples discussed within the review are briefly described.
ZSM-5 [143] is the second most applied zeolite in industry [142]. The framework code is MFI and the SBU consists of a pentasil unit, which itself is composed of eight rings with five cations each. It is a medium-pore zeolite where two types of pores can be found: straight channels along the (010) direction and zigzag channels along the (100) direction [142,144]. These cross each other at intersections; a three-dimensional pore network is obtained with the dimensions 5.1 × 5.5 Å (straight channel) and 5.3 × 5.6 Å (zigzag channel) [135]. In general, ZSM-5 shows strong acidity, high activity and stability and a pronounced shape selectivity during hydrocarbons conversion [135].
ZSM-23 [145] with framework code MTT is another example of a medium-pore zeolite [135]. Its channels are one-dimensional with an opening of 5.2 × 4.5 Å [141]. This accelerates deactivation, but also yields more higher and branched olefins, which are suitable for gasoline production [146,147].
The aluminophosphates consist of tetrahedral AlO 4 and PO 4 + units. Consequently, this framework is neutral [137]. When P is replaced with Si, a negative charge is introduced which creates acid sites. This leads to the silicoaluminophosphates with SAPO-34 and SAPO-18 as examples. Their strict framework ordering allows only even-numbered rings as pore openings [142]. While the Si/Al ratio must be greater than one for the aluminosilicates [137], it is usually less than one for SAPO. The structure of SAPO-34 [148] is similar to chabazite (framework code CHA) meaning it is a small-pore zeolite with an opening of 3.8 Å [149] and a three-dimensional cage structure. On the one hand, its moderate acidity in combination with the shape selectivity leads to high yields of lower olefins. On the other hand, SAPO catalysts are prone to rapid deactivation effects [150].
SAPO-18 [151] is isomorphic to SAPO-34, while the framework is of AEI type [149]. It belongs to the small-pore zeolites with openings similar to SAPO-34 [141]. Although these two SAPO examples also have the same Si/(Si+Al+P) ratio, the amount of Brønsted acid sites is significantly lower for SAPO-18. Hence, it has a longer lifetime [151,152]. Moreover, synthesis of SAPO-18 is simpler and cheaper than for SAPO-34 [151].

2.4. Reaction Mechanisms

Many references about olefin cracking and MTO exist in the literature. Here, only the most important facts are summarized. In addition, the discussion of each reaction network in the individual sections also gives hints about the underlying mechanism.

2.4.1. Olefin Cracking

Several studies analyze the mechanism and product distribution of olefin cracking over zeolites [153,154,155,156,157,158,159,160]. A helpful overview can be found in [3]. The conversion of higher olefins to mainly propene using a recycle reactor concept comparable to MTP is viable [161,162]; however, thus far, no commercial process has been achieved.
Two main pathways must be differentiated: monomolecular cracking and dimerization with subsequent cracking [163]. The former is only possible for olefins having carbon numbers greater than or equal to [164]. Ethene, propene and butenes must undergo a dimerization step first. The resulting higher olefin can either crack in a second step or it can react in another dimerization. This leads to a complex interconversion scheme [158]. Figure 3 shows that thermodynamics favor lower olefins at high temperatures. One reason is that dimerization is exothermic, while the cracking reaction is endothermic. In addition, adsorption effects might be important for this observation because adsorption is less favored at higher temperatures [165].
The general description of cracking within a model and especially the difference between a simpler approach and microkinetics is well illustrated by the monomolecular cracking of 2-methyl-hept-2-ene.
In a simple model considering stoichiometry, the reaction would be formulated as C 7 = C 3 = + C 4 = with the corresponding rate equation r = k p C 7 = . However, this ignores both the backward reaction and the adsorption of C 7 = prior to the reaction. Due to of the latter fact, the estimated rate constant is an apparent value that includes adsorption effects. This could lead to negative activation energies, especially when more than one reactant is required in the adsorbed state [166].
The microkinetic approach for this reaction is shown in Scheme 1. Here, the adsorption step must be considered first: it is described as a two-step chemisorption at a Brønsted acid site, which can be divided into π complex formation and protonation [167]. The resulting intermediate is depicted as a carbenium ion here, however, it should be noted that alkoxides are also proposed as stable intermediates [167,168,169].
The intermediate obtained after protonation in Scheme 1 illustrates why microkinetic models differentiate each isomer: in the initial form, monomolecular cracking would be energetically less desired because of the formation of a primary intermediate [164]. By contrast, the molecule undergoes two isomerization reactions: an additional side group is formed by branching via a protonated cyclopropane (PCP) transition state, whereas a subsequent methyl shift changes the position of this side group. Cracking to a secondary propyl intermediate is now possible. The other product, but-2-ene, is released directly to the gas phase. Finally, the desorption to propene takes place. As illustrated in Scheme 1, all steps are reversible and only the cracking or dimerization as a backward reaction are of kinetic relevance [164]. By contrast, the adsorption as well as isomerization reactions are often assumed to be quasi-equilibrated [54,164]. In addition to PCP branching and methyl shift, hydride shifts also exist as isomerization steps.
Apart from these olefin interconverting steps, side reactions also exist [170,171]. The most important pathway produces both paraffins and aromatics. It starts with a hydride transfer from an olefin to a protonated intermediate. The latter is converted to a paraffin, whereas the former converts into a protonated olefin. Provided the chain is long enough, a cyclization reaction takes place, yielding a cyclic olefin subsequent to a deprotonation [170]. Through two additional hydride transfers and deprotonations, an aromatic structure is obtained. This mechanism results in a ratio of 3:1 of paraffins to aromatics. However, the latter can form polymerized species, leading to coke, which also allows different ratios. The formation of methane is attributed to thermal cracking effects. Further elementary steps occurring during olefin interconversion, especially when many cyclic compounds are involved, are beyond the focus of this review and can be found for example in [20,52,53,58,172].

2.4.2. Methanol-to-Olefins

Since the conversion of methanol to hydrocarbons was discovered accidentally by two independent research teams at Mobil [173], many scientists have tried to determine the exact mechanism. At first, the focus of this process was on the production of high-octane compounds (MTG), but the product spectrum always contained high quantities of olefins, which is why MTO was introduced [174]. A commercial solution for increasing propene yields by recycling the higher olefins is called methanol-to-propylene (MTP) [175]. The product composition depends heavily on the conditions, setup and catalyst [11]. Nevertheless, some general features of methanol conversion over zeolites are shown here.
When pure methanol is led over an acid zeolite, the reaction to form DME and water proceeds comparably quickly. The thermodynamic equilibrium in Figure 1b is rapidly achieved. Several studies exist that consider the exact mechanism of this reaction [176,177,178,179,180,181,182]. The dissociative mechanism suggests that after methanol is chemisorbed, its dehydration leads to a surface methyl group. In a subsequent step, the latter reacts with a second methanol molecule to a protonated DME which finally desorbs. In the associative route, DME is produced directly without forming the surface methyl group as an intermediate.
Mechanistically, the formation of the first C-C bond, i.e., the conversion of C 1 (methanol) and C 2 (DME) oxygenates to higher hydrocarbons, has been under debate for decades. It is still not fully understood, although some recent contributions underline the importance of formaldehyde in this context [183]. Previously, other mechanisms were proposed: the oxonium ylide mechanism, the carbene mechanism, the carbocationic mechanism, the free radical mechanism and the consecutive type mechanism. These are summarized and discussed in the review by Stöcker [174] and also in [10]. Despite the unresolved mechanism, the autocatalytic nature of MTO with a pure methanol feed is well-known [24,26]. During the initiation phase, the conversion of oxygenates is almost zero because the formation of the first C-C bond is slow. After a certain contact time, the conversion rate increases: the first hydrocarbons are formed, this accelerates the conversion of oxygenates which again produces more hydrocarbons. Figure 4 clearly shows the resulting S-shape of the curve which only slows down when the concentration of oxygenates becomes too low.
An important concept for MTO chemistry is the hydrocarbon pool proposed by Dahl and Kolboe [184,185,186]. According to this theory, adsorbed or trapped hydrocarbon species which are not further defined act as a co-catalyst through ongoing methylation and dealkylation reactions, the latter releasing mainly ethene and propene. It was suggested that the pool species are somehow similar to coke, i.e., polymethylated aromatic compounds formed during the early reaction stage [184]. Much research has gone into determining the exact structure of the aromatic compounds [11,187,188,189,190,191]. Furthermore, two mechanistic pathways for methanol consumption and subsequent olefin dealkylation were suggested [189]. In the side-chain mechanism [192,193,194,195,196], one of the side chains of the aromatic compound is continuously growing until it is dealkylated as olefin. By contrast, in the paring mechanism [197], the growth of the aromatic compound causes complex structural rearrangements which also lead to olefin release.
The trapped aromatics are especially important for small pore catalysts like SAPO-18 or SAPO-34. However, different characteristics were determined over ZSM-5. Here, olefins are the main source of methanol consumption by continuous methylation and cracking [153,198]. This observation led to the proposal of the dual-cycle theory [199,200]: it was found that yields of ethene correlate with those of aromatics in contrast to propene. Consequently, their formation routes must be mechanistically separated. Whereas the aromatic hydrocarbon pool is similar to the one described above, an olefin hydrocarbon pool also plays an important role. Here, olefins grow through methylation reactions and crack down to lower olefins again. Over ZSM-5, this is the main route towards propene, especially at high temperatures. Again, whether the olefins are methylated in a stepwise mechanism via a surface methyl group [26,176] or in a concerted step [201] remains the subject of much debate. Furthermore, it has been observed that DME can also perform methylation reactions, a step which exhibits lower barriers than methanol [202,203].
The formation of side products is not restricted to the evolution of polymethylated aromatics. The mechanism described in Section 2.4.1 for olefin cracking is also valid for MTO. However, it was observed that, when methanol is present, the side product formation is significantly higher than for the pure cracking case [171]; in addition, methane formation is pronounced [204]. This led to the proposal of a methanol-induced hydrogen transfer [205,206] where again formaldehyde plays an important role. Figure 5 shows the MTO reaction network on a ZSM-5 catalyst in a simplified way. This illustration emphasizes the dual-cyle mechanism, with the olefin based cycle on the left side and the aromatic based cycle on the right side. The latter is not further specified, i.e., it characterizes both the less methylated aromatics which are found in the product spectrum as well as the heavier compounds trapped in the pores.
As mentioned above, the undesired higher olefins are recycled and co-fed in the commercial MTP process [175,207]. This changes the underlying chemistry drastically [208,209,210,211,212,213]: the slow formation of the first C-C bond is obsolete because higher hydrocarbons are available straightaway. Consequently, no initiation phase is observed; the oxygenates conversion increases immediately from the beginning as depicted in Figure 4.
Several reviews [11,23,36,37,144,174,190,214,215,216] and overviews [217] provide more details. Current research is focused on a wide range of issues, i.e., the exact mechanism of methylation [38,40,41,42,201,202,218,219,220,221,222,223,224], catalyst properties [45,222,225,226,227,228], reaction conditions [210,211,229] and deactivation [203,230,231,232,233,234]. Finally, an overview of the current state of MTO commercialization is given in [191].

3. Kinetic models for Olefin Cracking

The different models are grouped according to crucial characteristics. The ones by Epelde et al. [235], Ying et al. [236] and Huang et al. [166] depict manifold olefin interconversion reactions over ZSM-5. All three have comparable numeric approaches and especially the studies by Ying et al. [236] and Huang et al. [166] are very similar, although the latter includes a mechanistic approach. The next section groups the models by Borges et al. [165] and Oliveira et al. [237] over ZSM-5. Here, the focus is not on a complete olefin interconversion picture, but on describing the feed consumption rate [165] and on considering the different acid strengths of the sites [237]. The next two sections both contain only one model: there is no other microkinetic study of olefin cracking except for von Aretin et al. [164] and the model by Zhou et al. [77] is the only example over SAPO-34. An overview of the analyzed models can be found in Table 1 and Table 2; the horizontal lines divide the different sections. At the end of each section, a short summary paragraph compares the models and shows advantages and disadvantages of the approach. Table 1 contains information about the catalysts used in the studies, whereas Table 2 lists the experimental conditions and details about the modeling approach. In the following text, only special features of both catalyst and setup are mentioned. The description focuses on the underlying reaction network and the derivation of the model. In Table 2, the maximum experimental contact time is given in the same unit as in the original publication. This value is always based on the inlet molar flow rate which is either expressed as molar flow rate of carbon (subscript C) or of all species (subscript t). For the kinetic parameters, only the subscript C is used when the values are explicitly related to carbon units; otherwise, no subscript is shown.

3.1. Studies Focusing on Olefin Interconversion over ZSM-5

3.1.1. Epelde et al.: Eight- and Five-Lump Approach for C 4 = Feeds at Elevated Partial Pressures

Catalyst

The self-synthesized ZSM-5 zeolite has a comparatively high Si/Al ratio (280). According to the authors [235], this was done to attenuate hydrogen transfer so that side product formation is hindered and propene yields are increased. In addition to this, 1 % wt K was added to the zeolite which lowers overall acidity and leads to a homogeneous distribution of acid strength. This should reduce side reactions and especially the evolution of coke precursors [238]. The measurements were performed at a time-on-stream (TOS) of 5 h ; however, the authors extrapolated the results to 0 h TOS to characterize the reactivity of a fresh catalyst. In a preliminary study [239], the influencing factors of coke evolution were evaluated in detail.

Setup and Conditions

The experimental setup consisted of an automated reaction equipment where the feed components were provided as gases. The continuous fixed bed reactor was located within a furnace chamber whose temperature could be controlled via three test points, one of them being inside the catalyst bed and the other two in the chamber and in the transfer line to the GC, respectively. The stainless steel reactor had an inner diameter of 9 mm. Product analysis was performed using a micro gas chromatograph (GC) equipped with a thermal conductivity detector (TCD) and four columns. Both the feed and the catalyst bed were diluted using helium and SiC, respectively. More details about the setup can be found in the original publications [235,238,239]. In this study, 1-butene was the only reactive feed component analyzed; its partial pressures at the reactor inlet were relatively high.

Reaction Network

The proposed reaction network results from an analysis of kinetic experiments shown elsewhere [239]. The different species are grouped by means of reactivity which yields eight lumps: C 2 = , C 3 = , C 4 = , C 5 + al , C 1 , C 2 3 , C 4 and C 6 8 ar . The reaction rates are formulated based on experimental observations of primary and secondary products and evolution of the lump yields with changing conditions; the network with the best fit is chosen. Here, the formation of ethene ( k 3 and k 8 ) as well as of the side products ( k 4 k 7 and k 10 ) is assumed to be irreversible whereby a minor part of C 2 = , C 2 3 , C 4 and C 6 8 ar can still react to methane. The remaining steps comprise the interconversion of C 3 = to C 5 + al hydrocarbons ( k 1 , k 2 , k 8 , k 8 and k 9 ) where the only irreversible step is the production of propene out of C 5 + al . Besides methane formation, ethene does not act as reactant. As it can be seen in Scheme 2, the steps are considered as elementary reactions. Moreover, the stoichiometry is neglected both in the derivation of the rates and in the formulation of the net rates of production. Adsorption effects are not included.
The net rates of production can be obtained by adding all reaction rates where the respective lump is involved (see Scheme 3).
The authors observed only a minor side product formation [238], which is why they reduce the original eight-lump model. All paraffins are grouped together now (C1–4), whereas the aromatics are summarized with the higher aliphatics to the new lump C 5 + HC . The resulting reaction network can be found in Scheme 4.
From this, the net rates of production are defined according to Scheme 5.

Parameter Estimation

The mole fractions and molar flow rates in this study are expressed in carbon units, whereas, for the reaction rates in Scheme 2, partial pressures are used. Parameter estimation is performed with a multivariable nonlinear regression in MATLAB. The molar flow rates along the reactor are obtained with a fourth-order finite differences approximation, whereas the actual regression is two-part: a self-written routine using the Levenberg–Marquardt algorithm delivers initial values for the final step, the minimization of the objective function via fminsearch. The objective function returns the weighted sum of squared residuals between the experimental and theoretical mole fractions. For replicate measurements, an average value is used for the experimental value. The calculation of the weighting factor is different to Equation (30): due to the lacking division by the sum of the weighting factors for all fitting responses, the individual values might exceed one for Epelde et al. [238]. With this methodology, 13 reference rate constants and ten activation energies are estimated. This means the reparameterized Arrhenius approach (see Equation (21)) is used with the reference temperature being the average value of the investigated range (773 K ). Steps 4 and 4 are assumed to have similar activation energies, as well as Steps 8, 8 and 8 , to reduce the number of estimated parameters. For the five lump version, 16 unknown values exist: nine reference rate constants and seven activation energies. The same simplification for the activation energy of Steps 8, 8 and 8 is introduced.

3.1.2. Ying et al.: Eight-Lump Model for Arbitrary Olefin Feeds Including Side Product Formation

Catalyst

As shown in Table 1, not many details about the catalyst are accessible because Ying et al. [236] used a commercial ZSM-5 extrudate sample from Süd-Chemie. The only noteworthy fact is the relatively large particle size (420–841 μm). The measurements were performed with a fresh catalyst.

Setup and Conditions

In the kinetic measurements, different olefins from propene to heptene were analyzed as feed. Ethene was also fed at the beginning of the study. It showed almost no reactivity and was therefore ignored. Whereas propene and butenes could be fed directly as gases, the higher olefins were provided as liquids and had to be evaporated. The temperature was measured within the catalyst bed diluted with silica. For feed dilution, nitrogen was chosen. The continuous fixed bed reactor had an inner diameter of 10 mm, but high volumetric flow rates were applied to prevent film diffusion. For each feed, different maximum contact times and conversions had to be analyzed. However, the latter value was comparable for propene, butenes and pentenes. Both hexene and heptene are very reactive and, therefore, conversion was almost one despite having short contact times. Samples were evaluated with a GC equipped with one column and a flame ionization detector (FID).

Reaction Network

The authors conducted a profound analysis of the selectivity results of each olefinic feed. This insight is used to create the reaction network which consists of seven lumps: C 2 = , C 3 = , C 4 = , C 5 = , C 6 = , C 7 = and C i SP . The whole network describes olefin interconversion ( k 1 k 8 ) except for one side product formation step ( k 9 ). It is mentioned that the theoretical C 7 = lump is compared with an experimental result of C 7 8 = olefins. The side product lump contains all paraffins and aromatics with arbitrary carbon numbers. As mentioned above, ethene showed negligible reactivity, so the authors assume its formation reactions to be irreversible. The same is applied to the step leading to C i SP and to the formation of C 4 = and C 6 = out of two pentenes (see Scheme 6). The latter assumption is justified with the missing improvement when the backward reaction is implemented. Stoichiometry is considered and various olefin interconversion reactions are included: there is a clear separation between monomolecular cracking (C 5 = , C 6 = and C 7 = ) and dimerization-cracking reactions (C 3 = –C 7 = , but especially important for lower olefins). For the dimerization, the highest intermediate included is C 10 = . The steps are treated as elementary reactions without any adsorption effects. Scheme 6 shows an overview of all reactions covered by Ying et al. [236].
This network leads to the net rates of production listed in Scheme 7.

Parameter Estimation

Both the contact time and the reactor model are calculated with mass flow rates, which means that the net rate of production of each lump (Scheme 7) has to be multiplied by its molar mass. The reaction rates (Scheme 6) are expressed with molar concentrations per volume. For parameter fitting, the Levenberg–Marquardt algorithm is used to minimize the objective function. The latter is defined as the unweighted sum of squared residuals between the theoretical and experimental mass fractions. The reparameterized Arrhenius approach according to Equation (21) is used with a reference temperature of 673 K , which is the lowest examined value. As unknown parameters, 14 reference rate constants and 14 activation energies follow from this model.

3.1.3. Huang et al.: Six-Lump Approach for Arbitrary Olefin Feeds Including LH and HW Types of Mechanism

Catalyst

The authors [166] chose a commercial ZSM-5 catalyst by Shanghai Fuyu Company due to its coking resistance and high propene to ethene ratio. As shown in Table 1, the increased Si/Al ratio (200) caused a low number of acid sites ( 0.012 mmol g cat 1 ). A preliminary test revealed that catalyst deactivation was negligible, which is why a broad spectrum of TOS was chosen with a regeneration after each 10 h . With 17 h TOS, the coke selectivity was still below 0.01%.

Setup and Conditions

Huang et al. [166] used a continuous U-shaped fixed bed reactor made of titanium with an inner diameter of 6 mm. Different olefins from propene to heptene were applied as feed, but, in contrast to the study of Ying et al. [236], the corresponding linear 1-alcohols were fed as liquids and evaporated in a pre-heater. The authors stated that the dehydration to the corresponding 1-olefin occurred very quickly when the feed mixture reached the catalyst bed [166]. However, this inevitably caused water release, which can be seen as further diluent, but also interacted with the acid sites of the catalyst. Further feed dilution could be achieved by using nitrogen, whereas the catalyst was diluted 1:5 with an inert not further specified. The reactor was surrounded by a molten salt bath which allowed controlling the temperature, although no thermocouple was available within the catalyst bed. A GC equipped with an FID and one column was used for product analysis. Each data point resulted from a twofold GC sampling. The authors performed two additional experimental series at 713 K and 753 K with a mixture of different olefins as feed. These were not included into parameter fitting, but used to prove the validity of the model not only for single olefins as feed, but also for mixtures. Therefore, the detailed molar composition without inerts was 0.07, 0.235, 0.22, 0.235, 0.12 and 0.12 for C 2 = , C 3 = , C 4 = , C 5 = , C 6 = and C 7 = , respectively.

Reaction Network

Similar to Ying et al. [236], a detailed study of each olefinic feed was performed. This could be used to derive the reaction network which consists of the following six lumps: C 2 = , C 3 = , C 4 = , C 5 = , C 6 = and C 7 + = ; the latter also contains species higher than heptenes. All steps in the network are related to olefin interconversion. Huang et al. [166] allow the highest intermediate to have a carbon number of twelve, so hexene dimerization can occur. Furthermore, they include not only monomolecular cracking and dimerization, but also four trimolecular alkylation reactions, for example, the trimerization of propene to butene and pentene. The network shows no irreversible steps: no evolution of side products is included and, although ethene dimerization is neglected, the ethene formation out of higher olefins is assumed to be reversible. The resulting network contains a huge variety of olefin interconversion reactions and can be found in Scheme 8. For the derivation of the reaction rates, Huang et al. [166] follow a combination of LH and HW types of mechanism. This means the backward reactions are determined with equilibrium constants and the denominator contains the inhibition through competing adsorption. For the latter, all olefins and water are considered. The different reactions are assumed to be elementary and stoichiometry is retained.
For this model, the expressions for the reaction rates are quite complex, which is why Scheme 9 only shows r l .

Parameter Estimation

The mole fractions shown in the figures [166] are based only on hydrocarbons, whereas the rate expressions in Scheme 8 are defined with partial pressures. The estimated parameters are obtained via nonlinear regression which is used to minimize the objective function. The latter returns the weighted sum of squared residuals between measured and predicted mole fractions. The weighting is performed in a relatively simple manner: the respective feed component is multiplied by 0.25 and the remaining components by 1. In a subsequent study [240], the authors gave some explanations on numerics: the integration is performed with a fourth–fifth-order Runge–Kutta method provided by ode45 in MATLAB, whereas the Levenberg–Marquardt algorithm is used for minimizing the objective function. The olefin adsorption constant is assumed to be independent of chain length, so only one reference constant and one adsorption enthalpy are fitted. The interaction between water and the catalyst is reduced to a competitive adsorption, which also requires the estimation of these two values. Finally, the equilibrium constants of the backward reactions are fitted and not calculated from thermodynamics, because the lumps resemble isomer distributions which are difficult to characterize with single values. This causes 44 estimated parameters: ten reference rate constants, ten activation energies, twelve reference equilibrium constants, ten reaction enthalpies and two adsorption enthalpies. The reparameterized approach according to Equations (21) and (24) is used both for rate and for equilibrium constants with a reference temperature of 733 K , which is in the upper third of the investigated range.

3.1.4. Summary

All three examples comprise several steps of olefin interconversion reactions. Whereas Huang et al.’s model [166] is experimentally covered only for lower conversions where side product formation can be neglected, this aspect is included for Epelde et al.’s [235] model as well as Ying et al.’s [236] model. The former model differentiates paraffins and aromatics in four lumps (eight-lump version), whereas the latter only has one general side product lump. On the other hand, the HW type of mechanism used by Huang et al. [166] yields a comparably robust model, although performance could be further improved by using different adsorption constants for all carbon numbers. Moreover, the high number of estimated parameters can cause numerical difficulties during estimation. For the two other models, both adsorption effects and a mechanistic approach are missing. In addition, feed partial pressures are relatively high for Epelde et al. [235]; consequently, extrapolation to lower values might be difficult. This is the reason why the authors could not notice any improvement when using an HW type of mechanism [235]. Furthermore, use of this model is restricted to butenes as feed, whereas the other two examples can be applied to different olefins and also to mixtures as feed. This feature is derived from their reaction networks, which contain a high number of pure olefin interconversion steps. Conclusions concerning the mechanism is difficult for Epelde et al. [235] because their network neglects stoichiometry and, in the five lump version, combines final and intermediate products in one lump. However, it is suitable to describe conversion of butenes over ZSM-5 modified with potassium.

3.2. Studies Focusing on Feed Olefin Consumption over ZSM-5

3.2.1. Borges et al.: Three-Lump Approach for Oligomerization of C 2 = to C 4 = Feed Olefins

Catalyst

A commercial ZSM-5 powder by Zeolyst International with a rather low Si/Al ratio of 30 was used here [241]. As shown in Table 1, no further details are available. Measurements were performed with a TOS between 0 and 1.4 h ; no deactivation was observed during this period. Furthermore, no coke could be detected during heating up the catalyst to 973 K under air and analyzing the effluent with a thermogravimetry (TG)/differential scanning calorimetry (DSC) combination. This was attributed to the mild conditions and steric hindrances of coke evolution [237].

Setup and Conditions

In the study of Borges et al. [165], a continuous fixed bed reactor was used; no additional information about the setup is given. Ethene, propene and 1-butene were provided as gases and fed separately, each of them diluted with nitrogen. The products were analyzed via a GC containing a single column and an FID.

Reaction Network

This work focuses on the consumption of a certain feed olefin through oligomerization. Thus, no interconversion reactions are implemented, the model consists of only one rate equation, which is equal to the net rate of production of either C 2 = , C 3 = or C 4 = (see Scheme 10). For the values of R, stoichiometry is not retained. Although the actual rate is written as dimerization, the authors account for the oligomerization through allowing also higher intermediates to participate in this reaction step: one reactant is always the feed component (e.g., C 2 = ), whereas the other reactant is either also the feed molecule or a multiple of it (e.g., C 2 = , C 4 = , C 6 = ...). In the derivation of Scheme 10, it is assumed that the sum of partial pressures equals the inlet partial pressure of the feed component p in C i = throughout the whole reactor. This allows expressing the partial pressures of all reactants via the conversion X and p in C i = . Furthermore, irreversible elementary reactions are underlaid. This work is an example where ethene dimerization is included. Scheme 10 is a combination of ER and HW types of mechanism, so adsorption effects are included for one of the reacting olefins (superscript “ads”), whereas the other olefin reacts directly from the gas phase. In the numerator, adsorption equilibrium and rate constant as well as the total number of acid sites C t are summarized to a composite value k i 1 co . The scope of describing the feed olefin consumption via oligomerization means that no cracking and no side reactions are considered, although the corresponding interconversion and side products are observed.

Parameter Estimation

For the three reaction rates in Scheme 10, partial pressures are used. The rates are fitted to measured data points using Microsoft Excel. Here, a non-linear least-squares regression is performed to minimize the sum of squared residuals between experiments and model. In contrast to most other studies, the objective function evaluates catalytic activity and not mole fractions or comparable values. The catalytic activity relates the final conversion with the initial molar flow rate of the olefin and the catalyst mass. For the parameter estimation, no weighting factors are included. The adsorption of the different olefins is realized via the same constant. This is justified by a reference to literature studies and by own hybrid Hartree–Fock (HF) and DFT calculations which show a significant difference only for ethene. Although the model describes not only the dimerization of two feed molecules, but also of multiples of it and a feed molecule, all rate constants for a certain feed are assumed to be the same. These as well as the adsorption equilibrium constant are expressed via values at the reference temperature of 648 K , which is the mean of the experimentally covered range. The kinetic rate constants are composite values (superscript “co”) which include the rate constant itself, the adsorption constant and the molar concentration of total acid sites per catalyst mass C t . Finally, eight parameters are estimated with the experimental data: three reference rate constants, three activation energies, one reference equilibrium constant and one adsorption enthalpy.

3.2.2. Oliveira et al.: 17-Lump Model for C 2 = to C 4 = Feeds Considering Heterogeneity in Acid Sites

Catalyst

This model [237] is a subsequent work to Borges et al. [165]. Thus, the same ZSM-5 zeolite powder was used (see Table 1). However, focus of this study was creating a kinetic model which has the heterogeneity of the acid sites implemented. The authors investigated the coherence between acidity and activity earlier [241] and found a linear relationship between the activation energy of ammonia desorption resembling acid strength and of several surface reactions as well as of the adsorption enthalpy. These results were further confirmed by ab initio calculations [237]. This contradicts the approach of Thybaut et al. [54], where a difference in acid strength is fully attributed to the adsorption properties, whereas the kinetic descriptors, i.e., preexponential factor and activation energy, are independent of the catalyst properties. However, in Thybaut et al.’s study [54], an average acidity was assumed for each catalyst, whereas, for Oliveira et al. [237], several sites with different strength were defined. Further variety within the catalyst samples was achieved by exchanging 0%, 2.4%, 3.0% and 3.2% of the protons with Na. The number of acid sites as well as their strength decreased with higher Na contents. In contrast, for Thybaut et al. [54], the strength of the acid sites increases when their amount is lowered. An explanation could be that the different catalysts were synthesized already with the reduced number of acid sites, whereas, for Oliveira et al. [237], some of the sites’ protons were exchanged with Na after synthesis which might especially affect the ones with highest strength.

Setup and Conditions

The same apparatus and similar conditions as for Borges et al. [241] were used (see Table 2).

Reaction Network

As stated above, this kinetic model aims at simulating the olefin interconversion on four different ZSM-5 samples where each had a uniform distribution of acid strength additionally. For this, 17 lumps are introduced: C 2 = , C 3 = , C 4 = , C 5 = , C 6 = , C 7 = , C 8 = , C 2 , C 3 , C 4 , C 5 , C 6 , C 7 , C 8 , C 6 ar , C 7 ar and C 8 ar . In contrast to the previous study, cracking is also considered as a backward reaction to the dimerization. Furthermore, the irreversible evolution of side products is included. The corresponding rate equations can be found in Scheme 11 where θ h represents the fraction of acid sites having the activation energy of ammonia desorption of E a , h NH 3 . The total number of acid sites is included in the preexponential fitting parameter α of each reaction type. The linear relationship between E a , h NH 3 and activation energy or adsorption enthalpy is expressed via the parameters β and δ . The carbon number dependence of the non-equilibrated steps is implemented with a hyperbolic tangent function and the additional parameters γ , ϕ and φ . As in the previous study [165], the sum of partial pressures should always be equal to the inlet partial pressure of the feed component C w . In Scheme 11, one olefin is always in adsorbed state (superscript “ads”), whereas, when applicable, the other one is in the gas phase. Consequently, the dimerization and aromatization steps are combined ER and HW types of mechanism. For the monomolecular cracking reactions, the L and HW types of mechanism are coupled. All steps should occur as elementary reactions. Ethene dimerization reactions are covered by this model. Although Scheme 11 proposes that three olefins are converted to three paraffins per evolution of one aromatic molecule, stoichiometry is retained neither in the reaction rate nor in the net rate of production.
For each of the lumps, the net rate of production is defined. Because of the many combination possibilities, Scheme 12 is written in generalized form.

Parameter Estimation

The reaction rates in Scheme 11 are defined with partial pressures. As in the previous study, the objective function compares catalytic activities between experiment and model. The discrepancy minimized via a nonlinear least squares regression using MATLAB and without any weighting. The solver ode15s is applied to integrate the differential equations. With ab initio HF calculations, the authors could show that only the size of the gas phase olefin is crucial for the activation energy, an effect which is included via γ , ϕ and φ . Again, it is assumed that all olefins have the same value for the adsorption constant. Both the latter and the rate constants are expressed via values at the reference temperature, a value which is not mentioned. Finally, 20 parameters are estimated: three activation energies, three preexponential factors, six values to correlate acid strength and activation energies, five factors for the carbon number dependence, one reference equilibrium constant, one adsorption enthalpy and one factor to correlate acid strength and adsorption enthalpy.

3.2.3. Summary

The model by Borges et al. [165] is an effective way to describe the consumption of C 2 = to C 4 = feeds. However, due to the negligence of interconversion and side reactions, its application is restricted to low conversion in contrast to the examples in Section 3.1.3. On the other hand, computational effort is less for Borges et al. [165]. The limitation of low conversion is improved by the subsequent model by Oliveira et al. [237] where more variability in reactivity is given, but where also more parameters are required. Here, the description of side product formation is also possible. For both models, agreement could be increased by considering the carbon number dependence of adsorption constants. Furthermore, the assumption that the sum of all partial pressures is equal to the inlet partial pressure of the feed component might not always be fulfilled. Nevertheless, the approach by Oliveira et al. [237] is the only one in this review which allows considering the fact that not all sites of a zeolite have the same acid strength.

3.3. Microkinetic Study over ZSM-5

3.3.1. von Aretin et al.: Model for Arbitrary Olefin Feeds Considering all Interconversion Steps with Maximum Carbon Number of Twelve

Catalyst

A commercial ZSM-5 powder provided by Clariant AG was used in this study [164]. As shown in Table 1, the applied particle size is in the upper range. Before the first data point was recorded, the catalyst had to be deactivated for six hours. In this period, a significant loss of activity was observed, whereas it reached an almost constant value for the next ten hours [242].

Setup and Conditions

The experiments were performed with 1-pentene as feed using a continuous fixed bed quartz glass reactor with an inner diameter of 6 mm. During the measurements, two different volumetric flow rates were applied (300 and 400 mL min−1), which caused two total pressures (1.16 and 1.23 bar). Isothermality was guaranteed by using SiC and nitrogen to dilute the catalyst and the feed, respectively. This was monitored by measuring the temperature at the tube wall. The 1-pentene stream had to be evaporated before it was fed into the reactor. The products were analyzed with a GC which had three columns and both an FID and a TCD.

Reaction Network

In contrast to all other examples shown in Table 2, a microkinetic model is formulated here. Lumping is still performed during evaluation of the experiments: The model differentiates each isomer, but summarizes them for comparison with the measurements. Here, the responses C 2 = , C 3 = , C 4 = , C 5 = and C 6 12 = are compared during parameter estimation. The model considers all olefins from C 2 = to C 12 = which have no or only methyl side groups, two side groups as maximum, no quaternary carbon atoms and which are not derivatives of 2,3-dimethylbutene. As reaction families, protonation, deprotonation, cracking, dimerization and two isomerization reactions (methyl shift and PCP branching) are implemented. This causes 4395 different elementary reactions. However, all steps where the carbon number is kept constant are assumed as quasi-equilibrated, meaning that 611 cracking and 293 dimerization reactions remain. Combined with the different protonation possibilities, 1585 pathways of kinetic relevance are considered. A representative reaction is shown in Scheme 13. Ethene is considered as product of irreversible cracking reactions, so no dimerization with ethene is implemented. Chemisorption of the reactants which is a combination of π complex and protonation is explicitly included, meaning that the cracking reactions are formulated with a combination of L and HW types of mechanism. For the dimerization, the second olefin is assumed to react directly out of the gas phase; this corresponds to coupled ER and HW types of mechanism. The equilibrium constants describing the π complex as well as the protonation values are extracted from a theoretical QM-PoT and statistical thermodynamics study by Nguyen et al. [167,243]. In Table 1, the total number of acid sites is shown. However, calculations are performed with the molar concentration of strong Brønsted acid sites per catalyst mass C t , SBAS which equals 0.135 mmol g cat 1 . Although the measurements revealed small amounts of pentane, cyclopentane, cyclopentene, methylcyclopentene and aromatics as side products, their formation is not included in the model because the mole fraction of all side products never exceeded 3% [163].
From the reaction rates, the net rates of production according to Scheme 14 are obtained. For better clarity, they are divided into olefins in the gas phase and the corresponding chemisorbed intermediates.

Parameter Estimation

The reaction rates in Scheme 13 require partial pressures. The objective function in this study evaluates the squared residuals between the molar flow rates of model and experiment. This value is minimized with a nonlinear and unweighted regression using the Levenberg–Marquardt algorithm of the routine lsqnonlin in MATLAB. The molar flow rates are obtained by applying the solver ode15s to the differential equations. As explained above, all adsorption and equilibrium constants are calculated before parameter estimation. Although a broad picture of the olefin interconversion is depicted, only five parameters are necessary. This is possible through the application of the single-event methodology which is extensively described in the literature [20,21,54,245]. Here, the estimated parameters are not related to single reactions, but to reaction families and to types of reactant and product intermediates. It follows that, for a certain reaction family such as cracking, only a handful of different combination possibilities and thus single-event rate constants k ˜ exist (see Scheme 13). All symmetry related information is considered via the number of single events n e , a value which can be calculated for each reaction. The principle of thermodynamic reversibility [246] is applied in the model by von Aretin et al. [164] to express all dimerization reactions with the cracking parameters and an equilibrium constant K ˜ RDS . For this, the thermodynamic equilibrium constant K ˜ TD is required. The five estimated values consist of four activation energies and one preexponential factor; the latter is assumed to be the same for all cracking reactions. During parameter estimation, the reparameterized Arrhenius approach is used, but with the additional temperature dependence of the preexponential factor (see Equation (23)). The reference temperature of 683 K is the mean value of the experimentally investigated range.

3.3.2. Summary

Similar to Huang et al. [166] und Ying et al. [236], the model by von Aretin et al. [164] can be applied to different olefins as feed. Through considering all possible reactions as well as the carbon number dependence of adsorption effects, this approach yields a realistic picture of overall reactivity. It can be further transferred to other catalysts because of a separation of kinetic and catalyst descriptors [54,244]. On the other hand, it has to be underlined that creation of such a model is very complex and time-consuming. Moreover, the computational power which is required is another disadvantage. Finally, the implementation of side product formation missing for this model is significantly more difficult compared to the approaches shown above.

3.4. Study Elucidating the Peculiarities over SAPO-34

3.4.1. Zhou et al.: Eight-Lump Model for C 2 = to C 4 = Feeds Considering Side Product Formation

Catalyst

In this work [77], a self-synthesized zeolite was used. Although the X-ray diffraction (XRD) pattern revealed a 50/50 structure of SAPO-18 and SAPO-34 fragments, it is referred to as SAPO-34 because both zeolite types show the same MTO performance according to the authors. The zeolite powder was sieved to a very fine fraction with a mean size of 3.2 μm. Because of the small pores within the eight-membered SAPO rings, the formation of olefins higher than C 4 = and even of isobutene was suppressed. During the measurements, the authors observed significant amounts of coke, which is why a closure of the carbon balances was not possible. Consequently, the kinetic measurements were recorded after 1 min TOS. The coke was analyzed by introducing air subsequent to the kinetic measurements and by monitoring the CO and CO 2 evolution with a TCD.

Setup and Conditions

Ethene, propene, 1-butene and 2-butene were separately investigated and therefore fed as gas. For this, a continuous fixed bed reactor made of quartz glass with an inner diameter of 6 mm was used. Only in three cases, the feed was diluted with nitrogen, but these data points are not considered during parameter estimation. For the remaining measurements, the partial pressure of the feed equaled the total pressure. In contrast to that, the catalyst bed was diluted each time with silica so that the ratio of bed height and bed diameter was approximately two. For product analysis, the authors applied a GC with one column and an FID.

Reaction Network

The kinetic description is conducted with eight responses during parameter estimation: C 2 = , C 3 = , C 4 = , C 5 = , C 1 , C 2 , C 3 and C 4 . An additional lump C x + is introduced which should resemble a higher protonated intermediate with arbitrary carbon number. For this, the pseudo-steady state approximation (PSSA) is applied since no experimental data for comparison are available. The authors justify this C x + lump by referring to the measurements which yield an olefin composition close to the calculated thermodynamic equilibrium on this specific catalyst regardless of the feed olefin used; thus, similar intermediates should be present. The experiments with either 1-butene or 2-butene as feed showed that the linear butenes can be summarized to one lump because isomerization is fast. However, isobutene is excluded from the reaction network due to steric hindrance. For the same reason, no higher olefins and no aromatics are included. This strong molecular sieving effect could be seen as a hint that the majority of acid sites is located within the micropores. In the resulting general reaction pathways, the feed olefin is converted to C x + ( k 1 k 6 ) and then further cracked to olefins ( k 7 k 10 ), as can be seen in Scheme 15. Through side reactions ( k 11 k 14 ), the olefins can also react to the respective paraffin, whereas the lump C x + is transformed to methane, respectively. This model considers the dimerization of ethene, both with itself and with propene or butenes. Only the paraffin formation is assumed to be irreversible. From the equations in Scheme 15, it can be seen that neither adsorption nor a mechanistic scheme are implemented. Furthermore, stoichiometry is neglected and the reactions are assumed to be of elementary type. Nevertheless, the order of both C 4 = and C 5 = dimerization is set to one.
The resulting net rates of production can be seen in Scheme 16. Here, the lump C x + is also shown. In the original publication [77], the concentrations of all olefins are summed up for the side product formation (see Steps 12–14). It is assumed here that the consumption through this summarized value is not included in the net rates of production of the respective olefins.

Parameter Estimation

All mass fractions in this study are defined on a carbon basis, whereas, in the rate equations, molar concentrations per volume have to be used. No information about the actual fitting routine can be found. Only rate constants are estimated because all data points were collected at constant temperature. The reaction network is restricted to the most important dimerization reactions in order to have not too many unknown parameters. This is why the dimerization reactions of ethene with propene and with butenes are assumed to have the same rate constant. For butenes and pentenes, only the self-dimerization is considered. Finally, 14 unknown parameters are obtained. Although only the undiluted measurements are used for parameter estimation, extrapolation to lower feed partial pressures is also possible according to the authors.

3.4.2. Summary

Compared to the other examples presented in this section, the maximum carbon number is significantly lower for Zhou et al. [77] because of the smaller zeolite pores. This is why a transfer of ZSM-5 models to SAPO-34 or the other way round is difficult. The approach via reactive intermediates chosen here leads to decent agreement with experimental data and covers also side product formation; however, mechanistic insight is difficult because the rate equations seem to be rather artificial. Furthermore, no adsorption or mechanistic effects are considered. Finally, application of this model is limited to 723 K .

3.5. Other Studies

Chen et al. [247] performed cracking experiments on a commercial ZSM-5 zeolite (Si/Al = 42.6) with single butene, pentene and hexene feeds between 773 and 813 K . Short contact times and low conversions were applied, so dimerization could be neglected. The corresponding model focuses on different cracking steps under these differential conditions, which means it does not describe the evolution along the reactor. However, insight into the energetics of the cracking pathways is provided. By making use of group additivity and correction methods, the formation of an alkoxide as intermediate is calculated. Moreover, the theoretical evaluation of the kinetic experiments yields intrinsic activation energies of the different cracking modes. It is shown that tertiary alkoxides have the lowest stability and therefore very small concentrations. Thus, the contribution of highly branched olefins to the overall cracking performance is smaller than expected although the activation energies starting from tertiary intermediates are in a similar range than for a secondary alkoxide reactant. These results are consistent with an earlier dispersion-corrected DFT study [248]. This model allows describing the cracking products of C 4 = to C 6 = olefin feeds with high accuracy. Moreover, it yields detailed insight into preferred reaction pathways; however, application is limited to differential conditions which excludes consecutive and side reactions. Furthermore, model build-up is comparably complex.
In a recent study, Li et al. [249] performed experiments over a commercial ZSM-5 zeolite with a Si/Al ratio of 50. After modification, the catalyst contained 4 % wt of phosphorus and 2 % wt of iron. Measurements were performed at temperatures between 763 and 883 K with butenes and pentenes as co-feed. The kinetic data are described with a six-lump model, which requires 24 parameters. The model does not consider any mechanistic approaches or adsorption effects, but covers a broad picture of olefin interconversion including side product formation.
The model by Meng et al. [250] is beyond the focus of this review because of liquid products.

4. Kinetic Models for Methanol-to-Olefins without Olefin Co-Feed

Firstly, both catalyst properties and experimental conditions as well as modeling details are presented in Table 3 and Table 4, respectively. Subsequently, the models are grouped into subsections, explained and compared in a short summary paragraph. This section presents all kinetic models for a feed of pure oxygenates, i.e., methanol or DME, which means that an initiation phase should be visible for short contact times (see Section 2.4.2). The first subsection contains the models by Menges and Kraushaar-Czarnetzki [139] and Jiang et al. [251] over ZSM-5 where methanol and DME are summarized to one lump, which means no differentiation of their reactivity is possible. The next subsection contains the models by Gayubo et al. [114], Aguayo et al. [252] and Pérez-Uriarte et al. [253], which are all created by the same research group. The one by Gayubo et al. [114] is the first MTO model published by this group, meaning that many elements from this approach can be found in the subsequent models and also in the one by Epelde et al. [235]. Nevertheless, all three models in this subsection have a different focus. An important similarity of them is the differentiation of methanol and DME. In the following subsection, the two microkinetic studies over ZSM-5 by Park and Froment [132,254] and Kumar et al. [19] are discussed. Whereas the former evaluates different possible mechanisms for the formation of the first C-C bond, the latter is a subsequent work which uses the same reaction network except for the mentioned C-C bond formation steps. Instead, these are replaced by reactions of the aromatic hydrocarbon pool. The last subsection involves different zeolites: Gayubo et al. [255], Ying et al. [256], Chen et al. [257] and Alwahabi and Froment [258] describe MTO over SAPO-34, whereas another model by Gayubo et al. [259] and another one by Kumar et al. [146] are valid over SAPO-18 and over ZSM-22, respectively. On all these zeolite types, deactivation is significant which is why the different approaches accounting for this fact should be compared. Both models by Gayubo et al. [255,259] are comparable to the ZSM-5 case, whereas the microkinetic studies of Alwahabi and Froment [258] and Kumar et al. [146] are subsequent models to Park and Froment [132,254] and Kumar et al. [19] over ZSM-5, respectively.

4.1. Studies with Lumped Oxygenates over ZSM-5

4.1.1. Menges and Kraushaar-Czarnetzki: Six-Lump Approach Focusing on Lower Olefins Production

Catalyst

In this study [139], a self-extruded catalyst was applied. It consisted of a commercial zeolite from Zeochem and aluminium phosphate from Riedel-de Haen. In earlier studies [264,265,266], both the high Si/Al ratio of 250 and the binder were shown to be advantageous for high propene yields. With regular binders such as alumina, the Si/Al ratio could decrease during extrusion because of alumination which means the migration of extra aluminium from the binder into the zeolite. Moreover, alumina is known to produce both methane and coke, whereas aluminium phosphate is non-reactive, leading to a catalyst which has the advantageous macropores, but no changed reactivity. For the kinetic experiments, the catalyst was shaped into cylinders. The measurements were performed with fresh catalyst up to a TOS of 3 h [262] to avoid deactivation effects. For the same reason, the combination of the highest reaction temperature with the highest methanol partial pressure was ignored.

Setup and Conditions

The measurements were performed in an electrically heated continuous stainless steel fixed bed reactor [262] with an inner diameter of 16 mm. The methanol feed was introduced via a saturator configuration with nitrogen as carrier and dilution gas. Isothermality and plug flow conditions were assured by having SiC particles in front of, behind and also within the catalyst bed. At the latter position, the temperature was controlled via a thermocouple. The setup also contained a pre-reactor with the same dimensions as the main reactor, but filled with 10 g alumina. At a temperature of 573 K , the equilibrated state between methanol, DME and water was reached when leaving the pre-reactor in order to be closer to industrial conditions. The GC for product analysis had an FID and one column, but could not separate side products. An internal standard was used and with the combination of an afterburner and an infrared (IR) spectroscopy, the amount of CO and CO 2 was analyzed to screen the carbon balance. More details about the setup can be found elsewhere [262]. In addition to the experiments with a pure methanol feed, C 2 = to C 4 = olefins were separately co-fed with methanol for mechanistic analyses, but not for extending into the model.

Reaction Network

During preliminary studies, the authors observed individual reactivities of the olefins with different carbon numbers, which is why they divided them into separate lumps. Moreover, the experiments with different methanol partial pressures showed a behavior which was not necessarily first order. Finally, the methylation reactions revealed a dependency on both methanol and olefin partial pressure. This leads to six lumps: Ox (methanol plus DME), C 2 = , C 3 = , C 4 = , C 5 = and C 6 + = . As it is obvious, no reaction between methanol and DME is considered. Some side products such as aromatics were measured, but could not be separated from the higher olefins and are thus not included in the reaction network. Because of the relatively high minimum conversion values, no initiation phase can be observed. Scheme 17 contains three different types of reactions: conversion of oxygenates to olefins ( k 1 k 4 ), methylation of olefins ( k 5 k 7 ) and cracking of higher olefins to C 3 = ( k 8 ). The latter step is the only one representing olefin interconversion which means no dimerization is implemented. Ethene is a final product arising only from the oxygenates as methylation is restricted to C 3 = , C 4 = and C 5 = . All steps are assumed to be irreversible. The influence of water is neglected as well as adsorption. The rate equations represent power law kinetics without any mechanistic background. From Scheme 18, it can be seen that stoichiometry is neglected for the net rates of production. The reaction orders result from a preliminary fitting, where these were also adjustable parameters and thus have no physical meaning. In [262], an alternate reaction network can be found which includes the dimerization of C 3 = , C 4 = and C 5 = to higher olefins, but which has no improvement in describing the experimental data.
The net rates of production are listed in Scheme 18; the stoichiometric coefficients are extracted from [262].

Parameter Estimation

For the rate equations in Scheme 17, molar concentrations per volume are necessary. These are obtained via the molar flow rate of the respective compound and the current total volumetric flow rate. The differential equations are integrated with the solver ode23s in MATLAB, whereas lsqnonlin minimizes the unweighted sum of squared residuals between the molar concentrations in model and experiment with the trust-region-algorithm. For the objective function, each residual is normalized by dividing it by the respective experimental value. An Arrhenius equation that is not reparameterized is used for the rate constants, which causes 16 unknown parameters: eight preexponential factors and eight activation energies.

4.1.2. Jiang et al.: Eight-Lump Model Including Side Product Formation

Catalyst

A commercial ZSM-5 zeolite by SINOPEC with a high Si/Al ratio of 200 was used [251]. The authors specify a TOS of 2 h , however, another 50 h prereaction phase was applied to reach a stable plateau of propene yield. The authors state this should avoid any deactivation effects impeding the kinetic measurements.

Setup and Conditions

The experiments were performed in an electrically heated continuous fixed bed reactor with an inner diameter of 20 mm. Here, relatively large particles (600–900 μm) could be investigated. Four thermocouples were installed to control the temperature: three outside of the tube at the top, the middle and the bottom, and one within the catalyst bed. The methanol was provided in liquid state and pumped through a vaporizer before entering the reactor. Neither feed nor catalyst dilution is mentioned. A GC equipped with one column and an FID enabled product analysis.

Reaction Network

The model is composed of eight lumps: Ox (methanol plus DME), C 2 = , C 3 = , C 4 = , C 5 + = , C 1 , C 2 and C 3 . It should characterize the reactivity in a moving bed reactor where the catalyst slowly settles down to be regenerated at the end. Such a setup would allow the use of a methanol feed of significantly less purity and an adjustment of the catalyst to have optimum performance. The reactions in Scheme 19 can be classified into five types: conversion of oxygenates to olefins ( k 2 and k 5 k 7 ) or to paraffins ( k 1 , k 3 and k 4 ), methylation of olefins ( k 8 ), cracking ( k 10 ) and a simplified hybrid reaction for C 4 = which should resemble both methylation and dimerization ( k 9 ). The two types of oxygenates are not differentiated. Ethene is a final product in the reaction network, thus not acting as reactant and not being methylated. Furthermore, because its formation is mechanistically separated from the other olefins, the authors omitted cracking reactions leading to C 2 = . As side products, small paraffins from C 1 to C 3 are included. Because of missing data points for short contact times, no initiation phase is detected. All steps are formulated as irreversible elementary reactions without any stoichiometry or adsorption effects.
This leads to the net rates of production presented in Scheme 20.
The reaction rates in Scheme 19 require mole fractions based on carbon. The objective function equals the unweighted sum of squared residuals between calculated and measured mole fractions and is minimized using lsqnonlin within MATLAB. The solver ode45 is applied to the differential equations. For parameter estimation, the reparameterized Arrhenius approach of Equation (21) is used with a reference temperature of 733 K , which is the upper limit of the investigated range. Twenty parameters have to be fitted: ten reference rate constants and ten activation energies.

Parameter Estimation


4.1.3. Summary

The underlying reaction networks of both models show several similarities. Manifold pathways converting oxygenates to lower olefins and describing methylation reactions are considered. These models are fast and simple because no oxygenates interconversion is regarded. However, the different reactivity of methanol and DME cannot be expressed. Furthermore, in both studies, olefin interconversion reactions are implemented in a simplified way, meaning that dimerization reactions are missing and cracking is limited to one step. Extrapolation is difficult because of missing adsorption and mechanistic assumptions; furthermore, stoichiometry is not retained throughout the whole models. The model by Jiang et al. [251] allows a description of side product formation.

4.2. Studies with Differentiated Reactivity of Methanol and Dimethyl Ether over ZSM-5

4.2.1. Gayubo et al.: Four-Lump Approach Analyzing the Inhibiting Effect of Water Adsorption

Catalyst

In this study [114], a self-synthesized ZSM-5 zeolite with a low Si/Al ratio of 24 was mixed with bentonite and alumina. The measurements were started after a TOS of 6 h , but, similar to Epelde et al. [235], the results are extrapolated to a TOS of 0 h . This routine should yield the performance of a fresh catalyst although deactivation is significant for this system according to the authors. In a subsequent study [267], the deactivation through coke is modeled based on the kinetics presented in this section. Furthermore, in another publication [268], the authors derived a kinetic description of the irreversible deactivation caused by dealumination.

Setup and Conditions

The automated reaction equipment is described in detail in an earlier contribution [269]. It consisted of a continuous stainless steel fixed bed reactor with an inner diameter of 7 mm. This unit was surrounded by an oven and allowed measuring the temperature at three locations within the catalyst bed: close to the reactor wall, in the center and at the end of the bed. Methanol was provided in liquid state and evaporated, whereas the setup enabled the feeding of both liquid and gaseous compounds. For product analysis, the authors used a GC which had three columns and both an FID and a TCD. Additionally, the GC was coupled with a Fourier transform infrared (GC-FTIR) and a mass spectrometer (GC-MS). The catalyst bed was diluted with inert alumina. For the kinetics, the authors applied pure methanol without any dilution as feed. However, the influence of water co-feeding could be investigated in parts of the measurements: the water to methanol ratio based on weight was either zero or one.

Reaction Network

Four lumps are defined: MeOH, DME, C 2 3 = and C 4 + HC . However, the latter is not fitted to experimental data, but calculated with the results of the remaining lumps and the conservation of mass. The assumed network can be divided into four parts (see Scheme 21): the reaction between methanol and DME ( k 1 ), oxygenates transformation to olefins ( k 2 and k 3 ), methylation reactions ( k 5 and k 6 ) and olefin interconversion ( k 4 , k 7 and k 8 ). The concentrations of oxygenates are not implemented as equilibrated: the authors observed a DME amount that is much lower than the theoretical equilibrium value and attributed this to the higher reactivity of DME. This is why the reaction to DME is implemented as kinetic step with the backward reaction being expressed via a thermodynamic equilibrium constant. For the latter, the empiric correlation by Spivey [117] is used, which itself is a citation from Hayashi and Moffat [110]. However, in Gayubo et al.’s publication [114], different numeric values for this correlation are used (see Section 2.1). All other steps in the reaction network are assumed to be irreversible. No initiation phase can be observed during the measurements. The methylation is implemented both via methanol and via DME to account for the different reactivities. In addition, the conversion to olefins can start from both types of oxygenates according to the model. The olefin interconversion is limited to one cracking step and two reactions to higher compounds. It can be seen in Scheme 21 that the reaction rates are expressed as HW type of mechanism. Only the adsorption of water is considered because this step is significantly slower compared to the hydrocarbons adsorption and not quasi-equilibrated according to the authors. Side products are not explicitly mentioned, but especially aromatics should be included in the lump C 4 + HC as it was done in an earlier model [270]. The reactions are defined as elementary steps, but no stoichiometry is considered.
The net rates of production for all four lumps are presented in Scheme 22.

Parameter Estimation

The reaction rates in Scheme 21 are defined with mass fractions of organic compounds where water is explicitly excluded. Even the mass fraction of water is related to the water-free composition. Integration of the differential equations is performed with a code written in FORTRAN which makes use of the DGEAR subroutine of the IMSL library. The objective function returns the sum of squared residuals between modeled and experimental organic mass fractions and is additionally divided by the number of lumps and experiments. This average value is then minimized with the Complex algorithm, as explained in earlier work [271]. After obtaining the parameters of best description, another fitting is performed with the Marquardt algorithm. Reparameterization according to Equation (21) is applied with a reference temperature of 673 K , which is in the upper third of the investigated range. For the DME transformation to olefins and the methylation via DME, the same activation energies as for the respective methanol related steps are assumed, which only requires the fitting of a separate preexponential factor. In total, 15 parameters are estimated: eight reference rate constants, six activation energies and one rate constant for water adsorption.

4.2.2. Aguayo et al.: Seven-Lump Model for Significant Side Product Formation and Resulting Interconversion Reactions

Catalyst

The authors [252] used a commercial ZSM-5 zeolite from Zeolyst International with a low Si/Al ratio of 30 which they further processed to an extrudate. The resulting catalyst showed sufficient activity at 0 h TOS during earlier studies [272], combined with high olefin selectivity, low coke amounts and increased hydrothermal stability. It could be shown that up to ten reaction–regeneration cycles without irreversible deactivation were possible with this catalytic system. The measurements were performed at a TOS of 5 h , but, although it is not explicitly mentioned, the results might be extrapolated to 0 h .

Setup and Conditions

A continuous fixed bed reactor made of stainless steel with an inner diameter of 9 mm and surrounded by a heated steel chamber with a ceramic cover was applied. The temperature was measured inside the catalyst bed and also within the chamber and at the transfer line connecting the GC. The setup allowed providing methanol in liquid state which was evaporated before being fed to the reactor. More details about the reaction equipment which has many similarities to Epelde et al. [235] are shown in earlier work [272]. The catalyst bed was diluted with SiC in a way that the bed height remained almost constant. The authors analyzed the products with a micro GC equipped with three columns and a TCD.

Reaction Network

In this model, seven lumps are defined: MeOH, DME, C 2 4 = , C 5 + HC , C 1 , C 2 4 and C n 4 . The lump C 5 + HC comprises C 6 8 aromatics as well as C 5 10 aliphatics. In Scheme 23, eight different types of reactions can be identified: the one between methanol and DME ( k 1 ), the conversion of oxygenates to olefins ( k 2 and k 3 ), methylations ( k 5 and k 6 ), olefin interconversion ( k 9 ), olefin–paraffin interconversion ( k 7 and k 8 ), paraffin formation through oxygenates ( k 4 ) or olefins ( k 10 and k 11 ) and aromatization steps ( k 12 and k 13 ). A separate consideration of n-butane is performed because it was co-fed with methanol in an earlier study [272]. All reaction steps except the one between methanol and DME are treated as irreversible. Because the authors performed measurements at relatively short contact times, the initiation phase is clearly visible which means that no detectable conversion to hydrocarbons and only oxygenates equilibration takes place. Nevertheless, the methanol dehydration is implemented as step of kinetic relevance. Its backward reaction is expressed via a thermodynamic equilibrium constant which is calculated with an own correlation derived in another publication [109] (see Section 2.1). As in Gayubo et al.’s model [114] (Section 4.2.1), both methanol and DME can perform methylation reactions, which yields not only higher hydrocarbons, but also lower olefins. Both types of oxygenates can be converted to olefins or to methane; in the latter reaction, no differentiation between the reactivity of methanol and DME is performed. The olefin interconversion is restricted to one cracking step, whereas dimerization is neglected. Instead, several reactions starting with or leading to paraffins are implemented. The interaction between the formed water and the zeolite is not considered. Neither a mechanistic model nor any adsorption effects are included. The reactions are assumed to be elementary, except for steps k 10 and k 11 which are arbitrarily set to second order because of a better agreement with experimental data. Stoichiometry is not considered for the net rates of production; as for the second order reactions in Steps 10 and 11, the reaction rates of Steps 12 and 13 are arbitrarily multiplied by 2.
Scheme 24 contains the net rates of production of the different lumps.

Parameter Estimation

Whereas the mole fractions shown in the figures of Aguayo et al. [252] are defined with carbon units, regular mole fractions including water have to be inserted for the rate equations in Scheme 23. The kinetic parameters are obtained via multivariable nonlinear regression using MATLAB. The objective function returns the weighted sum of squared residuals between modeled and measured output, see Section 3.1.1 and an earlier publication [273] for details. Reparameterization according to Equation (21) is performed with a reference temperature of 773 K which is in the upper third of the investigated range. Finally, 26 parameters have to be fitted: 13 reference rate constants and 13 activation energies.

4.2.3. Pérez-Uriarte et al.: Eleven-Lump Approach for Dimethyl Ether Feeds

Catalyst

A central difference of this study [253] is the use of DME as feed which changes oxygenates conversion, product selectivities and deactivation rates and therefore requires different conditions and kinetic models [274]. The authors extruded a commercial high-silica (Si/Al = 280) ZSM-5 catalyst from Zeolyst International with boehmite from Sasol as binder and with α -alumina as inert filler. This composition showed a satisfying compromise between activity, stability and mechanical resistance in earlier work [275] through moderate acidity, a mesoporous structure and additional acid sites through γ -alumina, which is a calcination product of boehmite. The measurements were performed at 0.17 h TOS, but extrapolated to 0 h in order to represent the fresh catalyst. Deactivation through coke should be higher compared to methanol feeds according to the authors because of the lower water content. These effects are ignored in this study, but considered in a subsequent kinetic model of deactivation [276].

Setup and Conditions

The setup was almost identical to the studies by Aguayo et al. [252] and Epelde et al. [235] (see Section 3.1.1 and Section 4.2.2 as well as [275] for more details). Additionally, liquid components could be fed by pumping them through an evaporator. Besides the experiments with pure DME as feed, some other combinations with DME/helium, DME/methanol and DME/water mixtures were investigated and are also included in the model. The catalyst bed was diluted with SiC particles to reach a uniform height of 50 mm. A GC with four columns and a TCD enabled product analysis.

Reaction Network

Eleven lumps are defined: MeOH, DME, C 2 = , C 3 = , C 4 = , C 5 + = , C 1 , C 2 4 , C 6 8 ar , CO and H2O. For parameter estimation, the amount of water is not fitted to the experimental data, thereby reducing the number of responses in Table 4 to ten. The steps in Scheme 25 can be summarized to nine sections: DME to lower olefins ( k 1 ), the reaction between DME and methanol ( k 2 ), methanol to lower olefins ( k 3 ), reactions of lower olefins with DME ( k 4 k 6 ) or with methanol ( k 7 k 9 ), conversion of lower to higher olefins ( k 10 , k 10 and k 10 ), formation of BTX aromatics and lower paraffins out of higher ( k 11 ) or lower olefins ( k 12 , k 12 and k 12 ) and DME cracking to CO and methane ( k 13 ). It follows that the differing reactivity of methanol and DME is considered; both can react either to or with lower olefins. The mechanism of the latter step is not resolved, but it is different to the methylations postulated in other models. For the oxygenates interconversion, no instant equilibrium is assumed, causing a kinetic rate constant; for the backward reaction, the same equilibrium constant as for Aguayo et al. [252] is assumed. In the experimental data, no initiation phase can be observed, which might be either due to relatively high minimum contact times or due to the higher reactivity of DME. The olefin interconversion includes only dimerization, no cracking is included. The different reactivity for ethene and butenes compared to propene is accounted for via multiplying the rate constant for propene with a specific factor. The same is done for the side product formation out of these olefins. Besides C 2 4 paraffins and BTX aromatics, methane and CO are implemented, both being directly produced out of DME. All steps are formulated as elementary reactions, but with partially deviating reaction orders and except for the reaction between the oxygenates, all steps are irreversible. For the HW type of mechanism, the adsorption of methanol and water is considered with a common equilibrium constant K MW ads . Arbitrary values are used for the stoichiometric coefficients (see Scheme 26). The reaction network is compared with two other versions where Steps 4–9 are summarized to two reactions or where more olefin interconversion steps are implemented [253]; however, statistical evaluation proves that no improvement is achieved with these two variations.
The net rates of production are presented in Scheme 26.

Parameter Estimation

According to the authors, the mole fractions are defined with carbon units and therefore only for carbon containing species which pertains for the partial pressures. The numeric routine is similar to Epelde et al. [235] and is therefore described in Section 3.1.1. As reference temperature, 623 K is chosen, which is within the lower third of the pure DME experiments. Thirty parameters have to be estimated: 13 reference rate constants, 13 activation energies, 1 reference equilibrium constant, 1 adsorption enthalpy and 2 factors relating the rate constants for ethene and butenes with that of propene.

4.2.4. Summary

All models in this subsection differentiate the methylation via methanol and via DME. However, this causes several additional parameters, not only for the methylations themselves, but also for the interconversion of the oxygenates. In all three examples, the latter reaction is implemented as step of kinetic relevance with the backward reaction being described by the thermodynamic equilibrium constant. For this value, no reasonable results are obtained with the equation shown in [114], whereas the outcome for the other two models is close to thermodynamics. When a detailed description of lower olefins is desired, the combined ethene and propene lump of Gayubo et al. [114] might be problematic. In addition, no side products are described here. On the other hand, this model explicitly includes the effect of water adsorption, similar to Pérez-Uriarte et al. [253]. Moreover, Gayubo et al. [114] described olefin interconversion in a simple, but effective way. In contrast, more reactions were considered by Aguayo et al. [252]. Here, the separate description of n-butane is noteworthy. In general, this model is useful for significant side product formation: these evolve to such an extent that they interact with olefins. In this model, both adsorption and mechanistic effects are missing. These were considered by Pérez-Uriarte et al. [253] who, besides water, implemented methanol adsorption. Further improvement would be possible through extending this with olefin and DME adsorption. Their model is the only one in the review that is explicitly created for DME feeds. Nevertheless, it should be also valid at least for oxygenates mixtures as feed. A vast reactivity including side products is covered by the reaction network of Pérez-Uriarte et al. [253]; however, some reactions and especially their stoichiometry seem to be arbitrarily chosen. Furthermore, the number of estimated parameters is comparably high.

4.3. Microkinetic Studies over ZSM-5

4.3.1. Park and Froment: Analysis of First C-C Bond Formation Mechanisms

Catalyst

A self-synthesized ZSM-5 zeolite powder having a high Si/Al ratio of 200 was used without any binder [132,254]. The particle size of 500–1000 μm was small enough to exclude any effects of heat and mass transfer limitations according to the authors. Until 5 h TOS, no deactivation effects could be observed. Complete catalyst regeneration in air was possible up to 50 times.

Setup and Conditions

The measurements were performed in a continuous fixed bed stainless steel reactor with an inner diameter of 21.4 mm. A tube made of titanium was chosen for experiments at temperatures higher than 723 K . The reactor could be positioned within a molten salt bath during reaction. For product analysis, a GC with several columns, an FID and a TCD was applied with nitrogen as internal standard. Moreover, the authors evaluated the C 6 + fraction with a GC-MS. The catalyst bed was diluted 5:1 in a volumetric ratio using glass beads; these were also stacked in front of the catalyst bed. The latter was located on a stainless steel sieve and both glass wool and beads were placed in between. For dilution of the gaseous methanol feed, both water and nitrogen were used. The temperature within the bed could be controlled with a thermocouple sliding inside a well. More details about the setup can be found in [277].

Reaction Network

In the original publications [132,254], a detailed overview of all included reactions, rate equations and net rates of formation can be found. This is why only references and no schemes are shown here. In this microkinetic study, formation of the first C-C bond is modeled with the oxonium ylide mechanism [278]. This route comprises the formation of an oxonium methylide (OM) out of a surface methyl group ( R 1 + ) and a basic site (Step (iii.a”.1) in Table 1 in [254]), the reaction of OM and a protonated DME species (DMO + ) to protonated ethene and methanol (Step (iii.a”.2) in Table 1 in [254], LH type of mechanism) as well as to protonated propene and water (Step (iii.a”.4) in Table 1 in [254]). Similar to these three steps, the deprotonation of ethene is also considered as reaction of kinetic relevance (Step (iii.a”.3) in Table 1 in [254]). Both formation steps of the DMO + species are assumed to be irreversible. The surface methyl group is formed by methanol protonation (Step (i.1) in Table 1 in [254]) and subsequent water release (Step (i.2) in Table 1 in [254]). This surface group can perform methylation reactions; when methanol is the other reactant, DMO + is the product (Step (i.3) in Table 1 in [254]) whose desorption releases DME (reverse reaction of DME protonation, Step (i.4) in Table 1 in [254]). Another pathway starting from these two reactants is the formation of methane and formaldehyde (Step (ii.1) in Table 1 in [254]). Whereas the two protonations are assumed to be quasi-equilibrated, the remaining steps are kinetically relevant; except for the methane formation, all reactions are further assumed to be reversible. The surface methyl group can also methylate gas phase olefins (ER type of mechanism); all possible steps for C 2 –C 7 as reactants are included (Table 3 in [254]). In the olefin interconversion network, all cracking (Table 5 in [254]), dimerization (Table 4 in [254]) and isomerization steps are implemented for a maximum carbon number of eight. Only methyl side groups are allowed because of the small ZSM-5 pores. On the other hand, quaternary carbon atoms are considered. All steps starting from or leading to a primary intermediate are excluded except for ethene methylation and ethene self-dimerization to butene. It follows that methylation reactions are assumed to be irreversible in contrast to cracking/dimerization. The isomerization, protonation and deprotonation steps are assumed to be quasi-equilibrated. Cracking and dimerization are expressed as L and ER types of mechanism, respectively, where protonation of the gas phase olefins leads to the surface intermediates. Finally, 172 pathways of kinetic relevance remain in the whole network. No side product formation is covered by this model because only measurements at methanol conversions less than 0.7 are included. In this regime, side product formation is negligible. Only 31 of the original 222 data points are evaluated by the model. For comparison with the experimental results, the isomers of same carbon number are lumped, leading to the following fitting responses: DME, C 2 = , C 3 = , C 4 = , C 5 = , C 6 = , C 7 = , C 8 = and C 1 . The corresponding net rates of formation, in the same order, are formulated in Equations (8), (9), (11), (31) (exemplary equation for C 4 = –C 8 = ) and 7 in [254]. The reaction rates for methylation, dimerization and cracking are shown in Equation (24) in [254]. The concentration of reactive intermediates, i.e., surface methyl group and OM, is accessed via the PSSA (Equations (14) and (16) in [254]) and site balances are applied both for acid and for basic centers (Equations (21) and (23) in [254]) according to a HW type of mechanism.

Parameter Estimation

Results in [132] are shown with weight based yields, whereas the rate equations require partial pressures. The objective function compares the weighted squared differences of measured and modeled yields; the weighting factors are not obtained via replicate experiments, but calculated via Equation (30) where −1 as exponent is replaced by 0.3 for C 7 = , C 8 = and C 1 . Integration of the differential equations of stiff character is performed using Gear’s method. The deviation between model and experiment is minimized via a hybrid genetic algorithm (GA) approach [279]: at first, the GA searches for parameters satisfying the constraints and lowering the objective function to a significant extent. When these conditions are fulfilled, two local optimizers use the initial guesses obtained by the GA: a sequential quadratic program called FFSQP, which also considers constraints and the Levenberg–Marquardt algorithm for an unconstrained final parameter estimation. Even when a suitable solution is found, new initial guesses are tried up to the maximum number of GA iterations. Through this routine, finding of the global minimum should be ensured. For the GA, values of 0.10 and 0.005 are chosen for the crossover and mutation probability, respectively. The mentioned constraints should avoid physically unreasonable values, i.e., negative activation energies or positive reaction enthalpies for methylation and dimerization; furthermore, the protonation values have to match Boudart’s criteria [280]. Finally, the higher the carbon number, the lower the protonation enthalpy should be. All the linearized constraints can be found in Table 2 in [132]. Except for the methylation and dimerization rates, reparameterization is performed according to Equations (22) and (25); Table 1 in [132] contains all dimensionless fitting parameters. Their number is drastically reduced by using the single-event methodology [20,21] in combination with the Evans–Polanyi relation [281] and the concept of thermodynamic consistency [246]. The required thermodynamic data are calculated via Benson’s group contribution method [96] as well as via quantum chemical approaches. In total, 33 values have to be estimated: eight preexponential factors, eight activation energies, nine protonation enthalpies, three protonation entropies, one hydration enthalpy, one hydration entropy and one combination of preexponential factor, activation energy and transfer coefficient for the Evans–Polanyi relation (see Table 3 in [132] for the values). This model is used in a subsequent study to simulate isothermal fixed bed and adiabatic multi stage reactors [282].

4.3.2. Kumar et al.: Implementation of Aromatic Hydrocarbon Pool

Catalyst

The authors [19] used the same catalyst as Park and Froment [132,254], see Section 4.3.1.

Setup and Conditions

The setup is already explained in Section 4.3.1.

Reaction Network

In contrast to the previous microkinetic implementation [132,254], the conversion of oxygenates to lower olefins is implemented via the side-chain mechanism of the aromatic hydrocarbon pool according to Arstad et al. [195] (see Figure 1 in [19]). The formation of these polymethylated aromatics is not described by the model, but their contribution to the overall MTO reactivity is explicitly considered. Starting from para-xylene, a sequence of methylations (Steps (i), (iii) and (vi) in Figure 1 in [19]), deprotonations (Steps (ii), (v) and (viii) in Figure 1 in [19]) and dealkylations (Steps (iv) and (vii) in Figure 1 in [19]) releases ethene and propene. All these steps are assumed to be reversible and of kinetic relevance. The DME and methane formation (Steps (i)–(v)) is implemented in a similar way to Park and Froment [132,254] (see Section 4.3.1). Finally, olefin interconversion is accounted for up to a maximum carbon number of seven. This excludes all transformations of a tertiary reactant to a tertiary product intermediate. Moreover, the ethene self-dimerization is not considered. The other assumptions of Park and Froment [132,254] are retained, including the negligence of side products. The protonation is extended with a physisorption step before, the data for which are taken from Denayer et al. [283,284]. The reaction network leads to 64 pathways of kinetic relevance. The experimental data are fitted to eight responses: DME, C 2 = , C 3 = , C 4 = , C 5 = , C 6 = , C 7 = and C 1 . The net rates of formation for DME, ethene, propene and methane can be found in Equations (12), (13), (16) and (17) in [19]. For the higher olefins, this coherence is not shown, but it follows from a summation of all methylation (Equation (18)) and alkylation rates (Equation (19)) where these species are involved. The amount of methanol and water is calculated using a carbon and hydrogen balance, respectively. The concentration of surface methyl groups and the seven intermediates in the aromatic hydrocarbon pool follows from applying the PSSA (Equations (15) and (14) in [19]). In addition, the total concentration of all aromatic hydrocarbon pool species is fitted (Equation (26) in [19]); the value is comparable to a concentration of active catalyst sites. The balance for the acid sites is found in Equation (29) in [19].

Parameter Estimation

All figures in [19] use weight based yields. For the reaction rates, partial pressures have to be used. The objective function evaluates the weighted squared residuals between calculated and measured molar flow rates and is minimized by a combination of a Rosenbrock and a Levenberg–Marquardt algorithm. For the former, an in-house code is used, whereas the latter is provided by the ordinary least-squares option of ODRPACK, version 2.01, from Netlib. Integration of the differential equations is performed by DDASPK, which is also part of Netlib. Here, a consistent set of boundary conditions is required, which is accessible for the gas-phase species, but not for the reactive intermediates. The latter is obtained by applying the numerical routine DNSQE which solves the PSSA conditions via a hybrid Powell method. The weighting factors are calculated according to Equation (30). For parameter reduction, the single-event methodology [20,21] is applied as well as the thermodynamic consistency [246]. In addition, all protonation entropies and preexponential factors are calculated before fitting based on statistical thermodynamics and the principle of microscopic reversibility [18] (see Table 3 in [19]). Here, the necessary values for entropy changes are extracted from databases [80], calculated via group contribution methods [96] or obtained via DFT. The aromatic hydrocarbon pool is characterized by only one average concentration and, finally, two deprotonation, two methylation and two dealkylation steps within this catalytic cycle are assumed to have similar activation energies. During fitting, Boudart’s criteria [280] and the ordering according to carbon number are introduced as constraints for the protonation enthalpies. The rate constants are reparameterized according to Equation (21). Finally, besides the total concentration of aromatic hydrocarbon pool species, 29 parameters are fitted: 21 activation energies and eight protonation enthalpies.

4.3.3. Summary

Both models show high complexity and cause much computational effort therefore. On the other hand, an almost complete picture of reactivity is obtained here as the reaction network covers oxygenates interaction, olefin production out of oxygenates, methylation and olefin interconversion reactions. Only side product formation is left out because the maximum methanol conversion is limited to 0.7. In contrast to all other models in this review, the formation of lower olefins out of the oxygenates is not simply characterized by an arbitrary rate equation; in contrast, the pathways and intermediates are included. Whereas Park and Froment [132,254] focused on the formation of the first C-C bond on a direct way, Kumar et al. [19] considered the indirect formation via the aromatic hydrobarbon pool. In both models, the interaction between water and the zeolite is assumed to be negligible.

4.4. Studies with Significant Deactivation Effects over SAPO-34, SAPO-18 and ZSM-22

4.4.1. Gayubo et al.: Six- and Five-Lump Approach with and without Differentiation in Side Products over SAPO-34

Catalyst

The authors [255] synthesized a SAPO-34 zeolite with moderate acid strength that consisted mainly of Brønsted acid sites [261]. After that, the final catalyst was obtained by mixing the zeolite with bentonite and inert alumina. The deactivation through coke is considerably fast over SAPO-34 systems: it was observed that, under harsh conditions, 3–4% of the methanol fed was deposited on the catalyst even during the first minute TOS. However, this coking rate could be decreased through higher water contents, temperatures or contact times. The maximum coking rate under water co-feeding was 1%. Nevertheless, the measurements were performed at a TOS of 1 h with the results being extrapolated to the fresh catalyst.

Setup and Conditions

The experimental setup was the same as for Gayubo et al.’s model over ZSM-5 [114]; for more details, refer to Section 4.2.1 or [269]. For the SAPO-34 experiments, the catalyst was diluted 1:3 on a weight base with alumina. Furthermore, dilution of the methanol feed with water was performed with the following weight ratios: 0, 1 and 3.

Reaction Network

In this model, six lumps are applied: Ox (methanol plus DME), C 2 = , C 3 = , C 4 = , C 5 = and C 1 4 . Consequently, no differentiation and no reactions between the oxygenates are considered. Their amount is not fitted to experimental data, but calculated via conservation of mass. No methylation reactions are included; the network in Scheme 27 is restricted to either oxygenates conversion to olefins ( k 1 k 4 ) or olefin interconversion ( k 6 k 8 ). The latter comprises conversion of C 3 = to C 5 = olefins to ethene and propene. In this model, ethene is seen as final product because it cannot act as reactant. Similar to Zhou et al. [77], no compounds with more than five carbon atoms are detected because of the shape selectivity. For the same reason, the amount of isobutene is lower than expected. Side product formation is considered as oxygenates conversion to C 1 4 paraffins ( k 5 ). All steps are assumed to be irreversible and elementary, whereas stoichiometry is neglected; the consumption of pentenes in Scheme 28 is arbitrarily set to two. Water adsorption is taken into account according to the ZSM-5 model by the same group [114], meaning that the reaction rates in Scheme 27 are formulated as HW type of mechanism where the adsorption of all hydrocarbons is not considered.
The resulting net rates of production can be found in Scheme 28.
Compared to the model with six lumps, C 5 = and C 1 4 are summarized to the lump Rest. Furthermore, all olefin interconversion reactions are neglected (see Scheme 29). The resulting network thus only considers oxygenates conversion to olefins and to the Rest lump.
The network reduces the net rates of formation to the ones in Scheme 30.

Parameter Estimation

The numeric routine is similar to the ZSM-5 model by Gayubo et al. [114] (see Section 4.2.1). The reference temperature for reparameterization is set to 698 K which is close to the mean value of the experimentally covered range. The reaction scheme causes 17 unknown parameters: eight reference rate constants, eight activation energies and one equilibrium constant for water adsorption. As for the study over ZSM-5, the latter value is determined to unity, which converts the organic mass fractions to total mass fractions. Because of the poor numeric significance of the estimated parameters in Scheme 27, the network is reduced to five lumps in the following. For the version with five lumps, only eight parameters have to be estimated due to the simplified network: four reference rate constants and four activation energies. The equilibrium constant of water adsorption is kept fixed at a value of 1.

4.4.2. Ying et al.: Seven-Lump Model with Subsequent Fitting of Deactivation Parameters over SAPO-34

Catalyst

The authors [256] used the commercial DMTO catalyst by Chia Tai Energy Materials in order to ensure transferability of their model to an industrial plant. It is based over SAPO-34 crystals. Because of confidentiality, not many details about the final catalyst extrudate are given. Concerning the kinetic model, the measured data were obtained with a fresh catalyst. In addition to this, the authors analyzed deactivation effects using TOS values up to 1.67 h . For this, they applied a fluidized bed reactor because coke evolution in a fixed bed is prone to zoning effects, which cause a non-uniform coke distribution. The authors found that the reactor type has no influence on the final coke content. Furthermore, the coke growth rate was comparably high at the beginning and leveled off towards the maximum. At a certain deactivation level, the catalyst showed a maximum olefin production rate. This is why the authors include a seventh step to their kinetic scheme which accounts for coke formation out of methanol. The other six reaction rates are multiplied by a deactivation value φ l . This stems from an exponential approach consisting of several constants and a rate-specific value α l . The deactivation model as well as the resulting reactor model is beyond the scope of this review, so the reader is referred to the original contribution [256].

Setup and Conditions

The experiments were performed in a continuous fixed bed quartz glass reactor with an inner diameter of 4 mm. The liquid feed consisted of either pure methanol or a water–methanol stream with a molar ratio of 2:1 or 4:1; it was vaporized before entering the reactor. A GC with one column and an FID was used for product analysis. For the coking experiments, the authors applied a fluidized bed reactor with an inner diameter of 19 mm where the evolved coke could be evaluated via TG.

Reaction Network

The reaction network in Scheme 31 considers no DME formation; all reactions start from methanol as reactant. These steps are assumed to be irreversible and lead to both olefins ( k 2 , k 3 , k 5 and k 6 ) and paraffins ( k 1 , k 4 and k 6 ). Neither methylations nor olefin interconversion reactions are implemented. The following lumps are defined: MeOH, C 2 = , C 3 = , C 4 HC , C 1 , C 3 and C 2 , 5 , 6 HC . The latter comprises both olefins and paraffins with five and six carbon atoms as well as ethane. In preliminary experiments, no further side products and no higher compounds could be detected. Water attenuates the overall reaction rates, which is why its adsorption is included via a HW type of mechanism. The interaction of the hydrocarbons with the acid sites is neglected. All reactions are formulated as first-order with respect to methanol, which is the result of an experimental observation. Stoichiometry is retained for the net rates of formation.
An overview of the net rates of formation can be found in Scheme 32.

Parameter Estimation

In Scheme 31, molar concentrations per volume have to be used for organic compounds while the water content is expressed as mass fraction. Whereas water is excluded for the figures shown in [256], the integrated rate expressions lead to mass fractions where water is included. Parameter estimation is performed via the Levenberg–Marquardt algorithm which minimizes the objective function. The latter returns the weighted sum of squared residuals between the modeled and the experimental mass fractions, but the calculation of the weighting factors is not shown. The adsorption equilibrium constant of water is assumed to be the same for all steps. Reparameterization according to Equation (21) is performed with a reference temperature of 723 K , the lowest experimentally investigated value. In total, without the coking values, 13 parameters are obtained: six reference rate constants, six activation energies and one equilibrium constant for water adsorption.

4.4.3. Chen et al.: Seven-Lump Model with Simultaneous Fitting of Deactivation Parameters over SAPO-34

Catalyst

A commercial SAPO-34 powder from SINTEF was used [257]. As it is known for this zeolite type, the coking rate was high and significant deactivation could be observed from the beginning on. In an earlier contribution [285], a detailed kinetic model of the coke evolution was derived. For [257], a simpler approach via a linear function is chosen: a deactivation constant α l is multiplied by the weight percent of coke on the catalyst; subtracting the result from 1 yields the corresponding deactivation function φ l . It depends on the reaction step l because of a selective deactivation, which means the higher the carbon number, the more selectivity loss through coke deposition can be observed. The authors supposed changes in shape selectivity for this behavior.

Setup and Conditions

The experiments were performed in a tapered element oscillating microbalance reactor which is described elsewhere [263,286]. This allowed for measuring mass changes without bypass effects, making it a useful tool to measure product evolution and coke formation, equivalent to main and deactivation kinetics, simultaneously. The setup exhibited fixed-bed characteristics with almost gradientless operation. Temperature control was ensured by two thermocouples, one at the outside and one below the outlet of the reactor. The latter consisted of proprietary glass. Liquid feeds were provided from a storage cylinder and evaporated. The catalyst bed was diluted with quartz particles and the feed stream with helium. Because of the rapid deactivation, methanol was fed in pulses of 3 min at mild and of 1 min at harsh conditions. It could be shown that such a procedure does not affect conversion and selectivity [285]. For the same reason, not all combinations of conditions shown in Table 4 were performed (see [257]). The products were analyzed via a GC using one column and an FID.

Reaction Network

The reaction network is derived from preliminary measurements evaluated via yield-conversion plots. For one specific condition, several pulse amounts are applied. When connecting all data points of the first pulse, an optimum performance envelope is obtained, which gives further insight. The authors concluded that all olefins are stable secondary products forming in parallel out of DME. The effect of side reactions is low because of high WHSV values; only the stable tertiary products ethane and propane are produced at high oxygenates conversions. Methane is also detected as stable primary and secondary product, but it is excluded from modeling because of very small mole fractions. As coke deposition is significant throughout all experiments, its formation has to be included in the reaction network. It is classified as stable secondary and tertiary product. These observations lead to seven lumps: Ox (methanol plus DME), C 2 = , C 3 = , C 4 = , C 5 = , C 6 = and C 2 3 . Scheme 33 includes two different types of reactions, the conversion of oxygenates to olefins ( k 1 k 5 ) and the subsequent reaction of olefins to paraffins ( k 6 ). Consequently, no methylation reactions are considered and the reactivity of methanol is restricted to the step converting it to DME. Both oxygenates are summarized to one lump because of intracrystalline diffusion effects, which impede the reliable modeling of DME evolution. As mentioned above, although being lumped together with methanol, the olefin formation is assumed to originate only from DME. No olefin interconversion reactions are considered which is justified with their comparably low reactivity. The reaction rates are formulated as irreversible elementary steps without any stoichiometry. Neither the effect of water nor adsorption phenomena are implemented. An initiation phase is not observed, but the autocatalytic effect should be significantly lower over SAPO-34 according to the authors.
The resulting net rates of formation are listed in Scheme 34.

Parameter Estimation

Conversions and selectivities are based on carbon units, as is the mole fraction of oxygenates in Scheme 33. Here, the inlet partial pressure of methanol is also necessary. The reaction rates depend on the coke content wherefore a uniform distribution is assumed. The objective function which equals the weighted sum of squared residuals between predicted and measured mole fractions is minimized using lsqnonlin in MATLAB with the Levenberg–Marquardt algorithm. No information about the calculation of the weighting factors is given. The differential equations are integrated via a fourth-order Runge–Kutta method. The parameters of best description shown in Scheme 33 are obtained via isothermal regression at the four different temperatures and a subsequent Arrhenius plot. This causes twelve unknown values during one fitting run: six rate constants and six deactivation constants.

4.4.4. Alwahabi and Froment: Microkinetic Implementation over SAPO-34

Catalyst

The investigated SAPO-34 zeolite [258] powder had a small particle size of 1.1 μm. Measurements were performed after 0.25 h TOS where neither deactivation effects nor coke could be observed. In the final section of [258], TOS values of up to 3 h were achieved to model deactivation effects.

Setup and Conditions

For the measurements, a continuous fixed bed reactor was used. The feed consisted of 80 % mol water to suppress deactivation effects. The catalyst bed was diluted 1:4 on a weight base with α -alumina in three layers. All experimental data points are shown in [287].

Reaction Network

The same network as for the work by Park and Froment [254] is applied. Thus, 172 pathways of kinetic relevance are included. However, because of the smaller catalyst pores, fitting is only performed for the following responses: DME, C 2 = , C 3 = , C 4 = , C 5 = and C 1 .

Parameter Estimation

The numerical method is identical to Park and Froment [254]. Due to the lack of higher olefins in the product stream, three parameters are missing here, i.e, protonation enthalpies of C 6 = , C 7 = and C 8 = .

4.4.5. Gayubo et al.: Four- and Five-Lump Approach Including Deactivation Parameters over SAPO-18

Catalyst

A self-synthesized SAPO-18 zeolite was further processed to an extrudate [259]. The total number of acid sites was smaller compared to SAPO-34 and the acid strength was lower with a more uniform distribution which caused less deactivation. The measurements were performed up to a TOS of 1.5 h .

Setup and Conditions

In this study, a fluidized bed reactor with an internal diameter of 20 mm was applied. The catalyst bed was placed on a porous plate at a height of 285 mm from the bottom (total height of 465 mm). A ceramic chamber with a heating surrounded the whole reactor where the feed reactants were provided in liquid state. The temperature was measured both within the catalyst bed and in the vaporization chamber. A GC equipped with one column and an FID was used for product analysis. The whole setup is explained in detail in another publication [288]. For the experiments, alumina as diluent was mixed with the catalyst using a ratio of 1:4 on a weight base. Feed compositions with different gravimetric water/methanol ratios from 0 to 3 were analyzed.

Reaction Network

As it is obvious from Scheme 35, this model describes the reaction system with four lumps: Ox (methanol plus DME), C 2 5 = , C 1 and Int. The latter considers the initiation phase during which the oxygenates build up the first compounds of the hydrocarbon pool which themselves react with further oxygenates to higher intermediates (see Section 2.4.2). This lump is not further classified, but both the formation out of oxygenates ( k 2 ) and the autocatalytic behaviour ( k 3 ) are taken into account. The two remaining steps describe the olefin ( k 4 ) and methane ( k 5 ) evolution, the latter being the only side product detected. Because of the small pores, no species with a carbon number higher than five are detected. Although the reaction between methanol and DME is shown with a kinetic rate constant ( k 1 ) in the original publication, which is similar to the ZSM-5 model by the same authors [114] (see Section 4.2.1), both oxygenates are summarized to one lump in the model [260]. In another study [288], the authors observed that the amount of intermediates is almost independent of contact time. Thus, their evolution is only evaluated as time-dependent variable (see Scheme 35). The adsorption of water is assumed to attenuate the other reaction rates which is why the equations are written as HW type of mechanism without the adsorption of all other compounds. The steps are implemented as elementary reactions and no stoichiometry is retained. All steps are defined as irreversible. The models also describes the deactivation through coke deposition. For this, a rate constant for deactivation is introduced. Furthermore, all reaction rates except for methane production are multiplied with the activity a. This value expresses the ratio of the olefin production rate at a certain TOS to the one when activity would be unity, i.e., the fresh catalyst. For the deactivation rate, a different equilibrium constant and a different exponent of water adsorption are assumed.
Scheme 36 contains the resulting net rates of production.
The reaction network for the five-lump model is based on the previous one for SAPO-18, but the lump C 2 5 = is replaced with three separate olefin lumps C 2 = , C 3 = and C 4 + = in order to account for their different reactivities and evolutions depending on the reaction conditions. In the publication, five different networks with varying complexity for olefin interconversion are introduced and the one presented in Scheme 37 is chosen after an evaluation with the Fisher test. It should be noted that, except for the replacement of Step k 4 with Steps k 4 a , k 4 b and k 4 c , the same reaction network as in Scheme 35 applies. The earlier rate constant k 4 should yield the sum of k 4 a , k 4 b and k 4 c . The deactivation approach is unselective: the activity a relates the production rate after a certain TOS to the value at a = 1 for ethene, propene and higher olefins.
The net rates of formation are the same as for the four-lump model except that R C 2 5 = has to be replaced with R C 2 = , R C 3 = and R C 4 + = , which correspond to r 4 a , r 4 b and r 4 c , respectively.

Parameter Estimation

The mass fractions in Scheme 35 are defined with carbon units except for the intermediates where y cat Int is related to the mass of the fresh catalyst. Both the contact time dependent kinetic expressions as well as the TOS dependent equations for deactivation and intermediates have to be solved simultaneously. For this, a MATLAB script based on finite differences in combination with orthogonal collocation [269] is written. Parameter estimation is performed with the Levenberg–Marquardt algorithm where the objective function evaluates the unweighted squared differences between modeled and experimental mass fractions. Reparameterization according to Equation (21) is performed with a reference temperature of 623 K which is close to the lowest investigated value. Different values for n d , n H 2 O , n H 2 O d and K H 2 O d , ads are tried, the results with the best fit are shown in Scheme 35. Without these, eleven unknown parameters remain: five reference rate constants, five activation energies and one equilibrium constant for water adsorption. For the version with five lumps, 15 parameters are estimated: seven reference rate constants, seven activation energies and one equilibrium constant for water adsorption. As it can be seen in Scheme 37, the values which were already included in the model with four lumps [259] are fitted another time here.

4.4.6. Kumar et al.: Microkinetic Implementation over ZSM-22

Catalyst

The authors [146] used a commercial ZSM-23 sample without any binder provided by Zeolyst International. The relatively low Si/Al ratio of 26 caused a high number of acid sites ( 0.62 mol kg cat 1 ). The zeolite showed significant deactivation effects due to coke formation [147]. However, it was observed that the selectivity at a specific conversion level is independent of the coke amount [231]. Through the linear dependence between TOS and contact time until a certain conversion is achieved, an effective contact time is calculated in this study. This allows describing intrinsic kinetics free of interfering deactivation effects.

Setup and Conditions

The continuous fixed bed glass reactor had an inner diameter of 10 mm. It was fed by a saturator with helium as carrier and dilution gas. A GC equipped with an FID and one column enabled product analysis. In this study, only one temperature was analyzed; it was controlled by a thermocouple placed in the middle of the catalyst bed [289,290].

Reaction Network

The network is almost similar to the ZSM-5 model by the same authors; the only differences are caused by the use of a different catalyst [11]. Over ZSM-23, profound ethene formation out of olefins is observed which is why two additional cracking routes leading to primary intermediates are introduced, starting from either tertiary or from secondary intermediates. Because the reverse reaction takes also place, protonation to a primary intermediate has to be included; the stability difference between secondary and primary intermediates is an additional fitting parameter in this model. Physisorption is included with own experimental data of alkanes over ZSM-22 [291] which are applicable to ZSM-23 [292]. As in the ZSM-5 case, the formation of side products and especially of aromatics is negligible. Finally, 142 pathways of kinetic relevance are obtained. The following responses are fitted to the measurements: Ox (methanol plus DME), C 2 = , C 3 = , C 4 = , C 5 = , C 6 + = and C 1 . The amount of methanol within the Ox lump is calculated from a carbon balance, whereas water is obtained from a hydrogen balance.

Parameter Estimation

The numerical routine is similar to the ZSM-5 case. The kinetic descriptors determined earlier [19] are held constant, whereas the different catalyst descriptors are estimated. This leads to eight fitted parameters: two activation energies including primary intermediates, five protonation enthalpies and one stability difference between primary and secondary intermediates. In addition, the total concentration of aromatic hydrocarbon pool species is also obtained via regression as this value changes with a different catalyst type.

4.4.7. Summary

Because of the smaller pore size, deactivation is more pronounced over SAPO-34, SAPO-18 and ZSM-22 compared to ZSM-5 and cannot be ignored during kinetic evaluation. The four models over SAPO-34 show different methodologies to consider this fact. Gayubo et al. [255] chose conditions where deactivation effect are minimized and extrapolate their results to a fresh catalyst. This is why they could neglect coking effects in their model. Alwahabi and Froment [258] had a similar approach as they use kinetic measurements of an almost fresh catalyst and simulate deactivation with separate data. Ying et al. [256] estimated their parameters according to their kinetic scheme first; in a subsequent step, these are held constant, whereas rate-specific deactivation parameters are fitted. This procedure requires kinetic data free of deactivation effects for the first step. In contrast, Chen et al. [257] estimated these rate-specific deactivation values directly with the kinetic parameters. Except for the microkinetic approach of Alwahabi and Froment [258], the different reactivity of DME is ignored through lumping both oxygenates (Gayubo et al. [255] and Chen et al. [257]) or through considering only reactions starting from methanol (Ying et al. [256]). In the latter study, all olefin interconversion steps as well as methylation reactions are neglected. The same holds for the model by Chen et al. [257]. On the other hand, both approaches consider side product formation which is also included for Gayubo et al. [255]. In the latter, methylation is also missing, whereas some olefin interconversion steps are assumed. In the five lump version, lumping of final and intermediate products might impede extrapolation; this is also observed for Ying et al. [256]. Furthermore, in the approach with five lumps, the olefin interconversion steps are removed. On the other hand, this model as well as Ying et al. [256] consider water adsorption in an HW type of mechanism which is ignored for Chen et al. [257]. Finally, the approach by Alwahabi and Froment [258] depicts almost complete reactivity, but at cost of complex reaction networks and high computational effort. The SAPO-18 model by Gayubo et al. [259] is comparable to the SAPO-34 case. However, this version includes deactivation parameters which are directly fitted to the kinetic data. This model is the only one in the review that explicitly describes the evolution of the initiation phase via a lump of intermediates. The five lump version additionally has the advantage that the lower olefins are split up to separate lumps. Finally, Kumar et al. [146] took advantage of the effect that selectivity is independent of coking at a certain conversion level. Through a linear approach, they could convert data at specific TOS to the performance of a fresh catalyst. Besides this, the model is almost identical to the one over ZSM-5 with the same advantages and disadvantages. The transfer to ZSM-22 shows how a separation of kinetic and catalyst descriptors [54] allows one to move a specific model obtained on a certain catalyt to another one by holding the kinetics constant and by adapting the reaction network and catalyst specific values.

4.5. Other Studies

Another well-known model is the one by Kaarsholm et al. [293]. Here, a commercial ZSM-5 zeolite was further modified. The final catalyst contained 1.5% phosphorus. Experiments were performed at temperatures between 673 and 823 K . The feed consisted either of pure methanol or of mixtures with water or argon. Deactivation effects can be neglected for the kinetics. A fluidized bed reactor model is combined with a kinetic scheme consisting of eleven lumps. Here, 16 unknown parameters are estimated to experimental data. The model includes water adsorption in an HW type of mechanism. Furthermore, side product formation is covered. Methanol and DME are assumed to be equilibrated throughout the whole reactor. All steps producing hydrocarbons out of the oxygenates have to proceed via a protonated intermediate with ten carbon atoms.
In a recent study by Yuan et al. [294], a kinetic model is derived for converting methanol feeds on a commercial SAPO-34 catalyst. The authors conducted experiments in a fluidized bed reactor at temperatures between 698–763 K . The feed was diluted using nitrogen. The kinetic model consists of nine lumps and requires 34 parameters. The dual cycle is implemented via two virtual species, one characterizing the olefin and another one resembling the aromatic hydrocarbon pool. Deactivation is also considered to describe the product evolution as function of TOS. Several reactor modeling studies were already published by this group [295,296,297].
In the approach by Strizhak et al. [298], a 1:1 mixture of commercial ZSM-5 zeolize (Si/Al of 35.4) and alumina was analyzed at temperatures between 513 and 693 K . The methanol feed was diluted with argon, leading to methanol partial pressures between 0.055 and 0.236 . Different theoretical reaction mechanisms are compared to the experimental data. Highest agreement is achieved when the DME formation is assumed to occur on LAS, whereas the conversion of oxygenates takes place on BAS.
Other studies in this context are the ones by Sedighi et al. [299], Fatourehchi et al. [300], Taheri Najafabadi et al. [301] and Azarhoosh et al. [302].

5. Kinetic Models for Methanol-to-Olefins with Olefin Co-Feed

The properties of the catalysts are listed in Table 5 and an overview of experimental conditions as well as modeling details are found in Table 6. Then, an explanation of the different models follows, focusing on studies where olefins are co-fed with the oxygenates. Consequently, the initiation phase should disappear which leads to a direct increase of oxygenates conversion (see Section 2.4.2). No division into different subsections is performed because there are only two models. Nevertheless, a summary section is shown at the end. This section is about the models by Huang et al. [240] and Wen et al. [303]. The former is a subsequent study to the olefin interconversion work discussed above.

5.1. Huang et al.: Eight-Lump Approach Extending the Olefin Cracking Model to Methanol-to-Olefins

5.1.1. Catalyst

The authors [240] used the same catalyst as for the olefin cracking study [166], see Section 3.1.3.

5.1.2. Setup and Conditions

The reaction equipment is already described in Section 3.1.3. However, another GC column was used here for better separating the oxygenates from the olefins. The partial pressure of water was held constant at 0.24 bar for all measurements which includes the amount released during alcohol dehydration.

5.1.3. Reaction Network

All reactions from the olefin interconversion model of the same authors [166] (see Section 3.1.3) are also included here. This network is extended with the methanol related reactions in Scheme 38, which include the conversion to DME and water ( k 11 ) as well as methylation steps ( k 12 k 18 ). Consequently, the following lumps are described: MeOH, DME, C 2 = , C 3 = , C 4 = , C 5 = , C 6 = and C 7 + = . Because of the fast reaction progress under co-feeding conditions, no comparably slow conversion steps of oxygenates to hydrocarbons are implemented. For the same reason, the methanol reaction to DME and water is not treated as equilibrated: based on experiments and calculations, the authors could show that the fast methylation disturbs the equilibration of the oxygenates. Only propene to hexene are considered as possible reactants for methylations as an earlier study proved this reaction to be very slow when having ethene as co-feed [210]. A mechanistic pathway is implemented here: the methanol chemisorption on a Brønsted acid site leads to a surface methyl group, which methylates an olefin reacting out of the gas phase in a subsequent step. Besides the olefin interconversion steps implemented as combination of LH and HW types of mechanism (Section 3.1.3), the network thus comprises irreversible methylation steps expressed as ER type of mechanism. A first regression without the steps k 16 k 18 showed significant deviation especially for propene and butenes, indicating the absence of an important pathway for these species. The comparison with experimental results from Svelle et al. [209] leads to the formulation of double methylation reactions. In [209], it was observed that pentenes contain marked 13 C methanol in an amount that cannot be explained by simple stepwise methylation reactions of the co-fed 12 C propene. Based on these experiments, Huang et al. [240] formulate the double methylation of propene and butenes as well as a triple methylation of propene; all these are also assumed as ER type of mechanism, meaning that two or three methanol molecules have to be chemisorbed first. As for the olefin interconversion model by the same authors [166], stoichiometry is retained and adsorption is considered for all hydrocarbons, for methanol and for water (HW type of mechanism), but not for DME. Furthermore, the methylation through DME is not considered. In this work, side products are neglected because of short contact times. The yield of aromatics and paraffins was below 0.4% in all experiments. However, in a subsequent study [305], their formation is explicitly included.
Because the reaction rates are rather complex, only r l is shown for the net rates of formation in Scheme 39.

5.1.4. Parameter Estimation

Details about the numerical routine can be found in Section 3.1.3. All parameters estimated there are kept constant during fitting the MTO model. For the latter, 20 unknown values exist: eight reference rate constants, eight activation energies, two reference equilibrium constants, one reaction enthalpy and one adsorption enthalpy. This includes the equilibrium constant of methanol dehydration because the experimental value deviated from the theoretical one calculated via thermodynamics. The final kinetic description, enriched with the side reactions [305], is used in subsequent studies to create a heterogeneous model of the recycle reactor [207,306] or of a monolith reactor [307].

5.2. Wen et al.: Ten-Lump Model Being Valid for ZSM-5 Powder and for ZSM-5 on Stainless Steel Fibers

5.2.1. Catalyst

In this work [303], a regular ZSM-5 zeolite as well as a catalyst consisting of ZSM-5 crystals grown on three-dimensional stainless steel microfibers were analyzed. The latter showed improved stability and propene yields in earlier studies [304,308]. This is attributed to higher resistances to the aromatic hydrocarbon pool which reduces ethene formation and to a narrow residence distribution being optimal for propene as intermediate. Furthermore, the small zeolite shell being only a few micrometers thick increases mass transfer as well as acid sites efficiency and thus activity compared to regular powder. Both samples were self-synthesized, but Western Metal Material provided the stainless steel fibers with a diameter of 20 μm and a voidage of 85%. Through the dip-coating method [304], a catalyst with 19 % wt ZSM-5 and a Si/Al ratio of 147 was obtained. The powder exhibited a comparable Si/Al value of 155.

5.2.2. Setup and Conditions

Kinetic experiments were performed in a continuous fixed bed reactor made of quartz glass which had an inner diameter of 16 mm. An electrical furnace surrounding the reactor allowed for elevated temperatures. Methanol was fed in liquid state, evaporated and mixed with nitrogen as diluent. The fibered samples, provided as circular chips, were filled in layer by layer. Their diameter was 0.1 mm larger compared to the reactor to avoid bypass effects. In contrast, the application of quartz sand as diluent enabled comparable bed volumes for the powder sample. For product analysis, the authors used a GC having one column and an FID. As shown in Table 6, solely methanol was applied as feed. However, the model only works when olefins are present, otherwise, ethene and paraffins are produced exclusively. Therefore, the application range is similar to co-feeding conditions.

5.2.3. Reaction Network

For both samples, the same model is applied which consists of ten lumps: MeOH, DME, C 2 = , C 3 = , C 4 = , C 5 = , C 6 = , C 7 + = , C 1 and C 2 6 . The reactions outlined in Scheme 40 can be divided into six parts: oxygenates interconversion ( k 1 and k 2 ), methylation ( k 3 k 6 ), olefin interconversion ( k 7 k 13 and k 19 ), oxygenates conversion to olefins ( k 14 ) and paraffin formation out of olefins ( k 16 and k 17 ) as well as out of DME ( k 15 and k 18 ). The methylation is assumed to occur exclusively via DME which increases the carbon number of two similar olefins (C 3 = to C 6 = ) by one each. As mentioned in the previous paragraph, the model does not start at zero contact time, but at a minimum value where the end of the initiation phase is reached which means that the first olefins are produced already. Because of the low reactivity at the beginning, the oxygenates reached an equilibrated state at the first data points. For their model, the authors implemented both the forward reaction and the backward reaction of methanol dehydration as step of kinetic relevance without any equilibrium constants. The contribution of the aromatic hydrocarbon pool is restricted to the conversion of DME to ethene for simplicity. In general, methanol is not considered as reactant except for DME production. The olefin interconversion comprises the cracking of pentenes and hexenes including backward reactions whereby these are separately fitted again. Moreover, the formation of higher olefins as well as the dimerization of butenes is considered, but without reverse reaction. Finally, methane formation is limited to pentenes or DME, whereas the latter or propene can also react to lower paraffins. The origin of hydrogen necessary for methane formation is not resolved, also water is ignored in the rate equations of Scheme 40. Adsorption effects and mechanistic routes are not covered by this model. According to the authors, the reaction orders are adjusted to have highest agreement, but in fact, all are set to one. This means stoichiometry is neglected, as it also has arbitrary values for the net rates of production.
Scheme 41 contains the net rates of production of all species.

5.2.4. Parameter Estimation

Mole fractions are required for the rate equations in Scheme 40. For parameter estimation, lsqnonlin provided by MATLAB is used. It minimizes the objective function, i.e., the unweighted sum of squared residuals between modeled and measured mole fractions. The differential equations are integrated via the fourth–fifth-order Runge–Kutta method of ode45, also within MATLAB. The reparameterized Arrhenius approach (see Equation (21)) is applied using a reference temperature of 723 K , which is 10 K higher than the mean value of the investigated range. With this routine, 38 parameters are estimated: 19 reference rate constants and 19 activation energies.

5.3. Summary

Because the methanol co-feed implementation of Huang et al. [240] has similar methodology to the pure olefin interconversion case, advantages and disadvantages of the models are comparable. A problem might arise as the olefin interconversion equations are transferred to MTO without adaption of the denominator where the adsorption of methanol is missing. Nevertheless, the retained stoichiometry, the large reaction network and the HW type of mechanism yield a robust model. Further improvement could be achieved by having carbon number dependent adsorption values and by including DME adsorption. Furthermore, the methylation via DME is missing. On the other hand, several steps for double methylation are considered. The equilibrium constant of the oxygenates interaction is fitted to experimental data. In the approach by Wen et al. [303], both the forward and the backward reaction are estimated as rate constants which might impede thermodynamic consistency. This holds not only for oxygenates interaction, but also for olefin interconversion. This model restricts all methylation and olefin production reactions to DME as reactant. The aromatic hydrocarbon pool is indirectly considered via a step converting DME to ethene. Many different reactions including side product formation are depicted here; however, this causes also many fitting parameters. Extrapolation might be additionally difficult because of missing adsorption, mechanistic basics and stoichiometry. On the other hand, a reasonable agreement with experimental data on two different catalyst systems is achieved.

5.4. Other Studies

Guo et al. [212,309] performed measurements with a ZSM-5 zeolite (Si/Al of 200) at temperatures between 683 and 753 K . The feed consisted of methanol and different n-olefins and was diluted with water and nitrogen. The reaction network contains 14 lumps and requires 32 parameters. Besides olefin methylation, this model considers several olefin interconversion and side product formation steps. The rate equations are formulated as HW type of mechanism with the inhibiting water adsorption.
Another recent contribution by Ortega et al. [310] uses a recycle reactor and therefore olefin co-feed conditions, but temperatures are more within the MTG range as they are between 598 and 648 K .

6. Concluding Remarks and Outlook

The descriptions above show that the conversion of hydrocarbons over zeolites has complex reactivity which causes demanding reaction networks. Different ways of approaching these difficulties are shown above. Despite the many different possibilities, it is tried to sort some of the findings of this review and to give recommendations for future work. These are divided into general modeling advices and a reaction-specific part.

6.1. General

  • Reparameterization should be performed. The choice of reference temperature is not of highest importance; nevertheless, an optimum value can improve the model performance.
  • Forward and backward reactions should be expressed as such and not be fitted independently. The equilibrium constant of the reaction can be extracted from thermodynamics to have less unknown parameters. However, when lumps consisting of several species are involved, the equilibrium constant should be estimated because the lump might deviate from an equilibrium distribution. Thermodynamic consistency has to be retained.
  • Expressing the rate equations via partial pressures is advantageous as the influence of pressure changes is directly included. In contrast, when carbon based values are chosen, this effect might be ignored.
  • Inclusion of adsorption effects, especially via the HW type of mechanism, should lead to a comparably robust model. The agreement with experimental data can still be satisfying when adsorption is ignored, especially when high partial pressures are applied. However, one should be aware that such a model tends to extrapolation errors when different feed compositions are chosen.
  • Negative activation energies might occur when these apparent values contain adsorption effects. However, also in empirical models, positive adsorption enthalpies should be avoided because these are physically not reasonable and contradictory to thermodynamics. In such a case, other phenomena seem to impair the underlying model.
  • When no microkinetic model is applied, interpretation about preferred reaction pathways should be avoided. The estimated parameters describe the reactivity in an empirical way, but the values are influenced by too many factors to allow mechanistic analyses. Nevertheless, effect of conditions on product distributions can be elucidated; for example, negative activation energies show that this pathway is less preferred at higher temperatures.
  • Although high agreement can be achieved in any way, the stoichiometry within one reaction step should be retained to have a reasonable characterization of the reactivity. Moreover, when the concept of elementary reactions is chosen, this should be applied consistently. It can cause problems when the same lump appears both as reactant and as product within one step.

6.2. Olefin Cracking and MTO

  • For hydrocarbon conversion, a maximum carbon number of seven seems to be sufficient, although the level of detail can be increased by exceeding this value. Nevertheless, some higher intermediates can be included in the network which crack down immediately, thus having no fitting answer. Furthermore, this recommended value also depends on the feed: when pure hexenes are applied, the dimerization to C 12 = has to be included.
  • Lower olefins should not be summarized to one lump as their formation mechanisms and reactivity are different. The same holds for methanol and DME.
  • Concerning ethene reactivity, reasonable results are obtained by assuming ethene both as reversibly and as irreversibly formed. However, the latter approach might be advantageous to reduce the number of estimated parameters.
  • The complex interaction between zeolite and water is still not fully understood. Nevertheless, a useful approach is the inclusion of water as diluent and as competing adsorptive.
  • Especially for MTO, the underlying chemistry is very complex through many different types of reactions. Consequently, it is difficult to describe the whole reactivity with one model. It is recommended to implement the types of reactions stepwise (e.g., first olefin interconversion, then methanol related reactions, and then side reactions) with individual experimental datasets. This reduces the number of unknown parameters in each fitting step and allows focusing on the respective type of reaction.
  • Whenever MTO models for pure methanol feeds are created, one has to be aware that the unresolved initiation phase might influence the performance at low contact times which could impede the model. For such cases, it could be reasonable to simulate the product generation not from zero catalyst mass on. In contrast, this effect can be ignored for industrial MTP conditions where hydrocarbons are available from the beginning.
  • For pure methanol feeds, an equilibrated state is reached comparably quickly because of the slow formation of the first C-C bond. However, when hydrocarbons are co-fed, this equilibrium among methanol, DME and water might not be reached.
  • For MTO, it depends on the catalyst and the reaction conditions whether an implementation of the aromatic hydrocarbon pool is reasonable or not. If so, the underlying reactions have to be simplified to only some characteristic steps that are representative for the whole catalytic cycle.
In the end, it cannot be said which modeling methodology is the best; it always depends on the requirements it should fulfill. However, one always has to be aware of the range within which the model is valid. Simple kinetics might describe the investigated case in a satisfying and comparably fast way. Moreover, conclusions about the influence of reaction conditions on product distributions are possible. However, further application should be performed with caution because extrapolation out of the experimentally covered regime could cause unrealistic results and false trends. However, for microkinetics, one also always has to be aware that the theoretical description is still a model. Indeed, in the case of satisfying agreement, the probability is high that the chosen approach is a valid way to describe the surface reactions. On the other hand, no reaction mechanism can be proven by solely evaluating a microkinetic model. Thus, in these cases, overinterpretation should also be avoided.
This leads to the outlook for future studies. As mentioned above, even microkinetics are not sufficient to decode complexity. Consequently, kinetic studies should always be compared to experimental results and ab initio methods. Especially the latter is of high importance to exclude any transport or deactivation effects impairing intrinsic kinetic results and therefore distorting the model. Furthermore, it offers the possibility of introducing surface inhomogeneities into the model. Currently, most studies consider all active sites of a catalyst to be of identical reactivity. Here, a high overlapping of kinetic modeling, experimental insights and ab initio methods is desirable. Ideal surface kinetics can be used to simulate the performance on larger pellet shapes. Multicomponent transport phenomena have to be included then to accurately account for all ongoing effects in an industrial reactor. Simulation and optimization of a whole process is thus a multi-scale task of high complexity, as well as high potential for the future.

Funding

This research was funded by the Bavarian Ministry of Economic Affairs, Energy and Technology grant number [47-3665g/1075/1-NW-1501-0003].

Acknowledgments

Special thanks go to Maximilian Wende, Johanna Hemauer and Lei Li for their help in evaluating literature models. Furthermore, fruitful discussions about thermodynamics with Philipp J. Donaubauer and Daniel P. Schwinger are highly appreciated. The authors gratefully acknowledge the fruitful environment within the framework of MuniCat. S. Standl is thankful for the support from TUM Graduate School.

Conflicts of Interest

The authors declare no conflict of interest. The sponsors had no role in the design, execution, interpretation or writing of the study.

Nomenclature

APreexponential factor, variable
aCatalytic activity, -
A ˜ Single-event preexponential factor, variable
C i Concentration, mol m−3
C t Concentration of total Brønsted acid sites, mol kg cat 1
C t , SBAS Concentration of strong Brønsted acid sites, mol kg cat 1
c p , i Heat capacity, J mol K−1
d o f Degree of freedom, -
d p Particle diameter, m
E a Activation energy, J mol−1
F i Molar flow rate, mol s−1
f i Fugacity, Pa
G i Gibb’s free energy, J mol−1
G t Total Gibb’s free energy, J
H i Enthalpy, J mol−1
hPlanck constant, J s
KEquilibrium constant, variable
K ˜ Single-event equilibrium constant, variable
k B Boltzmann constant, J K−1
k l Rate constant, variable
k ˜ l Single-event rate constant, variable
M w Molar mass, kg mol−1
mType of reactant intermediate, -
N e l , i Number of atoms of element e l , -
N Exp Number of experiments, -
N Par Number of parameters, -
N Res Number of fitting responses, -
nType of product intermediate, -
n e Number of single events, -
n H 2 O Reaction order of water adsorption, -
n i Number of moles, mol
n d Deactivation order, -
n H 2 O d Deactivation order of water adsorption, -
pPressure, Pa
RGas constant, J mol−1 K−1
R 1 + Surface methyl group
R i Net rate of production, mol kg cat 1 s−1
r l Reaction rate, variable
S S Q Sum of squared residuals, -
S i Entropy, J mol−1 K−1
TTemperature, K
tTime, s
WCatalyst mass, kg cat
w i Mass fraction, -
XConversion, -
y i Mole fraction, -
y ^ i Modeled mole fraction, -
Greek letters
α Parameter for carbon number dependence, -
α l Composed preexponential factor, variable
β Parameter for carbon number dependence, -
β l Linearization parameter, -
γ Parameter for carbon number dependence, -
γ l Parameter for carbon number dependence, -
Δ Difference, variable
δ Parameter for carbon number dependence, -
δ l Linearization parameter, -
θ Coverage, -
κ Reaction order, -
μ i Chemical potential, J mol−1
ν Stoichiometric coefficient, -
ϕ l Parameter for carbon number dependence, -
φ l Deactivation parameter, -
ω i Weighting factor, -
Subscripts
adsAdsorption
CCarbon
catCatalyst
e l Element
fFormation
gGas phase
hRunning index for acid sites
iArbitrary species
jRunning index for arbitrary species
kRunning index for experiments
lReaction step
MWMethanol and water
maxMaximum value
OlOlefin
OxOxygenates
rReaction
tTotal
Transition state
Superscripts
adsAdsorption
arAromatization
chemChemisorption
coComposite value
crCracking
dDeactivation
dimDimerization
inInlet value
MFMetal fiber
POPowder
RDSRate-determining step
refReference
TDThermodynamic
π π complex
Standard condition ( p = 1 × 10⁵ Pa)

Abbreviations

The following abbreviations are used in this manuscript:
Ads.Adsorption
AEIFramework code of SAPO-18
BASBrønsted acid sites
BETBrunauer–Emmett–Teller
C i Paraffin with carbon number i
C n i n-Paraffin with carbon number i
C i = Olefin with carbon number i
C i al Aliphatic compound with carbon number i
C i ar Aromatic compound with carbon number i
C i HC Hydrocarbon with carbon number i
C i SP Side products with carbon number i
C x + Protonated intermediate
CHAFramework code of chabazite
DFTDensity functional theory
DMEDimethyl ether
DSCDifferential scanning calorimetry
EREley–Rideal
FCCFluid catalytic cracking
FIDFlame ionization detector
GAGenetic algorithm
GCGas chromatograph
GC-FTIRGas chromatograph with Fourier transform infrared
GC-MSGas chromatograph with mass spectrometer
HFHartree–Fock
HWHougen–Watson
IntIntermediates
IRInfrared
LASLewis acid sites
LLangmuir
LHLangmuir–Hinshelwood
Mech.Mechanistical scheme
MFIFramework code of ZSM-5
MTGMethanol-to-gasoline
MTHMethanol-to-hydrocarbons
MTOMethanol-to-olefins
MTTFramework code of ZSM-22
OMOxonium methylide
OxOxygenates (methanol and DME)
PCPProtonated cyclopropane
PSSAPseudo-steady state approximation
SBUSecondary building unit
SBASStrong Brønsted acid sites
Side prod.Side products
TCDThermal conductivity detector
TGThermogravimetry
TOSTime-on-stream
XRDX-ray diffraction

References

  1. Ren, T.; Patel, M.K.; Blok, K. Steam Cracking and Methane to Olefins: Energy Use, CO2 Emissions and Production Costs. Energy 2008, 33, 817–833. [Google Scholar] [CrossRef]
  2. Plotkin, J.S. The Propylene Gap: How Can It Be Filled? 2015. Available online: https://www.acs.org/content/acs/en/pressroom/cutting-edge-chemistry/the-propylene-gap-how-can-it-be-filled.html (accessed on 29 October 2018).
  3. Blay, V.; Epelde, E.; Miravalles, R.; Perea, L.A. Converting Olefins to Propene: Ethene to Propene and Olefin Cracking. Catal. Rev. Sci. Eng. 2018, 60, 278–335. [Google Scholar] [CrossRef]
  4. Ren, T.; Patel, M.K.; Blok, K. Olefins from Conventional and Heavy Feedstocks: Energy Use in Steam Cracking and Alternative Processes. Energy 2006, 31, 425–451. [Google Scholar] [CrossRef]
  5. Neelis, M.; Patel, M.K.; Blok, K.; Haije, W.; Bach, P. Approximation of Theoretical Energy-Saving Potentials for the Petrochemical Industry using Energy Balances for 68 Key Processes. Energy 2007, 32, 1104–1123. [Google Scholar] [CrossRef]
  6. Centi, G.; Iaquaniello, G.; Perathoner, S. Can We Afford to Waste Carbon Dioxide? Carbon Dioxide as a Valuable Source of Carbon for the Production of Light Olefins. ChemSusChem 2011, 4, 1265–1273. [Google Scholar] [CrossRef] [PubMed]
  7. Torres Galvis, H.M.; de Jong, K.P. Catalysts for Production of Lower Olefins from Synthesis Gas: A Review. ACS Catal. 2013, 3, 2130–2149. [Google Scholar] [CrossRef]
  8. Mokrani, T.; Scurrell, M. Gas Conversion to Liquid Fuels and Chemicals: The Methanol Route–Catalysis and Processes Development. Catal. Rev. Sci. Eng. 2009, 51, 1–145. [Google Scholar] [CrossRef]
  9. Rahimi, N.; Karimzadeh, R. Catalytic Cracking of Hydrocarbons over Modified ZSM-5 Zeolites to Produce Light Olefins: A Review. Appl. Catal. A 2011, 398, 1–17. [Google Scholar] [CrossRef]
  10. Nesterenko, N.; Aguilhon, J.; Bodart, P.; Minoux, D.; Dath, J.P. Methanol to Olefins: An Insight into Reaction Pathways and Products Formation. In Zeolites and Zeolite-Like Materials; Sels, B.F., Kustov, L.M., Eds.; Elsevier: Amsterdam, The Netherlands, 2016; pp. 189–263. [Google Scholar] [CrossRef]
  11. Olsbye, U.; Svelle, S.; Bjørgen, M.; Beato, P.; Janssens, T.V.W.; Joensen, F.; Bordiga, S.; Lillerud, K.P. Conversion of Methanol to Hydrocarbons: How Zeolite Cavity and Pore Size Controls Product Selectivity. Angew. Chem. Int. Ed. 2012, 51, 5810–5831. [Google Scholar] [CrossRef]
  12. Balcar, H.; Čejka, J. Mesoporous Molecular Sieves as Advanced Supports for Olefin Metathesis Catalysts. Coord. Chem. Rev. 2013, 257, 3107–3124. [Google Scholar] [CrossRef]
  13. Gholampour, N.; Yusubov, M.; Verpoort, F. Investigation of the Preparation and Catalytic Activity of Supported Mo, W, and Re Oxides as Heterogeneous Catalysts in Olefin Metathesis. Catal. Rev. Sci. Eng. 2016, 58, 113–156. [Google Scholar] [CrossRef]
  14. Sattler, J.J.H.B.; Ruiz-Martínez, J.; Santillan-Jimenez, E.; Weckhuysen, B.M. Catalytic Dehydrogenation of Light Alkanes on Metals and Metal Oxides. Chem. Rev. 2014, 114, 10613–10653. [Google Scholar] [CrossRef] [PubMed]
  15. Nawaz, Z. Light Alkane Dehydrogenation to Light Olefin Technologies: A Comprehensive Review. Rev. Chem. Eng. 2015, 31, 413–436. [Google Scholar] [CrossRef]
  16. Carrero, C.A.; Schlögl, R.; Wachs, I.E.; Schomäcker, R. Critical Literature Review of the Kinetics for the Oxidative Dehydrogenation of Propane over Well-Defined Supported Vanadium Oxide Catalysts. ACS Catal. 2014, 4, 3357–3380. [Google Scholar] [CrossRef]
  17. Ghashghaee, M. Heterogeneous Catalysts for Gas-Phase Conversion of Ethylene to Higher Olefins. Rev. Chem. Eng. 2018, 34, 595–655. [Google Scholar] [CrossRef]
  18. Dumesic, J.A.; Rudd, D.F.; Aparicio, L.M.; Rekoske, J.E.; Treviño, A.A. The Microkinetics of Heterogeneous Catalysis; ACS Professional Reference Book; American Chemical Society: Washington, DC, USA, 1993. [Google Scholar]
  19. Kumar, P.; Thybaut, J.W.; Svelle, S.; Olsbye, U.; Marin, G.B. Single-Event Microkinetics for Methanol to Olefins on H-ZSM-5. Ind. Eng. Chem. Res. 2013, 52, 1491–1507. [Google Scholar] [CrossRef]
  20. Vynckier, E.; Froment, G.F. Modeling of the Kinetics of Complex Processes based upon Elementary Steps. In Kinetic and Thermodynamic Lumping of Multicomponent Mixtures; Astarita, G., Sandler, S.I., Eds.; Elsevier: Amsterdam, The Netherlands, 1991; pp. 131–161. [Google Scholar]
  21. Thybaut, J.W.; Marin, G.B. Single-Event MicroKinetics: Catalyst Design for Complex Reaction Networks. J. Catal. 2013, 308, 352–362. [Google Scholar] [CrossRef]
  22. Khadzhiev, S.N.; Magomedova, M.V.; Peresypkina, E.G. Kinetic Models of Methanol and Dimethyl Ether Conversion to Olefins over Zeolite Catalysts (Review). Pet. Chem. 2015, 55, 503–521. [Google Scholar] [CrossRef]
  23. Keil, F.J. Methanol-to-Hydrocarbons: Process Technology. Microporous Mesoporous Mater. 1999, 29, 49–66. [Google Scholar] [CrossRef]
  24. Chen, N.Y.; Reagan, W.J. Evidence of Autocatalysis in Methanol to Hydrocarbon Reactions over Zeolite Catalysts. J. Catal. 1979, 59, 123–129. [Google Scholar] [CrossRef]
  25. Chang, C.D. A Kinetic Model for Methanol Conversion to Hydrocarbons. Chem. Eng. Sci. 1980, 35, 619–622. [Google Scholar] [CrossRef]
  26. Ono, Y.; Mori, T. Mechanism of Methanol Conversion into Hydrocarbons over ZSM-5 Zeolite. J. Chem. Soc. Faraday Trans. 1 1981, 77, 2209–2221. [Google Scholar] [CrossRef]
  27. Mihail, R.; Straja, S.; Maria, G.; Musca, G.; Pop, G. Kinetic Model for Methanol Conversion to Olefins. Ind. Eng. Chem. Process Des. Dev. 1983, 22, 532–538. [Google Scholar] [CrossRef]
  28. Mihail, R.; Straja, S.; Maria, G.; Musca, G.; Pop, G. A Kinetic Model for Methanol Conversion to Hydrocarbons. Chem. Eng. Sci. 1983, 38, 1581–1591. [Google Scholar] [CrossRef]
  29. Schipper, P.H.; Krambeck, F.J. A Reactor Design Simulation with Reversible and Irreversible Catalyst Deactivation. Chem. Eng. Sci. 1986, 41, 1013–1019. [Google Scholar] [CrossRef]
  30. Sedrán, U.A.; Mahay, A.; de Lasa, H.I. Modelling Methanol Conversion to Hydrocarbons: Revision and Testing of a Simple Kinetic Model. Chem. Eng. J. 1990, 45, 1161–1165. [Google Scholar] [CrossRef]
  31. Sedrán, U.A.; Mahay, A.; de Lasa, H.I. Modelling Methanol Conversion to Hydrocarbons: Alternative Kinetic Models. Chem. Eng. J. 1990, 45, 33–42. [Google Scholar] [CrossRef]
  32. Schönfelder, H.; Hinderer, J.; Werther, J.; Keil, F.J. Methanol to Olefins-Prediction of the Performance of a Circulating Fluidized-Bed Reactor on the Basis of Kinetic Experiments in a Fixed-Bed Reactor. Chem. Eng. Sci. 1994, 49, 5377–5390. [Google Scholar] [CrossRef]
  33. Bos, R.; Tromp, P.J.; Akse, H.N. Conversion of Methanol to Lower Olefins. Kinetic Modeling, Reactor Simulation, and Selection. Ind. Eng. Chem. Res. 1995, 34, 3808–3816. [Google Scholar] [CrossRef]
  34. Gayubo, A.G.; Benito, P.L.; Aguayo, A.T.; Aguirre, I.; Bilbao, J. Analysis of Kinetic Models of the Methanol-to-Gasoline (MTG) Process in an Integral Reactor. Chem. Eng. J. 1996, 63, 45–51. [Google Scholar] [CrossRef]
  35. Van Speybroeck, V.; Hemelsoet, K.; Joos, L.; Waroquier, M.; Bell, R.G.; Catlow, R.A. Advances in Theory and Their Application within the Field of Zeolite Chemistry. Chem. Soc. Rev. 2015, 44, 7044–7111. [Google Scholar] [CrossRef]
  36. Van Speybroeck, V.; de Wispelaere, K.; van der Mynsbrugge, J.; Vandichel, M.; Hemelsoet, K.; Waroquier, M. First Principle Chemical Kinetics in Zeolites: The Methanol-to-Olefin Process as a Case Study. Chem. Soc Rev. 2014, 43, 7326–7357. [Google Scholar] [CrossRef]
  37. Hemelsoet, K.; van der Mynsbrugge, J.; de Wispelaere, K.; Waroquier, M.; van Speybroeck, V. Unraveling the Reaction Mechanisms Governing Methanol-to-Olefins Catalysis by Theory and Experiment. ChemPhysChem 2013, 14, 1526–1545. [Google Scholar] [CrossRef]
  38. De Wispelaere, K.; Ensing, B.; Ghysels, A.; Meijer, E.J.; van Speybroeck, V. Complex Reaction Environments and Competing Reaction Mechanisms in Zeolite Catalysis: Insights from Advanced Molecular Dynamics. Chem. Eur. J. 2015, 21, 9385–9396. [Google Scholar] [CrossRef] [Green Version]
  39. De Wispelaere, K.; Wondergem, C.S.; Ensing, B.; Hemelsoet, K.; Meijer, E.J.; Weckhuysen, B.M.; van Speybroeck, V.; Ruiz-Martínez, J. Insight into the Effect of Water on the Methanol-to-Olefins Conversion in H-SAPO-34 from Molecular Simulations and in Situ Microspectroscopy. ACS Catal. 2016, 6, 1991–2002. [Google Scholar] [CrossRef] [Green Version]
  40. Moors, S.L.; de Wispelaere, K.; van der Mynsbrugge, J.; Waroquier, M.; van Speybroeck, V. Molecular Dynamics Kinetic Study on the Zeolite-Catalyzed Benzene Methylation in ZSM-5. ACS Catal. 2013, 3, 2556–2567. [Google Scholar] [CrossRef]
  41. Van der Mynsbrugge, J.; de Ridder, J.; Hemelsoet, K.; Waroquier, M.; van Speybroeck, V. Enthalpy and Entropy Barriers Explain the Effects of Topology on the Kinetics of Zeolite-Catalyzed Reactions. Chem. Eur. J. 2013, 19, 11568–11576. [Google Scholar] [CrossRef]
  42. Van Speybroeck, V.; van der Mynsbrugge, J.; Vandichel, M.; Hemelsoet, K.; Lesthaeghe, D.; Ghysels, A.; Marin, G.B.; Waroquier, M. First Principle Kinetic Studies of Zeolite-Catalyzed Methylation Reactions. J. Am. Chem. Soc. 2011, 133, 888–899. [Google Scholar] [CrossRef]
  43. Van der Mynsbrugge, J.; Moors, S.L.; de Wispelaere, K.; van Speybroeck, V. Insight into the Formation and Reactivity of Framework-Bound Methoxide Species in H-ZSM-5 from Static and Dynamic Molecular Simulations. ChemCatChem 2014, 6, 1906–1918. [Google Scholar] [CrossRef]
  44. Lesthaeghe, D.; van der Mynsbrugge, J.; Vandichel, M.; Waroquier, M.; van Speybroeck, V. Full Theoretical Cycle for both Ethene and Propene Formation during Methanol-to-Olefin Conversion in H-ZSM-5. ChemCatChem 2011, 3, 208–212. [Google Scholar] [CrossRef]
  45. Yarulina, I.; de Wispelaere, K.; Bailleul, S.; Goetze, J.; Radersma, M.; Abou-Hamad, E.; Vollmer, I.; Goesten, M.; Mezari, B.; Hensen, E.J.; et al. Structure-Performance Descriptors and the Role of Lewis Acidity in the Methanol-to-Propylene Process. Nat. Chem. 2018, 10, 804–812. [Google Scholar] [CrossRef]
  46. Van der Mynsbrugge, J.; Janda, A.; Lin, L.C.; van Speybroeck, V.; Head-Gordon, M.; Bell, A.T. Understanding Brønsted-Acid Catalyzed Monomolecular Reactions of Alkanes in Zeolite Pores by Combining Insights from Experiment and Theory. ChemPhysChem 2018, 19, 341–358. [Google Scholar] [CrossRef] [Green Version]
  47. Van der Mynsbrugge, J.; Janda, A.; Mallikarjun Sharada, S.; Lin, L.C.; van Speybroeck, V.; Head-Gordon, M.; Bell, A.T. Theoretical Analysis of the Influence of Pore Geometry on Monomolecular Cracking and Dehydrogenation of n-Butane in Brønsted Acidic Zeolites. ACS Catal. 2017, 7, 2685–2697. [Google Scholar] [CrossRef]
  48. Cnudde, P.; de Wispelaere, K.; Vanduyfhuys, L.; Demuynck, R.; van der Mynsbrugge, J.; Waroquier, M.; van Speybroeck, V. How Chain Length and Branching Influence the Alkene Cracking Reactivity on H-ZSM-5. ACS Catal. 2018, 8, 9579–9595. [Google Scholar] [CrossRef]
  49. Cnudde, P.; de Wispelaere, K.; van der Mynsbrugge, J.; Waroquier, M.; van Speybroeck, V. Effect of Temperature and Branching on the Nature and Stability of Alkene Cracking Intermediates in H-ZSM-5. J. Catal. 2017, 345, 53–69. [Google Scholar] [CrossRef]
  50. Hajek, J.; van der Mynsbrugge, J.; de Wispelaere, K.; Cnudde, P.; Vanduyfhuys, L.; Waroquier, M.; van Speybroeck, V. On the Stability and Nature of Adsorbed Pentene in Brønsted Acid Zeolite H-ZSM-5 at 323 K. J. Catal. 2016, 340, 227–235. [Google Scholar] [CrossRef]
  51. Martens, G.G.; Marin, G.B.; Martens, J.A.; Jacobs, P.A.; Baron, G.V. A Fundamental Kinetic Model for Hydrocracking of C8 to C12 Alkanes on Pt/US-Y Zeolites. J. Catal. 2000, 195, 253–267. [Google Scholar] [CrossRef]
  52. Martens, G.G.; Marin, G.B. Kinetics for Hydrocracking Based on Structural Classes: Model Development and Applications. AIChE J. 2001, 47, 1607–1622. [Google Scholar] [CrossRef]
  53. Martens, G.G.; Thybaut, J.W.; Marin, G.B. Single-Event Rate Parameters for the Hydrocracking of Cycloalkanes on Pt/US-Y Zeolites. Ind. Eng. Chem. Res. 2001, 40, 1832–1844. [Google Scholar] [CrossRef]
  54. Thybaut, J.W.; Marin, G.B.; Baron, G.V.; Jacobs, P.A.; Martens, J.A. Alkene Protonation Enthalpy Determination from Fundamental Kinetic Modeling of Alkane Hydroconversion on Pt/H-(US)Y-Zeolite. J. Catal. 2001, 202, 324–339. [Google Scholar] [CrossRef]
  55. Narasimhan, C.S.L.; Thybaut, J.W.; Marin, G.B.; Jacobs, P.A.; Martens, J.A.; Denayer, J.F.; Baron, G.V. Kinetic Modeling of Pore Mouth Catalysis in the Hydroconversion of n-Octane on Pt-H-ZSM-22. J. Catal. 2003, 220, 399–413. [Google Scholar] [CrossRef]
  56. Thybaut, J.W.; Narasimhan, C.S.L.; Denayer, J.F.; Baron, G.V.; Jacobs, P.A.; Martens, J.A.; Marin, G.B. Acid-Metal Balance of a Hydrocracking Catalyst: Ideal versus Nonideal Behavior. Ind. Eng. Chem. Res. 2005, 44, 5159–5169. [Google Scholar] [CrossRef]
  57. Narasimhan, C.S.L.; Thybaut, J.W.; Martens, J.A.; Jacobs, P.A.; Denayer, J.F.; Marin, G.B. A Unified Single-Event Microkinetic Model for Alkane Hydroconversion in Different Aggregation States on Pt/H-USY-Zeolites. J. Phys. Chem. B 2006, 110, 6750–6758. [Google Scholar] [CrossRef]
  58. Quintana-Solórzano, R.; Thybaut, J.W.; Marin, G.B. Catalytic Cracking and Coking of (Cyclo)Alkane/1-Octene Mixtures on an Equilibrium Catalyst. Appl. Catal. A 2006, 314, 184–199. [Google Scholar] [CrossRef]
  59. Thybaut, J.W.; Choudhury, I.R.; Denayer, J.F.; Baron, G.V.; Jacobs, P.A.; Martens, J.A.; Marin, G.B. Design of Optimum Zeolite Pore System for Central Hydrocracking of Long-Chain n-Alkanes based on a Single-Event Microkinetic Model. Top. Catal. 2009, 52, 1251–1260. [Google Scholar] [CrossRef]
  60. Choudhury, I.R.; Hayasaka, K.; Thybaut, J.W.; Narasimhan, C.S.L.; Denayer, J.F.; Martens, J.A.; Marin, G.B. Pt/H-ZSM-22 Hydroisomerization Catalysts Optimization Guided by Single-Event Microkinetic Modeling. J. Catal. 2012, 290, 165–176. [Google Scholar] [CrossRef]
  61. Vandegehuchte, B.D.; Choudhury, I.R.; Thybaut, J.W.; Martens, J.A.; Marin, G.B. Integrated Stefan-Maxwell, Mean Field, and Single-Event Microkinetic Methodology for Simultaneous Diffusion and Reaction inside Microporous Materials. J. Phys. Chem. C 2014, 118, 22053–22068. [Google Scholar] [CrossRef]
  62. Vandegehuchte, B.D.; Thybaut, J.W.; Marin, G.B. Unraveling Diffusion and Other Shape Selectivity Effects in ZSM5 Using n-Hexane Hydroconversion Single-Event Microkinetics. Ind. Eng. Chem. Res. 2014, 53, 15333–15347. [Google Scholar] [CrossRef]
  63. Toch, K.; Thybaut, J.W.; Marin, G.B. A Systematic Methodology for Kinetic Modeling of Chemical Reactions Applied to n-Hexane Hydroisomerization. AIChE J. 2015, 61, 880–892. [Google Scholar] [CrossRef]
  64. Thybaut, J.W.; Marin, G.B. Multiscale Aspects in Hydrocracking: From Reaction Mechanism Over Catalysts to Kinetics and Industrial Application. In Advances in Catalysis; Song, C., Ed.; Academic Press: Cambridge, MA, USA, 2016; Volume 59, pp. 109–238. [Google Scholar] [CrossRef]
  65. Surla, K.; Vleeming, H.; Guillaume, D.; Galtier, P. A Single Events Kinetic Model: n-Butane Isomerization. Chem. Eng. Sci. 2004, 59, 4773–4779. [Google Scholar] [CrossRef]
  66. Valéry, E.; Guillaume, D.; Surla, K.; Galtier, P.; Verstraete, J.; Schweich, D. Kinetic Modeling of Acid Catalyzed Hydrocracking of Heavy Molecules: Application to Squalane. Ind. Eng. Chem. Res. 2007, 46, 4755–4763. [Google Scholar] [CrossRef]
  67. Mitsios, M.; Guillaume, D.; Galtier, P.; Schweich, D. Single-Event Microkinetic Model for Long-Chain Paraffin Hydrocracking and Hydroisomerization on an Amorphous Pt/SiO2·Al2O3 Catalyst. Ind. Eng. Chem. Res. 2009, 48, 3284–3292. [Google Scholar] [CrossRef]
  68. Becker, P.J.; Serrand, N.; Celse, B.; Guillaume, D.; Dulot, H. A Single Events Microkinetic Model for Hydrocracking of Vacuum Gas Oil. Comput. Chem. Eng. 2017, 98, 70–79. [Google Scholar] [CrossRef]
  69. Pellegrini, L.; Locatelli, S.; Rasella, S.; Bonomi, S.; Calemma, V. Modeling of Fischer–Tropsch Products Hydrocracking. Chem. Eng. Sci. 2004, 59, 4781–4787. [Google Scholar] [CrossRef]
  70. Becker, P.J.; Celse, B.; Guillaume, D.; Dulot, H.; Becker, P.J. Hydrotreatment Modeling for a Variety of VGO Feedstocks: A Continuous Lumping Approach. Fuel 2015, 139, 133–143. [Google Scholar] [CrossRef]
  71. Becker, P.J.; Celse, B.; Guillaume, D.; Costa, V.; Bertier, L.; Guillon, E.; Pirngruber, G. A Continuous Lumping Model for Hydrocracking on a Zeolite Catalysts: Model Development and Parameter Identification. Fuel 2016, 164, 73–82. [Google Scholar] [CrossRef]
  72. Becker, P.J.; Serrand, N.; Celse, B.; Guillaume, D.; Dulot, H. Comparing Hydrocracking Models: Continuous Lumping vs. Single Events. Fuel 2016, 165, 306–315. [Google Scholar] [CrossRef]
  73. Lopez Abelairas, M.; de Oliveira, L.P.; Verstraete, J.J. Application of Monte Carlo Techniques to LCO Gas Oil Hydrotreating: Molecular Reconstruction and Kinetic Modelling. Catal. Today 2016, 271, 188–198. [Google Scholar] [CrossRef]
  74. Browning, B.; Afanasiev, P.; Pitault, I.; Couenne, F.; Tayakout-Fayolle, M. Detailed kinetic modelling of vacuum gas oil hydrocracking using bifunctional catalyst: A distribution approach. Chem. Eng. J. 2016, 284, 270–284. [Google Scholar] [CrossRef]
  75. Shahrouzi, J.R.; Guillaume, D.; Rouchon, P.; Da Costa, P. Stochastic Simulation and Single Events Kinetic Modeling: Application to Olefin Oligomerization. Ind. Eng. Chem. Res. 2008, 47, 4308–4316. [Google Scholar] [CrossRef]
  76. Walas, S.M. Phase Equilibria in Chemical Engineering; Butterworth: Boston, MA, USA, 1985. [Google Scholar]
  77. Zhou, H.; Wang, Y.; Wei, F.; Wang, D.; Wang, Z. Kinetics of the Reactions of the Light Alkenes over SAPO-34. Appl. Catal. A 2008, 348, 135–141. [Google Scholar] [CrossRef]
  78. Zhang, R.; Wang, Z.; Liu, H.; Liu, Z.; Liu, G.; Meng, X. Thermodynamic Equilibrium Distribution of Light Olefins in Catalytic Pyrolysis. Appl. Catal. A 2016, 522, 165–171. [Google Scholar] [CrossRef]
  79. International Union of Pure and Applied Chemistry (Ed.) Compendium of Chemical Terminology: Gold Book, 2nd ed.; IUPAC: Research Triangle Park, NC, USA, 2014. [Google Scholar] [CrossRef]
  80. Lide, D.R. (Ed.) CRC Handbook of Chemistry and Physics, 87th ed.; Taylor and Francis Group: Boca Raton, FL, USA, 2006. [Google Scholar]
  81. Alberty, R.A. Extrapolation of Standard Chemical Thermodynamic Properties of Alkene Isomer Groups to Higher Carbon Numbers. J. Phys. Chem. 1983, 87, 4999–5002. [Google Scholar] [CrossRef]
  82. Alberty, R.A. Chemical Thermodynamic Properties of Isomer Groups. Ind. Eng. Chem. Fundam. 1983, 22, 318–321. [Google Scholar] [CrossRef]
  83. Alberty, R.A.; Oppenheim, I. A Continuous Thermodynamics Approach to Chemical Equilibrium within an Isomer Group. J. Chem. Phys. 1984, 81, 4603–4609. [Google Scholar] [CrossRef]
  84. Alberty, R.A. Chemical Equilibrium In Complex Organic Systems. J. Phys. Chem. 1985, 89, 880–883. [Google Scholar] [CrossRef]
  85. Alberty, R.A.; Gehrig, C.A. Standard Chemical Thermodynamic Properties of Alkane Isomer Groups. J. Phys. Chem. Ref. Data 1984, 13, 1173–1197. [Google Scholar] [CrossRef]
  86. Alberty, R.A. Standard Chemical Thermodynamic Properties of Alkylbenzene Isomer Groups. J. Phys. Chem. Ref. Data 1985, 14, 177–192. [Google Scholar] [CrossRef]
  87. Alberty, R.A.; Bloomstein, T.M. Standard Chemical Thermodynamic Properties of Alkylnaphthalene Isomer Groups. J. Phys. Chem. Ref. Data 1985, 14, 821–837. [Google Scholar] [CrossRef]
  88. Alberty, R.A.; Gehrig, C.A. Standard Chemical Thermodynamic Properties of Alkene Isomer Groups. J. Phys. Chem. Ref. Data 1985, 14, 803–820. [Google Scholar] [CrossRef]
  89. Alberty, R.A.; Ha, Y.S. Standard Chemical Thermodynamic Properties of Alkylcyclopentane Isomer Groups, Alkylcyclohexane Isomer Groups, and Combined Isomer Groups. J. Phys. Chem. Ref. Data 1985, 14, 1107–1132. [Google Scholar] [CrossRef]
  90. Alberty, R.A.; Burmenko, E. Standard Chemical Thermodynamic Properties of Alkyne Isomer Groups. J. Phys. Chem. Ref. Data 1986, 15, 1339–1349. [Google Scholar] [CrossRef]
  91. Alberty, R.A.; Chung, M.B.; Flood, T.M. Standard Chemical Thermodynamic Properties of Alkanol Isomer Groups. J. Phys. Chem. Ref. Data 1987, 16, 391–417. [Google Scholar] [CrossRef]
  92. Alberty, R.A.; Reif, A.K. Standard Chemical Thermodynamic Properties of Polycyclic Aromatic Hydrocarbons and Their Isomer Groups I. Benzene Series. J. Phys. Chem. Ref. Data 1988, 17, 241–253. [Google Scholar] [CrossRef]
  93. Alberty, R.A.; Reif, A.K. Erratum: Standard Chemical Thermodynamic Properties of Polycyclic Aromatic Hydrocarbons and Their Isomer Groups I. Benzene Series [J. Phys. Chem. Ref. Data 17, 241 (1988)]. J. Phys. Chem. Ref. Data 1989, 18, 551–553. [Google Scholar] [CrossRef]
  94. Alberty, R.A.; Chung, M.B.; Reif, A.K. Standard Chemical Thermodynamic Properties of Polycyclic Aromatic Hydrocarbons and Their Isomer Groups. II. Pyrene Series, Naphthopyrene Series, and Coronene Series. J. Phys. Chem. Ref. Data 1989, 18, 77–109. [Google Scholar] [CrossRef]
  95. Alberty, R.A.; Chung, M.B.; Reif, A.K. Standard Chemical Thermodynamic Properties of Polycyclic Aromatic Hydrocarbons and Their Isomer Groups. III. Naphthocoronene Series, Ovalene Series, and First Members of Some Higher Series. J. Phys. Chem. Ref. Data 1990, 19, 349–370. [Google Scholar] [CrossRef]
  96. Benson, S.W.; Cruickshank, F.R.; Golden, D.M.; Haugen, G.R.; O’Neal, H.E.; Rodgers, A.S.; Shaw, R.; Walsh, R. Additivity Rules for the Estimation of Thermochemical Properties. Chem. Rev. 1969, 69, 279–324. [Google Scholar] [CrossRef]
  97. Benson, S.W. Thermochemical Kinetics: Methods for the Estimation of Thermochemical Data and Rate Parameters, 2nd ed.; Wiley: New York, NY, USA, 1976. [Google Scholar]
  98. Cohen, N.; Benson, S.W. Estimation of Heats of Formation of Organic Compounds by Additivity Methods. Chem. Rev. 1993, 93, 2419–2438. [Google Scholar] [CrossRef]
  99. Cohen, N. Revised Group Additivity Values for Enthalpies of Formation (at 298 K) of Carbon-Hydrogen and Carbon-Hydrogen-Oxygen Compounds. J. Phys. Chem. Ref. Data 1996, 25, 1411–1481. [Google Scholar] [CrossRef]
  100. Domalski, E.S.; Hearing, E.D. Estimation of the Thermodynamic Properties of Hydrocarbons at 298.15 K. J. Phys. Chem. Ref. Data 1988, 17, 1637–1678. [Google Scholar] [CrossRef]
  101. Domalski, E.S.; Hearing, E.D. Estimation of the Thermodynamic Properties of C–H–N–O–S–Halogen Compounds at 298.15 K. J. Phys. Chem. Ref. Data 1993, 22, 805–1159. [Google Scholar] [CrossRef]
  102. Sabbe, M.K.; Saeys, M.; Reyniers, M.F.; Marin, G.B.; van Speybroeck, V.; Waroquier, M. Group Additive Values for the Gas Phase Standard Enthalpy of Formation of Hydrocarbons and Hydrocarbon Radicals. J. Phys. Chem. A 2005, 109, 7466–7480. [Google Scholar] [CrossRef]
  103. Sabbe, M.K.; de Vleeschouwer, F.; Reyniers, M.F.; Waroquier, M.; Marin, G.B. First Principles Based Group Additive Values for the Gas Phase Standard Entropy and Heat Capacity of Hydrocarbons and Hydrocarbon Radicals. J. Phys. Chem. A 2008, 112, 12235–12251. [Google Scholar] [CrossRef]
  104. Poling, B.E.; Prausnitz, J.M.; O’Connell, J.P. The Properties of Gases and Liquids, 5th ed.; McGraw-Hill: New York, NY, USA, 2001. [Google Scholar]
  105. Burgess, D.R. Thermochemical Data. In NIST Chemistry WebBook, NIST Standard Reference Database Number 69; Linstrom, P.J., Mallard, W.G., Eds.; National Institute of Standards and Technology: Gaithersburg, MD, USA, 2018. [Google Scholar]
  106. Chao, J.; Hall, K.R.; Marsh, K.N.; Wilhoit, R.C. Thermodynamic Properties of Key Organic Oxygen Compounds in the Carbon Range C1 to C4. Part 2. Ideal Gas Properties. J. Phys. Chem. Ref. Data 1986, 15, 1369–1436. [Google Scholar] [CrossRef]
  107. Pilcher, G.; Pell, S.; Coleman, D.J. Measurements of Heats of Combustion by Flame Calorimetry. Part 2.—Dimethyl Ether, Methyl Ethyl Ether, Methyl n-Propyl Ether, Methyl isoPropyl Ether. Trans. Faraday Soc. 1964, 60, 499–505. [Google Scholar] [CrossRef]
  108. Kennedy, R.M.; Sagenkahn, M.; Aston, J.G. The Heat Capacity and Entropy, Heats of Fusion and Vaporization, and the Vapor Pressure of Dimethyl Ether. The Density of Gaseous Dimethyl Ether. J. Am. Chem. Soc. 1941, 63, 2267–2272. [Google Scholar] [CrossRef]
  109. Aguayo, A.T.; Ereña, J.; Mier, D.; Arandes, J.M.; Olazar, M.; Bilbao, J. Kinetic Modeling of Dimethyl Ether Synthesis in a Single Step on a CuO-ZnO-Al2O3/γ-Al2O3 Catalyst. Ind. Eng. Chem. Res. 2007, 46, 5522–5530. [Google Scholar] [CrossRef]
  110. Hayashi, H.; Moffat, J.B. The Properties of Heteropoly Acids and the Conversion of Methanol to Hydrocarbons. J. Catal. 1982, 77, 473–484. [Google Scholar] [CrossRef]
  111. Diep, B.T.; Wainwright, M.S. Thermodynamic Equilibrium Constants for the Methanol-Dimethyl Ether-Water System. J. Chem. Eng. Data 1987, 32, 330–333. [Google Scholar] [CrossRef]
  112. Given, P.H. Given—Korrelation zu Methanol-Dehydratisierung, 1943. J. Chem. Soc. 1943, 589. [Google Scholar] [CrossRef]
  113. Tavan, Y.; Hasanvandian, R. Two Practical Equations for Methanol Dehydration Reaction over HZSM-5 Catalyst—Part I: Second Rrder Rate Equation. Fuel 2015, 142, 208–214. [Google Scholar] [CrossRef]
  114. Gayubo, A.G.; Aguayo, A.T.; Castilla, M.; Morán, A.L.; Bilbao, J. Role of Water in the Kinetic Modeling of Methanol Transformation into Hydrocarbons on HZSM-5 Zeolite. Chem. Eng. Commun. 2004, 191, 944–967. [Google Scholar] [CrossRef]
  115. Schiffino, R.S.; Merrill, R.P. A Mechanistic Study of the Methanol Dehydration Reaction on γ–Alumina Catalyst. J. Phys. Chem. 1993, 97, 6425–6435. [Google Scholar] [CrossRef]
  116. Khademi, M.H.; Farsi, M.; Rahimpour, M.R.; Jahanmiri, A. DME Synthesis and Cyclohexane Dehydrogenation Reaction in an Optimized Thermally Coupled Reactor. Chem. Eng. Process. 2011, 50, 113–123. [Google Scholar] [CrossRef]
  117. Spivey, J.J. Review: Dehydration Catalysts for the Methanol/Dimethyl Ether Reaction. Chem. Eng. Commun. 1991, 110, 123–142. [Google Scholar] [CrossRef]
  118. Steinfeld, J.I.; Francisco, J.S.; Hase, W.L. Chemical Kinetics and Dynamics; Prentice Hall: Englewood Cliffs, NJ, USA, 1989. [Google Scholar]
  119. Davis, M.E.; Davis, R.J. Fundamentals of Chemical Reaction Engineering; Chemical Engineering Series; McGraw-Hill: New York, NY, USA, 2003. [Google Scholar]
  120. Marin, G.B.; Yablonsky, G.S. Kinetics of Chemical Reactions: Decoding Complexity; Wiley-VCH: Weinheim, Germany, 2011. [Google Scholar]
  121. Froment, G.F.; Bischoff, K.B.; de Wilde, J. Chemical Reactor Analysis and Design, 3rd ed.; Wiley: New York, NY, USA, 2011. [Google Scholar]
  122. Dittmeyer, R.; Emig, G. Simultaneous Heat and Mass Transfer and Chemical Reaction. In Handbook of Heterogeneous Catalysis; Ertl, G., Knözinger, H., Schüth, F., Weitkamp, J., Eds.; Wiley-VCH: Weinheim, Germany, 2008; pp. 1727–1784. [Google Scholar]
  123. Dumesic, J.A.; Huber, G.W.; Boudart, M. Principles of Heterogeneous Catalysis. In Handbook of Heterogeneous Catalysis; Ertl, G., Knözinger, H., Schüth, F., Weitkamp, J., Eds.; Wiley-VCH: Weinheim, Germany, 2008; pp. 1–15. [Google Scholar]
  124. Lynggaard, H.; Andreasen, A.; Stegelmann, C.; Stoltze, P. Analysis of Simple Kinetic Models in Heterogeneous Catalysis. Prog. Surf. Sci. 2004, 77, 71–137. [Google Scholar] [CrossRef]
  125. Neimark, A.V.; Sing, K.S.W.; Thommes, M. Surface Area and Porosity. In Handbook of Heterogeneous Catalysis; Ertl, G., Knözinger, H., Schüth, F., Weitkamp, J., Eds.; Wiley-VCH: Weinheim, Germany, 2008; pp. 721–738. [Google Scholar]
  126. Schwaab, M.; Pinto, J.C. Optimum Reparameterization of Power Function Models. Chem. Eng. Sci. 2008, 63, 4631–4635. [Google Scholar] [CrossRef]
  127. Kapteijn, F.; Berger, R.J.; Moulijn, J.A. Rate Procurement and Kinetic Modeling. In Handbook of Heterogeneous Catalysis; Ertl, G., Knözinger, H., Schüth, F., Weitkamp, J., Eds.; Wiley-VCH: Weinheim, Germany, 2008; pp. 1693–1714. [Google Scholar]
  128. Buzzi-Ferraris, G.; Manenti, F. Kinetic Models Analysis. Chem. Eng. Sci. 2009, 64, 1061–1074. [Google Scholar] [CrossRef]
  129. Eyring, H. The Activated Complex and the Absolute Rate of Chemical Reactions. Chem. Rev. 1935, 17, 65–77. [Google Scholar] [CrossRef]
  130. Nørskov, J.K.; Studt, F.; Abild-Pedersen, F.; Bligaard, T. Fundamental Concepts in Heterogeneous Catalysis; John Wiley & Sons: Hoboken, NJ, USA, 2014. [Google Scholar]
  131. Schwaab, M.; Pinto, J.C. Optimum Reference Temperature for Reparameterization of the Arrhenius equation. Part 1: Problems Involving One Kinetic Constant. Chem. Eng. Sci. 2007, 62, 2750–2764. [Google Scholar] [CrossRef]
  132. Park, T.Y.; Froment, G.F. Kinetic Modeling of the Methanol to Olefins Process. 2. Experimental Results, Model Discrimination, and Parameter Estimation. Ind. Eng. Chem. Res. 2001, 40, 4187–4196. [Google Scholar] [CrossRef]
  133. Schwaab, M.; Lemos, L.P.; Pinto, J.C. Optimum Reference Temperature for Reparameterization of the Arrhenius Equation. Part 2: Problems Involving Multiple Reparameterizations. Chem. Eng. Sci. 2008, 63, 2895–2906. [Google Scholar] [CrossRef]
  134. Toch, K.; Thybaut, J.W.; Vandegehuchte, B.D.; Narasimhan, C.S.L.; Domokos, L.; Marin, G.B. A Single-Event Microkinetic Model for “Ethylbenzene Dealkylation/Xylene Isomerization” on Pt/H-ZSM-5 Zeolite Catalyst. Appl. Catal. A 2012, 425–426, 130–144. [Google Scholar] [CrossRef]
  135. Wright, P.A.; Pearce, G.M. Structural Chemistry of Zeolites. In Zeolites and Catalysis; Čejka, J., Corma, A., Zones, S., Eds.; Wiley-VCH: Weinheim, Germany, 2010; Volume 1, pp. 171–207. [Google Scholar]
  136. Schmidt, F.; Reichelt, L.; Pätzold, C. Catalysis of Methanol Conversion to Hydrocarbons. In Methanol, Asinger’s Vision Today; Bertau, M., Offermanns, H., Plass, L., Schmidt, F., Wernicke, H.J., Eds.; Springer: Berlin, Germany, 2014; pp. 423–440. [Google Scholar]
  137. Wright, P.A. Microporous Framework Solids; RSC Materials Monographs; The Royal Society of Chemistry: Cambridge, UK, 2008. [Google Scholar]
  138. Ong, L.H. Nature and Stability of Aluminum Species in HZSM-5: Changes upon Hydrothermal Treatment and Effect of Binder. Ph.D. Dissertation, Technical University of Munich, Munich, Germany, 2009. [Google Scholar]
  139. Menges, M.; Kraushaar-Czarnetzki, B. Kinetics of Methanol to Olefins over AlPO4-Bound ZSM-5 Extrudates in a Two-Stage Unit with Dimethyl Ether Pre-Reactor. Microporous Mesoporous Mater. 2012, 164, 172–181. [Google Scholar] [CrossRef]
  140. McCusker, L.B.; Baerlocher, C. Zeolite Structures. In Introduction to Zeolite Science and Practice; van Bekkum, H., Flanigen, E.M., Jacobs, P.A., Jansen, J.C., Eds.; Studies in Surface Science and Catalysis; Elsevier: Amsterdam, The Netherlands, 2001; pp. 37–67. [Google Scholar]
  141. Baerlocher, C.; McCusker, L.B. Database of Zeolite Structures. Available online: http://www.iza-structure.org/databases/ (accessed on 18 October 2018).
  142. Lobo, R.F. Introduction to the Structural Chemistry of Zeolites. In Handbook of Zeolite Science and Technology; Auerbach, S.M., Carrado, K.A., Dutta, P.K., Eds.; Marcel Dekker: New York, NY, USA, 2003; pp. 80–112. [Google Scholar]
  143. Kokotailo, G.T.; Lawton, S.L.; Olson, D.H.; Meier, W.M. Structure of Synthetic Zeolite ZSM-5. Nature 1978, 272, 437–438. [Google Scholar] [CrossRef]
  144. Chang, C.D. Hydrocarbons from Methanol. Catal. Rev. Sci. Eng. 1983, 25, 1–118. [Google Scholar] [CrossRef]
  145. Rohrman, A.C.; LaPierre, R.B.; Schlenker, J.L.; Wood, J.D.; Valyocsik, E.W.; Rubin, M.K.; Higgins, J.B.; Rohrbaugh, W.J. The Framework Topology of ZSM-23: A High Silica Zeolite. Zeolites 1985, 5, 352–354. [Google Scholar] [CrossRef]
  146. Kumar, P.; Thybaut, J.W.; Teketel, S.; Svelle, S.; Beato, P.; Olsbye, U.; Marin, G.B. Single-Event MicroKinetics (SEMK) for Methanol to Hydrocarbons (MTH) on H-ZSM-23. Catal. Today 2013, 215, 224–232. [Google Scholar] [CrossRef]
  147. Teketel, S.; Skistad, W.; Benard, S.; Olsbye, U.; Lillerud, K.P.; Beato, P.; Svelle, S. Shape Selectivity in the Conversion of Methanol to Hydrocarbons: The Catalytic Performance of One-Dimensional 10-Ring Zeolites: ZSM-22, ZSM-23, ZSM-48, and EU-1. ACS Catal. 2012, 2, 26–37. [Google Scholar] [CrossRef]
  148. Lok, B.M.; Messina, C.A.; Patton, L.; Gajek, R.T.; Cannan, T.R.; Flanigen, E.M. Silicoaluminophosphate molecular sieves: another new class of microporous crystalline inorganic solids. J. Am. Chem. Soc. 1984, 106, 6092–6093. [Google Scholar] [CrossRef]
  149. Epelde, E.; Ibáñez, M.; Valecillos, J.; Aguayo, A.T.; Gayubo, A.G.; Bilbao, J.; Castaño, P. SAPO-18 and SAPO-34 Catalysts for Propylene Production from the Oligomerization-Cracking of Ethylene or 1-Butenes. Appl. Catal. A 2017, 547, 176–182. [Google Scholar] [CrossRef]
  150. Stöcker, M. Methanol to Olefins (MTO) and Methanol to Gasoline (MTG). In Zeolites and Catalysis; Čejka, J., Corma, A., Zones, S., Eds.; Wiley-VCH: Weinheim, Germany, 2010; Volume 2, pp. 687–711. [Google Scholar]
  151. Chen, J.; Thomas, J.M.; Wright, P.A.; Townsend, R.P. Silicoaluminophosphate Number Eighteen (SAPO-18): A New Microporous Solid Acid Catalyst. Catal. Lett. 1994, 28, 241–248. [Google Scholar] [CrossRef]
  152. Chen, J.; Wright, P.A.; Thomas, J.M.; Natarajan, S.; Marchese, L.; Bradley, S.M.; Sankar, G.; Catlow, R.A.; Gai-Boyes, P.; Townsend, R.P.; et al. SAPO-18 Catalysts and Their Brønststed Acid Sites. J. Phys. Chem. 1994, 98, 10216–10224. [Google Scholar] [CrossRef]
  153. Dessau, R.M.; LaPierre, R.B. On the Mechanism of Methanol Conversion to Hydrocarbons over HZSM-5. J. Catal. 1982, 78, 136–141. [Google Scholar] [CrossRef]
  154. Weitkamp, J.; Jacobs, P.A.; Martens, J.A. Isomerization and Hydrocracking of C9 through C16 n-Alkanes on Pt/HZSM-5 Zeolite. Appl. Catal. 1983, 8, 123–141. [Google Scholar] [CrossRef]
  155. Garwood, W.E. Conversion of C2–C10 to Higher Olefins over Synthetic Zeolite ZSM-5. In Intrazeolite Chemistry; ACS Symposium Series; Stucky, G.D., Dwyer, F.G., Eds.; American Chemical Society: Washington, DC, USA, 1983; Volume 218, pp. 383–396. [Google Scholar] [CrossRef]
  156. Tabak, S.A.; Krambeck, F.J.; Garwood, W.E. Conversion of Propylene and Butylene over ZSM-5 Catalyst. AIChE J. 1986, 32, 1526–1531. [Google Scholar] [CrossRef]
  157. Quann, R.J.; Green, L.A.; Tabak, S.A.; Krambeck, F.J. Chemistry of Olefin Oligomerization over ZSM-5 Catalyst. Ind. Eng. Chem. Res. 1988, 27, 565–570. [Google Scholar] [CrossRef]
  158. Buchanan, J.S.; Santiesteban, J.G.; Haag, W.O. Mechanistic Considerations in Acid-Catalyzed Cracking of Olefins. J. Catal. 1996, 158, 279–287. [Google Scholar] [CrossRef]
  159. Buchanan, J.S. Gasoline Selective ZSM-5 FCC Additives: Model Reactions of C6–C10 Olefins over Steamed 55:1 and 450:1 ZSM-5. Appl. Catal. A 1998, 171, 57–64. [Google Scholar] [CrossRef]
  160. Arudra, P.; Bhuiyan, T.I.; Akhtar, M.N.; Aitani, A.M.; Al-Khattaf, S.S.; Hattori, H. Silicalite-1 As Efficient Catalyst for Production of Propene from 1-Butene. ACS Catal. 2014, 4, 4205–4214. [Google Scholar] [CrossRef]
  161. Von Aretin, T.; Standl, S.; Tonigold, M.; Hinrichsen, O. Optimization of the Product Spectrum for 1-Pentene Cracking on ZSM-5 Using Single-Event Mmethodology. Part 2: Recycle Reactor. Chem. Eng. J. 2017, 309, 873–885. [Google Scholar] [CrossRef]
  162. Sundberg, J.; Standl, S.; von Aretin, T.; Tonigold, M.; Rehfeldt, S.; Hinrichsen, O.; Klein, H. Optimal Process for Catalytic Cracking of Higher Olefins on ZSM-5. Chem. Eng. J. 2018, 348, 84–94. [Google Scholar] [CrossRef]
  163. Von Aretin, T.; Standl, S.; Tonigold, M.; Hinrichsen, O. Optimization of the Product Spectrum for 1-Pentene Cracking on ZSM-5 Using Single-Event Methodology. Part 1: Two-Zone reactor. Chem. Eng. J. 2017, 309, 886–897. [Google Scholar] [CrossRef]
  164. Von Aretin, T.; Schallmoser, S.; Standl, S.; Tonigold, M.; Lercher, J.A.; Hinrichsen, O. Single-Event Kinetic Model for 1-Pentene Cracking on ZSM-5. Ind. Eng. Chem. Res. 2015, 54, 11792–11803. [Google Scholar] [CrossRef]
  165. Borges, P.; Ramos Pinto, R.; Lemos, A.; Lemos, F.; Védrine, J.C.; Derouane, E.G.; Ramôa Ribeiro, F. Light Olefin Transformation over ZSM-5 Zeolites: A Kinetic Model for Olefin Consumption. Appl. Catal. A 2007, 324, 20–29. [Google Scholar] [CrossRef]
  166. Huang, X.; Aihemaitijiang, D.; Xiao, W.D. Reaction Pathway and Kinetics of C3–C7 Olefin Transformation over High-silicon HZSM-5 Zeolite at 400–490 °C. Chem. Eng. J. 2015, 280, 222–232. [Google Scholar] [CrossRef]
  167. Nguyen, C.M.; de Moor, B.A.; Reyniers, M.F.; Marin, G.B. Physisorption and Chemisorption of Linear Alkenes in Zeolites: A Combined QM-Pot(MP2//B3LYP:GULP)-Statistical Thermodynamics Study. J. Phys. Chem. C 2011, 115, 23831–23847. [Google Scholar] [CrossRef]
  168. Kazansky, V.B.; Frash, M.V.; van Santen, R.A. Quantumchemical Study of the Isobutane Cracking on Zeolites. Appl. Catal. A 1996, 146, 225–247. [Google Scholar] [CrossRef]
  169. Rigby, A.M.; Kramer, G.J.; van Santen, R.A. Mechanisms of Hydrocarbon Conversion in Zeolites: A Quantum Mechanical Study. J. Catal. 1997, 170, 1–10. [Google Scholar] [CrossRef]
  170. Quintana-Solórzano, R.; Thybaut, J.W.; Marin, G.B.; Lødeng, R.; Holmen, A. Single-Event Microkinetics for Coke Formation in Catalytic Cracking. Catal. Today 2005, 107–108, 619–629. [Google Scholar] [CrossRef]
  171. Sun, X.; Müller, S.; Liu, Y.; Shi, H.; Haller, G.L.; Sanchez-Sanchez, M.; van Veen, A.C.; Lercher, J.A. On Reaction Pathways in the Conversion of Methanol to Hydrocarbons on HZSM-5. J. Catal. 2014, 317, 185–197. [Google Scholar] [CrossRef]
  172. Feng, W.; Vynckier, E.; Froment, G.F. Single-Event Kinetics of Catalytic Cracking. Ind. Eng. Chem. Res. 1993, 32, 2997–3005. [Google Scholar] [CrossRef]
  173. Chang, C.D.; Silvestri, A.J. The Conversion of Methanol and Other O-Compounds to Hydrocarbons over Zeolite Catalysts. J. Catal. 1977, 47, 249–259. [Google Scholar] [CrossRef]
  174. Stöcker, M. Methanol-to-Hydrocarbons: Catalytic Materials and their Behavior. Microporous Mesoporous Mater. 1999, 29, 3–48. [Google Scholar] [CrossRef]
  175. Koempel, H.; Liebner, W. Lurgi’s Methanol To Propylene (MTP®) Report on a Successful Commercialisation. In Natural Gas Conversion VIII; Studies in Surface Science and Catalysis; Noronha, F., Schmal, M., Sousa-Aguiar, E.F., Eds.; Elsevier: Amsterdam, The Netherlands, 2007; Volume 167, pp. 261–267. [Google Scholar]
  176. Forester, T.R.; Howe, R.F. In Situ FTIR Studies of Methanol and Dimethyl Ether in ZSM-5. J. Am. Chem. Soc. 1987, 109, 5076–5082. [Google Scholar] [CrossRef]
  177. Anderson, M.W.; Barrie, P.J.; Klinowski, J. 1H Magic-Angle-Spinning NMR Studies of the Adsorption of Alcohols on Molecular Sieve Catalysts. J. Phys. Chem. 1991, 95, 235–239. [Google Scholar] [CrossRef]
  178. Martin, K.A.; Zabransky, R.F. Conversion of Methanol to Dimethylether over ZSM-5 by DRIFT Spectroscopy. Appl. Spectrosc. 1991, 45, 68–72. [Google Scholar] [CrossRef]
  179. Blaszkowski, S.R.; van Santen, R.A. The Mechanism of Dimethyl Ether Formation from Methanol Catalyzed by Zeolitic Protons. J. Am. Chem. Soc. 1996, 118, 5152–5153. [Google Scholar] [CrossRef] [Green Version]
  180. Blaszkowski, S.R.; van Santen, R.A. Theoretical Study of the Mechanism of Surface Methoxy and Dimethyl Ether Formation from Methanol Catalyzed by Zeolitic Protons. J. Phys. Chem. B 1997, 101, 2292–2305. [Google Scholar] [CrossRef]
  181. Maihom, T.; Boekfa, B.; Sirijaraensre, J.; Nanok, T.; Probst, M.; Limtrakul, J. Reaction Mechanisms of the Methylation of Ethene with Methanol and Dimethyl Ether over H-ZSM-5: An ONIOM Study. J. Phys. Chem. C 2009, 113, 6654–6662. [Google Scholar] [CrossRef]
  182. Jones, A.J.; Iglesia, E. Kinetic, Spectroscopic, and Theoretical Assessment of Associative and Dissociative Methanol Dehydration Routes in Zeolites. Angew. Chem. Int. Ed. 2014, 53, 12177–12181. [Google Scholar] [CrossRef]
  183. Liu, Y.; Müller, S.; Berger, D.; Jelic, J.; Reuter, K.; Tonigold, M.; Sanchez-Sanchez, M.; Lercher, J.A. Formation Mechanism of the First Carbon-Carbon Bond and the First Olefin in the Methanol Conversion into Hydrocarbons. Angew. Chem. Int. Ed. 2016, 55, 5723–5726. [Google Scholar] [CrossRef]
  184. Dahl, I.M.; Kolboe, S. On the Reaction Mechanism for Propene Formation in the MTO Reaction over SAPO-34. Catal. Lett. 1993, 20, 329–336. [Google Scholar] [CrossRef]
  185. Dahl, I.M.; Kolboe, S. On the Reaction Mechanism for Hydrocarbon Formation from Methanol over SAPO-34: I. Isotopic Labeling Studies of the Co-Reaction of Ethene and Methanol. J. Catal. 1994, 149, 458–464. [Google Scholar] [CrossRef]
  186. Dahl, I.M.; Kolboe, S. On the Reaction Mechanism for Hydrocarbon Formation from Methanol over SAPO-34: 2. Isotopic Labeling Studies of the Co-Reaction of Propene and Methanol. J. Catal. 1996, 161, 304–309. [Google Scholar] [CrossRef]
  187. Bjørgen, M.; Olsbye, U.; Petersen, D.; Kolboe, S. The Methanol-to-Hydrocarbons Reaction: Insight into the Reaction Mechanism from [12C]Benzene and [13C]Methanol Coreactions over Zeolite H-Beta. J. Catal. 2004, 221, 1–10. [Google Scholar] [CrossRef]
  188. Wang, W.; Jiang, Y.; Hunger, M. Mechanistic Investigations of the Methanol-to-Olefin (MTO) Process on Acidic Zeolite Catalysts by in situ Solid-State NMR Spectroscopy. Catal. Today 2006, 113, 102–114. [Google Scholar] [CrossRef]
  189. Olsbye, U.; Bjørgen, M.; Svelle, S.; Lillerud, K.P.; Kolboe, S. Mechanistic Insight into the Methanol-to-Hydrocarbons Reaction. Catal. Today 2005, 106, 108–111. [Google Scholar] [CrossRef]
  190. Olsbye, U.; Svelle, S.; Lillerud, K.P.; Wei, Z.H.; Chen, Y.Y.; Li, J.F.; Wang, J.G.; Fan, W.B. The Formation and Degradation of Active Species during Methanol Conversion over Protonated Zeotype Catalysts. Chem. Soc. Rev. 2015, 44, 7155–7176. [Google Scholar] [CrossRef]
  191. Tian, P.; Wei, Y.; Ye, M.; Liu, Z. Methanol to Olefins (MTO): From Fundamentals to Commercialization. ACS Catal. 2015, 5, 1922–1938. [Google Scholar] [CrossRef]
  192. Mole, T.; Whiteside, J.A. Conversion of Methanol to Ethylene over ZSM-5 Zeolite in the Presence of Deuterated Water. J. Catal. 1982, 75, 284–290. [Google Scholar] [CrossRef]
  193. Sassi, A.; Wildman, M.A.; Ahn, H.J.; Prasad, P.; Nicholas, J.B.; Haw, J.F. Methylbenzene Chemistry on Zeolite HBeta: Multiple Insights into Methanol-to-Olefin Catalysis. J. Phys. Chem. B 2002, 106, 2294–2303. [Google Scholar] [CrossRef]
  194. Haw, J.F.; Song, W.; Marcus, D.M.; Nicholas, J.B. The Mechanism of Methanol to Hydrocarbon Catalysis. Acc. Chem. Res. 2003, 36, 317–326. [Google Scholar] [CrossRef]
  195. Arstad, B.; Nicholas, J.B.; Haw, J.F. Theoretical Study of the Methylbenzene Side-Chain Hydrocarbon Pool Mechanism in Methanol to Olefin Catalysis. J. Am. Chem. Soc. 2004, 126, 2991–3001. [Google Scholar] [CrossRef]
  196. Lesthaeghe, D.; Horré, A.; Waroquier, M.; Marin, G.B.; van Speybroeck, V. Theoretical Insights on Methylbenzene Side-Chain Growth in ZSM-5 Zeolites for Methanol-to-Olefin Conversion. Chem. Eur. J. 2009, 15, 10803–10808. [Google Scholar] [CrossRef]
  197. Sullivan, R.F.; Egan, C.J.; Langlois, G.E.; Sieg, R.P. A New Reaction That Occurs in the Hydrocracking of Certain Aromatic Hydrocarbons. J. Am. Chem. Soc. 1961, 83, 1156–1160. [Google Scholar] [CrossRef]
  198. Dessau, R.M. On the H-ZSM-5 Catalyzed Formation of Ethylene from Methanol or Higher Olefins. J. Catal. 1986, 99, 111–116. [Google Scholar] [CrossRef]
  199. Svelle, S.; Joensen, F.; Nerlov, J.; Olsbye, U.; Lillerud, K.P.; Kolboe, S.; Bjørgen, M. Conversion of Methanol into Hydrocarbons over Zeolite H-ZSM-5: Ethene Formation is Mechanistically Separated from the Formation of Higher Alkenes. J. Am. Chem. Soc. 2006, 128, 14770–14771. [Google Scholar] [CrossRef]
  200. Bjørgen, M.; Svelle, S.; Joensen, F.; Nerlov, J.; Kolboe, S.; Bonino, F.; Palumbo, L.; Bordiga, S.; Olsbye, U. Conversion of Methanol to Hydrocarbons over Zeolite H-ZSM-5: On the Origin of the Olefinic Species. J. Catal. 2007, 249, 195–207. [Google Scholar] [CrossRef]
  201. Svelle, S.; Arstad, B.; Kolboe, S.; Swang, O. A Theoretical Investigation of the Methylation of Alkenes with Methanol over Acidic Zeolites. J. Phys. Chem. B 2003, 107, 9281–9289. [Google Scholar] [CrossRef]
  202. Svelle, S.; Kolboe, S.; Swang, O.; Olsbye, U. Methylation of Alkenes and Methylbenzenes by Dimethyl Ether or Methanol on Acidic Zeolites. J. Phys. Chem. B 2005, 109, 12874–12878. [Google Scholar] [CrossRef]
  203. Martínez-Espín, J.S.; Mortén, M.; Janssens, T.V.W.; Svelle, S.; Beato, P.; Olsbye, U. New Insights into Catalyst Deactivation and Product Distribution of Zeolites in the Methanol-to-Hydrocarbons (MTH) Reaction with Methanol and Dimethyl Ether Feeds. Catal. Sci. Technol. 2017, 7, 2700–2716. [Google Scholar] [CrossRef]
  204. Hutchings, G.J.; Hunter, R. Hydrocarbon Formation from Methanol and Dimethyl Ether: A Review of the Experimental Observations Concerning the Mechanism of Formation of the Primary Products. Catal. Today 1990, 6, 279–306. [Google Scholar] [CrossRef]
  205. Müller, S.; Liu, Y.; Kirchberger, F.M.; Tonigold, M.; Sanchez-Sanchez, M.; Lercher, J.A. Hydrogen Transfer Pathways during Zeolite Catalyzed Methanol Conversion to Hydrocarbons. J. Am. Chem. Soc. 2016, 138, 15994–16003. [Google Scholar] [CrossRef]
  206. Martínez-Espín, J.S.; de Wispelaere, K.; Janssens, T.V.W.; Svelle, S.; Lillerud, K.P.; Beato, P.; van Speybroeck, V.; Olsbye, U. Hydrogen Transfer versus Methylation: On the Genesis of Aromatics Formation in the Methanol-To-Hydrocarbons Reaction over H-ZSM-5. ACS Catal. 2017, 7, 5773–5780. [Google Scholar] [CrossRef]
  207. Huang, X.; Li, H.; Li, H.; Xiao, W.D. Modeling and Analysis of the Lurgi-Type Methanol to Propylene Process: Optimization of Olefin Recycle. AIChE J. 2017, 63, 306–313. [Google Scholar] [CrossRef]
  208. Svelle, S.; Rønning, P.O.; Kolboe, S. Kinetic Studies of Zeolite-Catalyzed Methylation Reactions 1. Coreaction of [12C]Ethene and [13C]Methanol. J. Catal. 2004, 224, 115–123. [Google Scholar] [CrossRef]
  209. Svelle, S.; Rønning, P.O.; Olsbye, U.; Kolboe, S. Kinetic Studies of Zeolite-Catalyzed Methylation Reactions. Part 2. Co-Reaction of [12C]Propene or [12C]n-Butene and [13C]Methanol. J. Catal. 2005, 234, 385–400. [Google Scholar] [CrossRef]
  210. Wu, W.; Guo, W.; Xiao, W.D.; Luo, M. Dominant Reaction Pathway for Methanol Conversion to Propene over High Silicon H-ZSM-5. Chem. Eng. Sci. 2011, 66, 4722–4732. [Google Scholar] [CrossRef]
  211. Ilias, S.; Bhan, A. Tuning the Selectivity of Methanol-to-Hydrocarbons Conversion on H-ZSM-5 by Co-Processing Olefin or Aromatic Compounds. J. Catal. 2012, 290, 186–192. [Google Scholar] [CrossRef]
  212. Guo, W.; Xiao, W.D.; Luo, M. Comparison among Monolithic and Randomly Packed Reactors for the Methanol-to-Propylene Process. Chem. Eng. J. 2012, 207–208, 734–745. [Google Scholar] [CrossRef]
  213. Sun, X.; Müller, S.; Shi, H.; Haller, G.L.; Sanchez-Sanchez, M.; van Veen, A.C.; Lercher, J.A. On the Impact of Co-Feeding Aromatics and Olefins for the Methanol-to-Olefins Reaction on HZSM-5. J. Catal. 2014, 314, 21–31. [Google Scholar] [CrossRef]
  214. Chang, C.D. Methanol Conversion to Light Olefins. Catal. Rev. Sci. Eng. 1984, 26, 323–345. [Google Scholar] [CrossRef]
  215. Froment, G.F.; Dehertog, W.J.H.; Marchi, A.J. Zeolite Catalysis in the Conversion of Methanol into Olefins. In Catalysis; Spivey, J.J., Ed.; The Royal Society of Chemistry: Cambridge, UK, 1992; Volume 9, pp. 1–64. [Google Scholar]
  216. Svelle, S.; Visur, M.; Olsbye, U.; Saepurahman.; Bjørgen, M. Mechanistic Aspects of the Zeolite Catalyzed Methylation of Alkenes and Aromatics with Methanol: A Review. Top. Catal. 2011, 54, 897–906. [Google Scholar] [CrossRef]
  217. Ilias, S.; Bhan, A. Mechanism of the Catalytic Conversion of Methanol to Hydrocarbons. ACS Catal. 2013, 3, 18–31. [Google Scholar] [CrossRef]
  218. Svelle, S.; Bjørgen, M. Mechanistic Proposal for the Zeolite Catalyzed Methylation of Aromatic Compounds. J. Phys. Chem. A 2010, 114, 12548–12554. [Google Scholar] [CrossRef]
  219. Hill, I.M.; Ng, Y.S.; Bhan, A. Kinetics of Butene Isomer Methylation with Dimethyl Ether over Zeolite Catalysts. ACS Catal. 2012, 2, 1742–1748. [Google Scholar] [CrossRef]
  220. Hill, I.M.; Al Hashimi, S.; Bhan, A. Kinetics and Mechanism of Olefin Methylation Reactions on Zeolites. J. Catal. 2012, 285, 115–123. [Google Scholar] [CrossRef]
  221. Hill, I.; Malek, A.; Bhan, A. Kinetics and Mechanism of Benzene, Toluene, and Xylene Methylation over H-MFI. ACS Catal. 2013, 3, 1992–2001. [Google Scholar] [CrossRef]
  222. Brogaard, R.Y.; Wang, C.M.; Studt, F. Methanol-Alkene Reactions in Zeotype Acid Catalysts: Insights from a Descriptor-Based Approach and Microkinetic Modeling. ACS Catal. 2014, 4, 4504–4509. [Google Scholar] [CrossRef]
  223. Brogaard, R.Y.; Henry, R.; Schuurman, Y.; Medford, A.J.; Moses, P.G.; Beato, P.; Svelle, S.; Nørskov, J.K.; Olsbye, U. Methanol-to-Hydrocarbons Conversion: The Alkene Methylation Pathway. J. Catal. 2014, 314, 159–169. [Google Scholar] [CrossRef]
  224. Martínez-Espín, J.S.; de Wispelaere, K.; Westgård Erichsen, M.; Svelle, S.; Janssens, T.V.W.; van Speybroeck, V.; Beato, P.; Olsbye, U. Benzene Co-Reaction with Methanol and Dimethyl Ether over Zeolite and Zeotype Catalysts: Evidence of Parallel Reaction Paths to Toluene and Diphenylmethane. J. Catal. 2017, 349, 136–148. [Google Scholar] [CrossRef]
  225. Li, J.; Wei, Y.; Liu, G.; Qi, Y.; Tian, P.; Li, B.; He, Y.; Liu, Z. Comparative Study of MTO Conversion over SAPO-34, H-ZSM-5 and H-ZSM-22: Correlating Catalytic Performance and Reaction Mechanism to Zeolite Topology. Catal. Today 2011, 171, 221–228. [Google Scholar] [CrossRef]
  226. Almutairi, S.M.T.; Mezari, B.; Pidko, E.A.; Magusin, P.C.M.M.; Hensen, E.J.M. Influence of Steaming on the Acidity and the Methanol Conversion Reaction of HZSM-5 Zeolite. J. Catal. 2013, 307, 194–203. [Google Scholar] [CrossRef]
  227. Khare, R.; Bhan, A. Mechanistic Studies of Methanol-to-Hydrocarbons Conversion on Diffusion-Free MFI Samples. J. Catal. 2015, 329, 218–228. [Google Scholar] [CrossRef]
  228. Westgård Erichsen, M.; de Wispelaere, K.; Hemelsoet, K.; Moors, S.L.; Deconinck, T.; Waroquier, M.; Svelle, S.; van Speybroeck, V.; Olsbye, U. How Zeolitic Acid Strength and Composition Alter the Reactivity of Alkenes and Aromatics towards Methanol. J. Catal. 2015, 328, 186–196. [Google Scholar] [CrossRef]
  229. Wu, W.; Guo, W.; Xiao, W.D.; Luo, M. Methanol Conversion to Olefins (MTO) over H-ZSM-5: Evidence of Product Distribution Governed by Methanol Conversion. Fuel Process. Technol. 2013, 108, 19–24. [Google Scholar] [CrossRef]
  230. Kaarsholm, M.; Joensen, F.; Nerlov, J.; Cenni, R.; Chaouki, J.; Patience, G.S. Phosphorous Modified ZSM-5: Deactivation and Product Distribution for MTO. Chem. Eng. Sci. 2007, 62, 5527–5532. [Google Scholar] [CrossRef]
  231. Janssens, T.V.W. A New Approach to the Modeling of Deactivation in the Conversion of Methanol on Zeolite Catalysts. J. Catal. 2009, 264, 130–137. [Google Scholar] [CrossRef]
  232. Schulz, H. “Coking” of Zeolites during Methanol Conversion: Basic Reactions of the MTO-, MTP- and MTG Processes. Catal. Today 2010, 154, 183–194. [Google Scholar] [CrossRef]
  233. Bleken, F.L.; Barbera, K.; Bonino, F.; Olsbye, U.; Lillerud, K.P.; Bordiga, S.; Beato, P.; Janssens, T.V.W.; Svelle, S. Catalyst Deactivation by Coke Formation in Microporous and Desilicated Zeolite H-ZSM-5 During the Conversion of Methanol to Hydrocarbons. J. Catal. 2013, 307, 62–73. [Google Scholar] [CrossRef]
  234. Müller, S.; Liu, Y.; Vishnuvarthan, M.; Sun, X.; van Veen, A.C.; Haller, G.L.; Sanchez-Sanchez, M.; Lercher, J.A. Coke Formation and Deactivation Pathways on H-ZSM-5 in the Conversion of Methanol to Olefins. J. Catal. 2015, 325, 48–59. [Google Scholar] [CrossRef]
  235. Epelde, E.; Aguayo, A.T.; Olazar, M.; Bilbao, J.; Gayubo, A.G. Kinetic Model for the Transformation of 1-Butene on a K-Modified HZSM-5 Catalyst. Ind. Eng. Chem. Res. 2014, 53, 10599–10607. [Google Scholar] [CrossRef]
  236. Ying, L.; Zhu, J.; Cheng, Y.; Wang, L.; Li, X. Kinetic Modeling of C2–C7 Olefins Interconversion over ZSM-5 Catalyst. J. Ind. Eng. Chem. 2016, 33, 80–90. [Google Scholar] [CrossRef]
  237. Oliveira, P.; Borges, P.; Ramos Pinto, R.; Lemos, A.; Lemos, F.; Védrine, J.C.; Ramôa Ribeiro, F. Light Olefin Transformation over ZSM-5 Zeolites with Different Acid Strengths—A Kinetic Model. Appl. Catal. A 2010, 384, 177–185. [Google Scholar] [CrossRef]
  238. Epelde, E.; Gayubo, A.G.; Olazar, M.; Bilbao, J.; Aguayo, A.T. Modified HZSM-5 Zeolites for Intensifying Propylene Production in the Transformation of 1-Butene. Chem. Eng. J. 2014, 251, 80–91. [Google Scholar] [CrossRef]
  239. Epelde, E.; Gayubo, A.G.; Olazar, M.; Bilbao, J.; Aguayo, A.T. Intensifying Propylene Production by 1-Butene Transformation on a K Modified HZSM-5 Zeolite-Catalyst. Ind. Eng. Chem. Res. 2014, 53, 4614–4622. [Google Scholar] [CrossRef]
  240. Huang, X.; Aihemaitijiang, D.; Xiao, W.D. Co-Reaction of Methanol and Olefins on the High Silicon HZSM-5 Catalyst: A Kinetic Study. Chem. Eng. J. 2016, 286, 150–164. [Google Scholar] [CrossRef]
  241. Borges, P.; Ramos Pinto, R.; Lemos, A.; Lemos, F.; Védrine, J.C.; Derouane, E.G.; Ramôa Ribeiro, F. Activity-acidity Relationship for Alkane Cracking over Zeolites: n-Hexane Cracking over HZSM-5. J. Mol. Catal. A Chem. 2005, 229, 127–135. [Google Scholar] [CrossRef]
  242. Schallmoser, S. Insight into Catalytic Cracking of Hydrocarbons over MFI type Zeolites. Ph.D. Dissertation, Technical University of Munich, Munich, Germany, 2014. [Google Scholar]
  243. Nguyen, C.M.; de Moor, B.A.; Reyniers, M.F.; Marin, G.B. Isobutene Protonation in H-FAU, H-MOR, H-ZSM-5, and H-ZSM-22. J. Phys. Chem. C 2012, 116, 18236–18249. [Google Scholar] [CrossRef]
  244. Standl, S.; Tonigold, M.; Hinrichsen, O. Single-Event Kinetic Modeling of Olefin Cracking on ZSM-5: Proof of Feed Independence. Ind. Eng. Chem. Res. 2017, 56, 13096–13108. [Google Scholar] [CrossRef]
  245. Baltanas, M.A.; van Raemdonck, K.K.; Froment, G.F.; Mohedas, S.R. Fundamental Kinetic Modeling of Hydroisomerization and Hydrocracking on Noble-Metal-Loaded Faujasites. 1. Rate Parameters for Hydroisomerization. Ind. Eng. Chem. Res. 1989, 28, 899–910. [Google Scholar] [CrossRef]
  246. Mhadeshwar, A.B.; Wang, H.; Vlachos, D.G. Thermodynamic Consistency in Microkinetic Development of Surface Reaction Mechanisms. J. Phys. Chem. B 2003, 107, 12721–12733. [Google Scholar] [CrossRef] [Green Version]
  247. Chen, C.J.; Rangarajan, S.; Hill, I.M.; Bhan, A. Kinetics and Thermochemistry of C4–C6 Olefin Cracking on H-ZSM-5. ACS Catal. 2014, 4, 2319–2327. [Google Scholar] [CrossRef]
  248. Mazar, M.N.; Al-Hashimi, S.; Cococcioni, M.; Bhan, A. β-Scission of Olefins on Acidic Zeolites: A Periodic PBE-D Study in H-ZSM-5. J. Phys. Chem. C 2013, 117, 23609–23620. [Google Scholar] [CrossRef]
  249. Li, J.; Li, T.; Ma, H.; Sun, Q.; Li, C.; Ying, W.; Fang, D. Kinetics of Coupling Cracking of Butene and Pentene on Modified HZSM-5 Catalyst. Chem. Eng. J. 2018, 346, 397–405. [Google Scholar] [CrossRef]
  250. Meng, X.; Xu, C.; Li, L.; Gao, J. Kinetic Study of Catalytic Pyrolysis of C4 Hydrocarbons on a Modified ZSM-5 Zeolite Catalyst. Energy Fuels 2010, 24, 6233–6238. [Google Scholar] [CrossRef]
  251. Jiang, B.; Feng, X.; Yan, L.; Jiang, Y.; Liao, Z.; Wang, J.; Yang, Y. Methanol to Propylene Process in a Moving Bed Reactor with Byproducts Recycling: Kinetic Study and Reactor Simulation. Ind. Eng. Chem. Res. 2014, 53, 4623–4632. [Google Scholar] [CrossRef]
  252. Aguayo, A.T.; Mier, D.; Gayubo, A.G.; Gamero, M.; Bilbao, J. Kinetics of Methanol Transformation into Hydrocarbons on a HZSM-5 Zeolite Catalyst at High Temperature (400–550 °C). Ind. Eng. Chem. Res. 2010, 49, 12371–12378. [Google Scholar] [CrossRef]
  253. Pérez-Uriarte, P.; Ateka, A.; Aguayo, A.T.; Gayubo, A.G.; Bilbao, J. Kinetic Model for the Reaction of DME to Olefins over a HZSM-5 Zeolite Catalyst. Chem. Eng. J. 2016, 302, 801–810. [Google Scholar] [CrossRef]
  254. Park, T.Y.; Froment, G.F. Kinetic Modeling of the Methanol to Olefins Process. 1. Model Formulation. Ind. Eng. Chem. Res. 2001, 40, 4172–4186. [Google Scholar] [CrossRef]
  255. Gayubo, A.G.; Aguayo, A.T.; Sánchez del Campo, A.E.; Tarrío, A.M.; Bilbao, J. Kinetic Modeling of Methanol Transformation into Olefins on a SAPO-34 Catalyst. Ind. Eng. Chem. Res. 2000, 39, 292–300. [Google Scholar] [CrossRef]
  256. Ying, L.; Yuan, X.; Ye, M.; Cheng, Y.; Li, X.; Liu, Z. A Seven Lumped Kinetic Model for Industrial Catalyst in DMTO Process. Chem. Eng. Res. Des. 2015, 100, 179–191. [Google Scholar] [CrossRef]
  257. Chen, D.; Grønvold, A.; Moljord, K.; Holmen, A. Methanol Conversion to Light Olefins over SAPO-34: Reaction Network and Deactivation Kinetics. Ind. Eng. Chem. Res. 2007, 46, 4116–4123. [Google Scholar] [CrossRef]
  258. Alwahabi, S.M.; Froment, G.F. Single Event Kinetic Modeling of the Methanol-to-Olefins Process on SAPO-34. Ind. Eng. Chem. Res. 2004, 43, 5098–5111. [Google Scholar] [CrossRef]
  259. Gayubo, A.G.; Aguayo, A.T.; Alonso, A.; Atutxa, A.; Bilbao, J. Reaction Scheme and Kinetic Modelling for the MTO Process over a SAPO-18 Catalyst. Catal. Today 2005, 106, 112–117. [Google Scholar] [CrossRef]
  260. Gayubo, A.G.; Aguayo, A.T.; Alonso, A.; Bilbao, J. Kinetic Modeling of the Methanol-to-Olefins Process on a Silicoaluminophosphate (SAPO-18) Catalyst by Considering Deactivation and the Formation of Individual Olefins. Ind. Eng. Chem. Res. 2007, 46, 1981–1989. [Google Scholar] [CrossRef]
  261. Sánchez del Campo, A.E.; Gayubo, A.G.; Aguayo, A.T.; Tarrío, A.; Bilbao, J. Acidity, Surface Species, and Mechanism of Methanol Transformation into Olefins on a SAPO-34. Ind. Eng. Chem. Res. 1998, 37, 2336–2340. [Google Scholar] [CrossRef]
  262. Menges, M. Untersuchungen zum MTO-Prozess an AlPO4-gebundenen ZSM-5-Extrudaten und Beschreibung der Reaktionskinetik. Ph.D. Dissertation, Karlsruher Institut für Technologie, Karlsruhe, Germany, 2012. [Google Scholar] [CrossRef]
  263. Chen, D.; Grønvold, A.; Rebo, H.P.; Moljord, K.; Holmen, A. Catalyst Deactivation Studied by Conventional and Oscillating Microbalance Reactors. Appl. Catal. A 1996, 137, L1–L8. [Google Scholar] [CrossRef]
  264. Freiding, J.; Patcas, F.C.; Kraushaar-Czarnetzki, B. Extrusion of Zeolites: Properties of Catalysts with a Novel Aluminium Phosphate Sintermatrix. Appl. Catal. A 2007, 328, 210–218. [Google Scholar] [CrossRef]
  265. Freiding, J. Extrusion von technischen ZSM-5-Kontakten und ihre Anwendung im MTO-Prozess. Ph.D. Dissertation, Karlsruher Institut für Technologie, Karlsruhe, Germany, 2009. [Google Scholar] [CrossRef]
  266. Freiding, J.; Kraushaar-Czarnetzki, B. Novel Extruded Fixed-Bed MTO Catalysts with High Olefin Selectivity and High Resistance against Coke Deactivation. Appl. Catal. A 2011, 391, 254–260. [Google Scholar] [CrossRef]
  267. Gayubo, A.G.; Aguayo, A.T.; Morán, A.L.; Olazar, M.; Bilbao, J. Role of Water in the Kinetic Modeling of Catalyst Deactivation in the MTG Process. AIChE J. 2002, 48, 1561–1571. [Google Scholar] [CrossRef]
  268. Gayubo, A.G.; Aguayo, A.T.; Olazar, M.; Vivanco, R.; Bilbao, J. Kinetics of the Irreversible Deactivation of the HZSM-5 Catalyst in the MTO Process. Chem. Eng. Sci. 2003, 58, 5239–5249. [Google Scholar] [CrossRef]
  269. Gayubo, A.G.; Arandes, J.M.; Aguayo, A.T.; Olazar, M.; Bilbao, J. Calculation of the Kinetics of Deactivation by Coke in an Integral Reactor for a Triangular Scheme Reaction. Chem. Eng. Sci. 1993, 48, 1077–1087. [Google Scholar] [CrossRef]
  270. Aguayo, A.T.; Gayubo, A.G.; Ortega, J.M.; Olazar, M.; Bilbao, J. Catalyst Deactivation by Coking in the MTG Process in Fixed and Fluidized Bed Reactors. Catal. Today 1997, 37, 239–248. [Google Scholar] [CrossRef]
  271. Benito, P.L.; Gayubo, A.G.; Aguayo, A.T.; Castilla, M.; Bilbao, J. Concentration-Dependent Kinetic Model for Catalyst Deactivation in the MTG Process. Ind. Eng. Chem. Res. 1996, 35, 81–89. [Google Scholar] [CrossRef]
  272. Mier, D.; Aguayo, A.T.; Gayubo, A.G.; Olazar, M.; Bilbao, J. Catalyst Discrimination for Olefin Production by Coupled Methanol/n-Butane Cracking. Appl. Catal. A 2010, 383, 202–210. [Google Scholar] [CrossRef]
  273. Mier, D.; Aguayo, A.T.; Gamero, M.; Gayubo, A.G.; Bilbao, J. Kinetic Modeling of n-Butane Cracking on HZSM-5 Zeolite Catalyst. Ind. Eng. Chem. Res. 2010, 49, 8415–8423. [Google Scholar] [CrossRef]
  274. Pérez-Uriarte, P.; Ateka, A.; Gamero, M.; Aguayo, A.T.; Bilbao, J. Effect of the Operating Conditions in the Transformation of DME to Olefins over a HZSM-5 Zeolite Catalyst. Ind. Eng. Chem. Res. 2016, 55, 6569–6578. [Google Scholar] [CrossRef]
  275. Pérez-Uriarte, P.; Gamero, M.; Ateka, A.; Díaz, M.; Aguayo, A.T.; Bilbao, J. Effect of the Acidity of HZSM-5 Zeolite and the Binder in the DME Transformation to Olefins. Ind. Eng. Chem. Res. 2016, 55, 1513–1521. [Google Scholar] [CrossRef]
  276. Pérez-Uriarte, P.; Ateka, A.; Gayubo, A.G.; Cordero-Lanzac, T.; Aguayo, A.T.; Bilbao, J. Deactivation Kinetics for the Conversion of Dimethyl Ether to Olefins over a HZSM-5 Zeolite Catalyst. Chem. Eng. J. 2017, 311, 367–377. [Google Scholar] [CrossRef]
  277. Lox, E.; Coenen, F.; Vermeulen, R.; Froment, G.F. A Versatile Bench-Scale Unit for Kinetic Studies of Catalytic Reactions. Ind. Eng. Chem. Res. 1988, 27, 576–580. [Google Scholar] [CrossRef]
  278. Hutchings, G.J.; Gottschalk, F.; Hall, M.V.M.; Hunter, R. Hydrocarbon Formation from Methylating Agents over the Zeolite Catalyst ZSM-5. J. Chem. Soc. Faraday Trans. 1 1987, 83, 571–583. [Google Scholar] [CrossRef]
  279. Park, T.Y.; Froment, G.F. A Hybrid Genetic Algorithm for the Estimation of Parameters in Detailed Kinetic Models. Comput. Chem. Eng. 1998, 22, S103–S110. [Google Scholar] [CrossRef]
  280. Boudart, M.; Mears, D.E.; Vannice, M.A. Kinetics of Heterogeneous Catalytic Reactions. Ind. Chim. Belge 1967, 32, 281–284. [Google Scholar]
  281. Evans, M.G.; Polanyi, M. Inertia and Driving Force of Chemical Reactions. Trans. Faraday Soc. 1938, 34, 11–24. [Google Scholar] [CrossRef]
  282. Park, T.Y.; Froment, G.F. Analysis of Fundamental Reaction Rates in the Methanol-to-Olefins Process on ZSM-5 as a Basis for Reactor Design and Operation. Ind. Eng. Chem. Res. 2004, 43, 682–689. [Google Scholar] [CrossRef]
  283. Denayer, J.F.; Souverijns, W.; Jacobs, P.A.; Martens, J.A.; Baron, G.V. High-Temperature Low-Pressure Adsorption of Branched C5–C8 Alkanes on Zeolite Beta, ZSM-5, ZSM-22, Zeolite Y, and Mordenite. J. Phys. Chem. B 1998, 102, 4588–4597. [Google Scholar] [CrossRef]
  284. Denayer, J.F.; Baron, G.V.; Martens, J.A.; Jacobs, P.A. Chromatographic Study of Adsorption of n-Alkanes on Zeolites at High Temperatures. J. Phys. Chem. B 1998, 102, 3077–3081. [Google Scholar] [CrossRef]
  285. Chen, D.; Rebo, H.P.; Grønvold, A.; Moljord, K.; Holmen, A. Methanol Conversion to Light Olefins over SAPO-34: Kinetic Modeling of Coke Formation. Microporous Mesoporous Mater. 2000, 35–36, 121–135. [Google Scholar] [CrossRef]
  286. Chen, D.; Bjorgum, E.; Christensen, K.O.; Holmen, A.; Lodeng, R. Characterization of Catalysts under Working Conditions with an Oscillating Microbalance Reactor. In Advances in Catalysis; Gates, B.C., Knözinger, H., Eds.; Academic Press: Cambridge, MA, USA, 2007; Volume 51, pp. 351–382. [Google Scholar]
  287. Alwahabi, S.M. Conversion of Methanol to Light Olefins on SAPO-34: Kinetic Modeling and Reactor Design. Ph.D. Dissertation, Texas A&M University, College Station, TX, USA, 2003. [Google Scholar]
  288. Gayubo, A.G.; Vivanco, R.; Alonso, A.; Valle, B.; Aguayo, A.T. Kinetic Behavior of the SAPO-18 Catalyst in the Transformation of Methanol into Olefins. Ind. Eng. Chem. Res. 2005, 44, 6605–6614. [Google Scholar] [CrossRef]
  289. Bleken, F.; Bjørgen, M.; Palumbo, L.; Bordiga, S.; Svelle, S.; Lillerud, K.P.; Olsbye, U. The Effect of Acid Strength on the Conversion of Methanol to Olefins Over Acidic Microporous Catalysts with the CHA Topology. Top. Catal. 2009, 52, 218–228. [Google Scholar] [CrossRef]
  290. Teketel, S.; Olsbye, U.; Lillerud, K.P.; Beato, P.; Svelle, S. Selectivity Control through Fundamental Mechanistic Insight in the Conversion of Methanol to Hydrocarbons over Zeolites. Microporous Mesoporous Mater. 2010, 136, 33–41. [Google Scholar] [CrossRef]
  291. Narasimhan, C.S.L.; Thybaut, J.W.; Marin, G.B.; Martens, J.A.; Denayer, J.F.; Baron, G.V. Pore Mouth Physisorption of Alkanes on ZSM-22: Estimation of Physisorption Enthalpies and Entropies by Additivity Method. J. Catal. 2003, 218, 135–147. [Google Scholar] [CrossRef]
  292. Denayer, J.F.; Ocakoglu, R.A.; Huybrechts, W.; Martens, J.A.; Thybaut, J.W.; Marin, G.B.; Baron, G.V. Pore Mouth versus Intracrystalline Adsorption of Isoalkanes on ZSM-22 and ZSM-23 Zeolites under Vapour and Liquid Phase Conditions. Chem. Commun. 2003, 1880–1881. [Google Scholar] [CrossRef]
  293. Kaarsholm, M.; Rafii, B.; Joensen, F.; Cenni, R.; Chaouki, J.; Patience, G.S. Kinetic Modeling of Methanol- to-Olefin Reaction over ZSM-5 in Fluid Bed. Ind. Eng. Chem. Res. 2010, 49, 29–38. [Google Scholar] [CrossRef]
  294. Yuan, X.; Li, H.; Ye, M.; Liu, Z. Kinetic Modeling of Methanol to Olefins Process over SAPO-34 Catalyst Based on the Dual-Cycle Reaction Mechanism. AIChE J. 2018. [Google Scholar] [CrossRef]
  295. Yuan, X.; Li, H.; Ye, M.; Liu, Z. Comparative Study of MTO Kinetics over SAPO-34 Catalyst in Fixed and Fluidized Bed Reactors. Chem. Eng. J. 2017, 329, 35–44. [Google Scholar] [CrossRef]
  296. Lu, B.; Zhang, J.; Luo, H.; Wang, W.; Li, H.; Ye, M.; Liu, Z.; Li, J. Numerical Simulation of Scale-Up Effects of Methanol-to-Olefins Fluidized Bed Reactors. Chem. Eng. Sci. 2017, 171, 244–255. [Google Scholar] [CrossRef]
  297. Zhang, J.; Lu, B.; Chen, F.; Li, H.; Ye, M.; Wang, W. Simulation of a Large Methanol-to-Olefins Fluidized Bed Reactor with Consideration of Coke Distribution. Chem. Eng. Sci. 2018, 189, 212–220. [Google Scholar] [CrossRef]
  298. Strizhak, P.; Zhokh, A.; Trypolskyi, A. Methanol Conversion to Olefins on H-ZSM-5/Al2O3 Catalysts: Kinetic Modeling. React. Kinet. Mech. Catal. 2018, 123, 247–268. [Google Scholar] [CrossRef]
  299. Sedighi, M.; Bahrami, H.; Towfighi, J. Kinetic Modeling Formulation of the Methanol to Olefin Process: Parameter estimation. J. Ind. Eng. Chem. 2014, 20, 3108–3114. [Google Scholar] [CrossRef]
  300. Fatourehchi, N.; Sohrabi, M.; Royaee, S.J.; Mirarefin, S.M. Preparation of SAPO-34 catalyst and presentation of a kinetic model for methanol to olefin process (MTO). Chem. Eng. Res. Des. 2011, 89, 811–816. [Google Scholar] [CrossRef]
  301. Taheri Najafabadi, A.; Fatemi, S.; Sohrabi, M.; Salmasi, M. Kinetic Modeling and Optimization of the Operating Condition of MTO Process on SAPO-34 Catalyst. J. Ind. Eng. Chem. 2012, 18, 29–37. [Google Scholar] [CrossRef]
  302. Azarhoosh, M.J.; Halladj, R.; Askari, S. Presenting a New Kinetic Model for Methanol to Light Olefins Reactions over a Hierarchical SAPO-34 Catalyst Using the Langmuir–Hinshelwood-Hougen–Watson Mechanism. J. Phys. Condens. Matter 2017, 29, 425202. [Google Scholar] [CrossRef]
  303. Wen, M.; Ding, J.; Wang, C.; Li, Y.; Zhao, G.; Liu, Y.; Lu, Y. High-Performance SS-Fiber@HZSM-5 Core–Shell Catalyst for Methanol-to-Propylene: A Kinetic and Modeling Study. Microporous Mesoporous Mater. 2016, 221, 187–196. [Google Scholar] [CrossRef]
  304. Wen, M.; Wang, X.; Han, L.; Ding, J.; Sun, Y.; Liu, Y.; Lu, Y. Monolithic Metal-Fiber@HZSM-5 Core-Shell Catalysts for Methanol-to-Propylene. Microporous Mesoporous Mater. 2015, 206, 8–16. [Google Scholar] [CrossRef]
  305. Huang, X.; Li, H.; Xiao, W.D.; Chen, D. Insight into the Side Reactions in Methanol-to-Olefin Process over HZSM-5: A Kinetic Study. Chem. Eng. J. 2016, 299, 263–275. [Google Scholar] [CrossRef]
  306. Huang, X.; Li, H.; Li, H.; Xiao, W.D. A Computationally Efficient Multi-Scale Simulation of a Multi-Stage Fixed-Bed Reactor for Methanol to Propylene Reactions. Fuel Process. Technol. 2016, 150, 104–116. [Google Scholar] [CrossRef]
  307. Huang, X.; Li, X.G.; Li, H.; Xiao, W.D. High-Performance HZSM-5/Cordierite Monolithic Catalyst for Methanol to Propylene Reaction: A Combined Experimental and Modelling Study. Fuel Process. Technol. 2017, 159, 168–177. [Google Scholar] [CrossRef]
  308. Wang, X.; Wen, M.; Wang, C.; Ding, J.; Sun, Y.; Liu, Y.; Lu, Y. Microstructured Fiber@HZSM-5 Core-Shell Catalysts with Dramatic Selectivity and Stability Improvement for the Methanol-to-Propylene Process. Chem. Commun. 2014, 50, 6343–6345. [Google Scholar] [CrossRef]
  309. Guo, W.; Wu, W.; Luo, M.; Xiao, W.D. Modeling of Diffusion and Reaction in Monolithic Catalysts for the Methanol-to-Propylene Process. Fuel Process. Technol. 2013, 108, 133–138. [Google Scholar] [CrossRef]
  310. Ortega, C.; Hessel, V.; Kolb, G. Dimethyl Ether to Hydrocarbons over ZSM-5: Kinetic Study in an External Recycle Reactor. Chem. Eng. J. 2018, 354, 21–34. [Google Scholar] [CrossRef]
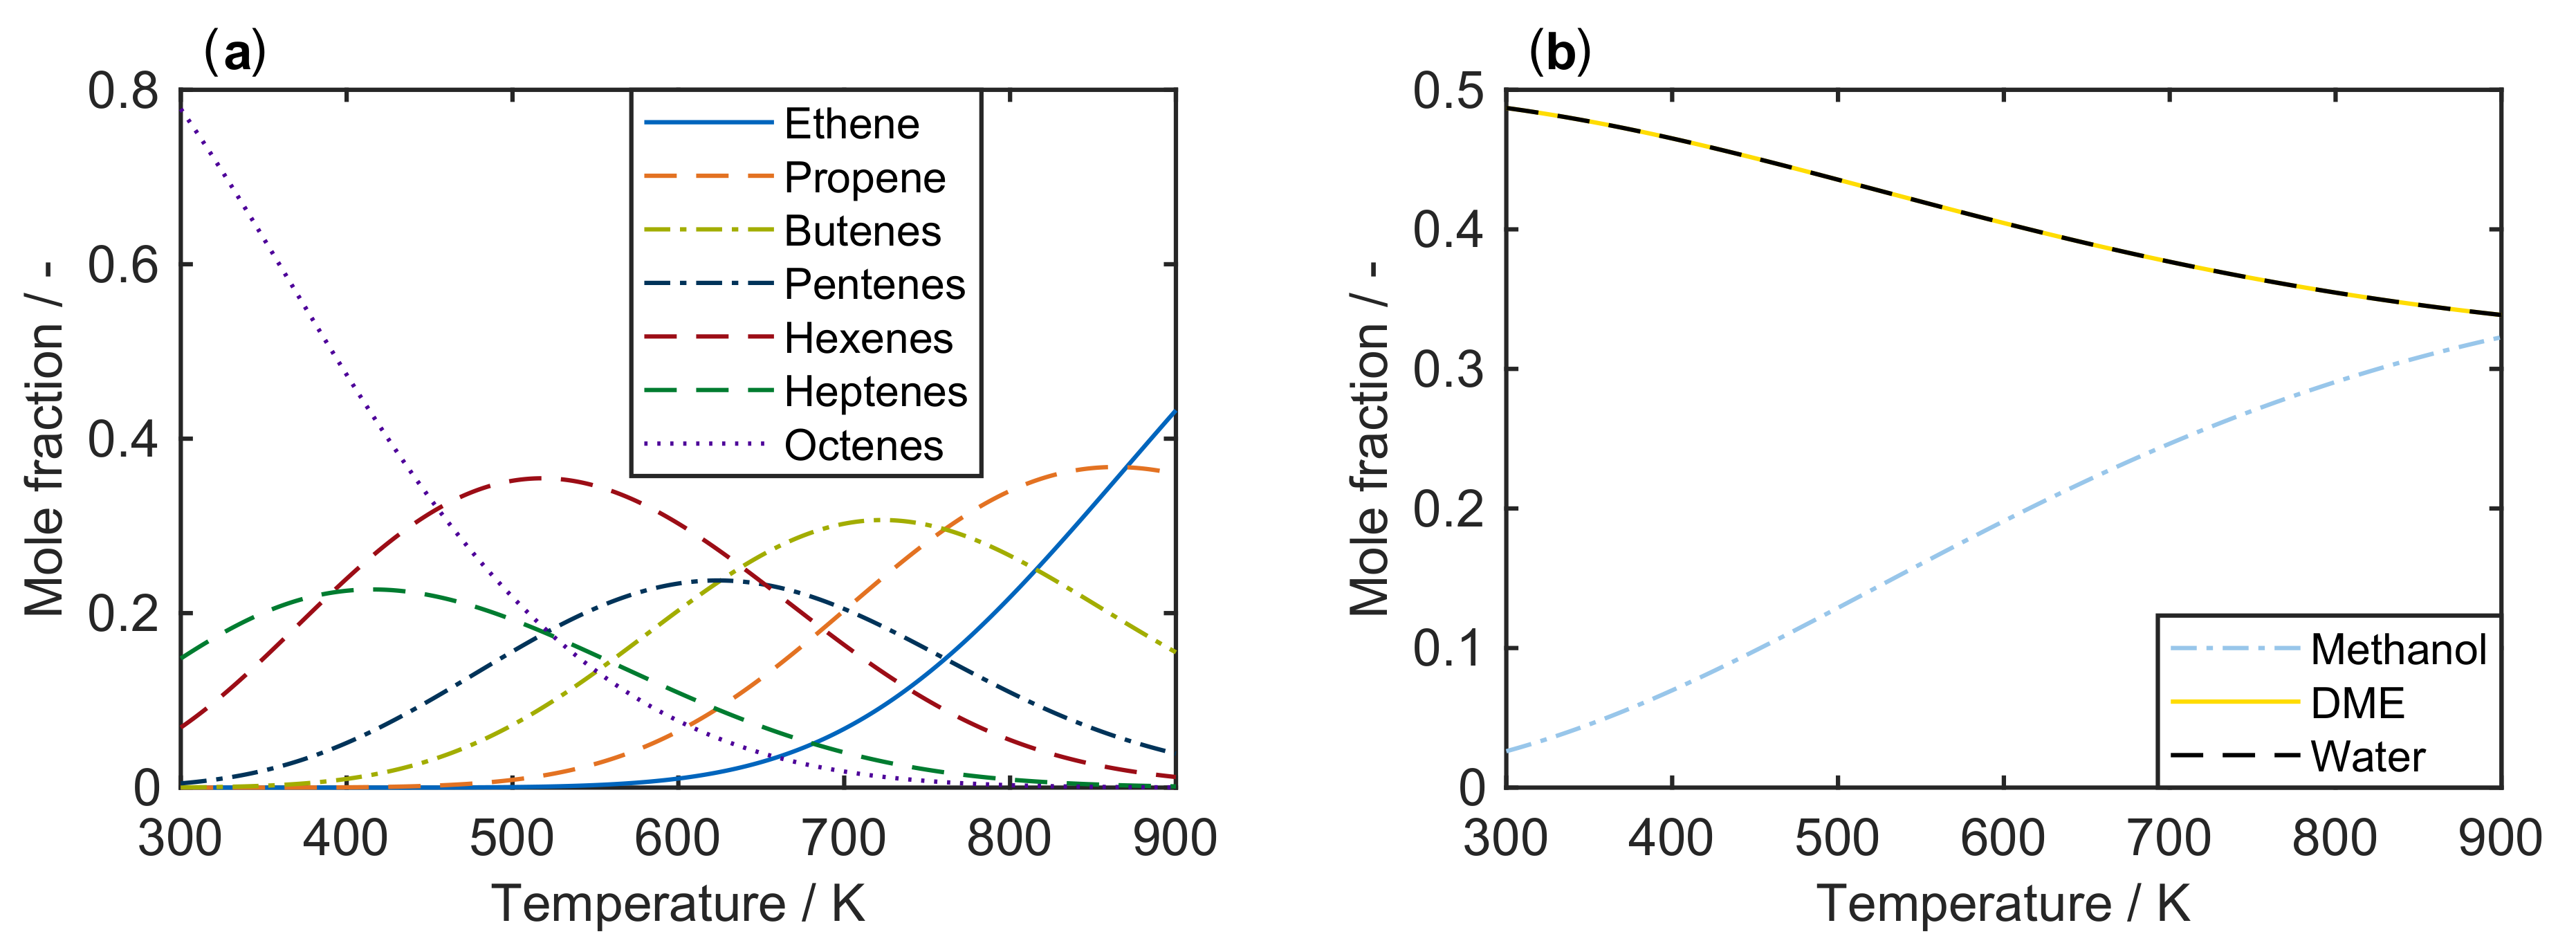
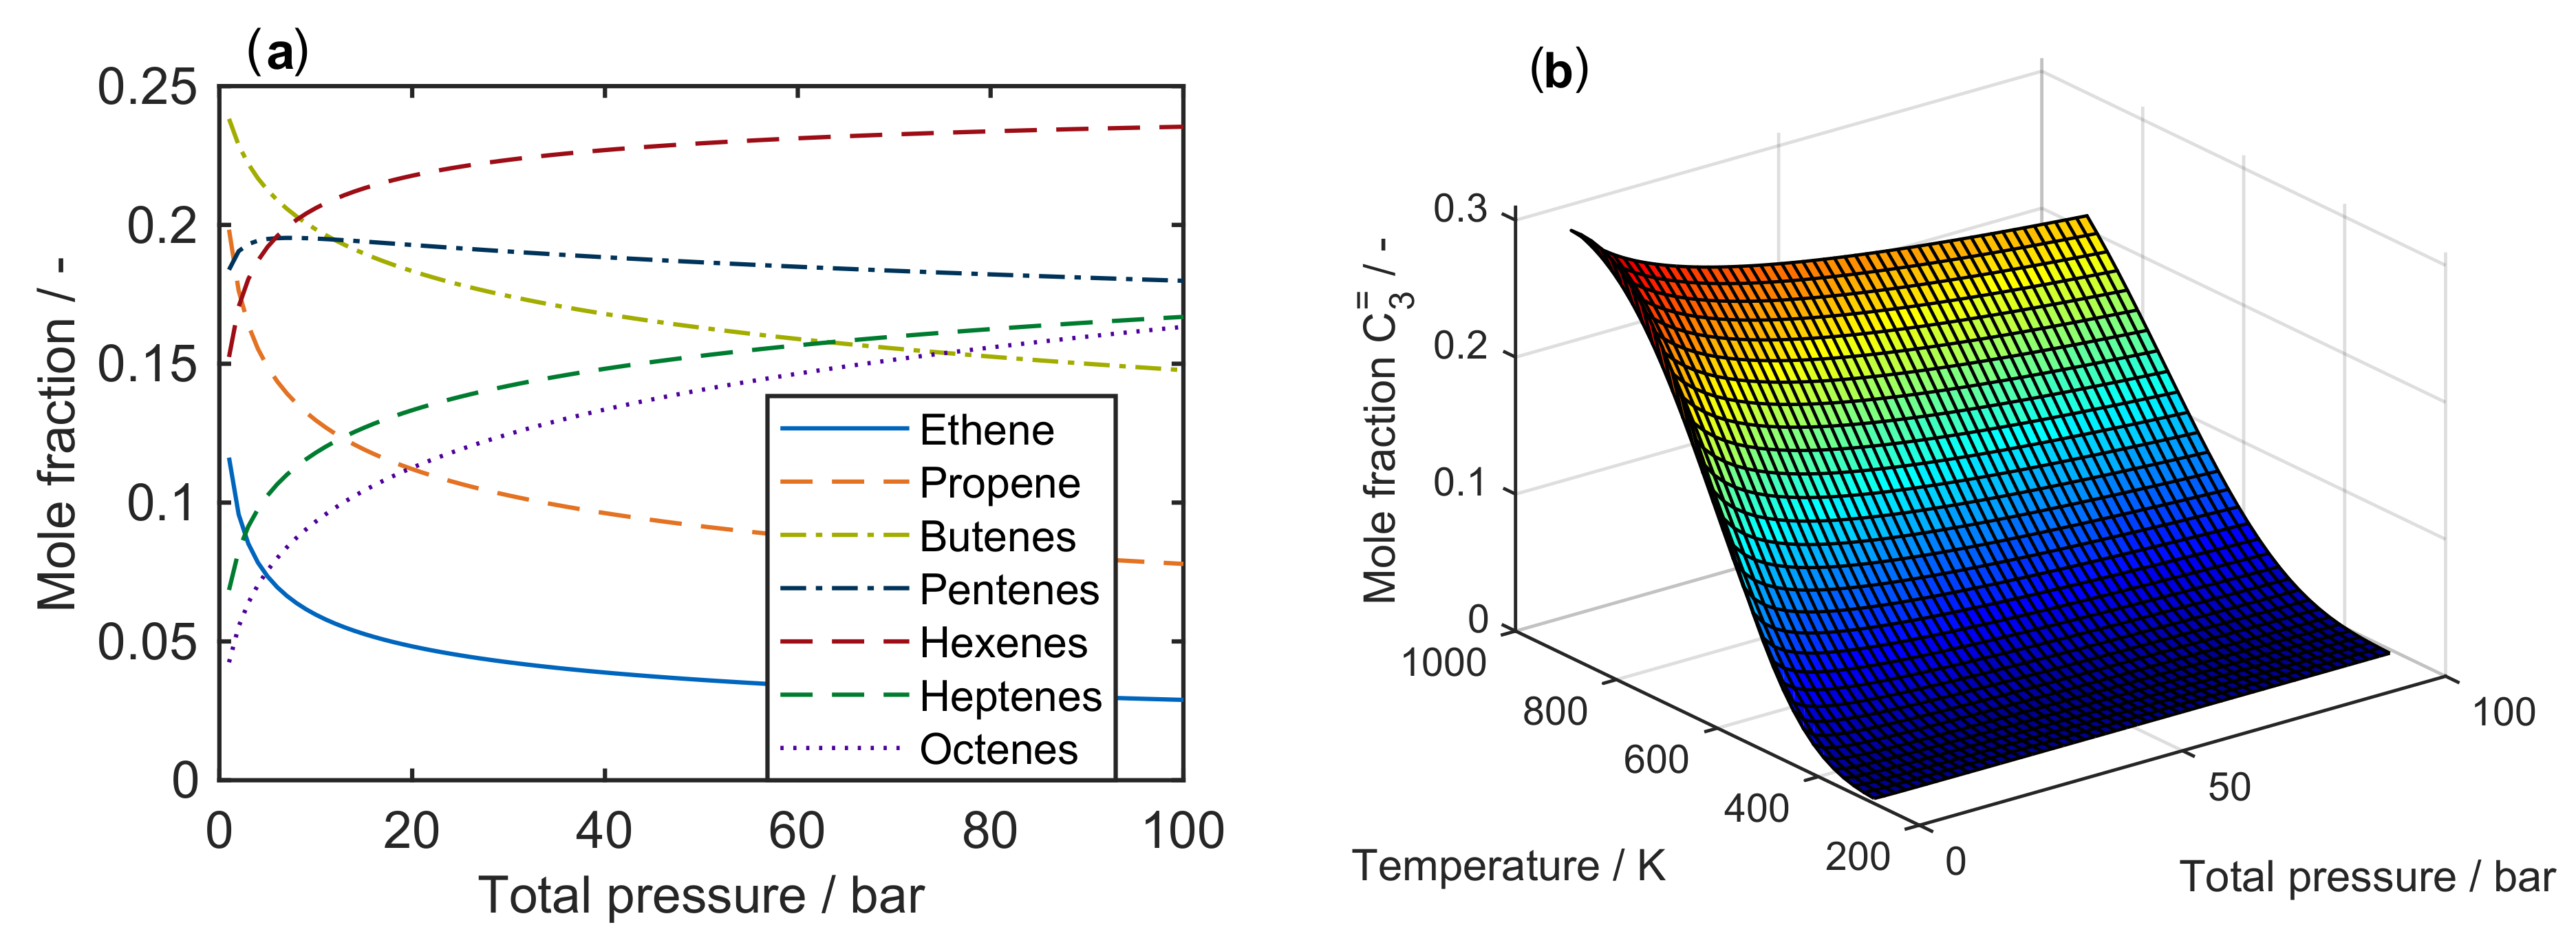
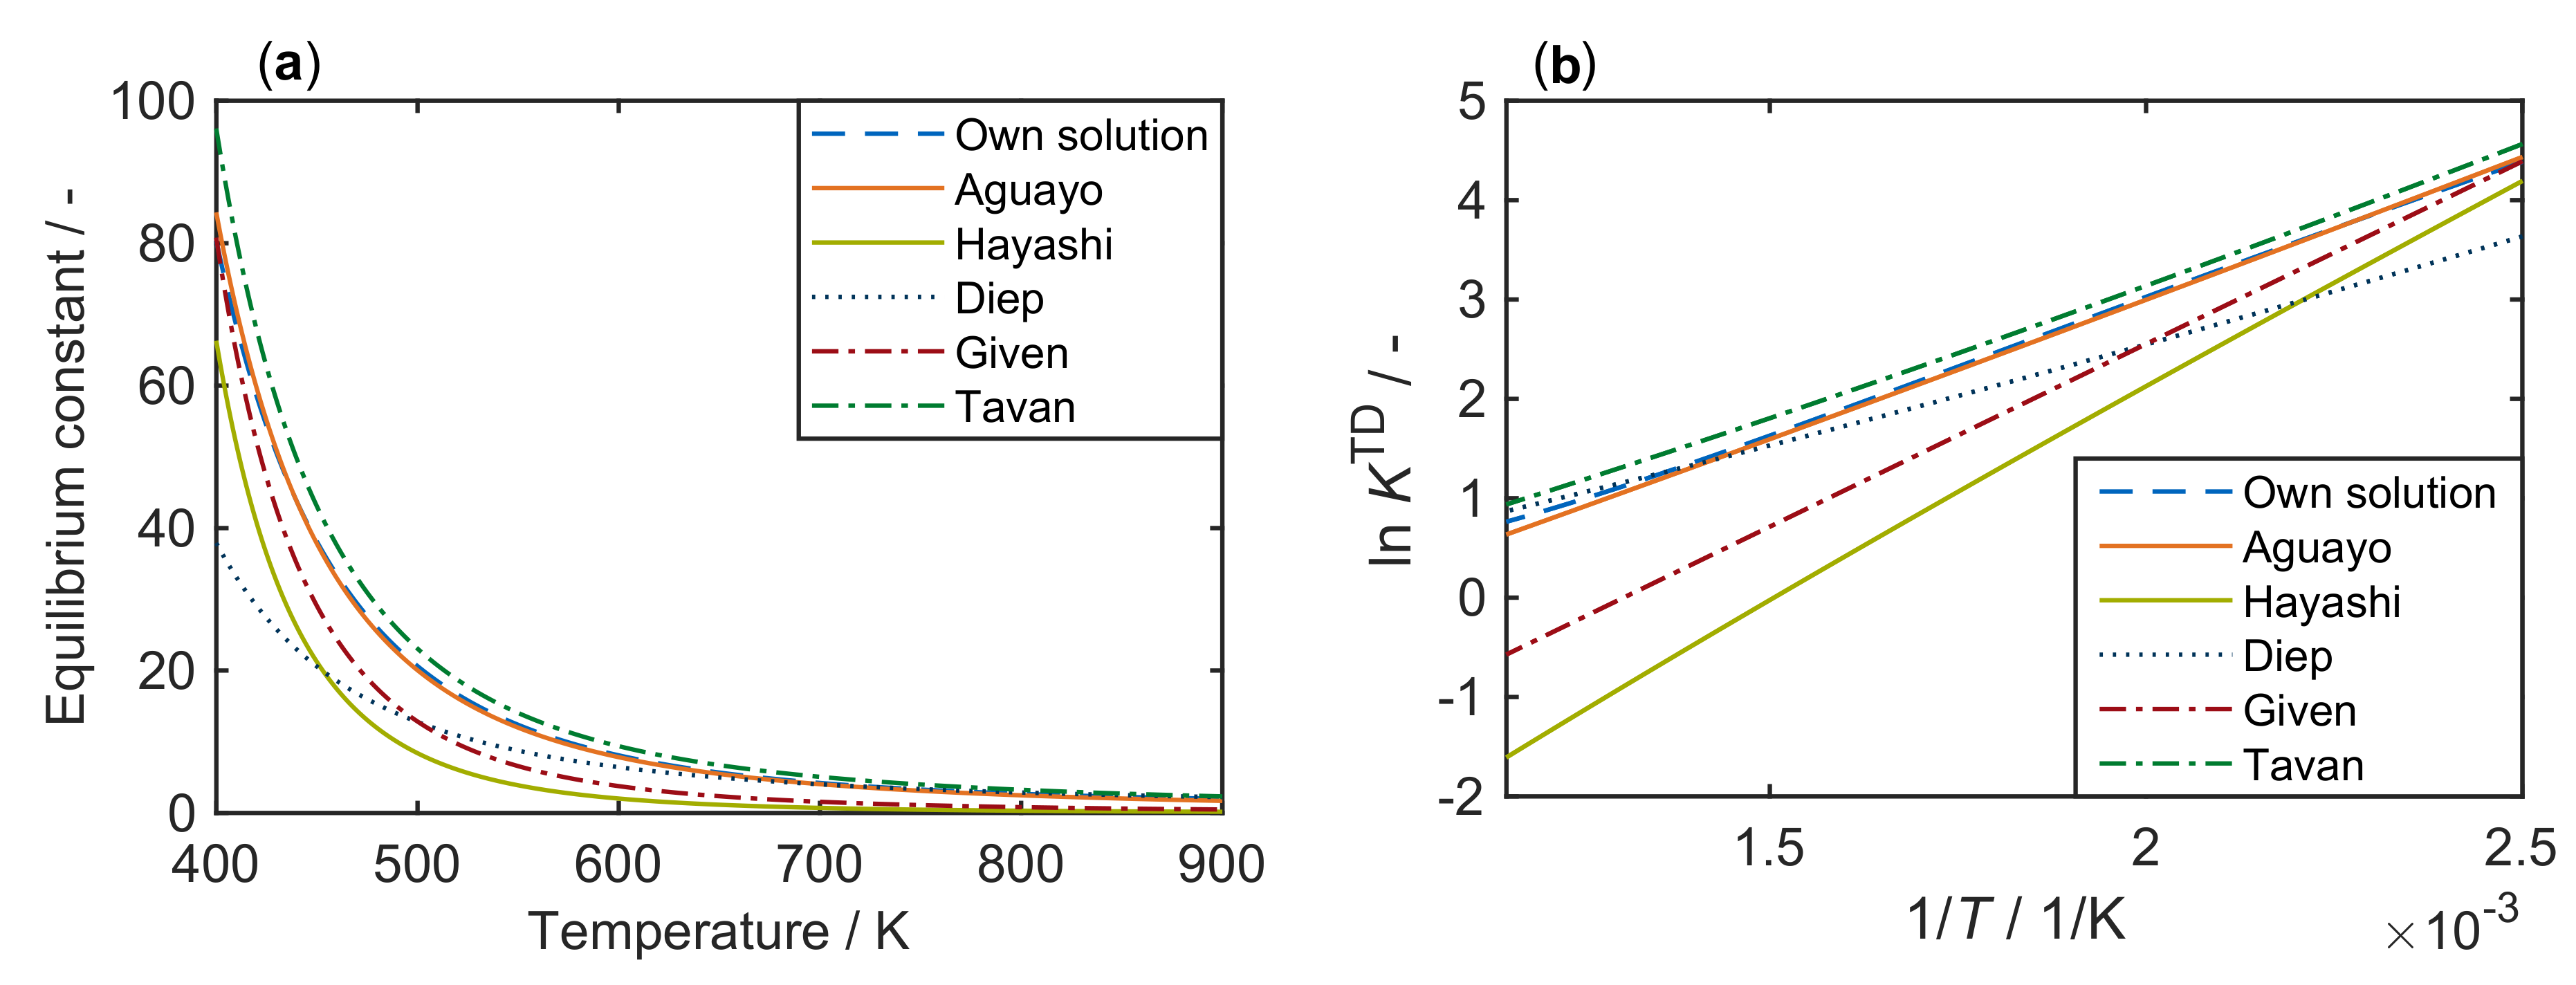
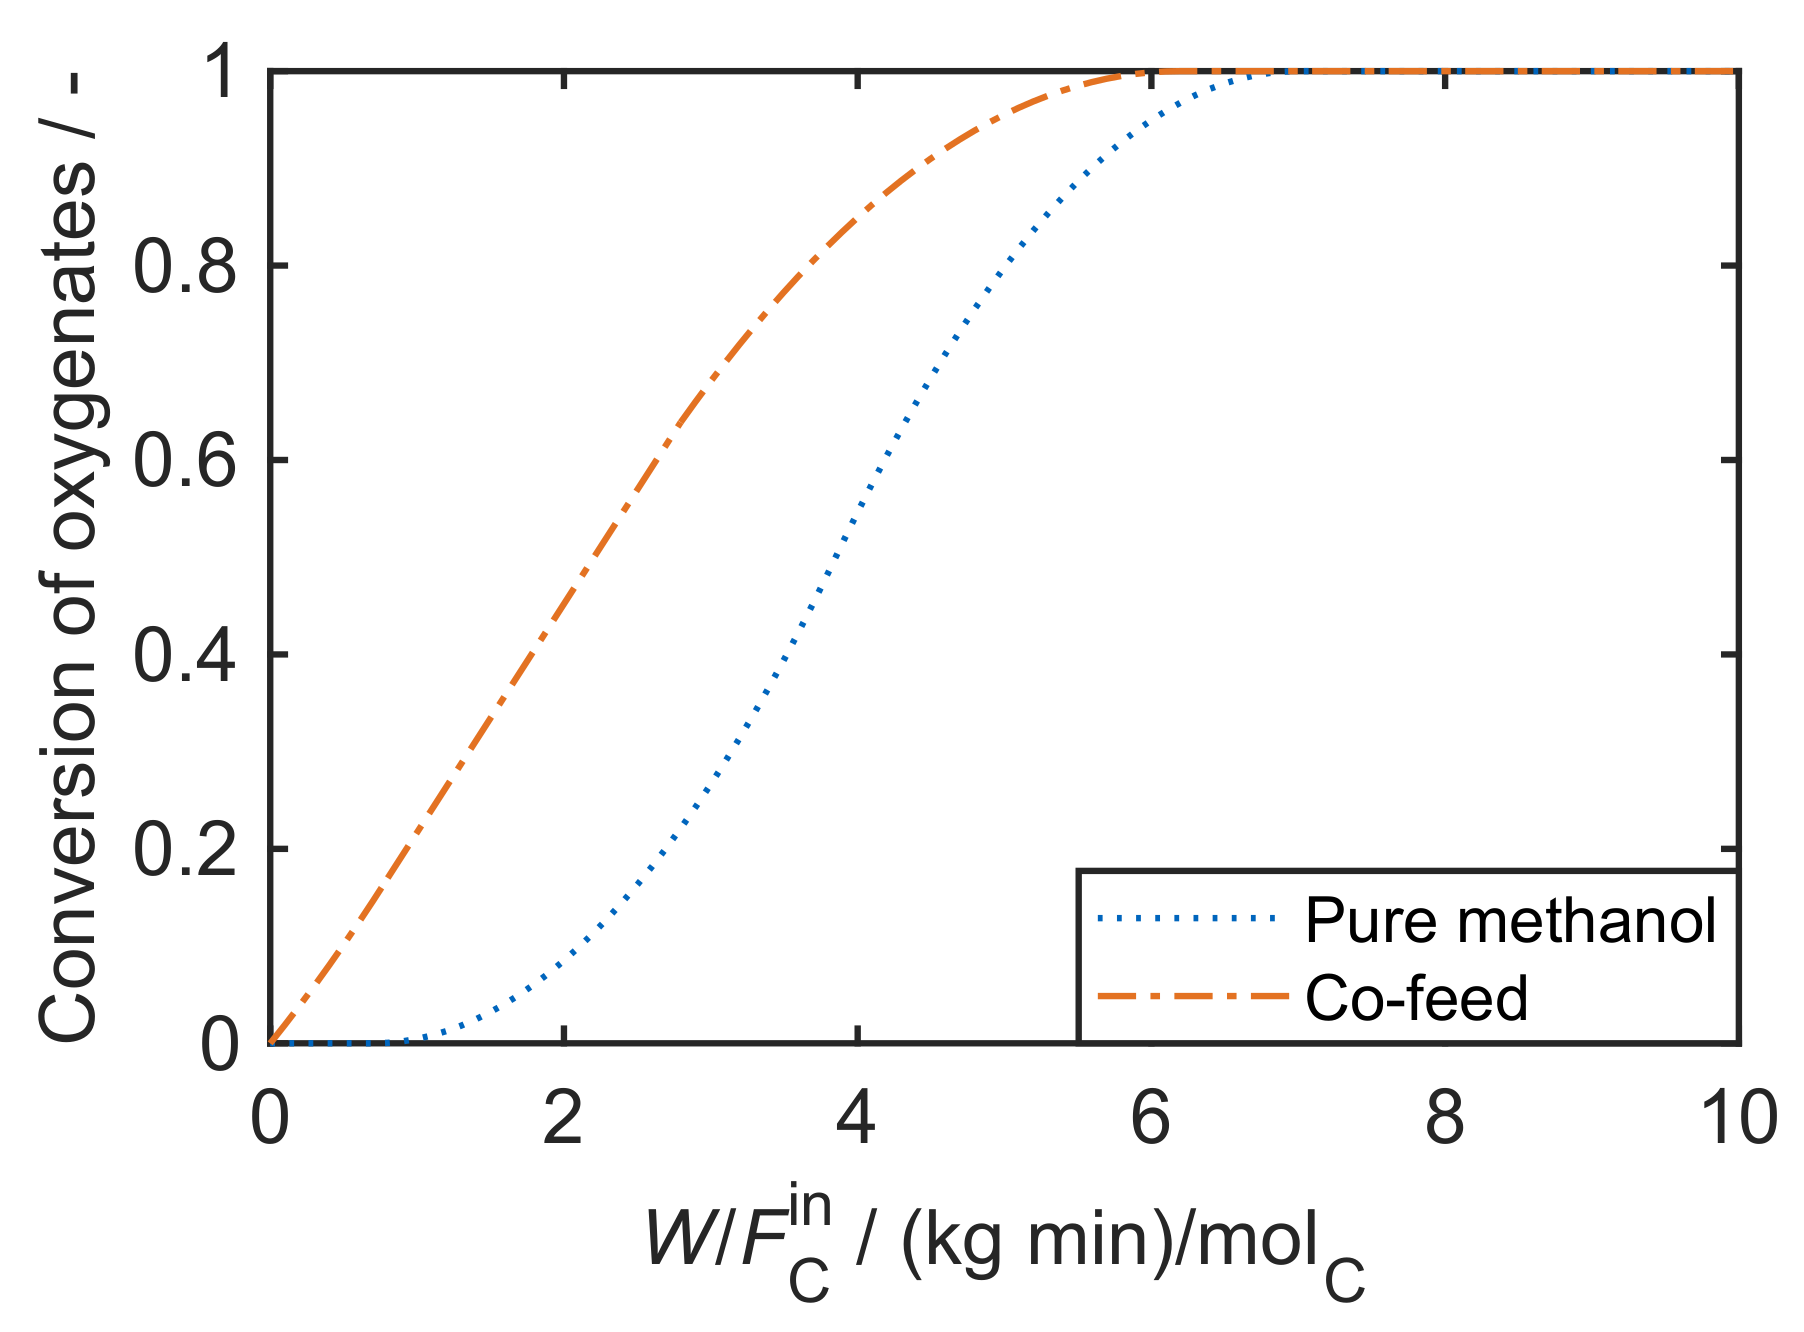
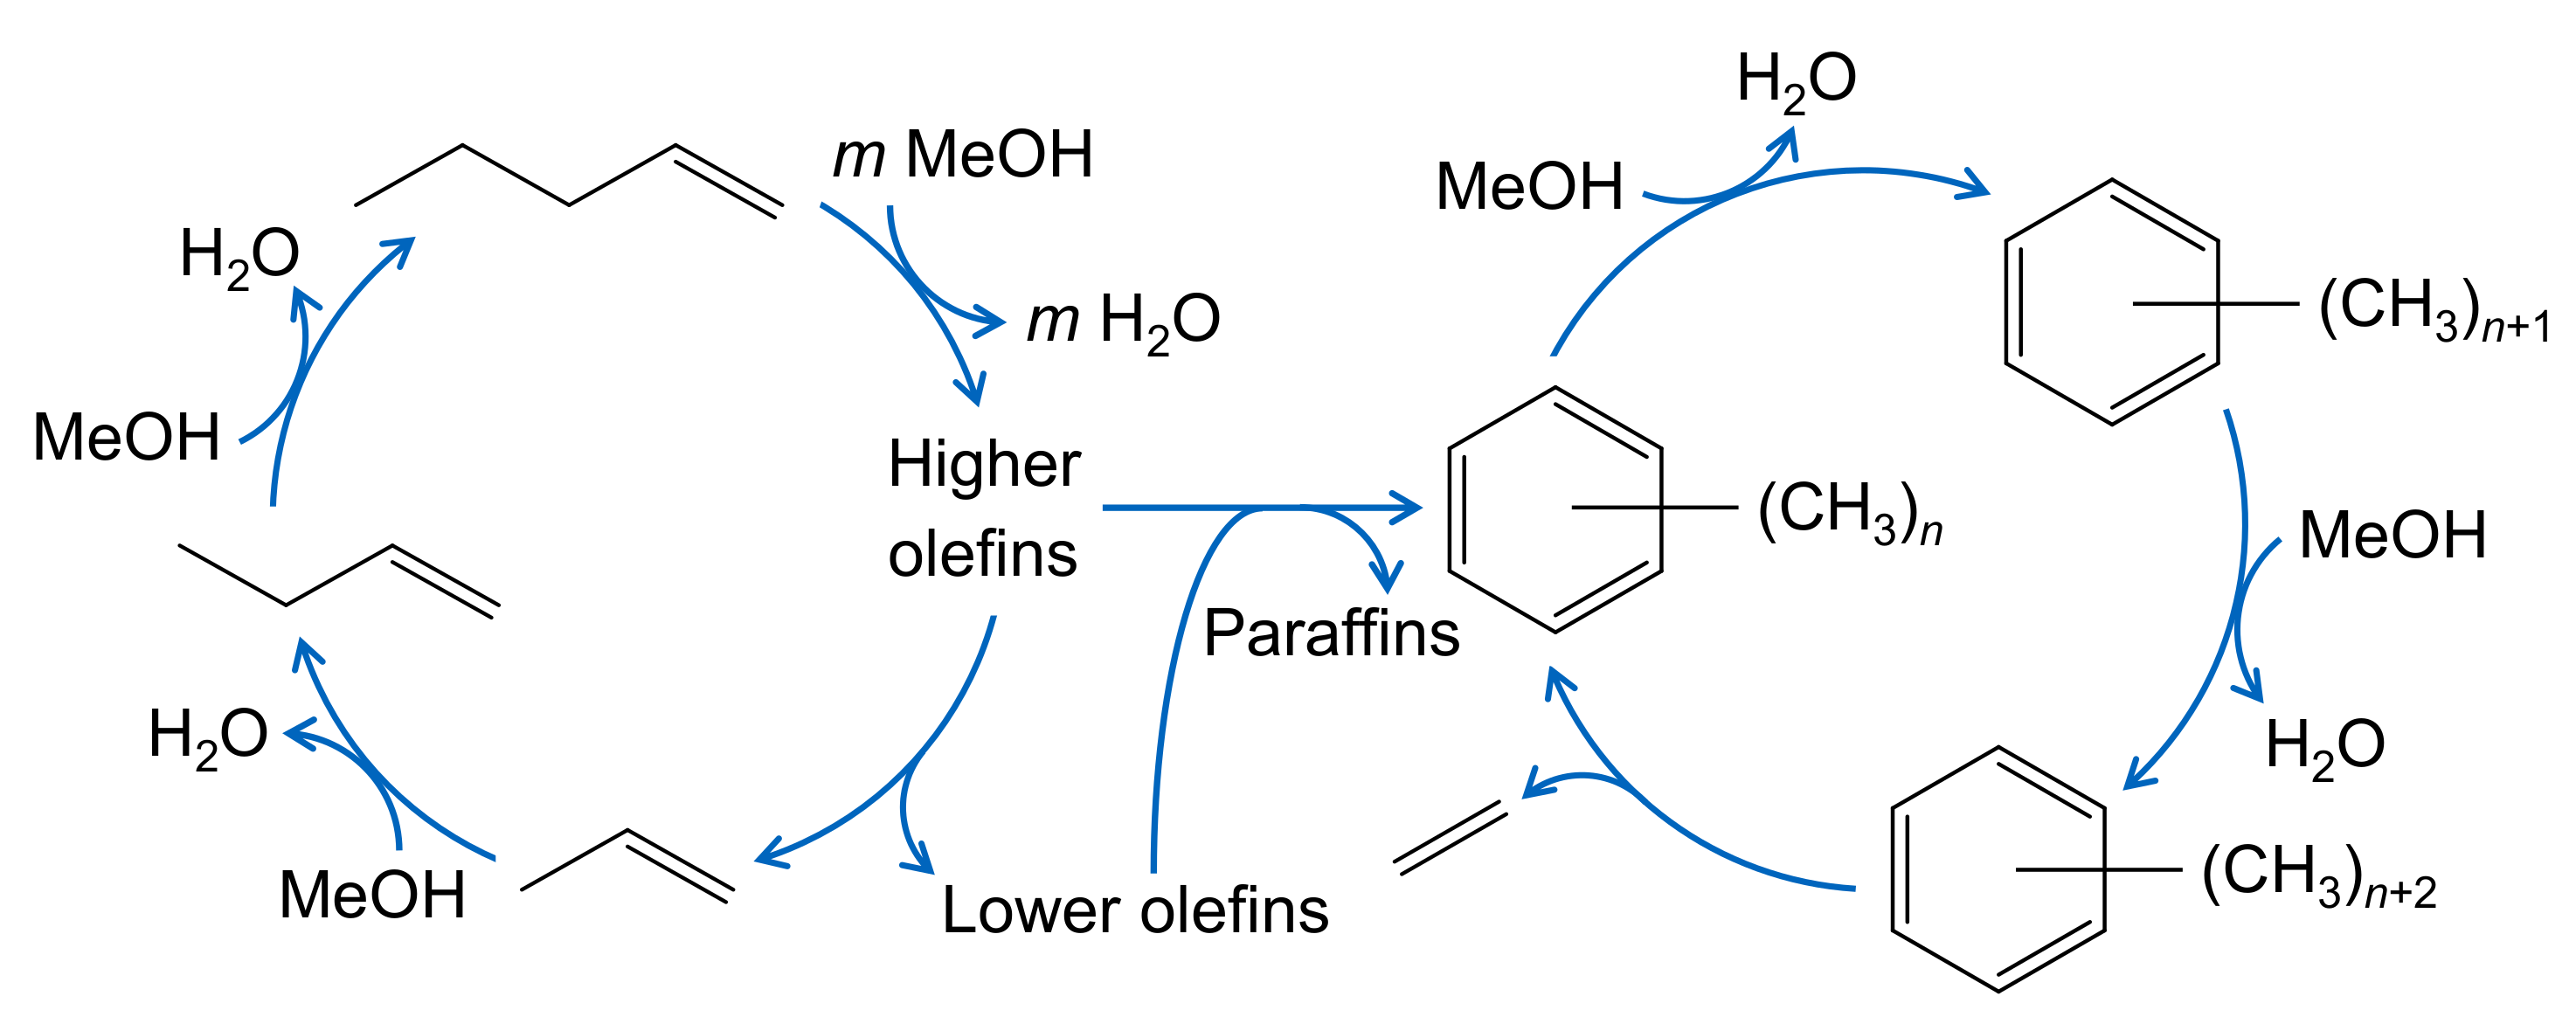
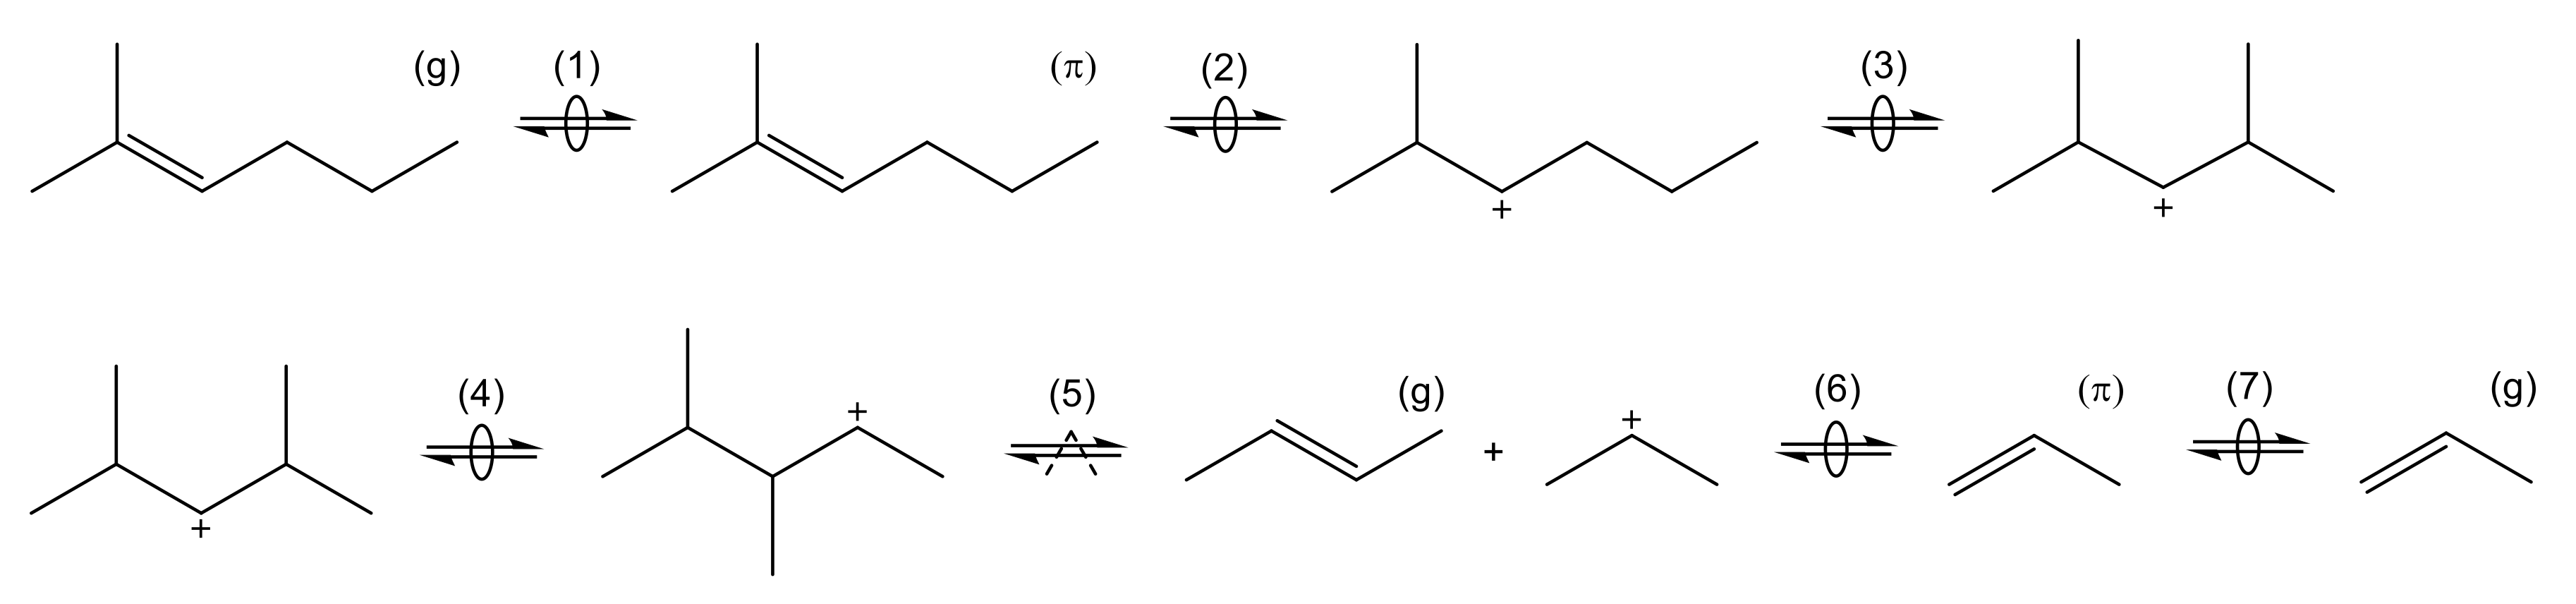
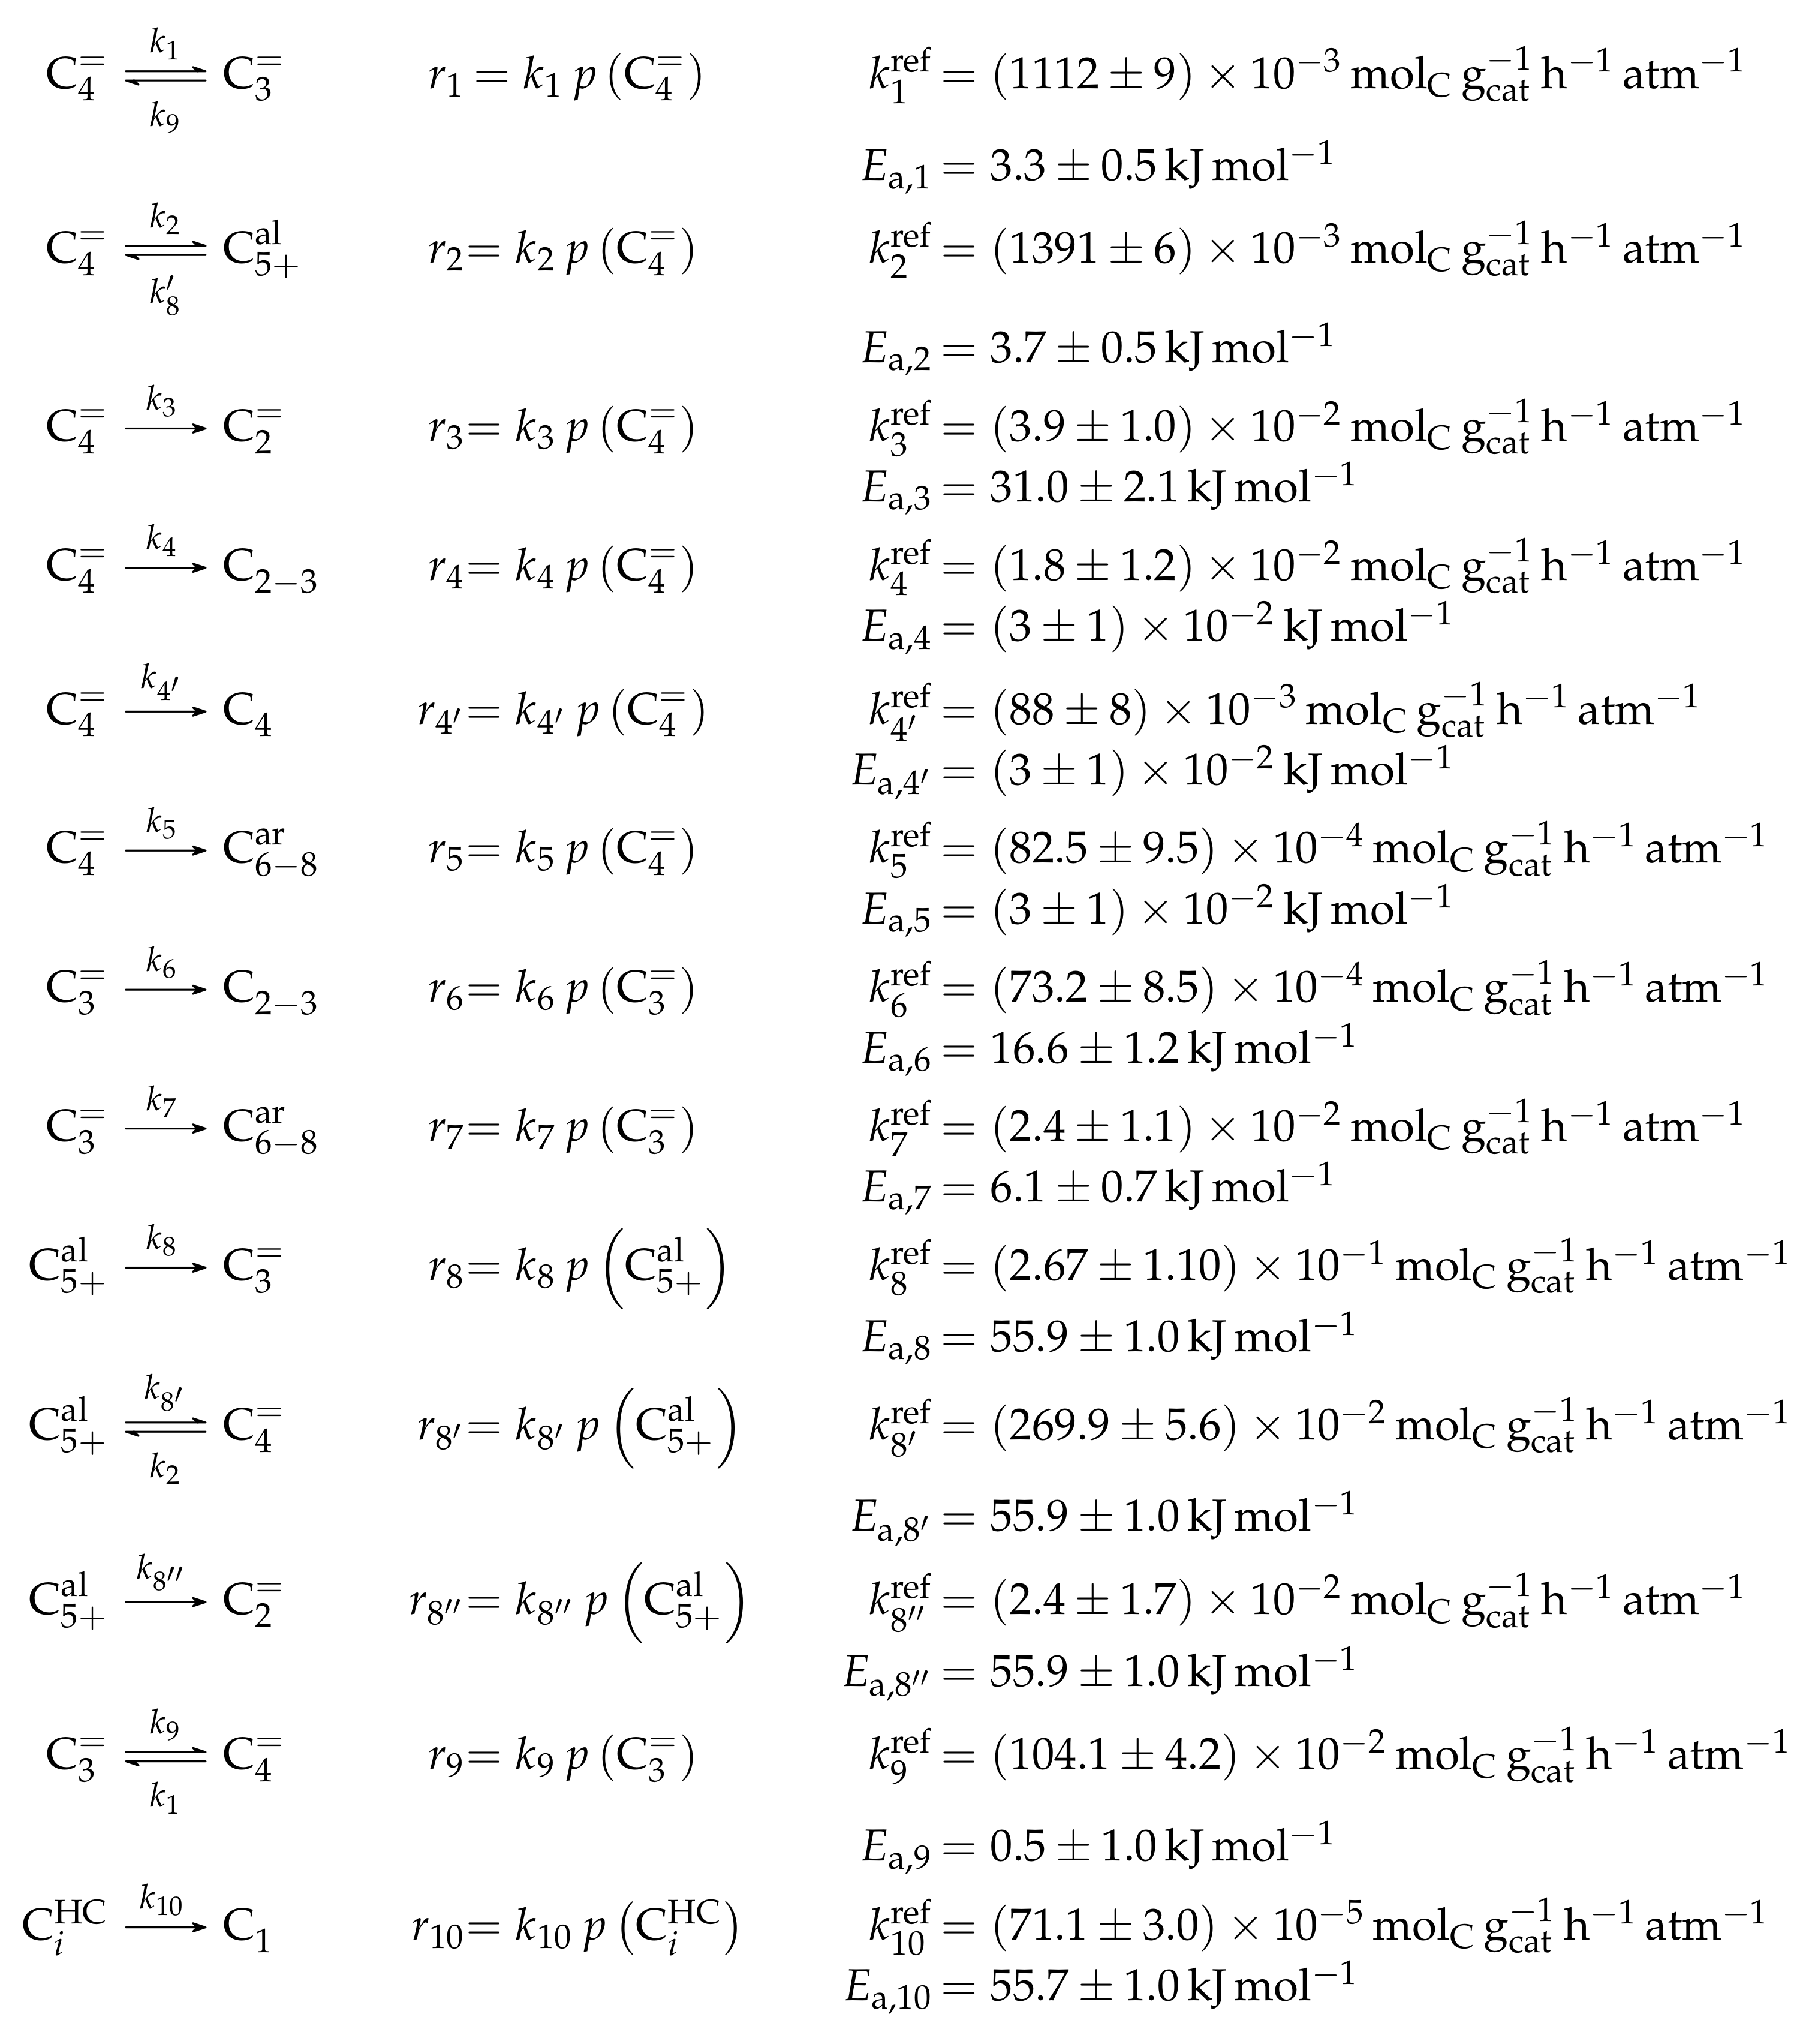
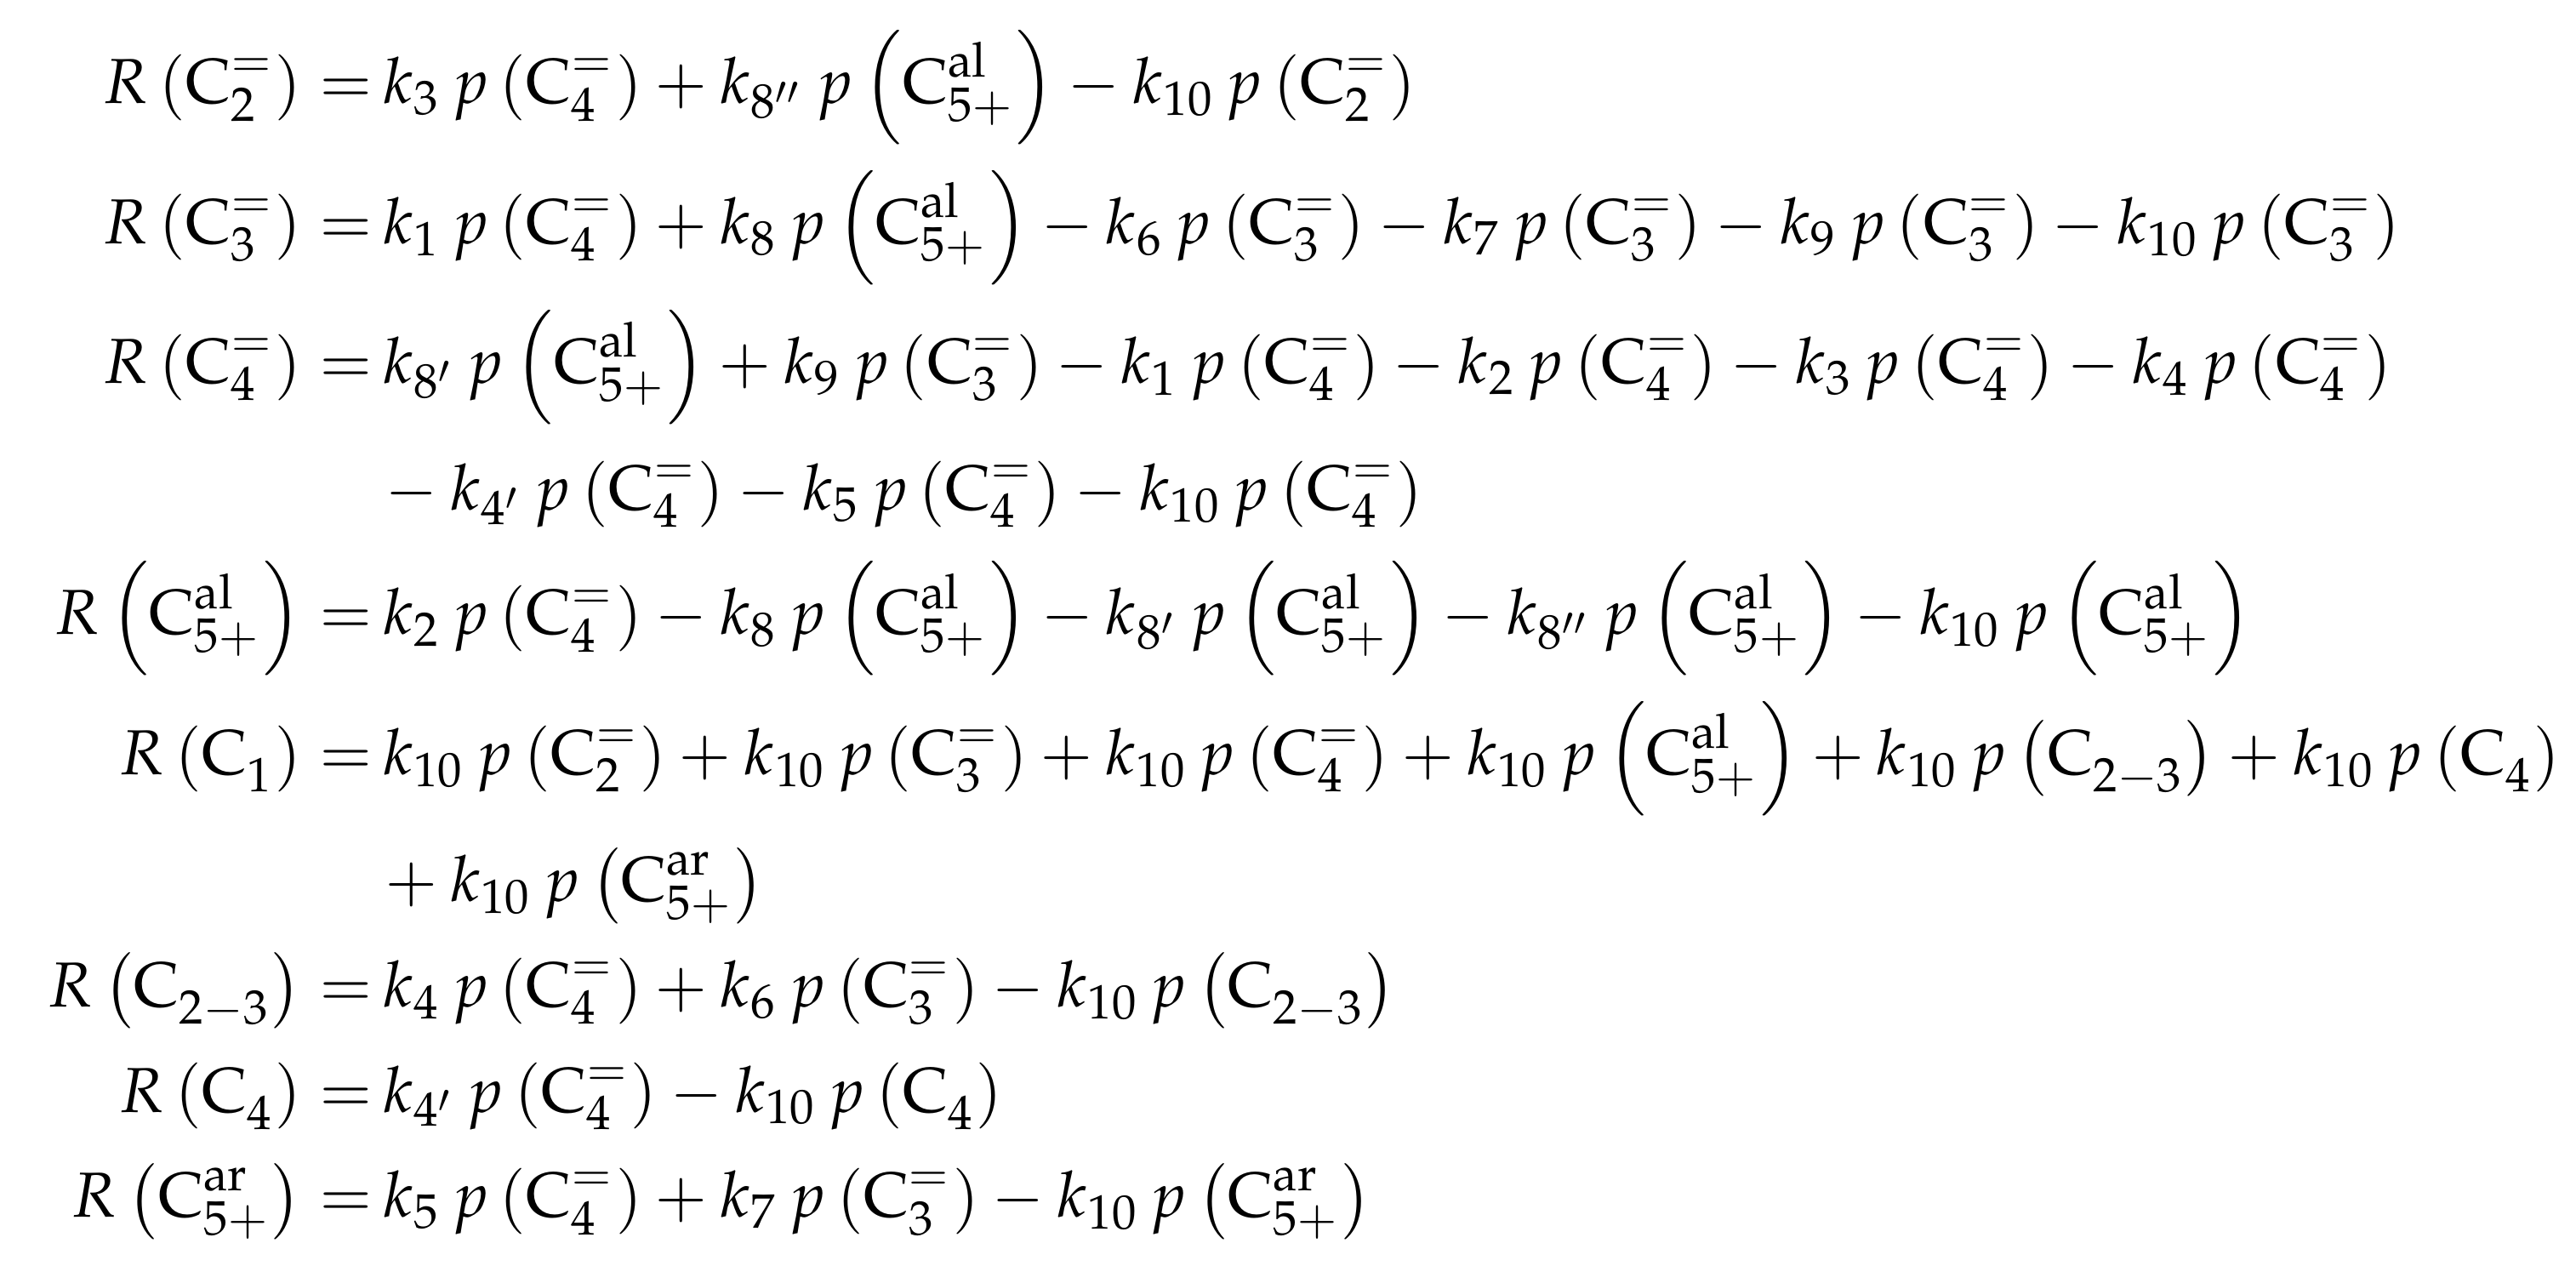
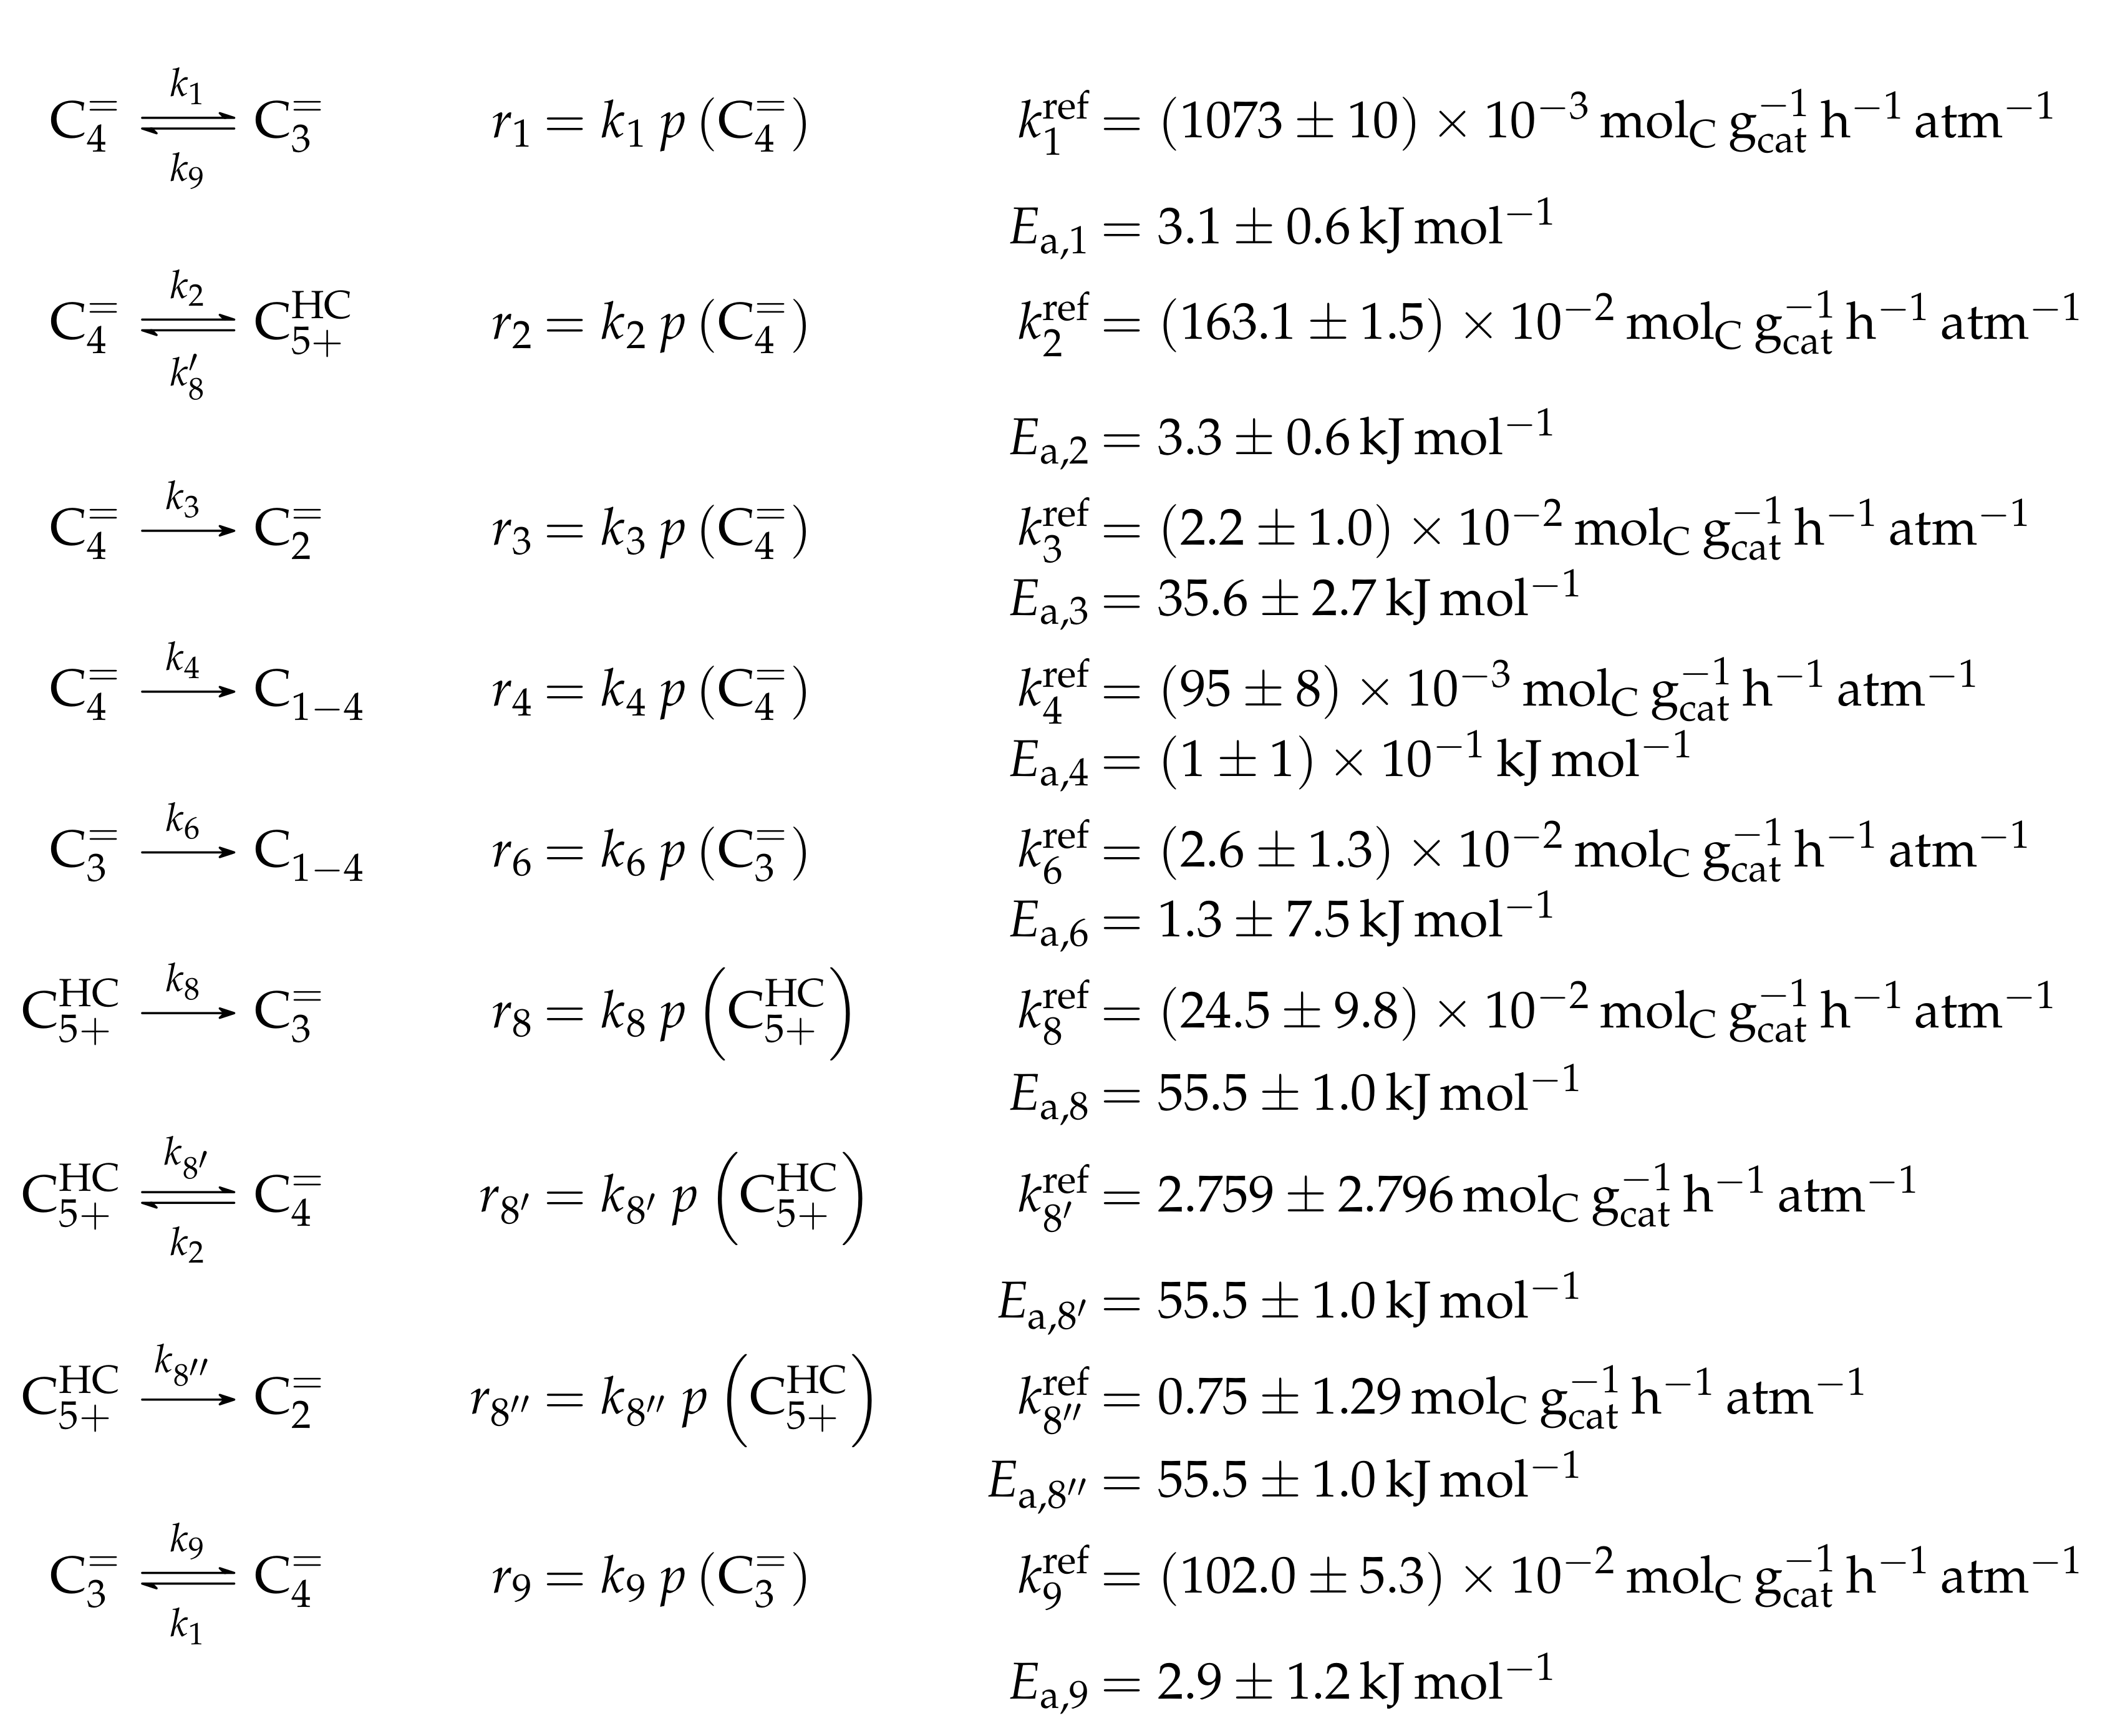
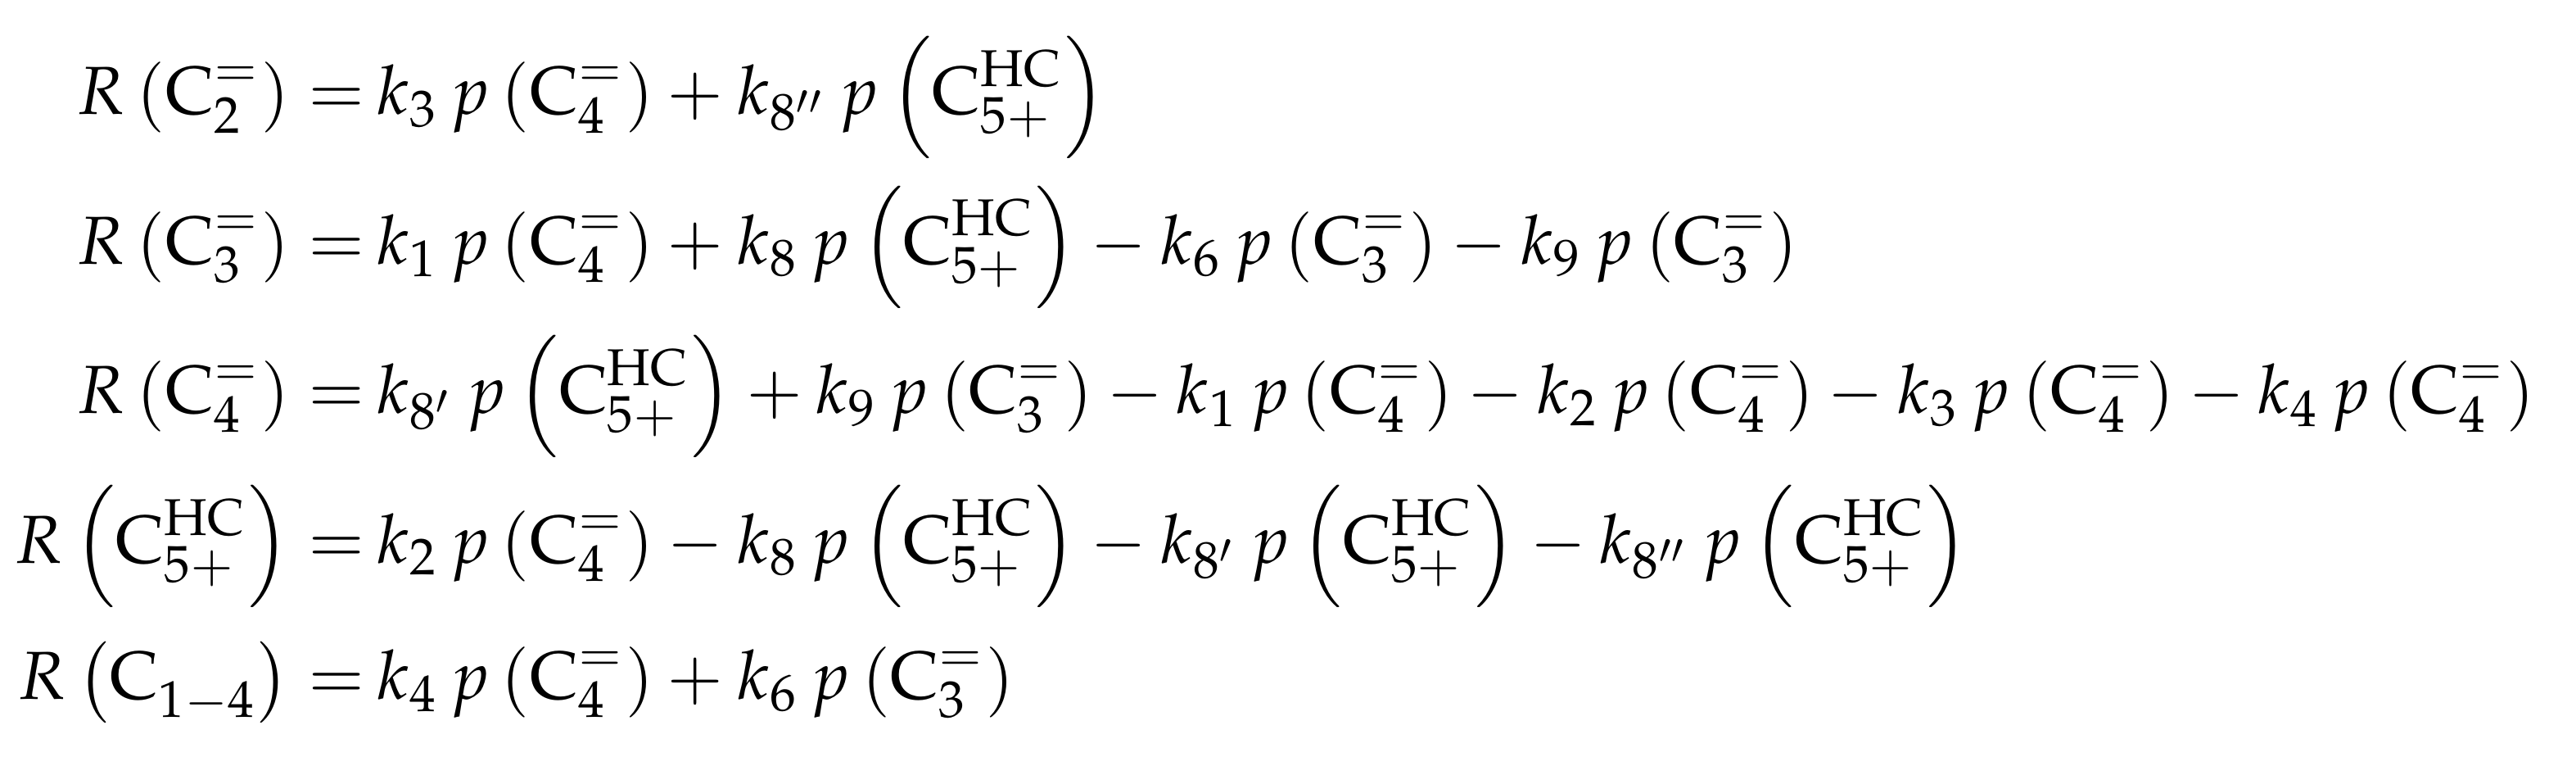
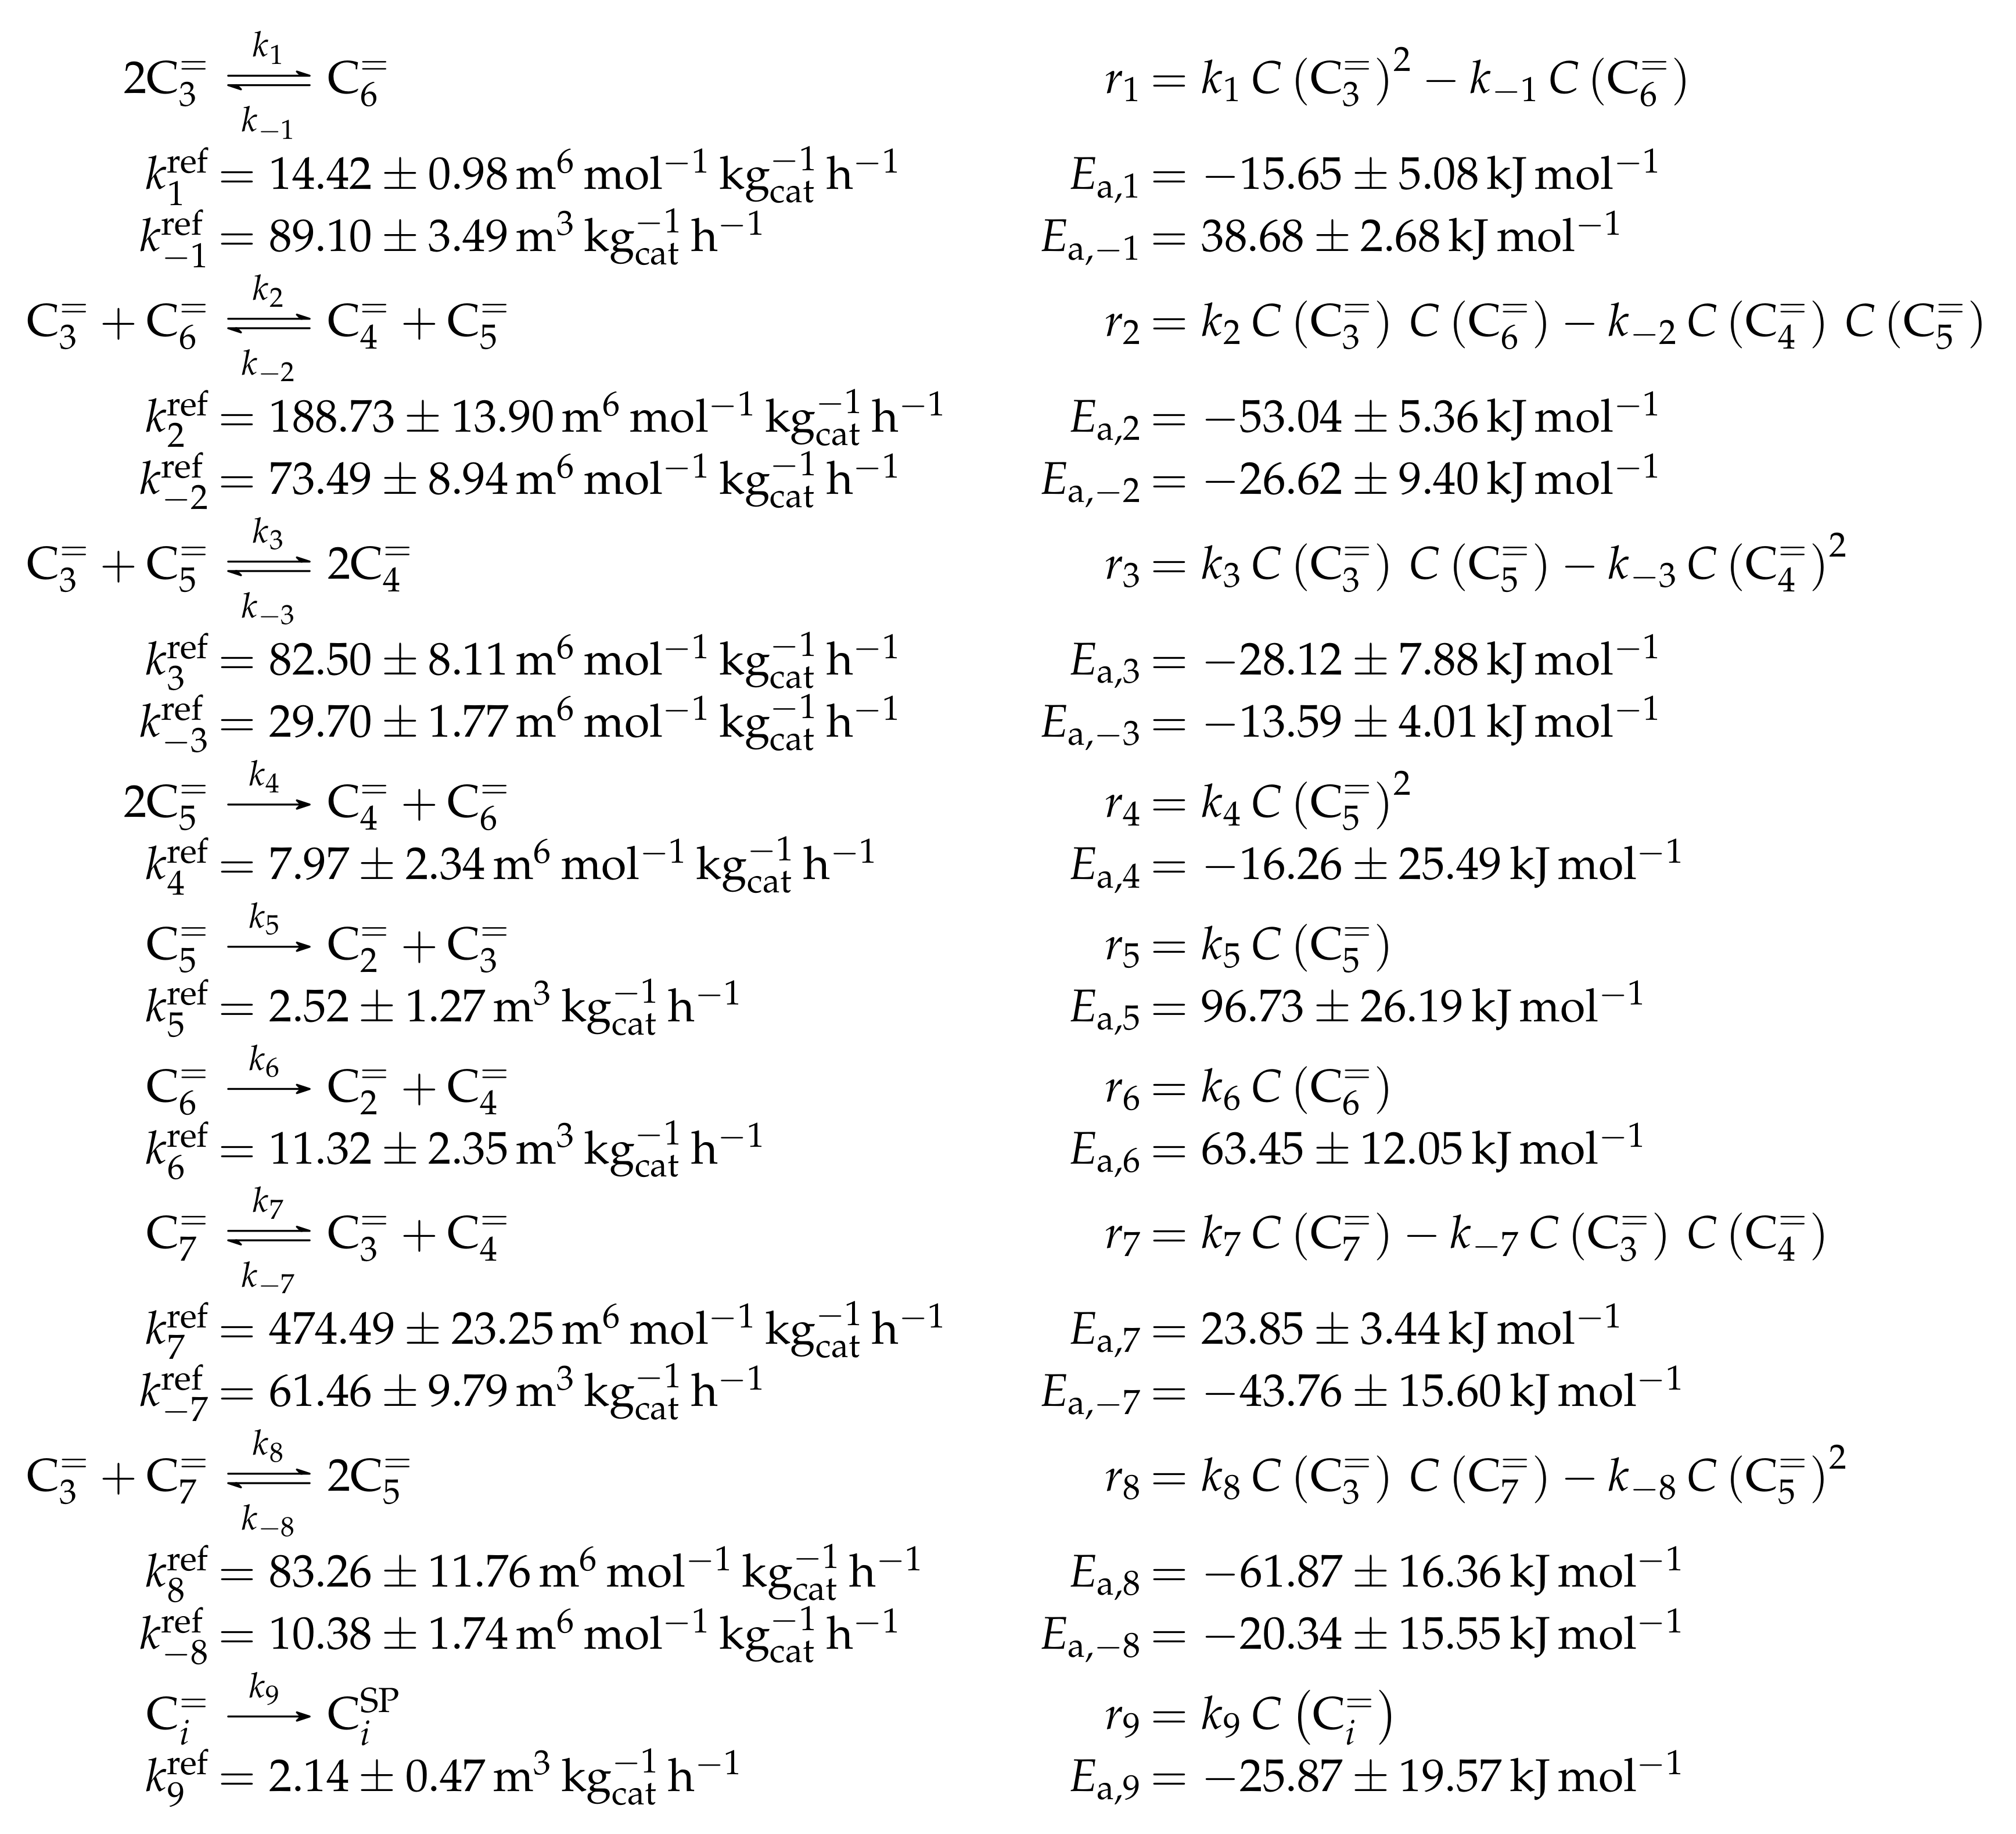
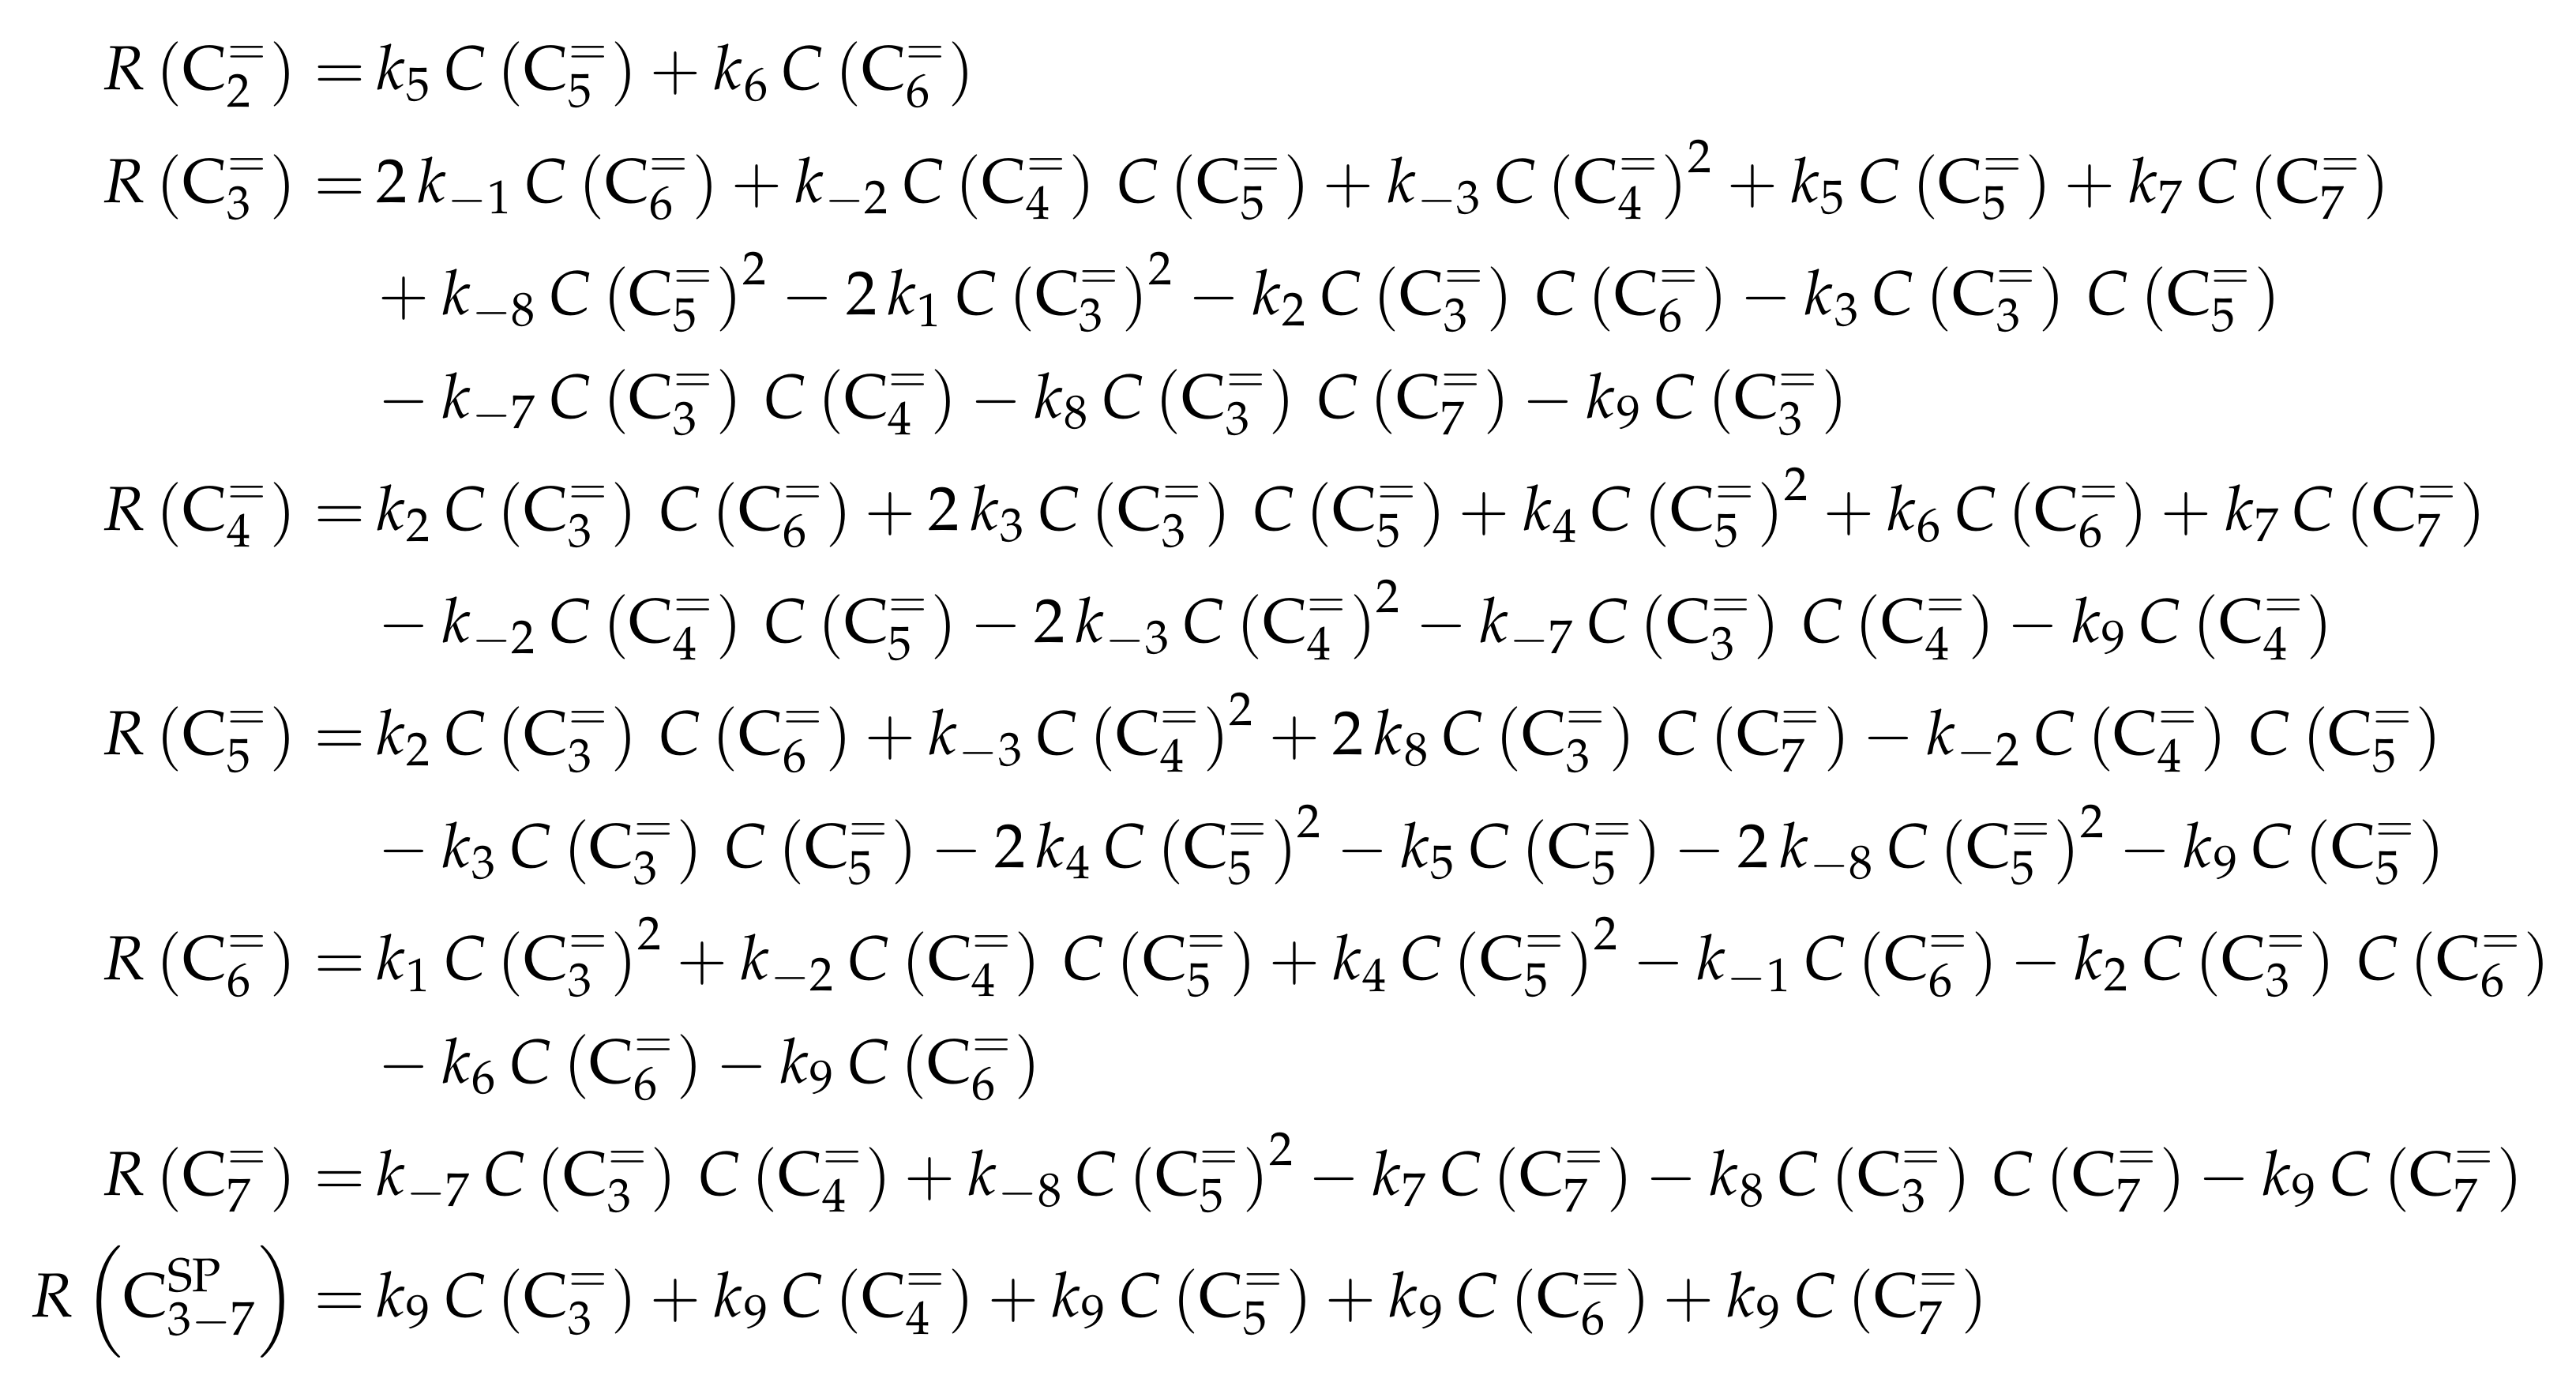
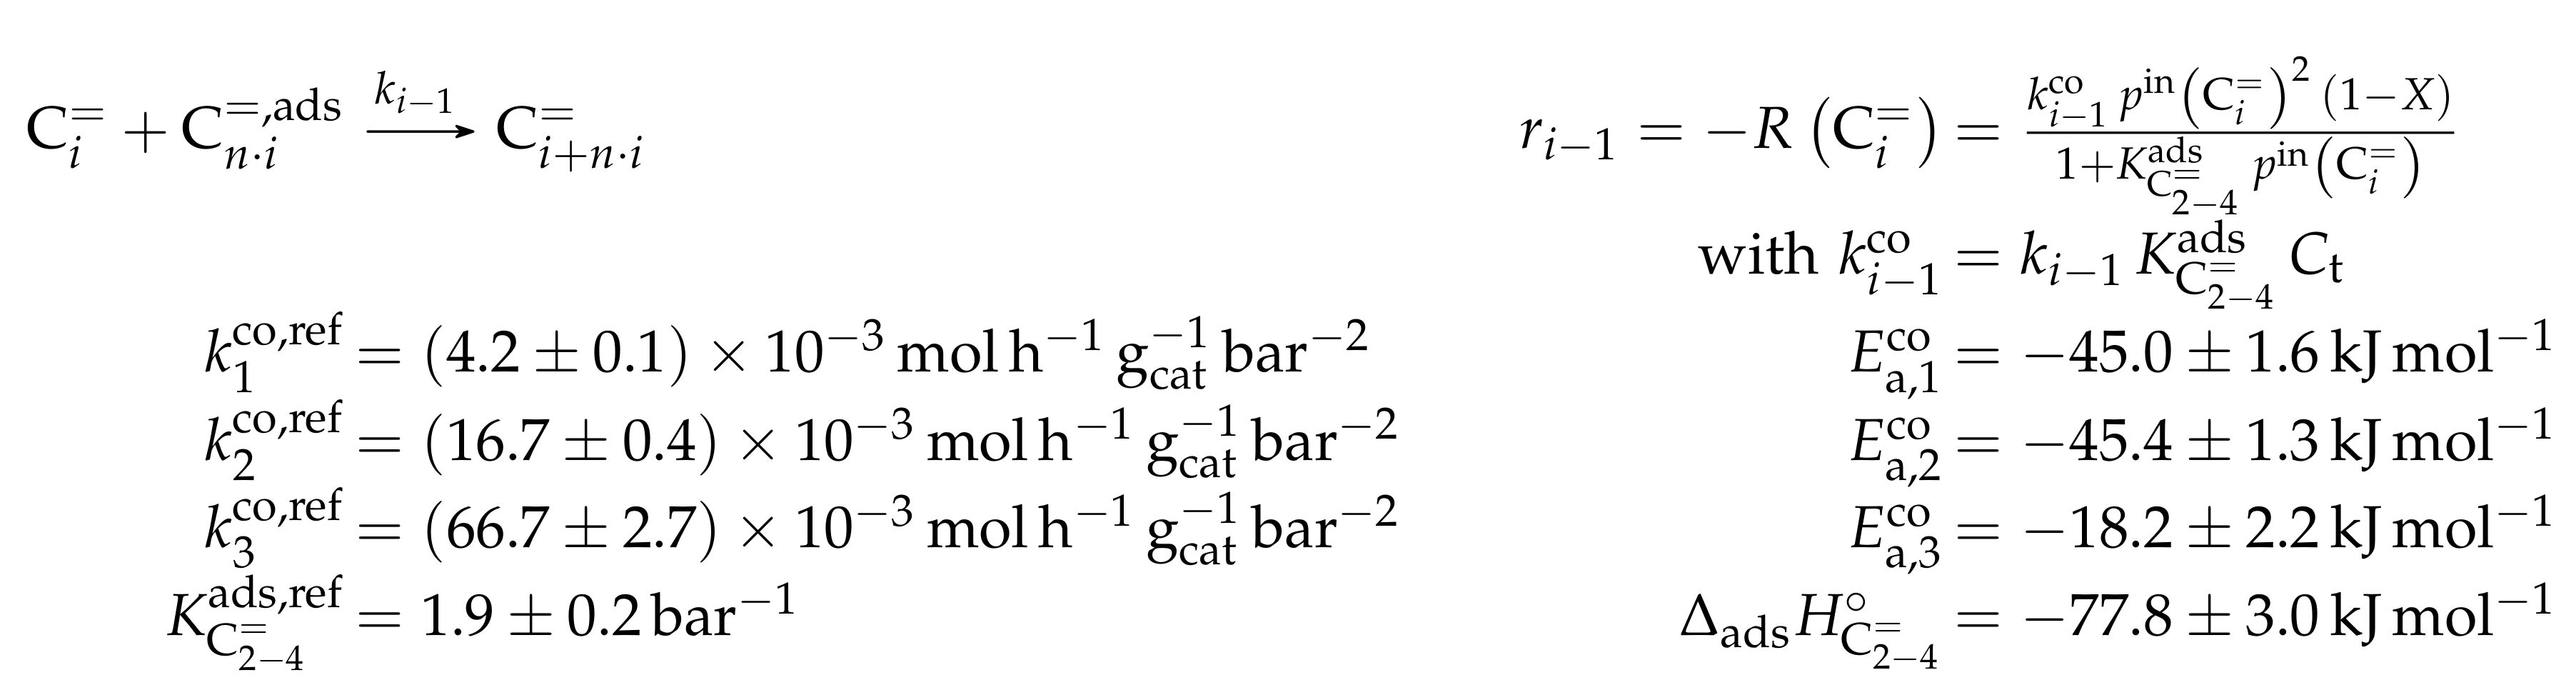
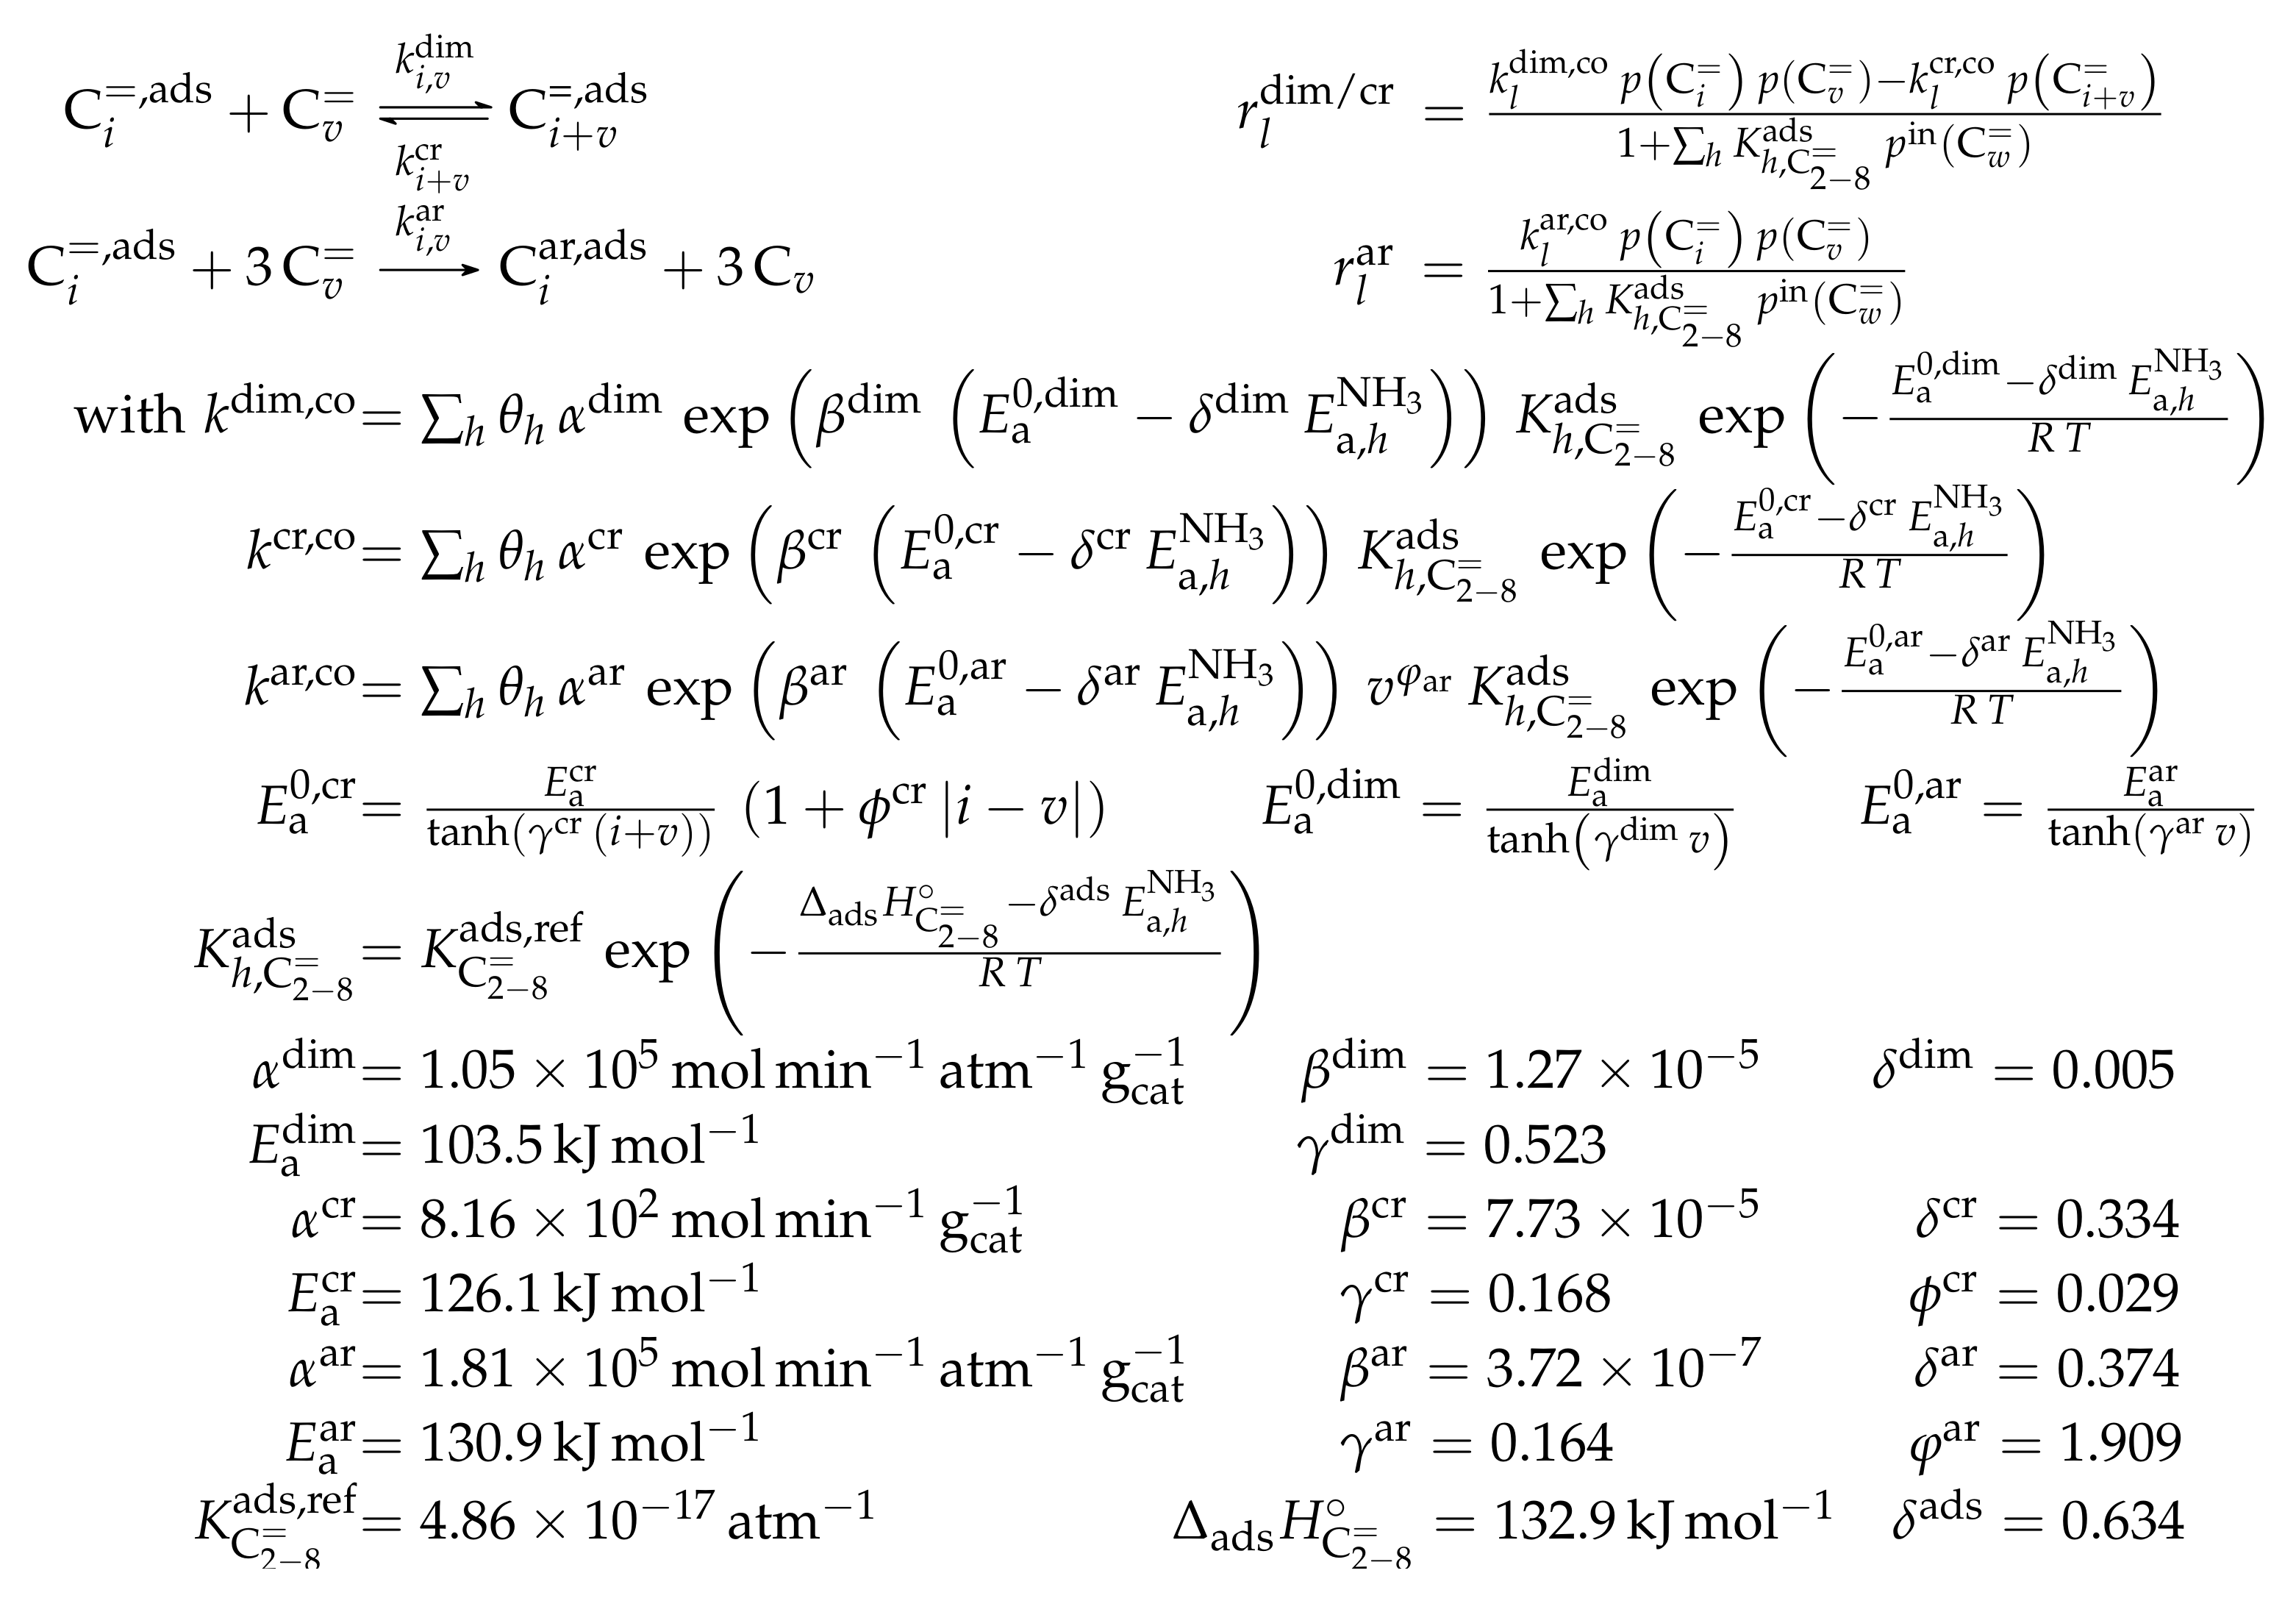
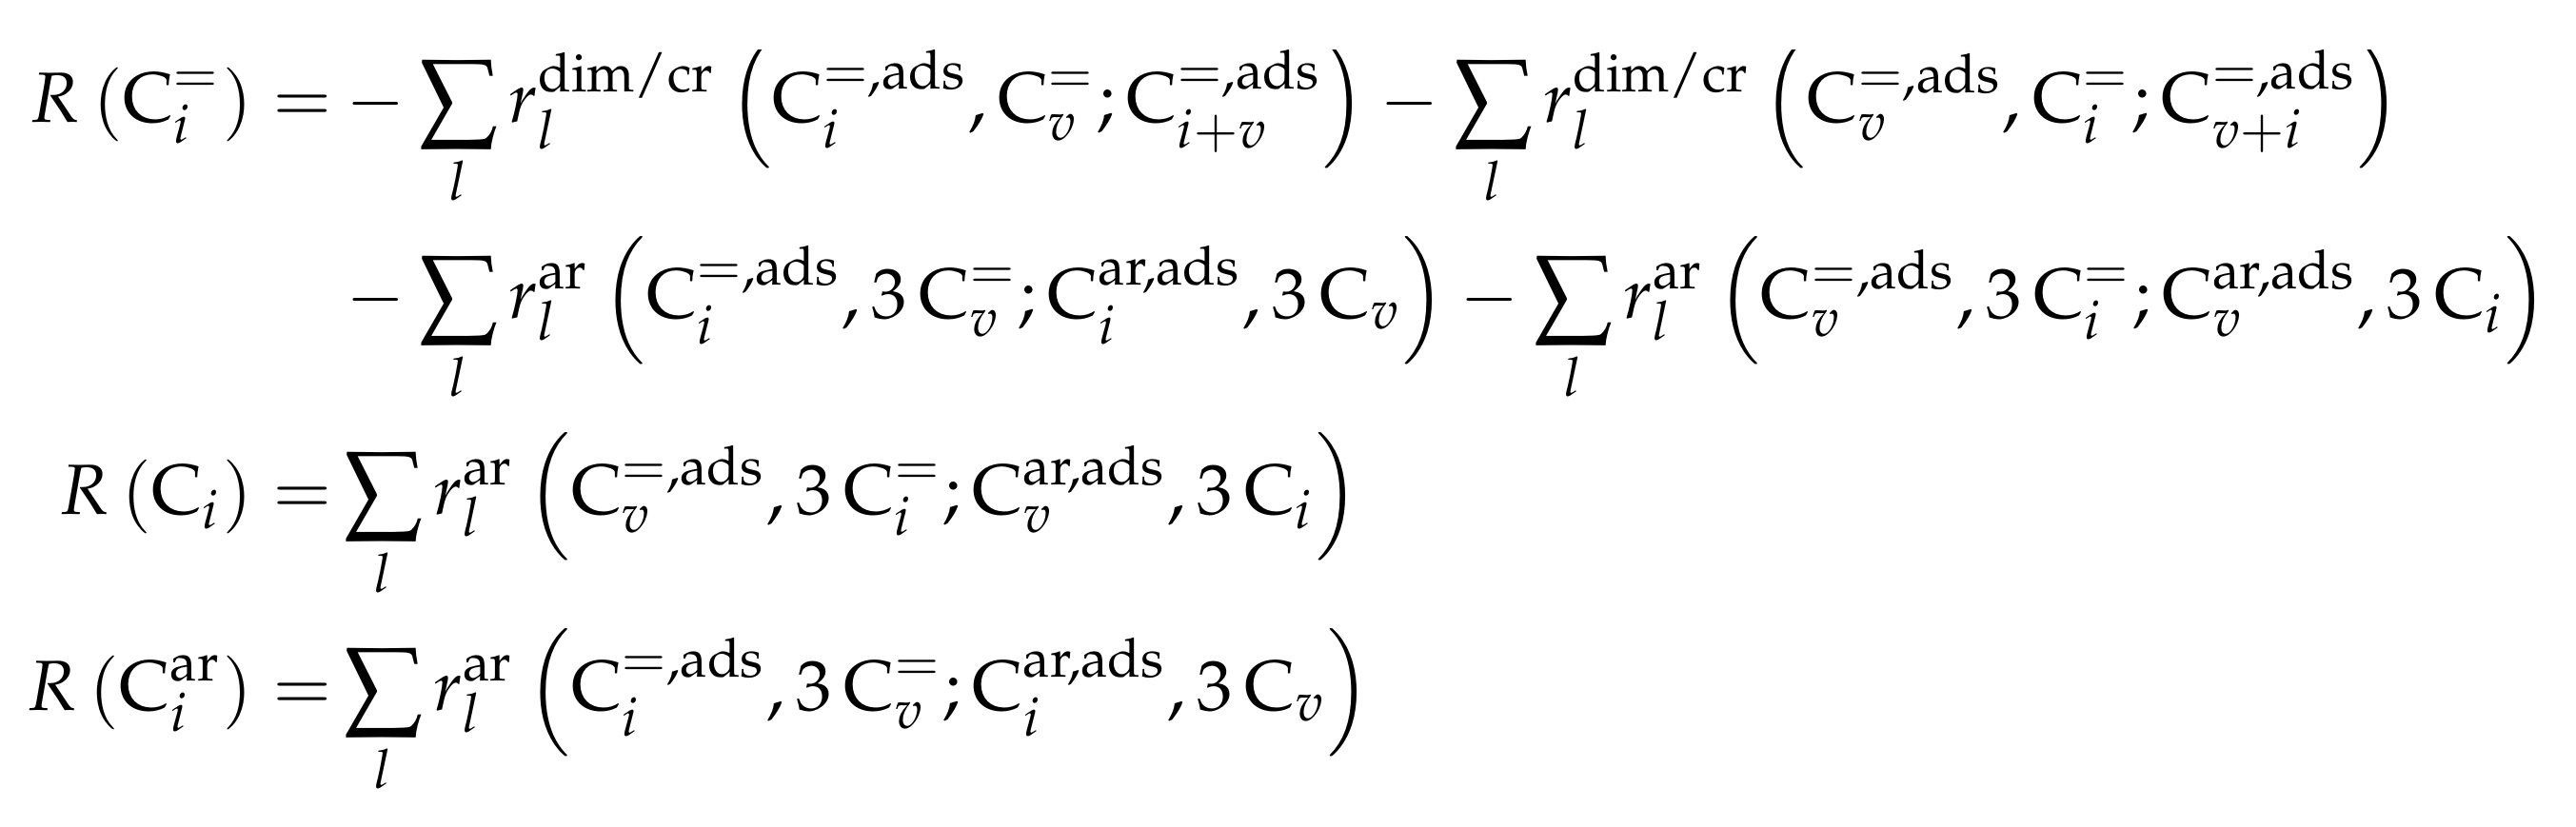
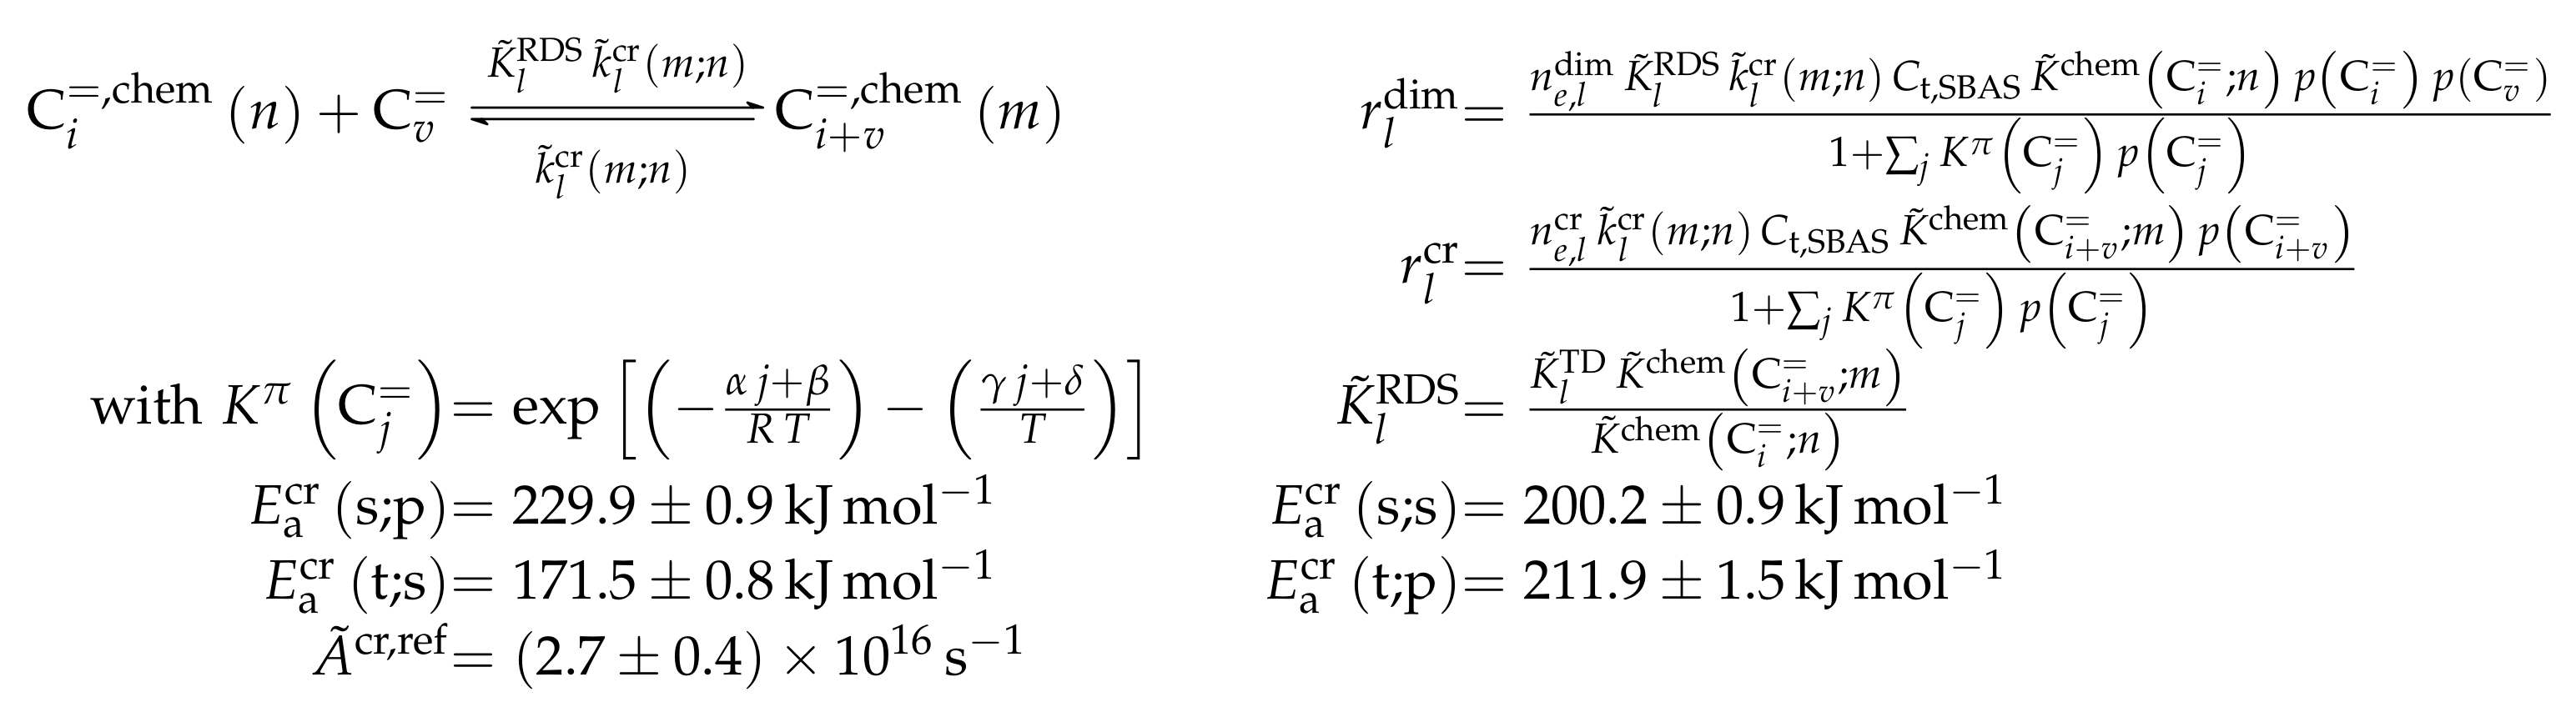
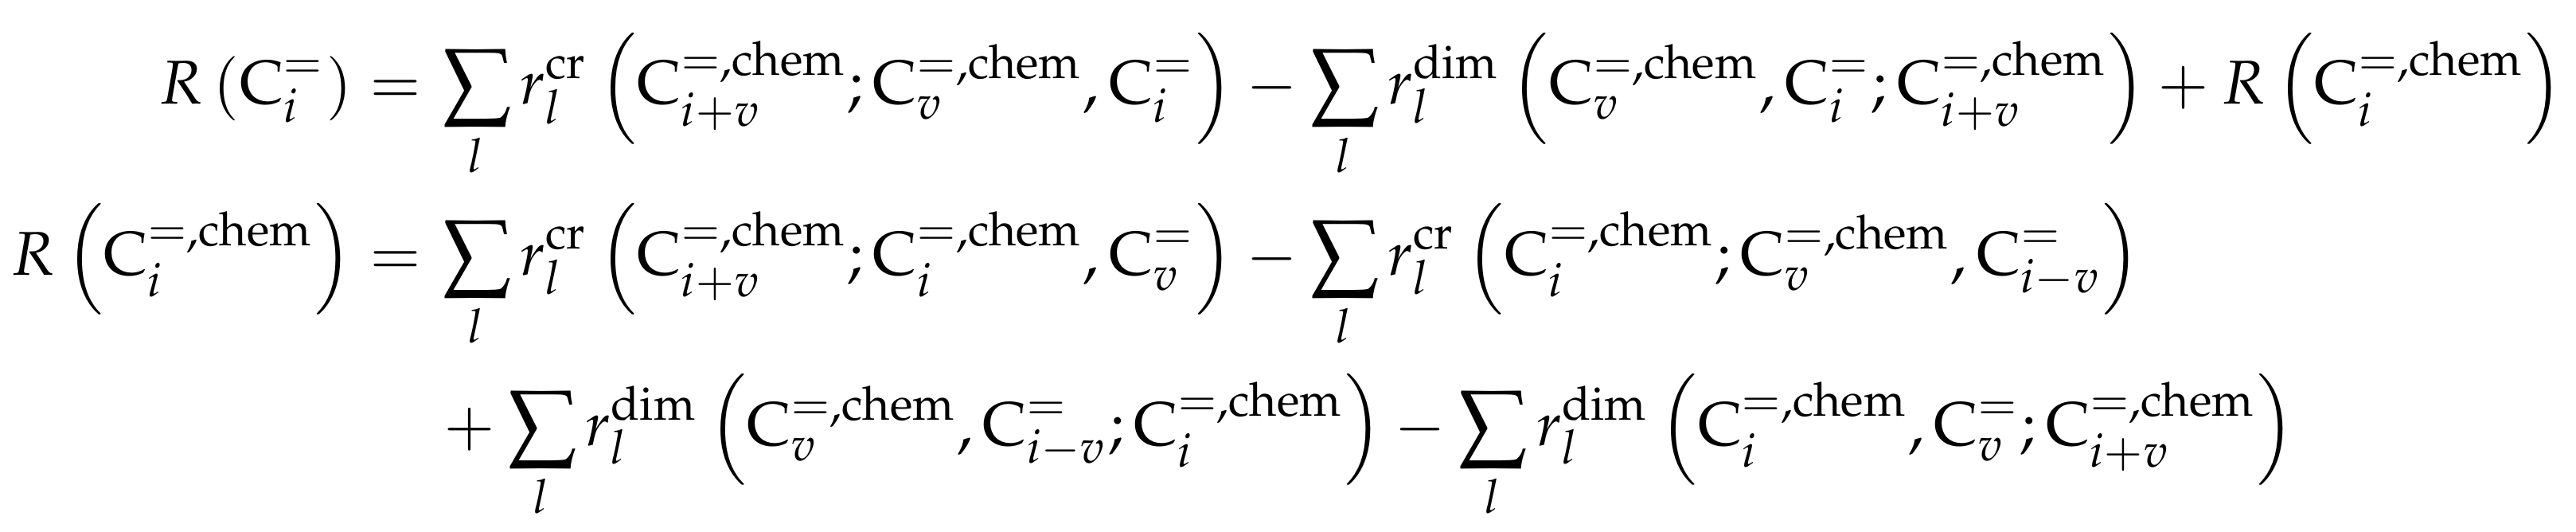
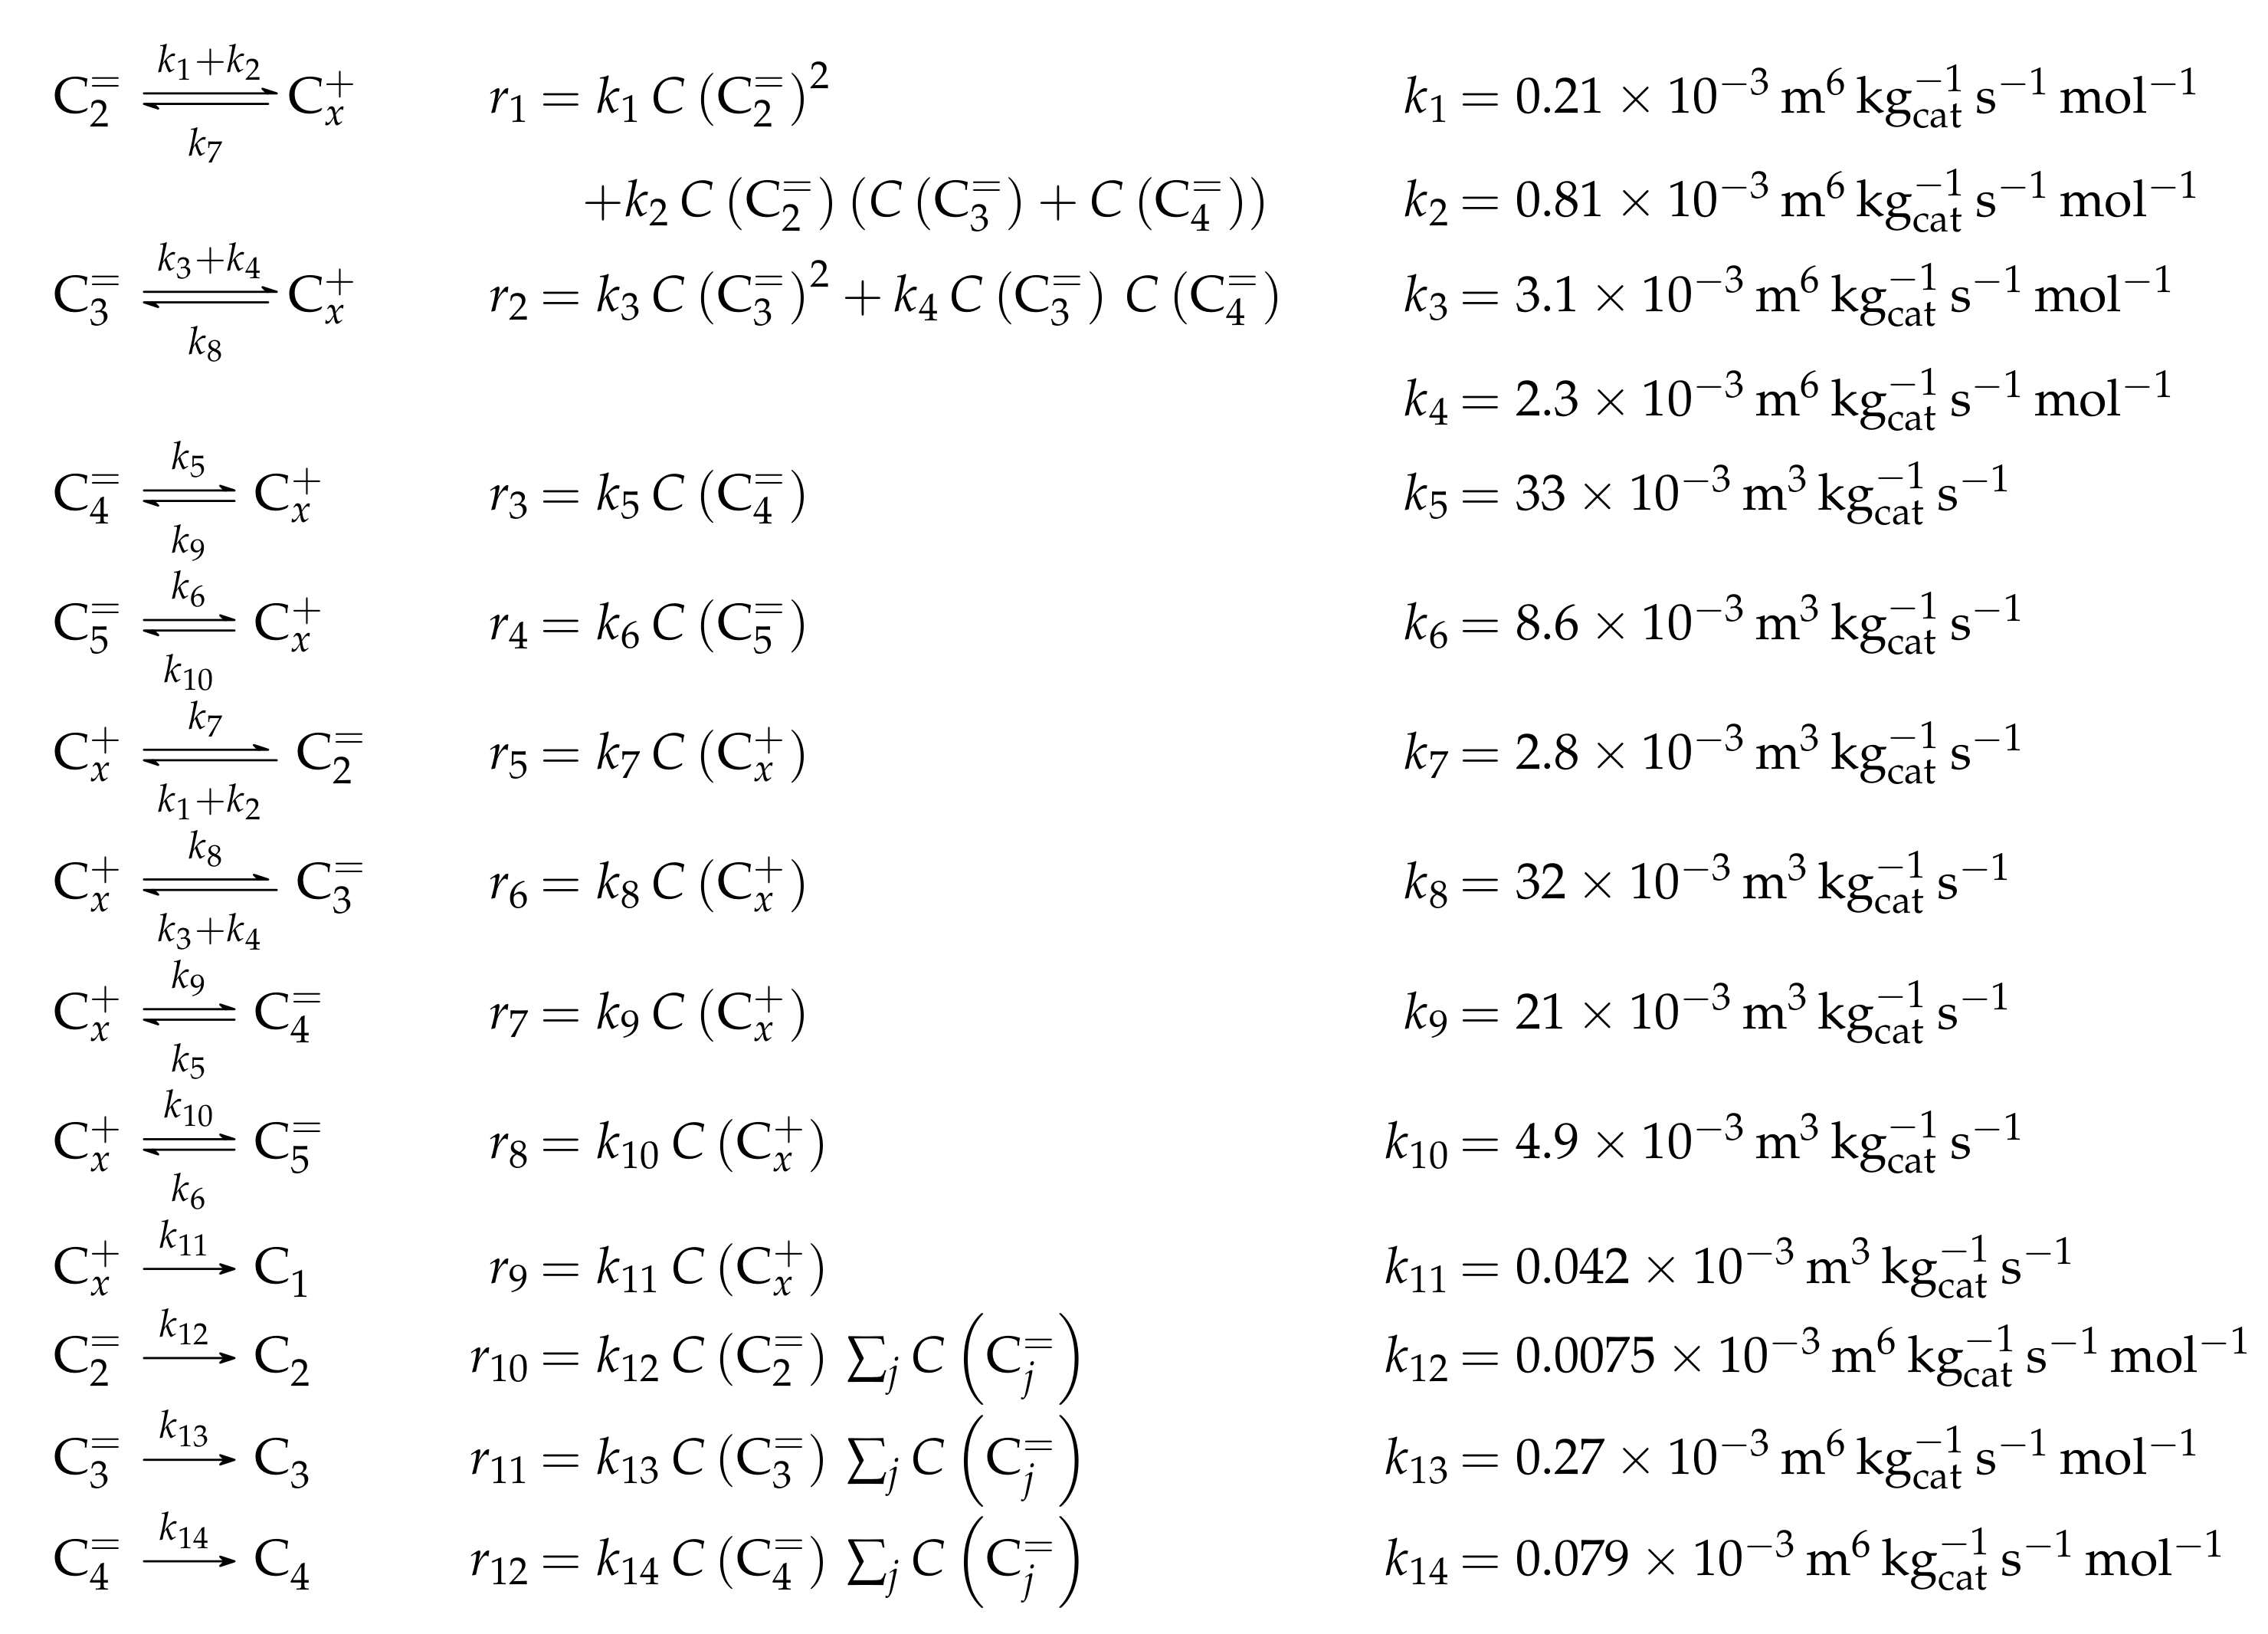
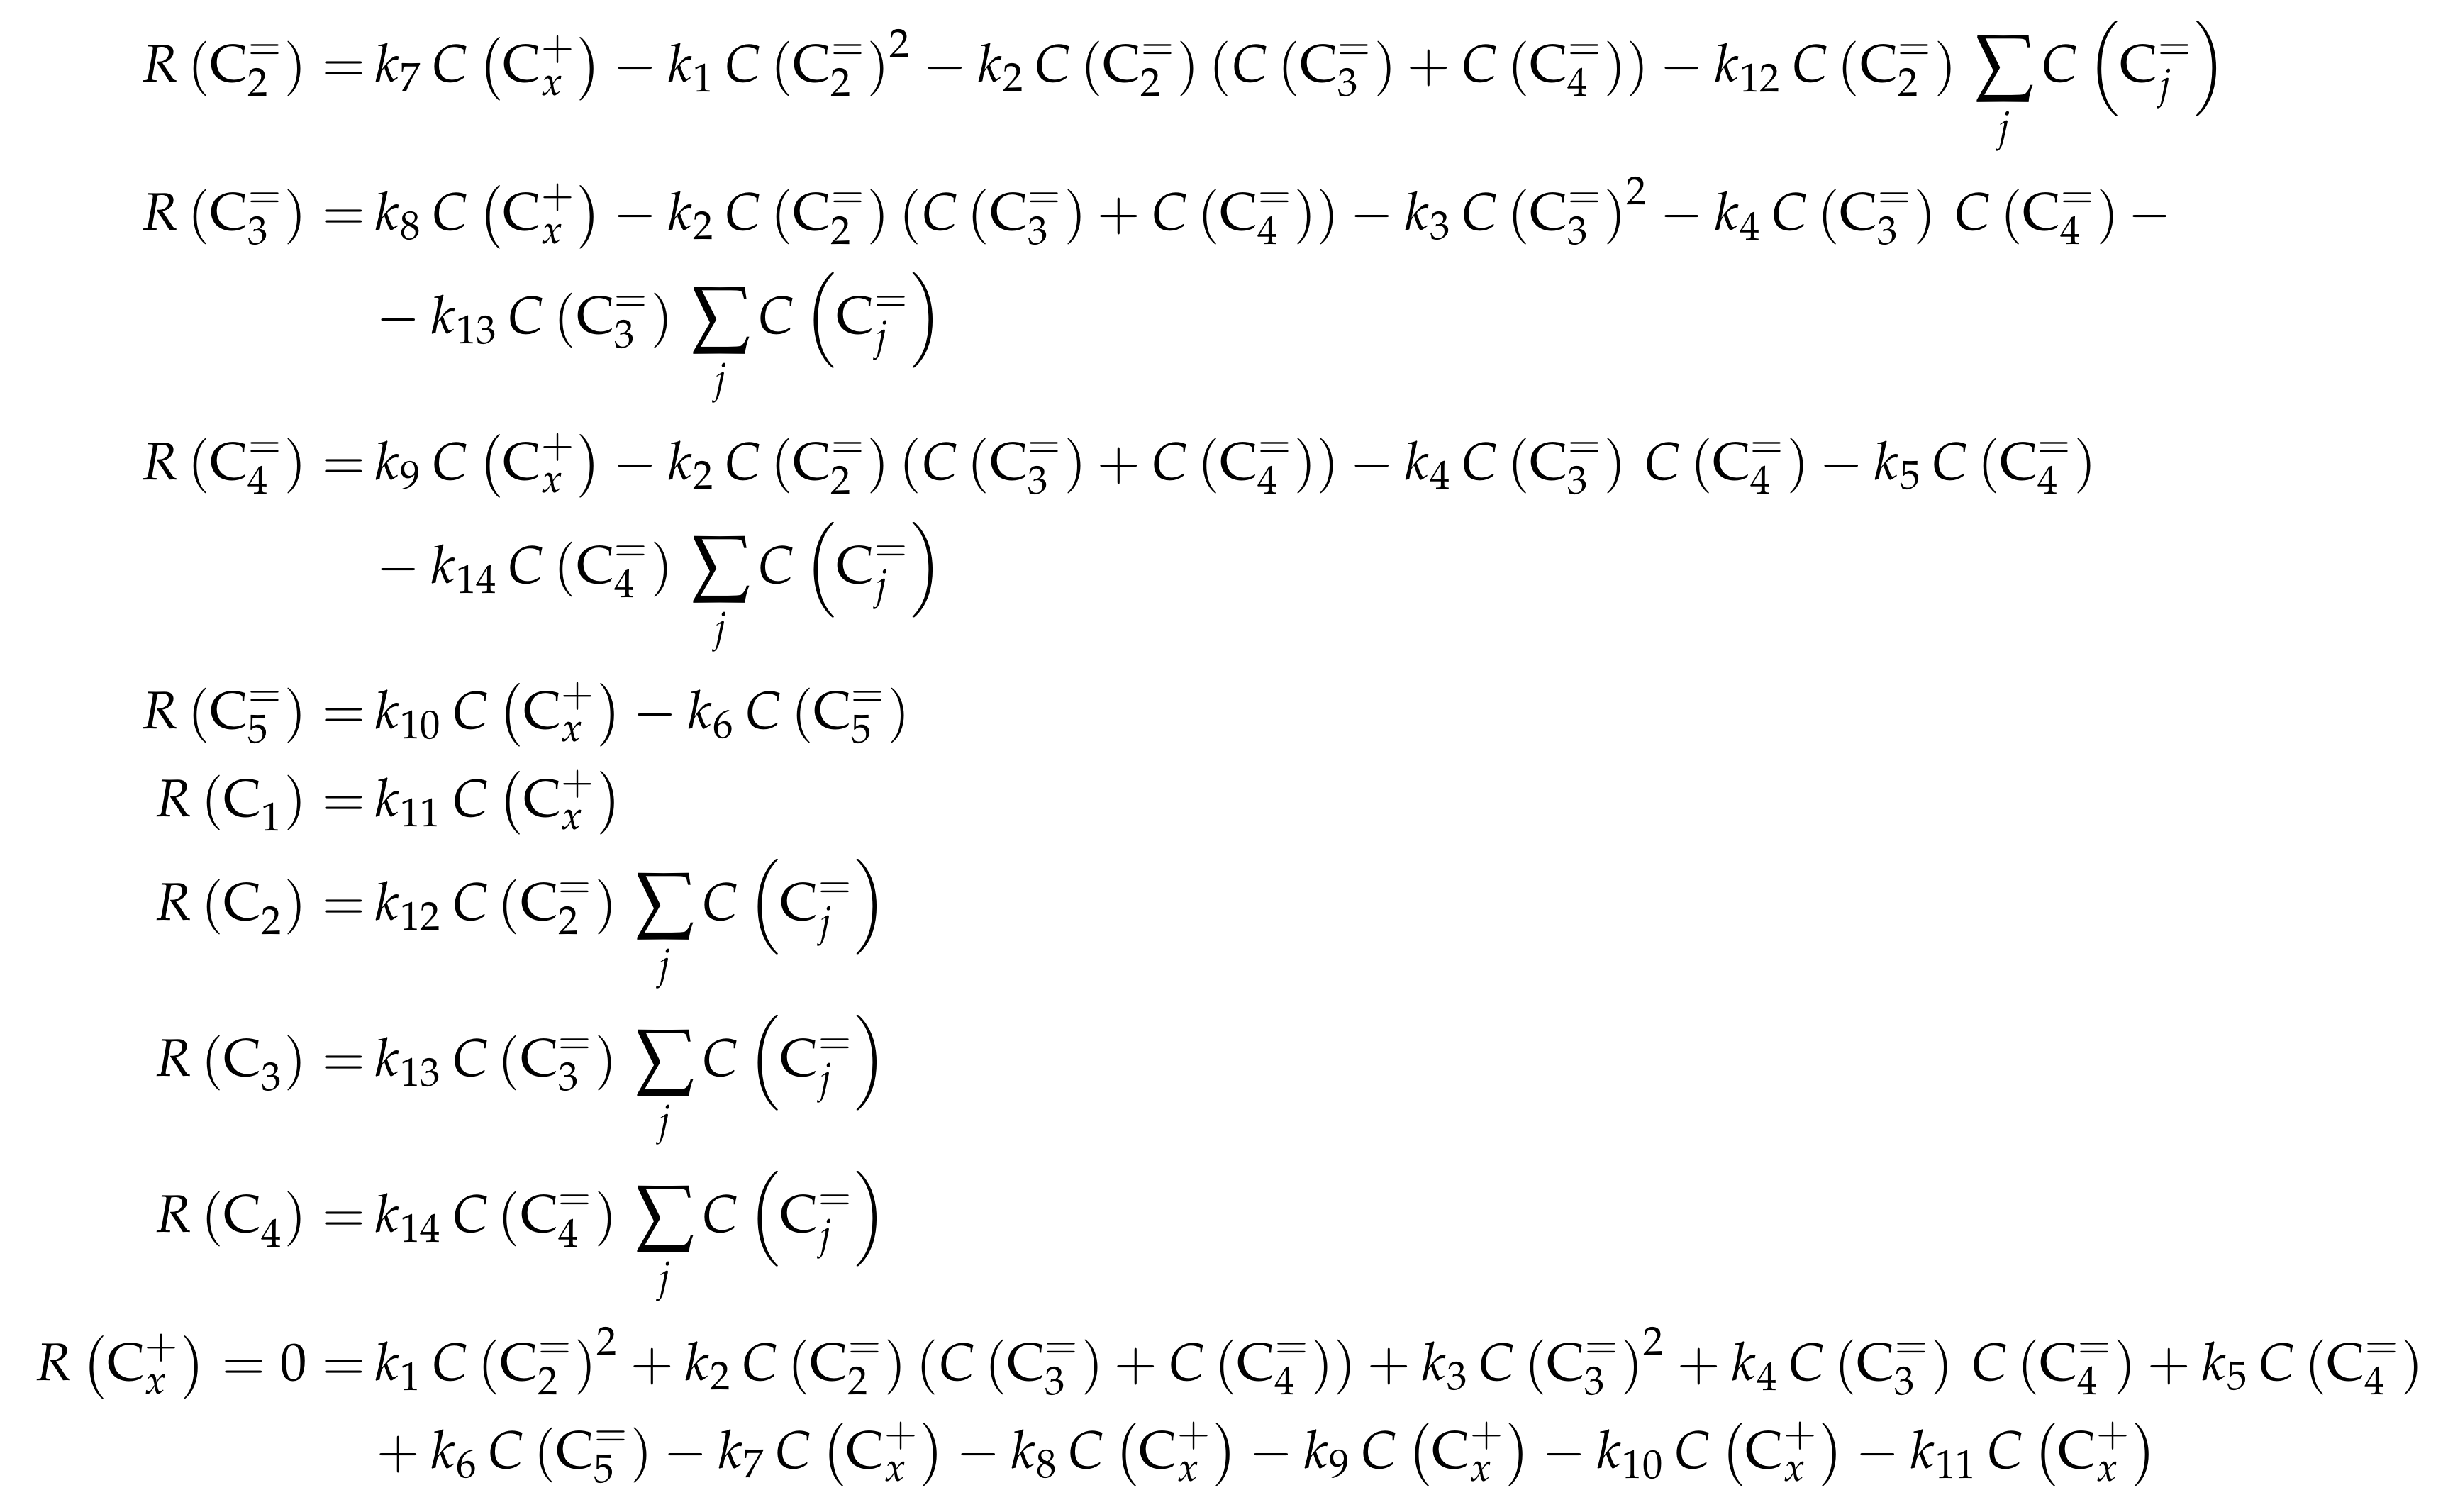
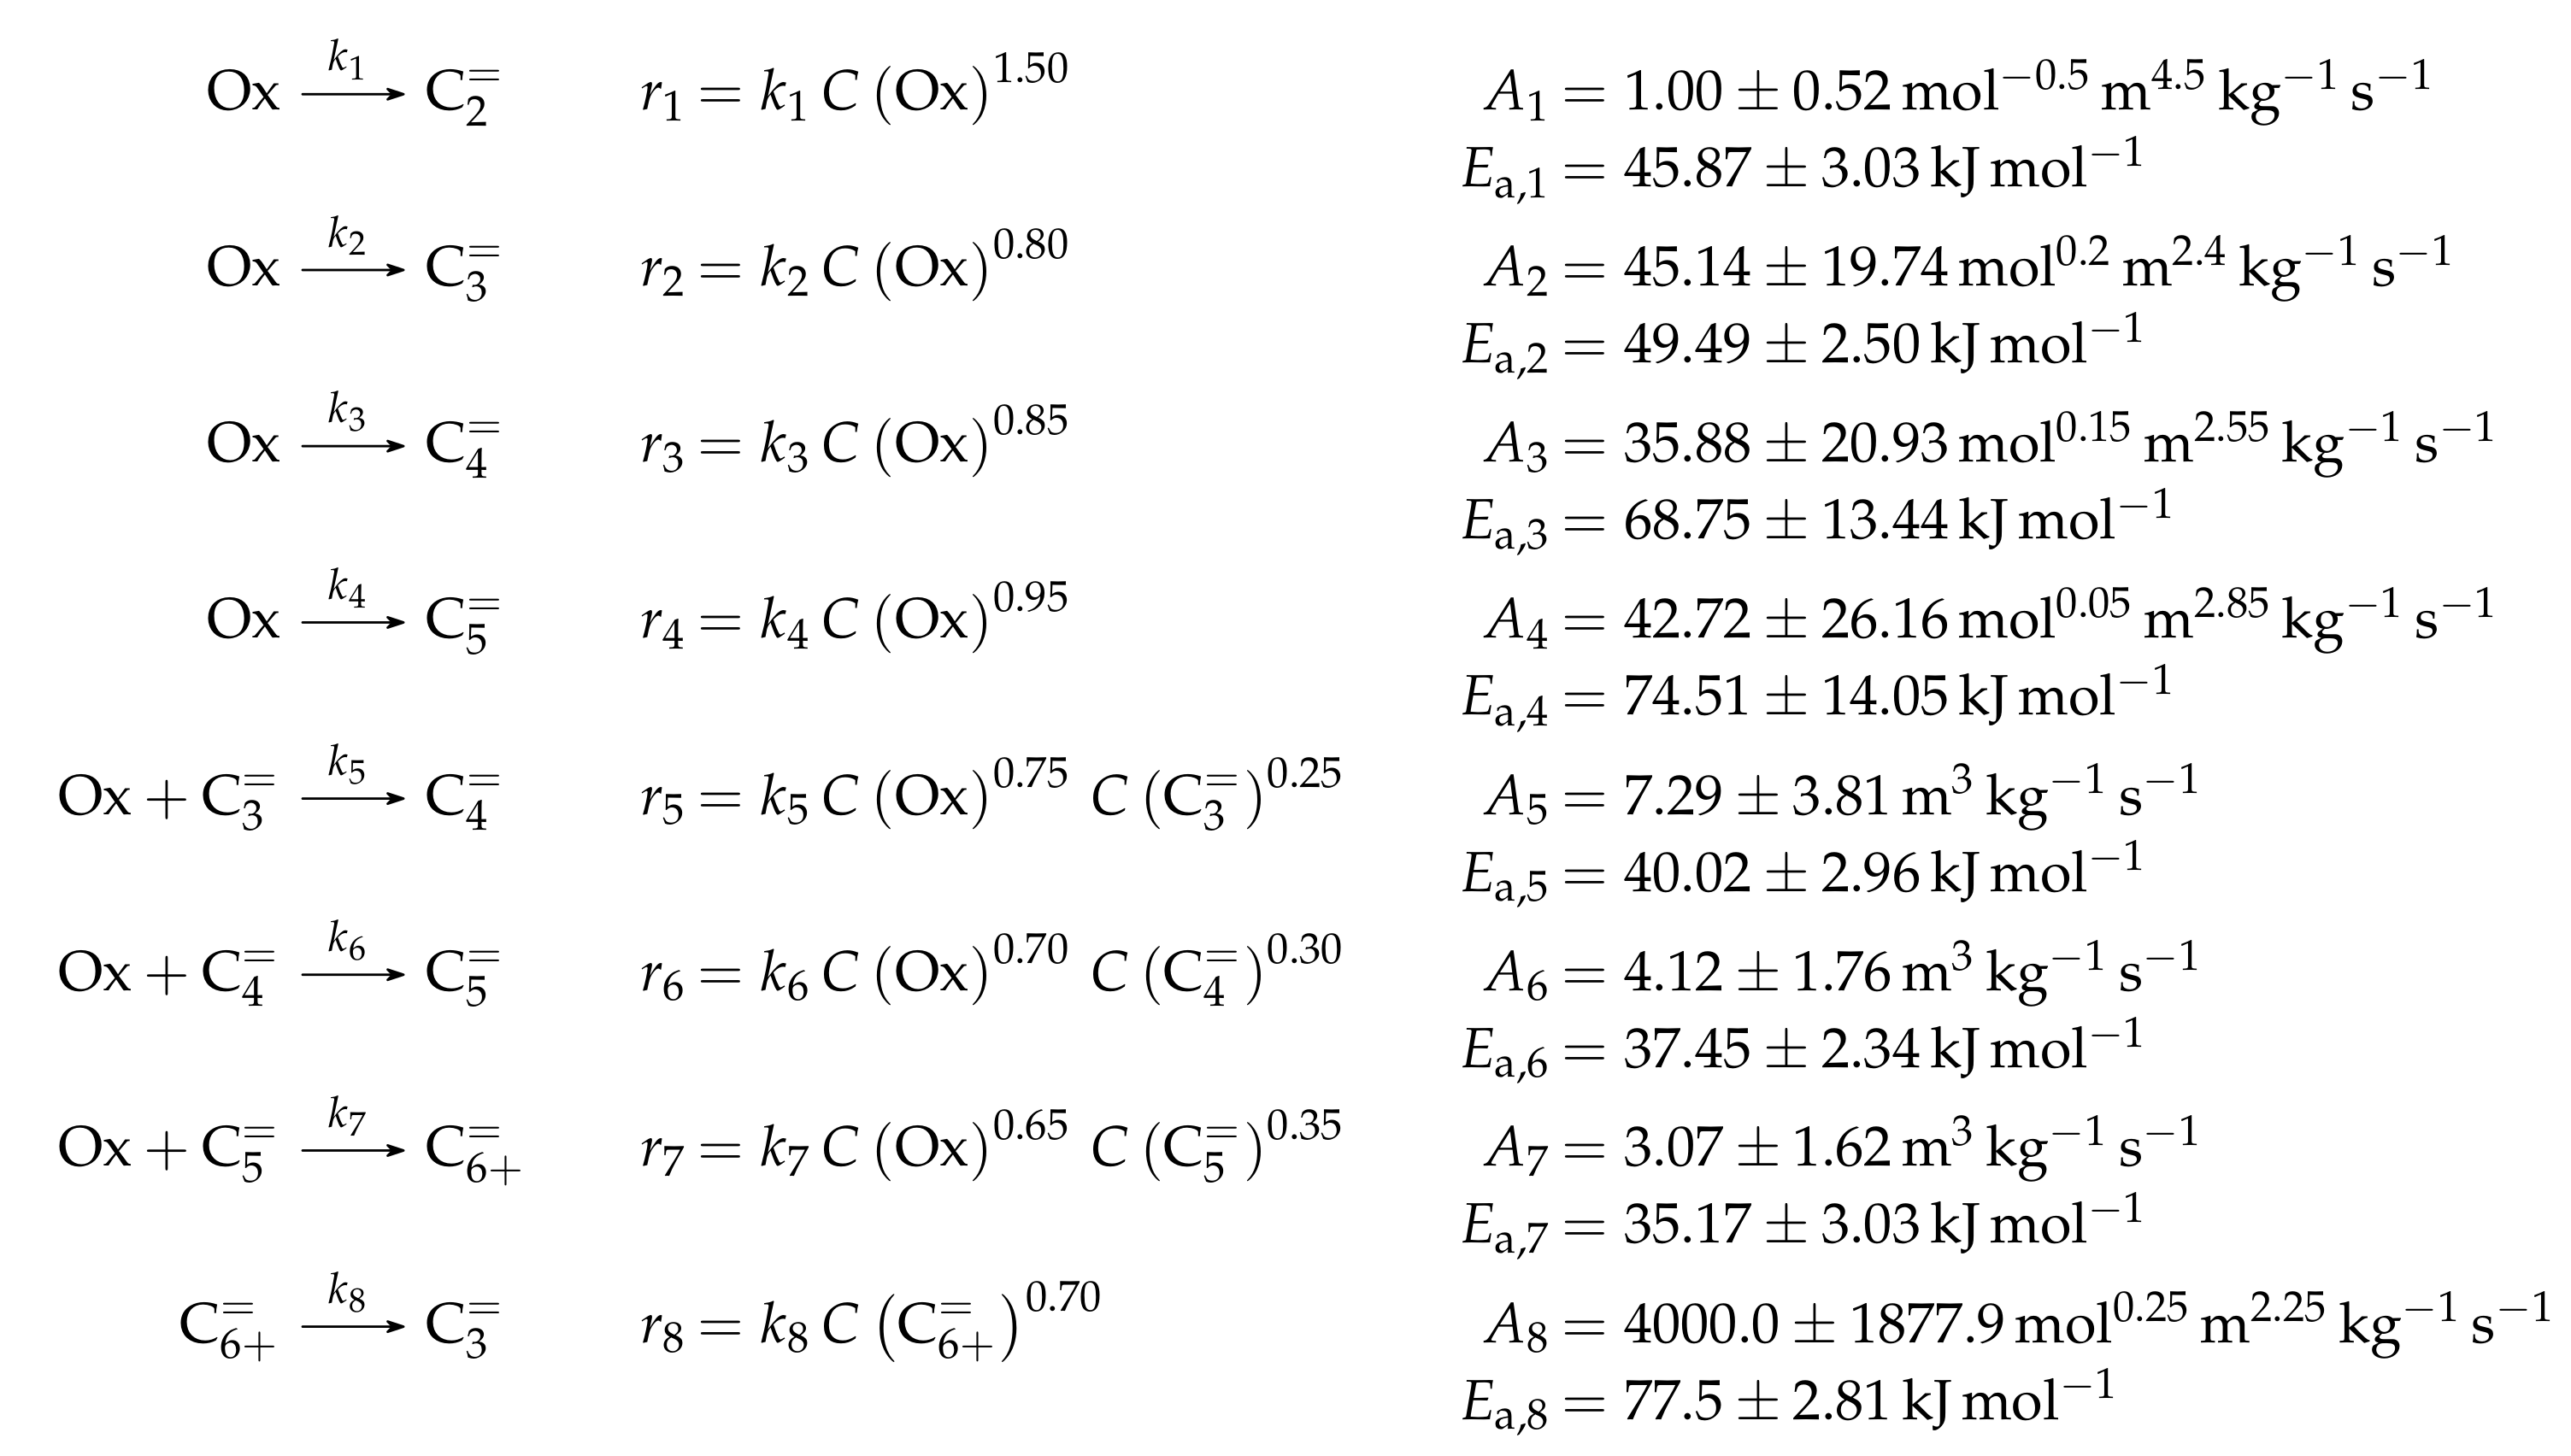
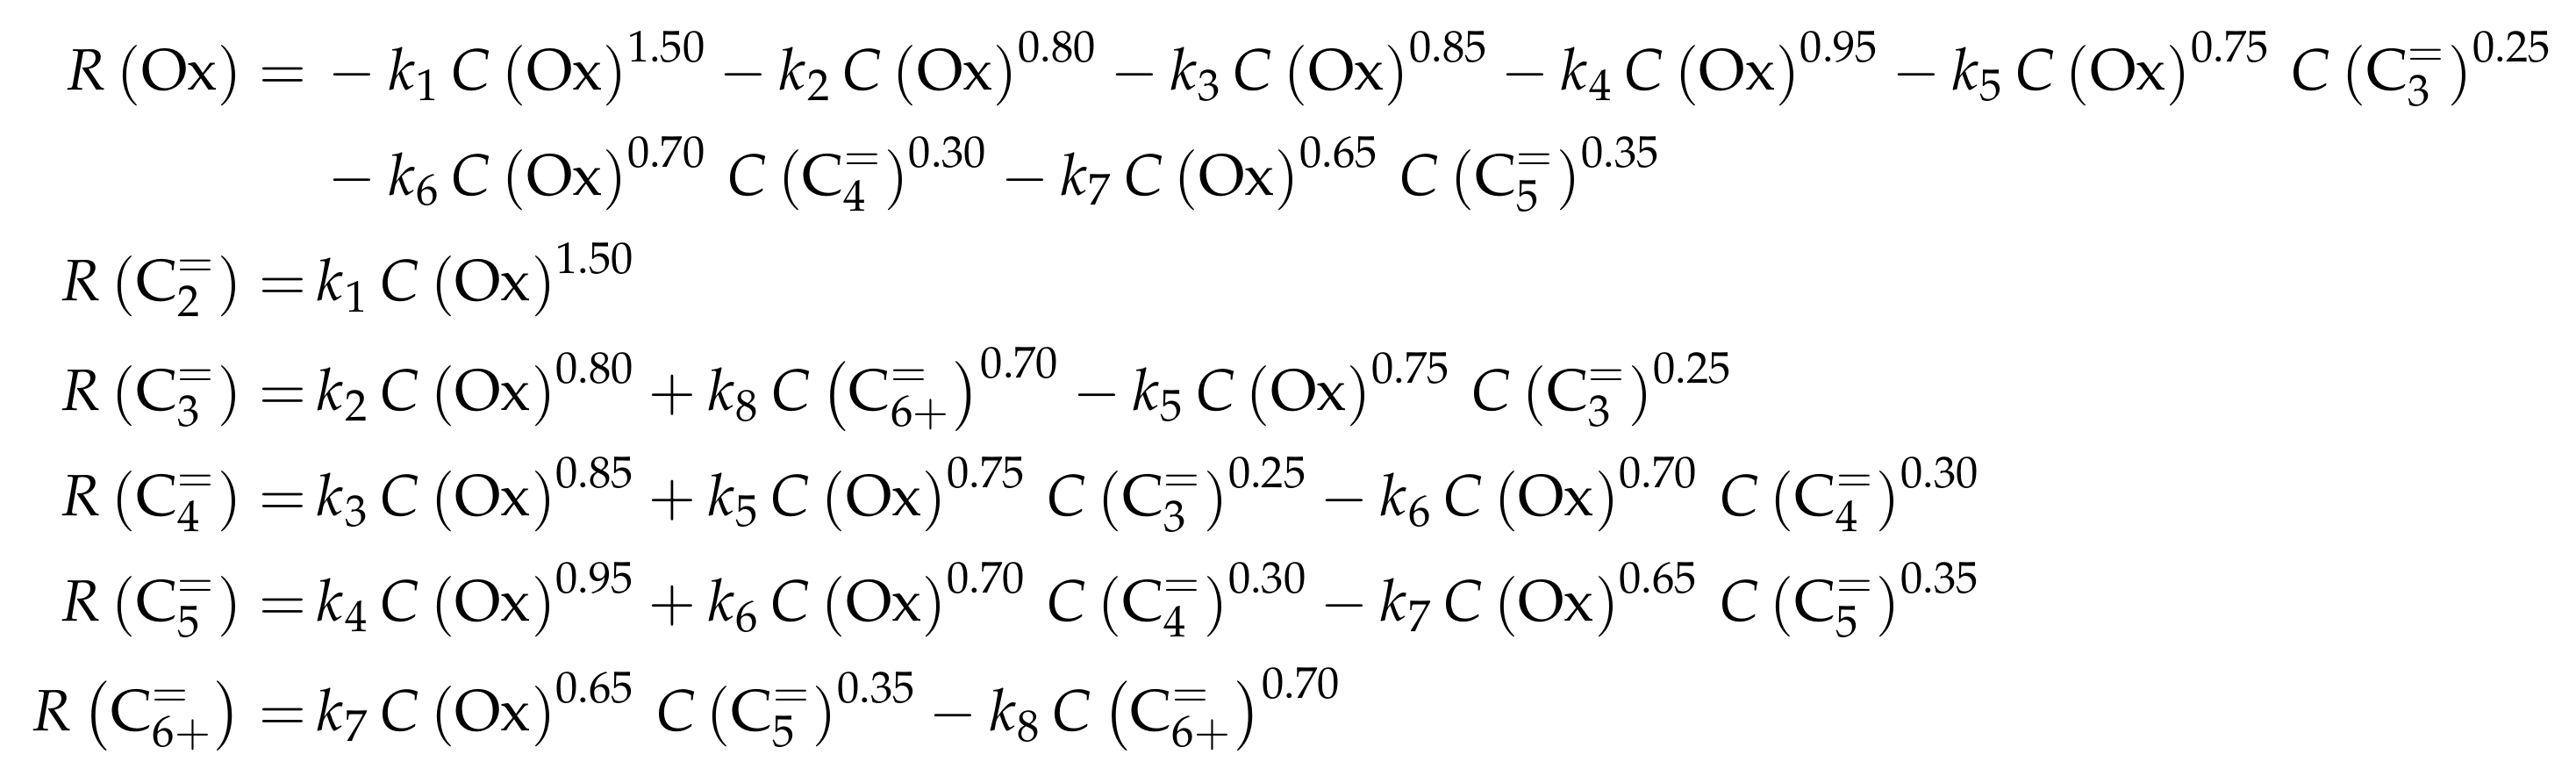
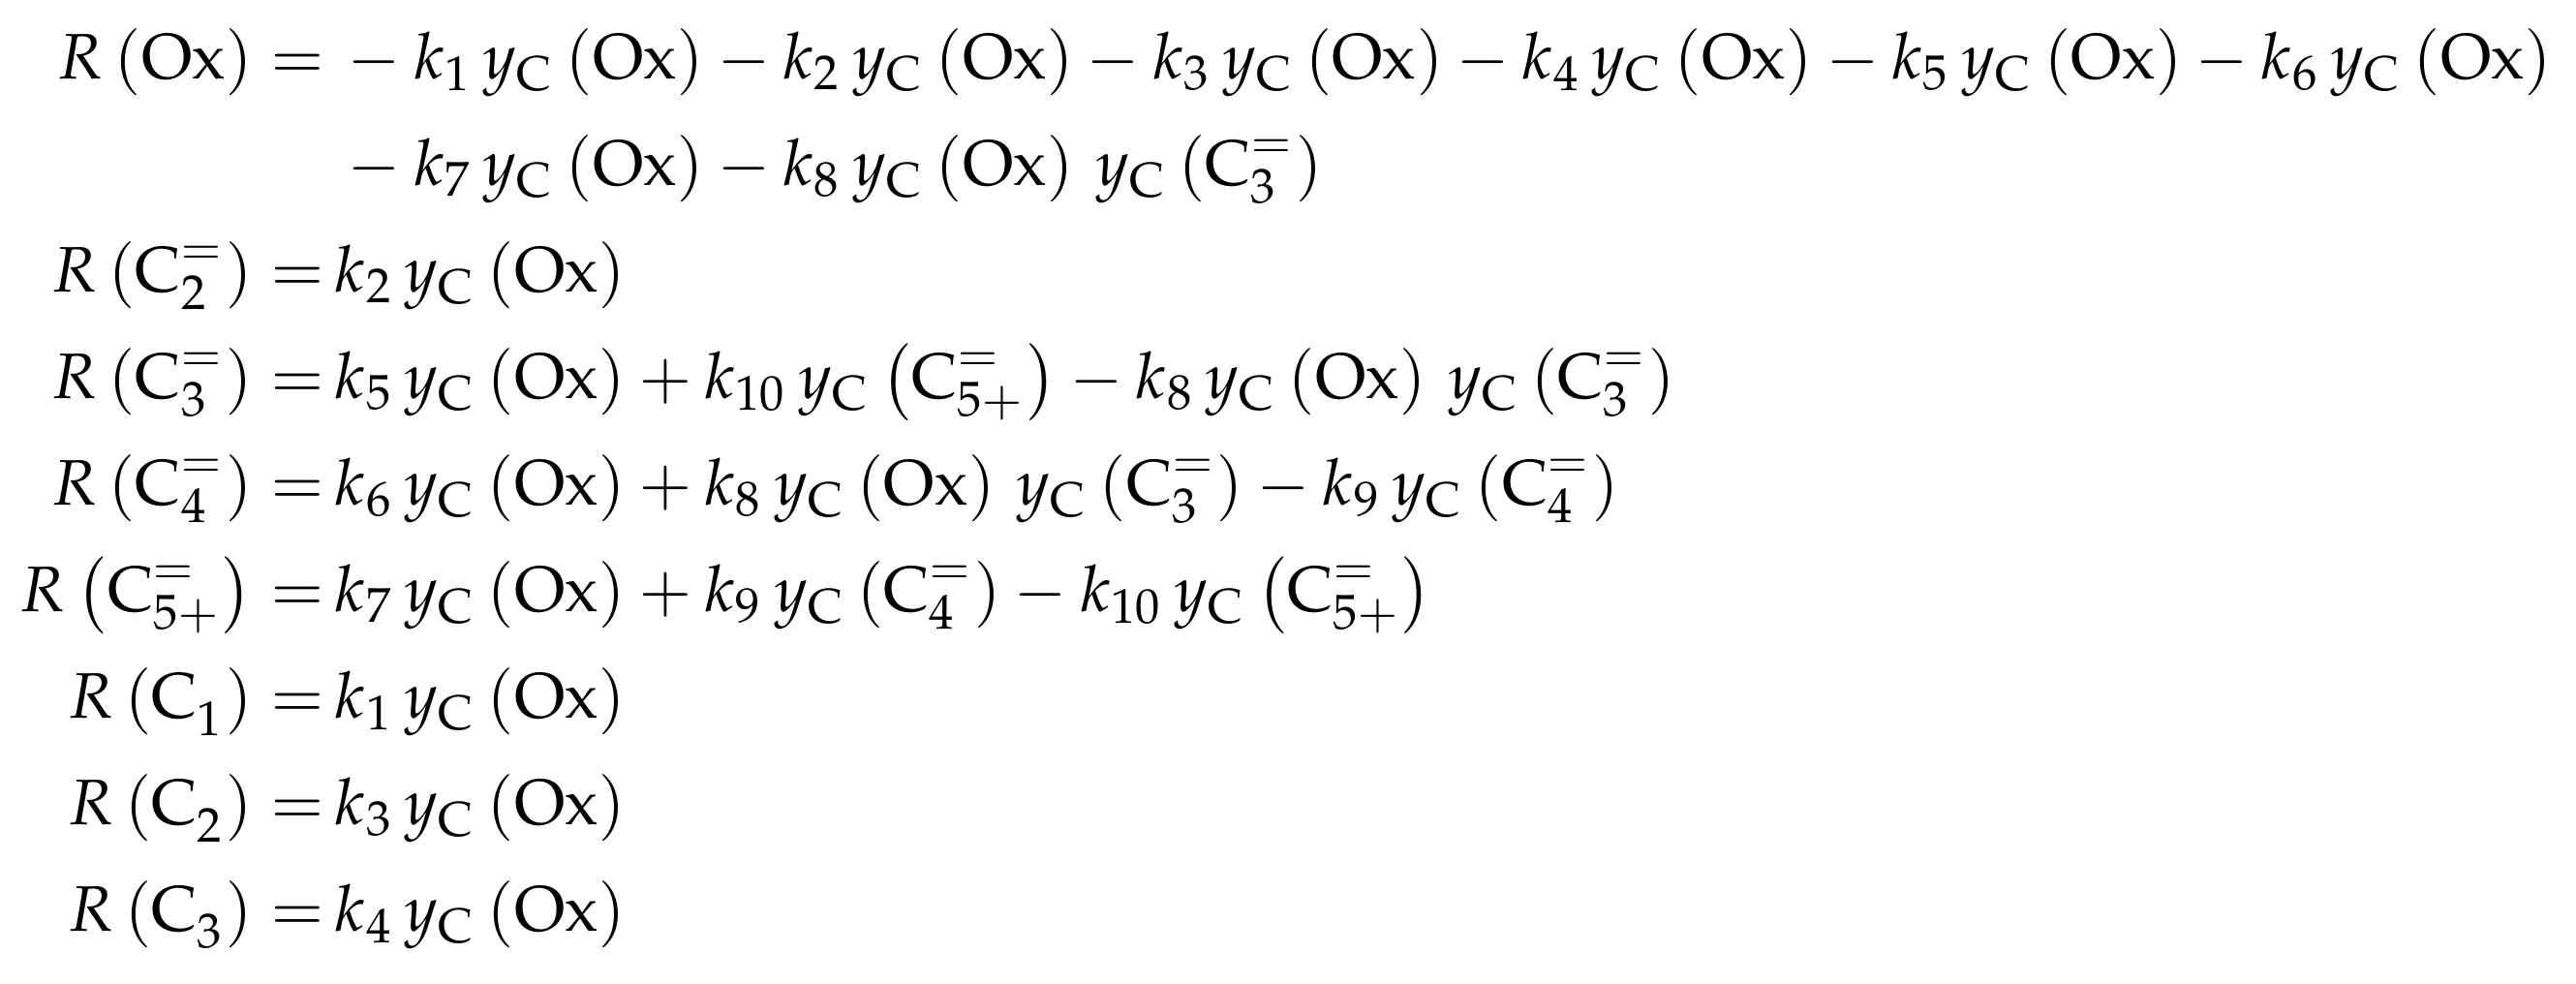
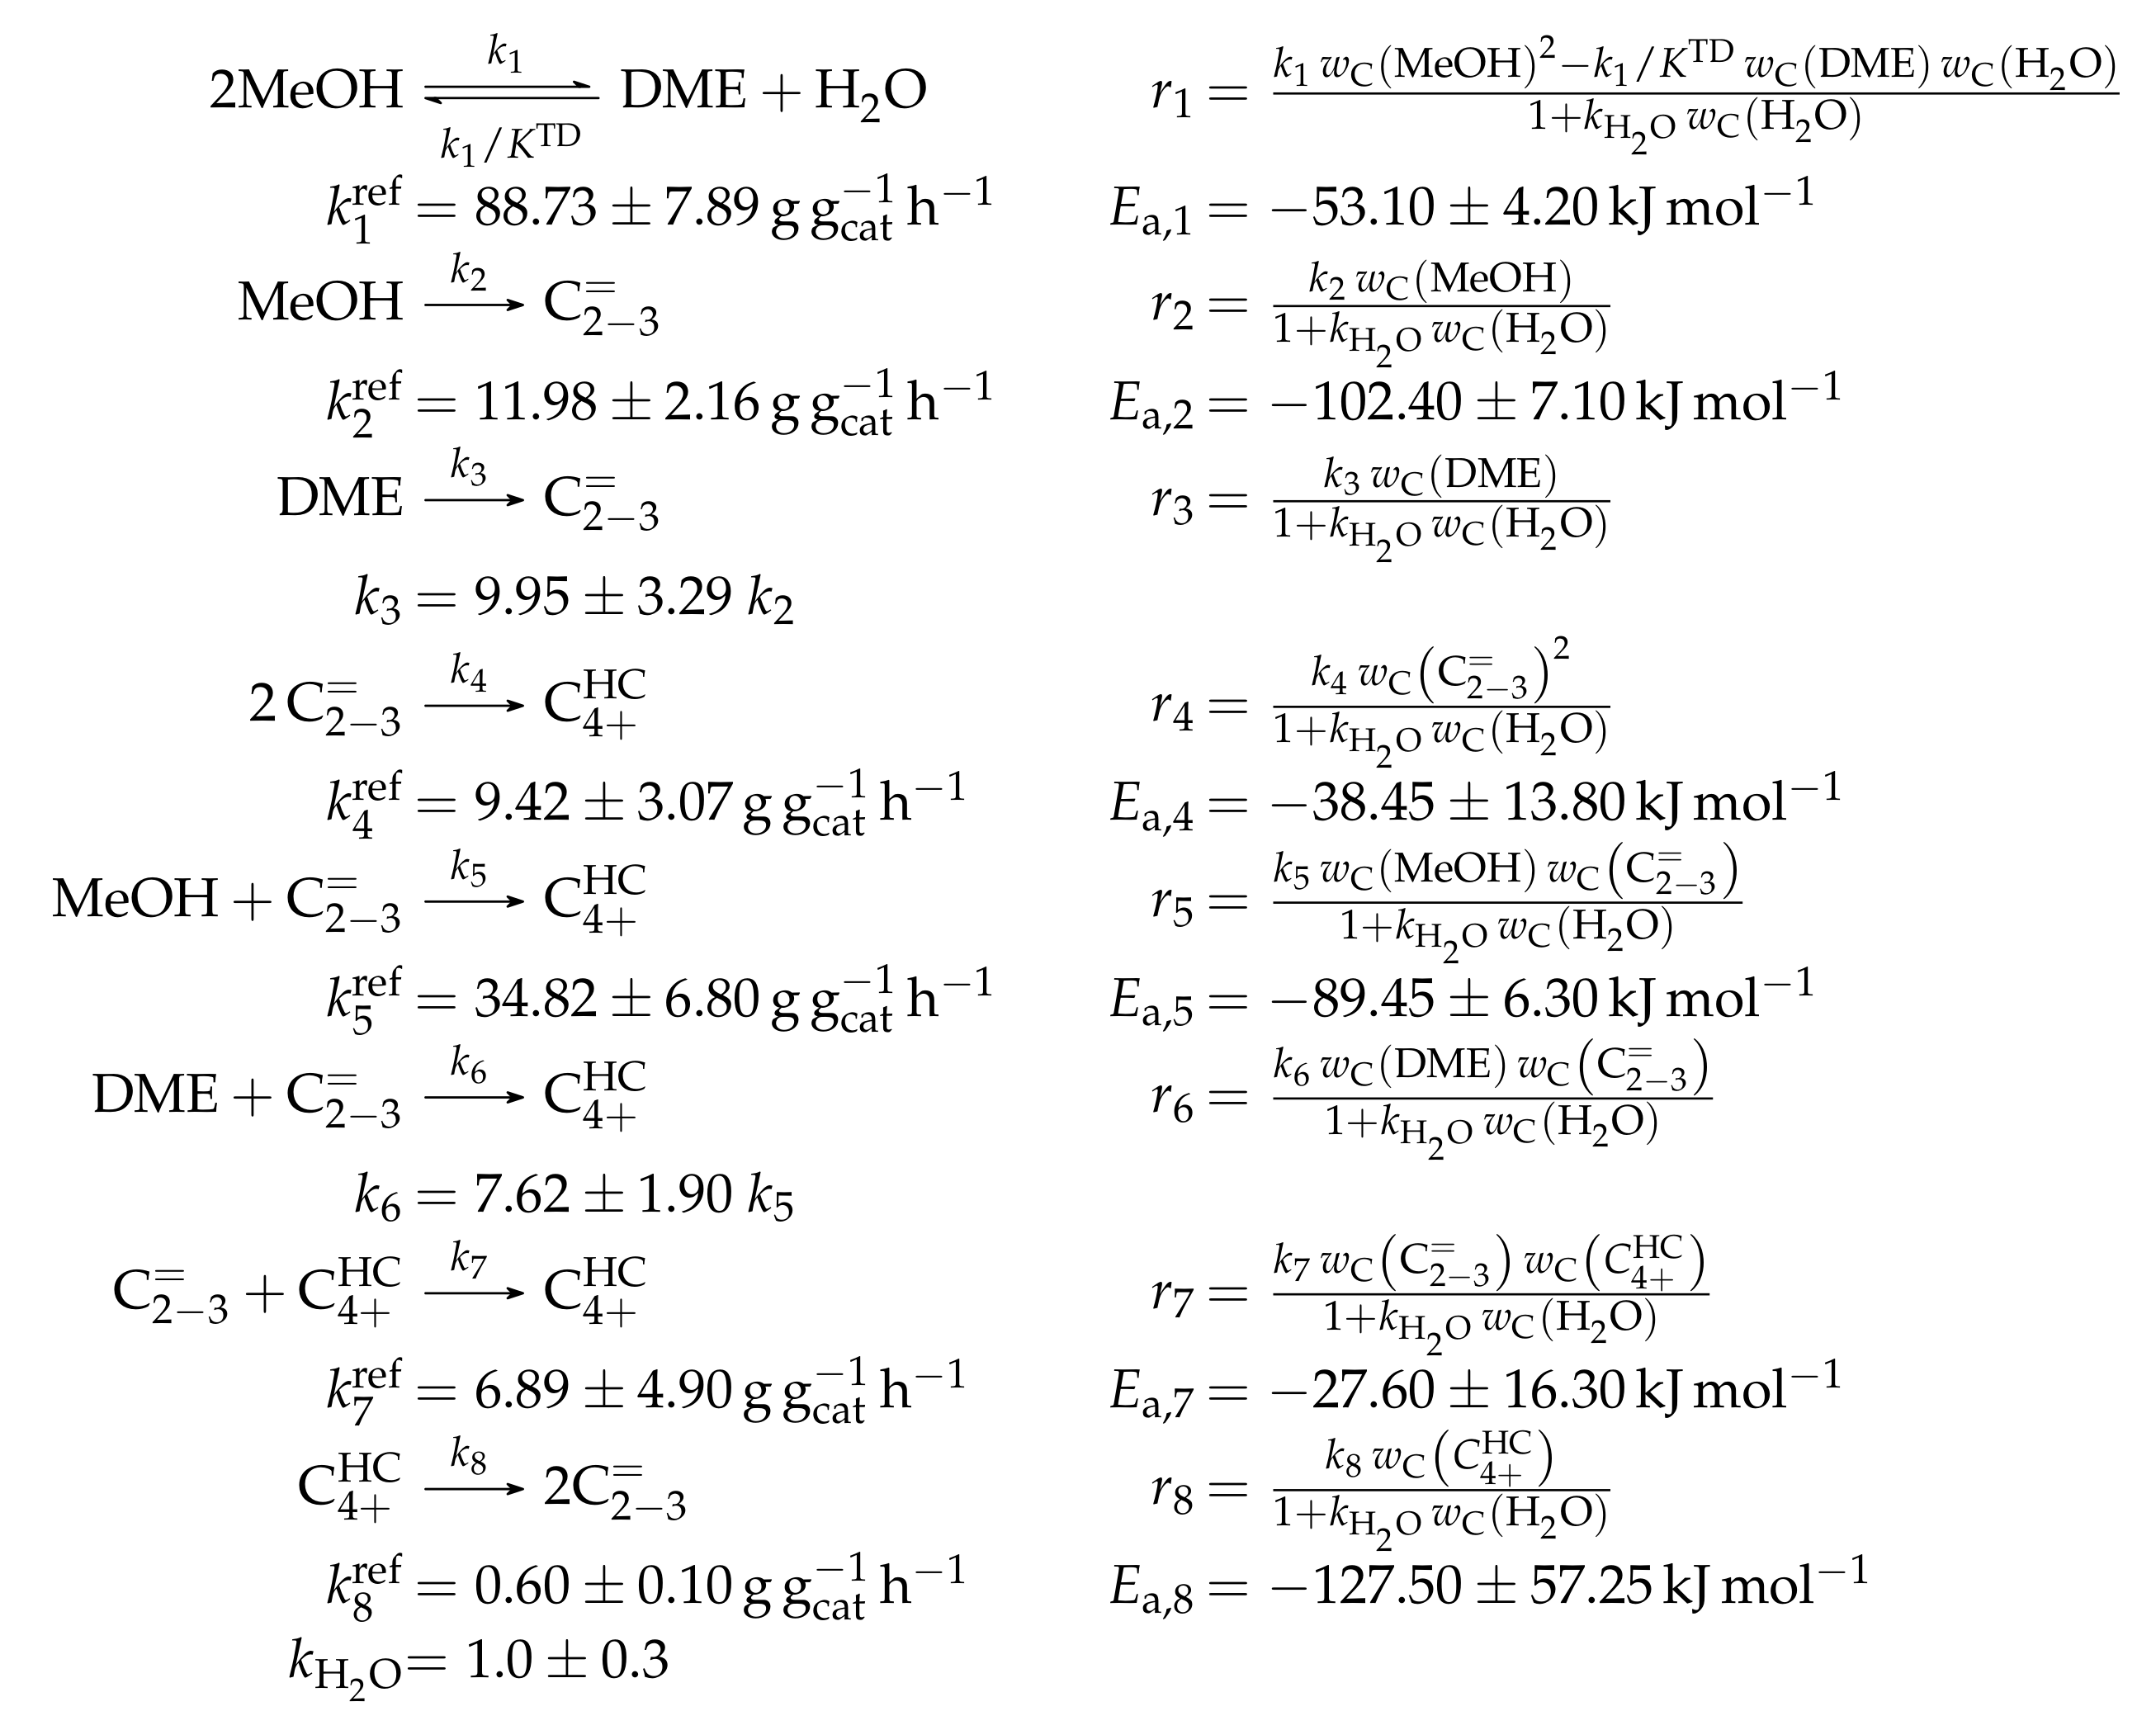
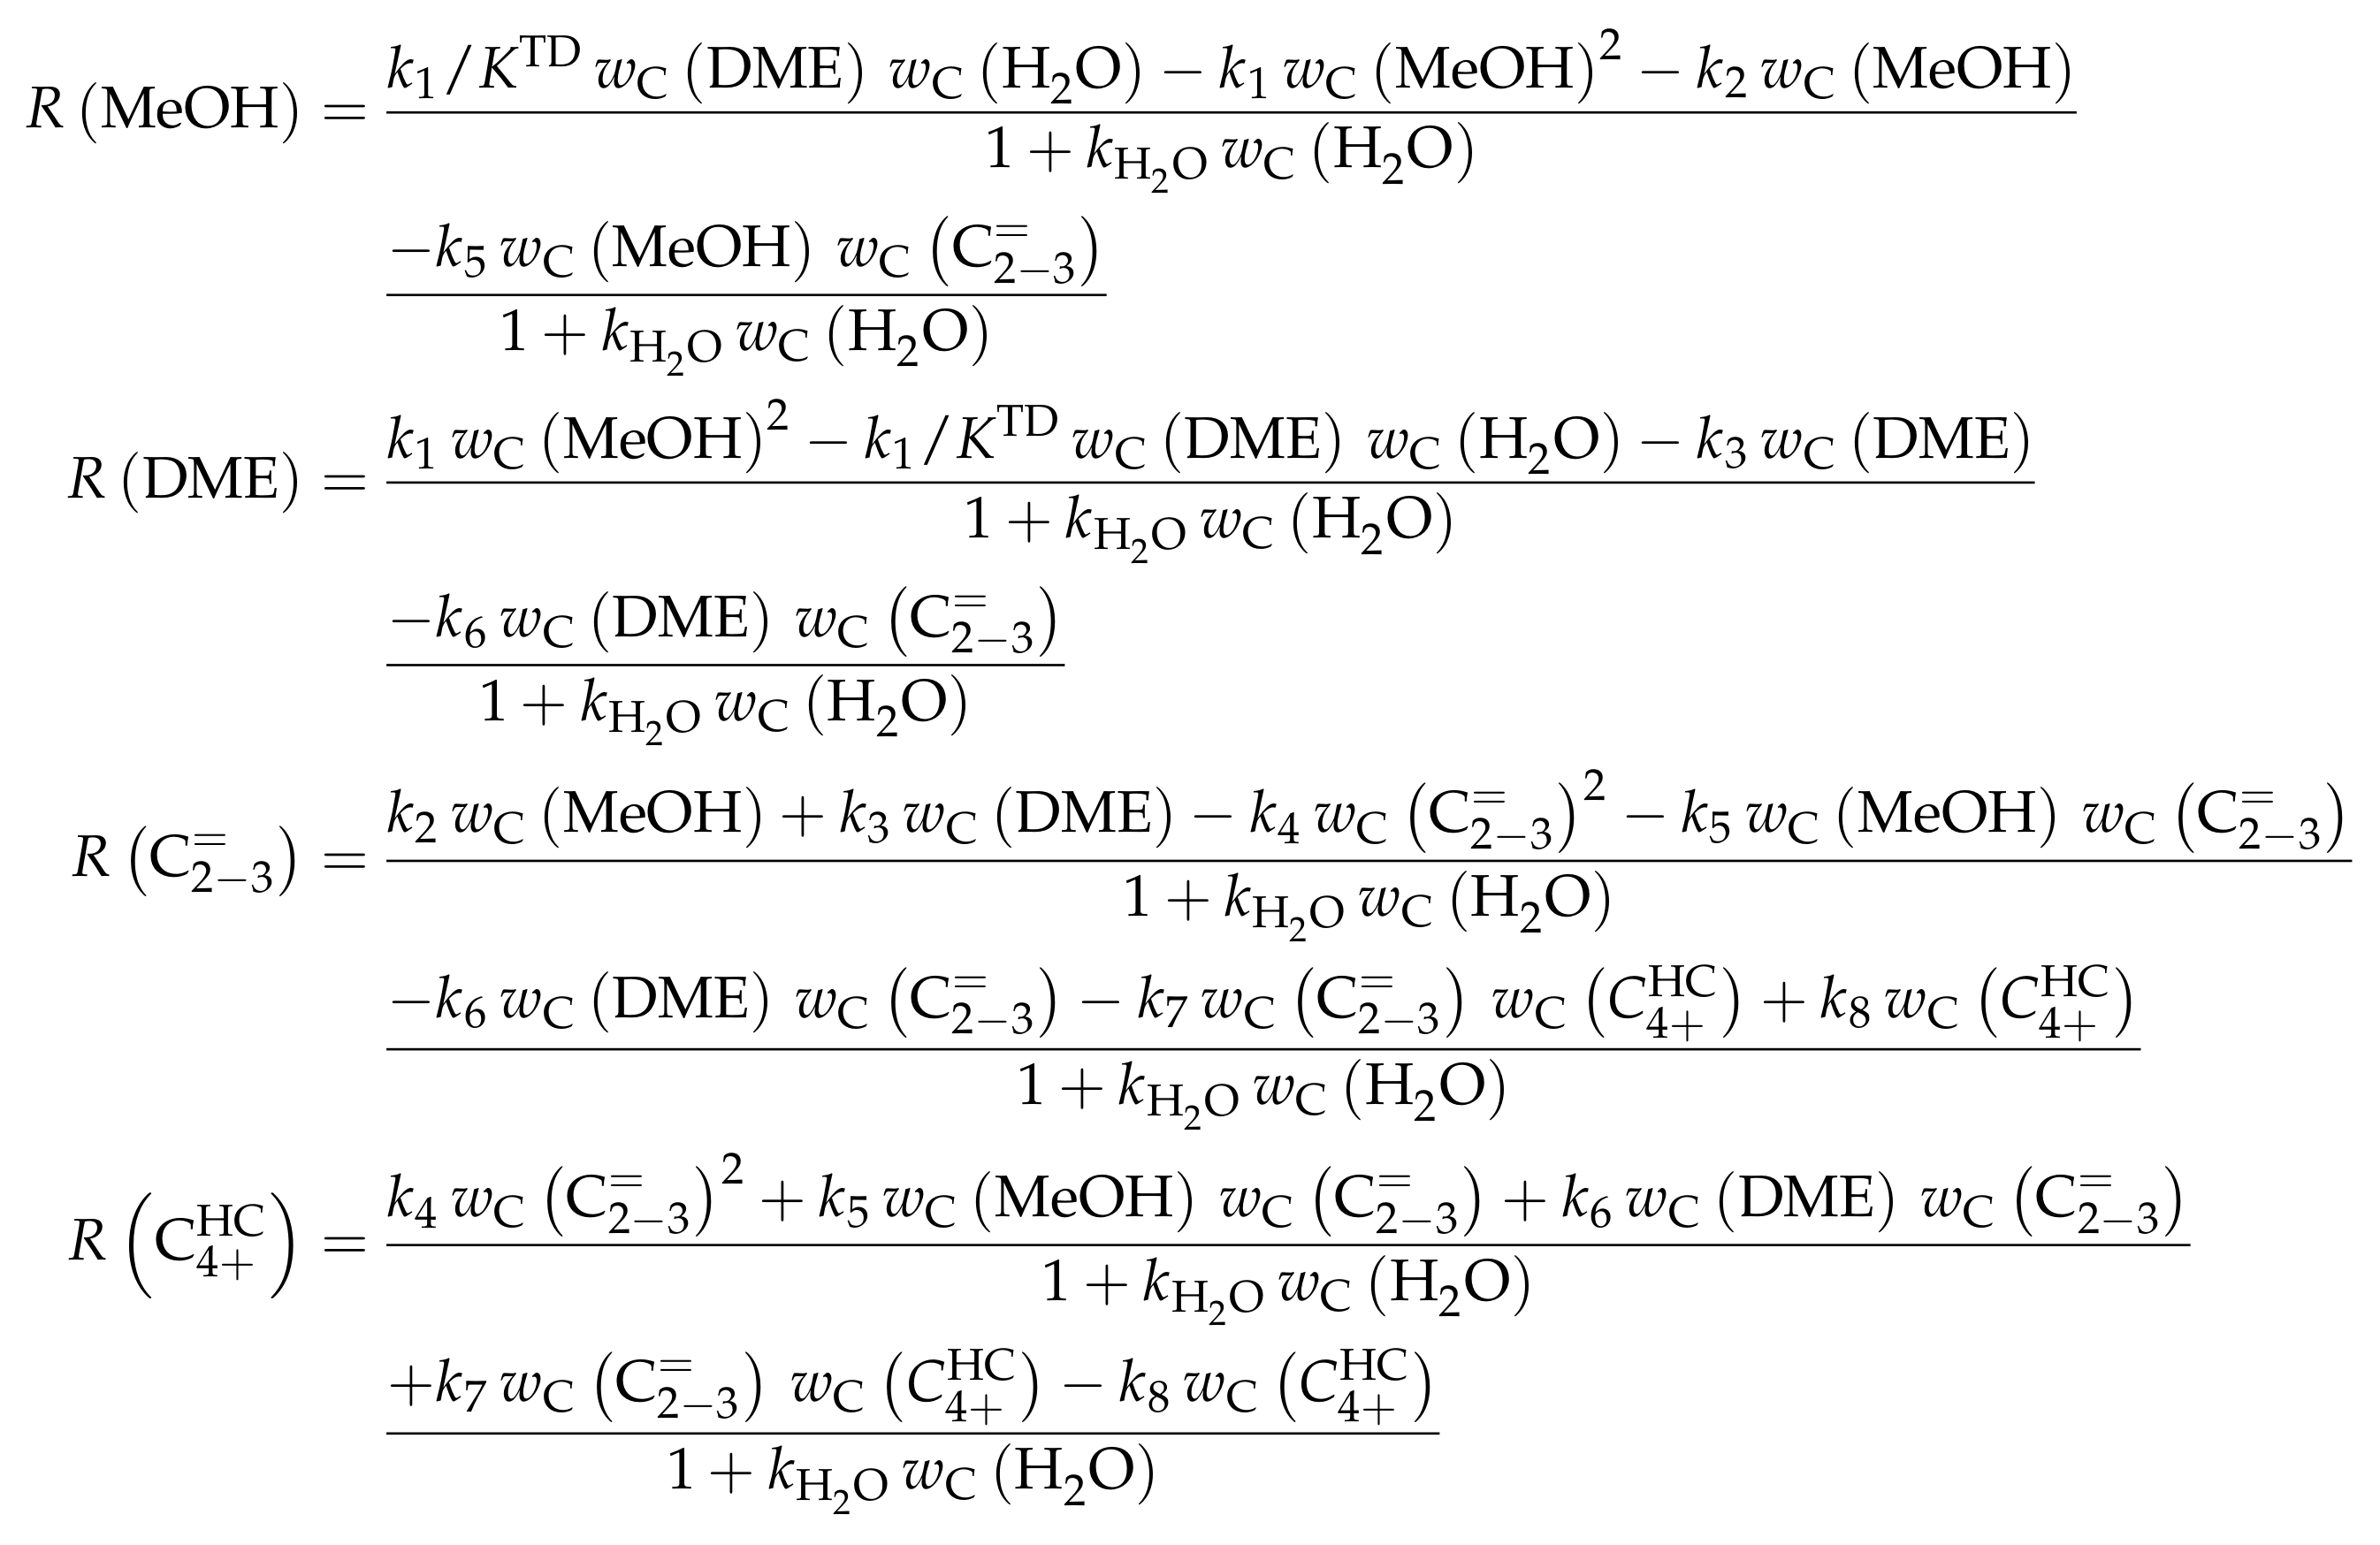
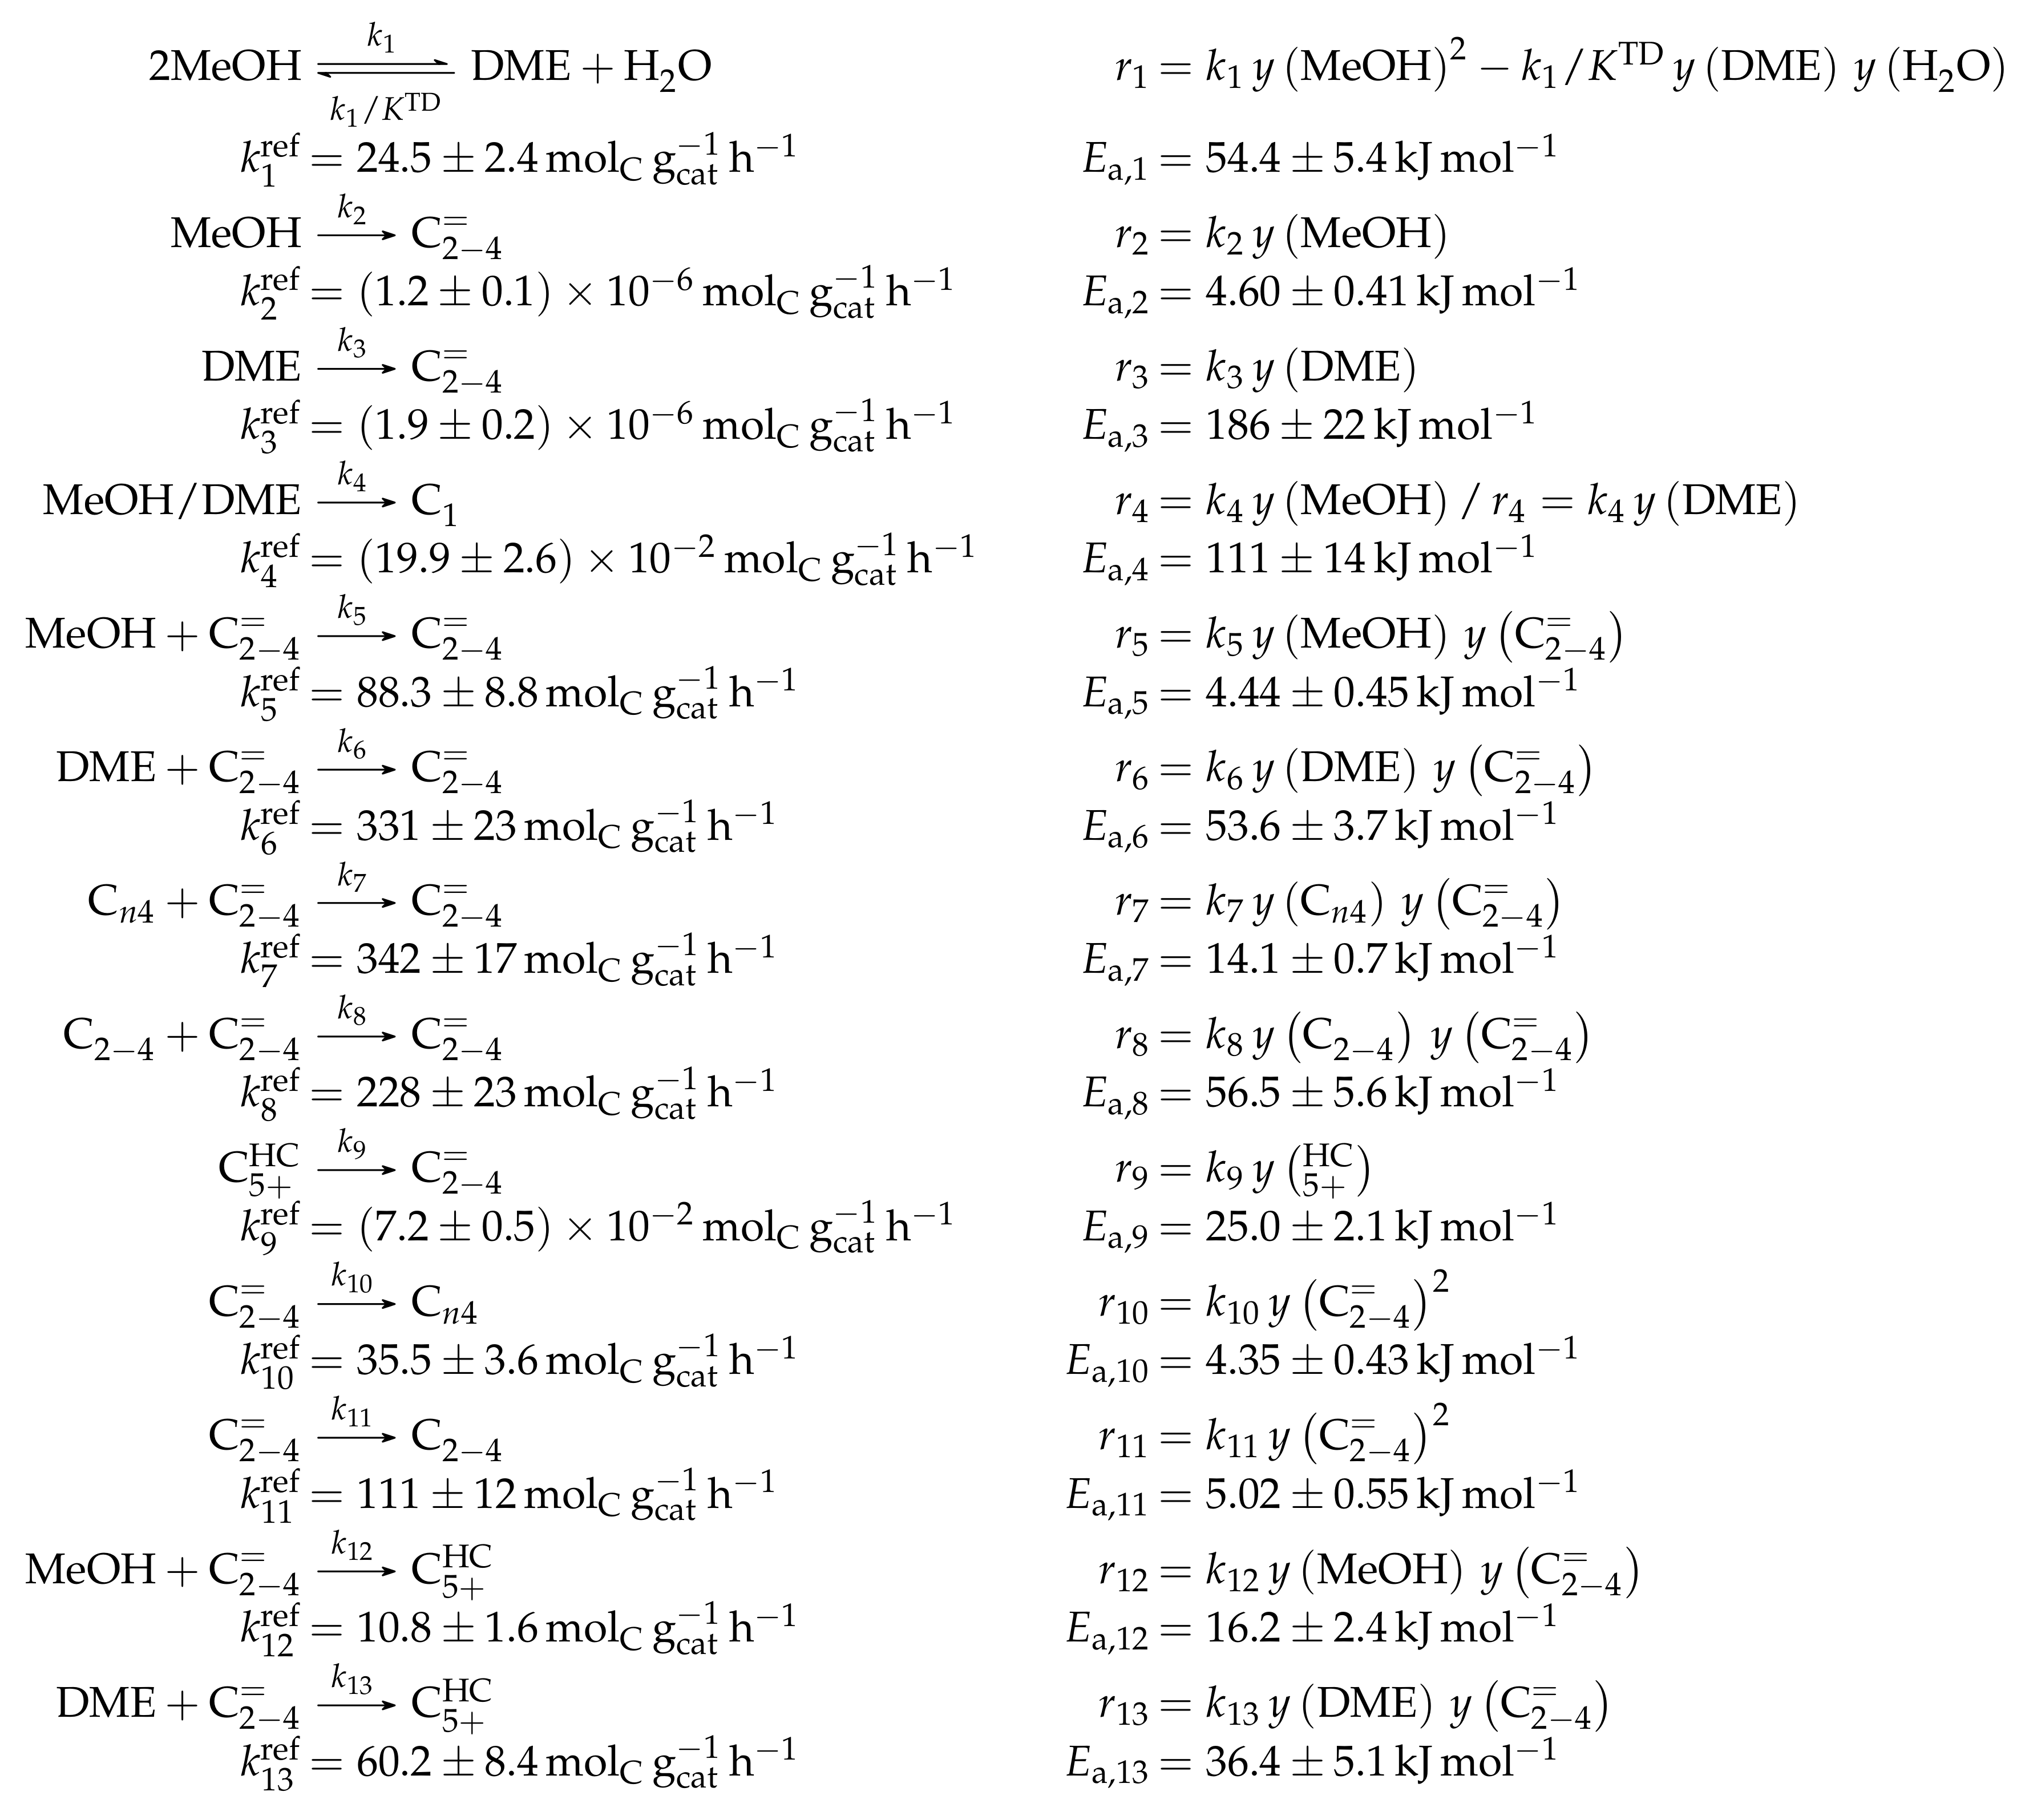
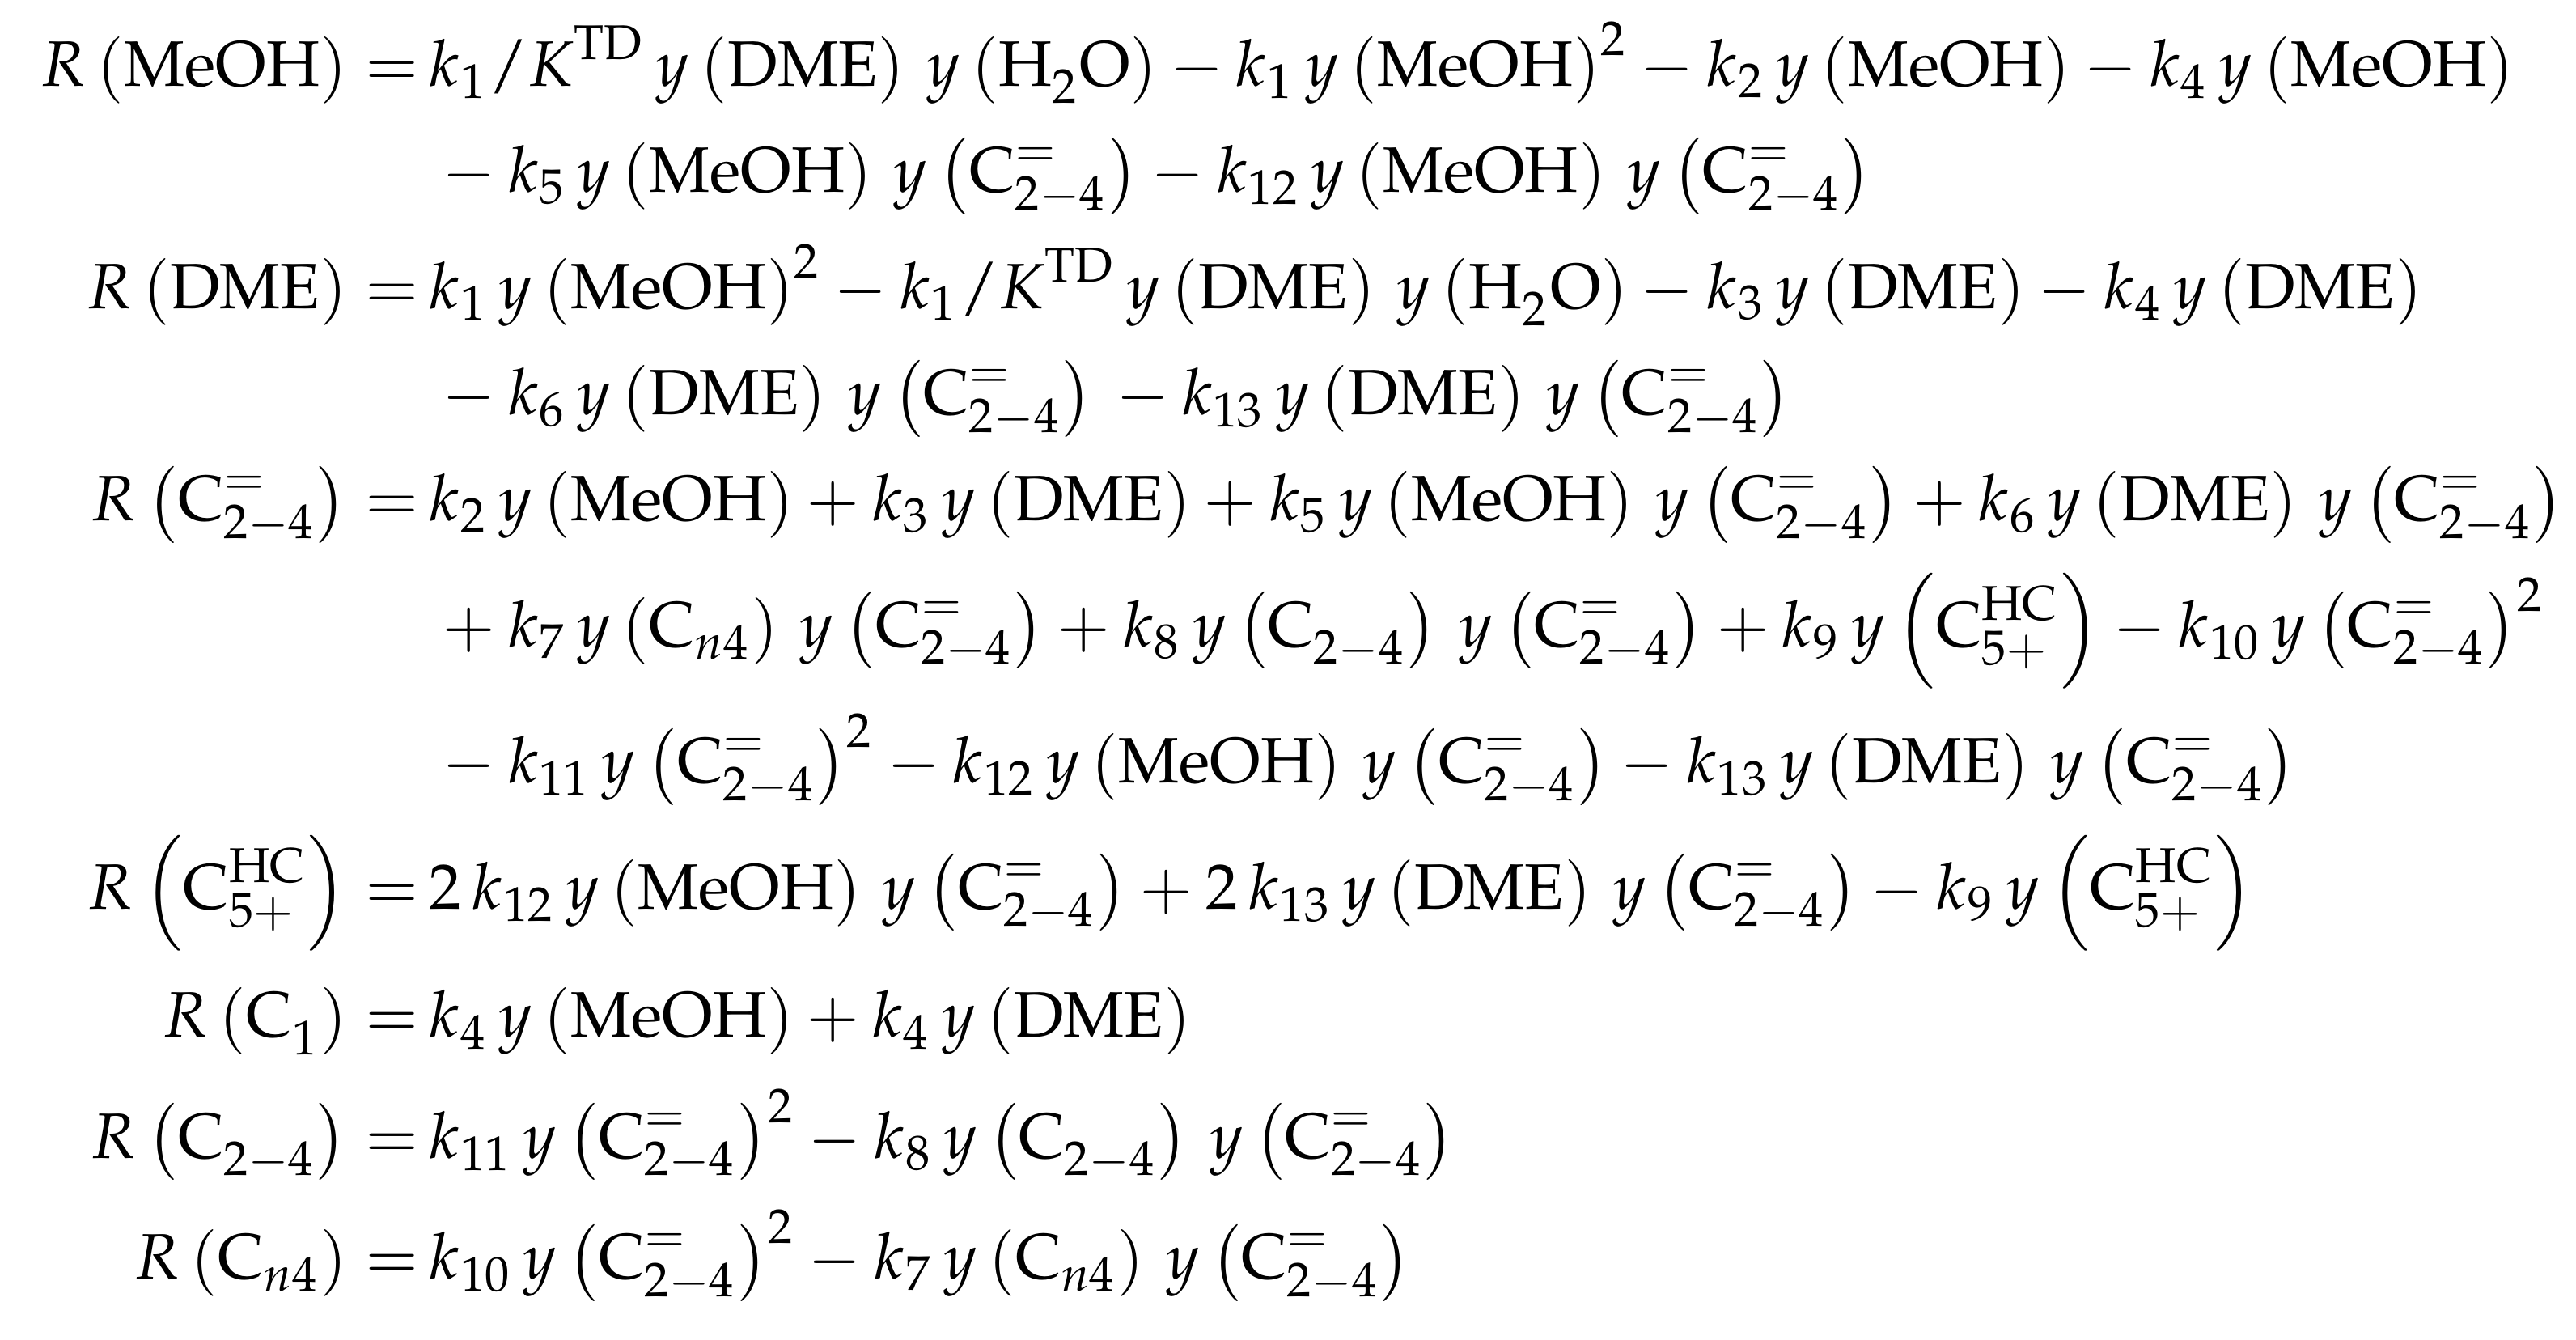
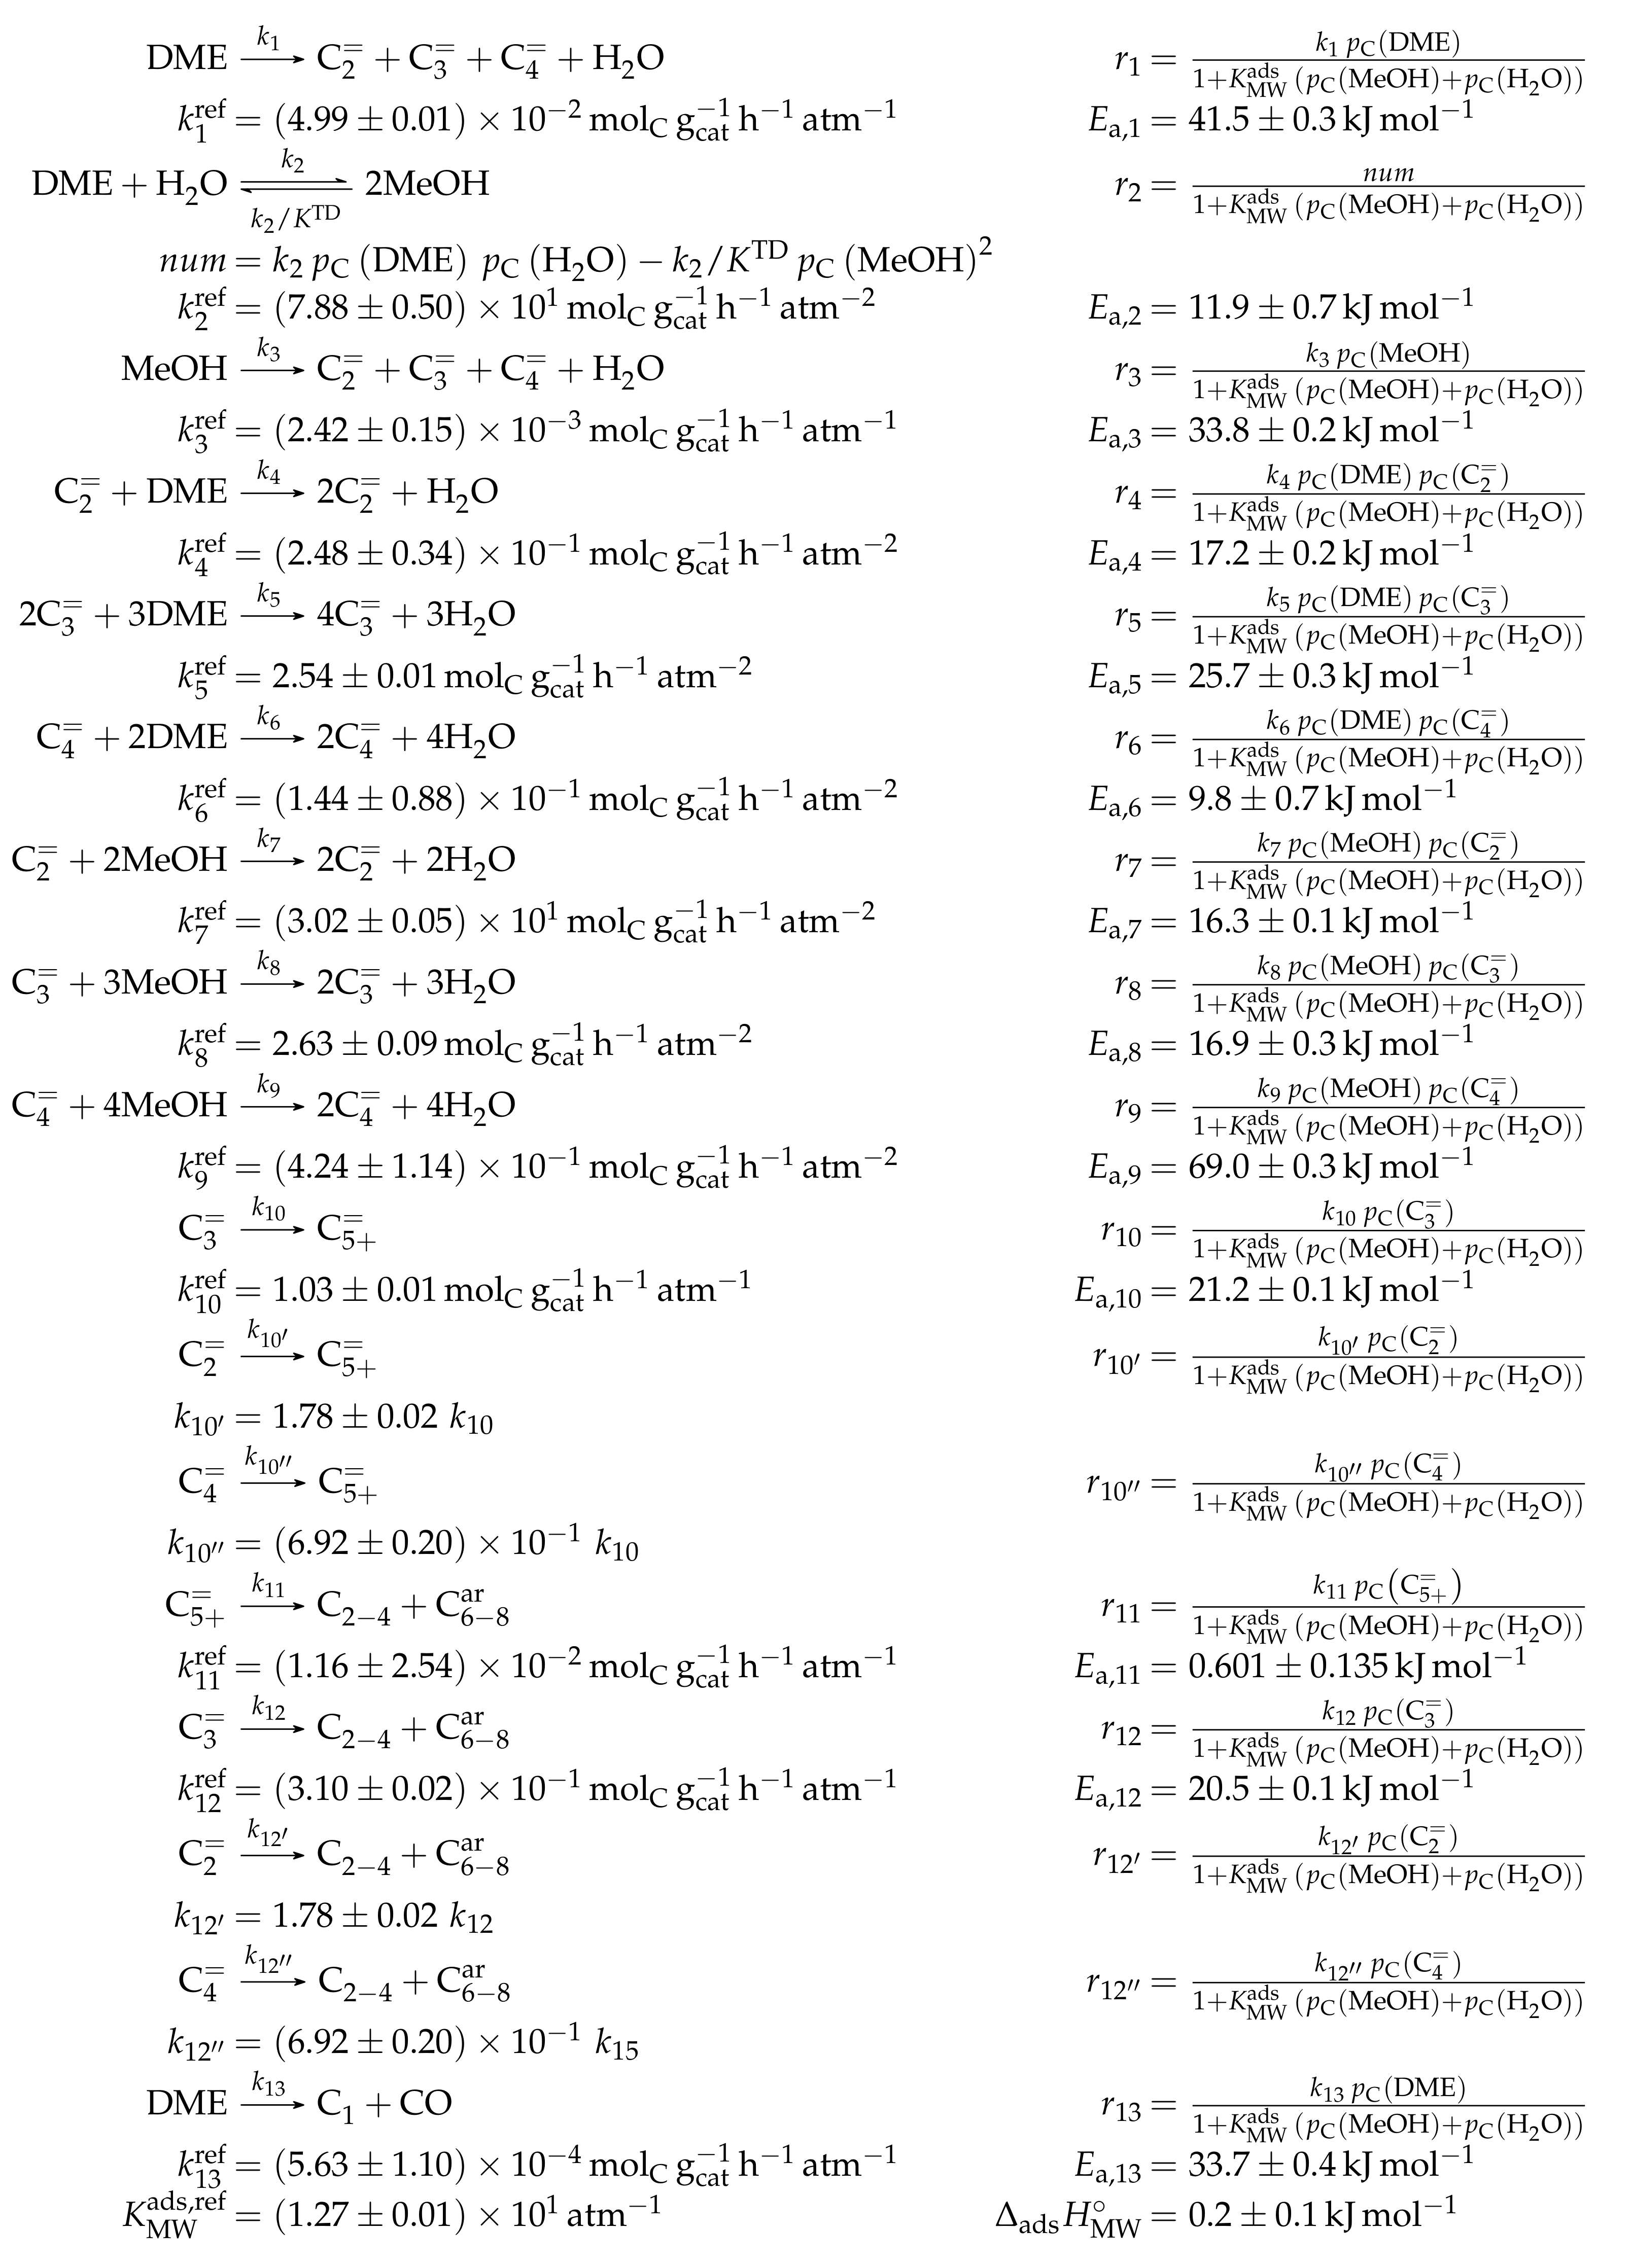
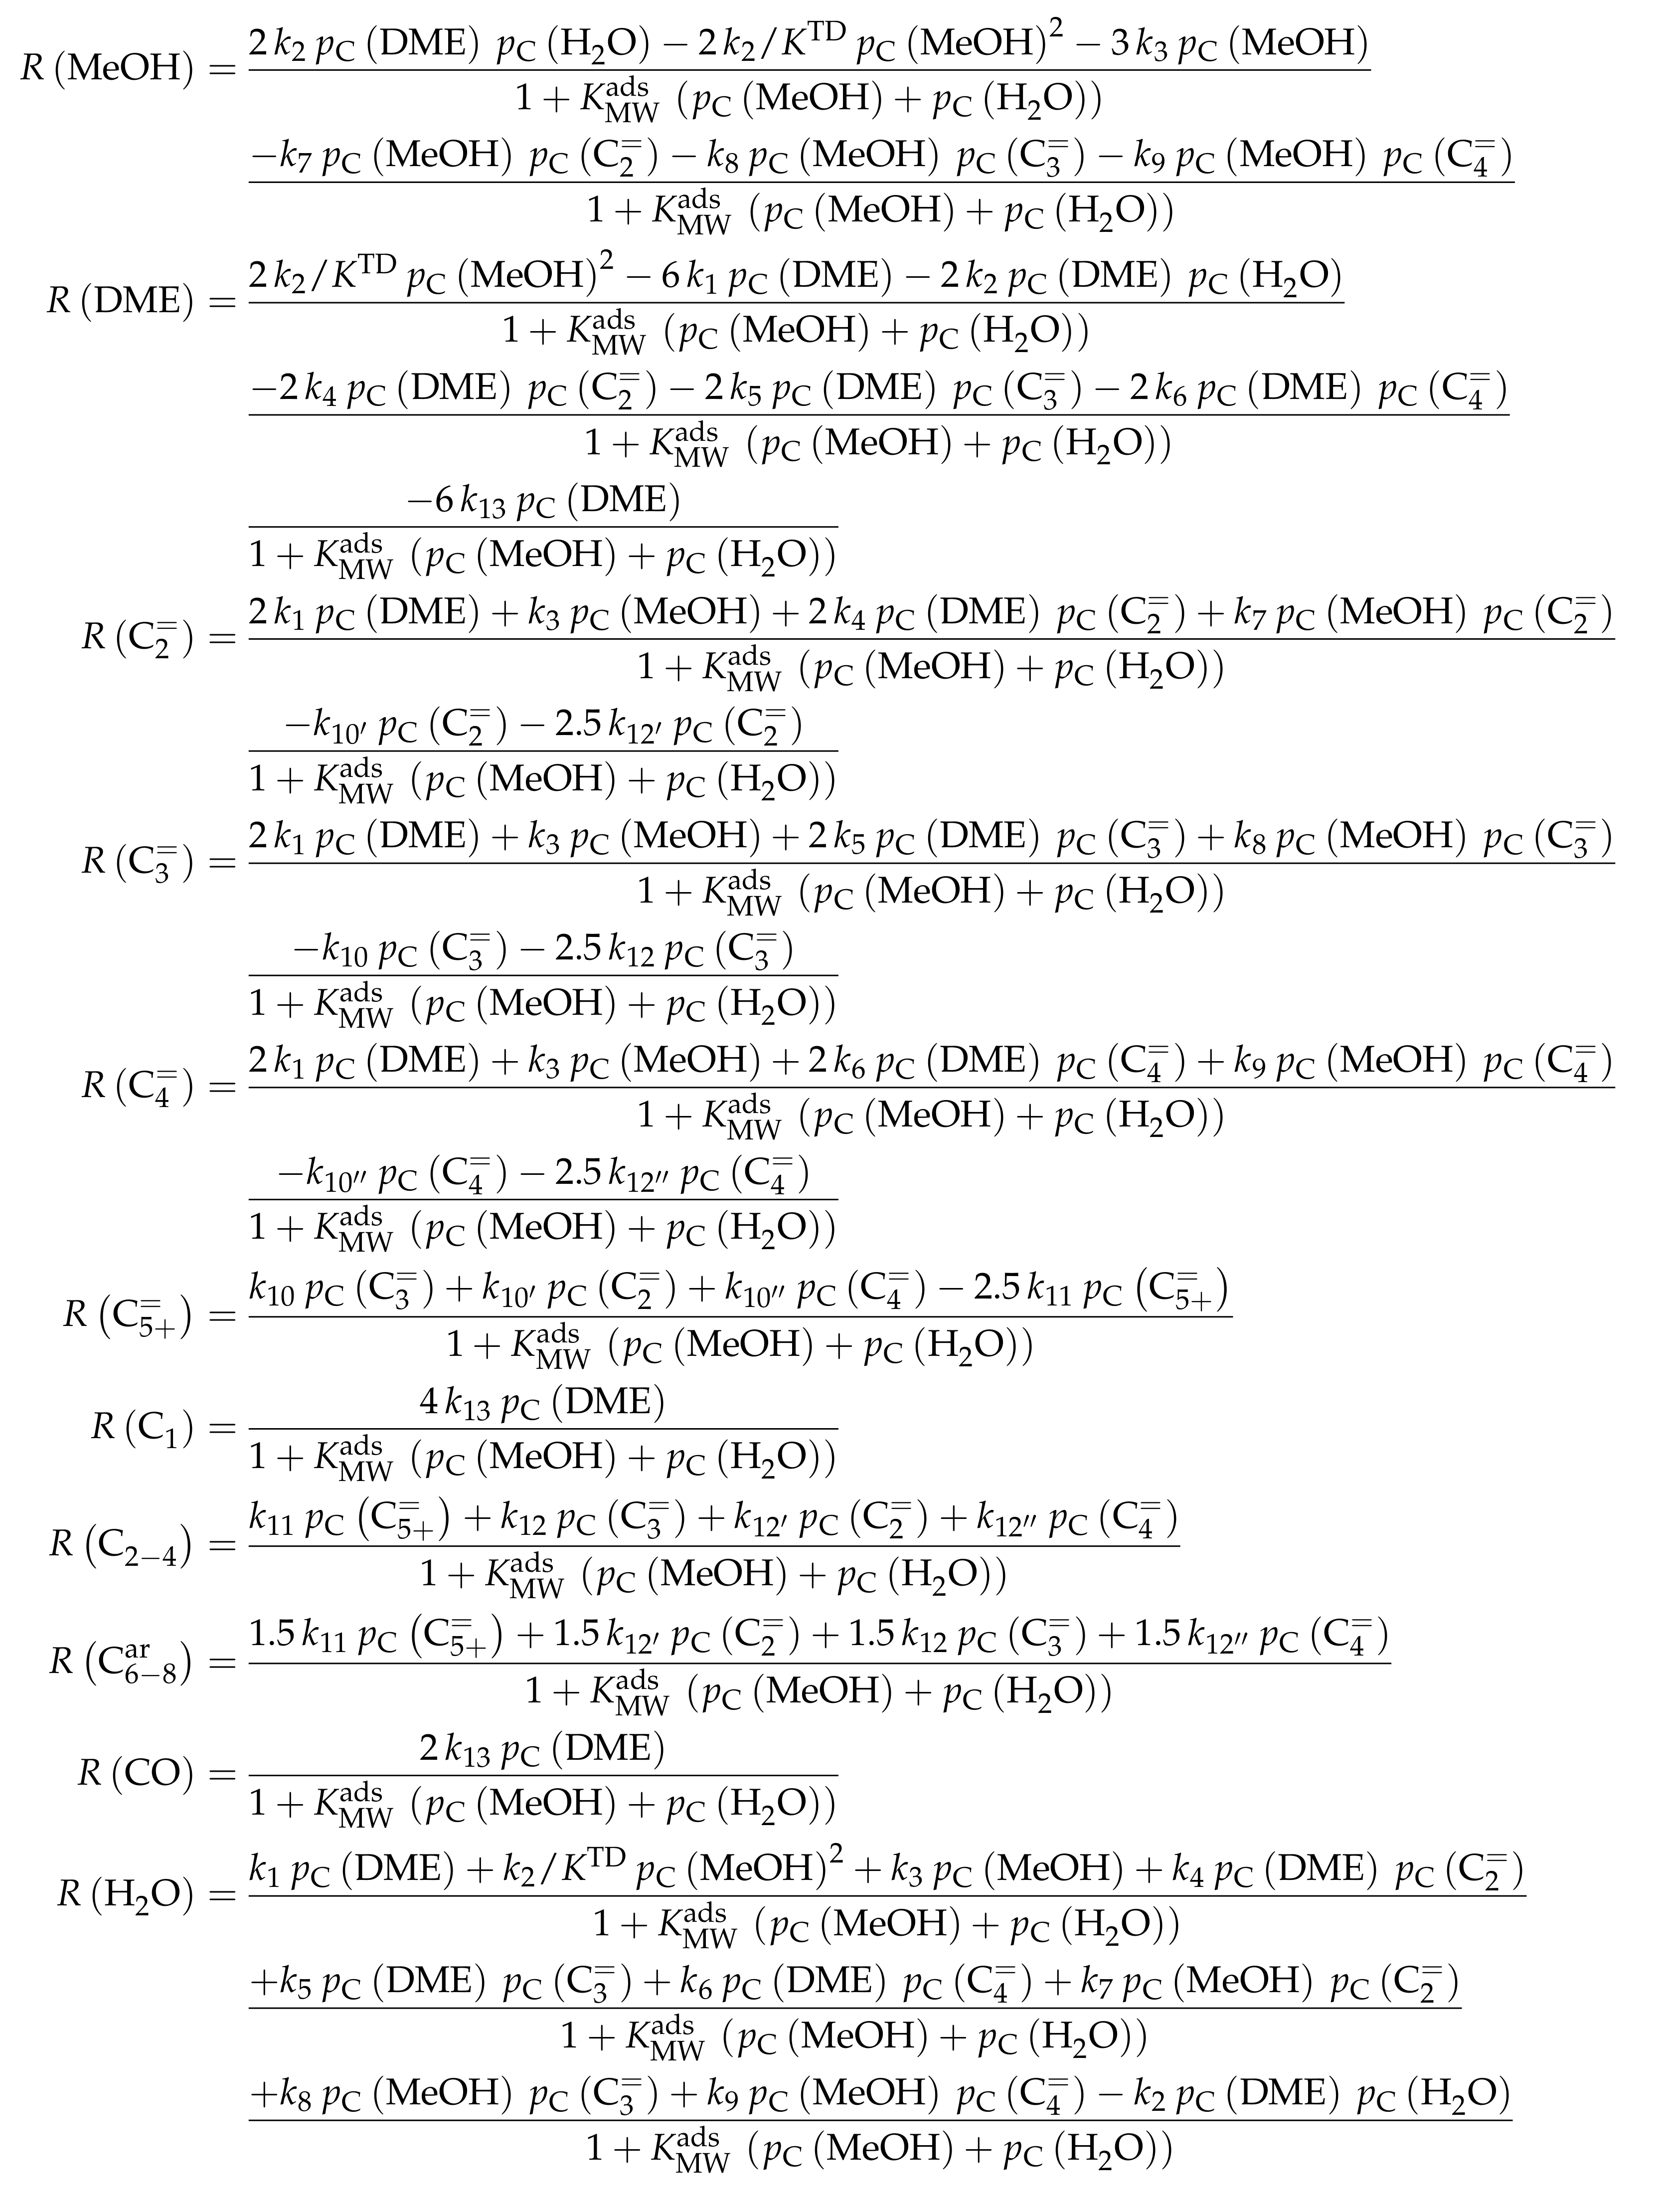
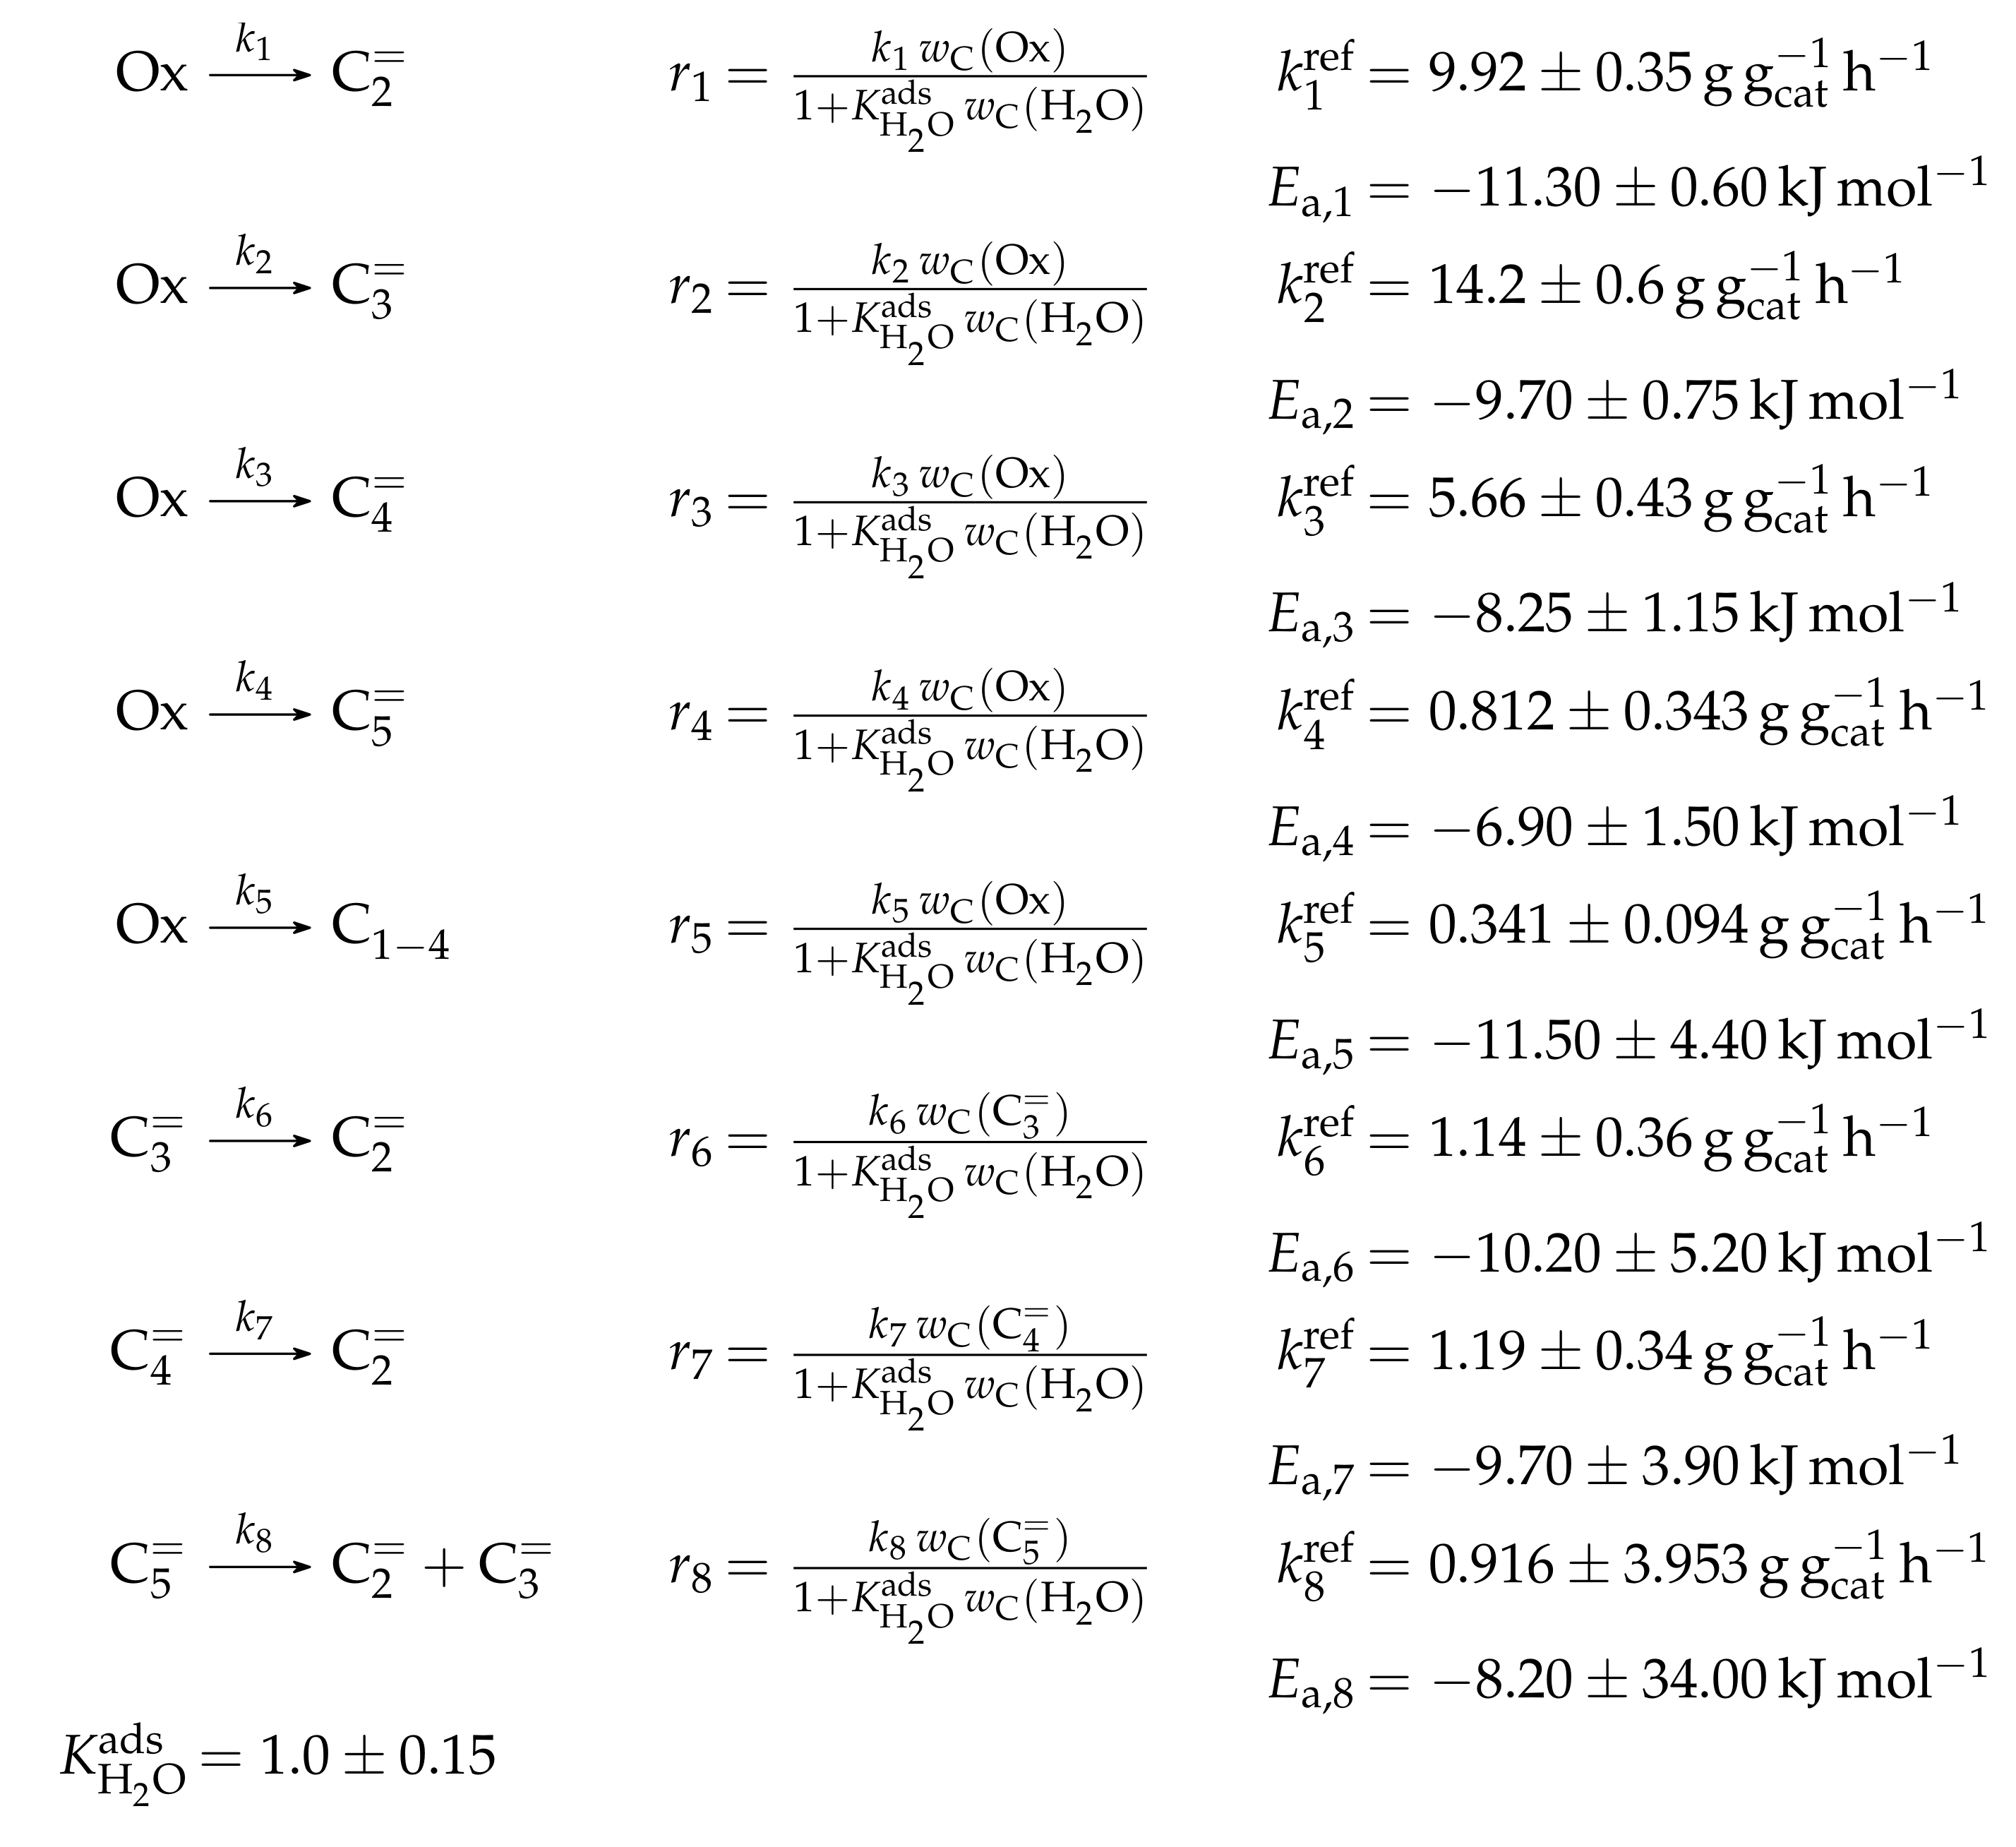
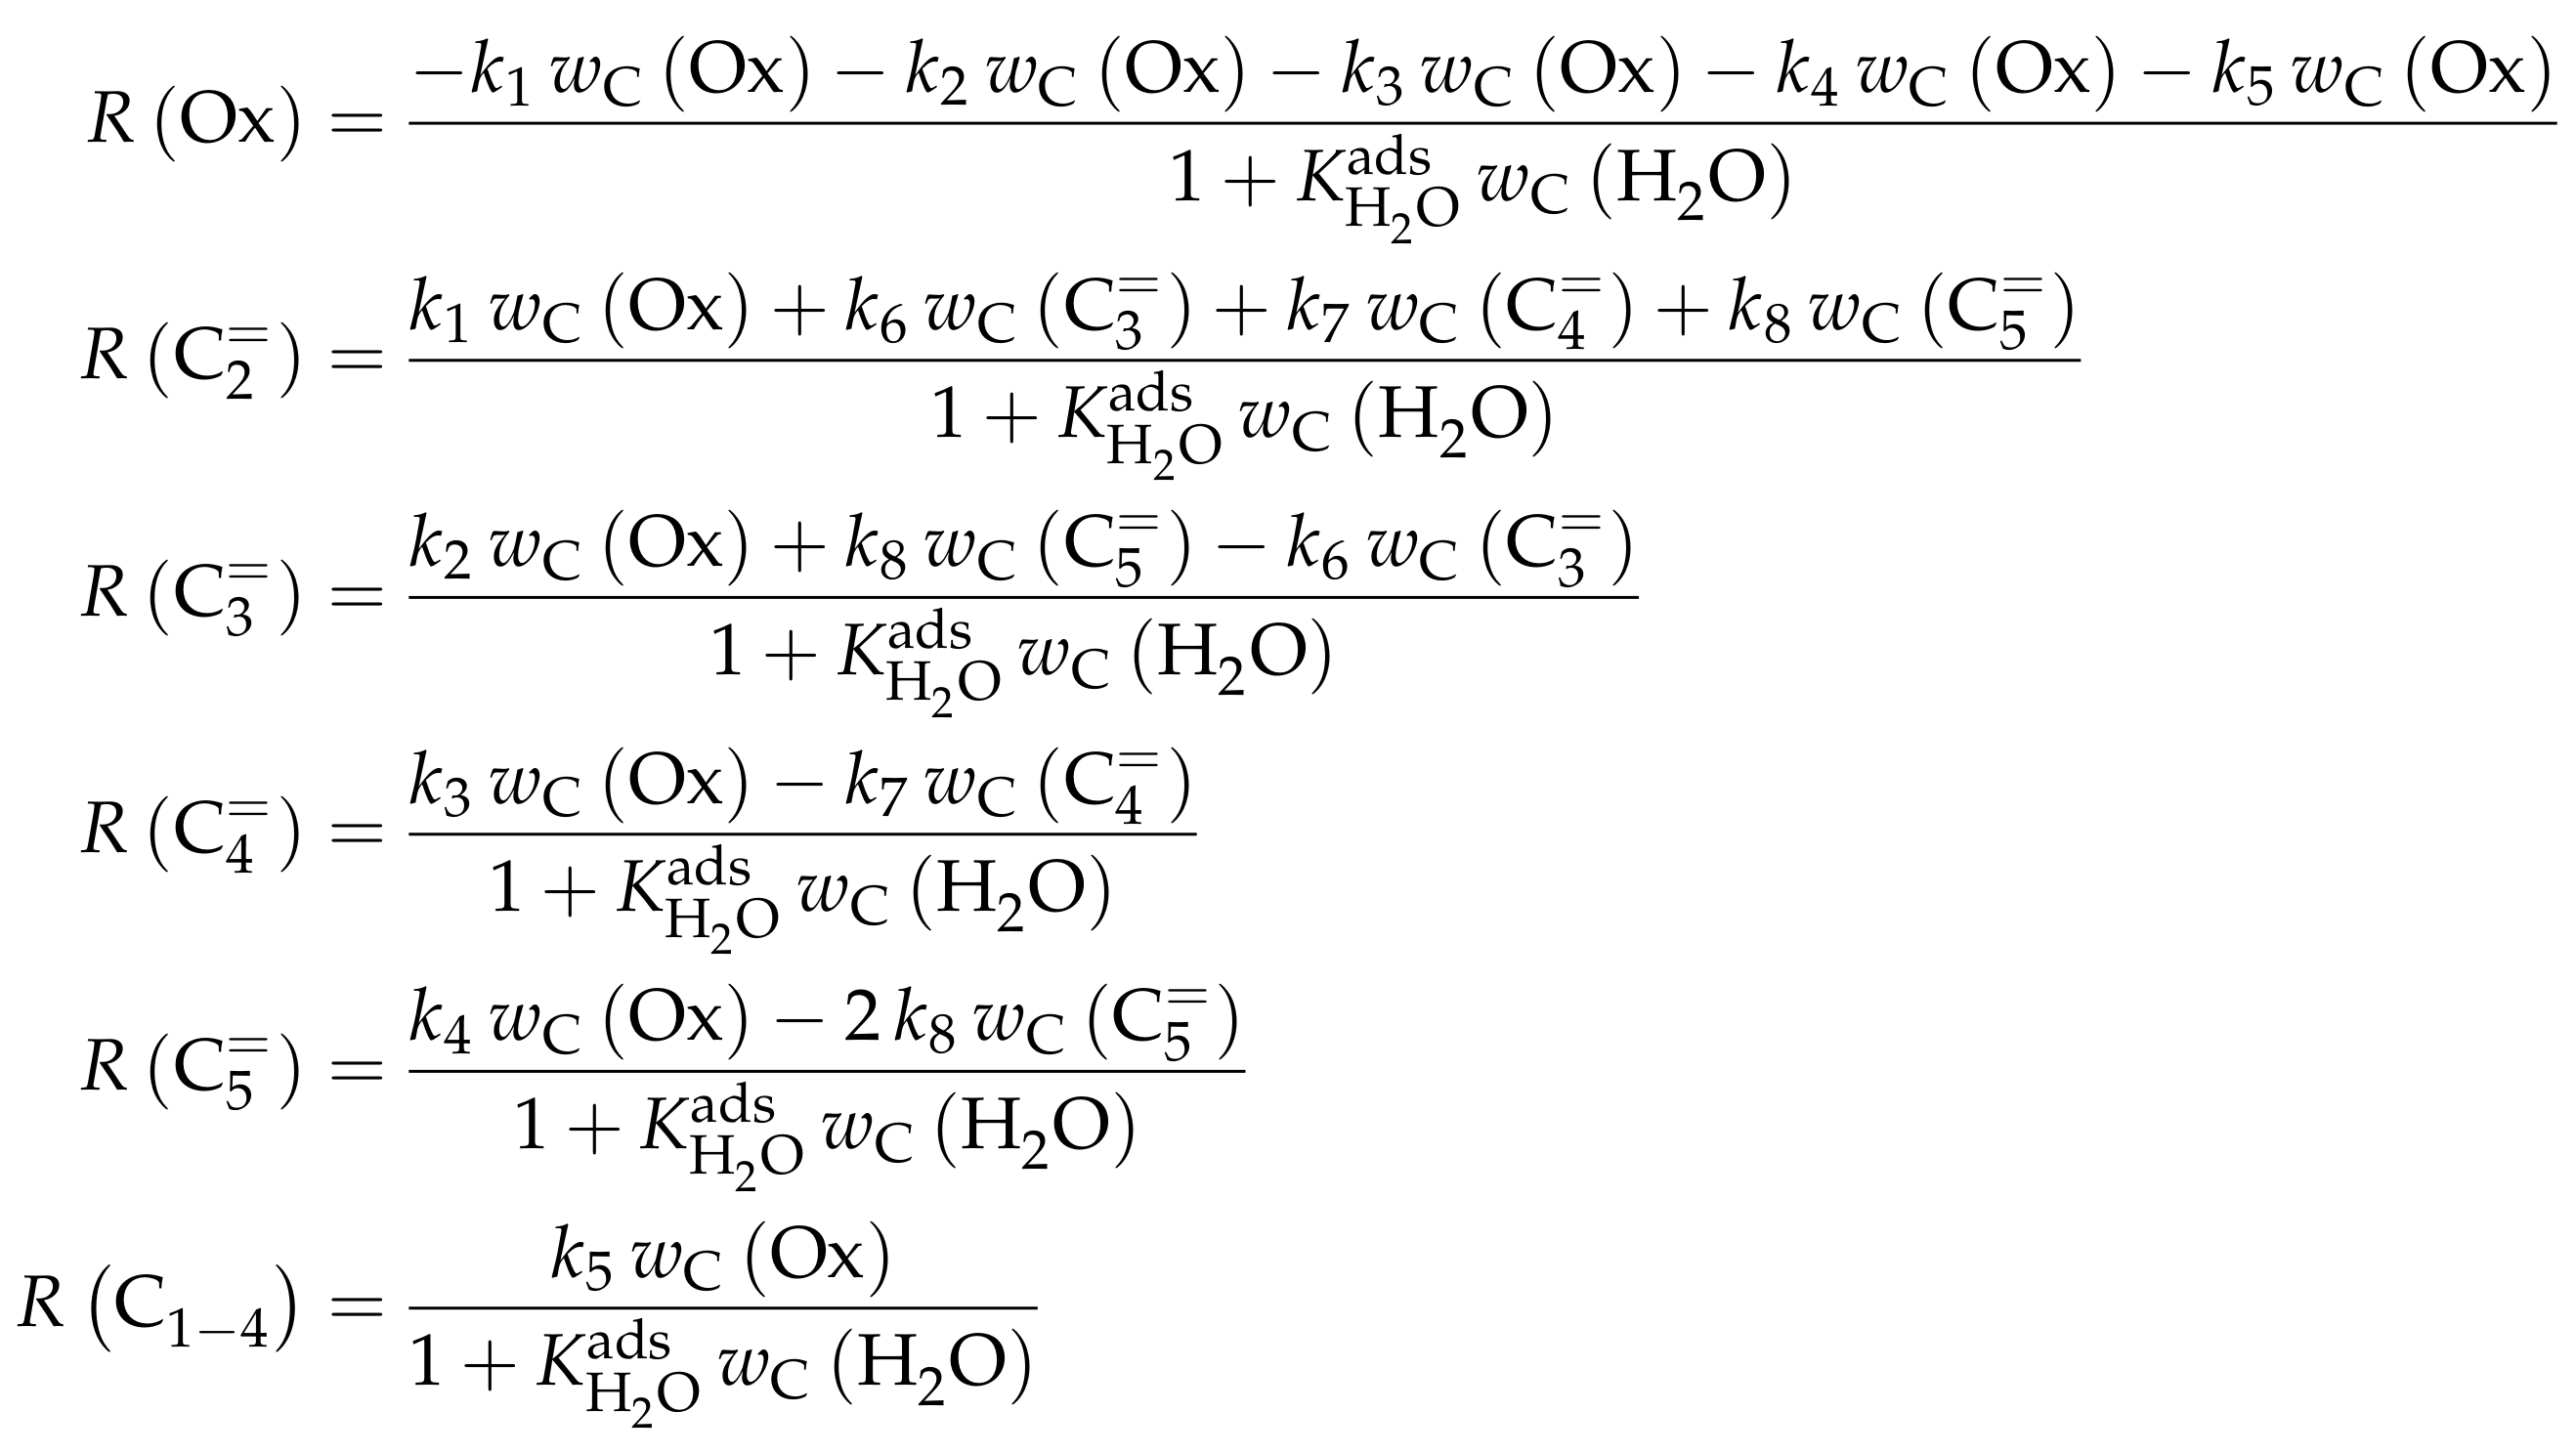
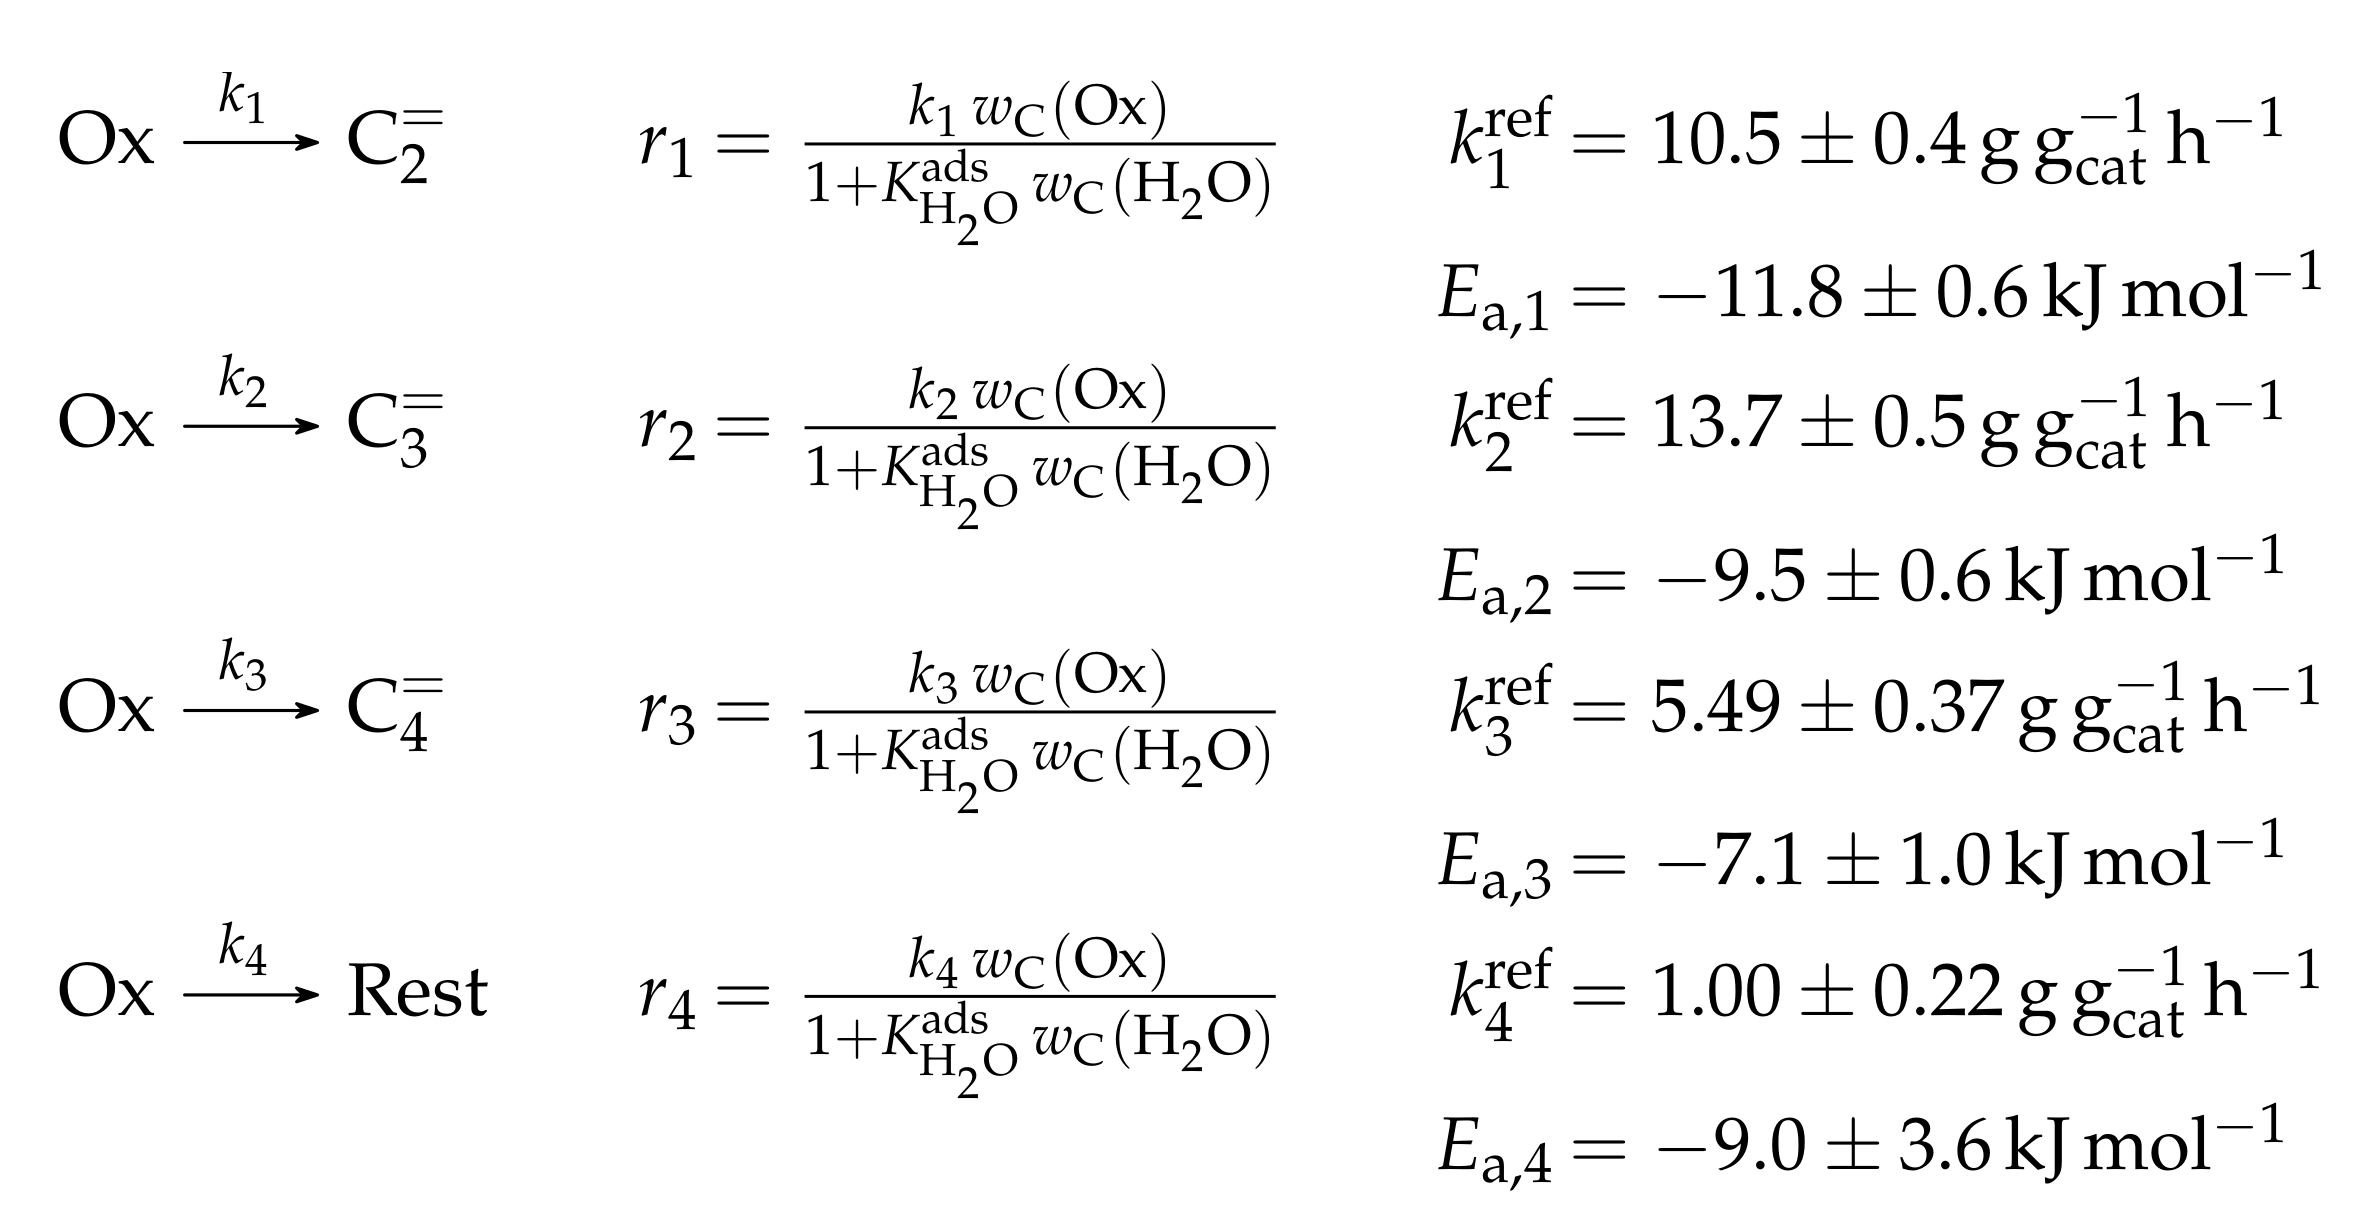
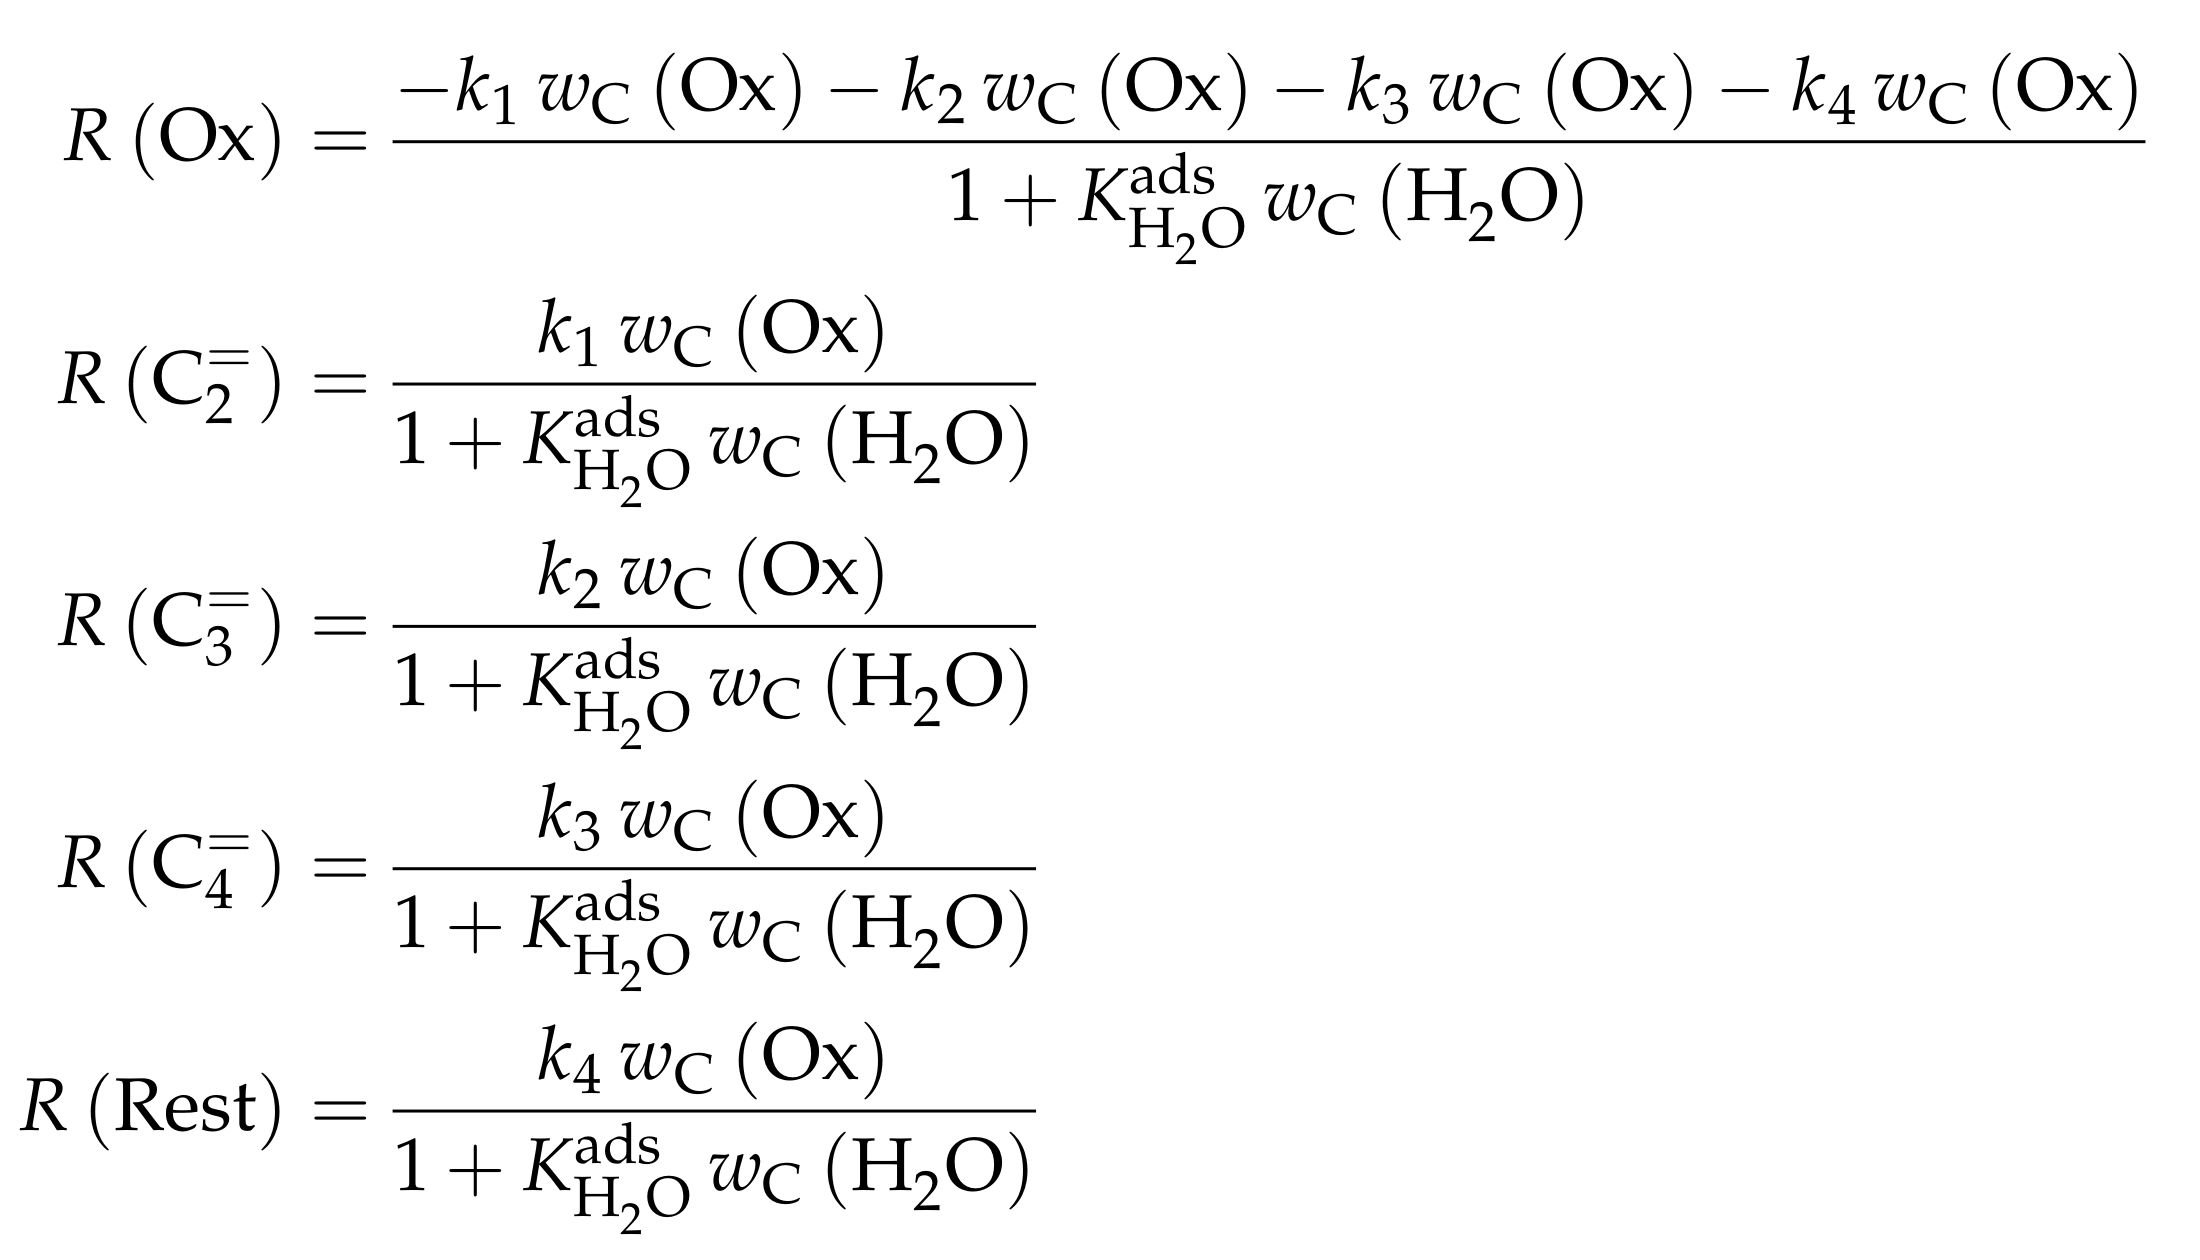
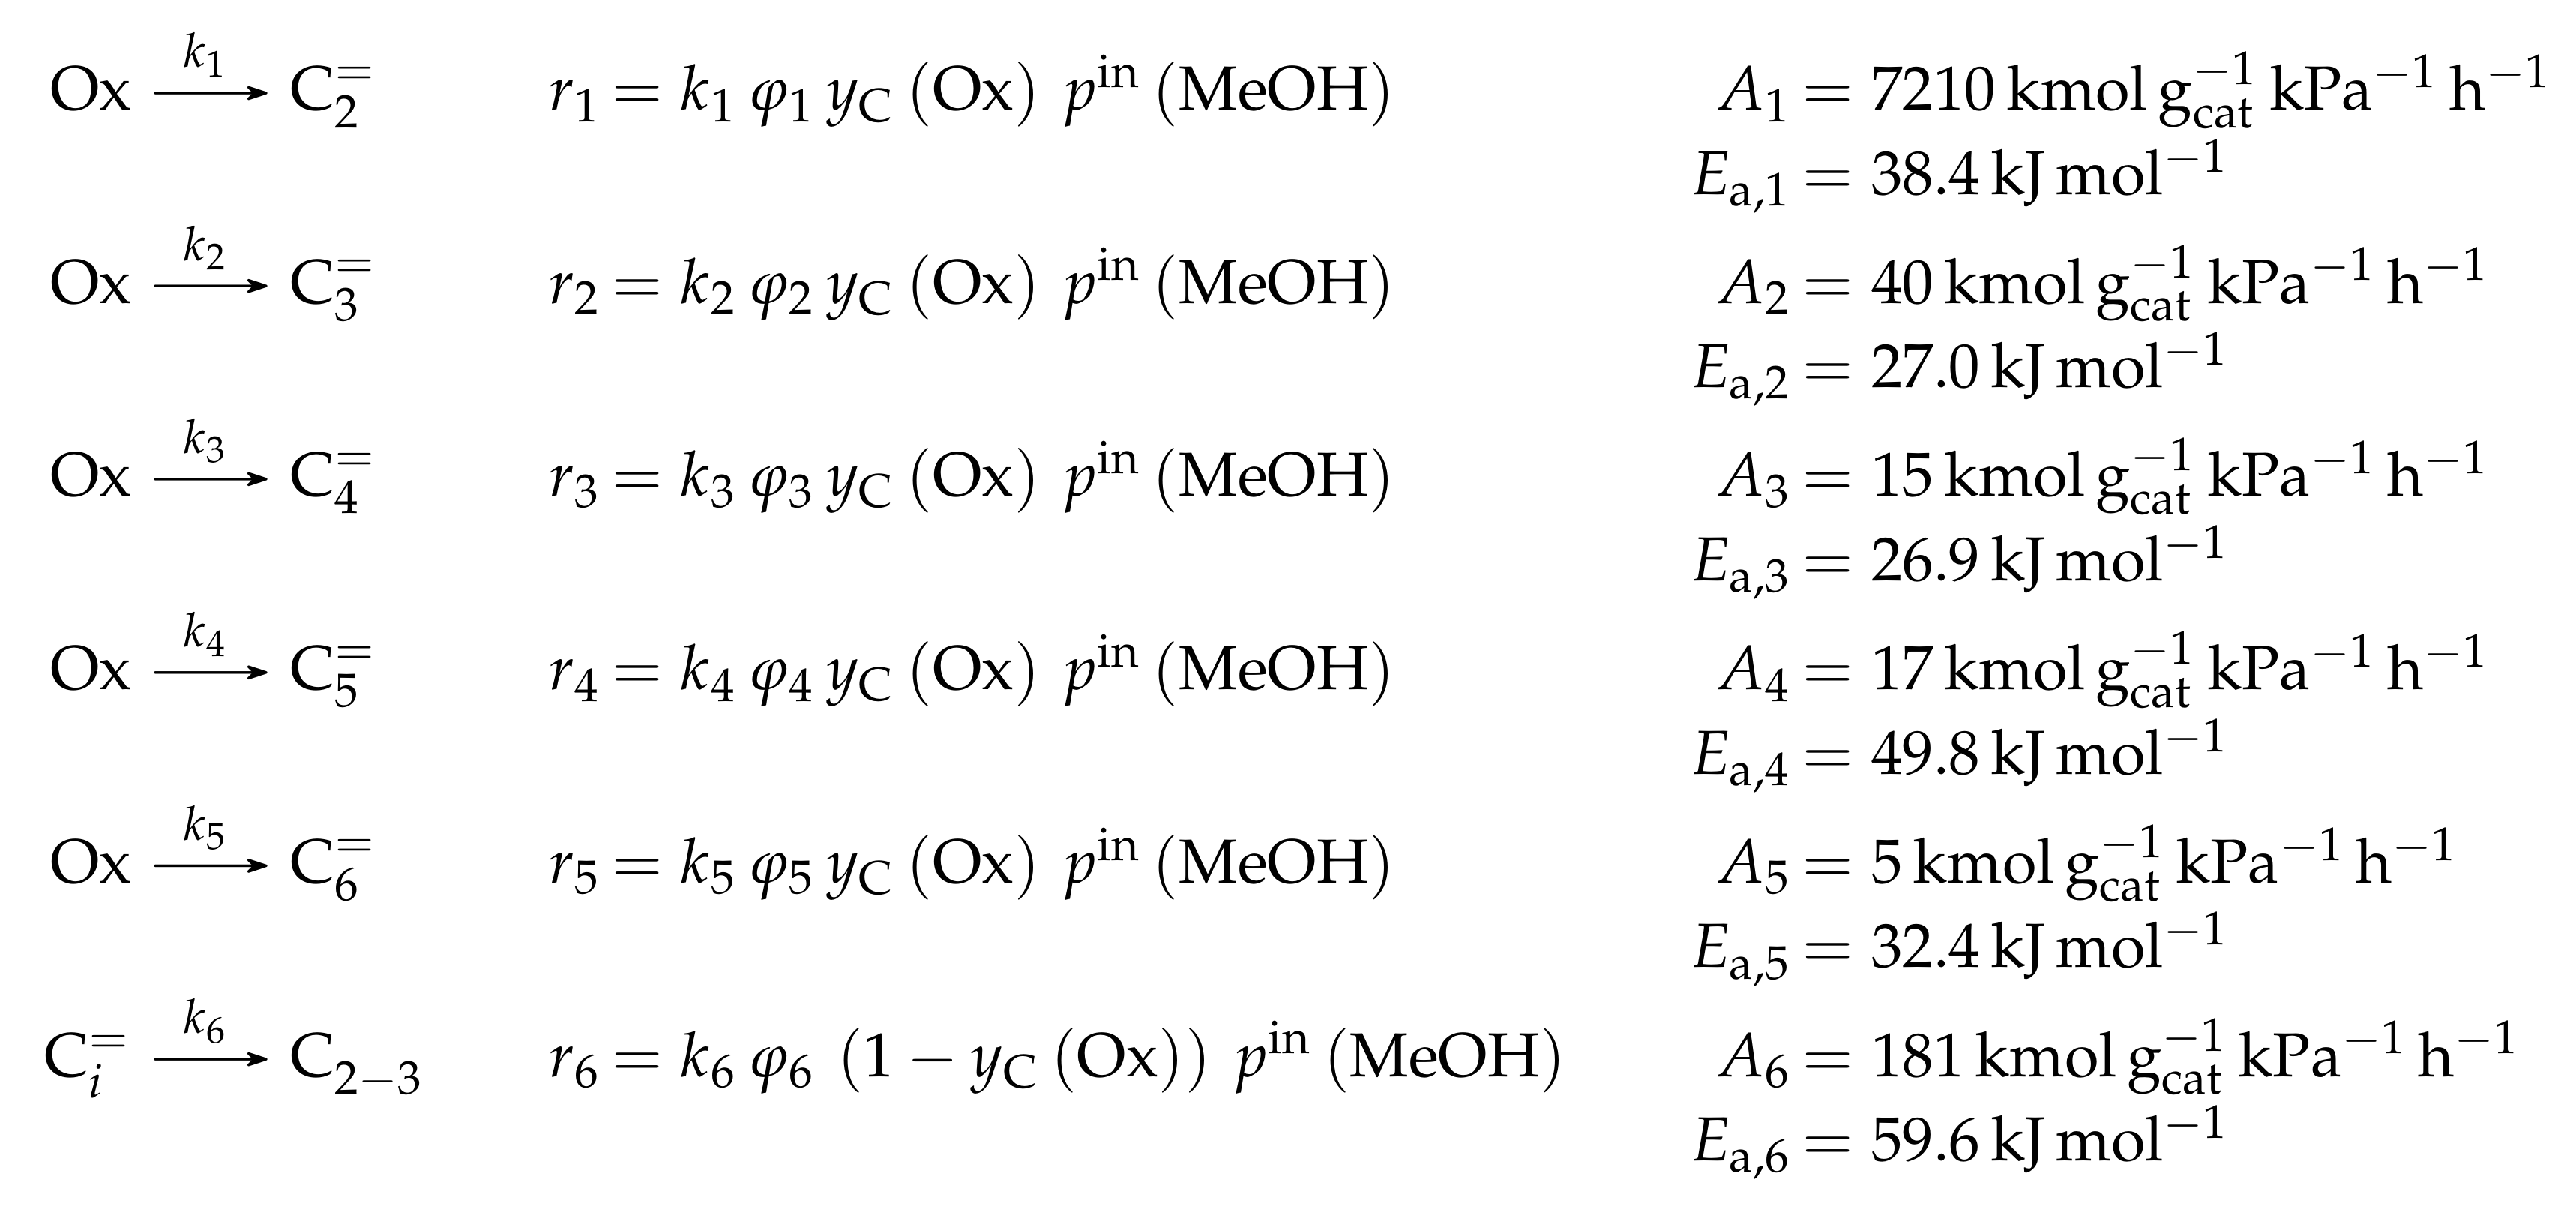
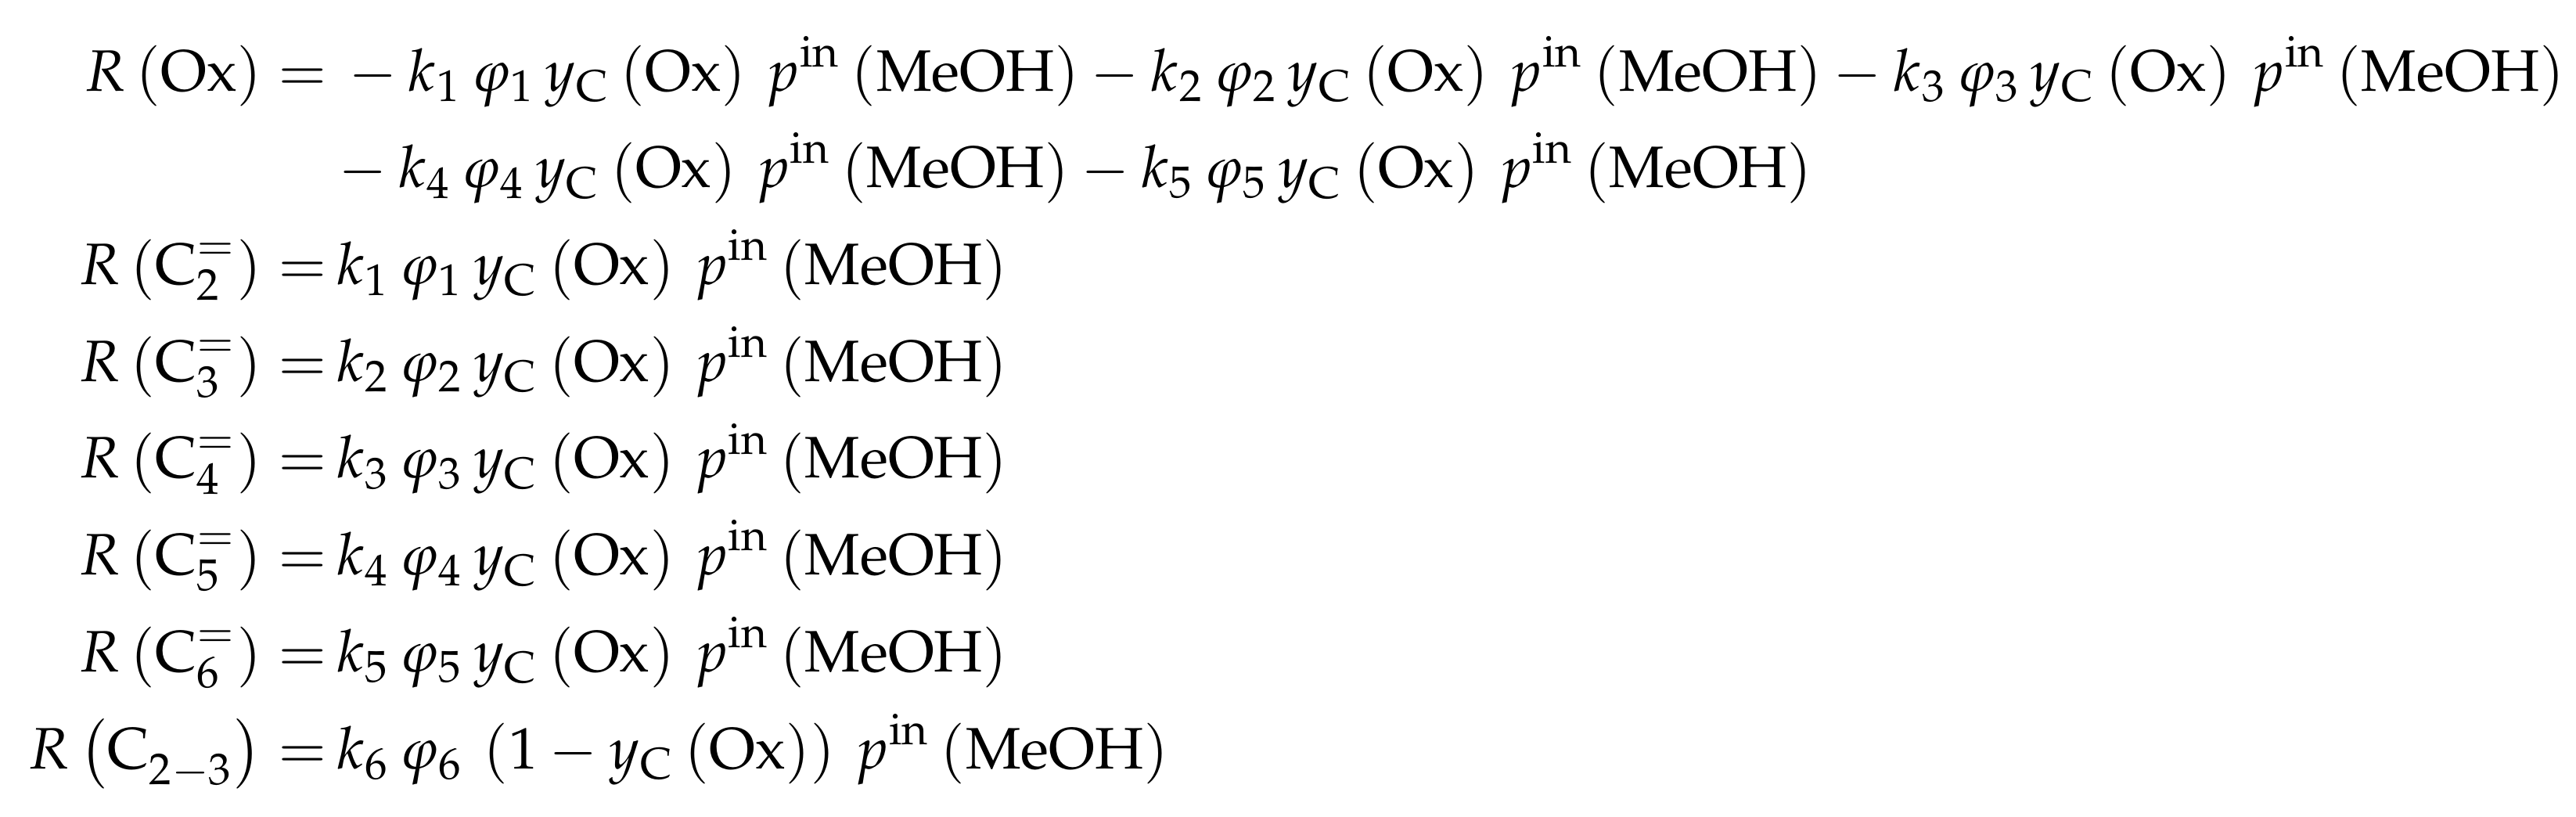
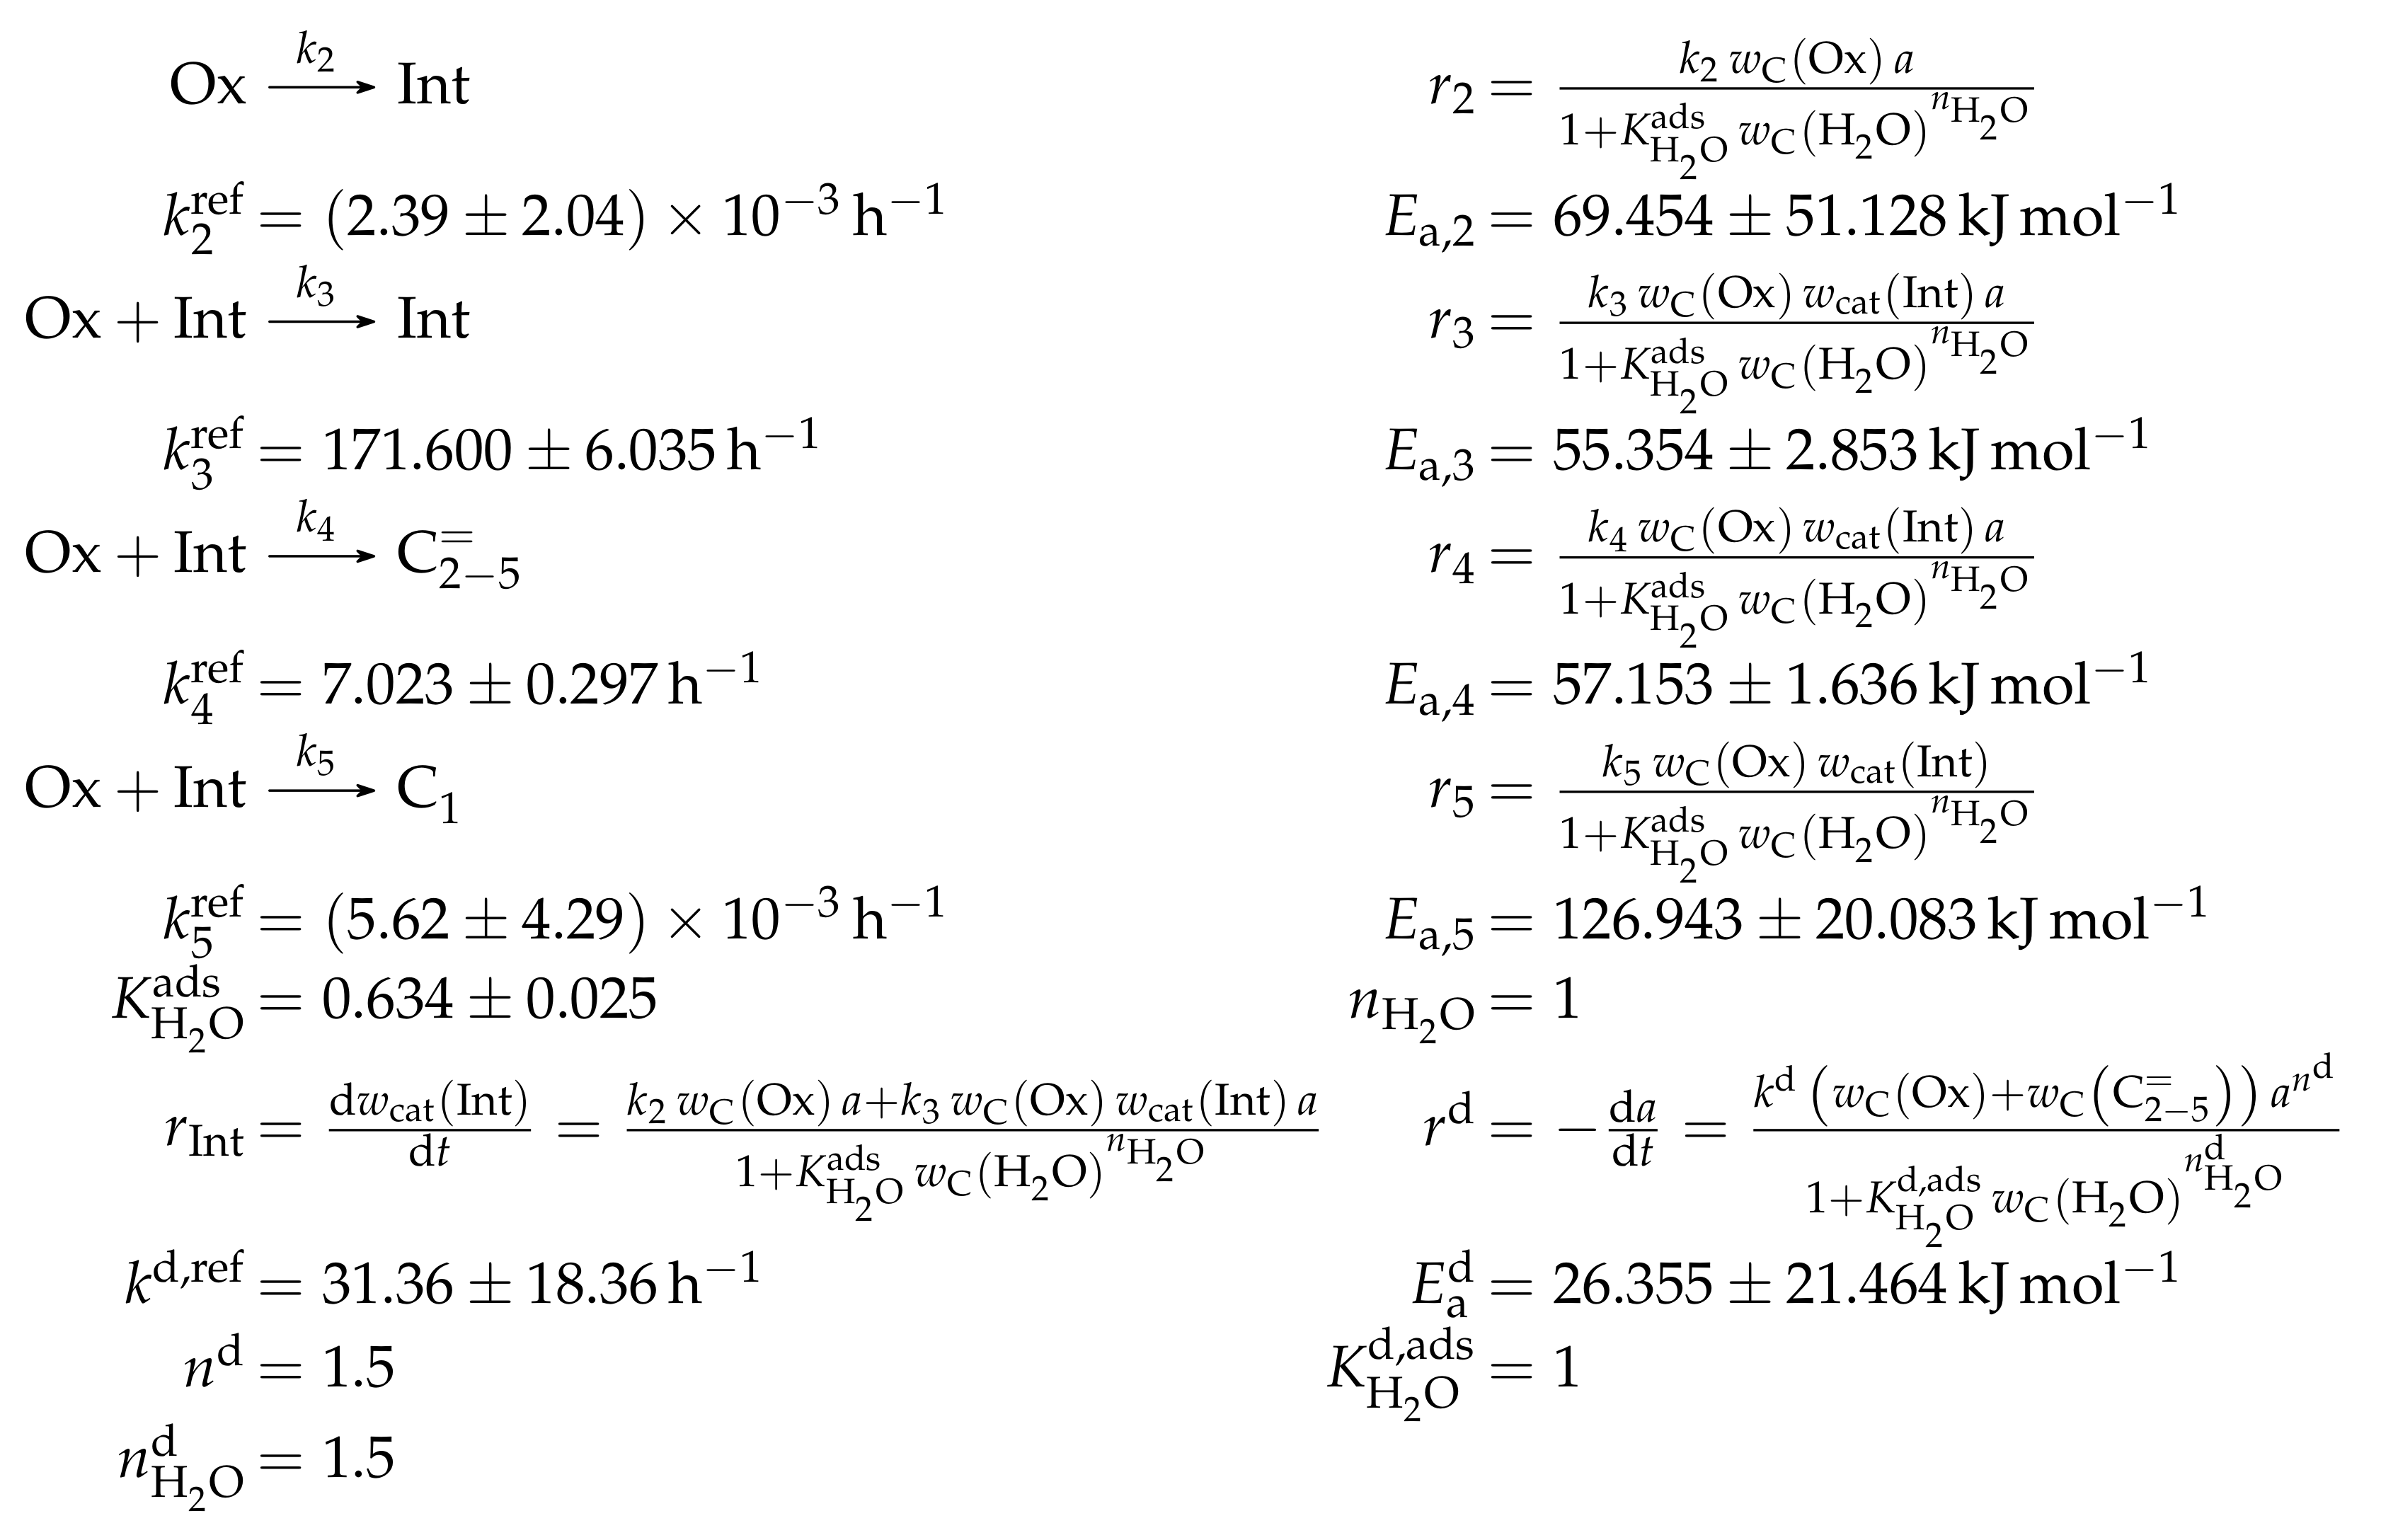
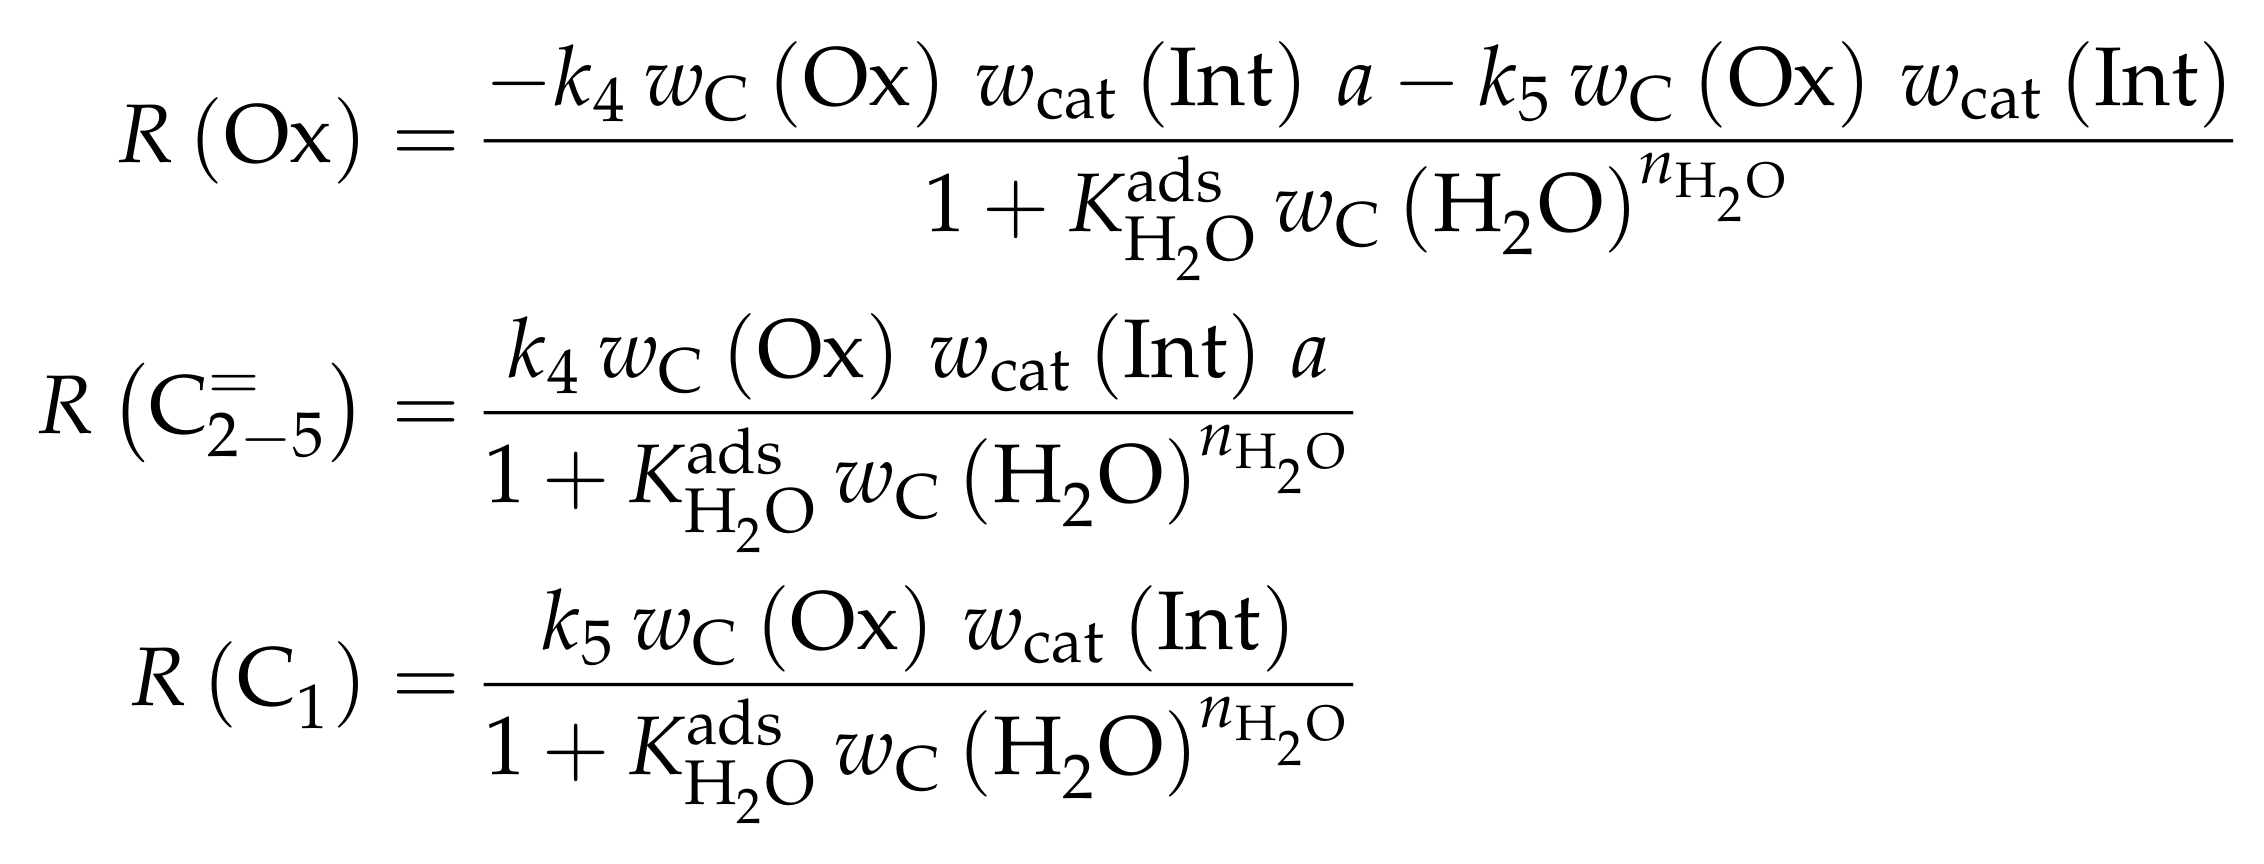
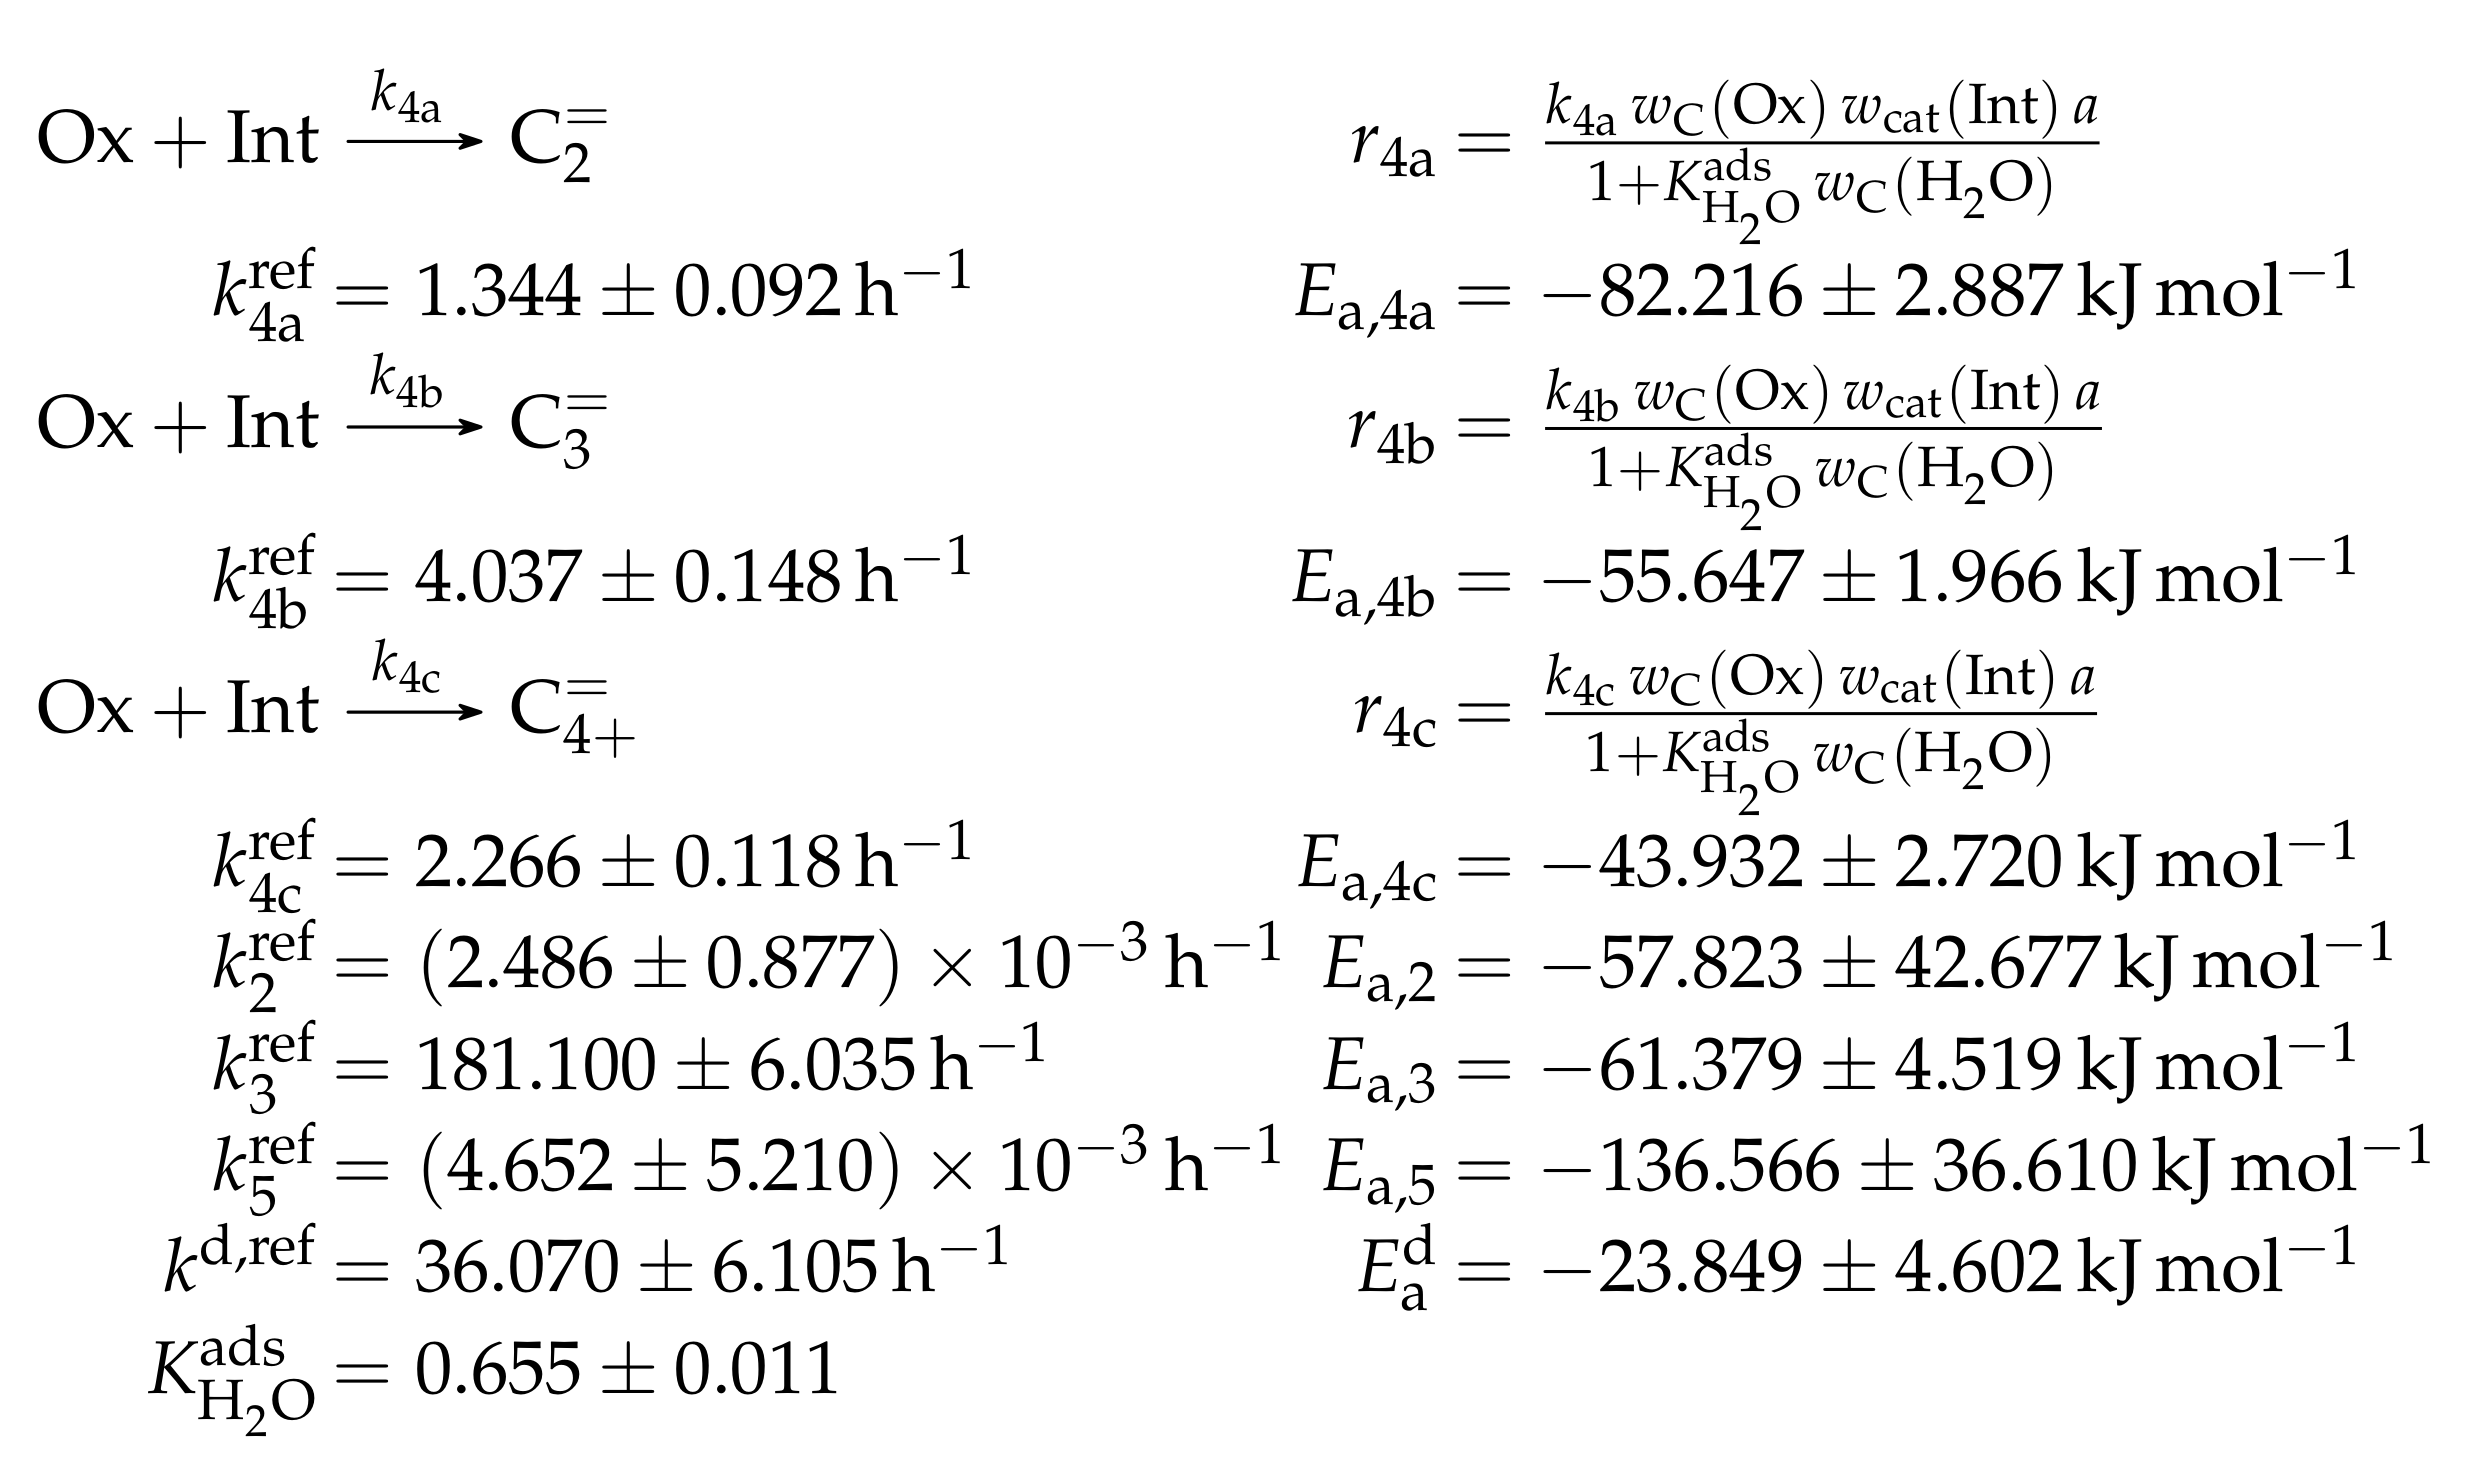
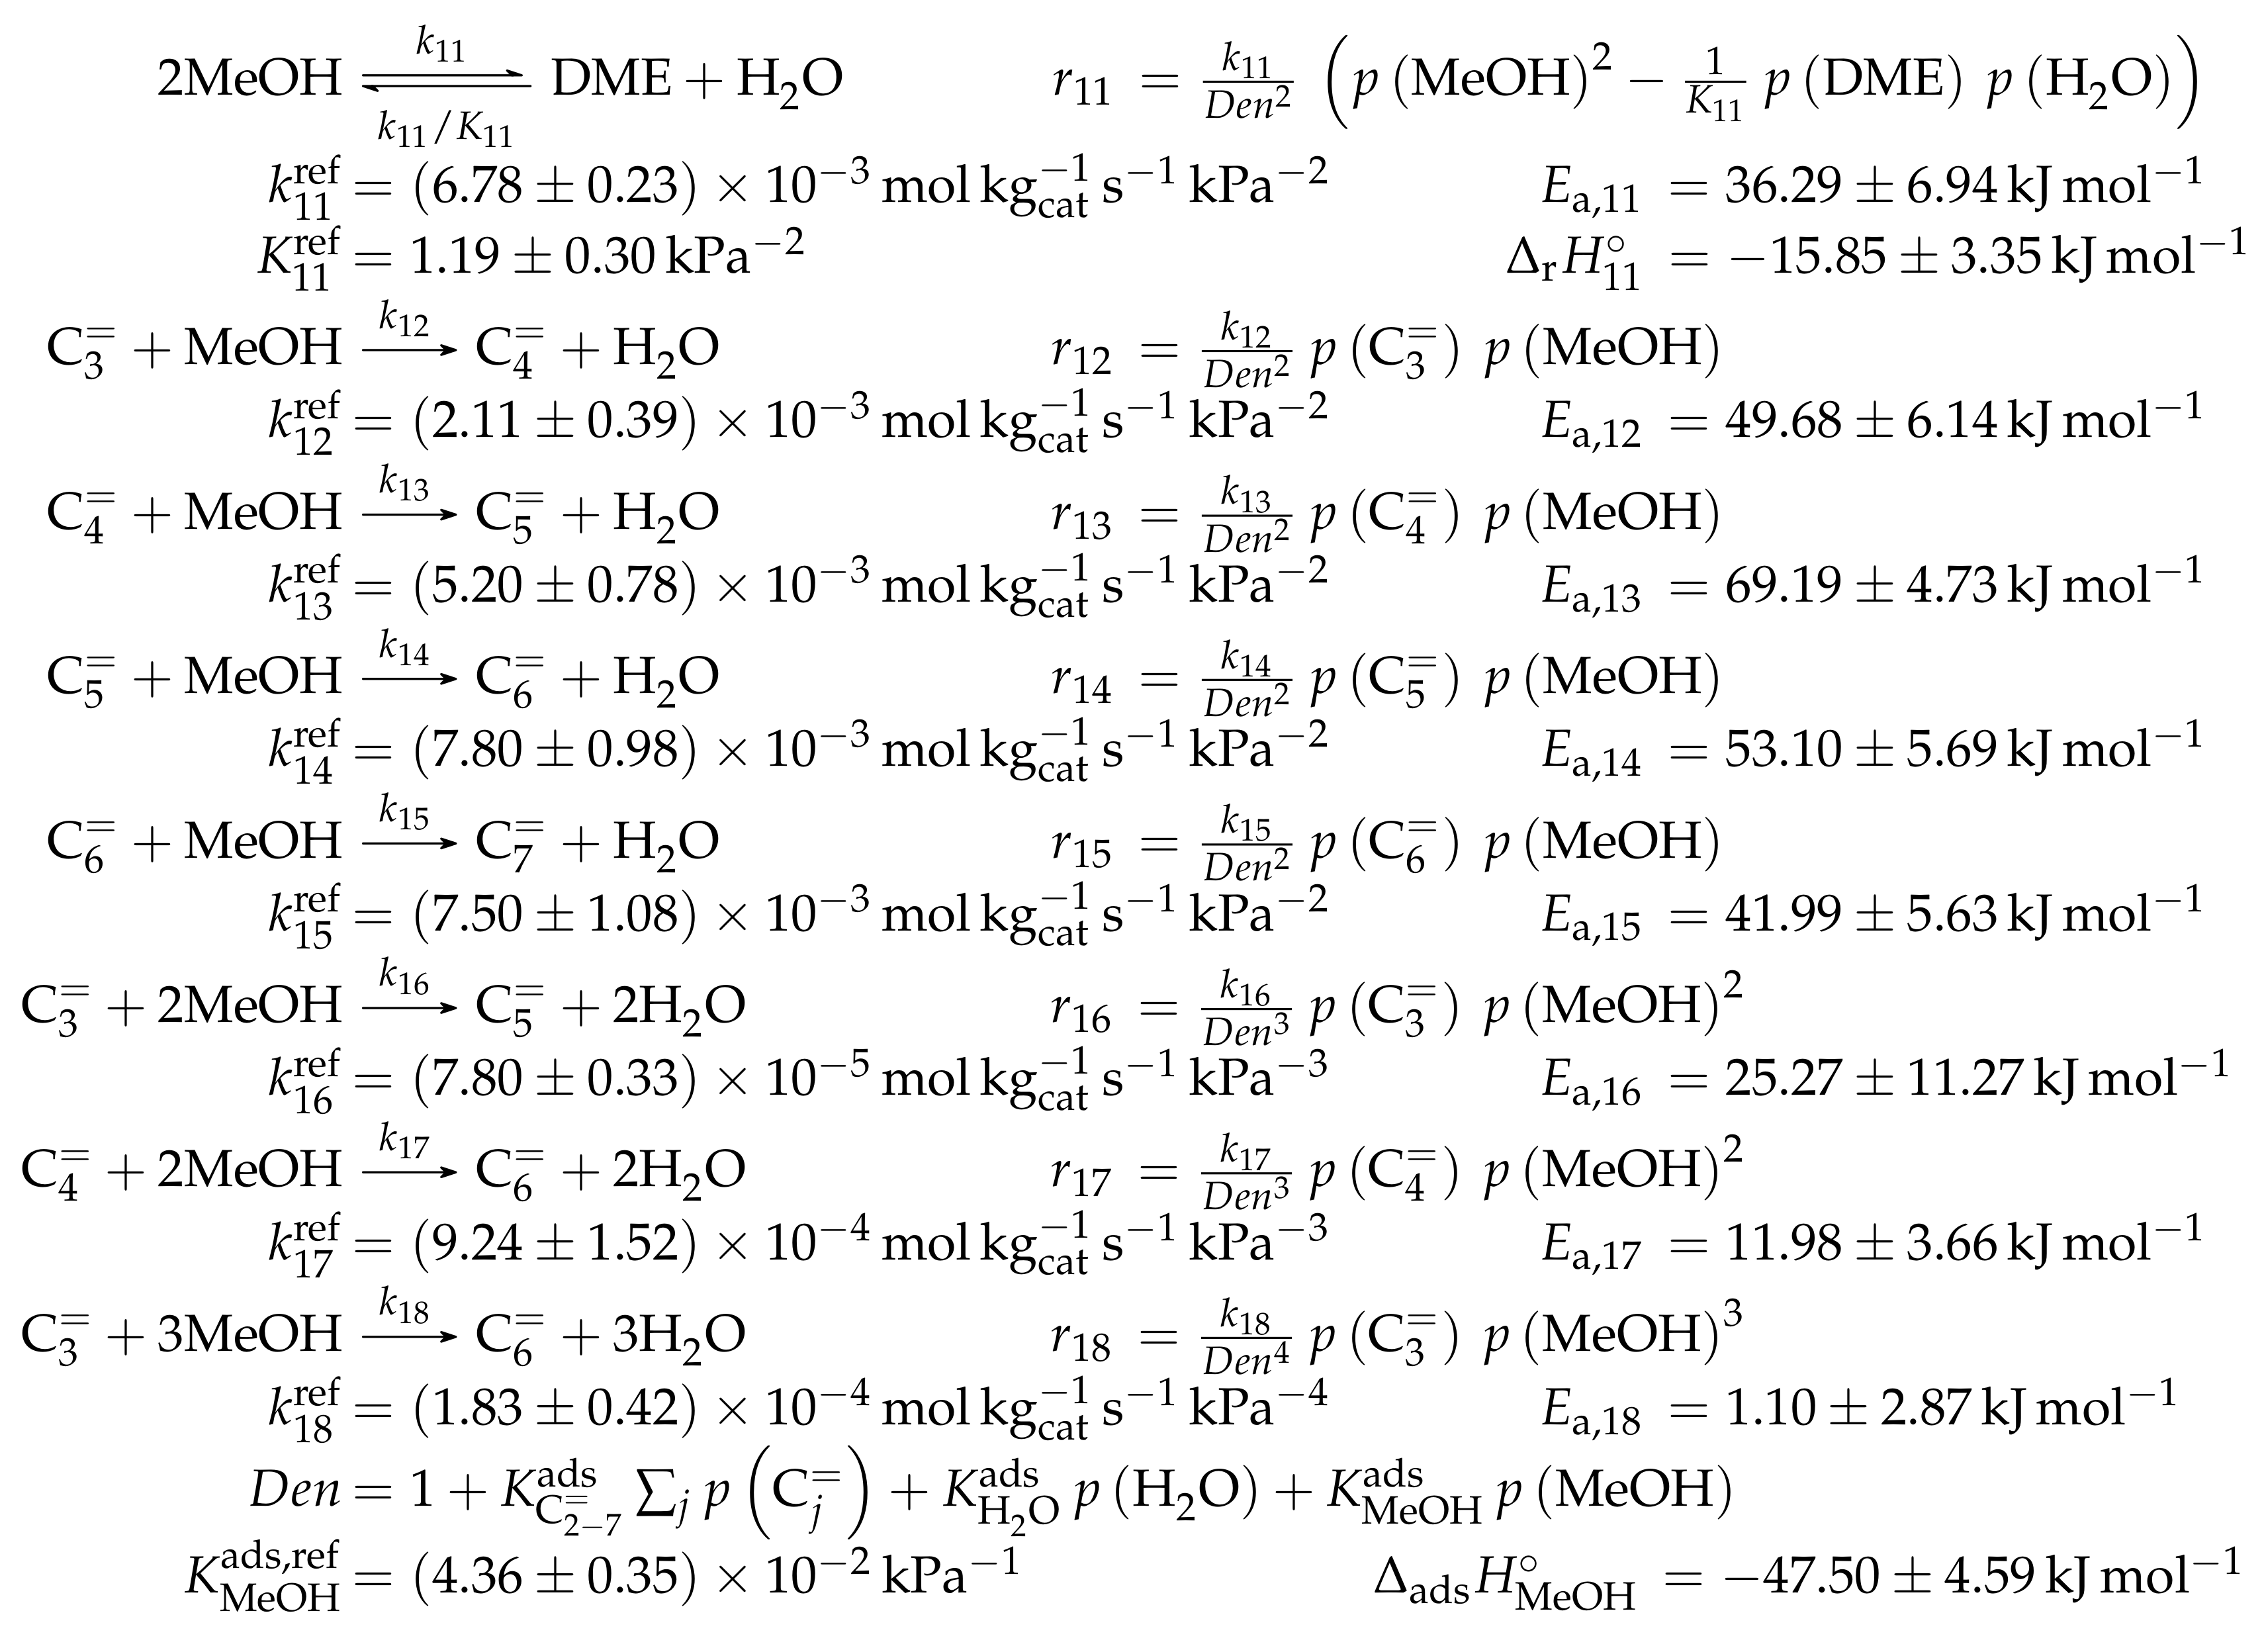
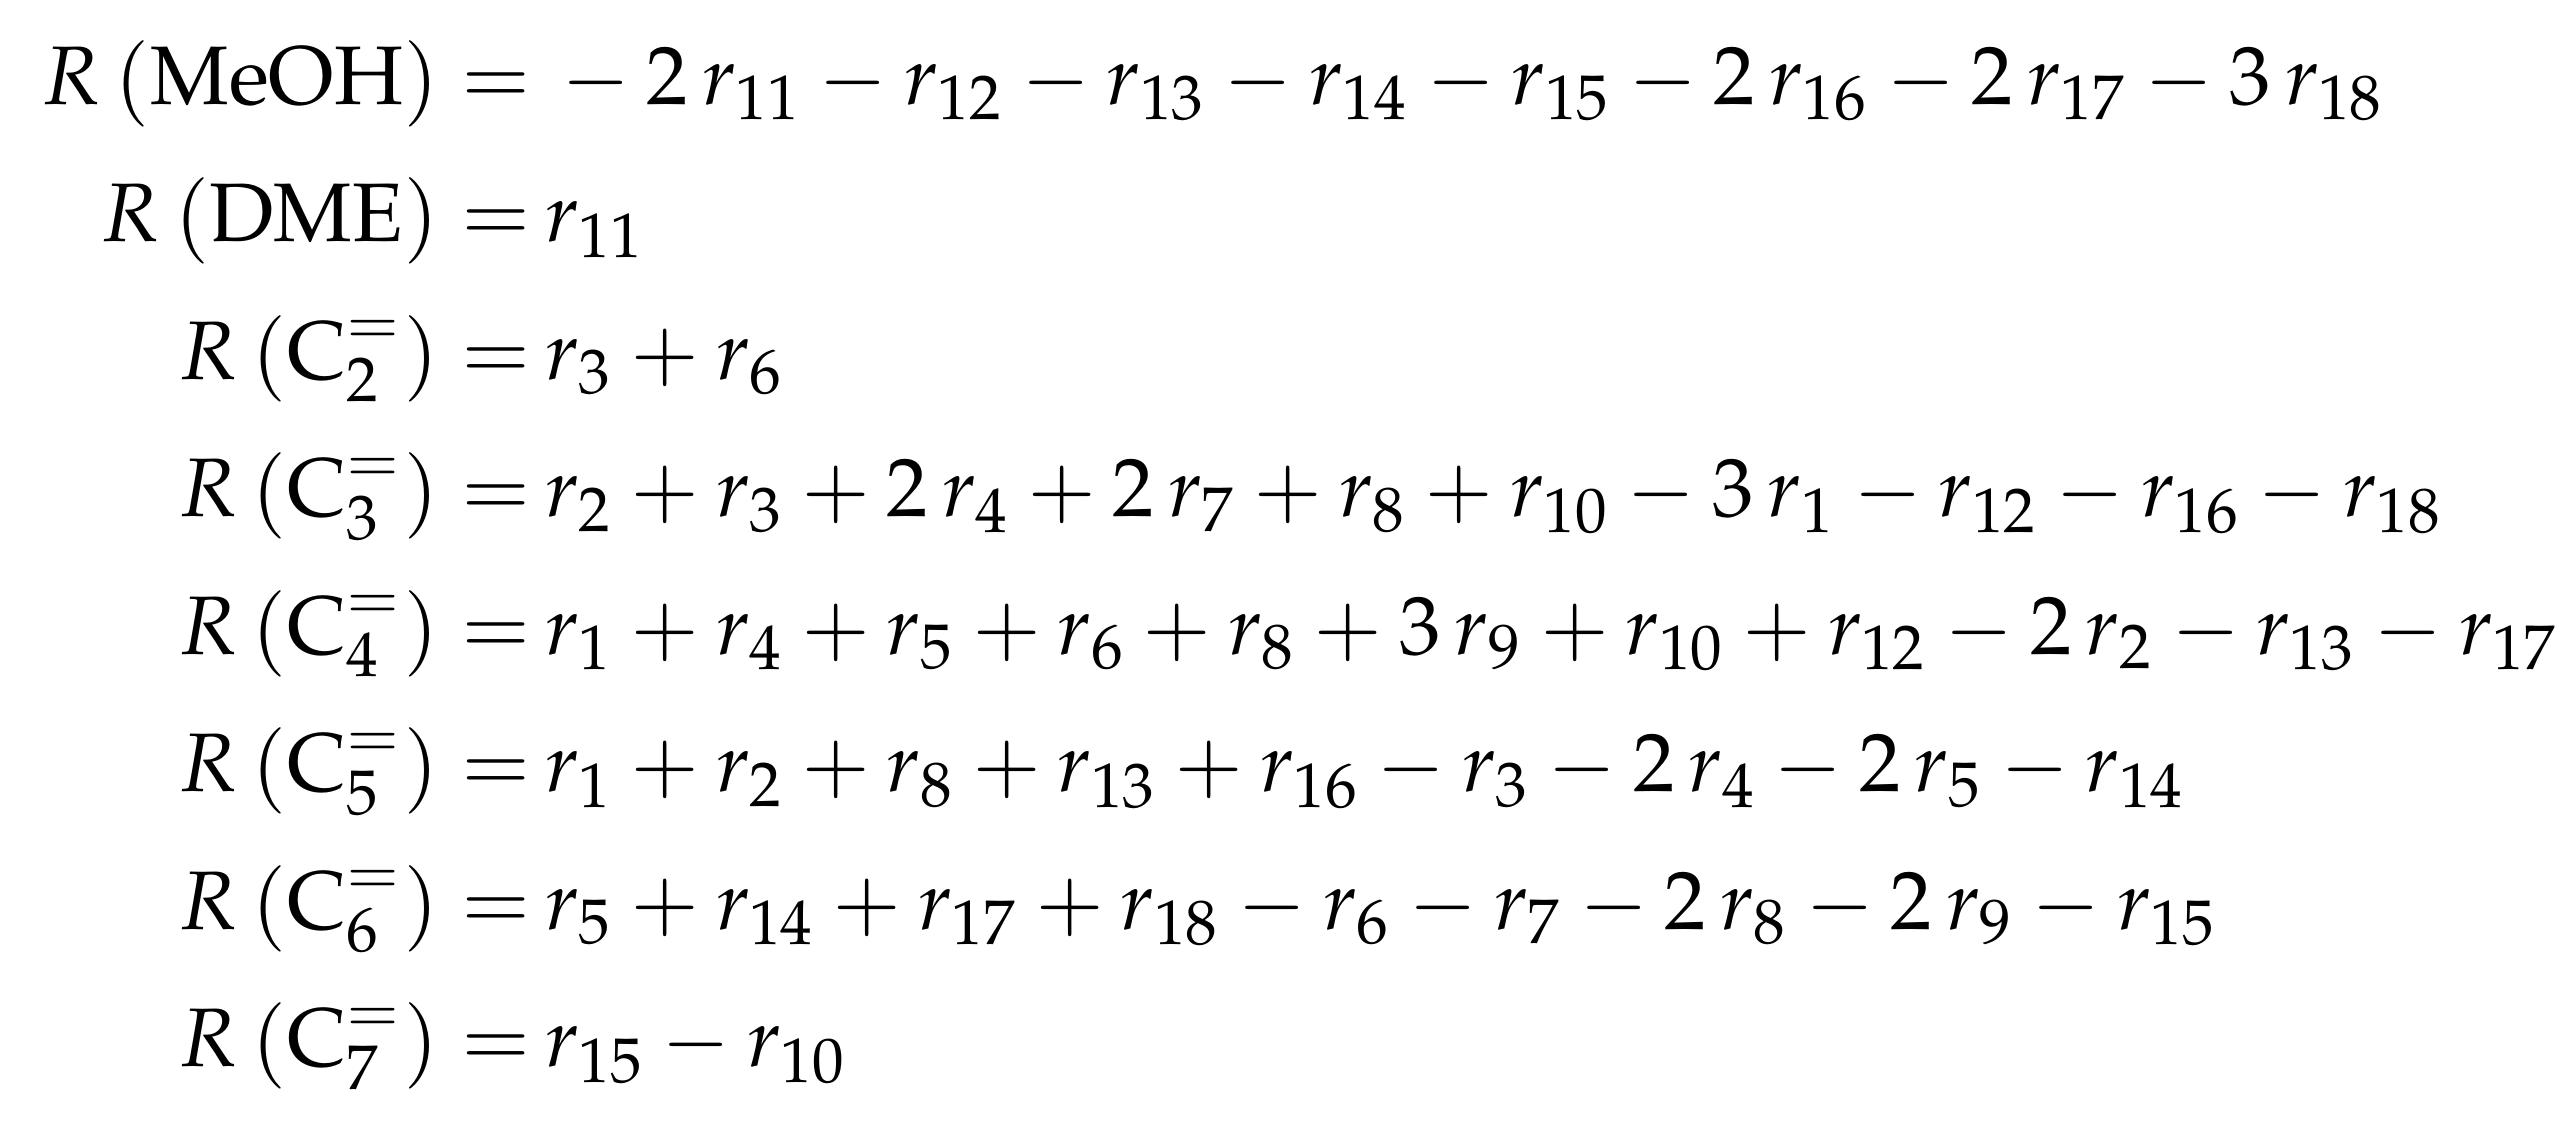
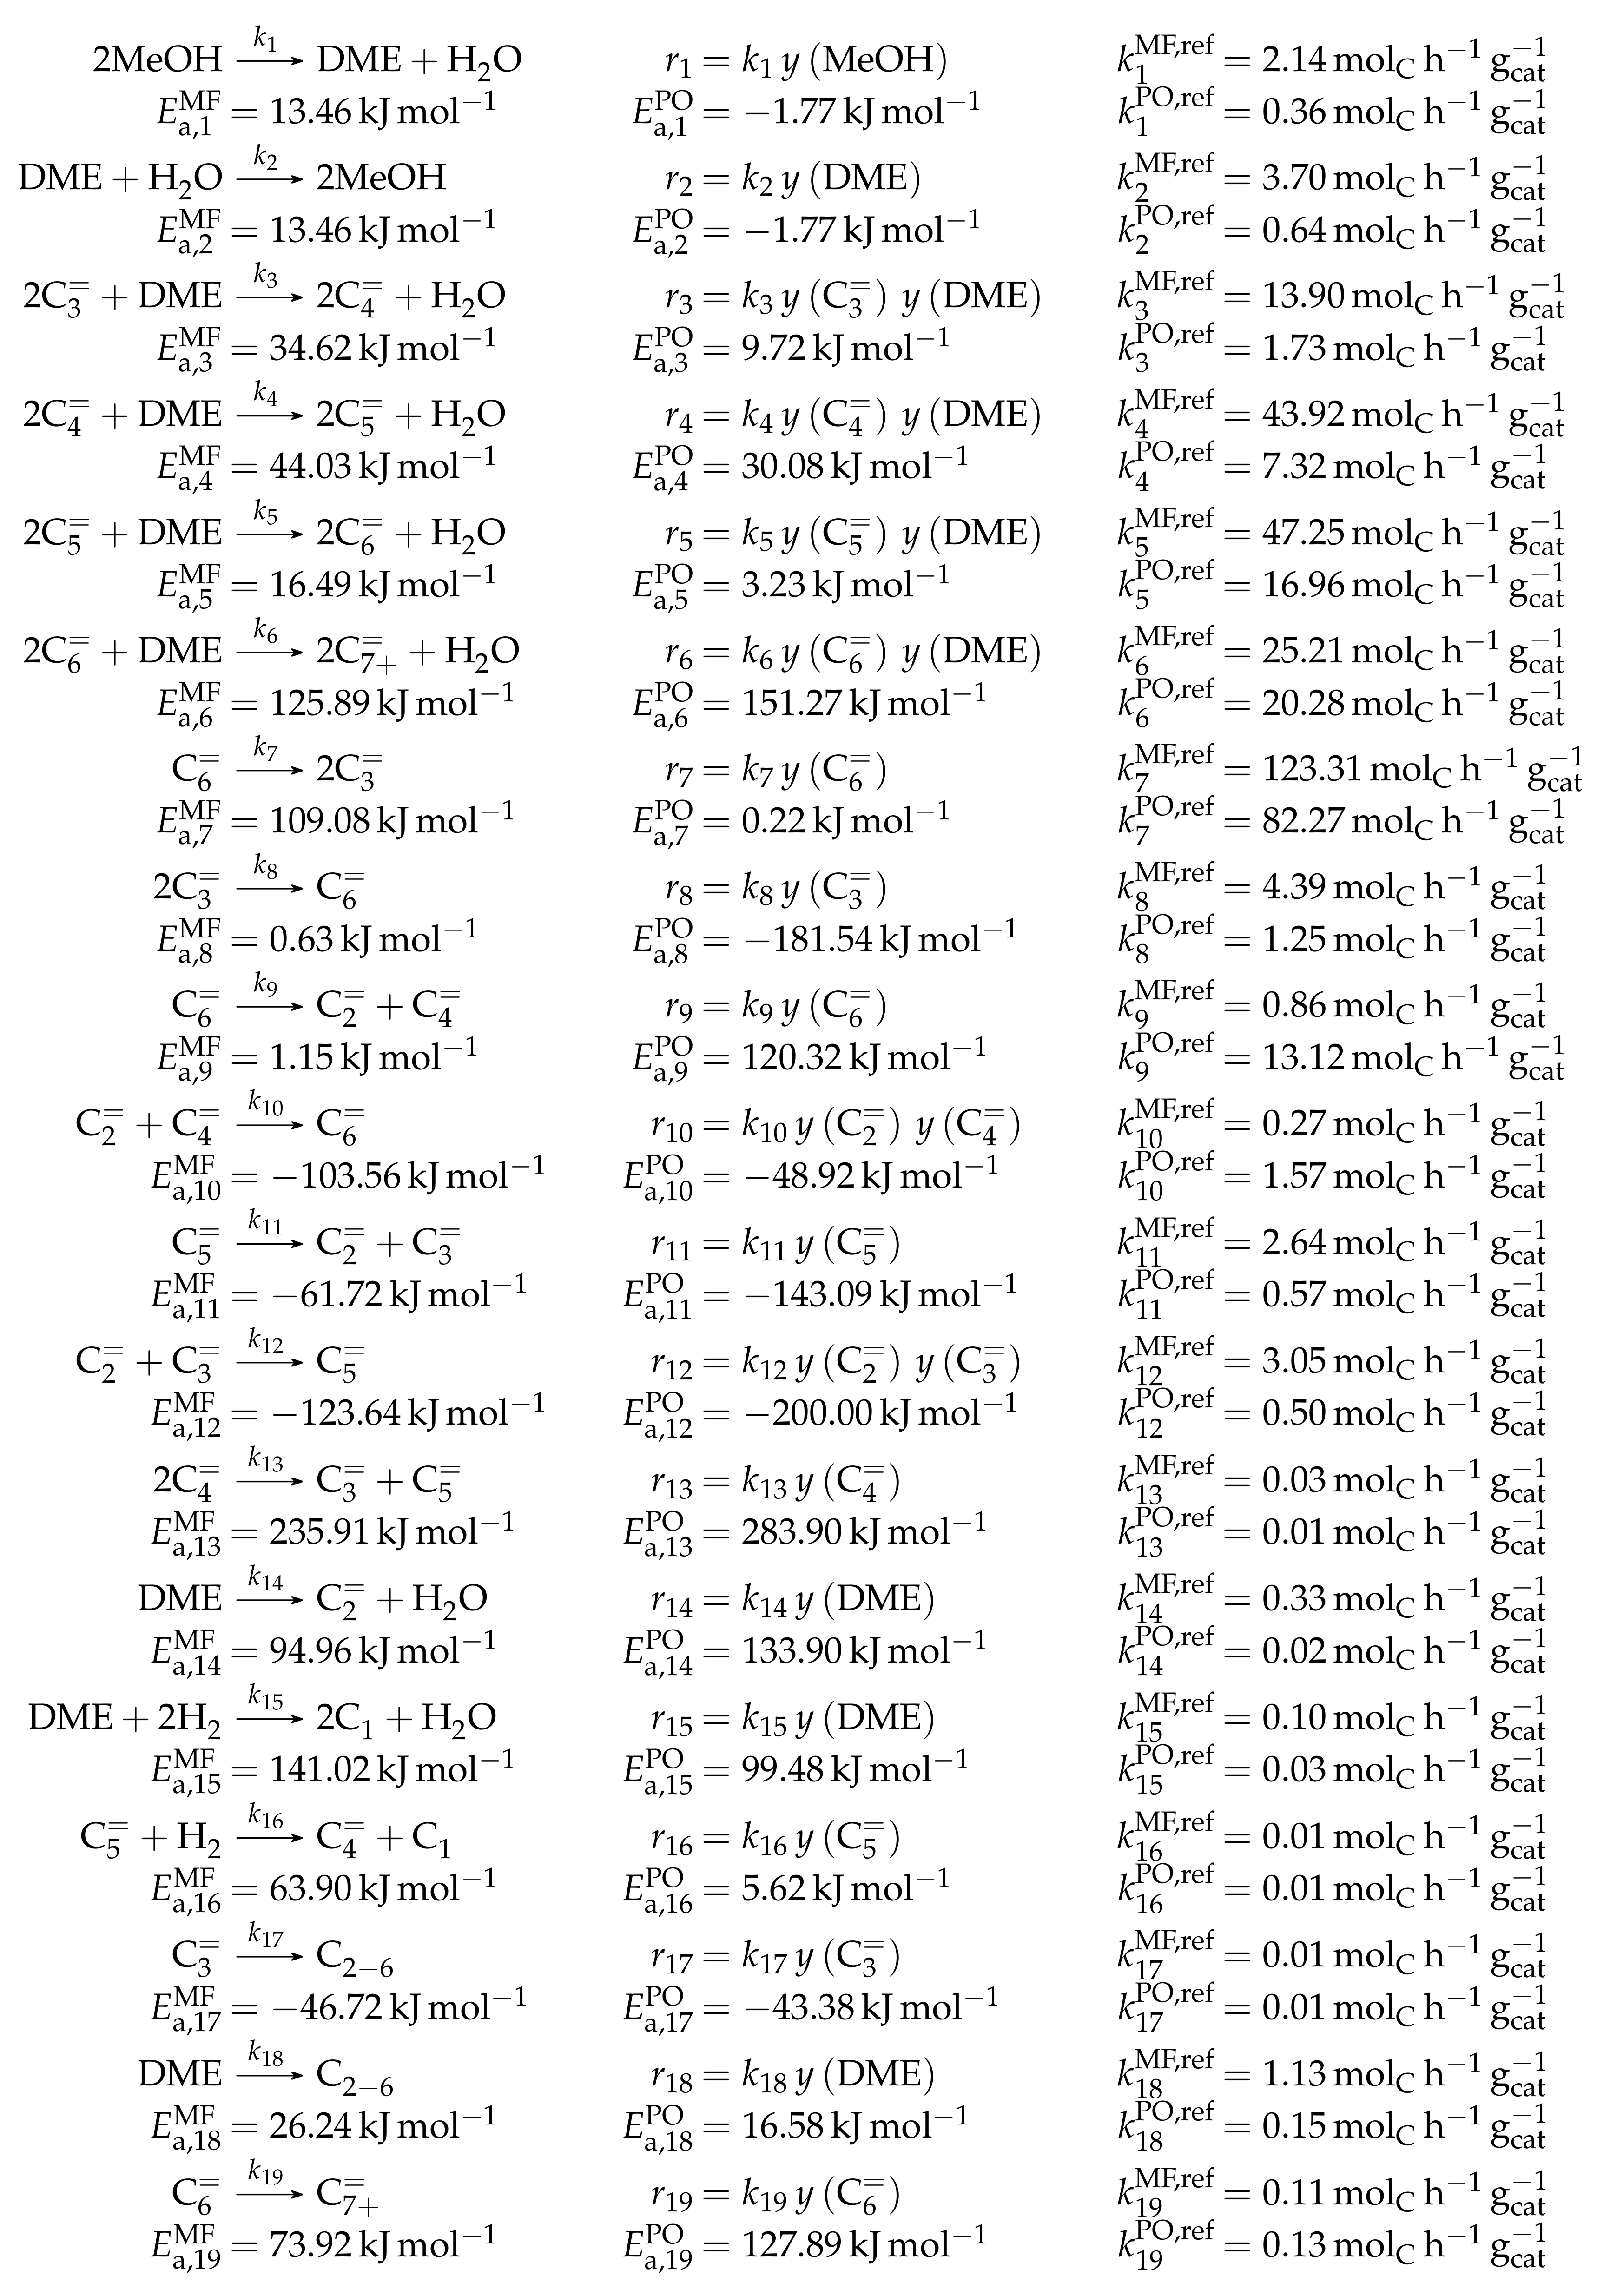
Figure 1. Composition of an equilibrated mixture as a function of temperature at standard pressure p t = p : (a) for C 2 = to C 8 = ; and (b) for the system methanol/DME/water.
Catalysts 08 00626 g001
Figure 2. Composition of an equilibrated mixture for C 2 = to C 8 = : (a) as a function of total pressure at 650 K ; and (b) as mole fraction of propene at equilibrium conditions as a function of both temperature and total pressure.
Catalysts 08 00626 g002
Figure 3. Equilibrium constants for the system methanol/DME/water, taken from different references [109,110,111,112,113] and compared with our own solution according to Figure 1, as a function of temperature: (a) with a regular scale; and (b) with a logarithmic scale.
Catalysts 08 00626 g003
Scheme 1. Elementary reactions occurring during cracking of olefins connected to a complete catalytic cycle: formation of π complex (1), protonation (2), isomerization through PCP branching (3), isomerization through methyl shift (4), cracking (5), deprotonation (6) and desorption (7). The superscripts (g) and ( π ) represent olefins in the gas phase and bound in a π complex, respectively.
Catalysts 08 00626 sch001
Figure 4. Typical case of oxygenates conversion as a function of contact time for a pure methanol feed and for a feed comprising olefins co-fed with methanol.
Catalysts 08 00626 g004
Figure 5. Simplified reaction network for MTO over ZSM-5 with the olefin based cycle on the left and the aromatics based cycle on the right side; the latter produces mainly ethene, whereas aromatics and paraffins are formed both through olefin interconversion reactions and a methanol induced pathway, adapted from [11].
Catalysts 08 00626 g005
Scheme 2. Reaction network, rate equations and estimated parameters for the model by Epelde et al. [235] (eight lumps) with i ranging from 2 to 4 (olefins) or being 2–3, 4 (paraffins), 6–8 (aromatics) or 5+ (aliphatics).
Catalysts 08 00626 sch002
Scheme 3. Net rates of production of the different lumps for the model by Epelde et al. [235] (eight lumps).
Catalysts 08 00626 sch003
Scheme 4. Reaction network, rate equations and estimated parameters for the model by Epelde et al. [235] (five lumps).
Catalysts 08 00626 sch004
Scheme 5. Net rates of production of the different lumps for the model by Epelde et al. [235] (five lumps).
Catalysts 08 00626 sch005
Scheme 6. Reaction network, rate equations and estimated parameters for the model by Ying et al. [236] with i ranging from 3 to 7.
Catalysts 08 00626 sch006
Scheme 7. Net rates of production of the different lumps for the model by Ying et al. [236].
Catalysts 08 00626 sch007
Scheme 8. Reaction network, rate equations and estimated parameters for the model by Huang et al. [166] with j ranging from 2 to 7.
Catalysts 08 00626 sch008
Scheme 9. Net rates of production of the different lumps for the model by Huang et al. [166].
Catalysts 08 00626 sch009
Scheme 10. Reaction network, rate equations, net rate of production of the different lumps and estimated parameters for the model by Borges et al. [165] with i ranging from 2 to 4 and n being a positive integer such that n · i is a multiple of i.
Catalysts 08 00626 sch010
Scheme 11. Reaction network, rate equations and estimated parameters for the model by Oliveira et al. [237] with i and v ranging from 2 to 6 and i + v being less than or equal to 8 for the dimerization/cracking reactions; for the aromatization, i is between 6 and 8 and v between 2 and 8; the carbon number of the feed olefin is characterized by w and can be between 2 and 8.
Catalysts 08 00626 sch011
Scheme 12. Net rates of production of the different lumps for the model by Oliveira et al. [237] with i ranging from 2 to 8 for R C i = , from 6 to 8 for R C i ar and from 2 to 8 for R C i , respectively; the same rules as in Scheme 11 apply for the different indices of the reaction rates.
Catalysts 08 00626 sch012
Scheme 13. Reaction network, rate equations and estimated parameters for the model by von Aretin et al. [164] with j ranging from 2 to 12 as well as i and v ranging from 2 to 10 and from 3 to 10, respectively and i + v being less than or equal to 12; when i is equal to 2, no dimerization takes place, cracking is thus irreversible in these cases; m and n resemble the types of protonated intermediates: primary, secondary or tertiary; and K ˜ chem is composed of K π , symmetry contributions, an equilibrium constant of isomerization and one of protonation (see [164]). Instead of the original parameters from [164], the slightly changed values from [244] are shown here, where K ˜ TD is calculated exclusively with thermodynamic data stemming from Benson’s group additivity method [96,97].
Catalysts 08 00626 sch013
Scheme 14. Net rates of production of the different species for the model by von Aretin et al. [164] with i ranging from 2 to 12 for R C i = and for R C i = , chem ; the same rules as in Scheme 13 apply for the different indices of the reaction rates.
Catalysts 08 00626 sch014
Scheme 15. Reaction network, rate equations and estimated parameters for the model by Zhou et al. [77] with j ranging from 2 to 5.
Catalysts 08 00626 sch015
Scheme 16. Net rates of production of the different lumps for the model by Zhou et al. [77] with j ranging from 2 to 5.
Catalysts 08 00626 sch016
Scheme 17. Reaction network, rate equations and estimated parameters for the model by Menges and Kraushaar-Czarnetzki [139].
Catalysts 08 00626 sch017
Scheme 18. Net rates of production of the different lumps for the model by Menges and Kraushaar-Czarnetzki [139].
Catalysts 08 00626 sch018
Scheme 19. Reaction network, rate equations and estimated parameters for the model by Jiang et al. [251].
Catalysts 08 00626 sch019
Scheme 20. Net rates of production of the different lumps for the model by Jiang et al. [251].
Catalysts 08 00626 sch020
Scheme 21. Reaction network, rate equations and estimated parameters for the model by Gayubo et al. [114] over ZSM-5; K TD is calculated with a modified version of Hayashi and Moffat’s correlation [110] (see Section 2.1).
Catalysts 08 00626 sch021
Scheme 22. Net rates of production of the different lumps for the model by Gayubo et al. [114] over ZSM-5; the C 4 + HC lump is calculated via conservation of mass within the model.
Catalysts 08 00626 sch022
Scheme 23. Reaction network, rate equations and estimated parameters for the model by Aguayo et al. [252]; K TD is calculated with an own correlation [109] (see Section 2.1).
Catalysts 08 00626 sch023
Scheme 24. Net rates of production of the different lumps for the model by Aguayo et al. [252].
Catalysts 08 00626 sch024
Scheme 25. Reaction network, rate equations and estimated parameters for the model by Pérez-Uriarte et al. [253]; K TD is calculated with an own correlation [109] (see Section 2.1); some values are from [276].
Catalysts 08 00626 sch025
Scheme 26. Net rates of production of the different lumps for the model by Pérez-Uriarte et al. [253].
Catalysts 08 00626 sch026
Scheme 27. Reaction network, rate equations and estimated parameters for the model by Gayubo et al. [255] over SAPO-34 (six lumps).
Catalysts 08 00626 sch027
Scheme 28. Net rates of production of the different lumps for the model by Gayubo et al. [255] over SAPO-34 (six lumps); the Ox lump (methanol plus DME) is calculated via conservation of mass within the model.
Catalysts 08 00626 sch028
Scheme 29. Reaction network, rate equations and estimated parameters for the model by Gayubo et al. [255] over SAPO-34 (five lumps).
Catalysts 08 00626 sch029
Scheme 30. Net rates of production of the different lumps for the model by Gayubo et al. [255] over SAPO-34 (five lumps); the Ox lump (methanol plus DME) is calculated via conservation of mass within the model.
Catalysts 08 00626 sch030
Scheme 31. Reaction network, rate equations and estimated parameters for the model by Ying et al. [256].
Catalysts 08 00626 sch031
Scheme 32. Net rates of production of the different lumps for the model by Ying et al. [256].
Catalysts 08 00626 sch032
Scheme 33. Reaction network, rate equations and estimated parameters for the model by Chen et al. [257] with i ranging from 2 to 6; see [257] for the deactivation parameters φ l .
Catalysts 08 00626 sch033
Scheme 34. Net rates of production of the different lumps for the model by Chen et al. [257].
Catalysts 08 00626 sch034
Scheme 35. Reaction network, rate equations and estimated parameters for the model by Gayubo et al. [259] over SAPO-18 (four lumps).
Catalysts 08 00626 sch035
Scheme 36. Net rates of production of the different lumps for the model by Gayubo et al. [259] over SAPO-18 (four lumps).
Catalysts 08 00626 sch036
Scheme 37. Reaction network, rate equations and estimated parameters for the model by Gayubo et al. [255] over SAPO-18 (five lumps); the corresponding equations for Steps 2, 3, 5 and d can be found in Scheme 35.
Catalysts 08 00626 sch037
Scheme 38. Reaction network, rate equations and estimated parameters for the model by Huang et al. [240] with j ranging from 2 to 7.
Catalysts 08 00626 sch038
Scheme 39. Net rates of production of the different lumps for the model by Huang et al. [240].
Catalysts 08 00626 sch039
Scheme 40. Reaction network, rate equations and estimated parameters for the model by Wen et al. [303].
Catalysts 08 00626 sch040
Scheme 41. Net rates of production of the different lumps for the model by Wen et al. [303].
Catalysts 08 00626 sch041
Table 1. Properties of the different catalysts which were used for the kinetic models of olefin cracking; besides the zeolite type, its silicon-to-aluminum ratio (Si/Al), its total number of acid sites plus determination method, its ratio of Brønsted to Lewis acid sites (BAS/LAS) and its surface area according to the method by Brunauer–Emmett–Teller (BET) are shown. Furthermore, the time-on-stream (TOS) after which the kinetic data were taken, the particle size ( d P ) and information about whether an extrudate or pure powder was used are presented. The line separates the different subsections. A hyphen represents missing information.
ModelZeolite TypeSi/AlTotal AcidityBAS/LASBETTOS d P Extrudate
Epelde [235]ZSM-5 (1 % wt K)280 ( 1 ) 0.033 mmol g cat 1 (t-BA) ( 2 ) -194 m 2 g cat 1 5 h ( 3 ) 150–300 μm25/30/45 % wt (Zeolite/Bentonite/Alumina)
Ying [236]ZSM-5103 0.21 mmol g cat 1 (NH 3 )-340 m 2 g cat 1 0.03 h 420–841 μmYes ( 4 )
Huang [166]ZSM-5200 ( 1 ) 0.012 mmol g cat 1 (NH 3 )1.35 at 423 K 301.1 m 2 g cat 1 0–10 h ( 5 ) 125–149 μm70/30 % wt (Zeolite/Alumina)
Borges [165]ZSM-530--416 m 2 g cat 1 ( 6 ) 0– 1.4 h -No
Oliveira [237]ZSM-5 (0, 0.52, 0.65 and 0.80 % wt Na) ( 7 ) 30--416 m 2 g cat 1 ( 8 ) 0– 1.4 h -No
von Aretin [164]ZSM-590 0.174 mmol g cat 1 (C 5 H 5 N)4.27454 m 2 g cat 1 > 6 h 400–500 μmNo
Zhou [77]SAPO-34 ( 9 ) 0.25 ( 10 ) 1.25 mmol g cat 1 (NH 3 )-550 m 2 g cat 1 0.02 h 3.2 μm ( 11 ) No
(1) Value of the zeolite, i.e., without binder. (2) Calculated under the assumption that the total acidity of the extrudate is equal to one fourth of the pure zeolite’s acidity according to the annotations in [235]. (3) Results extrapolated to 0 h TOS. (4) No further information available (commercial catalyst from Süd-Chemie), but the patent cited in [236] reveals the use of alumina as binder. (5) Regeneration after 10 h TOS. (6) Extracted from a subsequent publication [237]. (7) Corresponds to catalysts where 0%, 2.4%, 3.0% and 3.2 , respectively, of the protons were exchanged with Na ions. (8) Surface areas of 396, 394 and 386 m 2 g cat 1 , respectively, with higher Na amounts. (9) SAPO-34 and SAPO-18 disordered intergrowth structure revealed by XRD. (10) Value of the gel. (11) Mean size.
Table 2. Experimental conditions and modeling details for the kinetic models of olefin cracking: the feed components, the temperature range (T), the total pressure ( p t ), the partial pressure range of the feed olefin ( p Ol ) and the maximum contact time ((W/ F in ) max ) with resulting conversion ( X max ) are listed. Concerning the model, the number of fitted responses ( N Res ), the number of estimated parameters ( N Par ), the number of experiments ( N Exp ) and the degree of freedom ( d o f ) are shown. Finally, it is noted whether the model follows a type of a mechanistical scheme (Mech.), whether adsorption is considered (Ads.) and which side products are included (Side prod.). The line separates the different subsections. A hyphen represents missing information.
ModelFeedT p t p Ol (W/ F in ) max X max N Res N Par N Exp dof Mech.Ads.Side prod.
Epelde [235] C 4 = , He673–873 K 1.5 bar0.375–1.35 bar 1.60 g cat h mol C 1 0.7582351385NoNo C 1 4 , C 6 8 ar
51651239
Ying [236] C 3 = , N 2 673–763 K 1.013 bar 0.131 bar 0.23 h ( 1 ) 0.67728115777NoNo C 3 7 , C 6 7 ar
C 4 = , N 2 0.16 h (1)0.65
C 5 = , N 2 0.07 h (1)0.57
C 6 = , N 2 0.10 h (1)0.94
C 7 = , N 2 0.04 h (1)0.98
Huang [166]3 NW (2)673–763 K 1.013 bar 0.0832 bar 1.12 kgcat s mol t 1 0.33644104580LH, HW C 2 7 = , H2ONo
4 NW (2)0.0706 bar0.73 kgcat s mol t 1 0.40
5 NW (2)0.0601 bar0.39 kgcat s mol t 1 0.23
6 NW (2)0.0532 bar0.20 kgcat s mol t 1 0.46
7 NW (2)0.0476 bar0.03 kgcat s mol t 1 0.46
Borges [165] C 2 = , N 2 473–723 K 1.013 bar 0.05– 0.30 bar 9.33 gcat h mol C 1 -3836100ER, HW C 2 4 = No
C 3 = , N 2 1.55 gcat h mol C 1 -
C 4 = , N 2 0.27 gcat h mol C 1 -
Oliveira [237] C 2 = , N 2 473–723 K1.013 bar 0.05–0.30 bar9.33 gcat h mol C 1 -1720611017L, ER, HW C 2 8 = C 2 8 , C 6 8 ar
C 3 = , N 2 1.55 gcat h mol C 1 -
C 4 = , N 2 0.27 gcat h mol C 1 -
von Aretin [164] C 5 = , N 2 633–733 K 1.2 bar 0.043– 0.070 bar 1.6 kg cat s mol t 1 0.5555141700L, ER, HW C 2 12 = No
Zhou [77] C 2 = (3)723 K 1.013 bar 1.013 bar (3)0.22 h (4)0.7881416114NoNo C 1 4
C 3 = (3)0.12 h (4)0.65
C 4 = (3)0.12 h (4)0.82
(1) Contact time defined with mass flow rate of the reactant. (2) Respective n-alcohol was fed instead of the olefin; N = N2, W = H2O, 3 = C 3 = , 4 = C 4 = , 5 = C 5 = , 6 = C 6 = , 7 = C 7 = (3) Three measurements diluted with N2 (excluded for parameter estimation). (4) Inverse value of minimum WHSV containing only the mass flow rate of the reactant.
Table 3. Properties of the different catalysts which were used for the kinetic models of methanol-to-olefins without olefin co-feed; besides the zeolite type, its silicon-to-aluminum ratio (Si/Al), its total number of acid sites as well as determination method, its ratio of Brønsted to Lewis acid sites (BAS/LAS) and its surface area according to the method by Brunauer–Emmett–Teller (BET) are shown. Furthermore, the time-on-stream (TOS) after which the kinetic data were taken, the particle size ( d P ) and information about whether an extrudate or pure powder was used are presented. The line separates the different subsections. A hyphen represents missing information.
ModelZeolite TypeSi/AlTotal AcidityBAS/LASBETTOS d P Extrudate
Menges [139]ZSM-5250 ( 1 ) ---0–3 h 2 mm ( 2 ) 50/50 % wt ( 3 )
(Zeolite/AlPO4)
Jiang [251]ZSM-5200---2 h ( 4 ) 600–900 μmNo
Gayubo [114]ZSM-524 ( 1 ) 0.51 mmol g cat 1 (NH 3 ) ( 1 ) 2.9 ( 1 ) 124 m2 g cat 1 6 h ( 5 ) 150–300 μm25/30/45 % wt (Zeolite/Bentonite/Alumina)
Aguayo [252]ZSM-530 ( 1 ) 0.23 mmol g cat 1 (NH 3 )1.5 at 423 K 220 m 2 g cat 1 5 h ( 5 ) 150–300 μm25/30/45 % wt (Zeolite/Bentonite/Alumina)
Pérez [253]ZSM-5280 ( 1 ) 0.33 mmol g cat 1 (t-BA)-301 m 2 g cat 1 0.17 h ( 5 ) 125–300 μm50/30/20 % wt (Zeolite/Boehmite/Alumina)
Park [132,254]ZSM-5200--400 m 2 g cat 1 0–5 h 500–1000 μmNo
Kumar [19]ZSM-5200 0.083 mmol g cat 1 ( 6 ) -400 m 2 g cat 1 0–5 h 500–1000 μmNo
Gayubo [255]SAPO-340.16 0.135 mmol g cat 1 (NH 3 ) ( 7 ) -875 m 2 g cat 1 ( 1 ) 1 h ( 5 ) 100–300 μm25/30/45 % wt (Zeolite/Bentonite/Alumina)
Ying [256]SAPO-34---264 m 2 g cat 1 0 h 250–400 μmYes
Chen [257]SAPO-340.16--->0 h 105–290 μmNo
Alwahabi [258]SAPO-34----0.25 h1.1 μmNo
Gayubo [259,260]SAPO-180.3 ( 8 ) 0.12 mmol g cat 1 (NH 3 )-171 m 2 g cat 1 0– 1.5 h 150–250 μm25/45/30 % wt (Zeolite/Bentonite/Alumina)
Kumar [146]ZSM-23260.62 mmol g cat 1 ( 6 ) --0–7 h ( 9 ) 250–420 μmNo
(1) Value of the zeolite, i.e., without binder. (2) Diameter of the cylindrical pellets used in this study (length = 5 mm). (3) Dry basis. (4) Additional TOS of 50 h to reach a plateau with constant propene yields. (5) Results extrapolated to 0 h TOS. (6) Calculated via the Si/Al ratio. (7) Extracted from an earlier publication [261]. (8) Value of the gel [151]. (9) Converted to an effective space time to describe a non-deactivated catalyst.
Table 4. Experimental conditions and modeling details for the kinetic models of methanol-to-olefins without olefin co-feed; the feed components, the temperature range (T), the total pressure ( p t ), the partial pressure range of the feed oxygenates ( p Ox ) and the maximum contact time ((W/ F in ) max ) with resulting oxygenates conversion ( X max ) are listed; concerning the model, the number of fitted responses ( N Res ), the number of estimated parameters ( N Par ), the number of experiments ( N Exp ) and the degree of freedom ( d o f ) are shown; and, finally, it is noted whether the model follows a type of a mechanistical scheme (Mech.), whether adsorption is considered (Ads.) and which side products are included (Side prod.). The line separates the different subsections. A hyphen represents missing information.
ModelFeedT p t p Ox (W/ F in ) max X max N Res N Par N Exp dof Mech.Ads.Side prod.
Menges [139]MeOH, N2673–723 K1.65 bar0.170–0.556 bar280 kg zeo s m t 3 ( 1 ) 161678 ( 2 ) 452NoNoNo
Jiang [251]MeOH673–773 K --384 g cat min mol C 1 -82024172NoNoC1–3
Gayubo [114]MW (3,4)573–723 K 1.013 bar - 0.37 g cat h g MeOH 1 0.8 ( 5 ) 3 ( 6 ) 15--HWH2O-
Aguayo [252]MeOH673–823 K 1.013 bar 1.013 bar ( 7 ) 2.50 g cat h mol C 1 172618100NoNoC1–4, C 6 8 ar
Pérez [253]DME598–673 K1.10 bar1.10 bar6 g cat h mol C 1 1103039360HWMW ( 4 ) C1–4, C 6 8 ar
DME, He648 K0.28–1.10 bar1 g cat h mol C 1 0.5
DME, H2O648 K0.99–1.10 bar1 g cat h mol C 1 0.5
DME, MeOH623–673 K1.10 bar1 g cat h mol C 1 0.5
Park [132,254]MNW (4)633–753 K 1.04 bar-2 g cat h mol C 1 0.793331246LLEH ( 8 ) 28 MD (4)No
Kumar [19]MNW (4)633–753 K 1.04 bar- 6.5 kg cat s mol C 1 0.78 ( 9 ) 29--LLEH ( 8 ) 27 MD (4)No
Gayubo [255]MW (3,4)623–748 K --0.44 g cat h g MeOH 1 15 ( 10 ) 17--HWH2OC1–4
4 ( 10 ) 8--HWH2OC1–4
Ying [256]MW (3,4)723–763 K 1.013 bar0.203–1.013 bar0.03 g cat h g MeOH 1 171343288HWH2OC1–6
Chen [257]HM (4,11)673–823 K -0.072–0.830 bar0.02 h ( 12 ) 0.95712 (4x)--NoNoC2–3
Alwahabi [258]MeOH, H2O673–723 K 1.04 bar0.208 bar2.95 g cat h mol C 1 0.88630924LLEH ( 8 ) 25 MD ( 4 ) No
Gayubo [259,260]MW (3,4)598–748 K --0.68 g cat h g MeOH 1 0.9 ( 5 ) 411--HWH2OC1
515--HWH2OC1–4
Kumar [146]MeOH, He673 K 1.013 bar-57.7 kg cat s mol C 1 0.95781276LLEH ( 8 ) 27 MD ( 4 ) No
(1) Value based on outlet volumetric flow rate where volume expansion is considered. (2) Extracted from [262]. (3) Experiments both with and without water dilution. (4) D = DME, H = He, M = MeOH, N = N2, W = H2O, 27 = C 2 7 = , and 28 = C 2 8 = . (5) Calculated with the lowest oxygenates fraction shown; conversion might be higher for measurements not presented. (6) Another lump (higher hydrocarbons) calculated via conservation of mass. (7) No feed dilution mentioned. (8) LLEH = L, LH, ER, HW. (9) Two additional responses (methanol and water) from carbon and hydrogen balance. (10) Another lump (methanol plus DME) calculated via conservation of mass. (11) Extracted from [263]. (12) Inverse value of the minimum WHSV.
Table 5. Properties of the different catalysts which were used for the kinetic models of methanol-to-olefins with olefin co-feed; besides the zeolite type, its silicon-to-aluminum ratio (Si/Al), its total number of acid sites as well as the determination method, its ratio of Brønsted to Lewis acid sites (BAS/LAS) and its surface area according to the method by Brunauer–Emmett–Teller (BET) are shown. Furthermore, the time-on-stream (TOS) after which the kinetic data were taken, the particle size ( d P ) and the information on whether an extrudate or pure powder was used are presented. A hyphen represents missing information.
ModelZeolite TypeSi/AlTotal AcidityBAS/LASBETTOS d P Extrudate
Huang [240]ZSM-5200 ( 1 ) 0.012 mmol g cat 1 (NH 3 )1.35 at 423 K 301.1 m 2 g cat 1 0–10 h ( 2 ) 125–149 μm70/30 % wt (Zeolite/Alumina)
Wen [303]ZSM-5 on microfibers147--93 m 2 g cat 1 ( 3 ) -16.1 mm ( 4 ) No, but 19/81 % wt (Zeolite/Microfiber)
ZSM-5155----100–300 μmNo
(1) Value of the zeolite, i.e., without binder. (2) Regeneration after 10 h TOS. (3) Extracted from [304]. (4) Diameter of the circular sample chips.
Table 6. Experimental conditions and modeling details for the kinetic models of methanol-to-olefins with olefin co-feed; the feed components, the temperature range (T), the total pressure ( p t ), the partial pressure range of the feed oxygenates as well as the feed olefins ( p i , in that order) and the maximum contact time ((W/ F in ) max ) with resulting oxygenates conversion ( X max ) are listed; concerning the model, the number of fitted responses ( N Res ), the number of estimated parameters ( N Par ), the number of experiments ( N Exp ) and the degree of freedom ( d o f ) are shown; and, finally, it is noted whether the model follows a type of a mechanistical scheme (Mech.), whether adsorption is considered (Ads.) and which side products are included (Side prod.). A hyphen represents missing information.
ModelFeedT p t p i (W/ F in ) max X max N Res N Par N Exp dof Mech.Ads.Side prod.
Huang [240]MeOH, C 3 = ,673–763 K1.013 bar0.050 bar4.3 kg cat s mol t 1 0.9082079612LH, HW C 2 7 = , H2O,No ( 2 )
N2, H2O (1)0.050 barERMeOH
MeOH, C 4 = , 2.9 kg cat s mol t 1 0.92
N2, H2O (1)
MeOH, C 5 = , 2.5 kg cat s mol t 1 0.92
N2, H2O (1)
MeOH, C 6 = , 2.5 kg cat s mol t 1 0.92
Wen [303] ( 3 ) MeOH, N2 (4)673–753 K 1.013 bar (5)0.304 bar32 gcat h mol C 1 1103846422NoNoC1–6
Wen [303] ( 3 ) MeOH, N2 (4)673–753 K 1.013 bar (5)0.304 bar32 gcat h mol C 1 1103845412NoNoC1–6
(1) Respective n-alcohol was fed instead of the olefin. (2) Side product formation included in subsequent publication [305]. (3) Similar kinetic model for microfibered (first line) and powdered (second line) catalyst, but different d o f . (4) Pure methanol as feed, but model only works when olefins are present (comparable to co-feeding studies). (5) Extracted from [304].

