Article

Metal Micro-Monoliths for the Kinetic Study and the Intensification of the Water Gas Shift Reaction

by
Nuria García-Moncada
1,*,
Gianpiero Groppi
2,
Alessandra Beretta
2,
Francisca Romero-Sarria
1 and
José Antonio Odriozola
1
1
Instituto de Ciencia de Materiales de Sevilla and Departamento de Química Inorgánica, Centro Mixto CSIC-Universidad de Sevilla, Av. Américo Vespucio 49, 41092 Sevilla, Spain
2
Laboratory of Catalysis and Catalytic Processes, Dipartimento di Energia, Politecnico di Milano, via La Masa 33, 20156 Milano, Italy
*
Author to whom correspondence should be addressed.
Catalysts 2018, 8(12), 594; https://doi.org/10.3390/catal8120594
Submission received: 12 November 2018 / Revised: 24 November 2018 / Accepted: 27 November 2018 / Published: 30 November 2018
(This article belongs to the Special Issue Structured Catalysts for Catalytic Processes Intensification)

Abstract

:
A kinetic study of the water gas shift (WGS) reaction has been carried out on a Pt-based catalyst promoted by a Zr-based proton conductor. The investigation was first performed on powders with diluted feed mixtures and then extended to more severe and representative conditions by using a catalyst coated metallic micromonolith. Temperature measurements reveal that isothermal conditions were obtained along the micromonolith during the tested conditions. In addition, the very thin catalytic layer allows for the discarding of intraporous resistances, providing excellent conditions to analyse the kinetics of the WGS reaction under the integral regime. The proposed rate expression accounts for independence on CO concentration, an inhibiting effect of H2 and a promoting effect of H2O; kinetic orders on CO and H2 are in line with those reported in the literature for the Pt-based catalyst. Instead, the obtained reaction order of water (0.36) is significantly lower than that reported for unpromoted catalysts (typically 0.77–1.10) in good agreement with the proposed water-enhancer effect of the proton conductor on the rate-limiting step. Metallic micromonoliths turn out to be a powerful tool for the kinetic investigation, due to the absence of mass and heat transport limitations and represent a strategy for the intensification of the WGS unit for future applications of fuel processors in small mobile devices.

Graphical Abstract

1. Introduction

The determining role of water activation in the water gas shift (WGS) reaction over Pt-based catalysts is extensively accepted, since a significant influence of water pressure in the kinetics and positive reaction orders have been largely documented in the literature [1,2,3,4,5,6]. Although the nature of the rate-determining step is still uncertain and it has been reported to vary with the experimental conditions, it is commonly accepted that water activation (i.e., adsorption, diffusion and dissociation) is required to surpass high energy barriers thus slowing the reaction pathway [7,8,9,10]. In some studies, the diffusion of the dissociated water and the availability of OH species to interact with adsorbed CO have been pointed out as rate-limiting factors [6,11,12]. Accordingly, the adoption of a partially reducible oxide as support and the creation of oxygen vacancies have been reported to enhance the water dissociation and the surface concentration of available OH species providing higher WGS reaction rates and better catalytic performances, not only by improving the water activation step, but also by favouring the reactions of the intermediate species to produce H2 and CO2 [1,2,13,14,15,16,17].
The promoter effect of a Zr-based proton conductor physically mixed with a typical Pt-based catalyst has been demonstrated previously in our group [18,19,20]. These materials present oxygen vacancies capable of providing dissociated water and labile OH species which enhance the proton conductivity and, therefore, the CO conversion. A proton conductor promoted catalyst is herein investigated by an extensive kinetic study, which aims at the development of a simple but representative rate expression, useful for future engineering applications. These may include both conventional synthesis gas treatments of the industrial chemistry, and novel small-scale applications of fuel processing for the feeding of proton-exchange membrane (PEM) fuel cells.
At this purpose, the intensification of WGS units is mandatory and drives the improvement of catalyst and reactor designs. This is the reason why, in this study, the ionic conductor-promoted catalyst was studied in the form of structured catalyst, since this appears as an efficient strategy to reduce the reactor volume as well as to use high space velocities. In addition, structured configurations can represent flexible lab-scale solutions for the kinetic investigations, thus extending the possibilities of traditional fixed bed micro-reactors, by providing solutions for the elimination of mass and heat diffusional problems, especially under industrial feed conditions.
In this context, it has been reported that the use of micromonolithic structured catalysts reduces the reactor volume to one half for the same WGS efficiency [21]. Pt-based structured catalysts over micromonolithic supports have been reported showing promising results regarding catalyst activity and stability [11,22,23]. More specifically, the longitudinal parallel channel micromonoliths allow higher space velocities avoiding significant pressure drops. Moreover, better use of reactor volume and catalyst coverage can be achieved with these structures, since the exposed area is larger and the system allows the use of thin catalytic layers [24]. As a consequence, better control of the layer thickness is achieved and diffusional problems can be avoided.
Micromonoliths are often manufactured using metallic or ceramic substrates. Metallic support presents important advantages against ceramic ones, including much higher thermal conductivity and mechanical shock resistance. Thus, the highest heat diffusion provides isothermal conditions along the micromonolith and avoids the formation of hot-spots. Moreover, the use of metallic sheets, thinner than their ceramic homologues, allows for the manufacturing of denser unit cell per surface (cpsi) systems with higher exposed surface and thinner catalytic layers [25].
In this work, the kinetics of WGS over a promoted catalyst is first studied using powdered material and then investigated over a structured system. A typical Pt catalyst supported on CeO2-doped Al2O3 physically mixed with a Mo- and Eu-doped ZrO2 proton conductor is used. Both the powdered and structured samples have been already prepared, characterized and catalytically tested in a previous work [18,20], showing on one side the water-promoter effect, and on the other side, the accomplishment of thin catalytic layers. This allows for the performance of a kinetic study free from mass diffusional limitations [26,27]. In this study, a traditional packed bed microreactor was used to analyse the kinetics of the WGS reaction under diluted feed conditions and minimized thermal effects; the investigation was extended towards more concentrated feed streams and thermally severe conditions by the use of the coated micromonoliths.

2. Kinetic Analysis Methodology

A preliminary analysis by a differential reactor approach was considered for a first estimation of the kinetic dependences using experiments where CO conversions were below 20% [28,29]. In these conditions, the reaction rate was calculated as follows:
r C O = ξ C O · F C O I n W ,
where the rate is expressed in mol·s−1·gcat−1, ξCO is the CO conversion, FCO is the inlet molar flow rate of CO (mol·s−1) and W is the catalyst weight (g).
By expressing the reaction rate in a power law form [30]
r = k ( T ) i N P i α i ,
The single reaction orders (αi) can be estimated from the bi-logarithmic plot of the measured reaction rate vs the partial pressures of the ith species
ln ( r ) = ln ( k ) + α i · ln ( P i ) ,
The identification of reaction orders was herein taken as a basis for the proposal of a more general rate of expression, assuming the general definitions described by Hougen and co-workers [31,32] as a combination of kinetic terms, potential terms and adsorption terms:
r = ( k i n e t i c   t e r m s ) ( p o t e n t i a l   t e r m s ) ( a d s o r p t i o n   t e r m s ) n ,
The adequacy of the proposed rate expression and the estimate of intrinsic parameters were obtained by extending the analysis to the whole set of integral data. At this scope the rate equation was introduced in the differential pseudo-homogeneous 1D plug-flow model of the micro-reactor:
d Y C O d W = r C O F T o t ,
with   initial   condition :   Y i = Y i 0 ,
where FTot is the total inlet molar flow (mol·s−1), YCO is the CO molar fraction, Yi is the molar fraction of the ith species, −rCO is the reaction rate (mol·s−1·gcat−1) and W is the catalyst weight (g).
Equation (5) was integrated by the method of lines, that is, by approximating the differential of CO concentration across the indefinite catalyst weight as:
Y C O i + 1 = Y C O i Δ W F I n ( r C O ) ,
Kinetic parameters of the proposed rate expression were estimated by model fit, that is, by minimizing the sum of the square difference between the experimental and calculated molar fraction of CO in each experiment using the generalized reduced gradient (GNG) nonlinear solving method:
m i n ( Y C O E x p .   D a t a Y C O E q .   7 ) 2 ,

3. Results

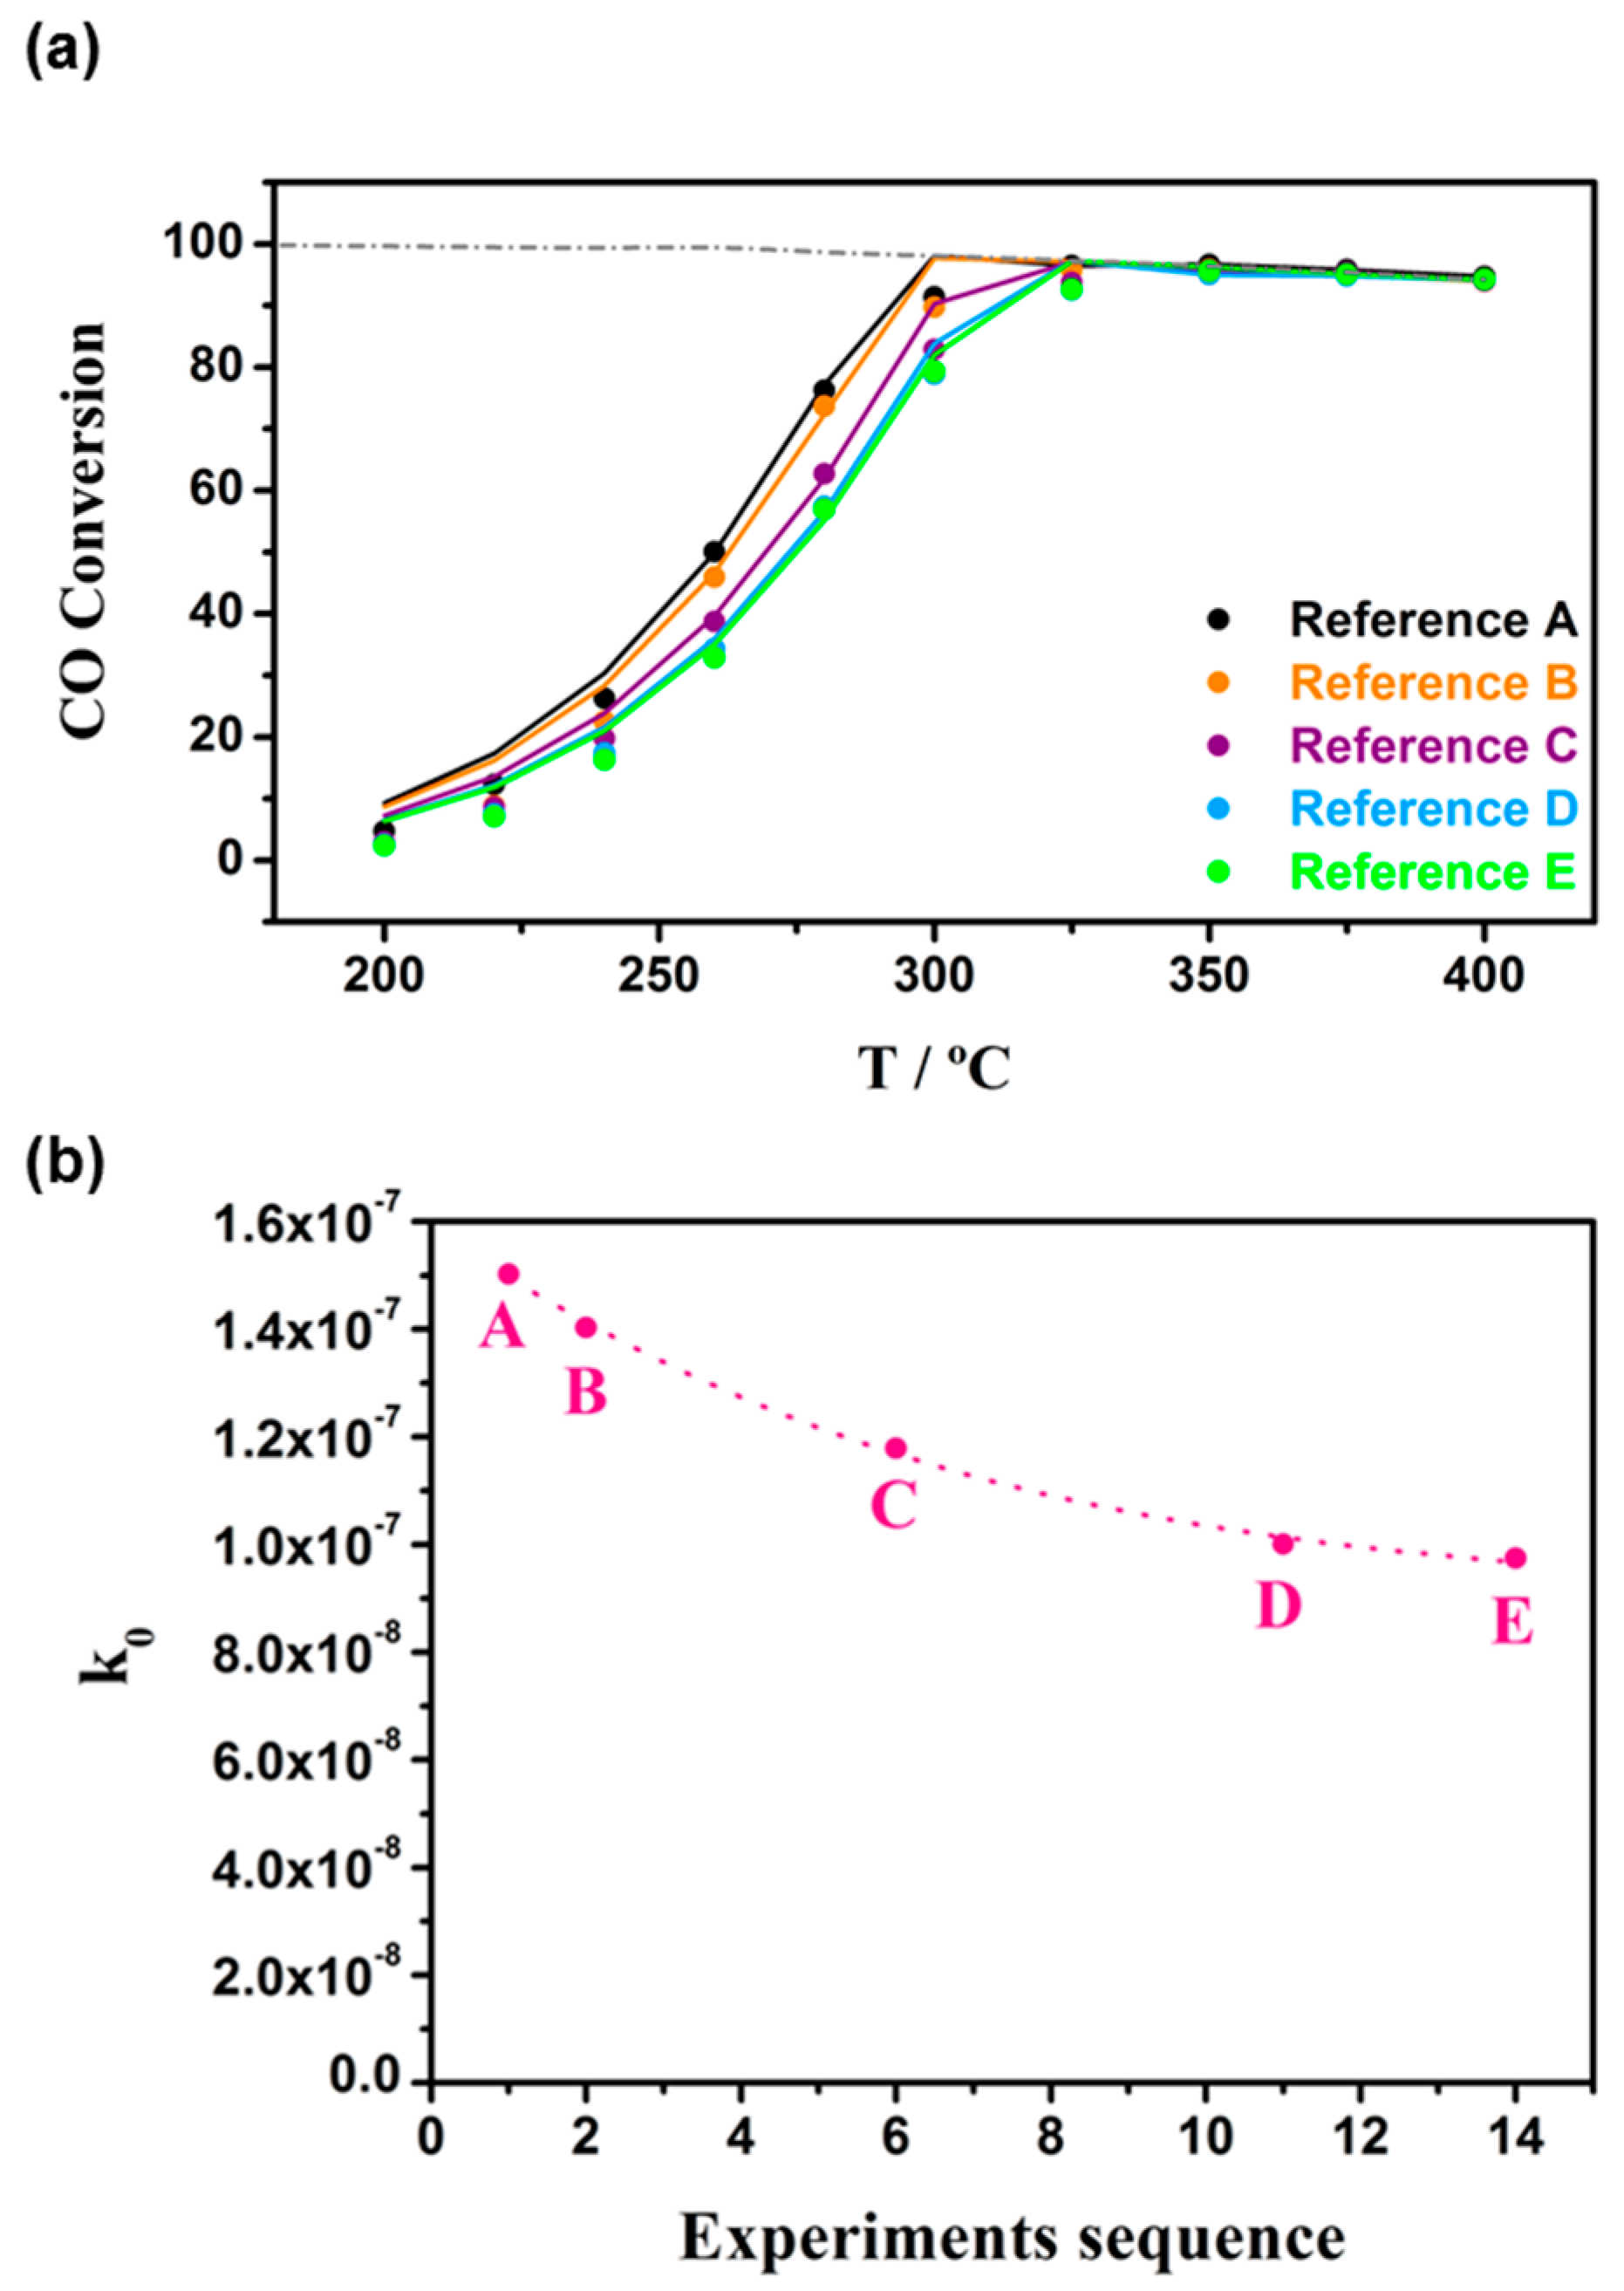
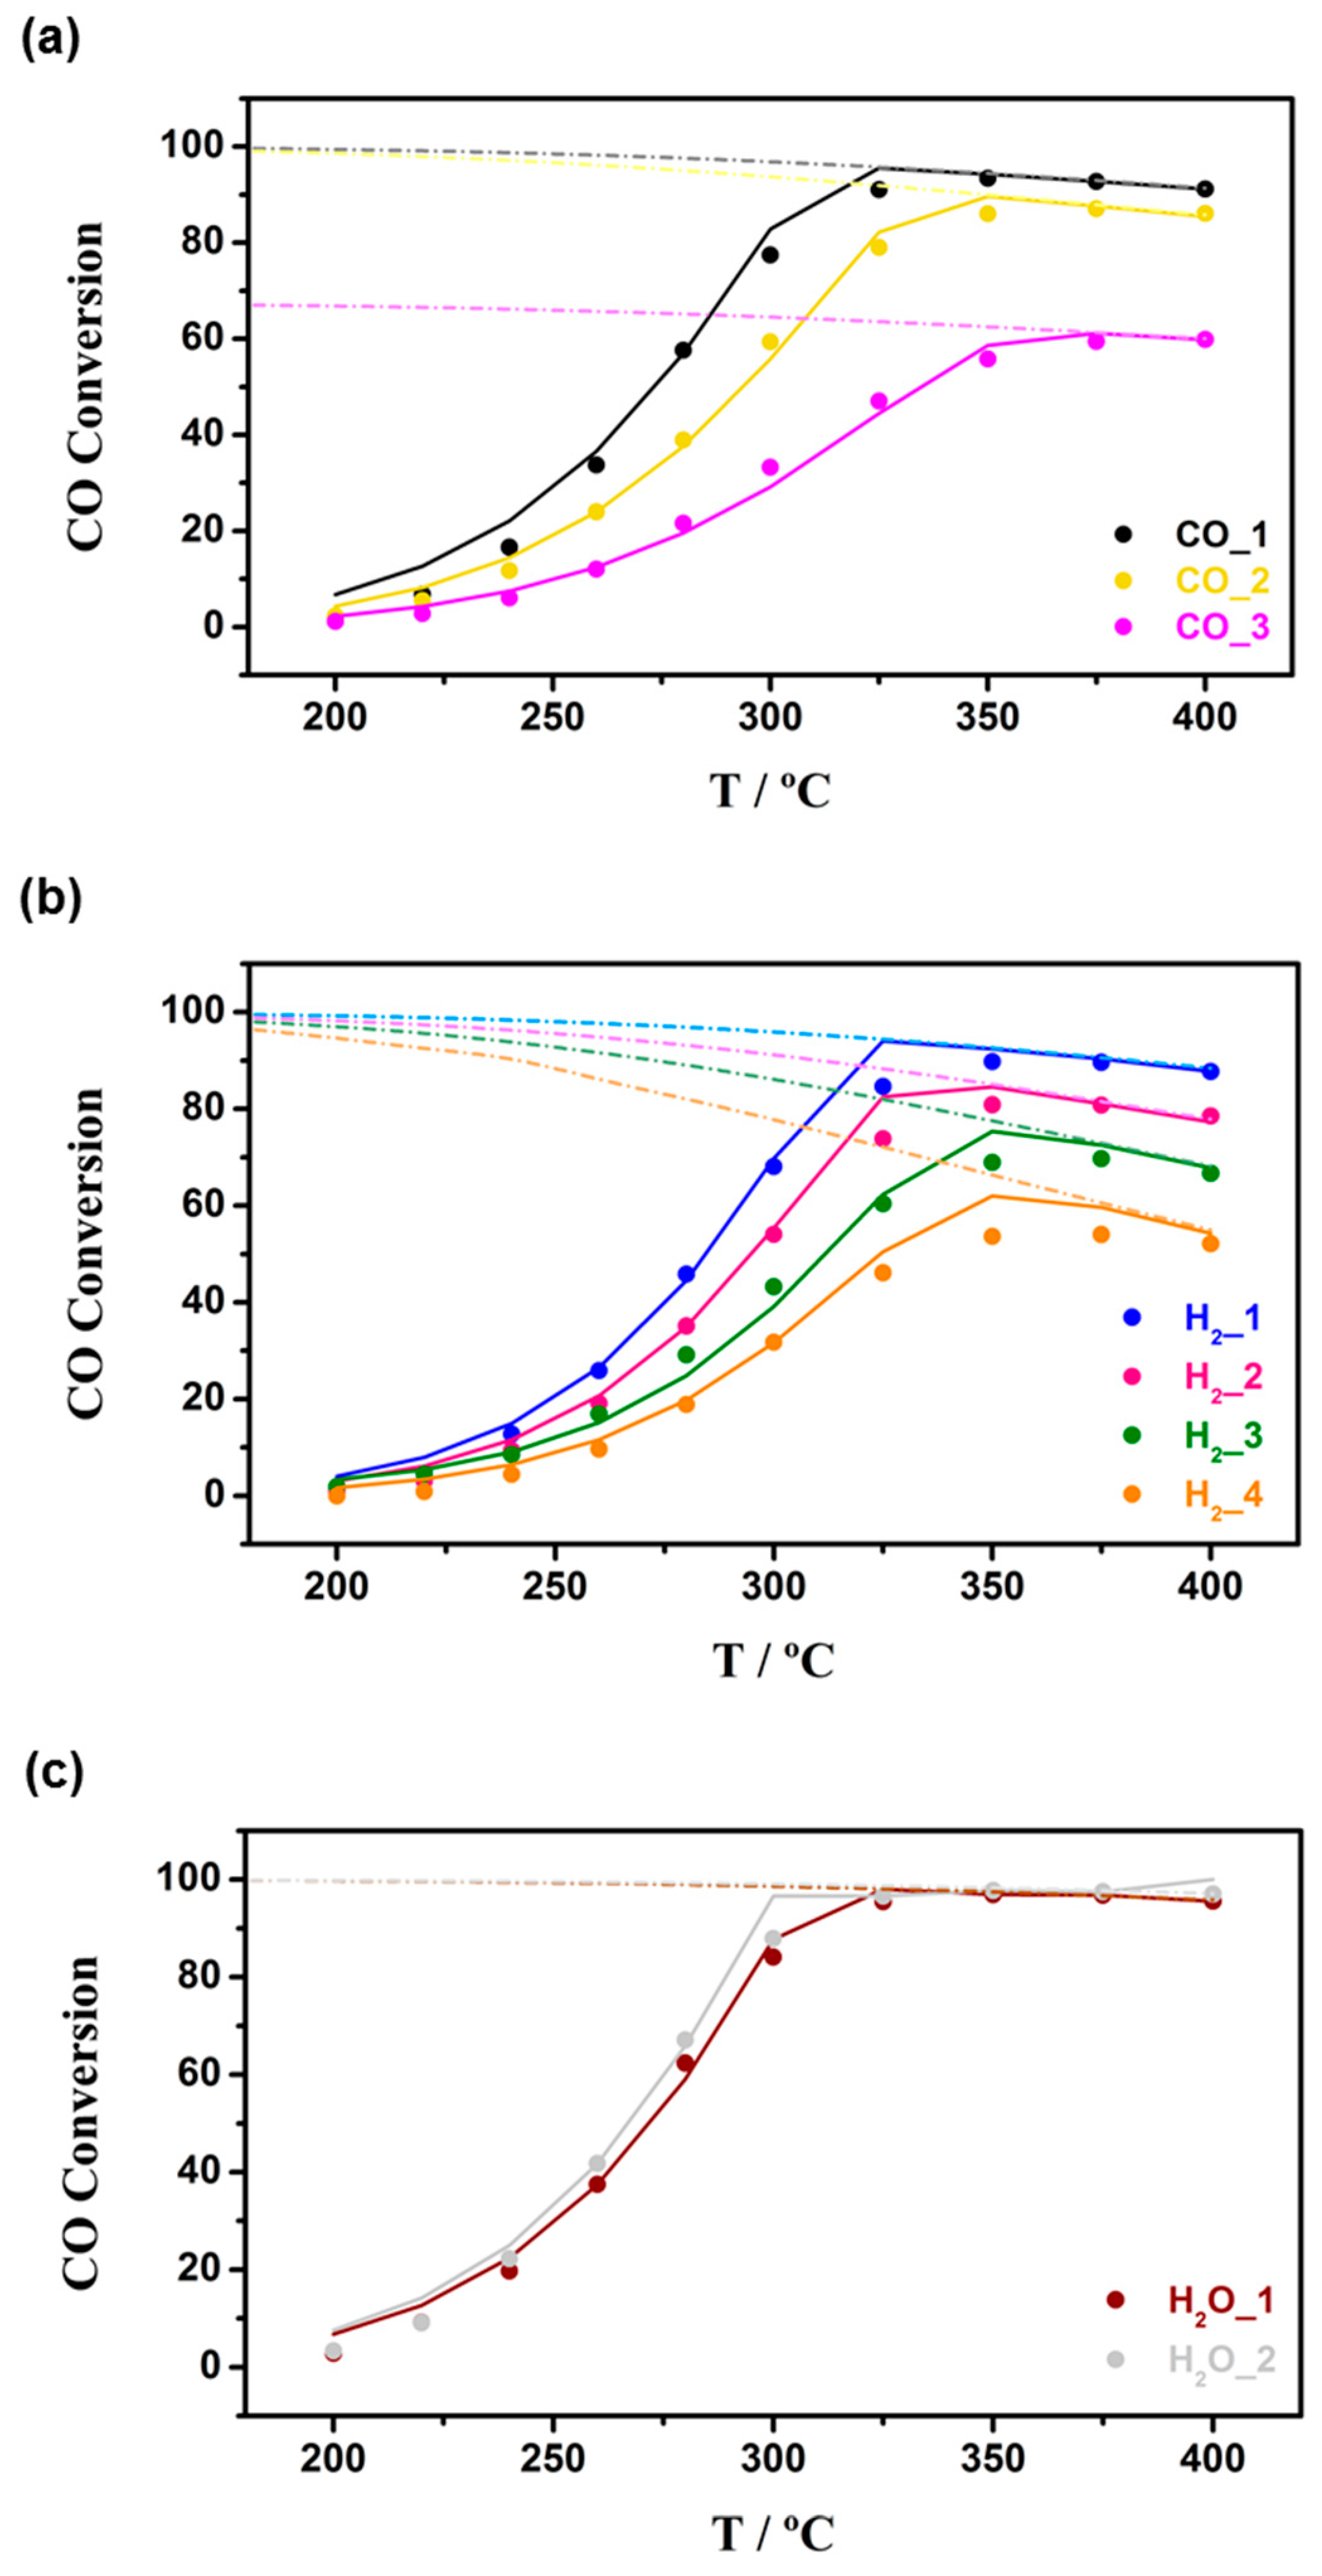
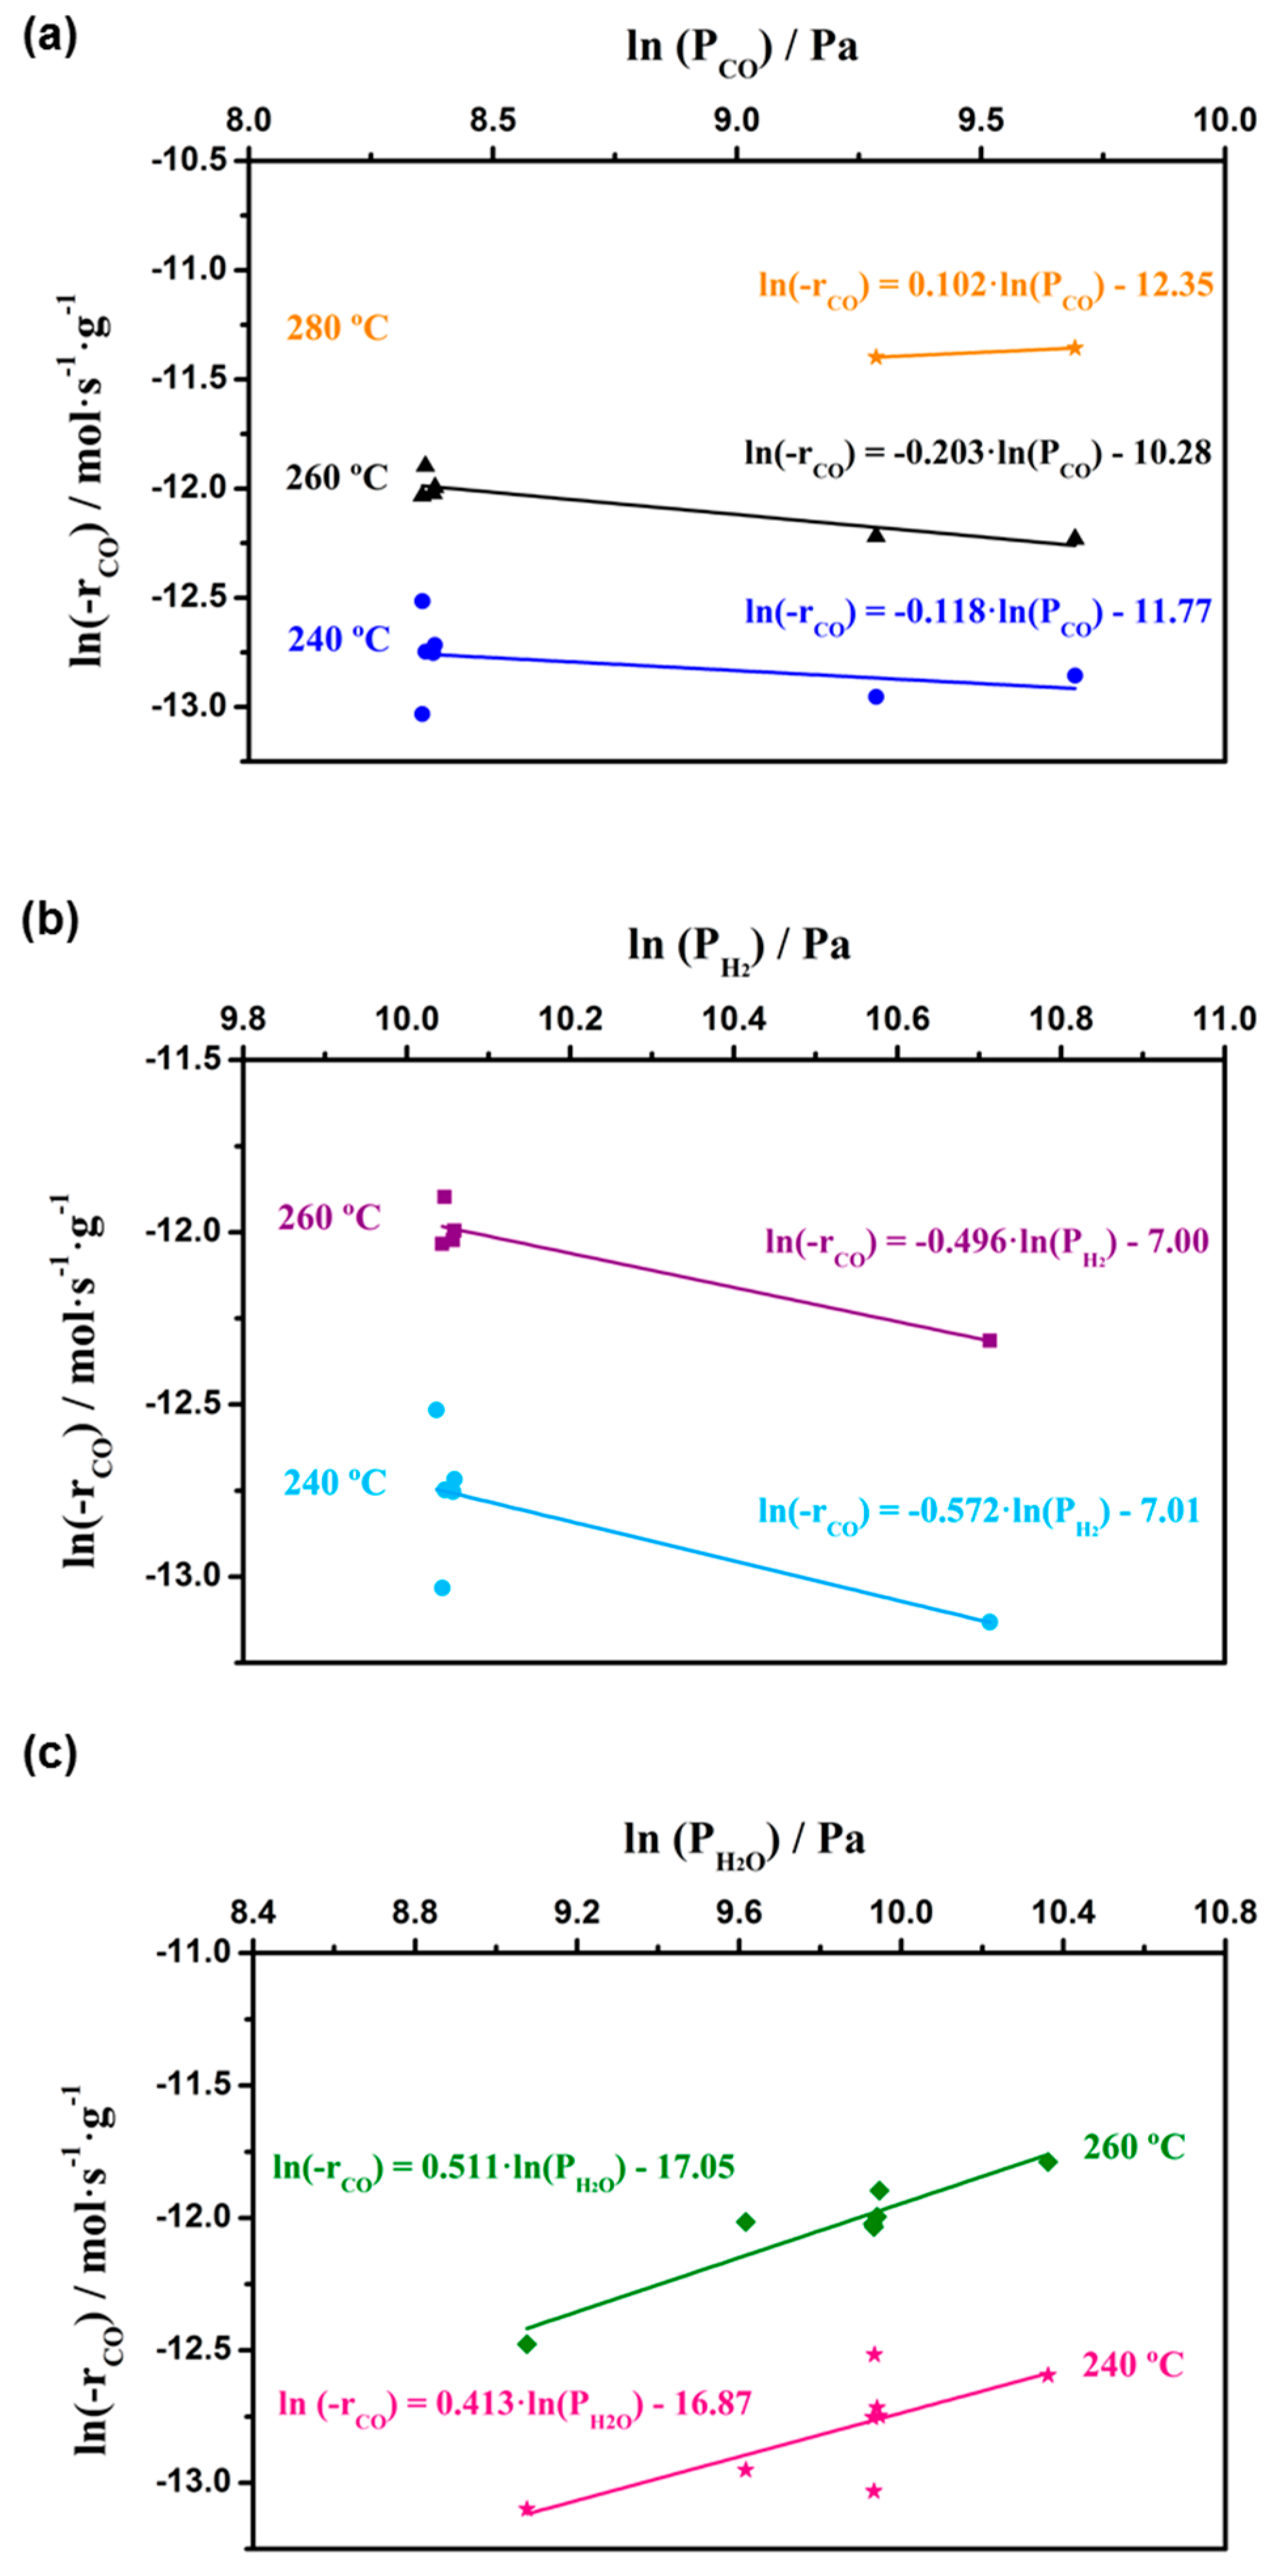
3.1. Kinetic Study on Powdered Catalyst

The kinetic analysis was performed at atmospheric pressure and at 80,000 mL·h−1·gcat−1 space velocity according to keep the reaction far from thermodynamic limitations in a sufficiently wide range of temperatures. The selected high space velocity allows observation of the promoter effect of the proton conductor in conditions representative of a small-scale application. The amount of PtCeAl catalyst in the reactor was maintained at 0.1 g with a mass ratio Cat/IC of 1:5 according to the previous studies [20].
The experiments were performed from 175 °C to 400 °C. A feed composition of 1.3% CO and 2.8% H2O balanced with N2 was used as a reference test. Then, the composition of the feed was varied in the ranges of 1.2–4.2 vol.% for CO, 2.7–5.1 vol.% of H2O and 0–21 vol.% of H2, balanced with N2, thereby keeping constant the total flow rate and the space velocity during the whole study. The first experiment was selected as the reference test. This test was then periodically repeated in order to monitor the decrease of the activity due to the deactivation of the catalyst. Table 1 summarizes the campaign of experiments performed in the micro-packed bed reactor:
Figure 1 presents the rates calculated by differential approach (Equation (1)) on varying the partial pressures of every component according to Equation (3) at different temperatures in the 200–240 °C range, which are selected for presenting CO conversions below 20%. Not surprisingly, the reaction order for CO is around zero in agreement with extensively reported data for Pt-based catalysts [1,4,33]. Therefore, the CO concentration exhibits no meaningful influence in the reaction rate. On the other side, the high positive reaction order for H2O and the negative one for H2 are also expected for WGS reaction rates on Pt-based catalysts [1,2,4,6,34].
According to the first approximation for the reaction orders using a differential reactor approach, which is also in agreement with that reported in the literature for Pt-based catalysts, the following rate expression for an integral reactor approach analysis was assumed as previously reported in the literature [32,35,36,37,38,39,40].
r C O = k P H 2 O β ( 1 η ) 1 + A P H 2 α ,
where pressures are in Pa and the rate in mol·s−1·gcat−1.
In Equation (9), the contribution of CO partial pressure was neglected while the positive influence of H2O concentration and the negative effect of H2 adsorption have been considered. The H2 adsorption constant (A) has been considered invariable in the temperature range studied to simplify calculations and the kinetic constant (k) has been evaluated with respect to a reference temperature (T0) to reduce the correlation between the preexponential factor (k0) and the activation energy (Ea) [28]:
k = k 0 exp [ E a R ( 1 T 1 T 0 ) ] ,
The η factor, also known as reversibility factor [1], is calculated as the ratio between the pressure quotient and the thermodynamic constant (Equation (11)). Therefore, its value ranges between 0 and 1, where the latter (η = 1) means that the thermodynamic equilibrium conversion has been achieved:
η = P C O 2 P H 2 P H 2 O P C O K e q ,
The equilibrium constant (Keq) has been estimated by the widely used correlation proposed by Moe [41] for WGS reaction studies:
K e q = e x p ( 4577.8 T 4.33 ) ,
A parameter (D) related to the deactivation was included in the rate expression, since the deactivation process for this catalyst is quite significant, thereby changing the kinetic constant value. Then, for the reference tests, a preliminary determination of the Ea, A, α and β values were estimated and fixed, evaluating thereby the decreasing value of the k0 parameter. Consequently, the factor “D” was introduced in the rate equation and was defined as:
D i = k 0 R e f .   i k 0 R e f .   A ,
where k0Ref.i is the preexponential factor (k0) of a reference test and k0Ref.A is the preexponential factor of the first test (Reference A). Thus, the Di factor decreases on increasing time on stream; that is, for consecutive experiments, being associated to the set of tests regarding the proximity in time of each reference test.
Finally, a correction factor was added to make the rate expression fully adequate to describe the system, even in the cases of complete conversion of CO:
σ C O = χ C O 10 4 + χ C O ,
The function σCO in fact is such that it is equal to 1 until the molar fraction of CO decreases below the threshold value of 10−4; in this case σCO drops to zero. This type of correcting term is important when the reaction rate does not show a kinetic dependence from the limiting reactant, CO in this case. Therefore, the final proposed reaction rate expression is defined as:
r C O = k P H 2 O β ( 1 η ) 1 + A P H 2 α · D i · σ C O ,
This expression is then used in Equation (7) to estimate the kinetic parameters by minimization of Equation (8). The obtained values are reported in Table 2 and were achieved considering a reference temperature (T0) of 473.15 K and by adapting the model to those data that satisfy the constraint η ≤ 0.1, that is, the data belonging to the kinetic control range and are far from the equilibrium conditions. To estimate Equation (7), temperatures are expressed in K, partial pressures in Pa and the rate in mol·s−1·gcat−1.
The calculated CO conversion using the proposed model (Equation (15) and Table 2) is plotted against the experimental CO conversion for all tests at every temperature that obeys to η ≤ 0.1 constraint (Figure 2). The good correspondence between the model and the data is noticeable, indicating a good estimation of the kinetic parameters summarized in Table 2.
The estimated kinetic parameters are in good agreement with those found for similar Pt-based catalysts. For instance, the activation energy as well as the reaction orders are comparable to those reported by Phatak et al. [4], where the activation energies vary between 68 and 84 kJ/mol and the reaction orders are close to zero for CO and CO2, from −0.38 to −0.49 for H2, and high values, between 0.77 and 1.1 are reported for H2O. Only when the Pt is supported on CeO2 a reaction order for H2O as low as 0.44 is reported. This is probably due to the promoter effect of ceria on water activation, which is also in concordance with the idea proposed in this work. Similar results for Ea (~70 kJ/mol) and reaction orders (−0.36 and 0.63 for H2 and H2O, respectively) are obtained by Grabow et al. [2] using both theoretical DFT analysis and experimental data for a Pt/Al2O3 catalyst. Furthermore, Germani et al. determined the kinetic parameters using both power law based and LH based reaction rate expressions for the WGS reaction on microstructured Pt/CeO2/Al2O3 catalysts [1,42]. These authors fit their data considering reaction orders equal to 0.49 and −0.45 for H2O and H2, respectively, and activation energies of 86 kJ/mol and 76.8 kJ/mol for the Pt-based catalysts depending on the catalyst preparation method. On considering the LH-based rate law expression, an activation energy of 78.2 kJ/mol is calculated. Moreover, the highest adsorption constant is obtained for H2 that they assume, as in this work, independent of temperature. Therefore, the kinetic model proposed in Equation (15) and the resulting parameters are in good agreement with the previously reported investigations.
It is worth underlining the low value obtained for the reaction order of water (0.36) in this work in relation to those found in the literature. This indicates an improvement in the water activation step that must be associated to the presence of the ionic conductor, which would provide a higher amount of the available dissociated water [18]. Consequently, the concentration of reactive OH species next to adsorbed CO is likely higher, decreasing the rate control level of this step. This behaviour is also in good agreement with that observed when ceria support was used instead of alumina support as described above, but made more intense by the addition of the ionic conductor.
A more detailed analysis of the model fit quality is presented in Figure 3 and Figure 4. In particular, Figure 3a shows the comparison between experimental and calculated data in CO conversion vs Temperature for the sequence of reference tests from Test A to Test E. A satisfactory description of the activity decay was obtained by the simple estimate of the Di factor, that is, by simply correcting the k0 parameter as shown in Figure 3b. About one third of the initial activity was lost during 12 consecutive tests. However, from reference test D the deactivation is unappreciable, indicating that the stabilization was accomplished. The behaviour followed by k0 parameter (Figure 3b) is also in good agreement with the deactivation profile observed in a previous deactivation study with the same sample carried out at the same space velocity at 330 °C (see below in structured catalyst analysis). As better discussed in the following, the phenomenon may be associated with the blocking of the active surface.
In the same way, the CO conversion vs Temperature plots have also been reported in Figure 4a–c for the tests exploring the effect of CO, H2 and H2O, respectively, showing the ability of the model to capture the investigated compositional effects in a wide temperature range.

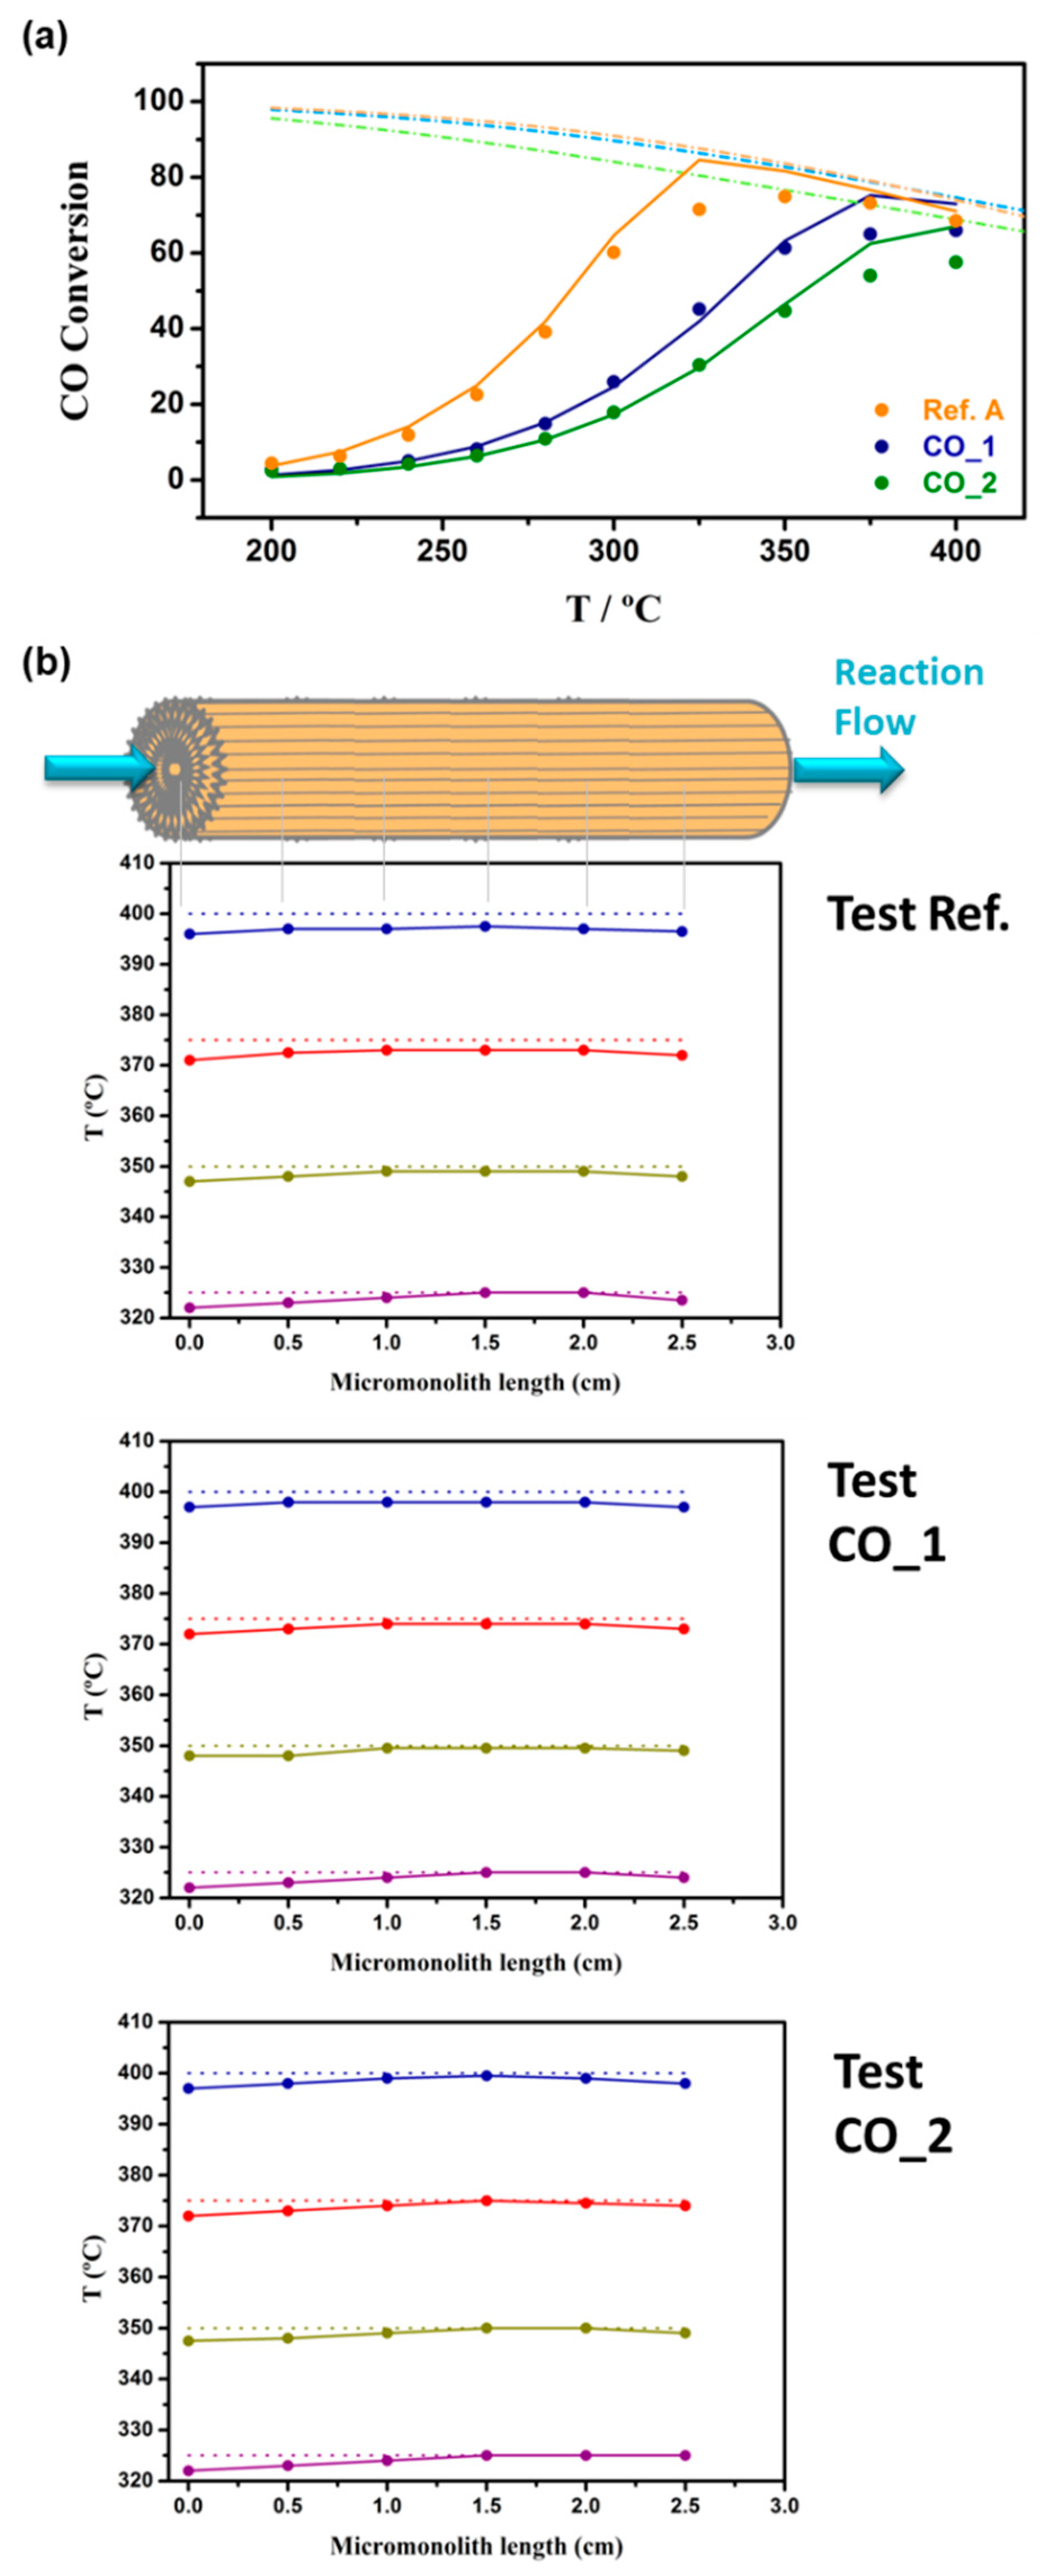
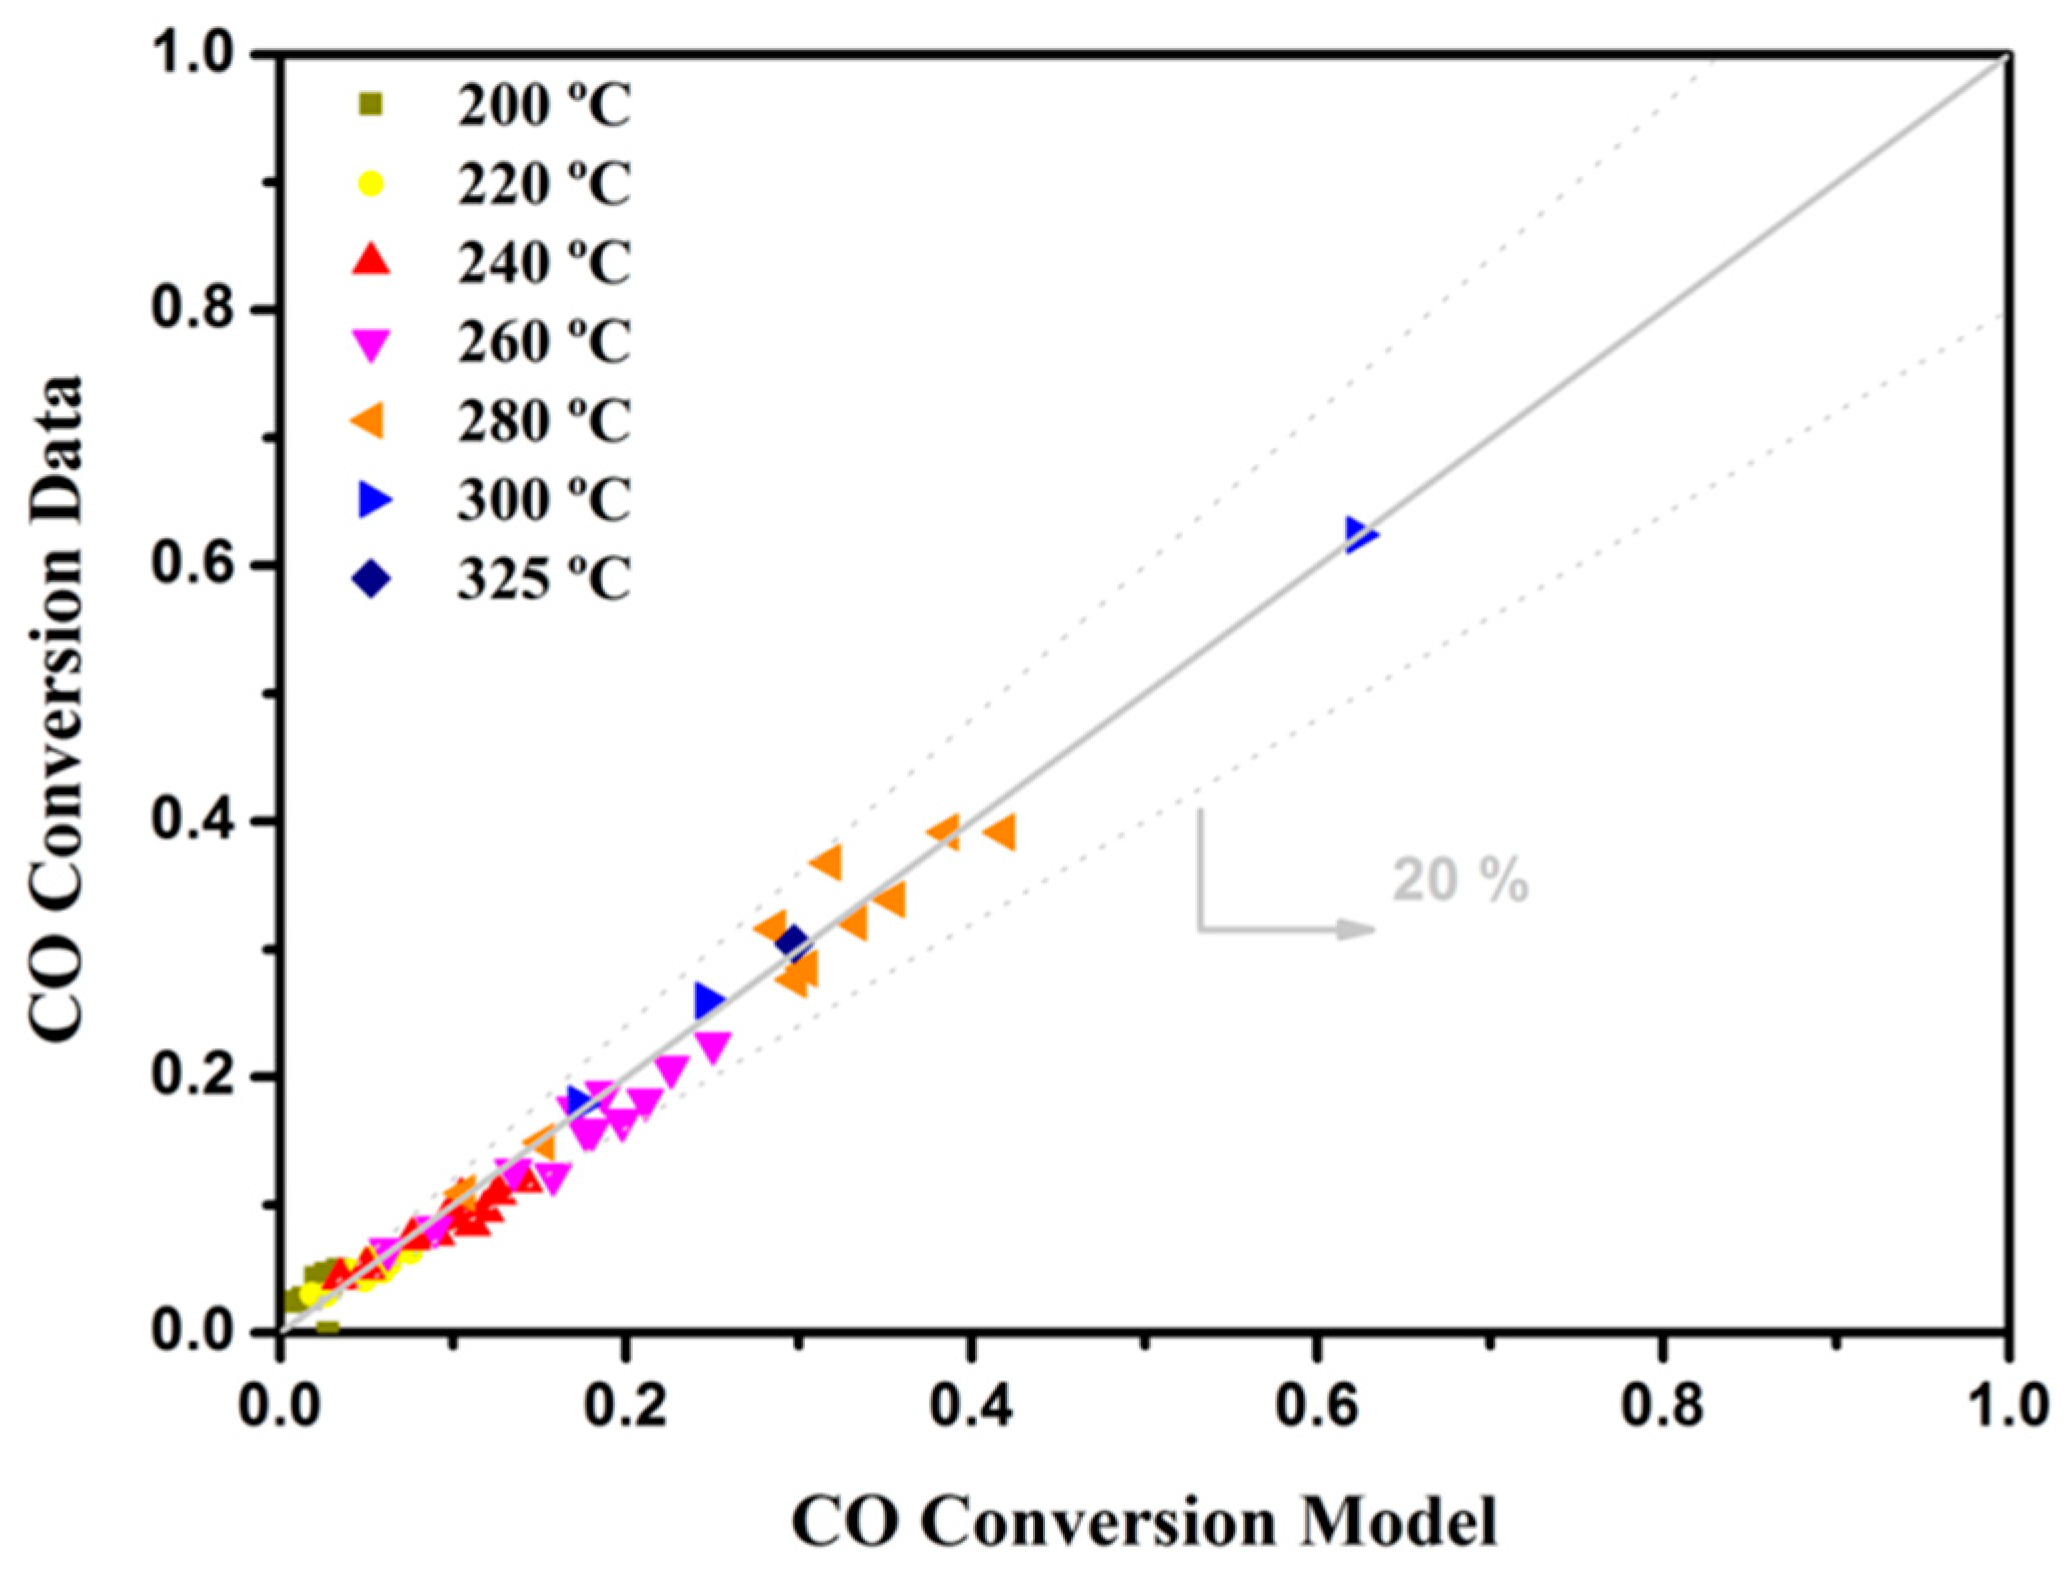
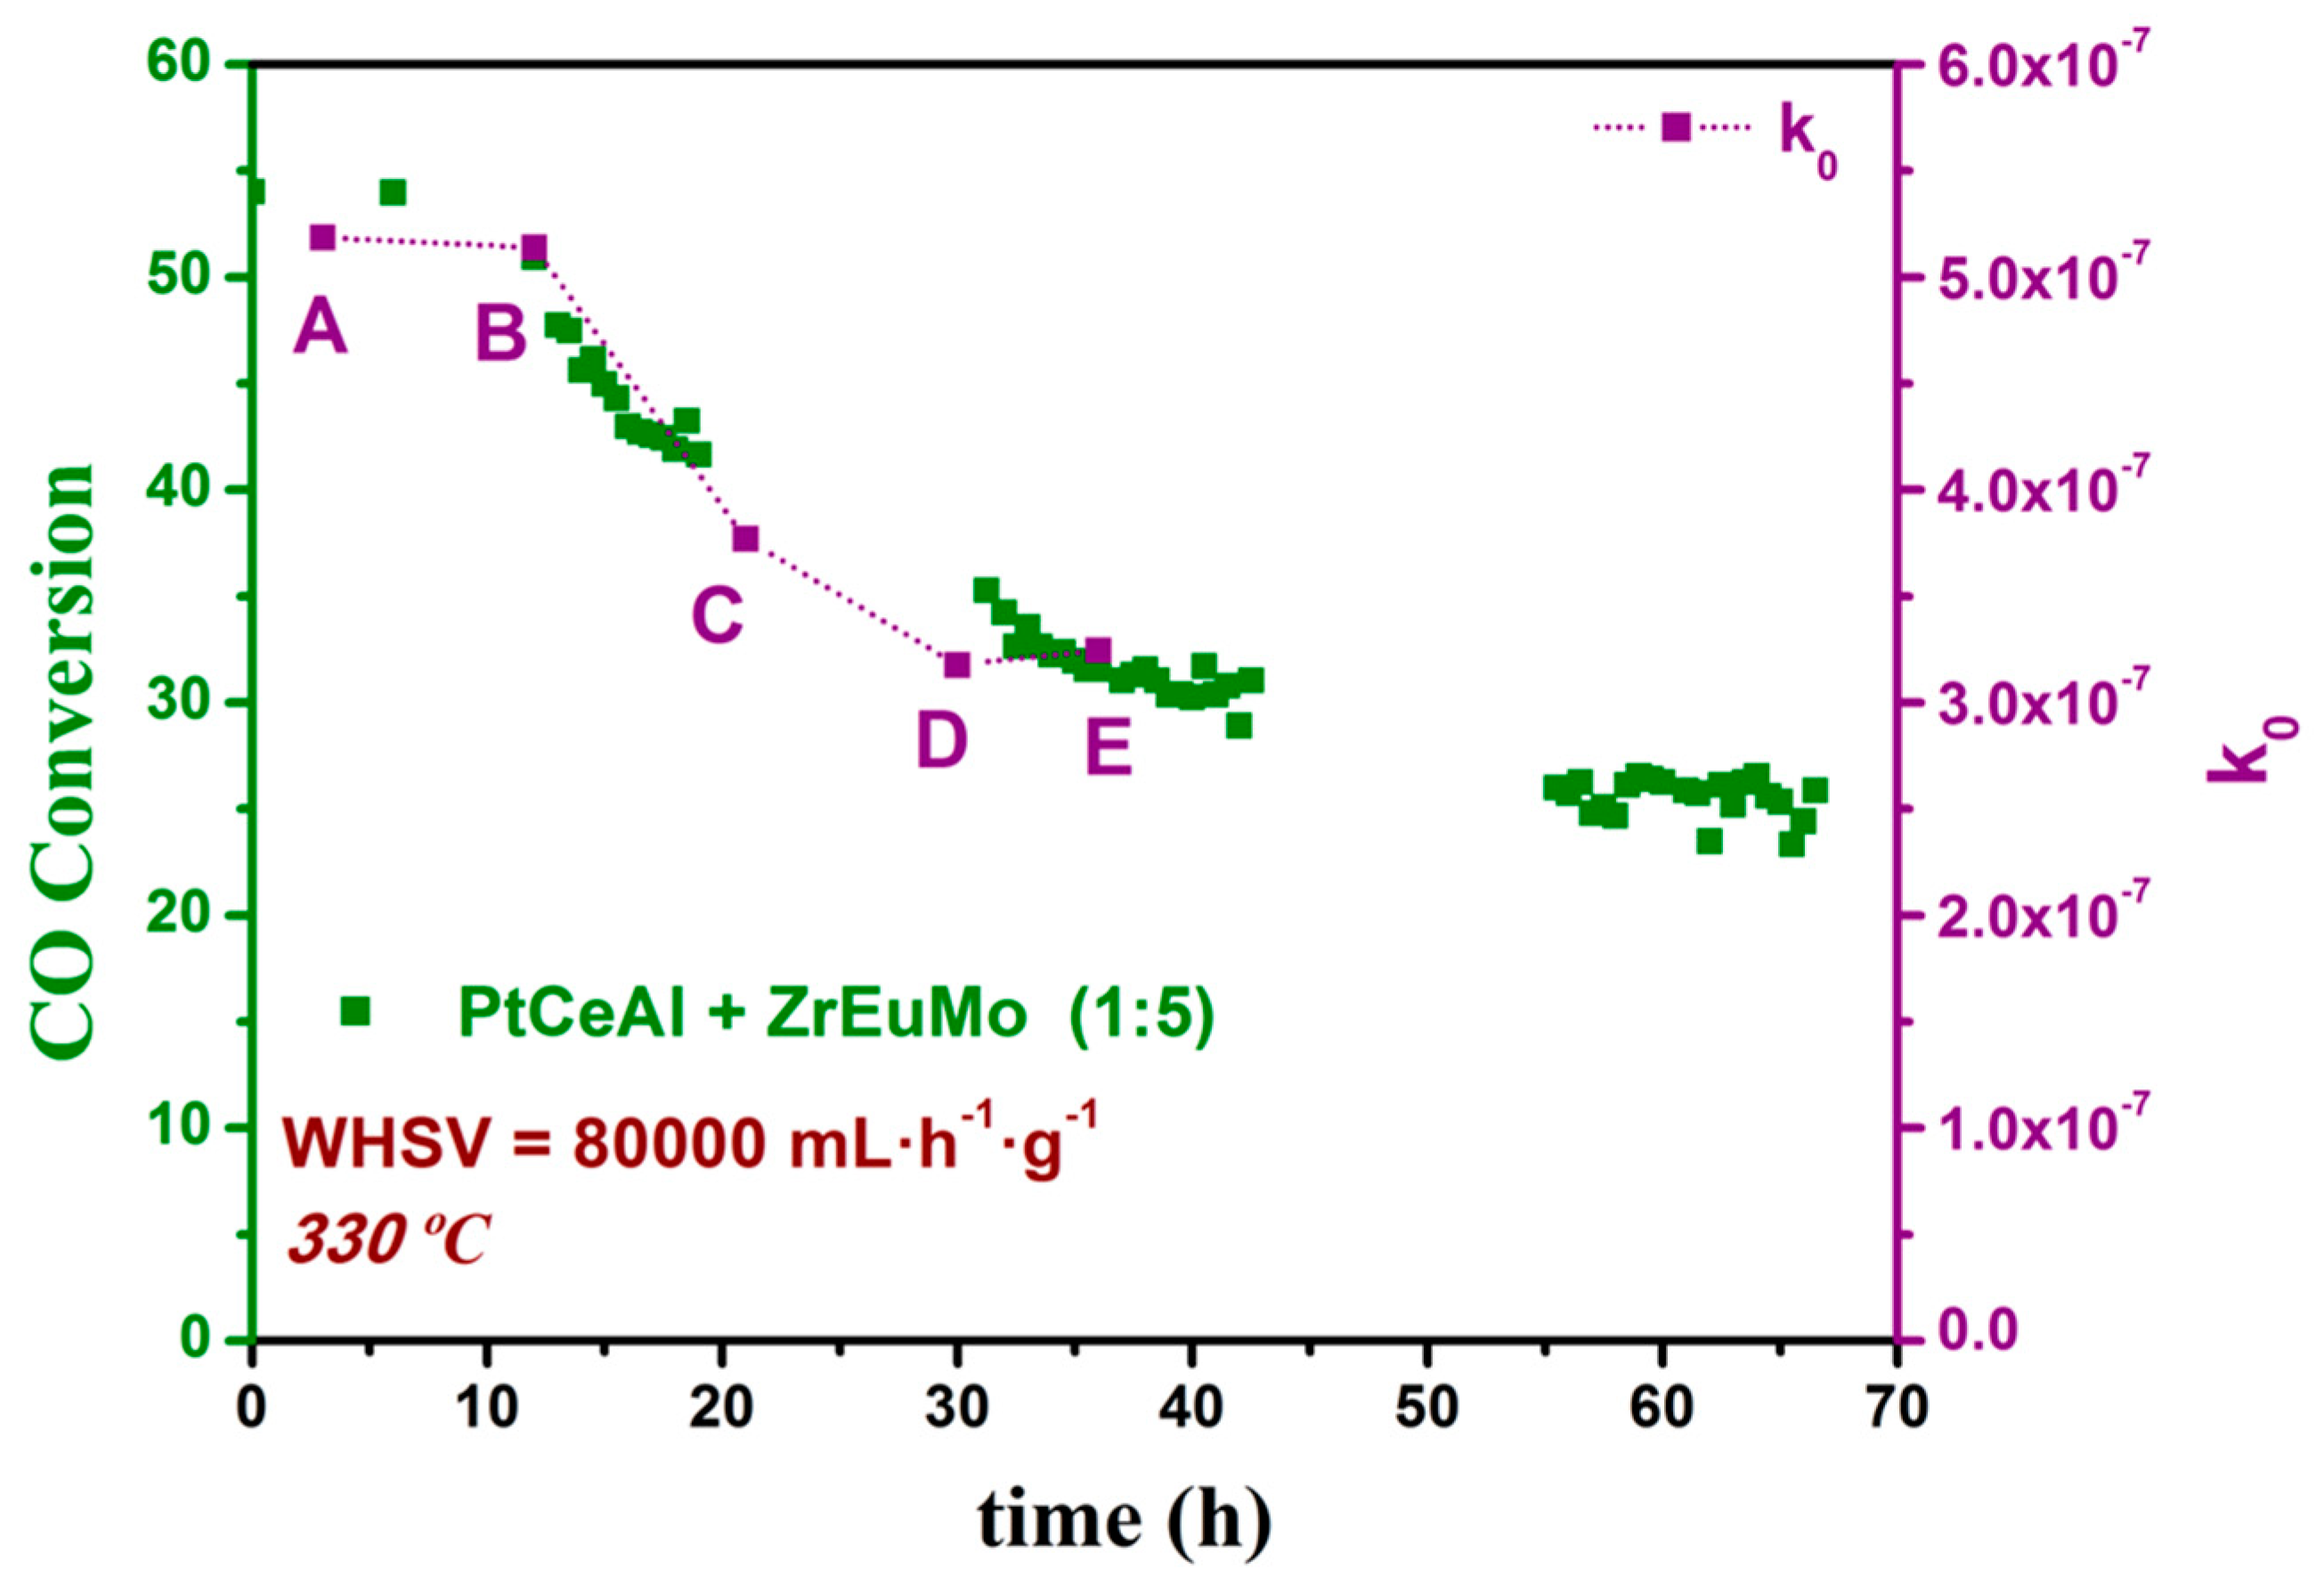
3.2. Kinetics Study on Structured Catalyst

Analogously to the previous kinetic analysis on the powdered sample, the kinetic study on the monolithic catalyst was performed at atmospheric pressure and at 80,000 mL·h−1·gcat−1 space velocity referred to the 0.1 g of PtCeAl catalyst. The experiments were carried out at temperatures ranging from 200 to 400 °C. As in micro-packed bed reactor, reference tests were periodically performed and used to quantify the catalyst deactivation included in the kinetic equation. However, the micromonolith setup allows higher water concentrations as well as the introduction of CO2 in the inlet stream. Therefore, the feed compositions tested in this kinetic study were extended with respect to the experimental campaign on powders. The explored operating conditions are listed in Table 3.
Prior to the activity measurements, the isothermal zone of the reactor was identified by running tests under flowing N2 or no flow. The isothermal zone was then taken as the reference to position the micromonolith (Figure 5). The temperature of the reactor was controlled by a thermocouple in the internal wall of the tubular furnace (temperature set point). A mobile thermocouple located in the centre of the tubular furnace was used to measure the real temperature along the longitudinal axis. As shown in Figure 5, this thermal characterization shows an isothermal zone in the furnace around 10 cm to place the micromonolith:
Therefore, in the catalytic tests the micromonolith (3 cm in length) was placed in the isothermal zone and the mobile thermocouple was introduced in its central channel. Hence, the real temperatures along the micromonolith were continuously measured during the reaction in all tested conditions. Thus, this system provides a longitudinal internal temperature profile and a fixed external temperature during the whole reaction (set point fixed with the thermocouple in the internal wall of the tubular furnace). As a representation, in Figure 6 the conversion is plotted at increasing CO inlet concentration and their axial temperature profiles at the highest temperatures where the conversion was higher, and consequently, the biggest exothermicity was found. Despite the remarkable thermal load, which increases with CO conversion and inlet concentration, temperature profiles keep practically flat under all the investigated conditions.
A maximal deviation of ±4 °C at the micromonolith endings are found at the highest tested temperatures. Such an excellent temperature control, which is due to the conductivity of the structure, guarantees that kinetic data have been collected under practically isothermal conditions and provide the basis for intensified reactor design. In addition, the mass internal diffusion can also be neglected since the structured sample presents catalytic layer thickness below 20 µm [20,26,27].
Following the same procedure as before for the powdered sample, a preliminary differential reactor approach was considered for conversions below 20%. In a similar way to that discussed above for the powdered samples, apparent kinetic orders were estimated (Figure 7) and a confirmation was found of the negative effect of H2, the promoting effect of H2O and the substantial independence from CO. Concerning the effect of CO2, the data set in this conversion range was not sufficiently large for estimating a kinetic order, but this was assumed to be zero according to the literature [4] and our previous analysis on powder.
Then, the analysis for an integral reactor was addressed. The same rate expression developed from powders (Equation (15)) was used, and the same parameter estimates were kept from those reported in Table 3, except for the k0 parameter; this unique degree of freedom was re-estimated by minimization of the sum of square errors between calculated and measured CO conversion (Equation (8)) over monolith. The data which satisfies η ≤ 0.1 were selected for the model fit. The new estimate of k0 is reported in Table 4, together with the rest of the parameters. In addition, the observed CO conversions and the calculated CO conversions by rate expression defined in Equation (15) and considering the parameters summarized in Table 4 is plotted in Figure 8 for comparison.
The goodness of the model response is documented by the parity plot in Figure 8 and the match between calculated and experimental measurements in Figure 6a.
The extension of the experimental field through the use of washcoated micromonolith has thus fully confirmed all the kinetic dependences identified over powders. Thus, the very low water coefficient in this structured sample corroborates the water promoter effect by the proton conductor, since heat or mass diffusional problems are neglected, discarding thereby diluting effects. Indeed, the micromonolith reveals a very versatile experimental tool for the kinetic investigation, since isothermal conditions and absence of transport phenomena are guaranteed under conditions of conversion and thermal load where the traditional micro-packed bed would fail.
Notably, the new estimate of the k0 parameter evidences a larger initial activity of the wash coated monolith by a factor of 2.5 over the powdered catalyst; this behaviour suggests that the preparation procedure of the monolith, that is the obtainment of a colloidal suspension of catalyst and ionic conductor, produces a more intimate contact between the solid components and thus a final more active catalyst respect to the simple physical mixing and pelletization (see description below).
Concerning the catalyst stability, deactivation was also observed over the micromonoiths and a deactivation factor (Di) was also accounted for expressing the change of the preexponential factor (k0). As it is shown in Figure 9, where CO conversion is plotted as a function of time of stream, the decrease of activity is in qualitative agreement with that exhibited by the powdered sample above described and also in line with the previously studied deactivation behaviour of the sample (green symbols in Figure 9), where a fast asymptotic deactivation of the sample was observed and 50% loss of the initial CO conversion occurred. As previously mentioned, it is believed that this process is associated with the deactivation of the PtCeAl catalyst. Indeed, the major drawback of the precious metal-based catalysts for WGS reaction is their deactivation tendency [33]. Several authors pointed out CeO2 support sintering, Pt particles occlusion and metal active surface decrease as deactivation factors [43,44] meanwhile other authors propose the active sites hindering by formed carbonaceous species during the reaction [45,46]. However, in the present formulation the alumina helps in keeping ceria and Pt particles small and dispersed [33,47]. Thus, the most significant deactivation factor for these catalysts should be the formation of carbonate species which remain adsorbed on the surface altering the water activation sites. Nevertheless, compared to the unpromoted catalyst found in the literature [20], the PtCeAl + ZrEuMo catalyst still provides higher activity until achieving the stable state. In fact, a delay of 6 to 7 h is observed which could indicate that the proton conductor supplies more effectively activated water species in comparison to the bare catalyst [20], whose deactivation starts earlier. Several authors report good stability of the cubic-type ionic conductors under WGS experimental conditions. Zhang et al. [48] studied the stability of fluorite-type La2Ce2O7 under wet conditions and found that a pressure of 1 GPa is necessary to modify the structure. Moreover, the introduction of Zr was reported to enhance the stability of the ionic conductors [49,50]. Joulia et al. [51] observed good stabilities of Re2Zr2O7 conductor under both, reducing and oxidant atmospheres at high temperatures. Therefore, the deactivation of the PtCeAl + ZrEuMo sample can be mainly attributed to the deactivation of the PtCeAl catalyst by carbonate species formation.

4. Materials and Methods

4.1. Catalyst

The sample in powder was prepared by the physical mixing of Pt (2 wt.%)/CeO2/Al2O3 catalyst (named PtCeAl) and the proton conductor Mo- and Eu-doped zirconia (5 mol.% MoO3 added to a molar ratio of ZrO2: Eu2O3 of 95:5, named ZrEuMo). The desired amount of Pt was loaded by wet impregnation on the commercial CeO2/Al2O3 support Puralox (20 wt.% of CeO2). On the other hand, the mixed oxide was synthesized by co-precipitation of the three nitrates precursors. Finally, both materials were physically mixed in the 1:5 mass ratio (catalyst: proton conductor) and pelletized and ground to obtain particles sizes in the 800–1000 µm range. More details about the synthesis and physicochemical characterization of these materials can be found in a previous work [20].
On the other side, the structured sample was prepared by the washcoating of a metallic micromonolith using a colloidal suspension of the same powdered mixture (PtCeAl + ZrEuMo in a mass ratio of 1:5). The micromonolith was previously manufactured from FeCrAlloy stainless steel foils (GoodFellow) with 0.05 mm in thickness. Flat and waves sheets were co-rolled in pairs resulting in cylindrical multichannel metallic micromonoliths with 15 mm in diameter and 30 mm in height as is shown in Figure 10. A cell density of 1543 cpsi was achieved and 0.6 g of sample (PtCeAl + ZrEuMo in a mass ratio of 1:5) were loaded. Extended details about the optimization of the colloidal suspension as well as impregnation process and a complete characterization of the samples can be found in a previous work [20].

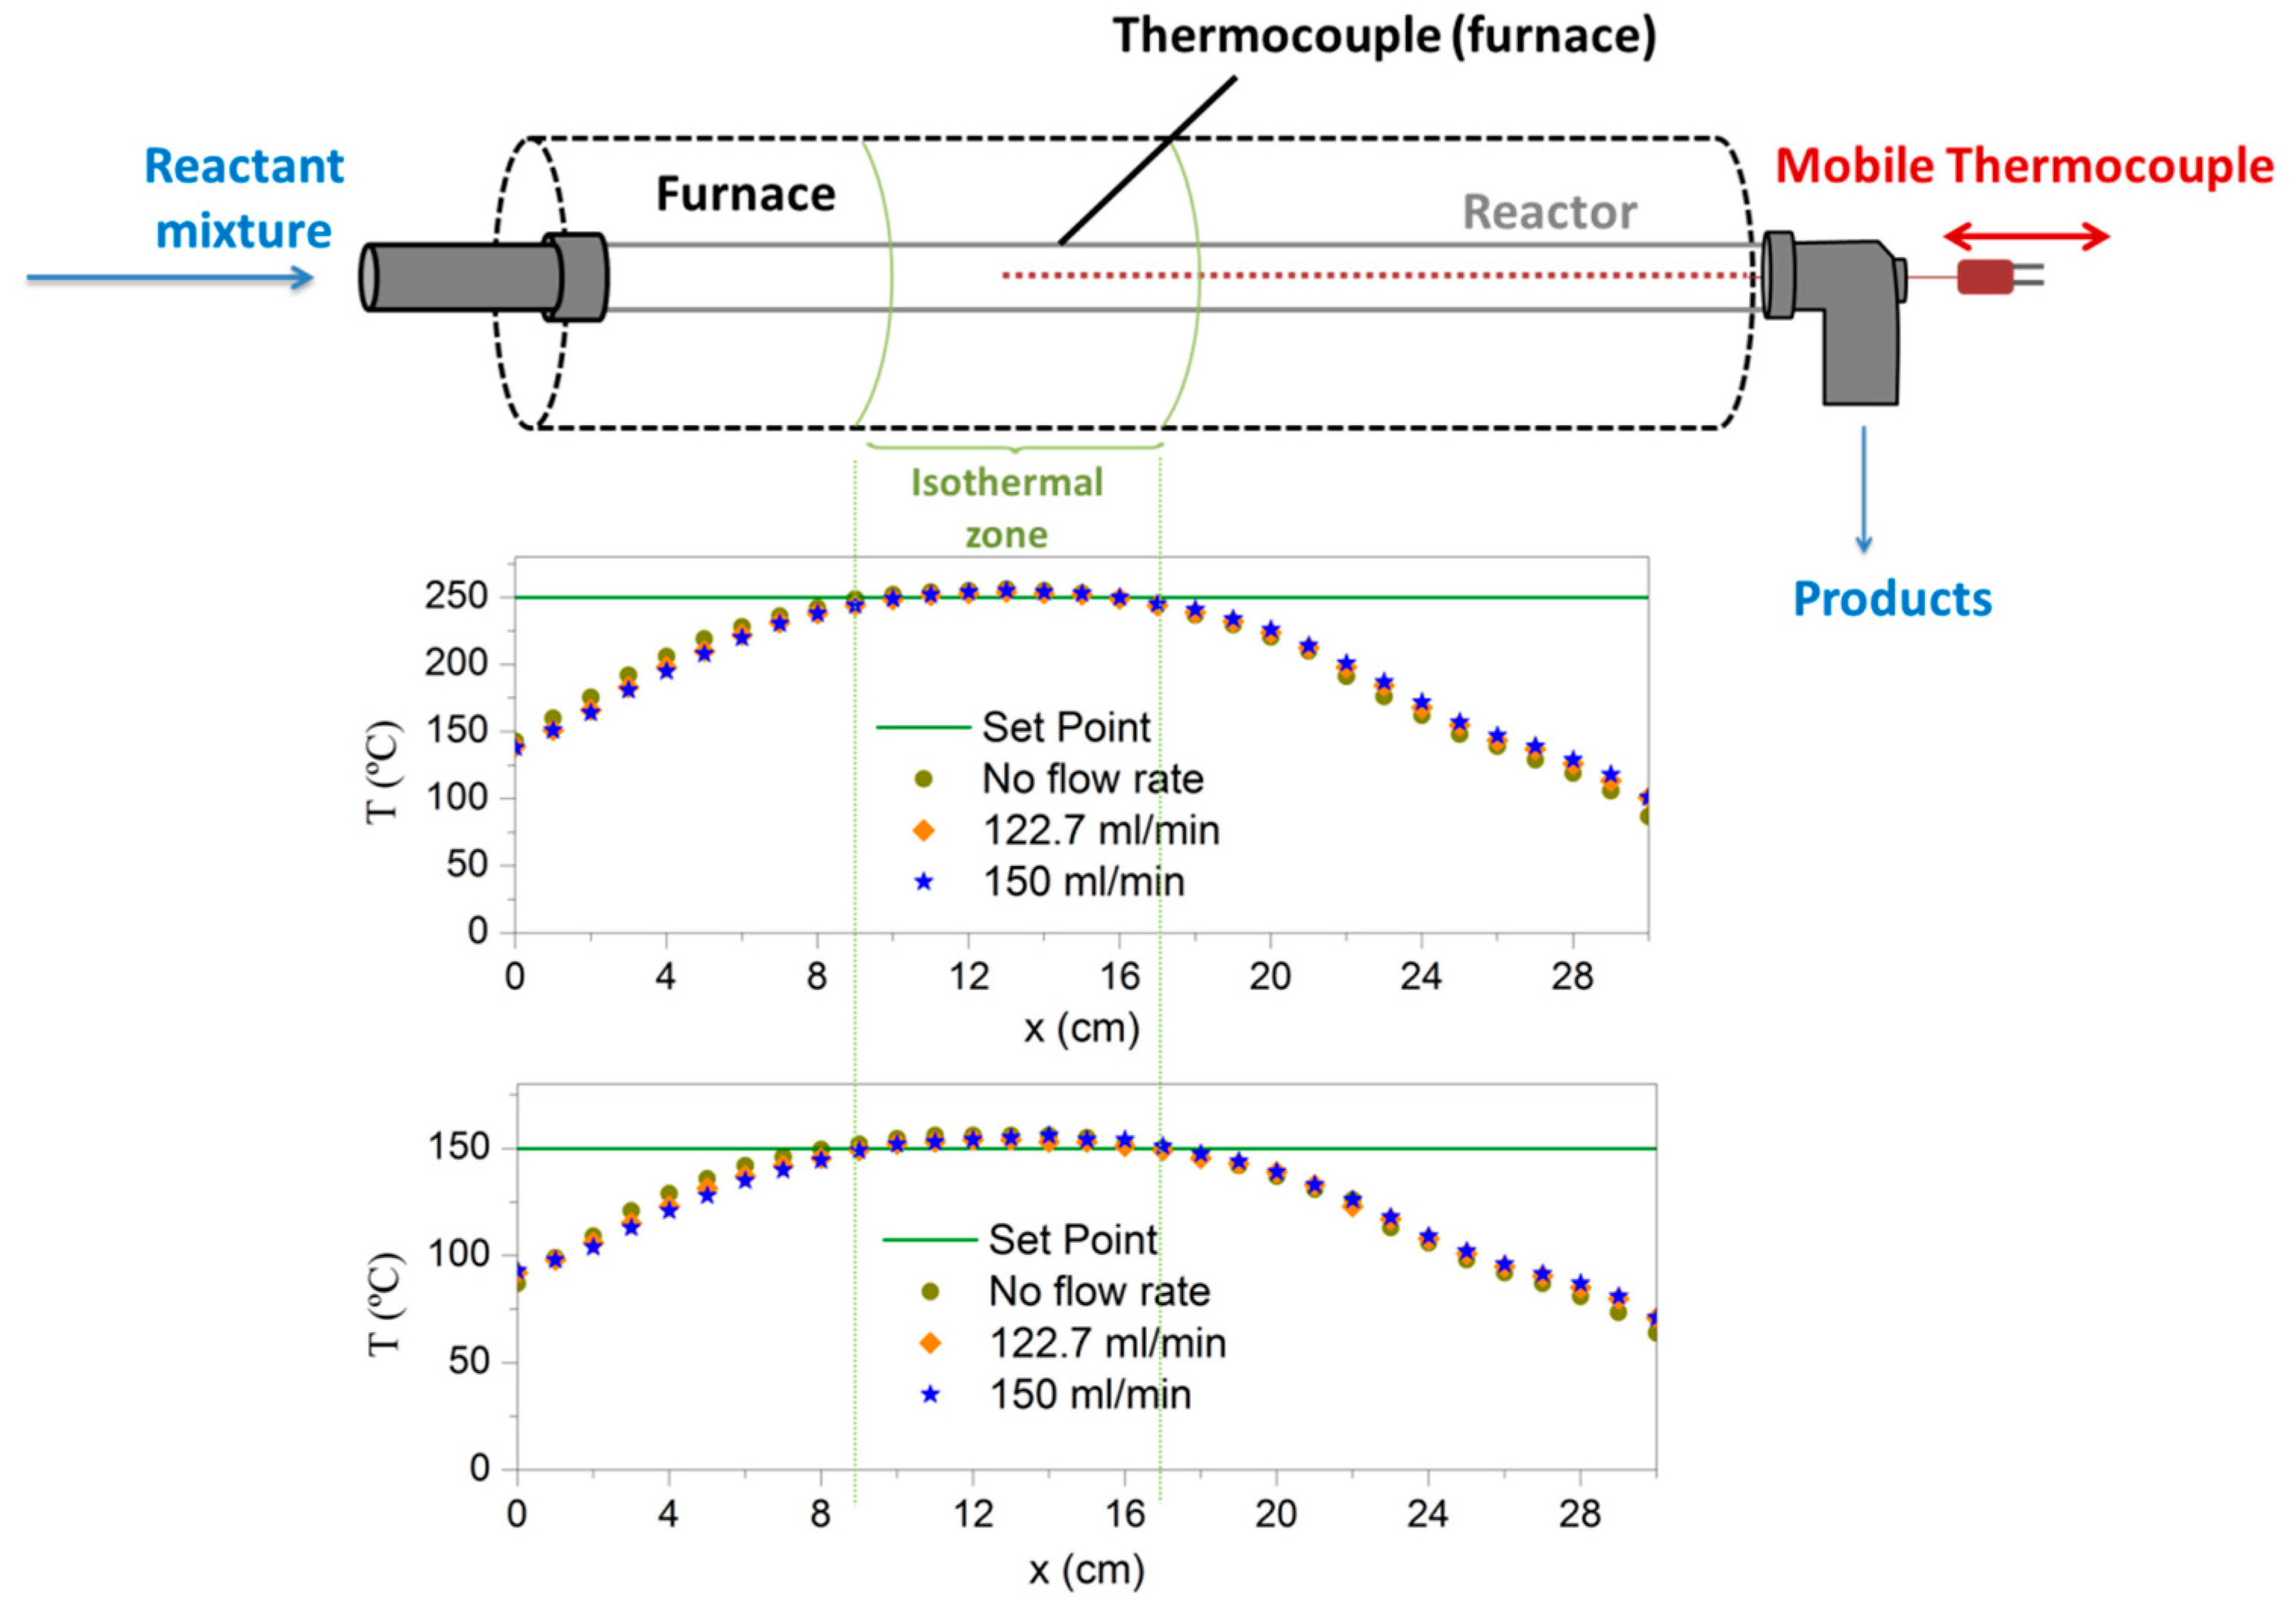
4.2. Experimental Setup for Powdered Catalyst

The kinetic study of WGS reaction on powdered catalysts was carried out at atmospheric pressure in a home-made setup coupled to an on-line µGC analyser (SRA Instruments R3000, Milan, Italy) equipped with two columns with Ar and He as carrier gas, respectively, and a Thermal Conductivity Detector (TCD). In this rig, the water was fed by making the N2 pass through a temperature-controlled saturator (Vertex Thermometer). The catalytic bed (0.4 cm3) was placed in a quartz reactor of 7 mm in diameter fixed by quartz wool on both ends. The reaction temperature was controlled by placing a K thermocouple of 0.5 mm in the middle of the catalytic bed. The reactor was externally heated by a tubular furnace (Carbolite 2408). Because of instrument/installation limitations the CO2 component in the reactant mixture could not be introduced. It is important to note that the carbon and the hydrogen mass balances have been controlled during all the tests and kept at 1 ± 0.1 and 1 ± 0.2, respectively.

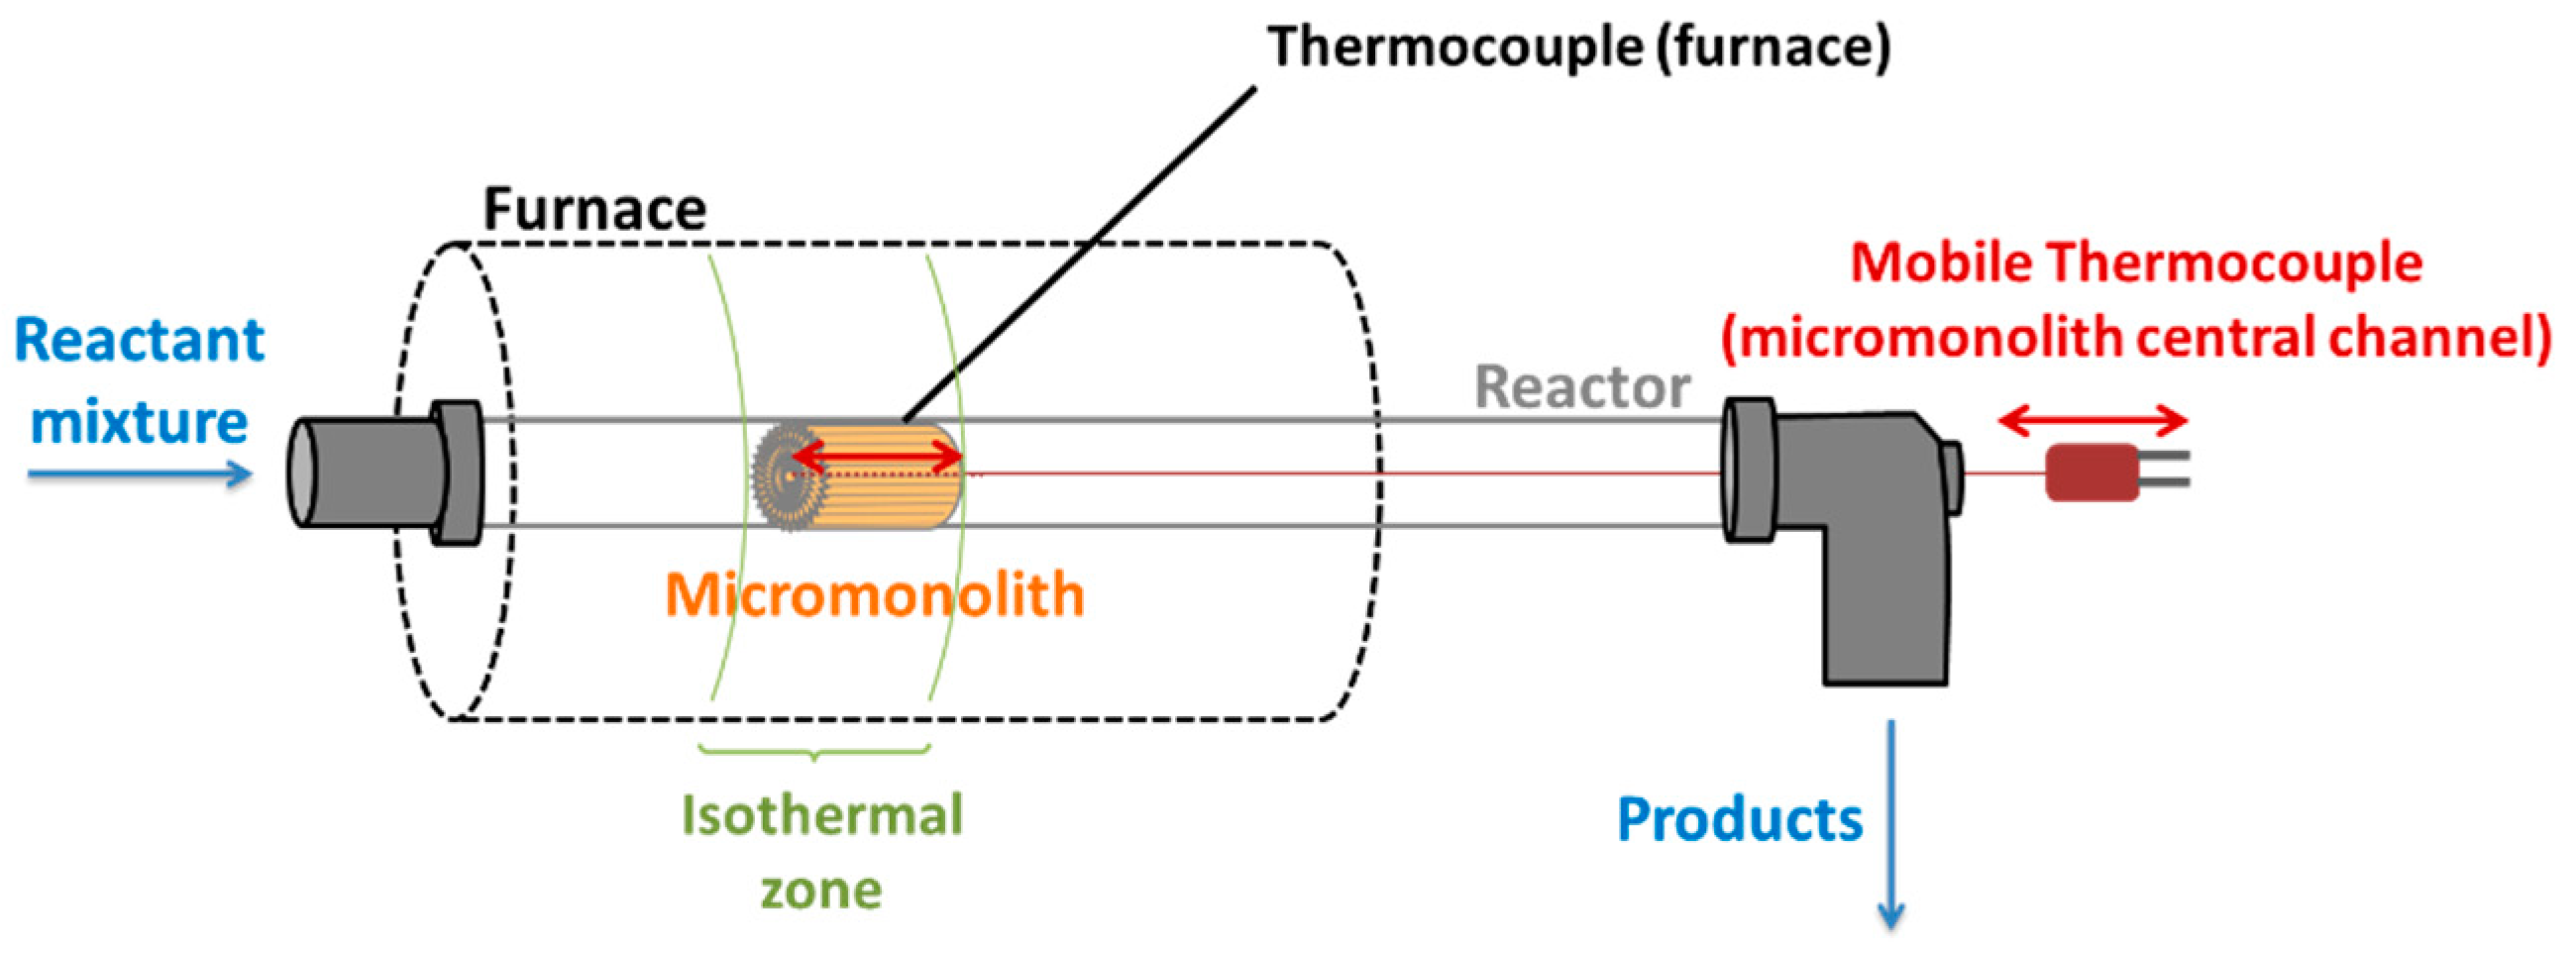
4.3. Experimental Setup for Structured Catalyst

The kinetic experiments in structured catalyst were also performed in a home-made setup at atmospheric pressure coupled to an on-line µGC analyser (Agilent 3000 A GC, Santa Clara, CA, USA) equipped with two columns with Ar and He as carrier gas, respectively, and a Thermal Conductivity Detector (TCD). Here, the water introduction was carried out by a digital pump (Gilson 302, Middleton, WI, USA) swept along with N2. After a home-made evaporator line, a humidity sensor (Humidity&Temperature transmitter HMT334, Vaisala, Helsinki, Finland) monitored with LabView software was used to measure the exact inlet water concentration. After the reactor, a condenser ABB Advance SCC-C at 3 °C was added to remove the high amount of water before the GC analyser. As for powdered samples, the carbon and the hydrogen mass balances have been controlled during all the tests and kept at 1 ± 0.1 and 1 ± 0.2, respectively. The monolithic catalyst was fixed by two inert foams and placed in the previously measured isothermal part of the tubular stainless reactor inside a tubular furnace (Carbolite Furnaces Tersid s.r.l.Milan, Italy). Two thermocouples were used: one that controls the furnace temperature, and a second one in the central channel of the micromonolith which is longitudinally mobile along the height of the structured catalyst as it is shown in Scheme 1. With this sliding thermocouple, the exact temperature along the sample is measured in each tested temperature step during the reaction, providing thereby a temperature profile along the micromonolith in real-time.

5. Conclusions

The kinetic investigation of the WGS reaction on the PtCeAl + ZrEuMo (1:5) catalyst showed that the reaction rate has a weak dependence on water concentration; the estimated reaction order for water (0.36) is in fact significantly lower than those reported in the literature. This is in agreement with a reduction of the influence of the limiting water activation step by the addition of the proton conductor which provides labile dissociated water to react with adsorbed CO on Pt.
The washcoating of the catalyst over a micro-channel metallic structure has resulted in an isothermal system where thermal or mass diffusional problems can be neglected. Reactant concentrations were varied within a much larger range than in traditional lab-scale packed bed reactors, with great benefit on the representativeness of the kinetic investigation. Also, pressure drop is avoided and high space velocities can be easily tested. Besides, the use of the structured catalyst allowed to validate the H2O activation promoting effect under conditions fully representative of a fuel processing train, thus confirming the potential of both catalyst formulation and reactor configuration for intensified WGS units.

Author Contributions

Preparation, characterization, preliminary kinetic investigations and study of the deactivation (in Sevilla), N.G.-M., F.R.-S. and J.A.O.; kinetic investigation and modelling analysis (in Politecnico di Milano), N.G.-M., A.B. and G.G.; writing-original draft preparation, N.G.-M.; writing-review and editing, N.G.-M., J.A.O., A.B. and G.G.

Funding

Financial support for this work was obtained from the Spanish Ministerio de Economía y Competitividad (MINECO) (ENE2015-66975-C3-2-R); and the projects MICROGEN30 by MISE-Italy and PRIN2015–HERCULES by MIUR-Italy.

Conflicts of Interest

The authors declare no conflict of interest. The funders had no role in the design of the study; in the collection, analyses, or interpretation of data; in the writing of the manuscript, or in the decision to publish the results.

References

  1. Germani, G.; Schuurman, Y. Water-Gas Shift Reaction Kinetics over µ-Structured Pt/CeO2/Al2O3 Catalysts. AIChE J. 2006, 52, 1806–1813. [Google Scholar] [CrossRef]
  2. Grabow, L.C.; Gokhale, A.A.; Evans, S.T.; Dumesic, J.A.; Mavrikakis, M. Mechanism of the Water Gas Shift Reaction on Pt: First Principles, Experiments, and Microkinetic Modeling. J. Phys. Chem. C 2008, 112, 4608–4617. [Google Scholar] [CrossRef]
  3. Grenoble, D.C.; Estadt, M.M.; Ollis, D.F. The Chemistry and Catalysis of the Water Gas Shift Reaction: 1. The Kinetics over Supported Metal Catalysts. J. Catal. 1981, 67, 90–102. [Google Scholar] [CrossRef]
  4. Phatak, A.A.; Koryabkina, N.; Rai, S.; Ratts, J.L.; Ruettinger, W.; Farrauto, R.J.; Blau, G.E.; Delgass, W.N.; Ribeiro, F.H. Kinetics of the water-gas shift reaction on Pt catalysts supported on alumina and ceria. Catal. Today 2007, 123, 224–234. [Google Scholar] [CrossRef]
  5. Kalamaras, C.M.; Dionysiou, D.D.; Efstathiou, A.M. Mechanistic Studies of the Water–Gas Shift Reaction over Pt/CexZr1–xO2 Catalysts: The Effect of Pt Particle Size and Zr Dopant. ACS Catal. 2012, 2, 2729–2742. [Google Scholar] [CrossRef]
  6. Kalamaras, C.M.; Panagiotopoulou, P.; Kondarides, D.I.; Efstathiou, A.M. Kinetic and mechanistic studies of the water-gas shift reaction on Pt/TiO2 catalyst. J. Catal. 2009, 264, 117–129. [Google Scholar] [CrossRef]
  7. Clay, J.P.; Greeley, J.P.; Ribeiro, F.H.; Delgass, W.N.; Schneider, W.F. DFT comparison of intrinsic WGS kinetics over Pd and Pt. J. Catal. 2014, 320, 106–117. [Google Scholar] [CrossRef]
  8. Huang, S.-C.; Lin, C.-H.; Wang, J.-H. Trends of Water Gas Shift Reaction on Close-Packed Transition Metal Surfaces. J. Phys. Chem. C 2010, 114, 9826–9834. [Google Scholar] [CrossRef]
  9. Liu, P.; Rodriguez, J.A. Water-gas-shift reaction on metal nanoparticles and surfaces. J. Chem. Phys. 2007, 126, 164705. [Google Scholar] [CrossRef] [PubMed]
  10. Phatak, A.A.; Delgass, W.N.; Ribeiro, F.H.; Schneider, W.F. Density Functional Theory Comparison of Water Dissociation Steps on Cu, Au, Ni, Pd, and Pt. J. Phys. Chem. C 2009, 113, 7269–7276. [Google Scholar] [CrossRef]
  11. González-Castaño, M.; Ivanova, S.; Laguna, O.H.; Martínez Tejada, L.M.; Centeno, M.A.; Odriozola, J.A. Structuring Pt/CeO2/Al2O3 WGS catalyst: Introduction of buffer layer. Appl. Catal. B Environ. 2017, 200, 420–427. [Google Scholar] [CrossRef]
  12. Olympiou, G.G.; Kalamaras, C.M.; Zeinalipour-Yazdi, C.D.; Efstathiou, A.M. Mechanistic aspects of the water-gas shift reaction on alumina-supported noble metal catalysts: In situ DRIFTS and SSITKA-mass spectrometry studies. Catal. Today 2007, 127, 304–318. [Google Scholar] [CrossRef]
  13. Kalamaras, C.M.; Petallidou, K.C.; Efstathiou, A.M. The effect of La3+-doping of CeO2 support on the water-gas shift reaction mechanism and kinetics over Pt/Ce1-xLaxO2-δ. Appl. Catal. B Environ. 2013, 136–137, 225–238. [Google Scholar] [CrossRef]
  14. Panagiotopoulou, P.; Kondarides, D.I. Effect of the nature of the support on the catalytic performance of noble metal catalysts for the water-gas shift reaction. Catal. Today 2006, 112, 49–52. [Google Scholar] [CrossRef]
  15. Panagiotopoulou, P.; Papavasiliou, J.; Avgouropoulos, G.; Ioannides, T.; Kondarides, D.I. Water-gas shift activity of doped Pt/CeO2 catalysts. Chem. Eng. J. 2007, 134, 16–22. [Google Scholar] [CrossRef]
  16. Rodriguez, J.A.; Liu, P.; Hrbek, J.; Evans, J.; Pérez, M. Water Gas Shift Reaction on Cu and Au Nanoparticles Supported on CeO2(111) and ZnO(0001): Intrinsic Activity and Importance of Support Interactions. Angew. Chem. Int. Ed. 2007, 46, 1329–1332. [Google Scholar] [CrossRef] [PubMed]
  17. Thinon, O.; Diehl, F.; Avenier, P.; Schuurman, Y. Screening of bifunctional water-gas shift catalysts. Catal. Today 2008, 137, 29–35. [Google Scholar] [CrossRef]
  18. García-Moncada, N.; Bobadilla, L.F.; Poyato, R.; López-Cartes, C.; Romero-Sarria, F.; Centeno, M.Á.; Odriozola, J.A. A direct in situ observation of water-enhanced proton conductivity of Eu-doped ZrO2: Effect on WGS reaction. Appl. Catal. B Environ. 2018, 231, 343–356. [Google Scholar] [CrossRef]
  19. García-Moncada, N.; González-Castaño, M.; Ivanova, S.; Centeno, M.Á.; Romero-Sarria, F.; Odriozola, J.A. New concept for old reaction: Novel WGS catalyst design. Appl. Catal. B Environ. 2018, 238, 1–5. [Google Scholar] [CrossRef]
  20. García Moncada, N. On the Rate-Limiting Step of the WGS Reaction: Design of the Model Catalyst. Ph.D. Thesis, University of Sevilla, Seville, Spain, 2017. [Google Scholar]
  21. Tonkovich, A.L.Y.; Zilka, J.L.; LaMont, M.J.; Wang, Y.; Wegeng, R.S. Microchannel reactors for fuel processing applications. I. Water gas shift reactor. Chem. Eng. Sci. 1999, 54, 2947–2951. [Google Scholar] [CrossRef]
  22. Farrauto, R.J.; Liu, Y.; Ruettinger, W.; Ilinich, O.; Shore, L.; Giroux, T. Precious Metal Catalysts Supported on Ceramic and Metal Monolithic Structures for the Hydrogen Economy. Catal. Rev. Sci. Eng. 2007, 49, 141–196. [Google Scholar] [CrossRef]
  23. González-Castaño, M.; Reina, T.R.; Ivanova, S.; Martínez Tejada, L.M.; Centeno, M.A.; Odriozola, J.A. O2-assisted Water Gas Shift reaction over structured Au and Pt catalysts. Appl. Catal. B Environ. 2016, 185, 337–343. [Google Scholar] [CrossRef]
  24. Milt, V.G.; Ivanova, S.; Sanz, O.; Domínguez, M.I.; Corrales, A.; Odriozola, J.A.; Centeno, M.A. Au/TiO2 supported on ferritic stainless steel monoliths as CO oxidation catalysts. Appl. Surf. Sci. 2013, 270, 169–177. [Google Scholar] [CrossRef]
  25. Govender, S.; Friedrich, H.B. Monoliths: A Review of the Basics, Preparation Methods and Their Relevance to Oxidation. Catalysts 2017, 7, 62. [Google Scholar] [CrossRef]
  26. Potemkin, D.I.; Snytnikov, P.V.; Belyaev, V.D.; Sobyanin, V.A. Preferential CO oxidation over Cu/CeO2-x catalyst: Internal mass transport limitation. Chem. Eng. J. 2011, 176–177, 165–171. [Google Scholar] [CrossRef]
  27. Laguna, O.H.; González Castaño, M.; Centeno, M.A.; Odriozola, J.A. Microreactors technology for hydrogen purification: Effect of the catalytic layer thickness on CuOx/CeO2-coated microchannel reactors for the PROX reaction. Chem. Eng. J. 2015, 275, 45–52. [Google Scholar] [CrossRef]
  28. Ayastuy, J.L.; Gutiérrez-Ortiz, M.A.; González-Marcos, J.A.; Aranzabal, A.; González-Velasco, J.R. Kinetics of the Low-Temperature WGS Reaction over a CuO/ZnO/Al2O3 catalyst. Ind. Eng. Chem. Res. 2005, 44, 41–50. [Google Scholar] [CrossRef]
  29. Levenspiel, O. Chemical Reaction Engineering, 3rd ed.; John Wiley & Sons, Inc.: New York, NY, USA, 1998; ISBN 9686165037. [Google Scholar]
  30. Vannice, M.A. Kinetics of Catalytic Reactions; Springer: New York, NY, USA, 2005; ISBN 0387246495. [Google Scholar]
  31. Hougen, O.A.; Watson, K.M. Solid catalysts and reaction rates. General Principles. Ind. Eng. Chem. 1943, 35, 529–541. [Google Scholar] [CrossRef]
  32. Yang, K.H.; Hougen, O.A. Determination of mechanism of catalyzed gaseous reactions. Chem. Eng. Prog. 1950, 46, 146–157. [Google Scholar]
  33. Ratnasamy, C.; Wagner, J.P. Water Gas Shift Catalysis. Catal. Rev. Sci. Eng. 2009, 51, 325–440. [Google Scholar] [CrossRef]
  34. Thinon, O.; Rachedi, K.; Diehl, F.; Avenier, P.; Schuurman, Y. Kinetics and Mechanism of the Water-Gas Shift Reaction over Platinum Supported Catalysts. Top. Catal. 2009, 52, 1940–1945. [Google Scholar] [CrossRef]
  35. Sun, J.; DesJardins, J.; Buglass, J.; Liu, K. Noble metal water gas shift catalysis: Kinetics study and reactor design. Int. J. Hydrogen Energy 2005, 30, 1259–1264. [Google Scholar] [CrossRef]
  36. Byron, S.R.J.; Loganathan, M.; Shekhar Shantha, M. A Review of the Water Gas Shift Reaction Kinetics. Int. J. Chem. React. Eng. 2010, 8, 1–32. [Google Scholar] [CrossRef]
  37. Maestri, M.; Vlachos, D.G.; Beretta, A.; Groppi, G.; Tronconi, E. Steam and dry reforming of methane on Rh: Microkinetic analysis and hierarchy of kinetic models. J. Catal. 2008, 259, 211–222. [Google Scholar] [CrossRef]
  38. Maestri, M.; Livio, D.; Beretta, A.; Groppi, G. Hierarchical Refinement of Microkinetic Models: Assessment of the Role of the WGS and r-WGS Pathways in CH4 Partial Oxidation on Rh. Ind. Eng. Chem. Res. 2014, 53, 10914–10928. [Google Scholar] [CrossRef]
  39. Kumar, K.V.; Porkodi, K.; Rocha, F. Langmuir-Hinshelwood kinetics—A theoretical study. Catal. Commun. 2008, 9, 82–84. [Google Scholar] [CrossRef]
  40. Vannice, M.A.; Hyun, S.H.; Kalpakci, B.; Liauh, W.C. Entropies of Adsorption in Heterogeneous Catalytic Reactions. J. Catal. 1979, 56, 358–362. [Google Scholar] [CrossRef]
  41. Moe, J.M. Design of water-gas shift reactors. Chem. Eng. Prog. 1962, 58, 33–36. [Google Scholar]
  42. Germani, G.; Alphonse, P.; Courty, M.; Schuurman, Y.; Mirodatos, C. Platinum/ceria/alumina catalysts on microstructures for carbon monoxide conversion. Catal. Today 2005, 110, 114–120. [Google Scholar] [CrossRef] [Green Version]
  43. Wang, X.; Gorte, R.J.; Wagner, J.P. Deactivation Mechanisms for Pd/Ceria during the Water–Gas-Shift Reaction. J. Catal. 2002, 212, 225–230. [Google Scholar] [CrossRef] [Green Version]
  44. Ruettinger, W.; Liu, X.; Farrauto, R.J. Mechanism of aging for a Pt/CeO2-ZrO2 water gas shift catalyst. Appl. Catal. B Environ. 2006, 65, 135–141. [Google Scholar] [CrossRef]
  45. Hilaire, S.; Wang, X.; Luo, T.; Gorte, R.J.; Wagner, J. A comparative study of water-gas-shift reaction over ceria supported metallic catalysts. Appl. Catal. A Gen. 2001, 215, 271–278. [Google Scholar] [CrossRef]
  46. Liu, X.; Ruettinger, W.; Xu, X.; Farrauto, R. Deactivation of Pt/CeO2 water-gas shift catalysts due to shutdown/startup modes for fuel cell applications. Appl. Catal. B Environ. 2005, 56, 69–75. [Google Scholar] [CrossRef]
  47. Trueba, M.; Trasatti, S.P. γ-alumina as a support for catalysts: A review of fundamental aspects. Eur. J. Inorg. Chem. 2005, 3393–3403. [Google Scholar] [CrossRef]
  48. Zhang, F.X.; Tracy, C.L.; Lang, M.; Ewing, R.C. Stability of fluorite-type La2Ce2O7 under extreme conditions. J. Alloys Compd. 2016, 674, 168–173. [Google Scholar] [CrossRef]
  49. Lv, J.; Wang, L.; Lei, D.; Guo, H.; Kumar, R.V. Sintering, chemical stability and electrical conductivity of the perovskite proton conductors BaCe0.45Zr0.45M0.1O3-δ (M = In, Y, Gd, Sm). J. Alloys Compd. 2009, 467, 376–382. [Google Scholar] [CrossRef]
  50. Phair, J.W.; Badwal, S.P.S. Review of proton conductors for hydrogen separation. Ionics 2006, 12, 103–115. [Google Scholar] [CrossRef] [Green Version]
  51. Joulia, A.; Vardelle, M.; Rossignol, S. Synthesis and thermal stability of Re2Zr2O7, (Re=La, Gd) and La2(Zr1−xCex)2O7−δ compounds under reducing and oxidant atmospheres for thermal barrier coatings. J. Eur. Ceram. Soc. 2013, 33, 2633–2644. [Google Scholar] [CrossRef]
Figure 1. Variation of WGS reaction rates on PtCeAl + ZrEuMo (1:5) for CO conversions below 20% with the different tested partial pressures: (a) variation of CO partial pressure (tests CO_1, CO_2, CO_3 and references), (b) variation of H2O partial pressure (tests H2O_1, H2O_2 and references), and (c) variation of H2 partial pressure (tests H2_1, H2_2, H2_3, H2_4 and references).
Catalysts 08 00594 g001
Figure 2. Plot of the calculated vs. the observed CO conversion using the proposed kinetic model for the WGS reaction, Equation (15), on powdered PtCeAl + ZrEuMo (1:5) catalyst.
Catalysts 08 00594 g002
Figure 3. (a) Conversion vs. Temperature plot of the reference tests. Experimental data is plotted by dots. Calculated data (Equation (15)) is plotted as solid lines. (b) Decrease of the estimated preexponential factor of the reference tests.
Catalysts 08 00594 g003
Figure 4. CO Conversion vs Temperature plots of the tested experiments. The experimental data is plotted as dots. Calculated data (Equation (15)) is plotted as solid lines. The equilibrium curves are plotted by dashed lines. (a) Effect of inlet CO concentration; (b) effect of inlet H2 concentration; and (c) effect of inlet H2O concentration.
Catalysts 08 00594 g004
Figure 5. Temperature profile along the empty reactor in different conditions.
Catalysts 08 00594 g005
Figure 6. (a) CO Conversion vs Temperature plot for several tests. The experimental data are plotted as dots. Calculated conversion data (Equation (15)) are plotted as solid lines. The equilibrium curves are plotted by dashed lines. (b) Temperature profile along the micromonolith length during WGS reaction kinetic tests. The real temperatures (straight lines) are measured by the mobile thermocouple in the central channel of the monolith. The temperature set points (dotted lines) are measured by the fixed thermocouple in the internal wall of the furnace.
Catalysts 08 00594 g006
Figure 7. Variation of WGS reaction rates on structured PtCeAl + ZrEuMo (1:5) for CO conversions below 20% with the different tested partial pressures: (a) variation of CO partial pressure (tests CO_1, CO_2 and references), (b) variation of H2 partial pressure (tests H2_1 and references), and (c) variation of H2O partial pressure (tests H2O_1, H2O_2, H2O_3 and references).
Catalysts 08 00594 g007
Figure 8. Plot of the calculated vs. the observed CO conversion using the proposed kinetic model for the WGS reaction, Equation (15), on structured PtCeAl + ZrEuMo (1:5) catalyst.
Catalysts 08 00594 g008
Figure 9. Decrease of the estimated preexponential factor (k0) of the reference tests of the structured sample compared to the stability of the same sample measured at 330 °C and 80,000 mL·h−1·gcat−1 with 9% CO, 30% H2O, 11% CO2 and 50% H2.
Catalysts 08 00594 g009
Figure 10. Manufactured metallic micromonolith.
Catalysts 08 00594 g010
Scheme 1. Structured catalyst and thermocouples positions.
Catalysts 08 00594 sch001
Table 1. Summary of feed composition (%) of the experiments for the kinetic study.
TestCOH2OCO2H2N2
Reference A1.282.870095.85
Reference B1.302.820095.88
CO_11.652.810095.54
CO_22.192.800095.01
CO_34.202.830092.97
Reference C1.302.760095.94
H2_11.283.0301.9393.76
H2_21.282.8005.3090.62
H2_31.262.87010.6985.18
H2_41.252.87021.2974.59
Reference D1.292.870095.84
H2O_11.313.580095.11
H2O_21.405.10093.50
Reference E1.272.780095.95
Table 2. Calculated kinetic parameters for the proposed reaction rate expression (Equation (15)) for WGS reaction on powdered PtCeAl + ZrEuMo sample.
k08.38 × 10−8
A0.052
Ea (kJ/mol)67.40
β (H2O)0.359
T0 (K)473.15
α (H2)0.428
Table 3. Summary of feed composition (%) of the experiments for the kinetic study on micromonolith.
TestCOH2OCO2H2N2
Reference A4.3920.357.1119.8248.33
CO_111.1220.967.1320.1340.66
H2_14.6720.147.2840.7627.15
Reference B4.3920.327.1519.9748.17
CO_216.7220.757.1320.2435.16
CO2_14.3820.160.0020.2655.20
Reference C4.4120.607.1720.0347.79
H2O_14.338.636.9719.3360.74
H2O_24.6231.237.5021.2035.45
Reference D4.5120.487.2420.2947.48
H2O_34.2514.816.8919.2254.83
Reference E4.4920.267.2220.2447.79
Table 4. Calculated kinetic parameters for the proposed reaction rate expression (Equation (15)) for WGS reaction on structured PtCeAl + ZrEuMo sample.
k02.08 × 10−7
A0.052
Ea (kJ/mol)67.40
β (H2O)0.359
T0 (K)473.15
α (H2)0.428

