Article

Toward an Accurate Spectrophotometric Evaluation of the Efficiencies of Photocatalysts in Processes Involving Their Separation Using Nylon Membranes

by
Halema Al-Kandari
1,*,
Peter Kasak
2,
Ahmed M. Mohamed
3,
Shekhah Al-Kandari
3,
Dusan Chorvat Jr.
4 and
Aboubakr M. Abdullah
2,*
1
Department of Health Environment, College of Health Sciences, PAAET, P.O. Box 1428, Faiha 72853, Kuwait
2
Center for Advanced Materials, Qatar University, Doha 2713, Qatar
3
Chemistry Department, Kuwait University, P.O. Box 5969, Safat 13060, Kuwait
4
Department of Biophotonics, International Laser Center, Ilkovicova 3, 84104 Bratislava, Slovakia
*
Authors to whom correspondence should be addressed.
Catalysts 2018, 8(12), 576; https://doi.org/10.3390/catal8120576
Submission received: 13 October 2018 / Revised: 13 November 2018 / Accepted: 19 November 2018 / Published: 22 November 2018
(This article belongs to the Special Issue Spectroscopy in Catalysis)

Abstract

:
Many works include the use of nylon membranes to separate the solid particles of photocatalysts from the photocatalytic reactors, before using spectrophotometers to evaluate the catalysts’ performance in the photocatalytic degradation of many pollutants. This might lead to significant errors due to the adsorption of some pollutants within the structure of the membranes during the filtration process used to separate the solid particles of the photocatalysts to get a clear filtrate. This, consequently, leads to incorrect calculations, which in turn are translated into false high photocatalytic efficiencies of the used catalysts. In this work, the authors study the interaction between nylon membrane filters and five different model compounds—phenol red, methylene blue, rhodamine B, rhodamine 6G, and phenol. The study reveals a significant interaction between the nylon membranes and both rhodamine B and phenol red.

1. Introduction

Water purification of refractory pollutants, like dyes and phenolic compounds, is crucial for any water treatment plant. Many techniques, such as chemical, electrochemical, physical, photoelectrochemical, and photocatalytic methods, can be used to deal with such types of compounds. The current approach is to use an advanced oxidation process in which a photocatalyst is used along with a green oxidizing agent such as ozone or hydrogen peroxide [1,2,3,4,5,6,7].
Separating photocatalysts from the photocatalytic reactor is an essential step before evaluating the performance of any photocatalyst using a spectroscopic study, to avoid the reflections and deflections of the used light, which will result in measuring incorrect read-outs and data outputs [8,9]. Among the techniques used, filtration and centrifugation are the most prevalent. The latter has been employed by many groups. Qianqian et al., Bai et al., and Liu et al. have used centrifugation for their nanomaterials; however, these techniques require several media transfers [10,11,12]. Filtration can be achieved using different types of cellulose filter papers and microporous membranes [1,9,13,14,15,16,17,18]. Among the commonly used membranes are nylon membranes [7,17,19,20,21] which will be used in this study.
During the investigation of the fluorescence signal in the photodegradation of polymers and pollutant degradation, we serendipitously discovered that a simple model compound, such as phenol red and rhodamine B, is removed efficiently through filtration using the commonly used Whatman nylon filter membranes purchased from Sigma Aldrich. This type of filter membrane, with a 0.2 μm pore size, 47 mm diameter, and 0.5 mm thickness, is proposed to be used after the photodegradation process to remove the submicron photocatalysts and obtain the filtrate for spectrophotometric analysis. This observation made us curious and, thus, we decided to investigate more in depth the removal efficiency of these nylon membranes and the removal mechanism beyond this observation. We chose several probes with different chemical characteristics, such as rhodamine B, phenol, rhodamine 6G, phenol red, and methylene blue. Our results indicate that the nature of the chemical structure is responsible for the removal through a chemical mechanism, involving a negatively charged molecule interacting with a positive charge from the terminal part of a polymer backbone in polyamide-based filters.

2. Results and Discussion

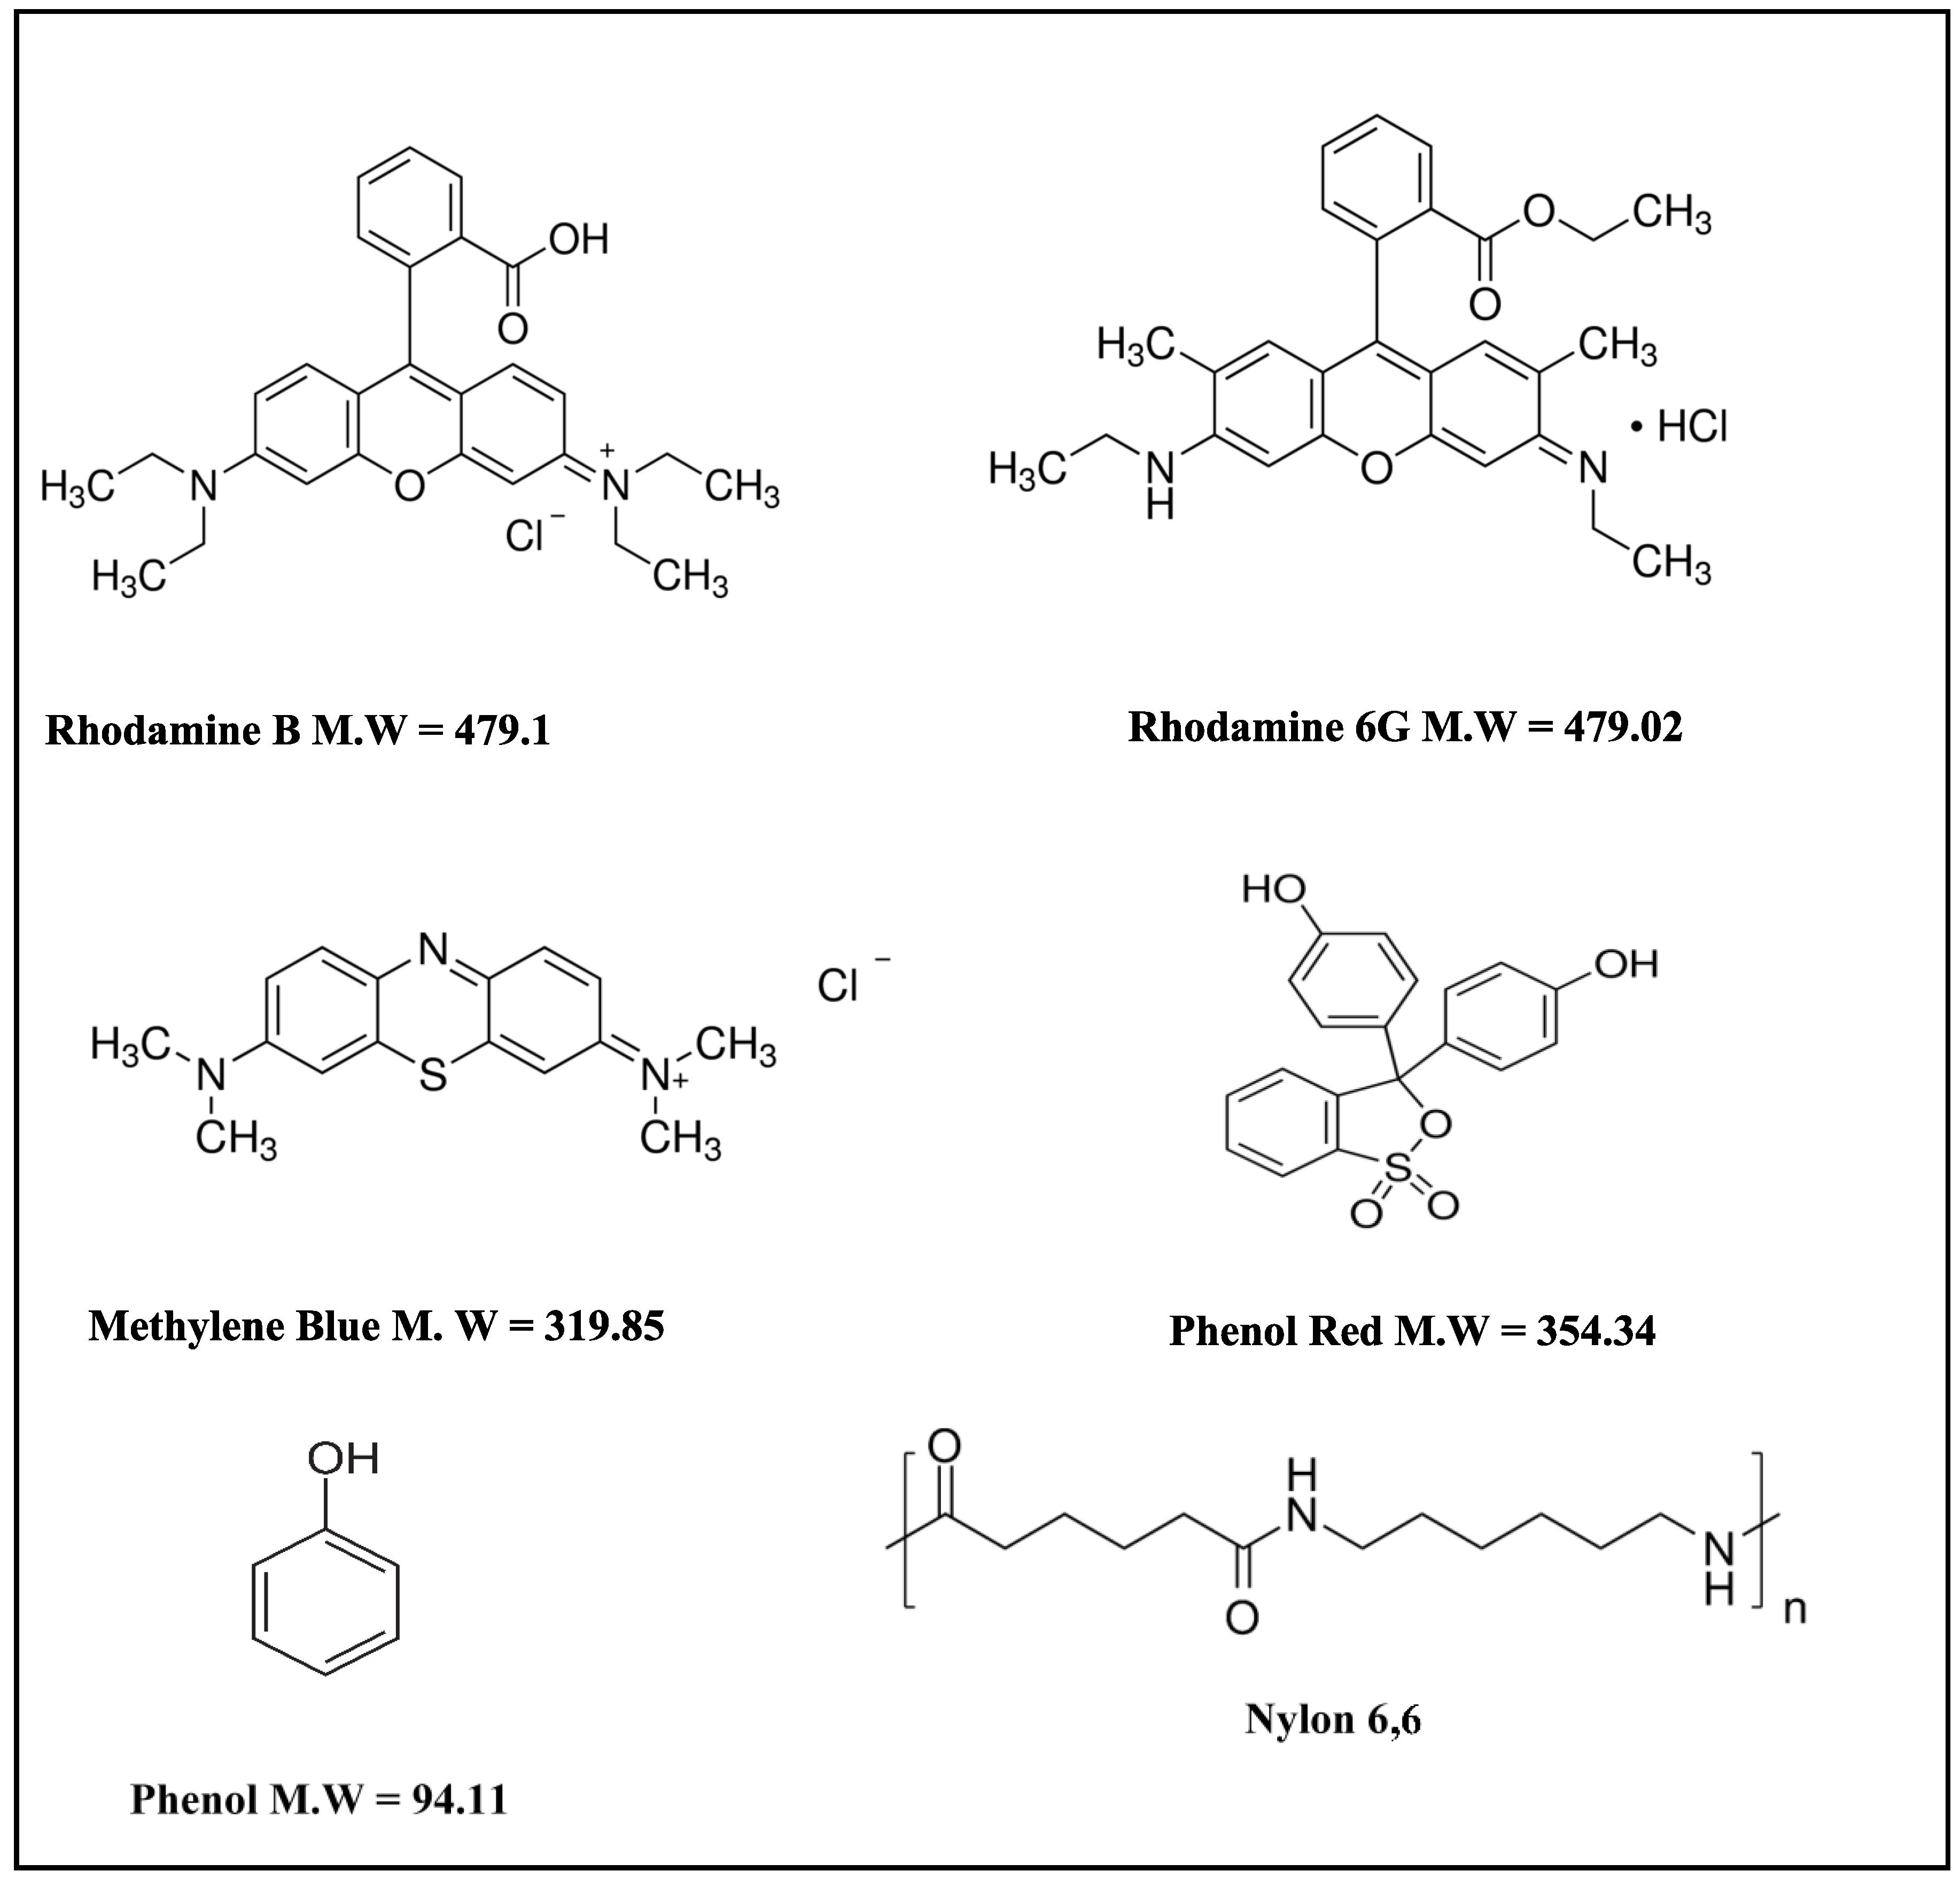
We chose several probes with different chemical characteristics, such as rhodamine B, rhodamine 6G, phenol red, methylene blue, and phenol (p). All the probes, which exhibit aromatic characteristics, as well as the structure of nylon 6,6 are depicted in Figure 1; UV detection was used on their filtrates at maximum absorbance.
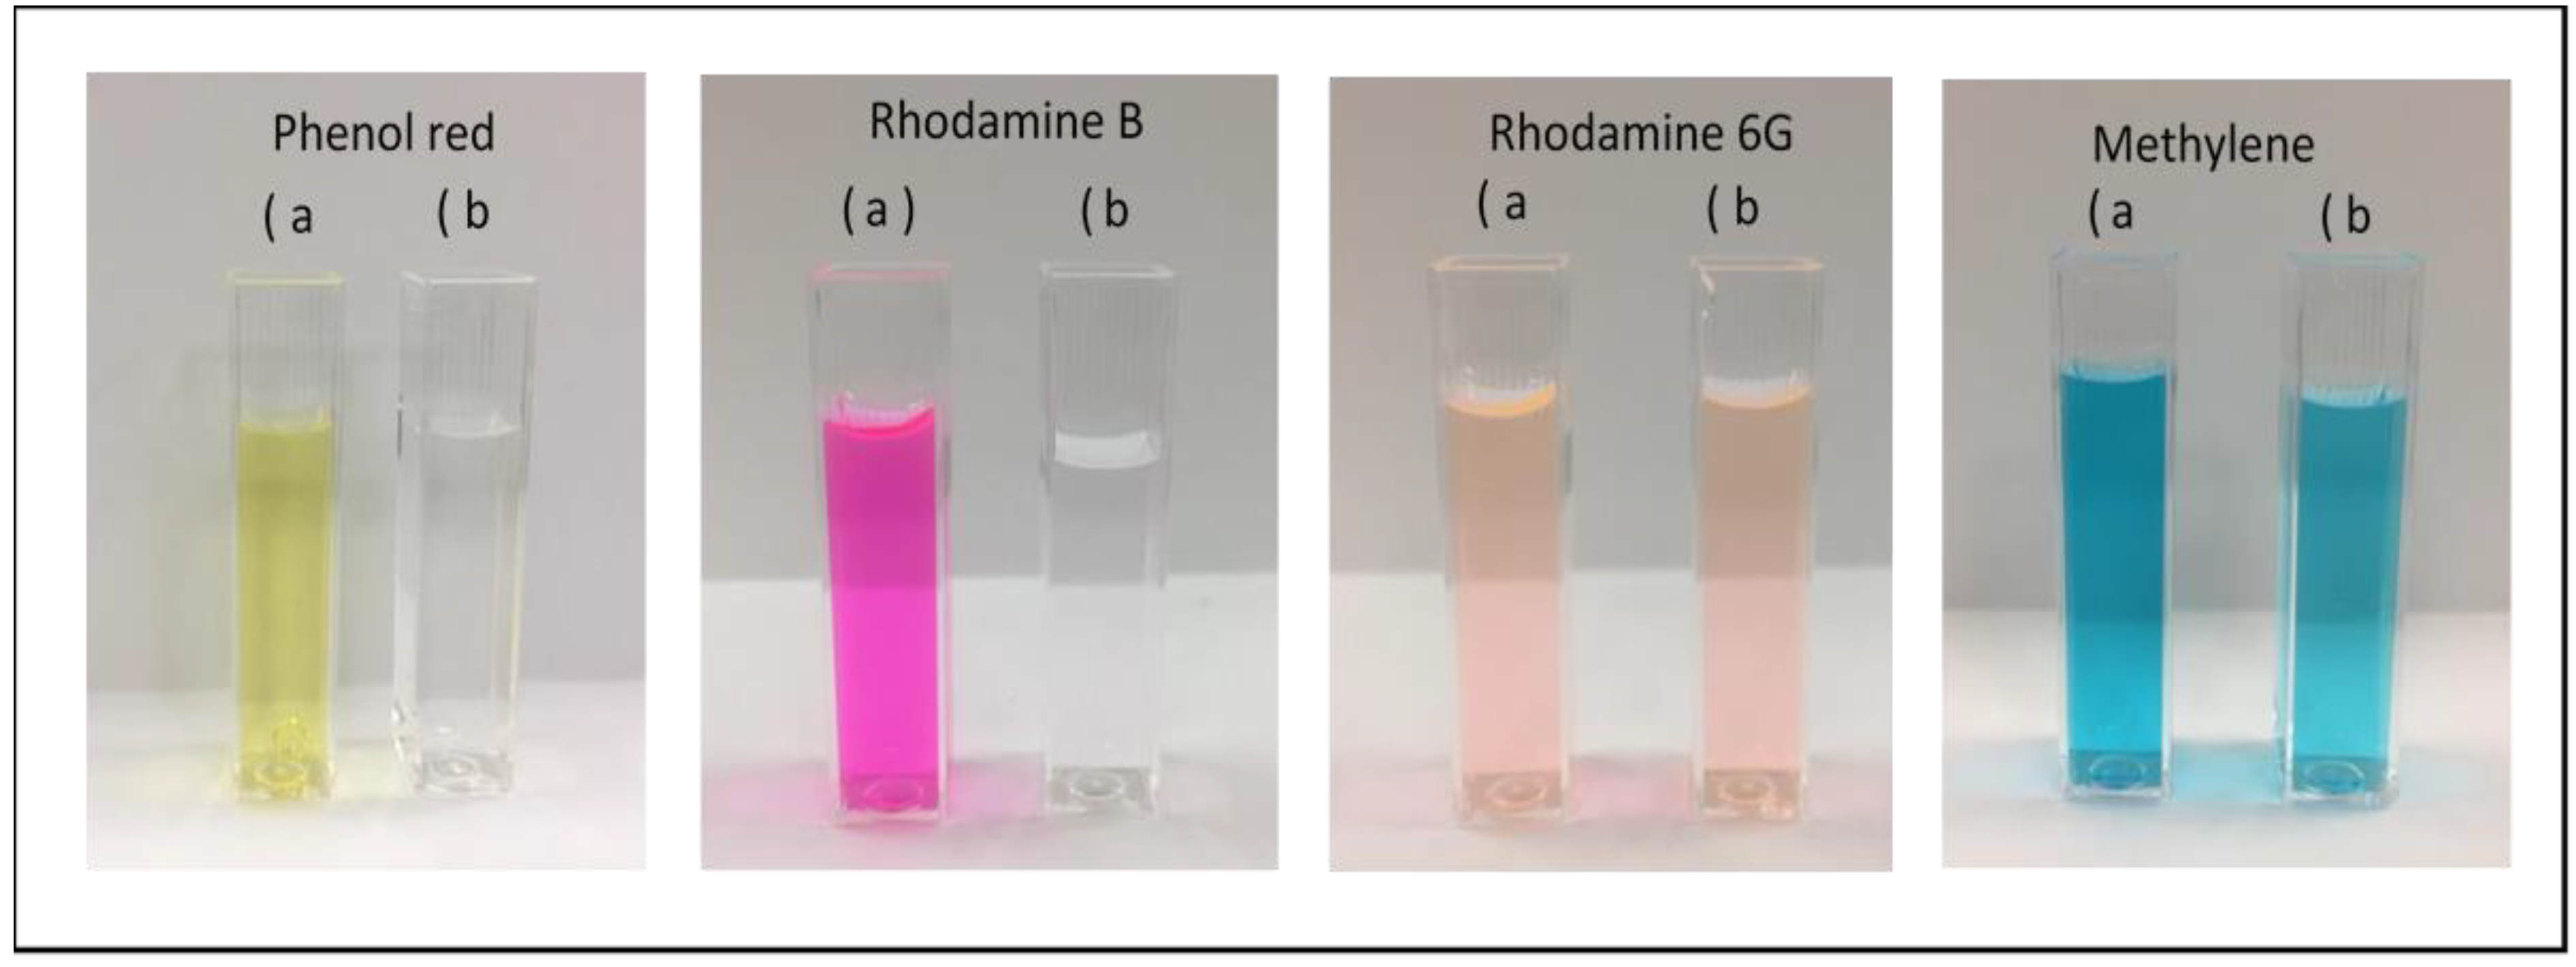
During the screening experiment using 5 mL of all probe samples at a concentration of 10 ppm, we observed that phenol, methylene blue, and rhodamine 6G were not removed, while 96% and 97% of phenol red and rhodamine B were removed completely (see Figure S1: filtration setup, Supplemeantary Materials). This can be seen in Figure 2 and Figure 3. 
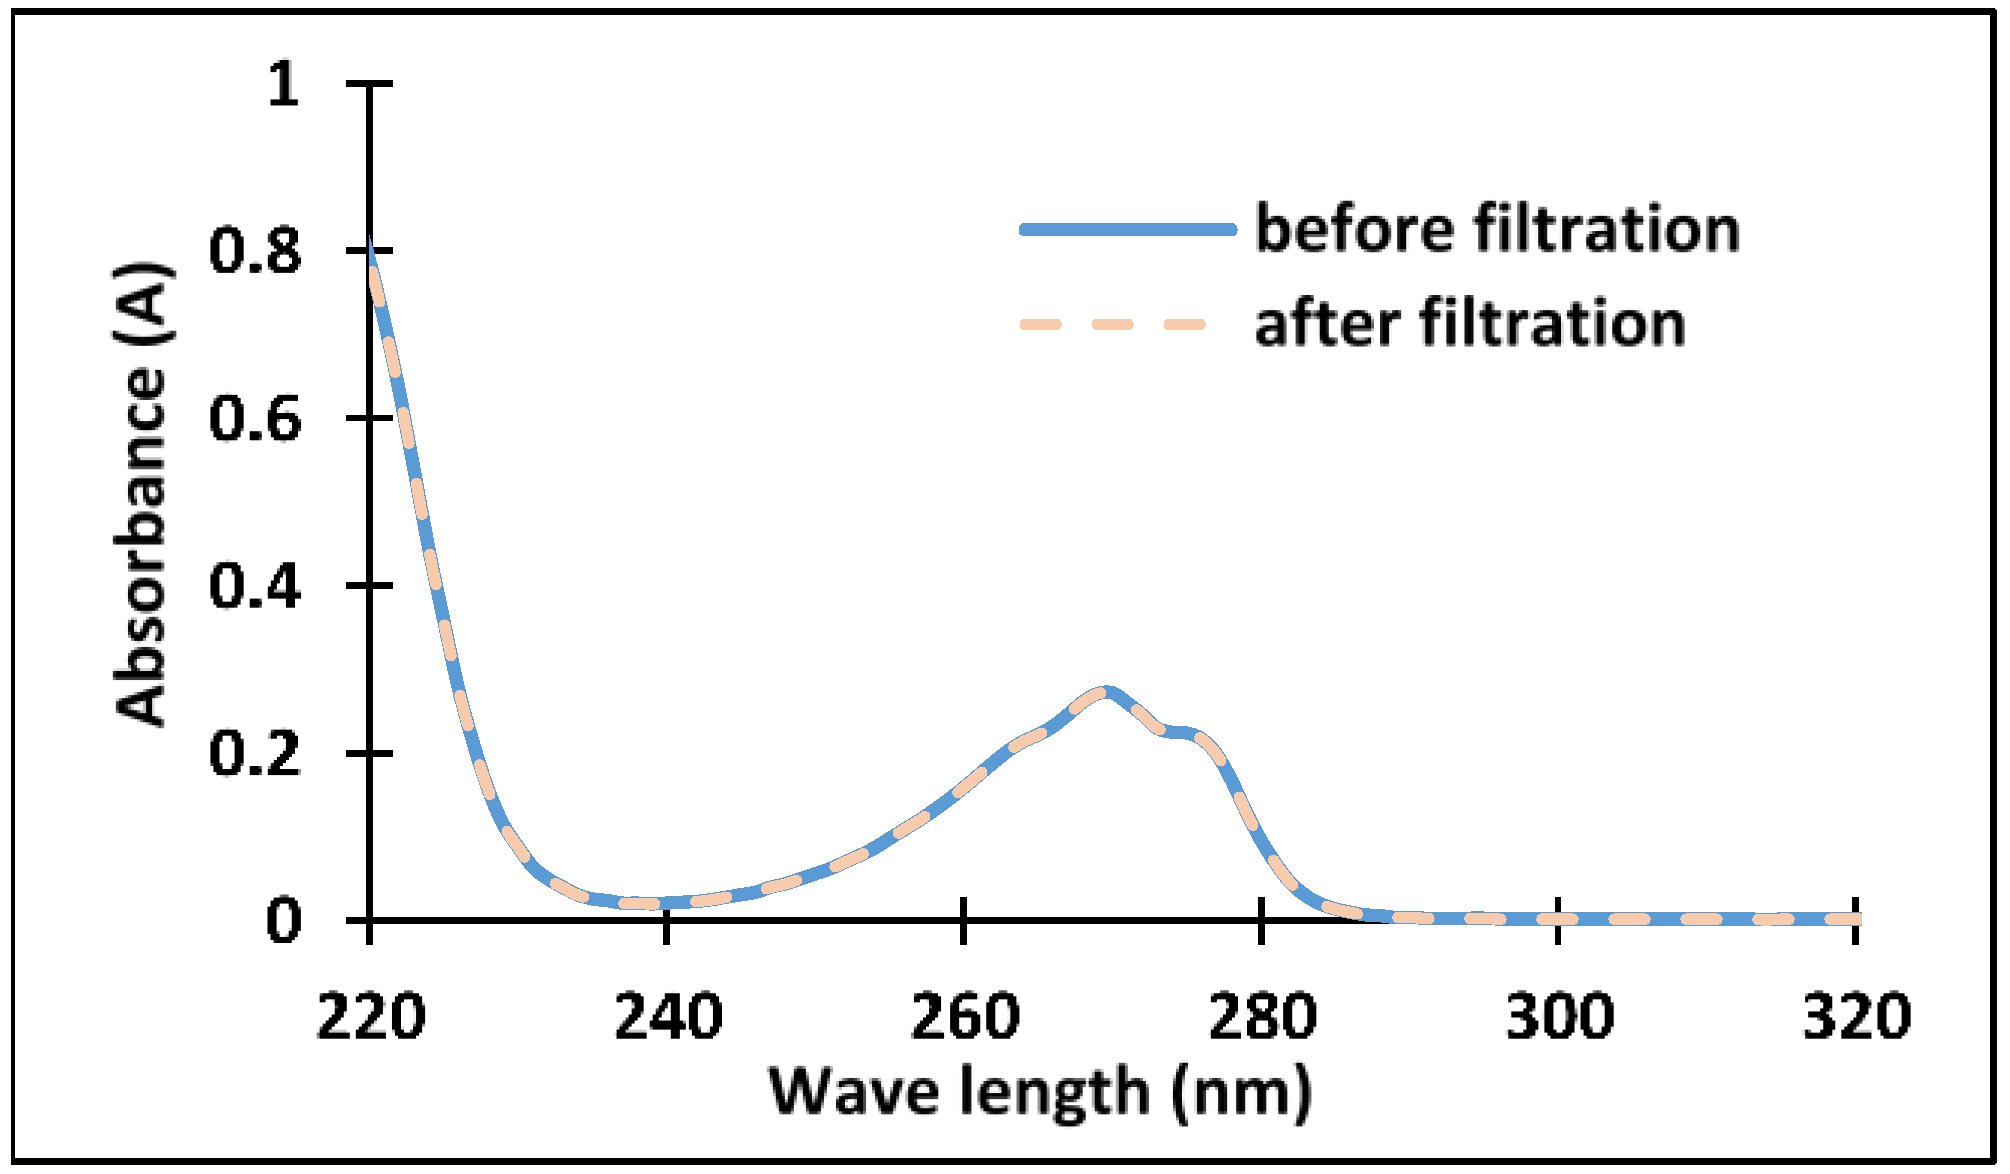
Figure 2 compares the color of the solution before and after filtration. Both phenol red and rhodamine B were almost totally removed by passing through the nylon filter membrane; however, the color of the methylene blue and rhodamine 6G samples did not undergo any change after passing through the nylon filter membrane. Since a phenol solution is colorless, the concentration of phenol before and after passing through the nylon filter membrane was measured using a spectrophotometer, as can be seen in Figure 3. Figure 3 shows no change at all in the absorption spectra of phenol after passing its solution through the membrane filter, compared to its prior absorption. It is good to note that even at at low concentration (5 ppm), a negligible removal (less than 3%) was observed for phenol, methylene blue, and rhodamine 6G. These results were confirmed by total organic carbon (TOC) analysis that showed 96% and 97% removal of phenol red and rhodamine B and no removal of phenol, methylene blue, and rhodamine 6G after the filtration process. Moreover, a 5 mL mixture of phenol red and phenol, each 10 ppm, for a total concentration of 20 ppm, was tested using a filter paper. Complete removal of phenol red and zero removal of phenol were observed. Therefore, it can be concluded that the adsorption of phenol red is not affected by phenol that is not adsorbed on the filter (see Figure S7 in Supplementary Materials).
It should be pointed out that three different batches of filters were tested, and the results were reproducible.
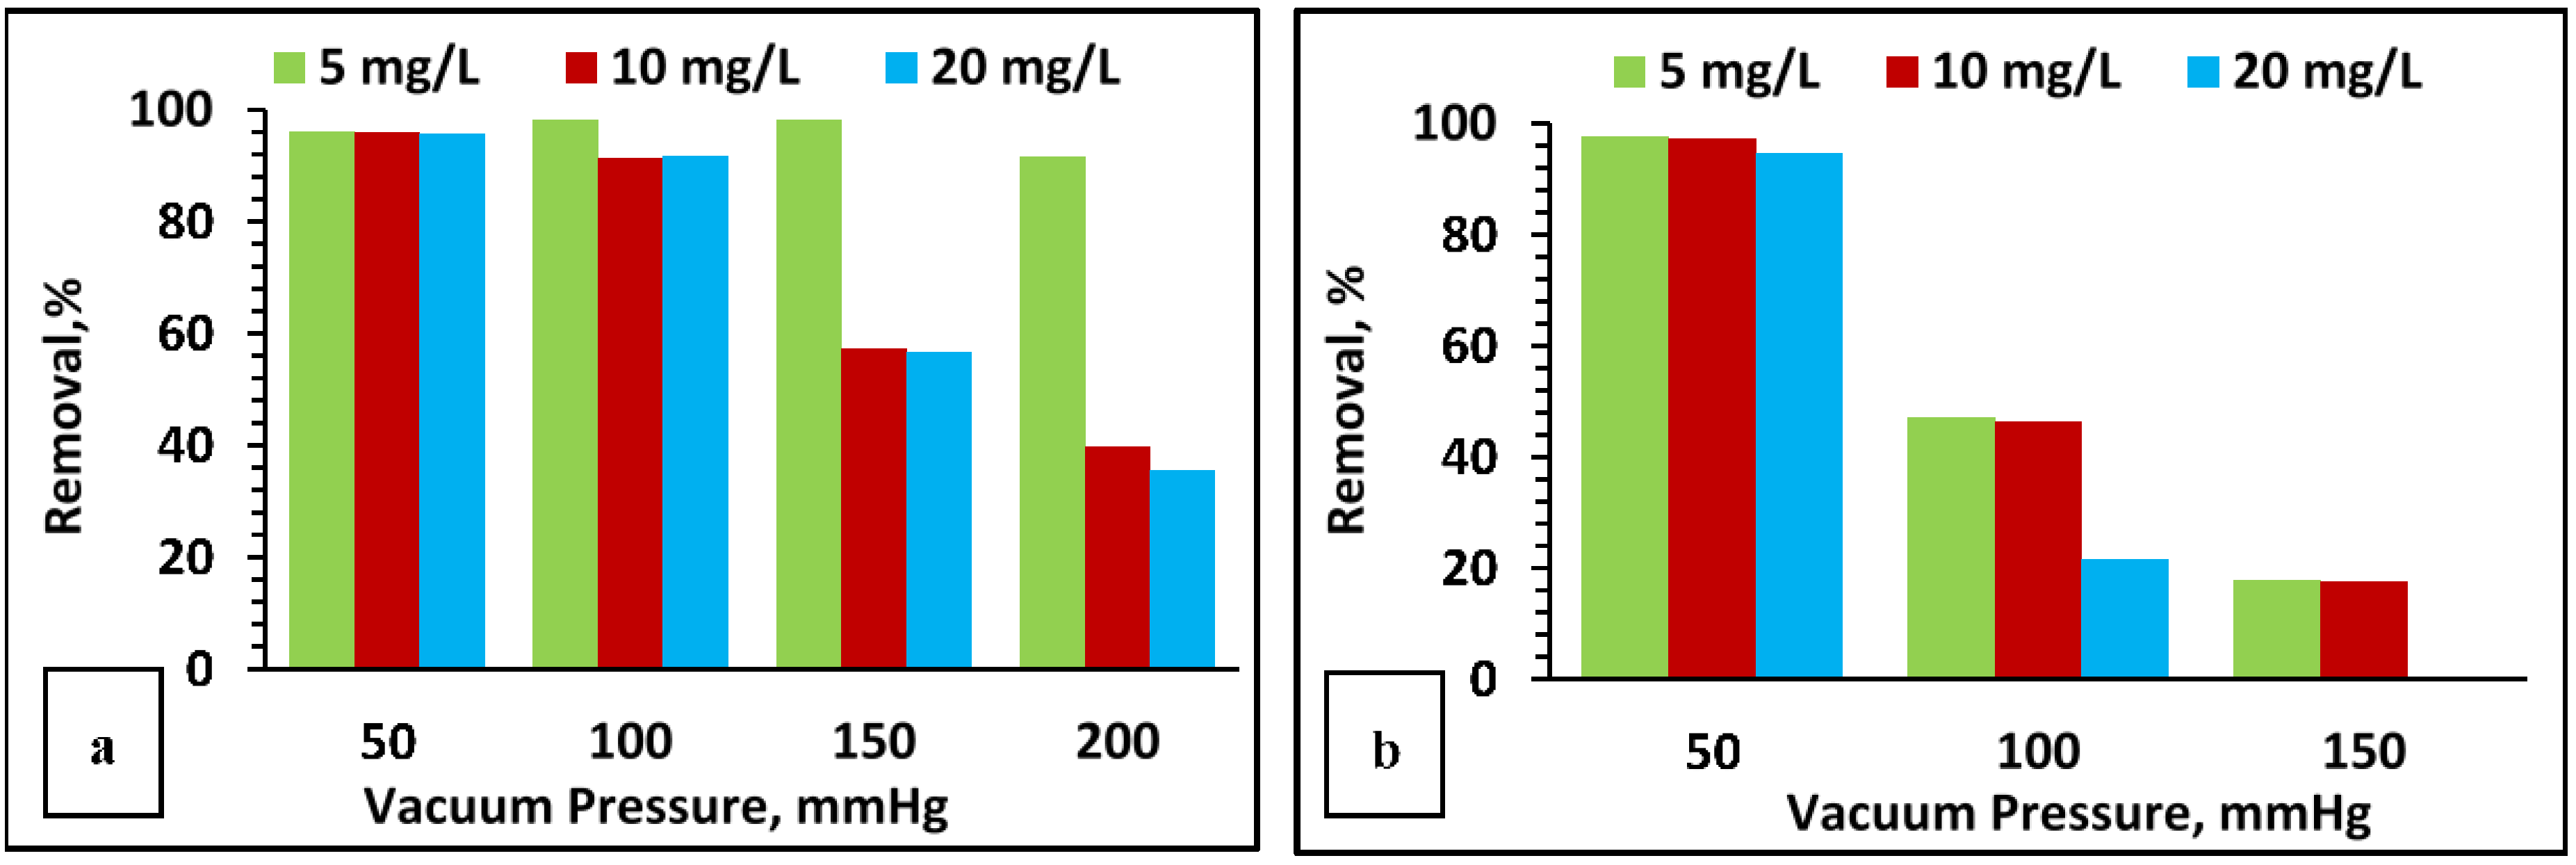
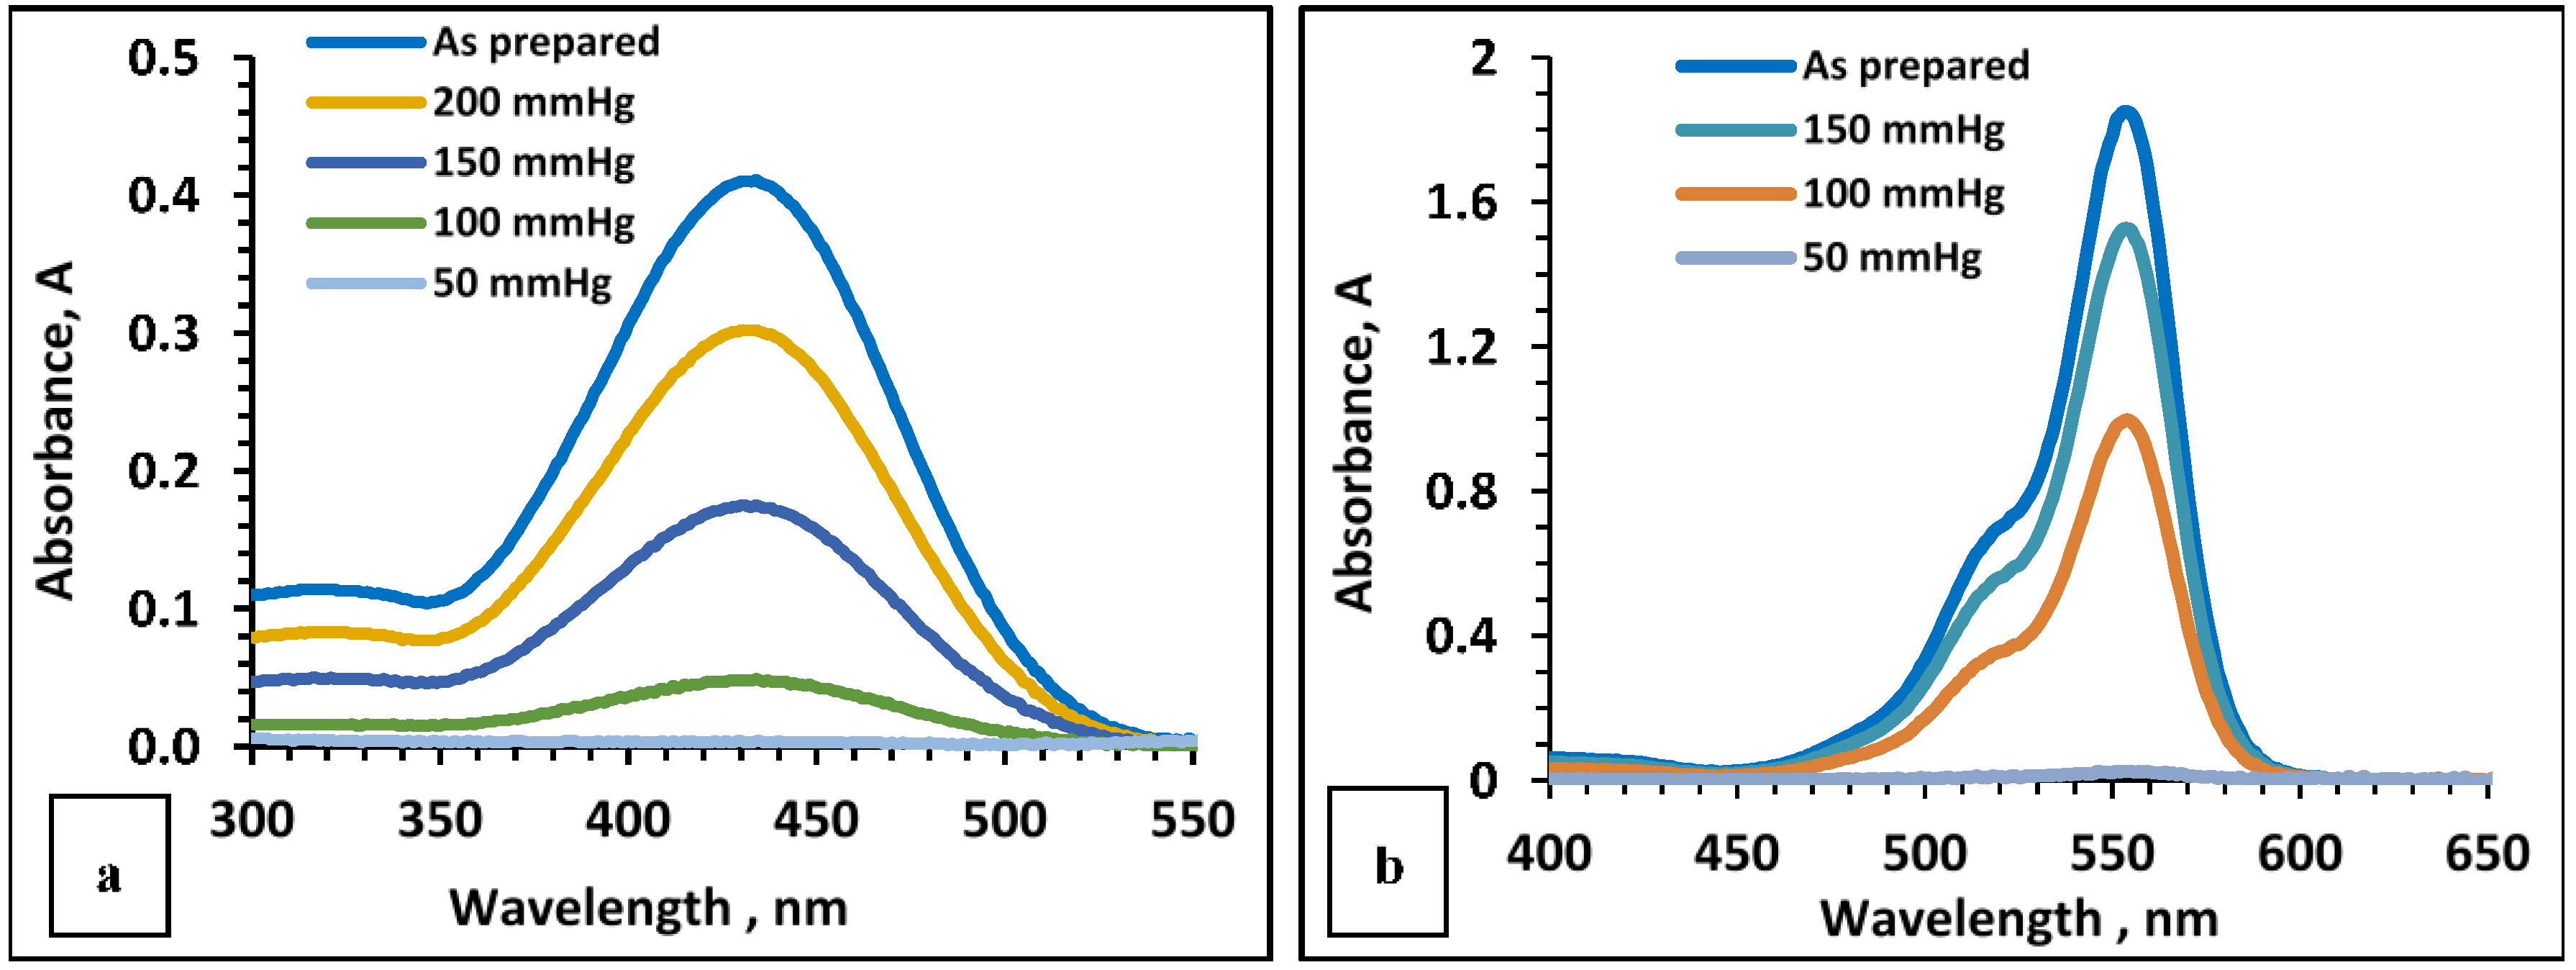
Further experiments focused on changing the applied pressure during the filtration process of 5 mL of different solutions of rhodamine B and phenol red at different concentrations of 5, 10, and 20 ppm, using a membrane filter (Figure 4a,b). It is worth mentioning that the choice of the concentrations (20 and 10 ppm) was based on the concentrations reported in the literature [7,17,19,20,21]. A high vacuum (i.e., low pressure and high suction power) enhanced the removal of the dyes in all cases. Regarding 5 ppm phenol red, only a slight increase in the removal was observed at a pressure increase from 50 to 100 mmHg with no further unchange until 150 mmHg, at which point the removal increased from 96% to 98.2%. Then, the removal decreased to 91.6% at 200 mmHg. For solutions with increased concentration of phenol red to 10 ppm, the effect of the applied pressure was more pronounced. The previously observed 95.9% removal of phenol red at 50 mmHg was decreased to 91.3% at 100 mmHg and then decreased drastically to 57.2% and 39.8% at 150 and 200 mmHg, respectively. A similar trend was observed with 20 ppm phenol red. The effect of pressure was more noticeable in the case of rhodamine B than in the case of phenol red. During experiments with a 5 ppm solution of rhodamine B at 50, 100, and 150 mmHg, we observed a progressive decrease in dye removal corresponding to 97.6%, 47.1%, and 17.8%, respectively. A similar trend was observed at a higher concentration of rhodamine B. It is important to note, as clearly shown in Figure 4, that the dye removals from 5, 10, 20 ppm solutions of phenol red at 50 mmHg, without adjustment of pH, were quantitatively very close to each other, and the same situation was observed for rhodamine B. This led to the conclusion that 50 mmHg is the optimal vacuum pressure for studying the removal of dyes at different concentrations and, especially, their mixtures.
The UV–vis spectra of filtrates from 5 mL solutions at 10 ppm concentration of phenol red and rhodamine B using different vacuum pressures are depicted in Figure 5a,b.
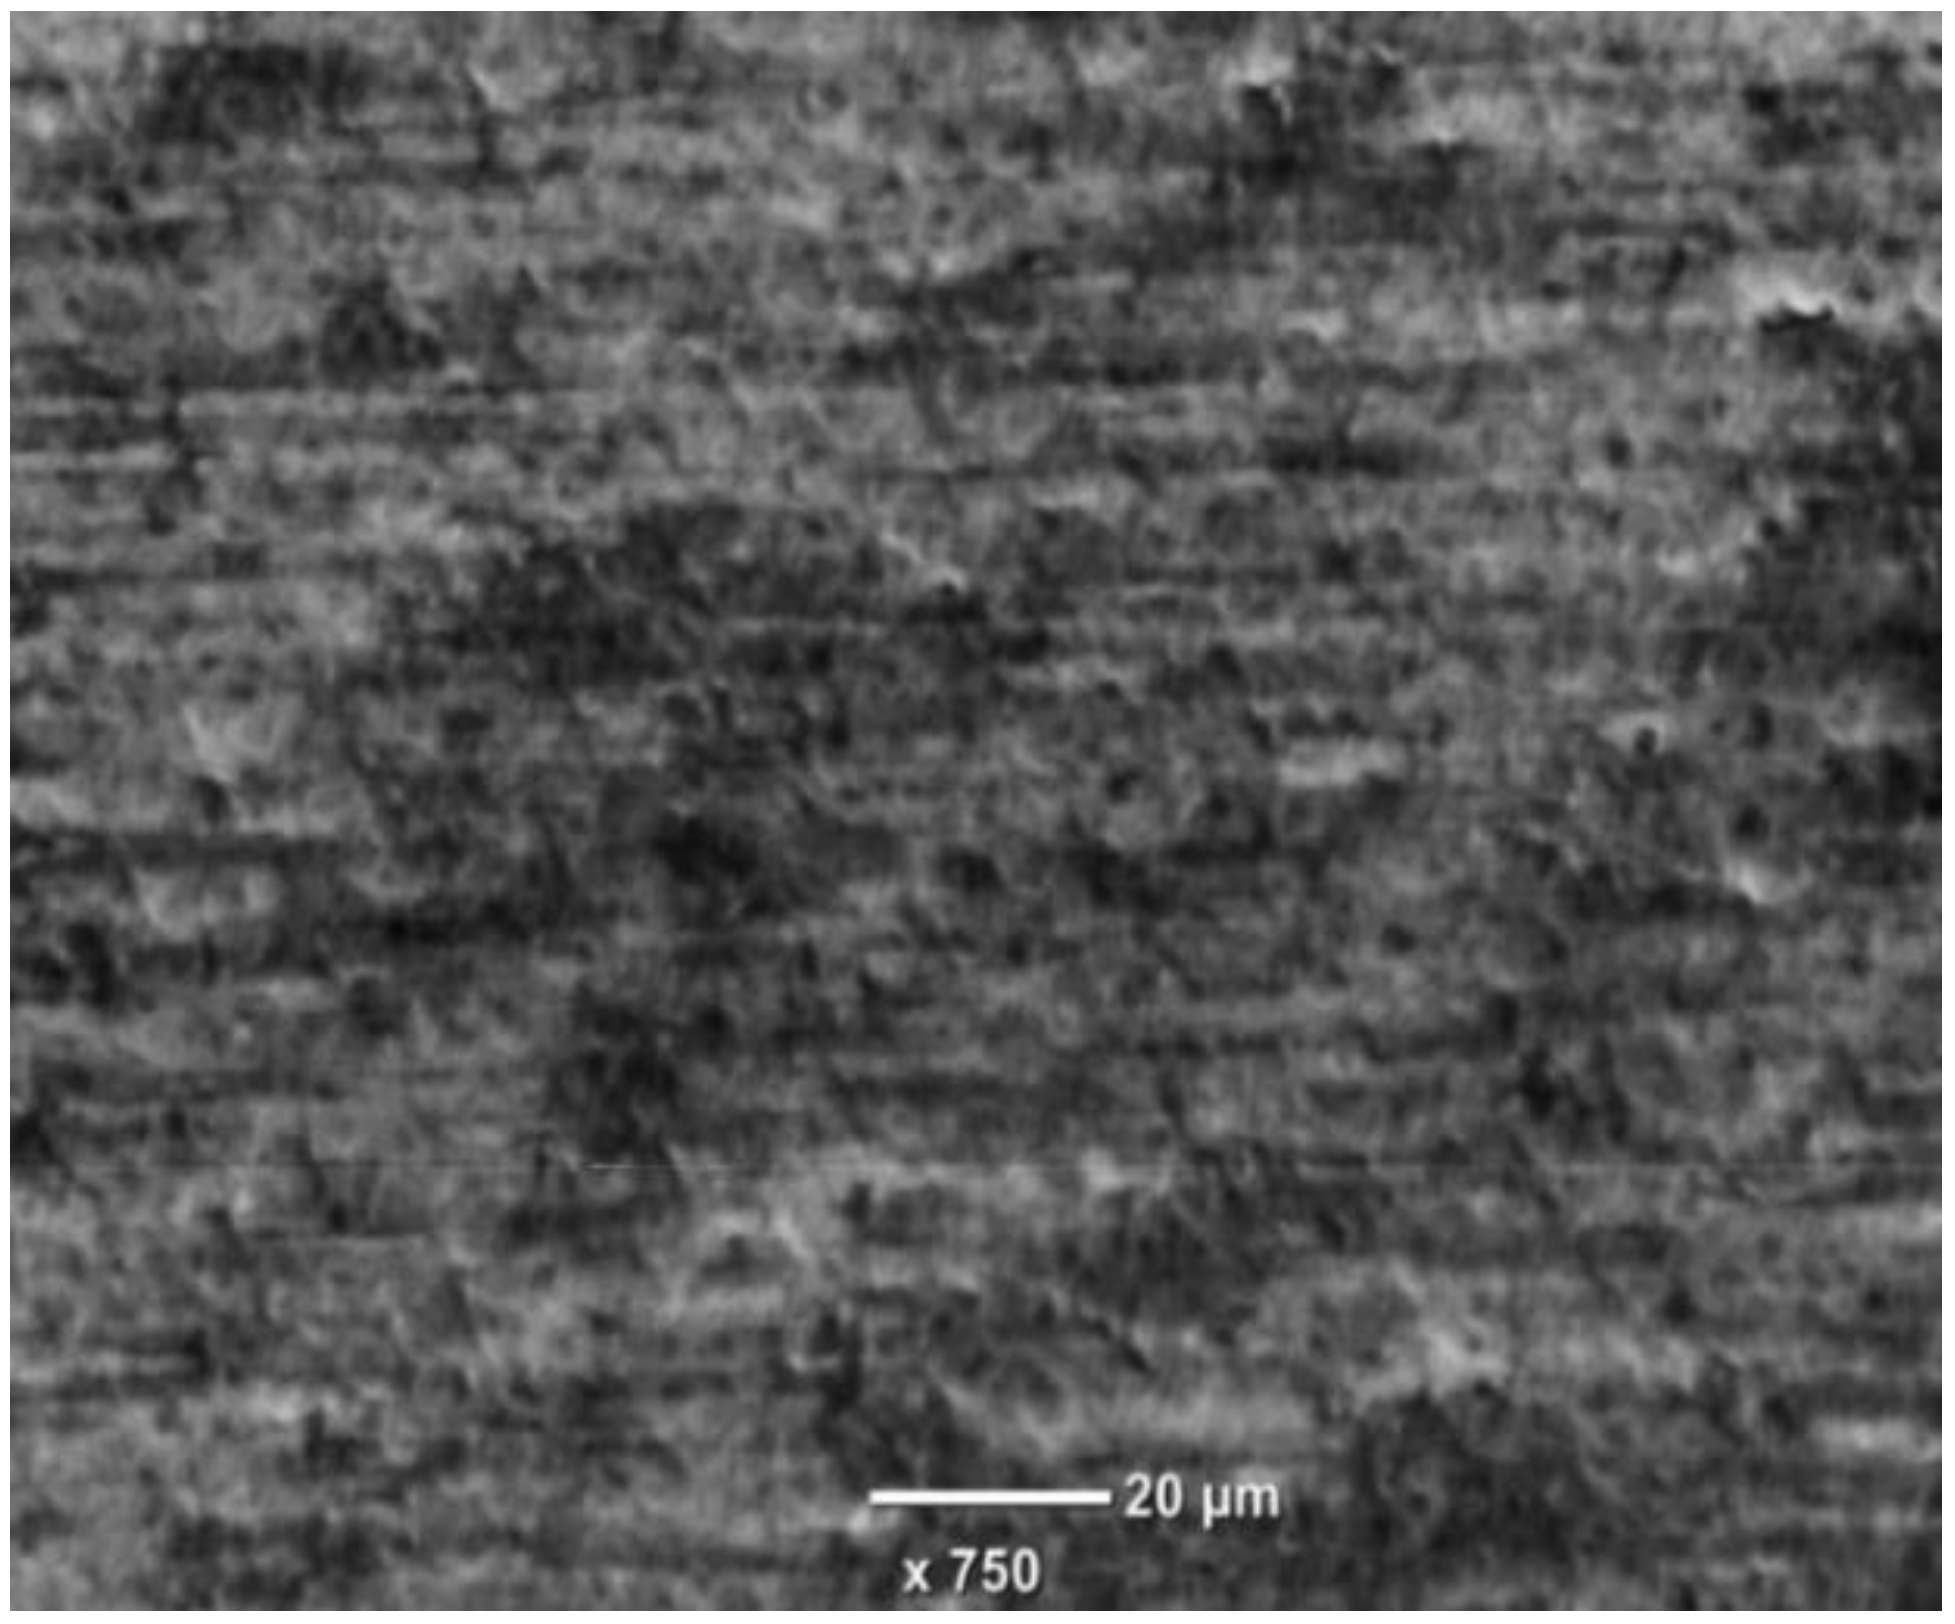
The efficient removal of the dyes under study at higher vacuum pressures was attributed to the membrane filter structure that is porous, as can be seen in the SEM picture (Figure 6). A higher vacuum (lower pressure, i.e., higher suction power), therefore, allows a more efficient dye penetration through the pores of the membrane filter and increases the selective permeation region of the filter porous membrane, increasing the contact area between the dyes and the structure of the membrane. The influence of higher vacuum on dye removal was more pronounced in the case of phenol red; thus, we assume a stronger interaction of phenol red with the filtration setup. Increasing the concentration of the dyes under study led to a decreased removal capacity of the membrane filter. An enhancement of dye removal can be achieved by using a multiple-filter membrane assembly, as it was investigated in a comparison of dye removal from different volumes of a 20 ppm mixture of phenol red and rhodamine B (each 10 ppm) using one and three nylon filter membranes (FP) at 50 mmHg (Table 1). Regarding phenol red, the removal percentage changed upon increasing the volume from 5, to 10, and to 50 mL, reaching values of 99.1%, 98.4%, and 65.5%, respectively, for one membrane, and 99.6%, 99.6%, and 97.9%, respectively, for the three-membrane assembly. Similarly, for rhodamine B, using a one-membrane filter, the removal percentage from 5, 10, and 50 mL solutions were 98.2%, 82.5%, and 36.1%, respectively, while, when applying the three-filter membrane, the removal increased to 99.7%, 99.7%. and 75.9%, respectively. With dye concentrations three-times higher, the use of three filters enhances the removal linearly, as investigated with 30 ppm solutions of phenol red and rhodamine B at 50 mm Hg, for which complete removal of phenol red (99.8%) and rhodamine B (99.2%) was observed. This is due to the increase in the membrane surface area (See Figures S2 and S3 in the Supplementary Materials).
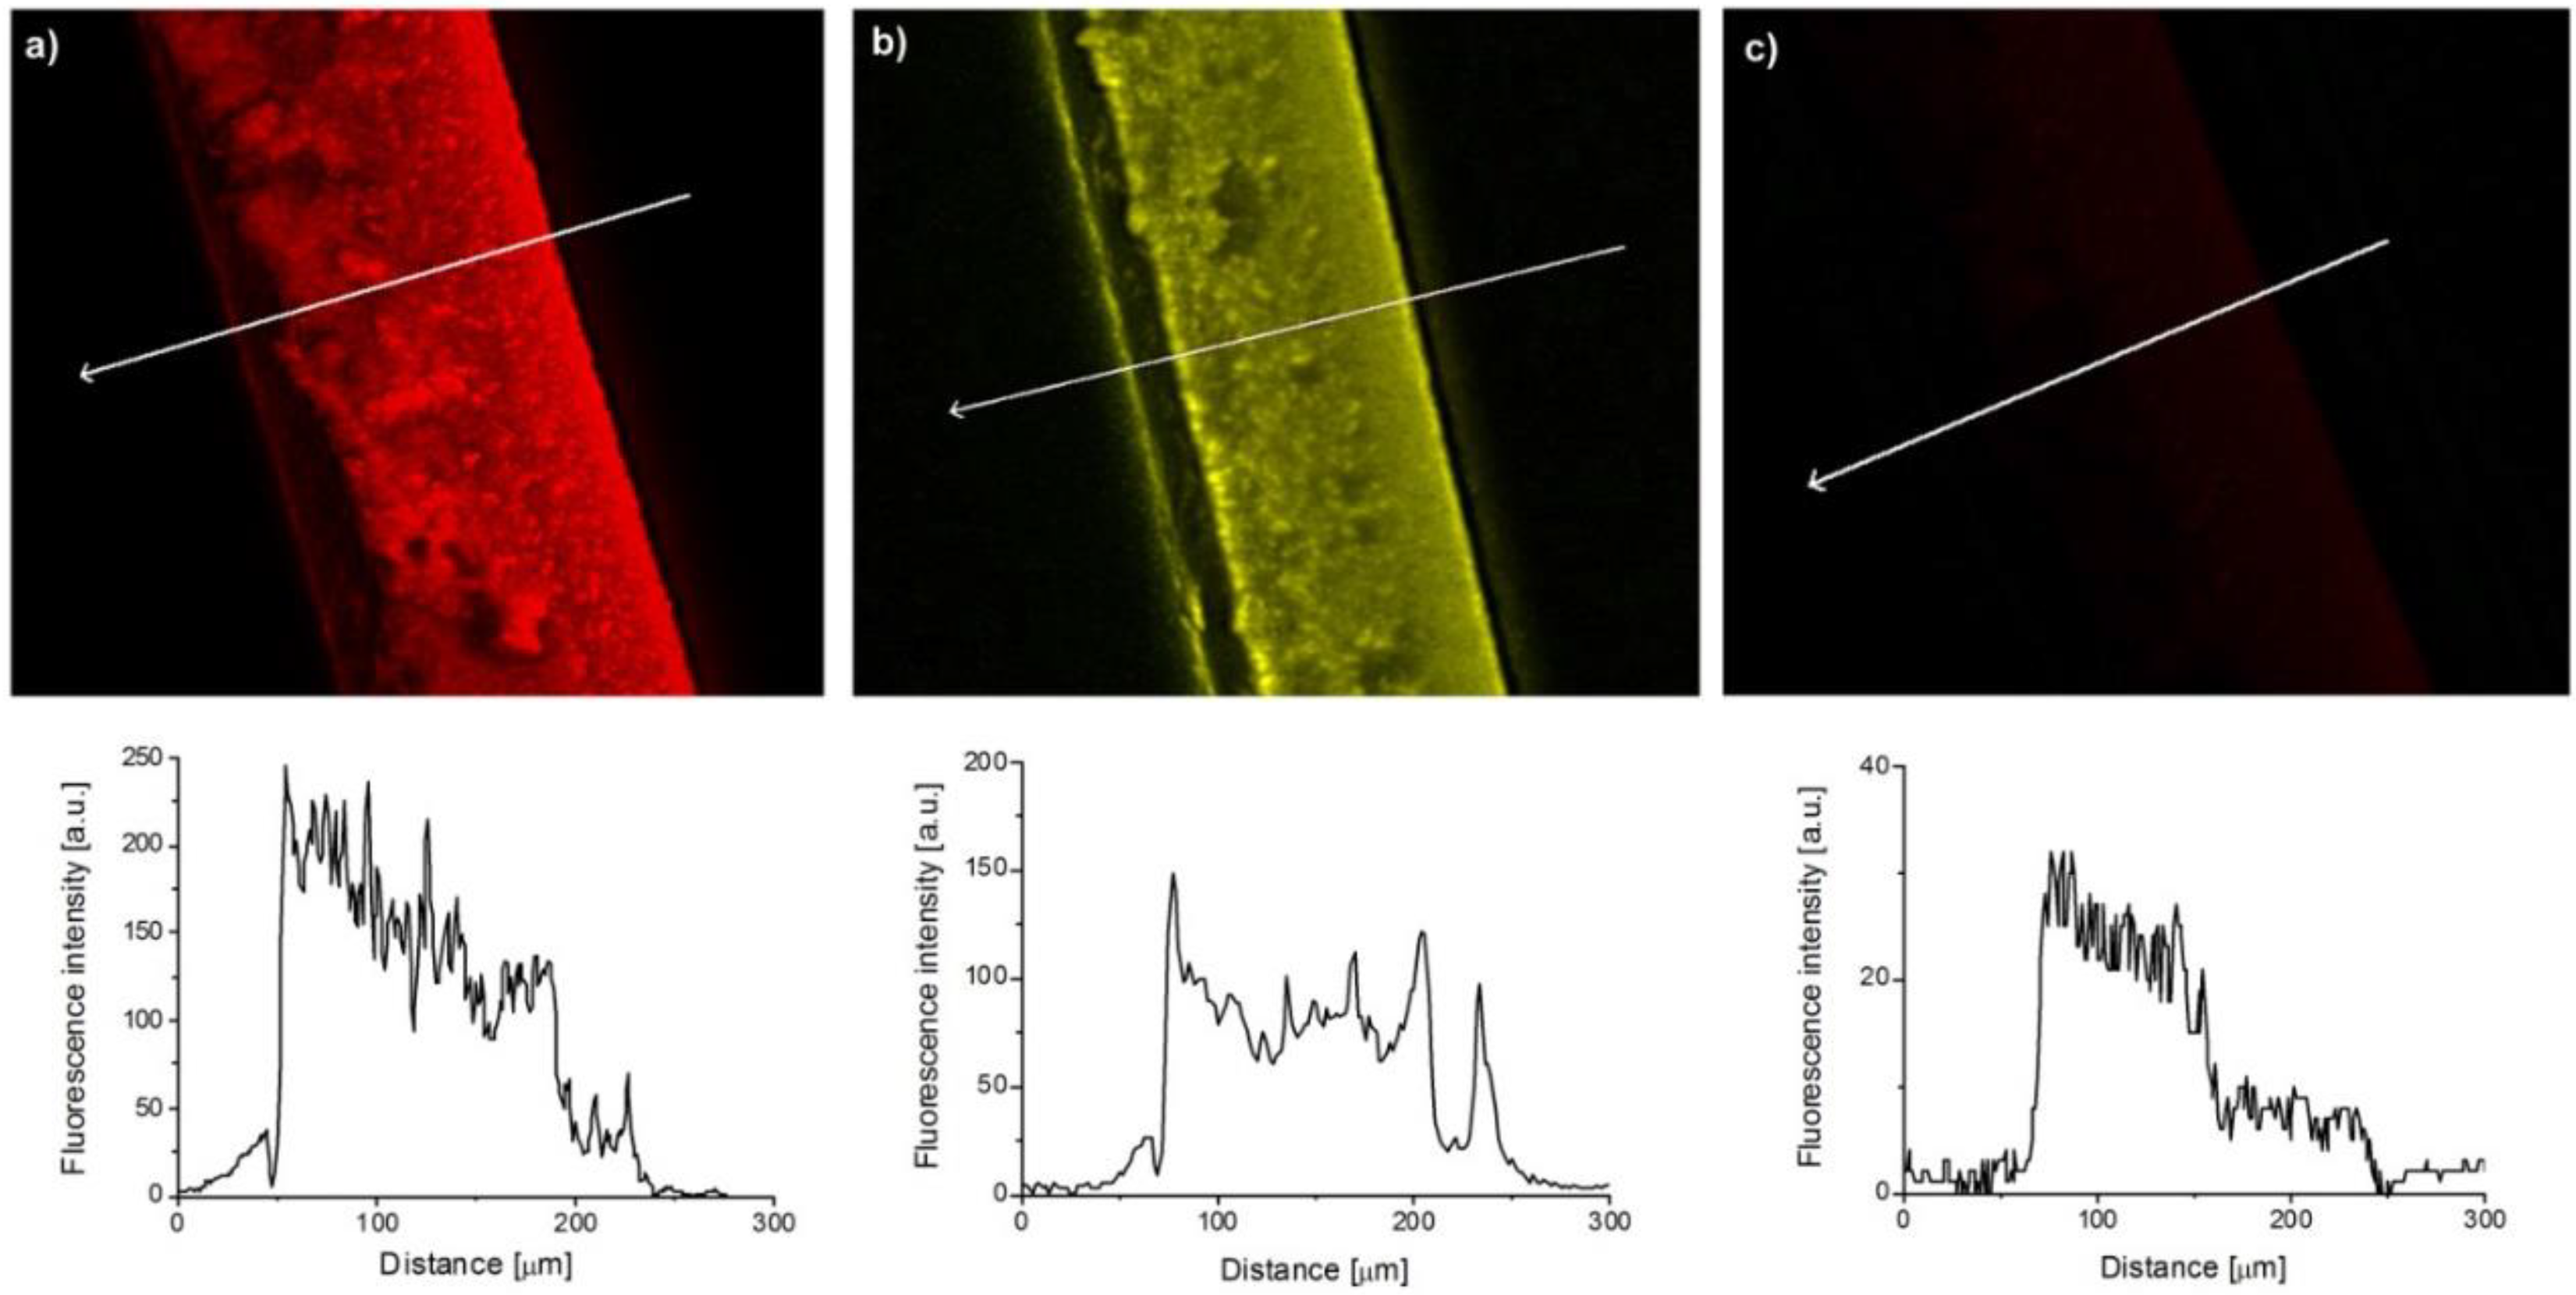
To study the removal capacity, the dye distribution and profile in cross sections of the membrane filters was investigated using confocal microscopy (Figure 7). It should be pointed out that attempts for confocal microscopy investigation directly from the top of the samples were carried out; however, the optical properties of the dense mesh of the membrane did not allow for this type of measurement. The arrows in Figure 7 indicate the direction of filtration. Two areas were chosen for investigation that differed for their contact with the filtrate. The first area corresponded to clear membrane filter where filtration took place, whereas the second area corresponded to a membrane region in contact with the ceramic support. Figure 7a,b shows that no precipitation formed, and both rhodamine B and phenol red were distributed gradually from the upper to the bottom part of the membrane. Intensity was much higher in the area were filtration took place (7a) compared to the areas in contact with the ceramic support (7c), suggesting the presence of an interaction between the dye and the membrane filter nylon material. Concerning the part of the filter in contact with ceramic, although the concentration of the dye was much lower, after normalization of the intensity, a similar gradual intensity profile of dye through the filter was observed (Figure 7, bottom row). For phenol, rhodamine 6G, and methylene blue it was observed that their fluorescence was negligible.
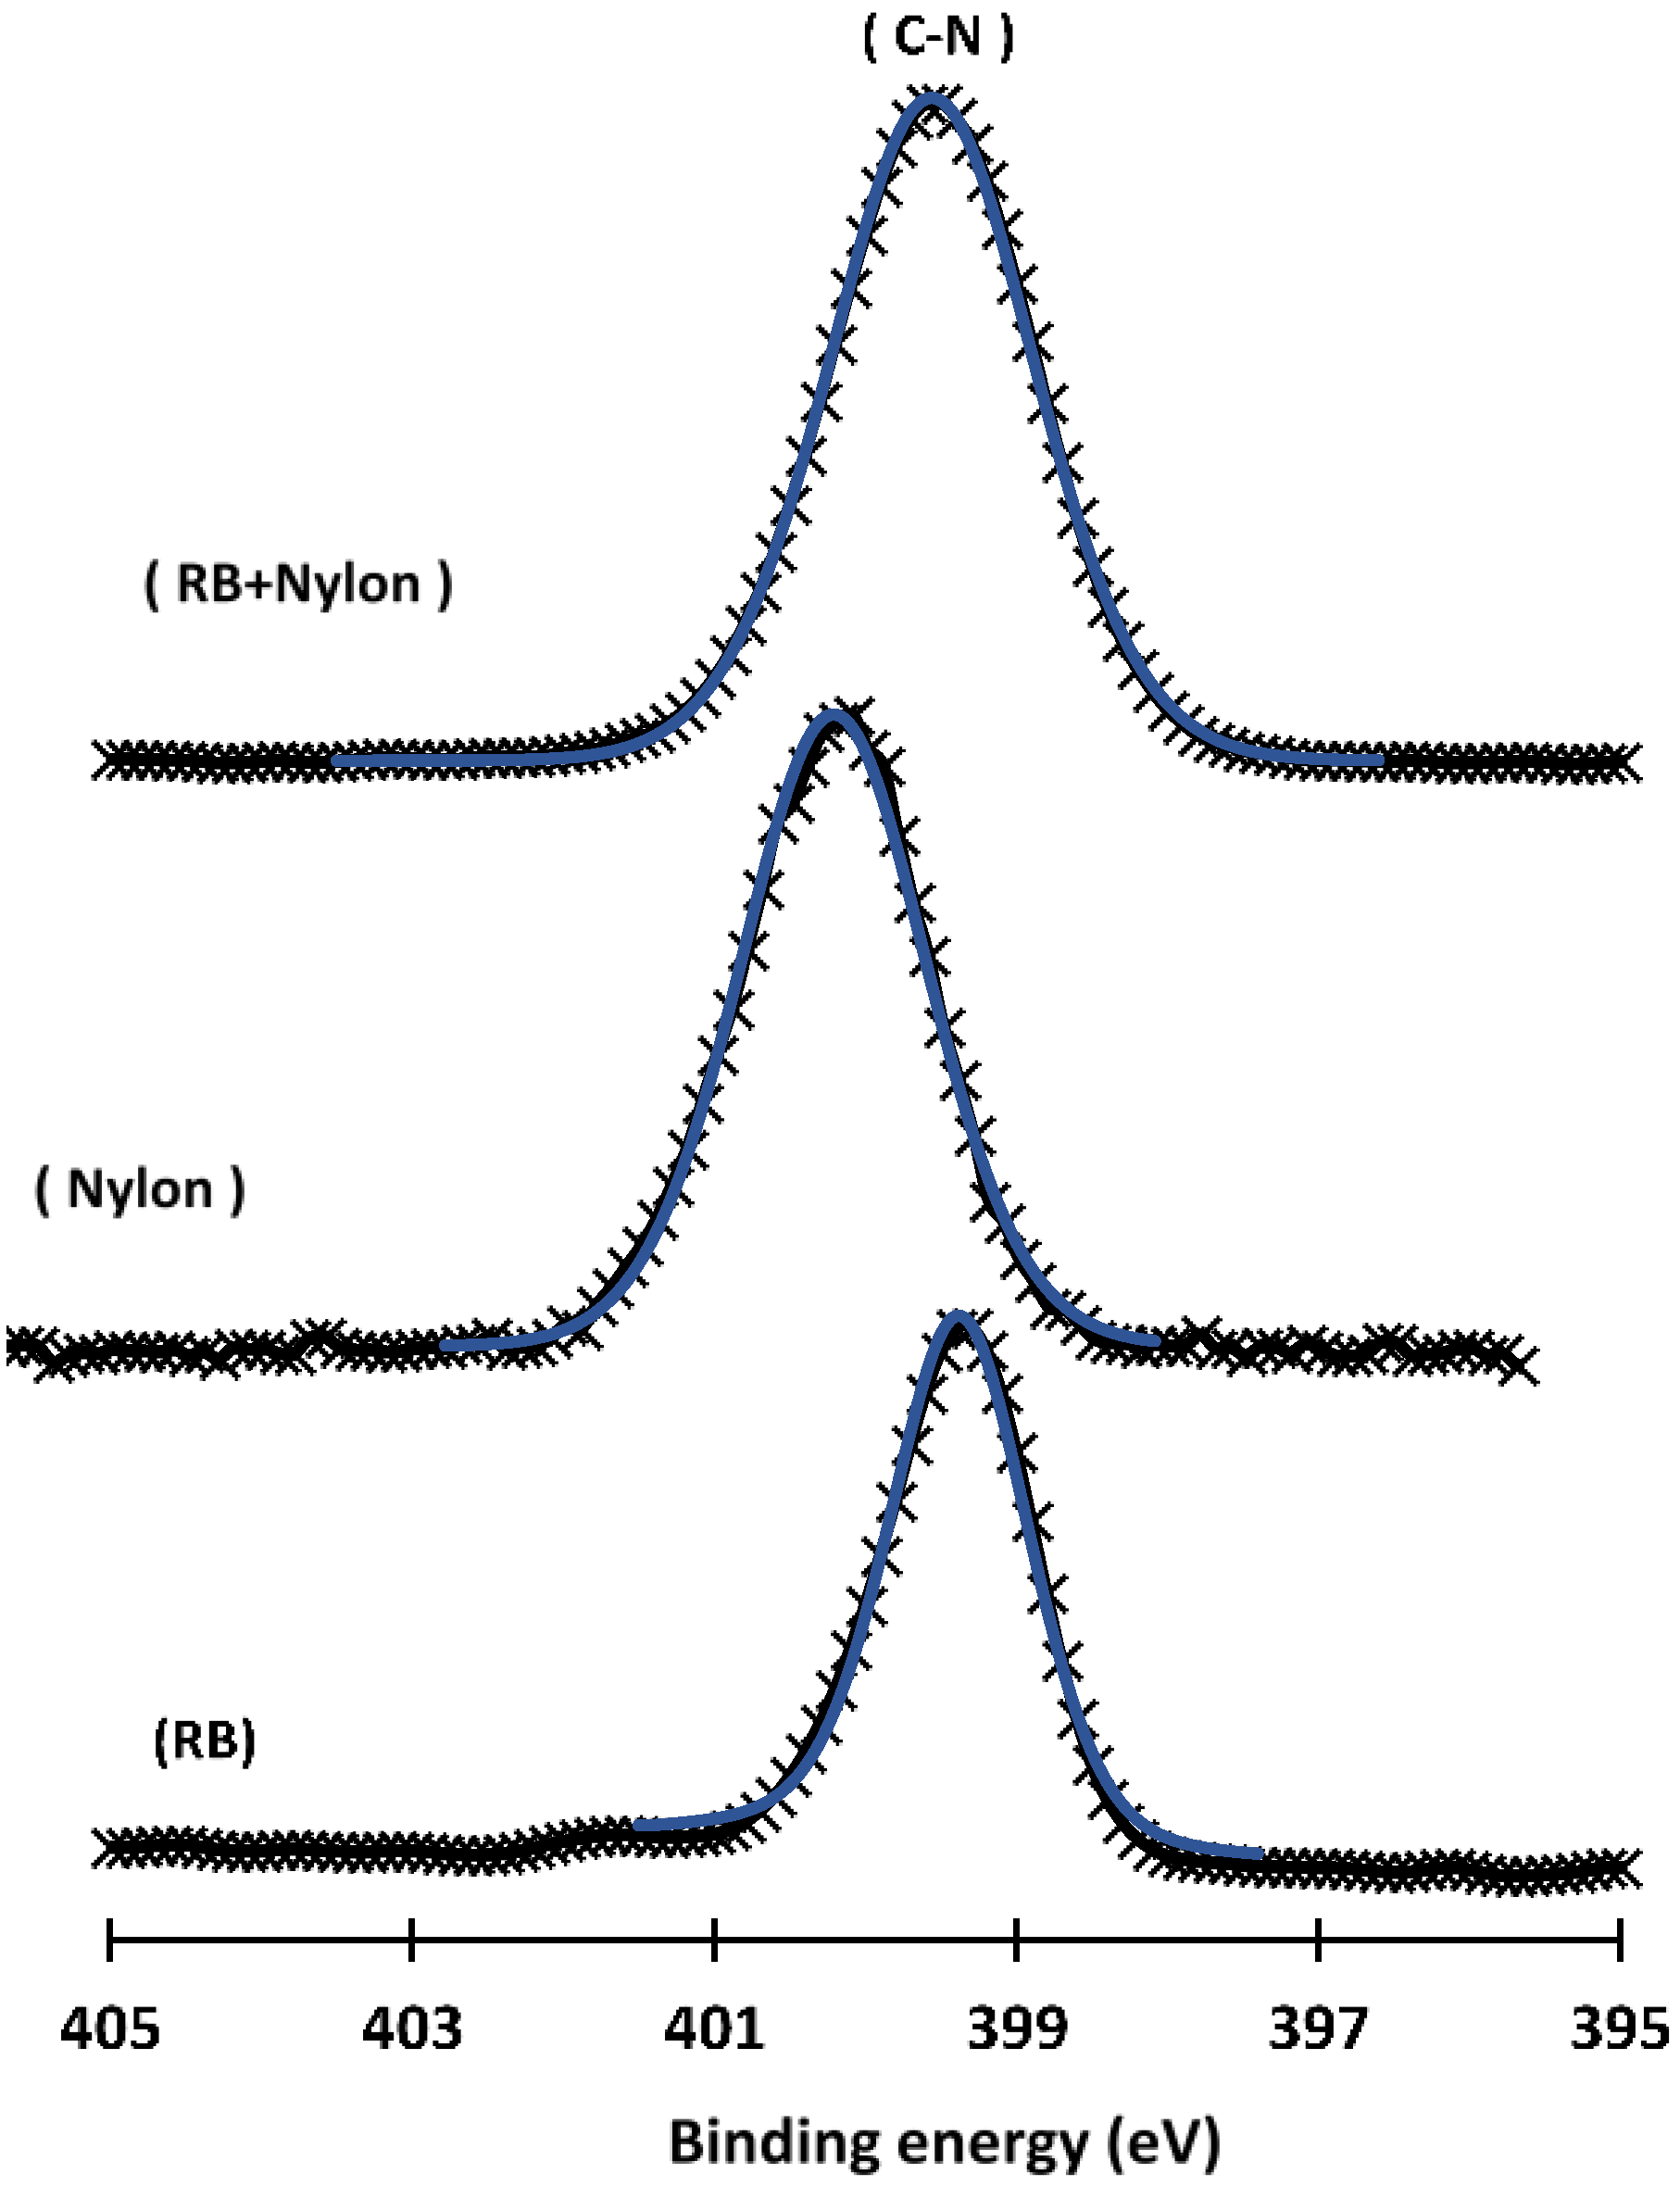
Since we assumed an interaction of the nylon filter with some probe, we conducted an X-ray Photoelectron Spectroscopy (XPS) investigation. XPS is a technique providing simple analyses of elements and their surface chemical state. Figure 8 shows the XPS spectra region of N1s for rhodamine B, a nylon membrane filter, and a nylon membrane filter + rhodamine B. The binding energies for N1s can be observed at 339.37, 399.53, and 399.56 eV for rhodamine B, nylon, and rhodamine B + nylon, respectively. On the basis of full-width at half-maximum (FWHM), N1s’ peak of rhodamine B + nylon is broader (FWHM of 1.59) than that of nylon and rhodamine B (FWHW of 1.46 and 1.12, respectively). The increase in the broadening of N1s in rhodamine B + nylon could be attributed to the overlap between the N1s’ peaks of rhodamine B and nylon.
The XPS of phenol red (Figure 9) showed the presence of two spectra lines for S2p, at 167.69 and 168.83 eV for 3/2 and 1/2 spin-orbit coupling. These peaks represent the SO3 group in the phenol red structure. Following filtration with the nylon membrane, the same S2p peak was observed, but broader and less intense, which might be due to the low intensity of phenol red on a nylon membrane filter.
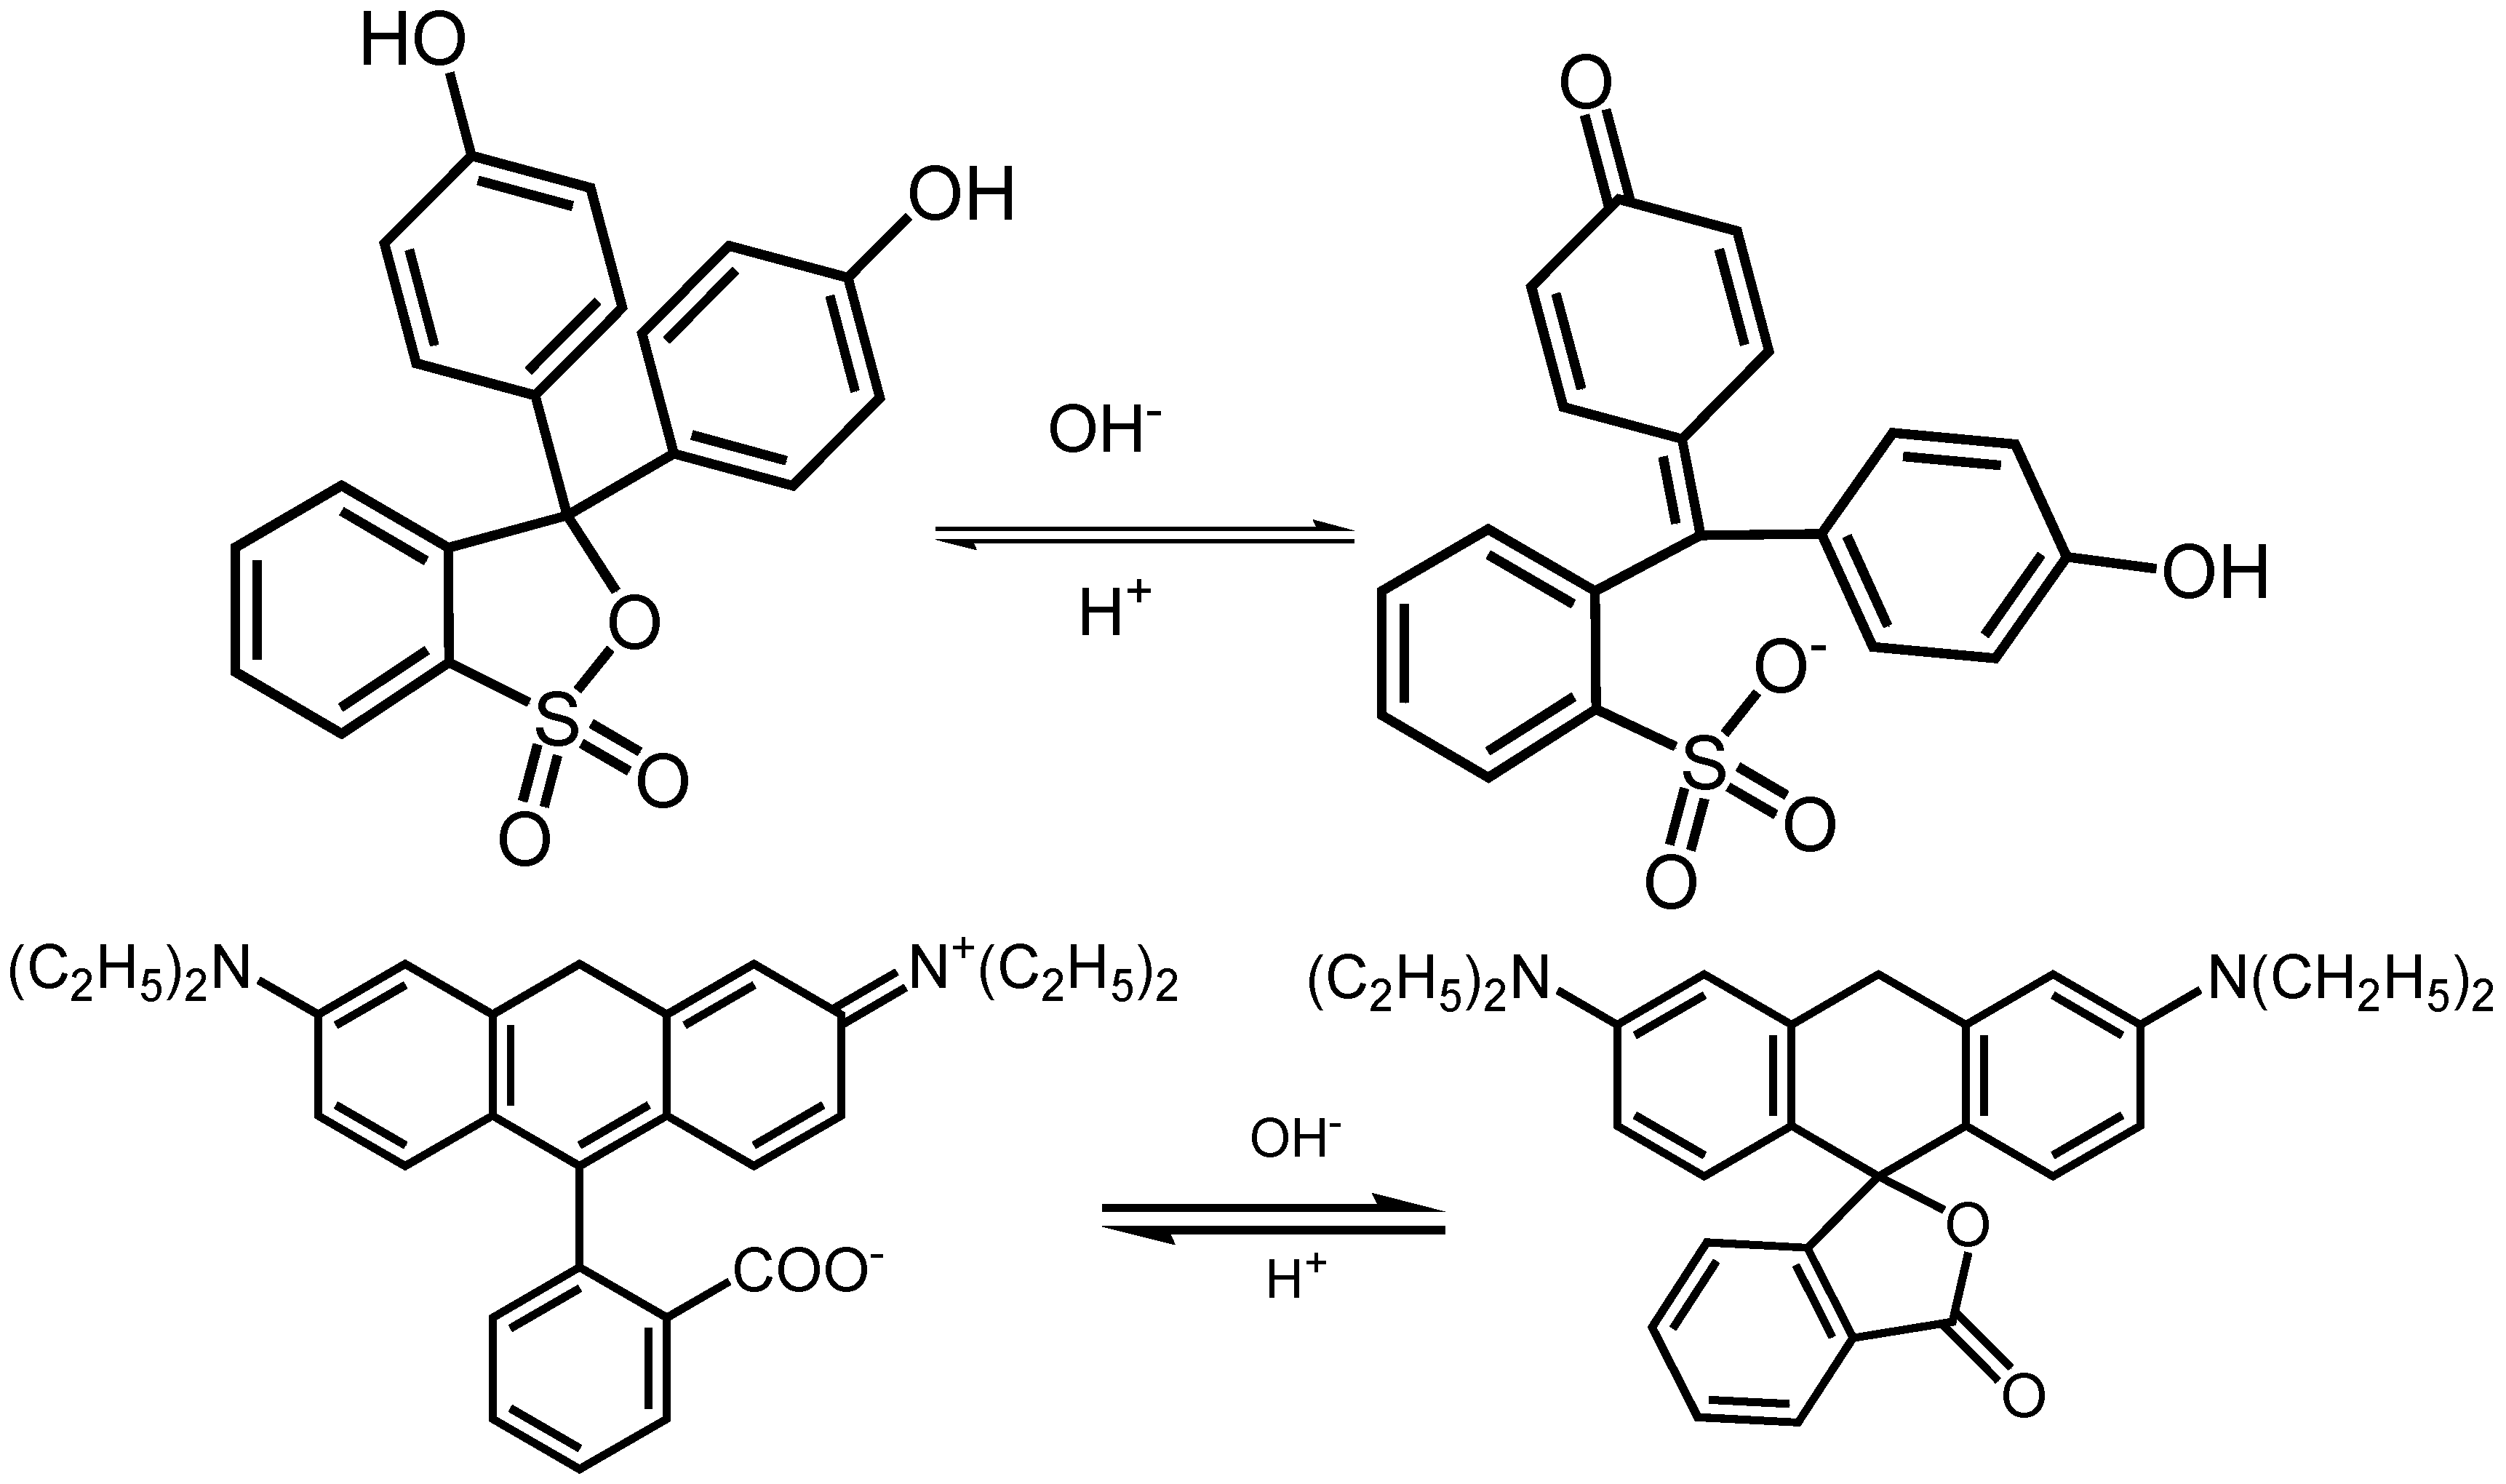
After these observations, we were curious about the mechanism of membrane adsorption of particular dyes. We assumed that the adsorption of some dyes, such as phenol red and rhodamine B, can be ascribed to the chemical characters of these dyes and of the filter. Since all investigated molecules contain large aromatic conjugated systems, π–π interactions are unlikely. Phenol red and rhodamine B at pH 7 are in the form of a carboxylate which, as a negatively charged molecule, can interact through electrostatic interactions with the Whatman nylon membrane filter, while phenol, rhodamine 6G, and methylene blue do not have such negatively charged moieties in their molecules, so they do not show any interaction with the nylon membrane. Phenol is neutral, rhodamine 6G has a stable ester moiety with only a positive charge on nitrogen in its structure, and methylene blue contains positively charged moieties. Phenol red and rhodamine B contain, at pH 7, a sulfo- and carboxylic group in their molecules, respectively, as in 
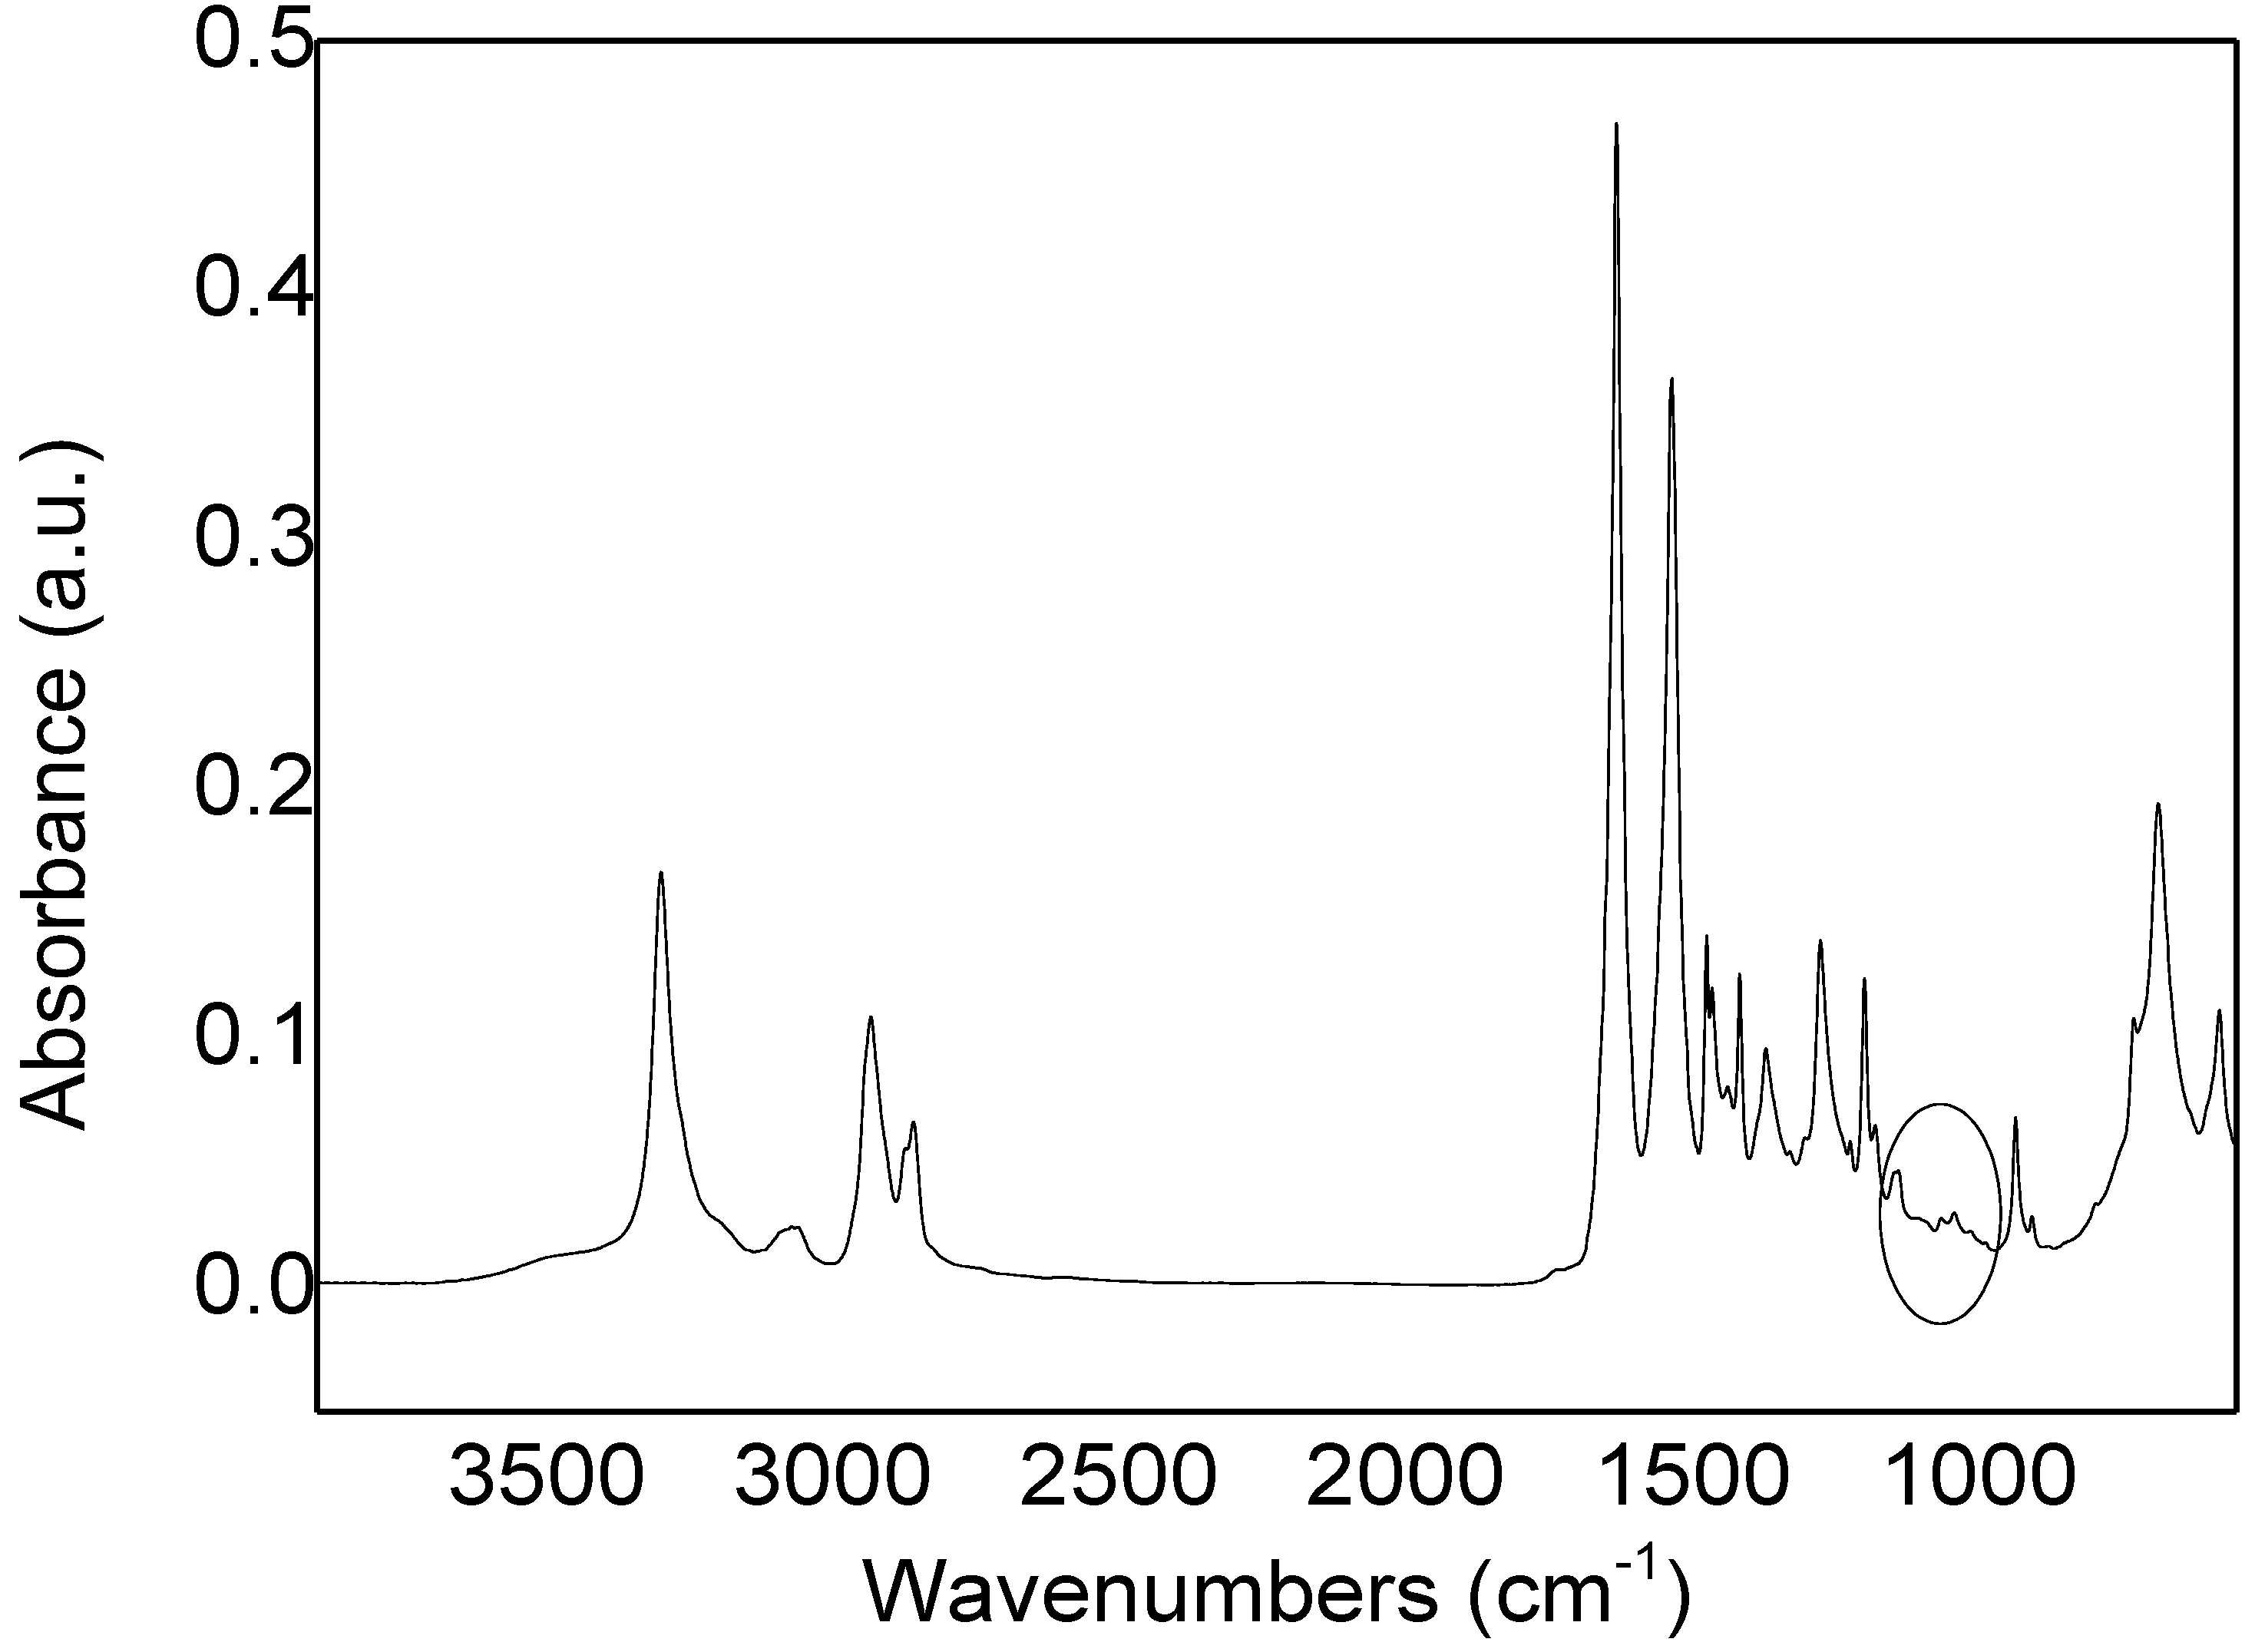
Figure 10. Since ion-pairs are more stable than free ions, interactions occur most probably with the charged terminal groups in the nylon molecules, which could form during the fabrication process of the membrane. Nylon 6,6 is a polyamide prepared by a polycondensation reaction from hexamethylenediamine and adipic acid, and it is known that, during the fabrication process, each polymer chain is terminated with functional groups such as the amino group. The terminal group is more exposed to the environment and, in the case of the amino group, it prefers a hydrophilic environment. FT–IR of the membrane filter was performed to obtain information about the functional groups present, as shown in Figure 11. The main absorption peaks at 3330, 3080, 1650, and 1535 cm−1 are related to N–H stretching, N–H angular deformation, C = O stretching, and N–H in-plane deformation, respectively, as regards the amide group. Moreover, the absorption peaks at 3020, 2950, and 2840 cm−1 correspond to C–H symmetric, CH2 asymmetric, and CH2 symmetric vibrations, respectively, in the main polymer structure. Additionally, there is indication of the amino-like group in FT–IR, attributed to aliphatic C–N stretching at 1140 cm−1. This supports the hypothesis of an interaction between the terminal groups of the polymeric chain with the charged dyes.
The higher removal percentage for rhodamine B at lower pH can be attributed to the formation of an ammonium salt on the membrane filter, involving the amino group on the membrane surface that electrostatically interacts with rhodamine B in the carboxylic acid form, whereas, at high pH, the amino group can be in the amine form, which reduces the electrostatic interactions with rhodamine B. This can form a lactone neutral form. Similarly, the lower removal of phenol red at a lower pH, at which phenol red is transformed to the neutral lactone form, suggests the same principle as previously explained for rhodamine B.
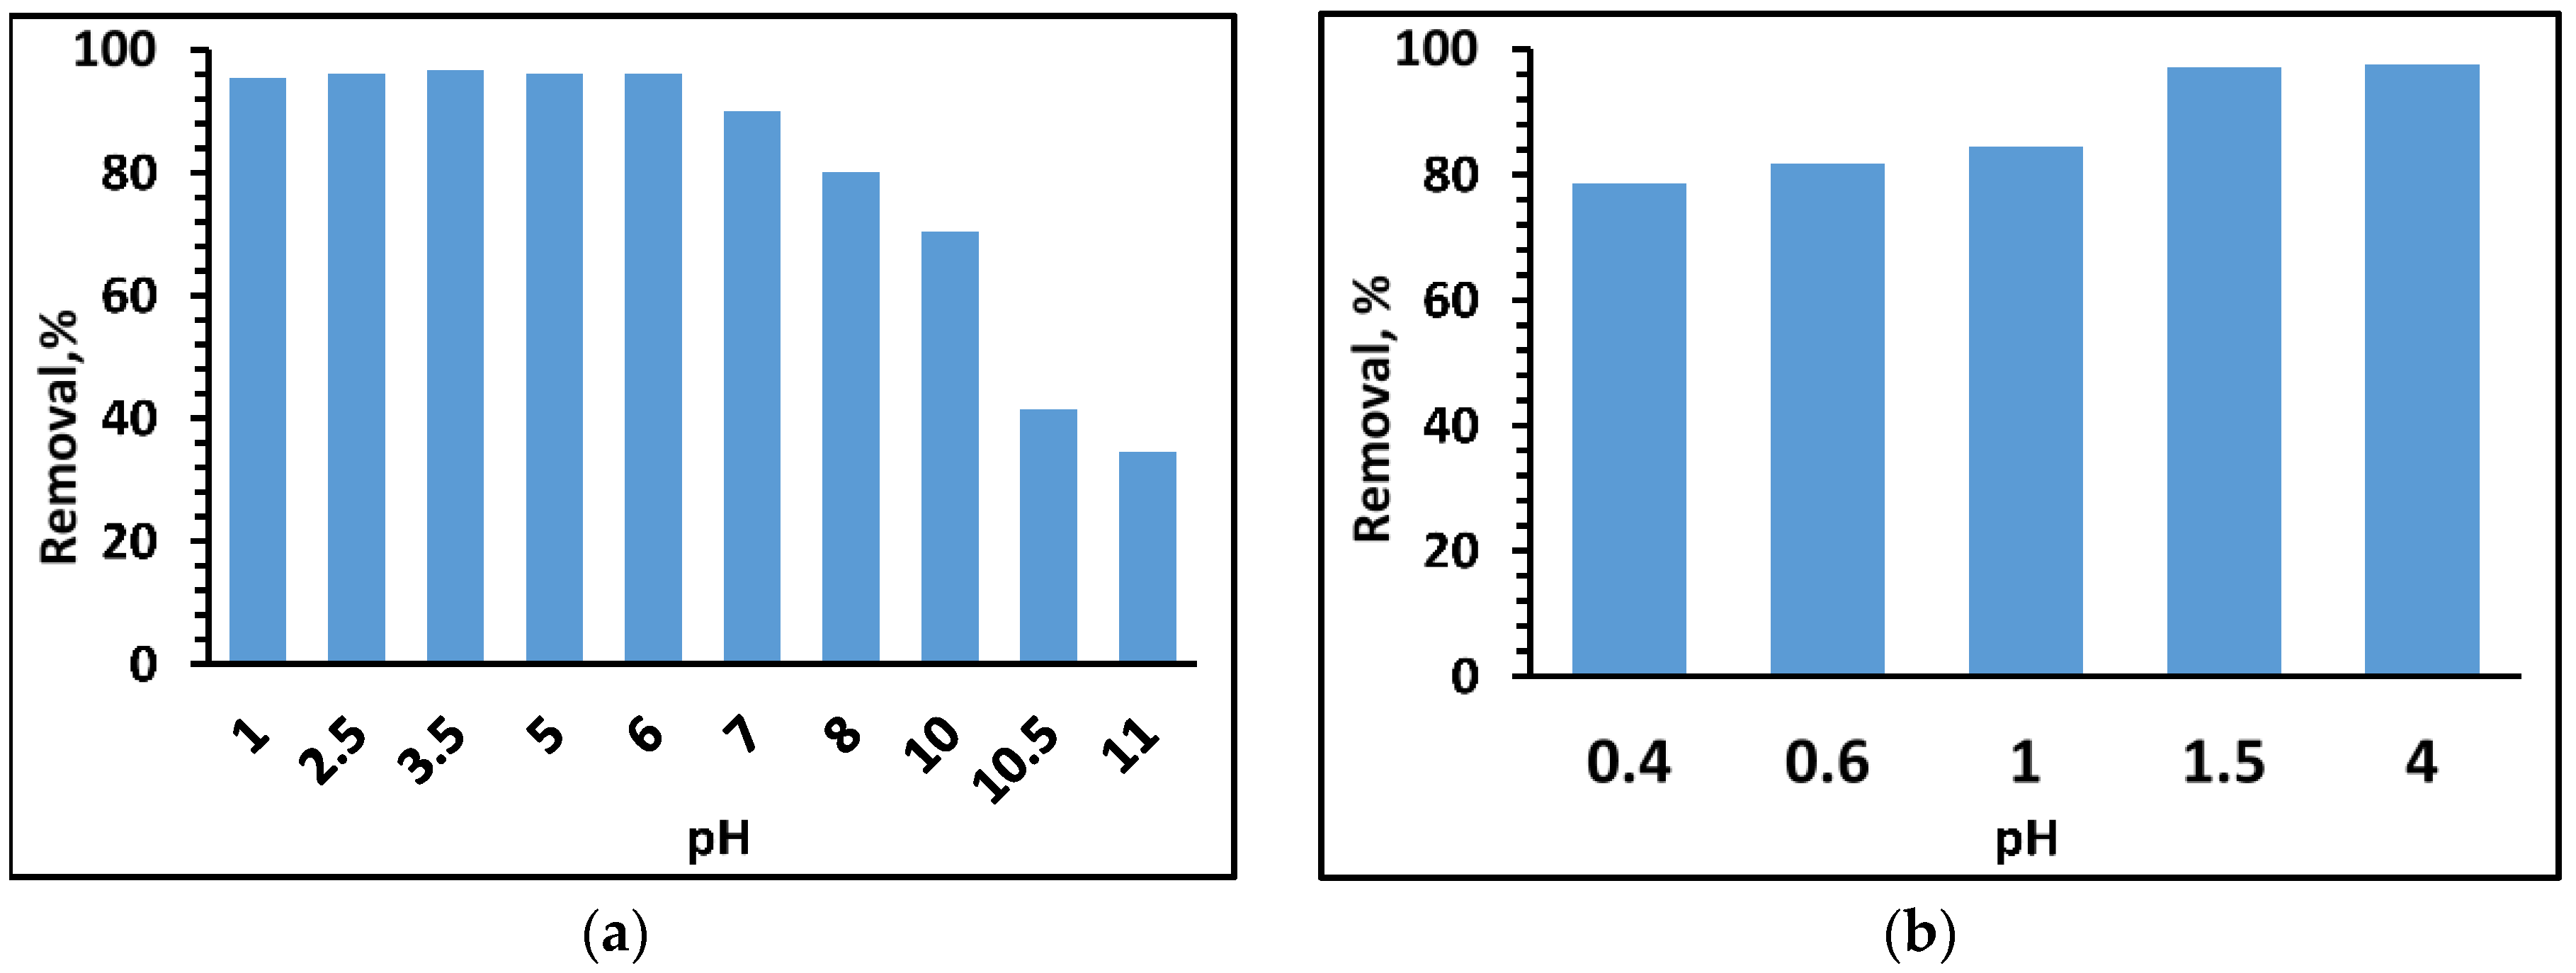
The measurements of the removal percentage at different pH values support fully this assumption, as is seen in Figure 12. Decrease of the removal percentage occurred at higher pH, as rhodamine B transformed into the neutral lactone form. Phenol red transformed at a lower pH to the lactone form, as depicted in Figure 12b, and, similarly, its removal percentage from the sample decreased.
Chemical differences also exist between rhodamine B and phenol red, as the organic sulfate group of phenol red has a much lower pKa compared to the pKa of the carboxylate group in phenol red. This difference in functionality influences ion pairing between negative and positive charges. Stronger ion pairing is formed between the more acidic sulfate group in phenol red and ammonium from the filter mesh, which is in agreement with our observations at high concentrations and vacuum pressures.
It is good to mention that during the experiments and data collection, we considered the alternative idea that CONH in the nylon could act as a hydrogen bond donor; however, such type of hydrogen bond is rather weak (about 2 kcal/mol) to strongly interact with a simple molecule, as in the case we examined [22]. Moreover, if the key and responsible interaction was a hydrogen bonding between N–H from nylon acting as H- acceptor and the COO or SO3 group acting as a donor, then also rhodamine 6G would react with the H- acceptor as well, which did not happen in our experiments. Additionally, FTIR data clearly indicated the presence of C–NH as an amine-like molecule, in addition to the peak related to the amide CONH group present in the main polymer backbone of the nylon membrane. On the other hand, the size of the molecule is not a factor for the adsorption of phenol red and rhodamine B on the filters. Key factors for the adsorption of the dyes are the electrostatic interactions and pKa. Phenol has a much higher pKa than a carboxylic acid, thus, it cannot form a strong electrostatic interaction as in the case of carboxylic acids or sulfonic acid derivatives.
To evaluate how many times a filter can be used, consecutive runs using one filter membrane with 10 ppm phenol red were tested. In each run, 5 mL of phenol red was filtered, and the percentage of removal of phenol red was calculated. These repetitive runs were done 10 times, then the filter was inverted, washed with distilled water under high vacuum, and subjected to two more runs. It was observed that, after four runs, the removal percentage was nearly the same as after the first run, corresponding to 98% removal, then it decreased gradually in the subsequent runs, to reach 64.3% after the 10th run. After washing the filter, its efficiency increased to 88% (see Table S1 in the Supplementary Materials).
To evaluate the possible error that can be associated with the use of a nylon filter for heterogenous catalysis, a photodegradation of 10 ppm phenol red with TiO2 as a photocatalyst using a 150 W Xe lamp as the irradiation source was done. Before photocatalysis, a 100 mL of phenol red with TiO2 was stirred in a dark room, then dye separation was performed, using either a centrifuge or a nylon filter paper, to determine the initial concentration of phenol red. After complete adsorption was accomplished, the suspended solution (phenol red + TiO2) was subjected to Xe illumination for 5 min. A 93% removal of phenol red was observed before illumination when using a nylon filter, while no removal of phenol red was observed when using a centrifuge. After 5 min illumination, a 98.9% removal of phenol red was measured when a nylon filter was used, while only 73.9% degradation was obtained when a centrifuge was used. Therefore, it can be concluded that an error corresponding to 25% can be associated to the use of a nylon filter paper in the photodegradation of 10 ppm phenol red after 5 min, using Xe illumination and TiO2 as a photocatalyst (see Figures S4–S6 in Supplementary Materials)

3. Materials and Methods

3.1. Filtration Experiments

All reagents used were of analytical grade without any further purification. Whatman nylon filter membranes of 0.2 μm pore size, 47 mm diameter, and 0.5 mm thickness, purchased from Sigma Aldrich (Dassel, Germany), were used for the filtration of different pollutants. Each 5, 10, and 20 ppm solution of rhodamine B, rhodamine 6G, phenol red, methylene blue, and phenol was prepared separately from their corresponding salts, using deionized (DI) distilled water for the screening experiments.
To conduct the higher load removal determination tests, solutions of phenol red and rhodamine B at the three different concentrations of 5, 10, and 20 mg/L were prepared using DI water. The filtration process was done using a vacuum pump equipped with a vacuum gauge controller. Under different vacuum pressures (50, 100, 150, and 200 mmHg), each solution was filtered, and the change of the filtrate concentration was monitored by measuring the absorbance at the wavelengths of 432 nm and 553 nm for phenol red and rhodamine B, respectively, using a Thermo UV–vis spectrophotometer (city). Additionally, the effect of the pH of the solutions on the efficiency of the filtration was studied. During each experiment, 5 mL of each solution was used using one filter membrane. To evaluate the efficiency of the nylon filter membrane, one and three membranes were used in the filtration process with different volumes of phenol red and rhodamine B. Finally, a mixture of phenol red and rhodamine B, each at a concentration of 5 ppm, with a total concentration of 10 ppm, was prepared and filtered under the best conditions, using one- and three-filter membranes.

3.2. Characterization

A JEOL JCM-6000PLUS NeoScope scanning electron microscope, SEM, (Tokyo, Japan), was used for characterizing the dyes on the nylon filter membranes. Confocal laser scanning fluorescence microscopy was performed with LSM510 META scan head (Carl Zeiss, Jena, Germany) attached to an Axiovert 200 M microscope stand (Carl Zeiss, Oberkochen, Germany). Images of the nylon filters were collected by a Zeiss Plan-Apochromat 10x/0.45 lens and 20x/0.75 lens, using a 450 nm diode laser (Kvant, Bratislava, Slovakia) for excitation. The filters used for reflection and fluorescence contrasts were BP 435–485 nm and LP 560 nm, respectively. A confocal pinhole was set to 1 Airy unit, and 3D stacks were merged by Helicon Focus stacking software.
XPS was carried out using a Scientific ESCALAB-250Xi spectrometer (Thermo, UK). The radiation source was monochromatic AlKα, operating at a power of 300 W (15 kV, 20 mA). The analysis chamber was vacuumed to lower than 7 × 10⁻⁹ bar in all measurements. The binding energies were based on the carbon pollution C1s at 284.6 eV within an experimental error of ±0.2 eV. Many scans were carried out to detect the N1s region and the S2p region for rhodamine B and phenol red before and after filtration, respectively. FT–IR spectra were recorded at room temperature with a 6300 type A FT–IR spectrometer (Jasco, Tokyo, Japan) in the range of 4000–400 cm−1 at a 4.0 cm−1 resolution with a scanning speed of 2 mm s−1.The total organic carbon (TOC) for all filtrates was measured using a TOC–VPH Shimadzu analyzer (Kyoto, Japan).

4. Summary and Conclusions

Nylon filter membranes can efficiently eliminate rhodamine B and phenol red from water media after a filtration process without any photocatalytic or chemical treatment. Therefore, the calculated efficiency of these treatments will falsely be much higher than the real one. The removal mechanism of phenol red and rhodamine B is affected by the pH and is attributed mainly to the electrostatic attraction between the charge of the ammonium salt formed by the terminal groups of nylon 66 (as proven by FT–IR) and the negative charges on the organic carboxylic and sulfate groups formed in rhodamine B and phenol red, respectively. Increasing the concentration and vacuum pressure lowers the efficiency of dye removal, as it increases the flow and decreases the contact time between the nylon membrane filter and the dyes. Increasing the pH also decreases the removal percentage because of the formation of a neutral lactone in the dyes, which decreases the electrostatic forces between the dyes and the nylon membrane filter. These observations should be considered before using nylon filter membranes for the filtration process in a photocatalysis analysis or other applications, such as biological species separation, chromatography sample preparation, heterogenous catalysis filtration, and, especially, in further analysis of negatively charged probes, (bio)species, or possible products.

Supplementary Materials

The following are available online at https://www.mdpi.com/2073-4344/8/12/576/s1. Figure S1: photograph of the filtration setup; Figure S2: Absorbance spectra of 30 ppm phenol red (a) before and (b) after filtration using three membranes; Figure S3: Absorbance spectra of 30 ppm rhodamine B (a) before and (b) after filtration using three membranes; Figure S4: (a) Color of 10 ppm phenol red, (b) color of phenol red + 0.1 g TiO2 after 30 min stirring in dark room, (c) color of phenol red + TiO2 after 5 min irradiation with Xe lamp as irradiation source; Figure S5: Absorbance spectra region of phenol red (a) as prepared, (b) after centrifuge of solution containing 10 ppm phenol red + 0.1 g TiO2 min stirred in dark room for 30 min; i.e., before illumination and (c) after centrifuge of irradiated solution containing 10 ppm phenol red + 0.1 g TiO2 min for 5 min using Xe lamp as irradiation source; Figure S6: Absorbance spectra region of phenol red (a) as prepared, (b) after filtration of solution containing 10 ppm phenol red + 0.1 g TiO2 min stirred in dark room for 30 min; i.e., before illumination and (c) after filtration of irradiated solution containing 10 ppm phenol red + 0.1 g TiO2 min for 5 min using Xe lamp as irradiation source; Figure S7: absorption spectra of 5 mL mixture of phenol red and phenol each 10 ppm (a) before filtration (b) after filtration using nylon filter; Table S1: removal percentage of phenol red from a 5 ml of 10 ppm phenol red solution using the same nylon filter membrane for 10 times, followed by 2 more runs after a washing cycle with distilled water under high vacuum.

Author Contributions

H.A.-K. did most of the experimental work and contributed to the manuscript writing and editing. P.K. contributed to the design of the experiments and manuscript writing and editing, especially the discussion section. A.M.M. did some of the experimental work and all the XPS measurements. S.A.-K. worked on the characterization, except for the confocal laser microscope, which was done by D.C.J. A.M.A. is the group leader. He participated significantly to the experimental work design, discussed the data, and contributed to the manuscript writing and editing.

Funding

This research received no external funding.

Acknowledgments

The authors thank the Public Authority for Applied Education and Training and the Center for Advanced Materials at Qatar University for the support they gave to this work. The publication of this article was funded by the Qatar National Library.

Conflicts of Interest

The authors declare no conflict of interest of any type.

References

  1. Yao, J.; Chen, H.; Jiang, F.; Jiao, Z.; Jin, M. Titanium dioxide and cadmium sulfide co-sensitized graphitic carbon nitride nanosheets composite photocatalysts with superior performance in phenol degradation under visible-light irradiation. J. Colloid Interface Sci. 2017, 490, 154–162. [Google Scholar] [CrossRef] [PubMed]
  2. Nagaveni, K.; Sivalingam, G.; Hegde, M.S.; Madras, G. Photocatalytic degradation of organic compounds over combustion-synthesized nano-TiO2. Environ. Sci. Technol. 2004, 38, 1600–1604. [Google Scholar] [CrossRef] [PubMed]
  3. Liu, L.; Liu, H.; Zhao, Y.-P.; Wang, Y.; Duan, Y.; Gao, G.; Ge, M.; Chen, W. Directed Synthesis of Hierarchical Nanostructured TiO2 Catalysts and their Morphology-Dependent Photocatalysis for Phenol Degradation. Environ. Sci. Technol. 2008, 42, 2342–2348. [Google Scholar] [CrossRef] [PubMed]
  4. Artuna, E.; Hupka, J. H2O2/UV/air oxidation of organic contaminants in the gas-sparged cyclone reactor. Cent. Eur. J. Public Health 2000, 8, 88–89. [Google Scholar] [PubMed]
  5. Han, E.; Vijayarangamuthu, K.; Youn, J.S.; Park, Y.K.; Jung, S.C.; Jeon, K.J. Degussa P25 TiO2 modified with H2O2 under microwave treatment to enhance photocatalytic properties. Catal. Today 2018, 303, 305–312. [Google Scholar] [CrossRef]
  6. Dixit, A.; Mungray, A.K.; Chakraborty, M. Photochemical Oxidation of Phenol and Chlorophenol by UV/H2O2/TiO2 Process: A Kinetic Study. Int. J. Chem. Eng. Appl. 2010, 1, 247–250. [Google Scholar]
  7. Al-Kandari, H.; Abdullah, A.M.; Al-Kandari, S.; Mohamed, A.M. Synergistic Effect of O3 and H2O2 on the Visible Photocatalytic Degradation of Phenolic Compounds Using TiO2/Reduced Graphene Oxide Nanocomposite. Sci. Adv. Mater. 2017, 9, 739–746. [Google Scholar] [CrossRef]
  8. Bai, S.; Shen, X.; Zhong, X.; Liu, Y.; Zhu, G.; Xu, X.; Chen, K. One-pot solvothermal preparation of magnetic reduced graphene oxide-ferrite hybrids for organic dye removal. Carbon 2012, 50, 2337–2346. [Google Scholar] [CrossRef]
  9. Khuanmar, K.; Wirojanagud, W.; Kajitvichyanukul, P.; Maensiri, S. Photocatalysis of phenolic compounds with synthesized nanoparticles TiO2/Sn2. J. Appl. Sci. 1968, 7, 1972–2007. [Google Scholar]
  10. Zhai, Q.; Bo, T.; Hu, G. High photoactive and visible-light responsive graphene/titanate nanotubes photocatalysts: Preparation and characterization. J. Hazard. Mater. 2011, 198, 78–86. [Google Scholar]
  11. Bai, S.; Liu, H.; Sun, J.; Tian, Y.; Chen, S.; Song, J.; Luo, R.; Li, D.; Chen, A.; Liu, C.-C. Improvement of TiO2 photocatalytic properties under visible light by WO3/TiO2 and MoO3/TiO2 composites. Appl. Surf. Sci. 2015, 338, 61–68. [Google Scholar] [CrossRef]
  12. Liu, S.; Huang, J.; Cao, L.; Li, J.; Ouyang, H.; Tao, X.; Liu, C. One-pot synthesis of TiO2–WO3 composite nanocrystallites with improved photocatalytic properties under natural sunlight irradiation. Mater. Sci. Semicond. Process. 2014, 25, 106–111. [Google Scholar] [CrossRef]
  13. Moctezuma, E.; Zermeño, B.; Zarazua, E.; Torres-Martínez, L.M.; García, R. Photocatalytic Degradation of Phenol with Fe-Titania Catalysts. Top Catal. 2011, 54, 496–503. [Google Scholar] [CrossRef]
  14. Wei, Z.; Liang, F.; Liu, Y.; Luo, W.; Wang, J.; Yao, W.; Zhu, Y. Photoelectrocatalytic degradation of phenol-containing wastewater by TiO2/g-C3N4 hybrid heterostructure thin film. App. Catal. B Environ. 2017, 201, 600–606. [Google Scholar] [CrossRef]
  15. Liu, H.; Dong, X.; Wang, X.; Sun, C.; Li, J.; Zhu, Z. A green and direct synthesis of graphene oxide encapsulated TiO2 core/shell structures with enhanced photoactivity. Chem. Eng. J. 2013, 230, 279–285. [Google Scholar] [CrossRef]
  16. Wang, C.; Hu, L.; Chai, B.; Yan, J.; Li, J. Enhanced photocatalytic activity of electrospun nanofibrous TiO2/g-C3N4 heterojunction photocatalyst under simulated solar light. Appl. Surf. Sci. 2018, 430, 243–252. [Google Scholar] [CrossRef]
  17. Al-Kandari, H.; Abdullah, A.M.; Ahmad, Y.H.; Al-Kandari, S.; AlQaradawi, S.Y.; Mohamed, A.M. An efficient eco advanced oxidation process for phenol mineralization using a 2D/3D nanocomposite photocatalyst and visible light irradiations. Sci. Rep. 2017, 7, 9898. [Google Scholar] [CrossRef] [PubMed]
  18. Wu, F.; Li, X.; Liu, W.; Zhang, S. Highly enhanced photocatalytic degradation of methylene blue over the indirect all-solid-state Z-scheme g-C3N4-RGO-TiO2 nanoheterojunctions. Appl. Surf. Sci. 2017, 405, 60–70. [Google Scholar] [CrossRef]
  19. Al-Kandari, H.; Abdullah, A.M.; Mohamed, A.M.; Al-Kandari, S. Photocatalysis of TiO2-Supported Graphene Oxide and its Reduced form towards Phenol degradation. ECS Trans. 2015, 64, 1–12. [Google Scholar] [CrossRef]
  20. Al-Kandari, H.; Abdullah, A.M.; Mohammad, A.M.; Al-Kandari, S. Graphene /TiO2 Composite Electrode: Synthesis and Application towards the Oxygen Reduction Reaction. ECS Trans. 2014, 61, 13–26. [Google Scholar] [CrossRef]
  21. Al-Kandari, H.; Abdullah, A.M.; Mohamed, A.M.; Al-Kandari, S. Enhanced photocatalytic degradation of a phenolic compounds’ mixture using a highly efficient TiO2/reduced graphene oxide nanocomposite. J. Mater. Sci. 2016, 51, 8331–8345. [Google Scholar] [CrossRef]
  22. Emsley, J. Very strong hydrogen bonding. Chem. Soc. Rev. 1980, 9, 91–124. [Google Scholar] [CrossRef]
Figure 1. Chemical structure of the investigated probes and of nylon 6,6.
Catalysts 08 00576 g001
Figure 2. The color of 5 mL solutions of 10 ppm phenol red, rhodamine B, rhodamine 6G, and methylene blue before filtration (a) and after filtration (b).
Catalysts 08 00576 g002
Figure 3. Absorbance spectrum of 10 ppm phenol before and after filtration using a nylon membrane filter.
Catalysts 08 00576 g003
Figure 4. Removal% of dyes from 5 mL solutions at different concentrations, using different vacuum pressures; (a) phenol red, (b) rhodamine B.
Catalysts 08 00576 g004
Figure 5. Spectrum removal after filtration of 5 mL solutions at 10 ppm concentration of (a) phenol red, (b) rhodamine B, using different vacuum pressures.
Catalysts 08 00576 g005
Figure 6. SEM image of the membrane filter; the scale bar is 20 µm.
Catalysts 08 00576 g006
Figure 7. Upper row: confocal images of the membranes after filtration in clear filtration areas for (a) rhodamine B (RB) and (b) phenol red (PR), and for (c) RB in an area in contact with the ceramic support. Bottom row: profiles of fluorescence intensity along the respective line; (arrows in the upper panels indicate the flow of filtration and the direction of the filtration distance coordinate).
Catalysts 08 00576 g007
Figure 8. X-ray Photoelectron Spectroscopy (XPS) of N1s regions of rhodamine B (RB), nylon membrane filter (Nylon), and rhodamine B after filtration (rhodamine B + Nylon).
Catalysts 08 00576 g008
Figure 9. XPS of the S2p region of phenol red before (PR) and after filtration (phenol red + Nylon).
Catalysts 08 00576 g009
Figure 10. The effect of pH on the ionization of phenol red and rhodamine B.
Catalysts 08 00576 g010
Figure 11. FT–IR of the nylon filter membrane.
Catalysts 08 00576 g011
Figure 12. Removal% from a 5 mL solution at 10 ppm concentration of (a) rhodamine B and (b) phenol red at different pH values.
Catalysts 08 00576 g012
Table 1. Dye removal% from different volumes of a 20 ppm mixture of phenol red and rhodamine (each 10 ppm) using one and three nylon filter membranes (FP) at 50 mmHg.
Volume of 20 ppm SolutionPhenol RedRhodamine B
One FPThree FPOne FPThree FP
599.199.698.299.7
1098.499.682.599.7
5065.597.936.175.9

