Photocatalytic Degradation of Methylene Blue over TiO2 Pretreated with Varying Concentrations of NaOH


Abstract
:1. Introduction
2. Results
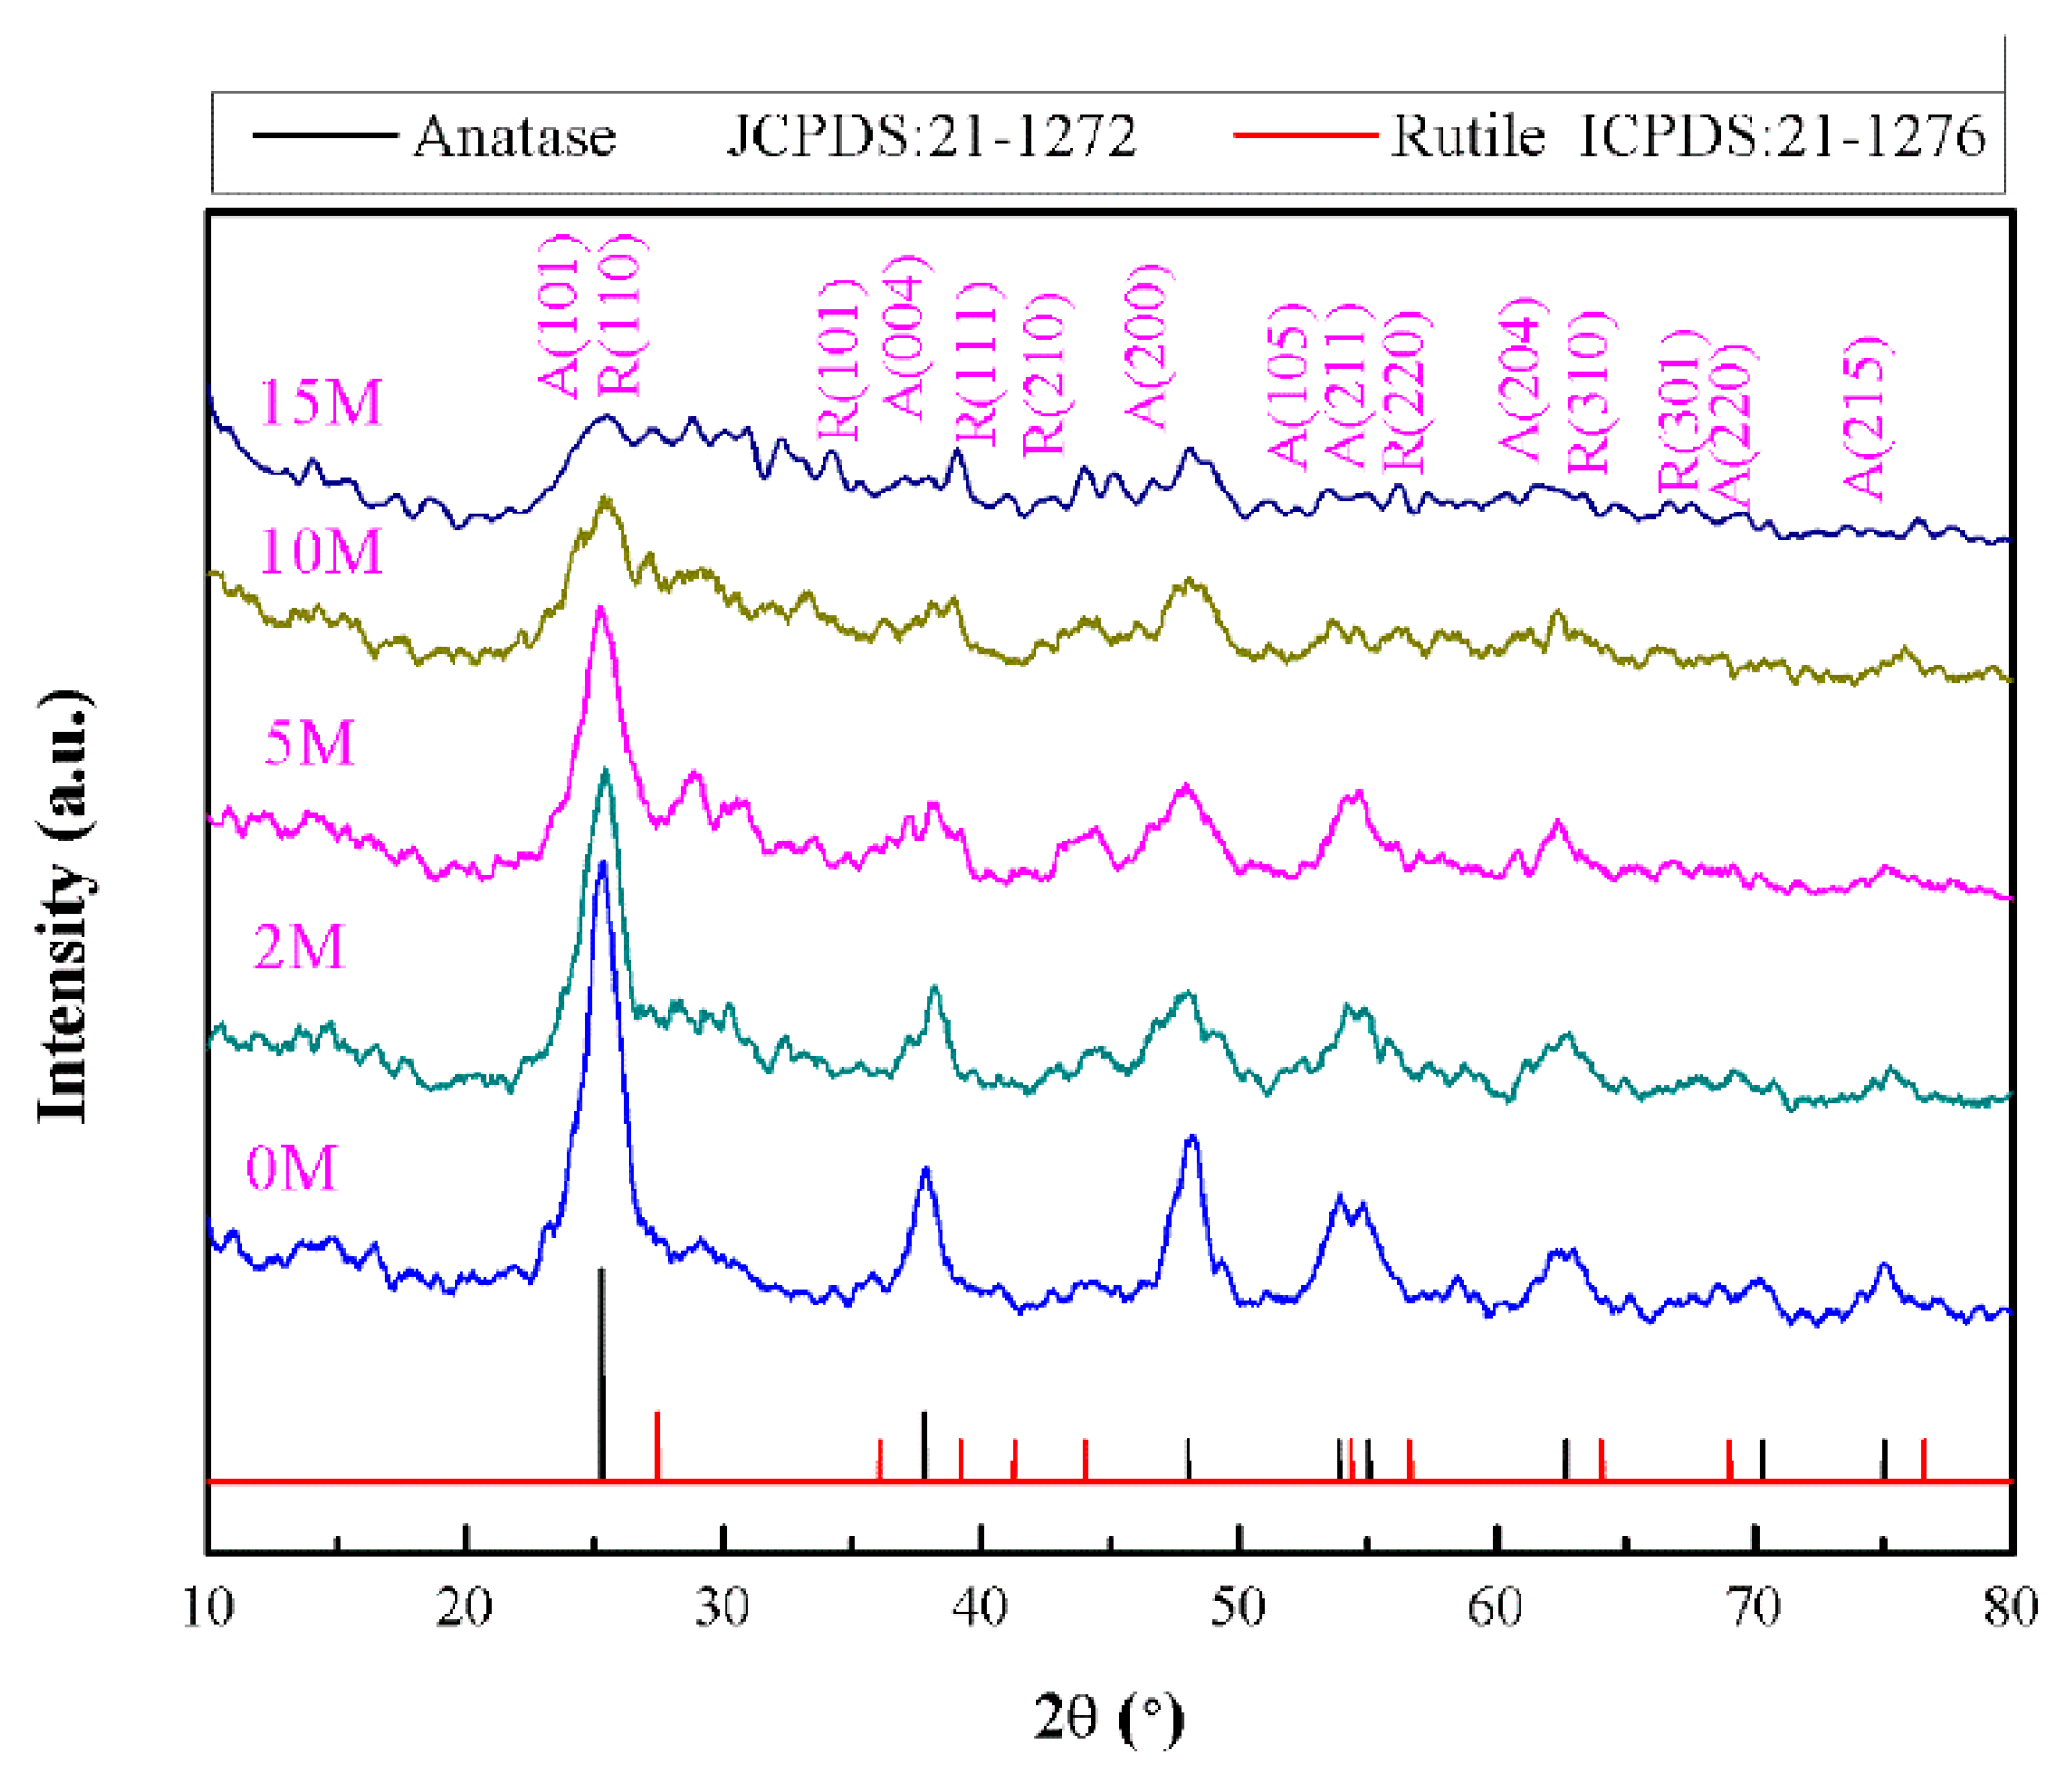
2.1. Structural Characterization
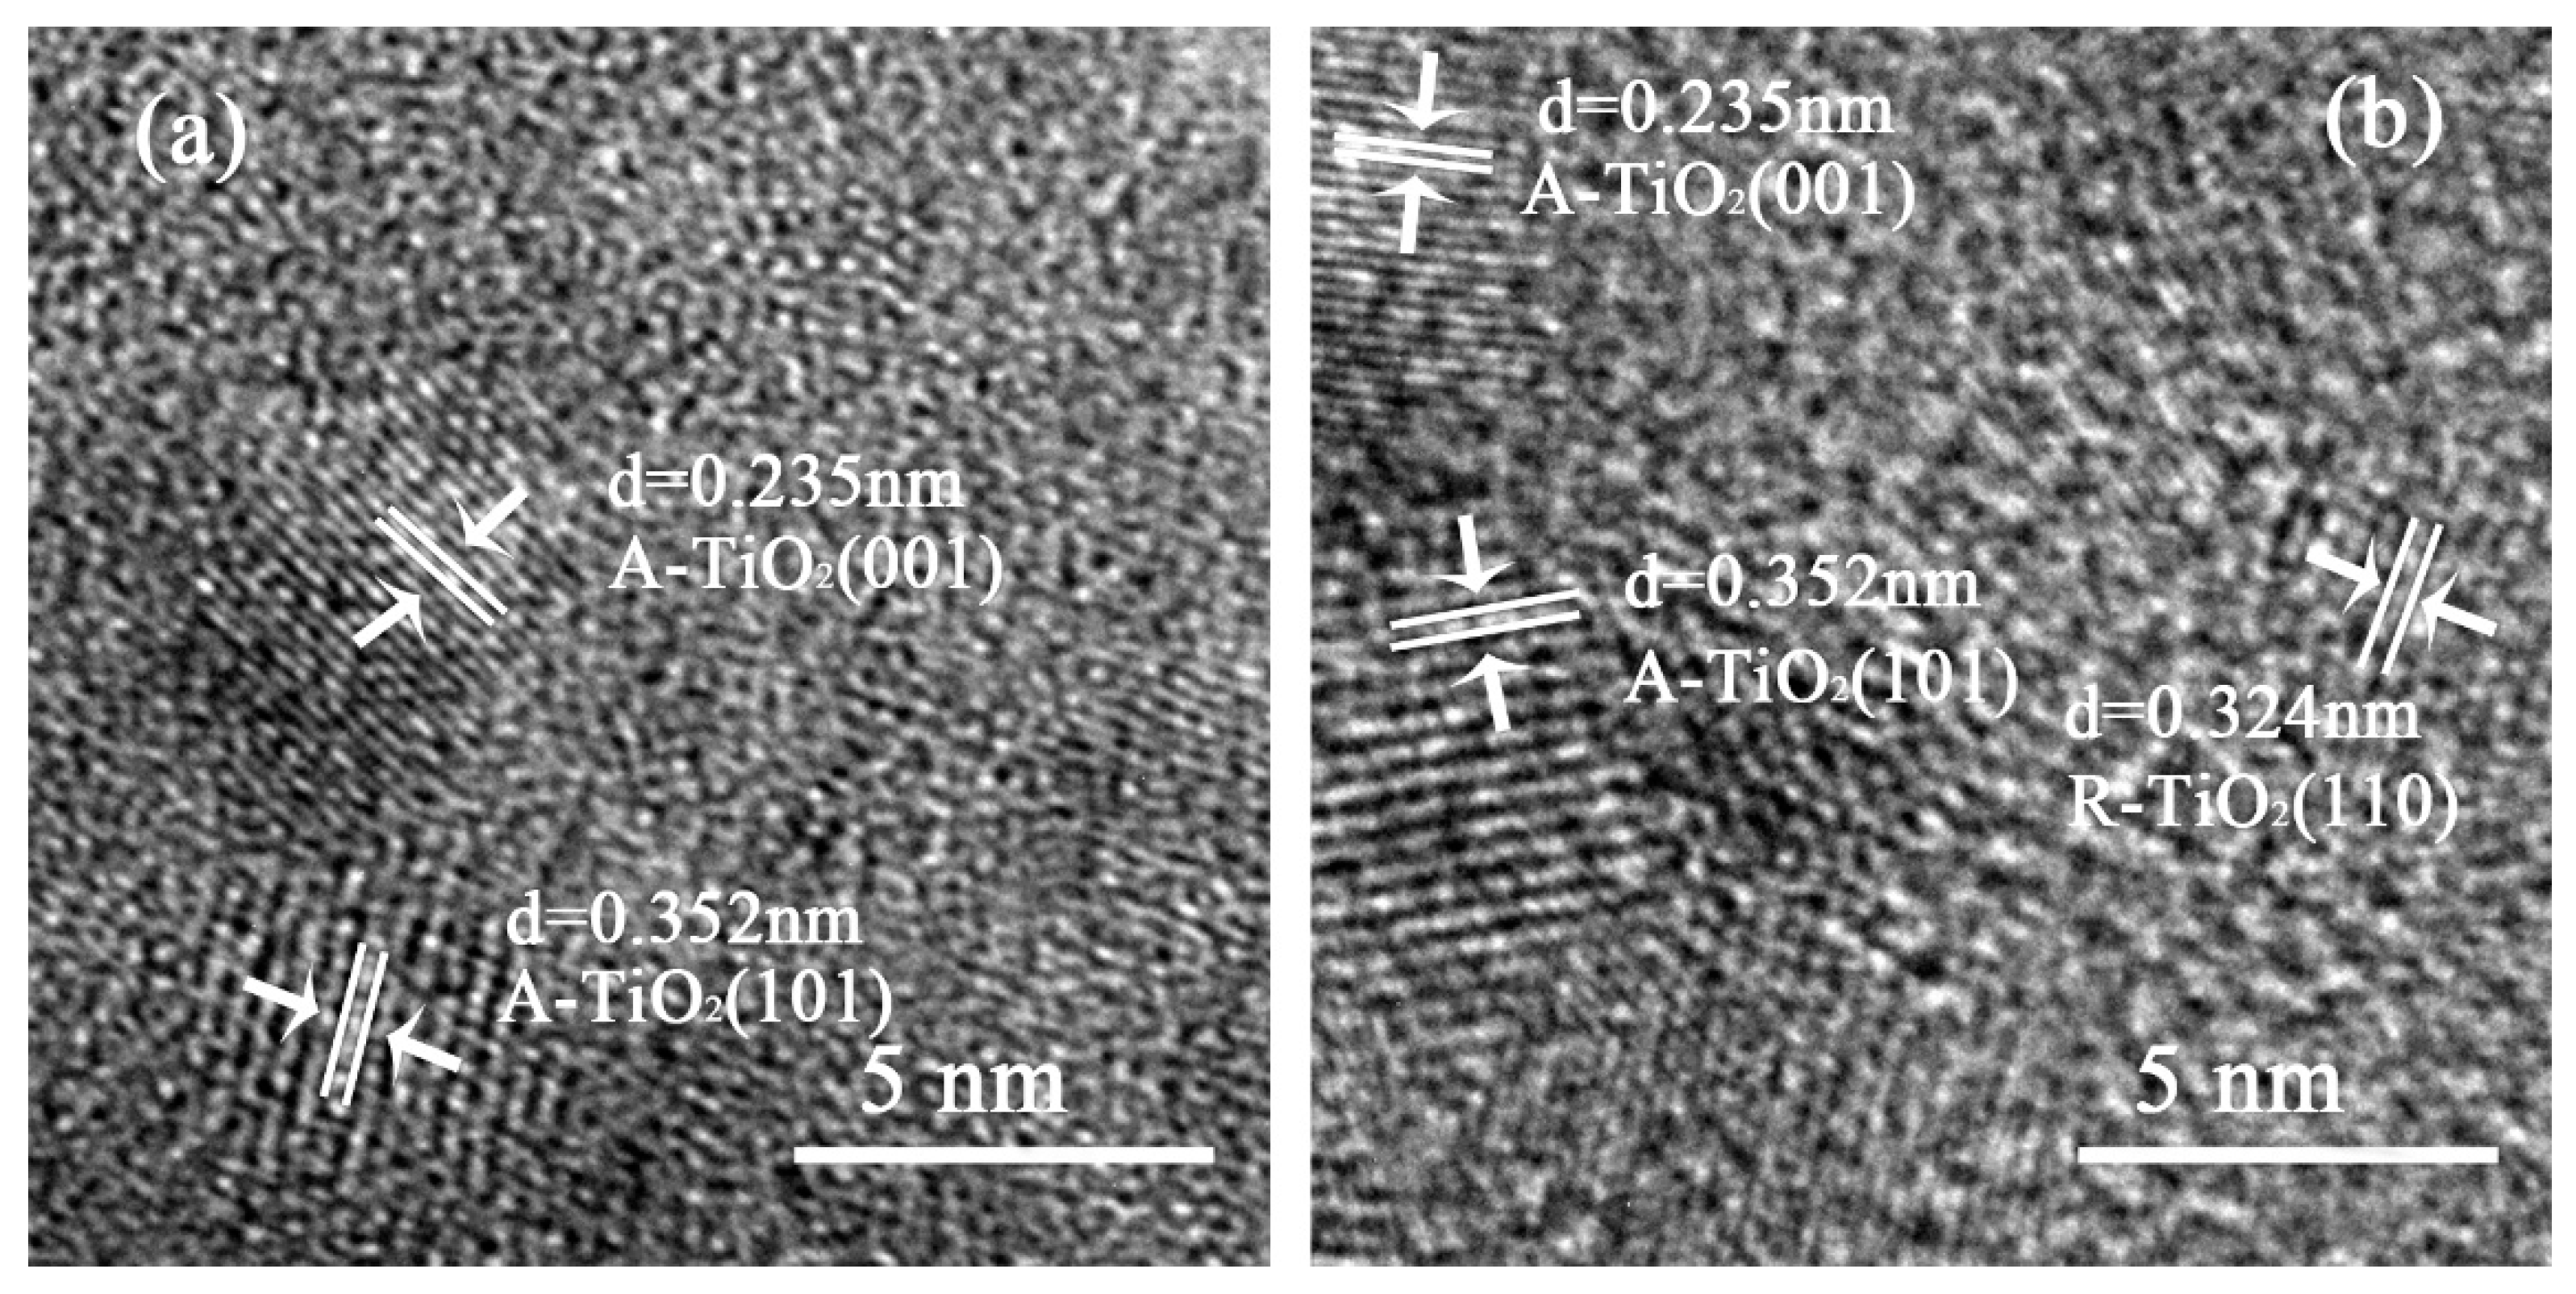
2.2. Lattice Spacing Analysis
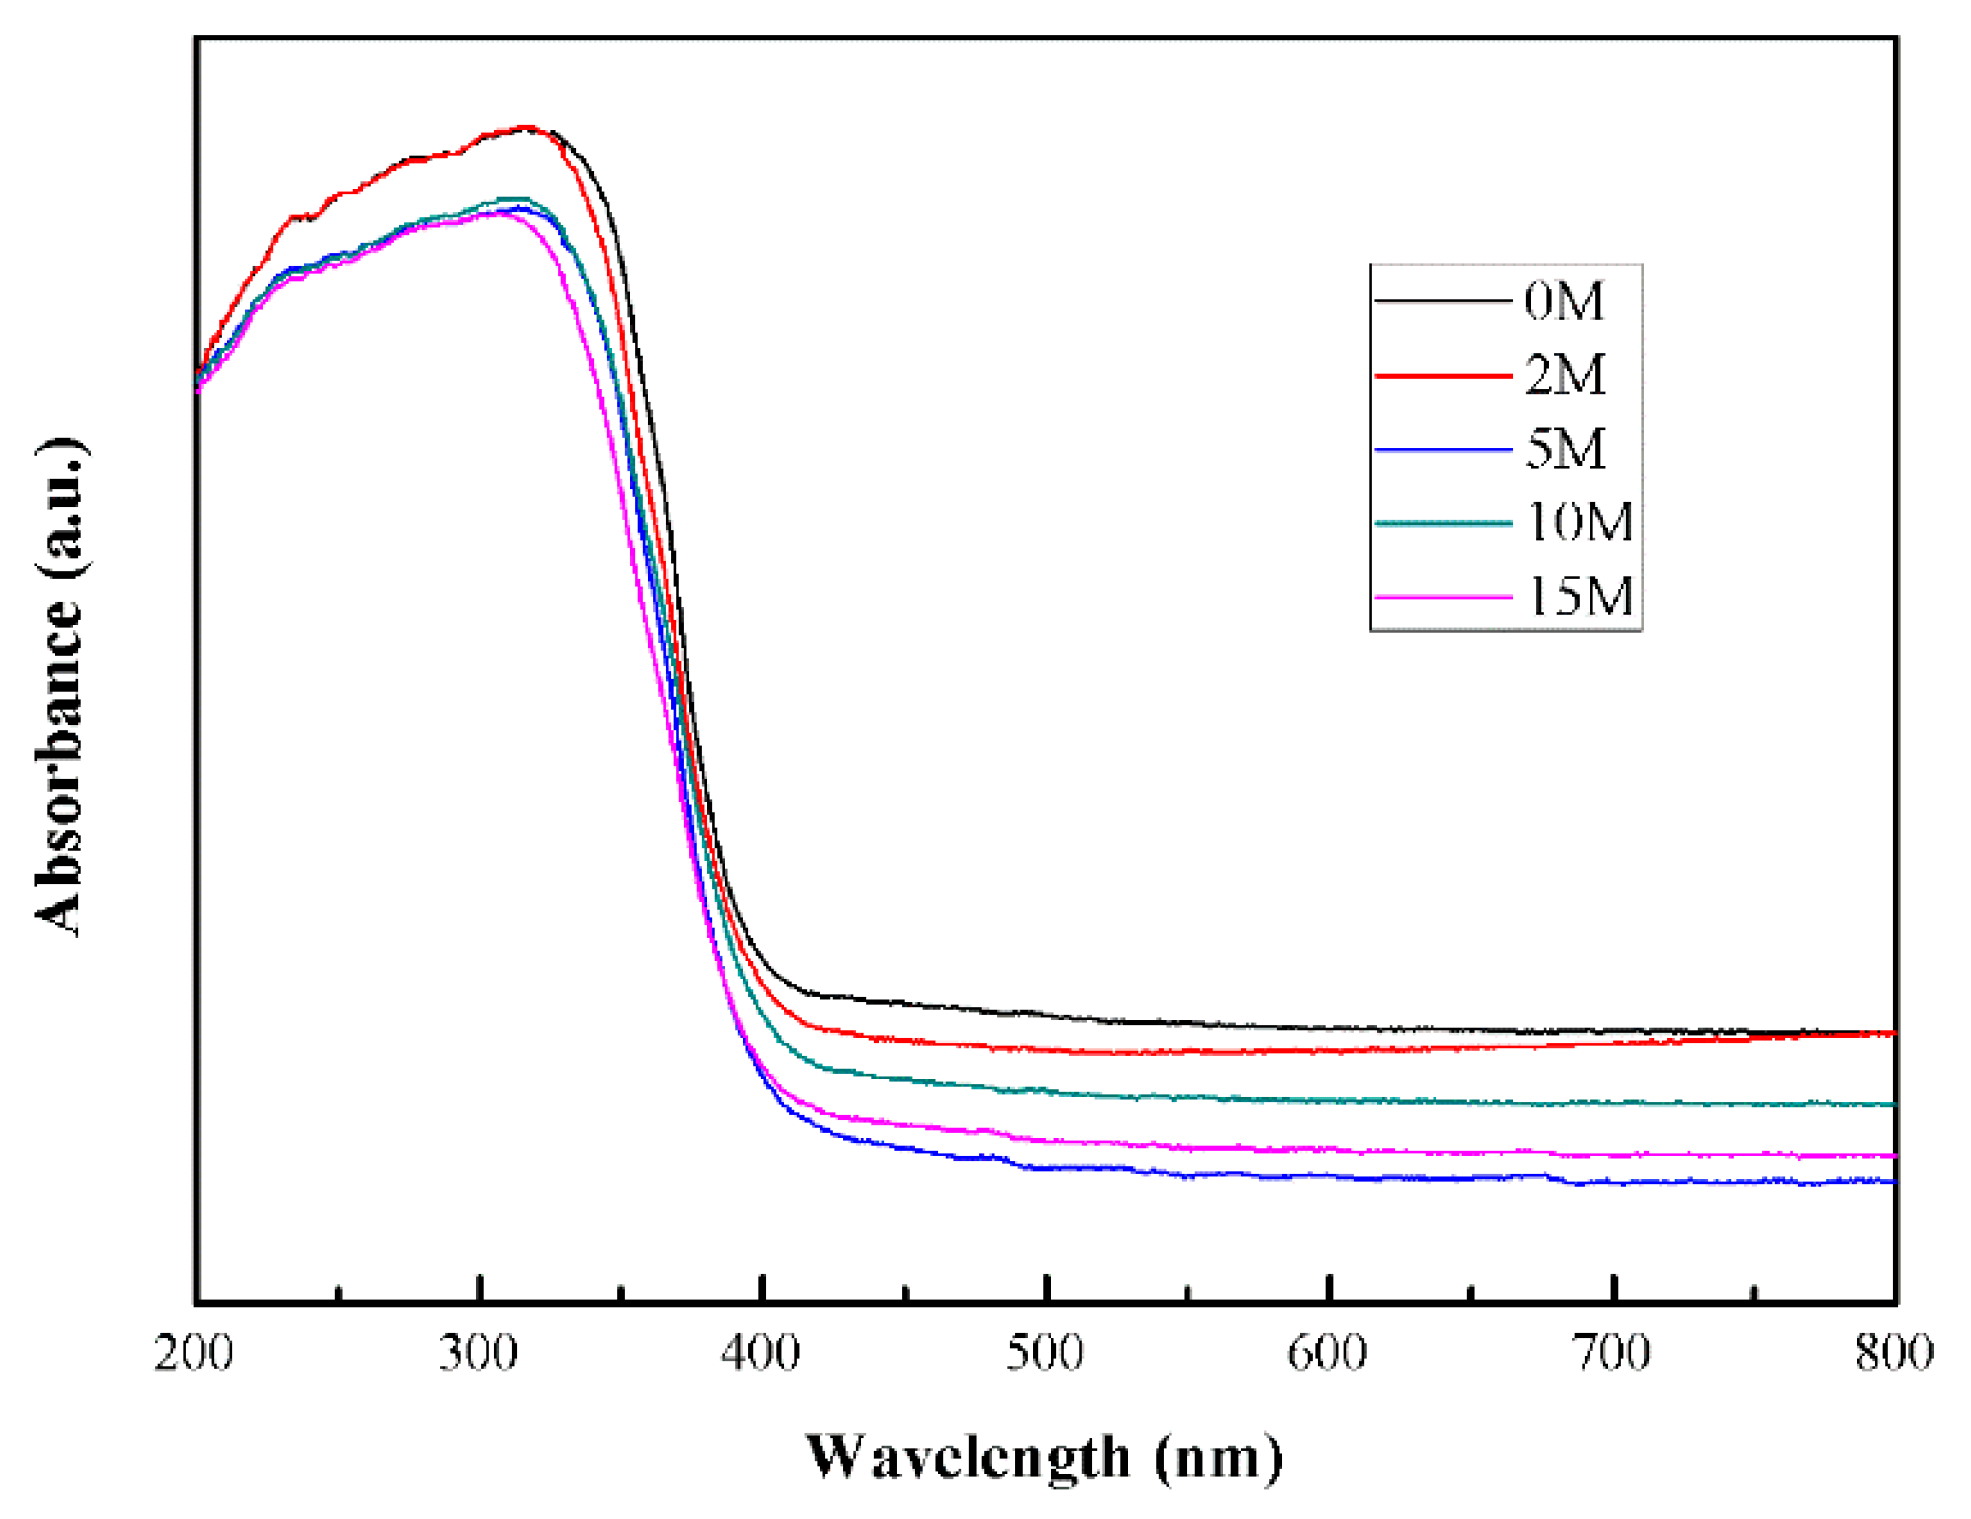
2.3. Optical Performance
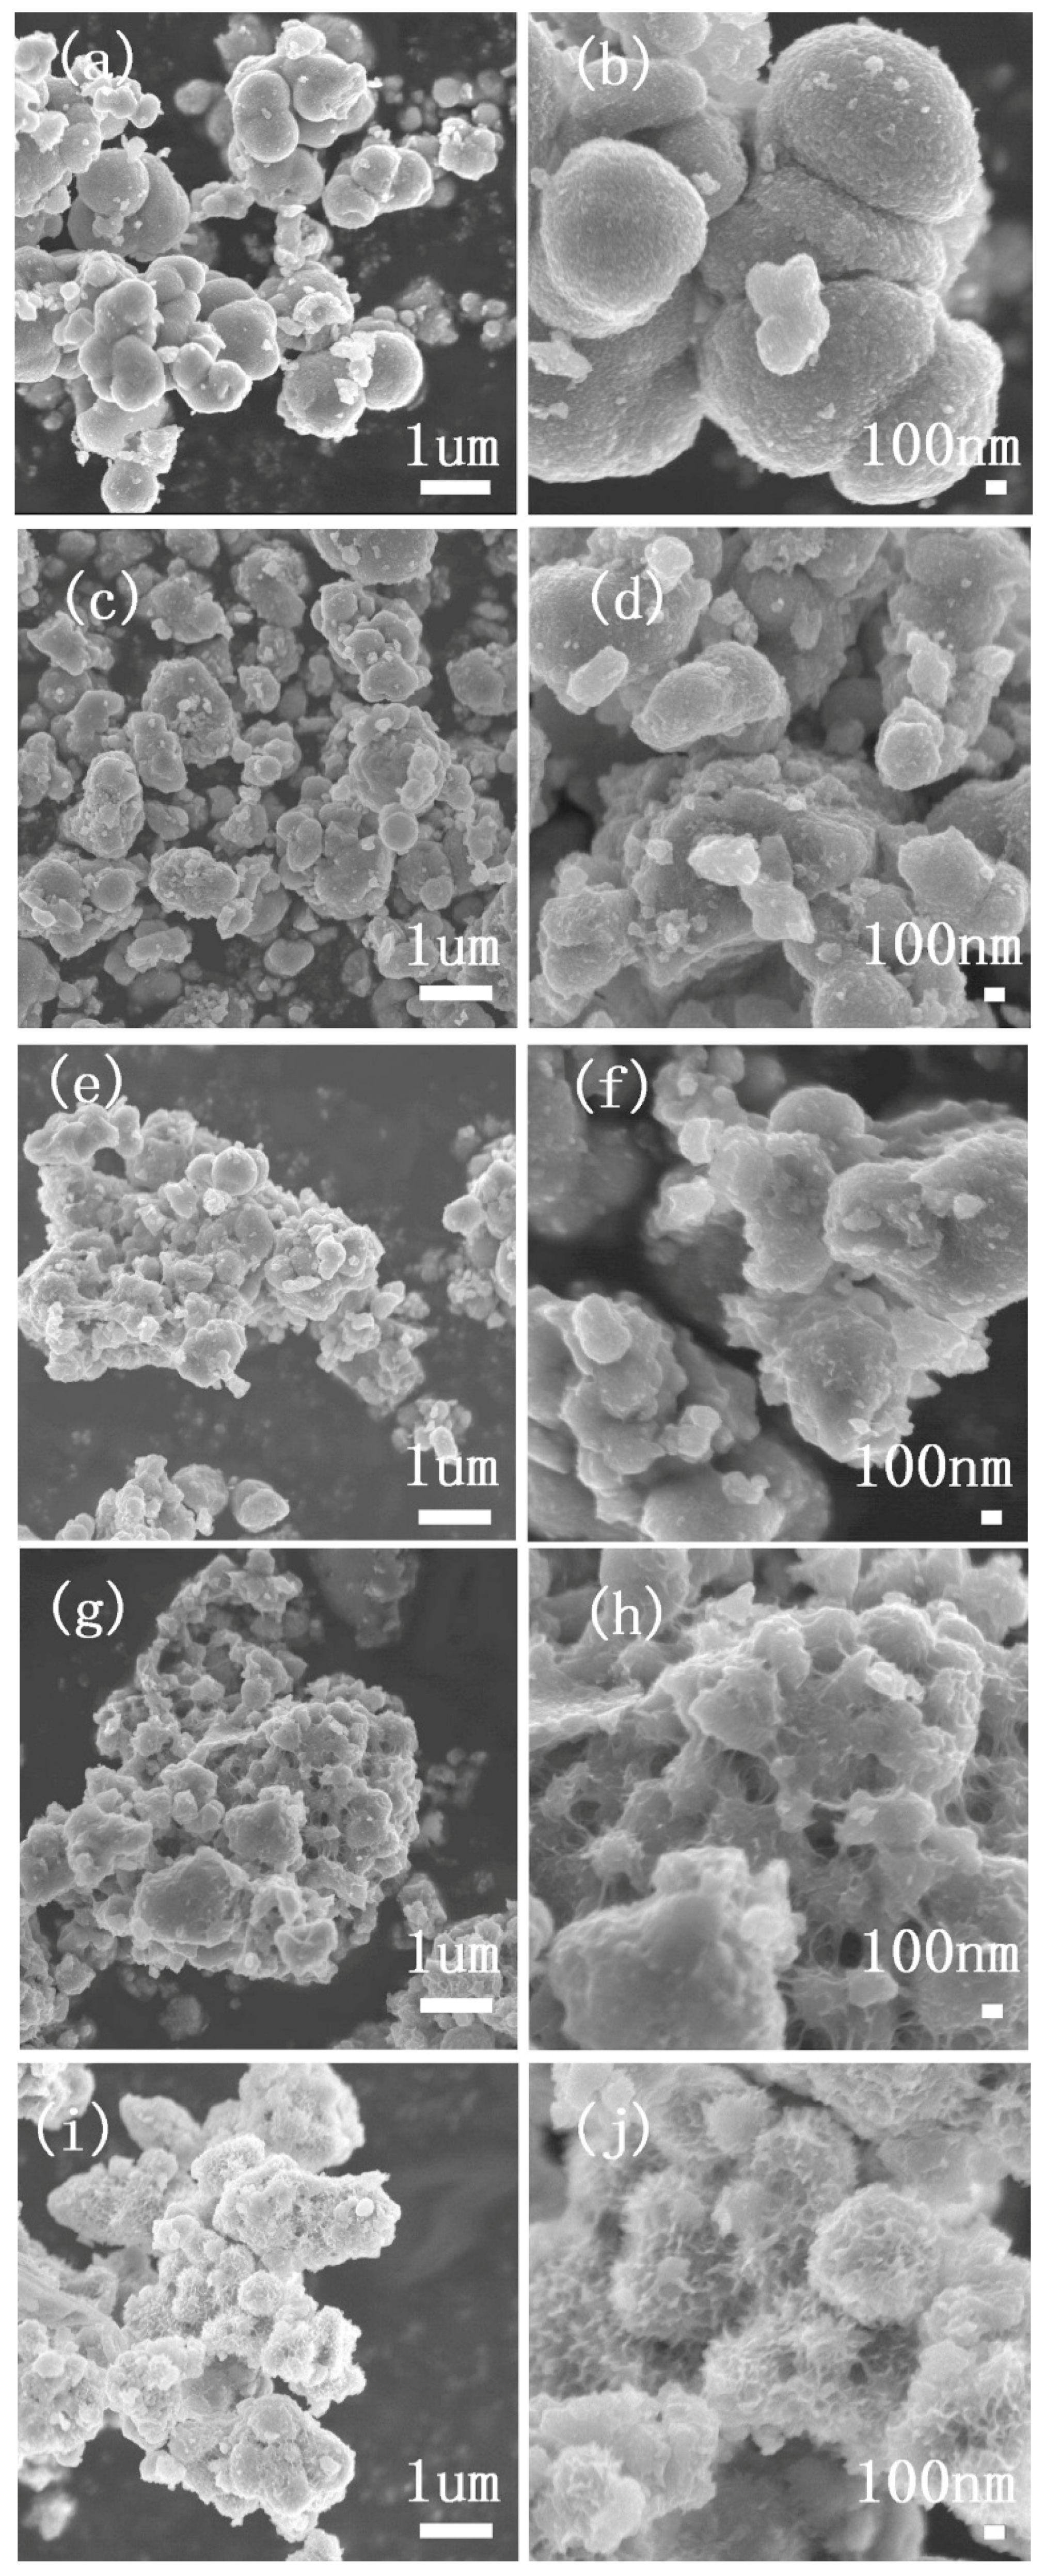
2.4. Crystal Morphology Analysis
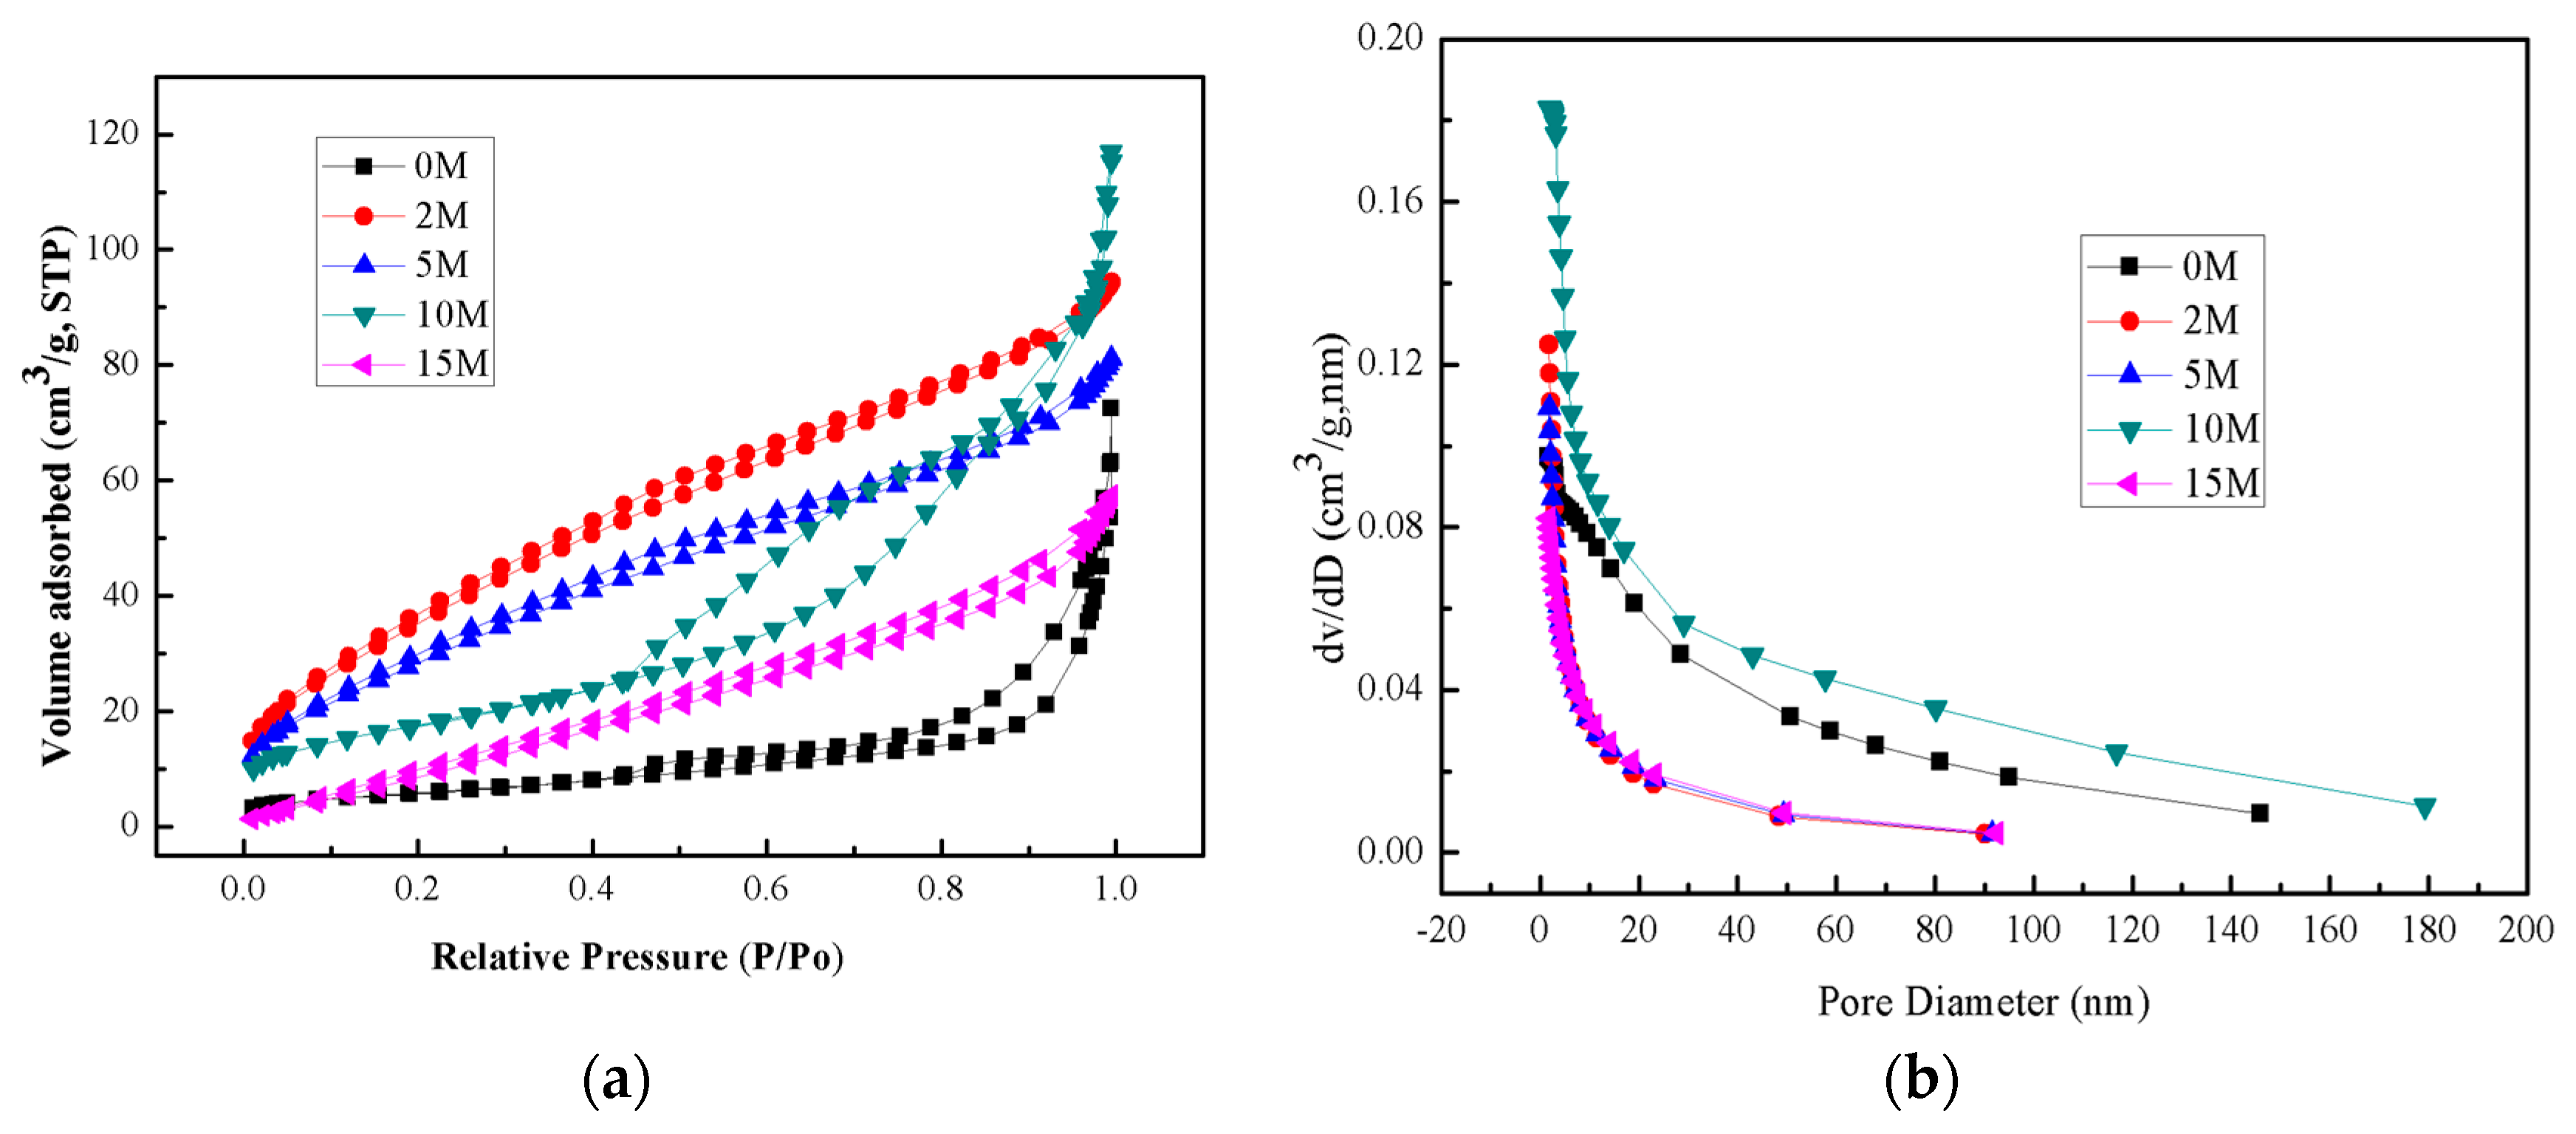
2.5. BET Analysis
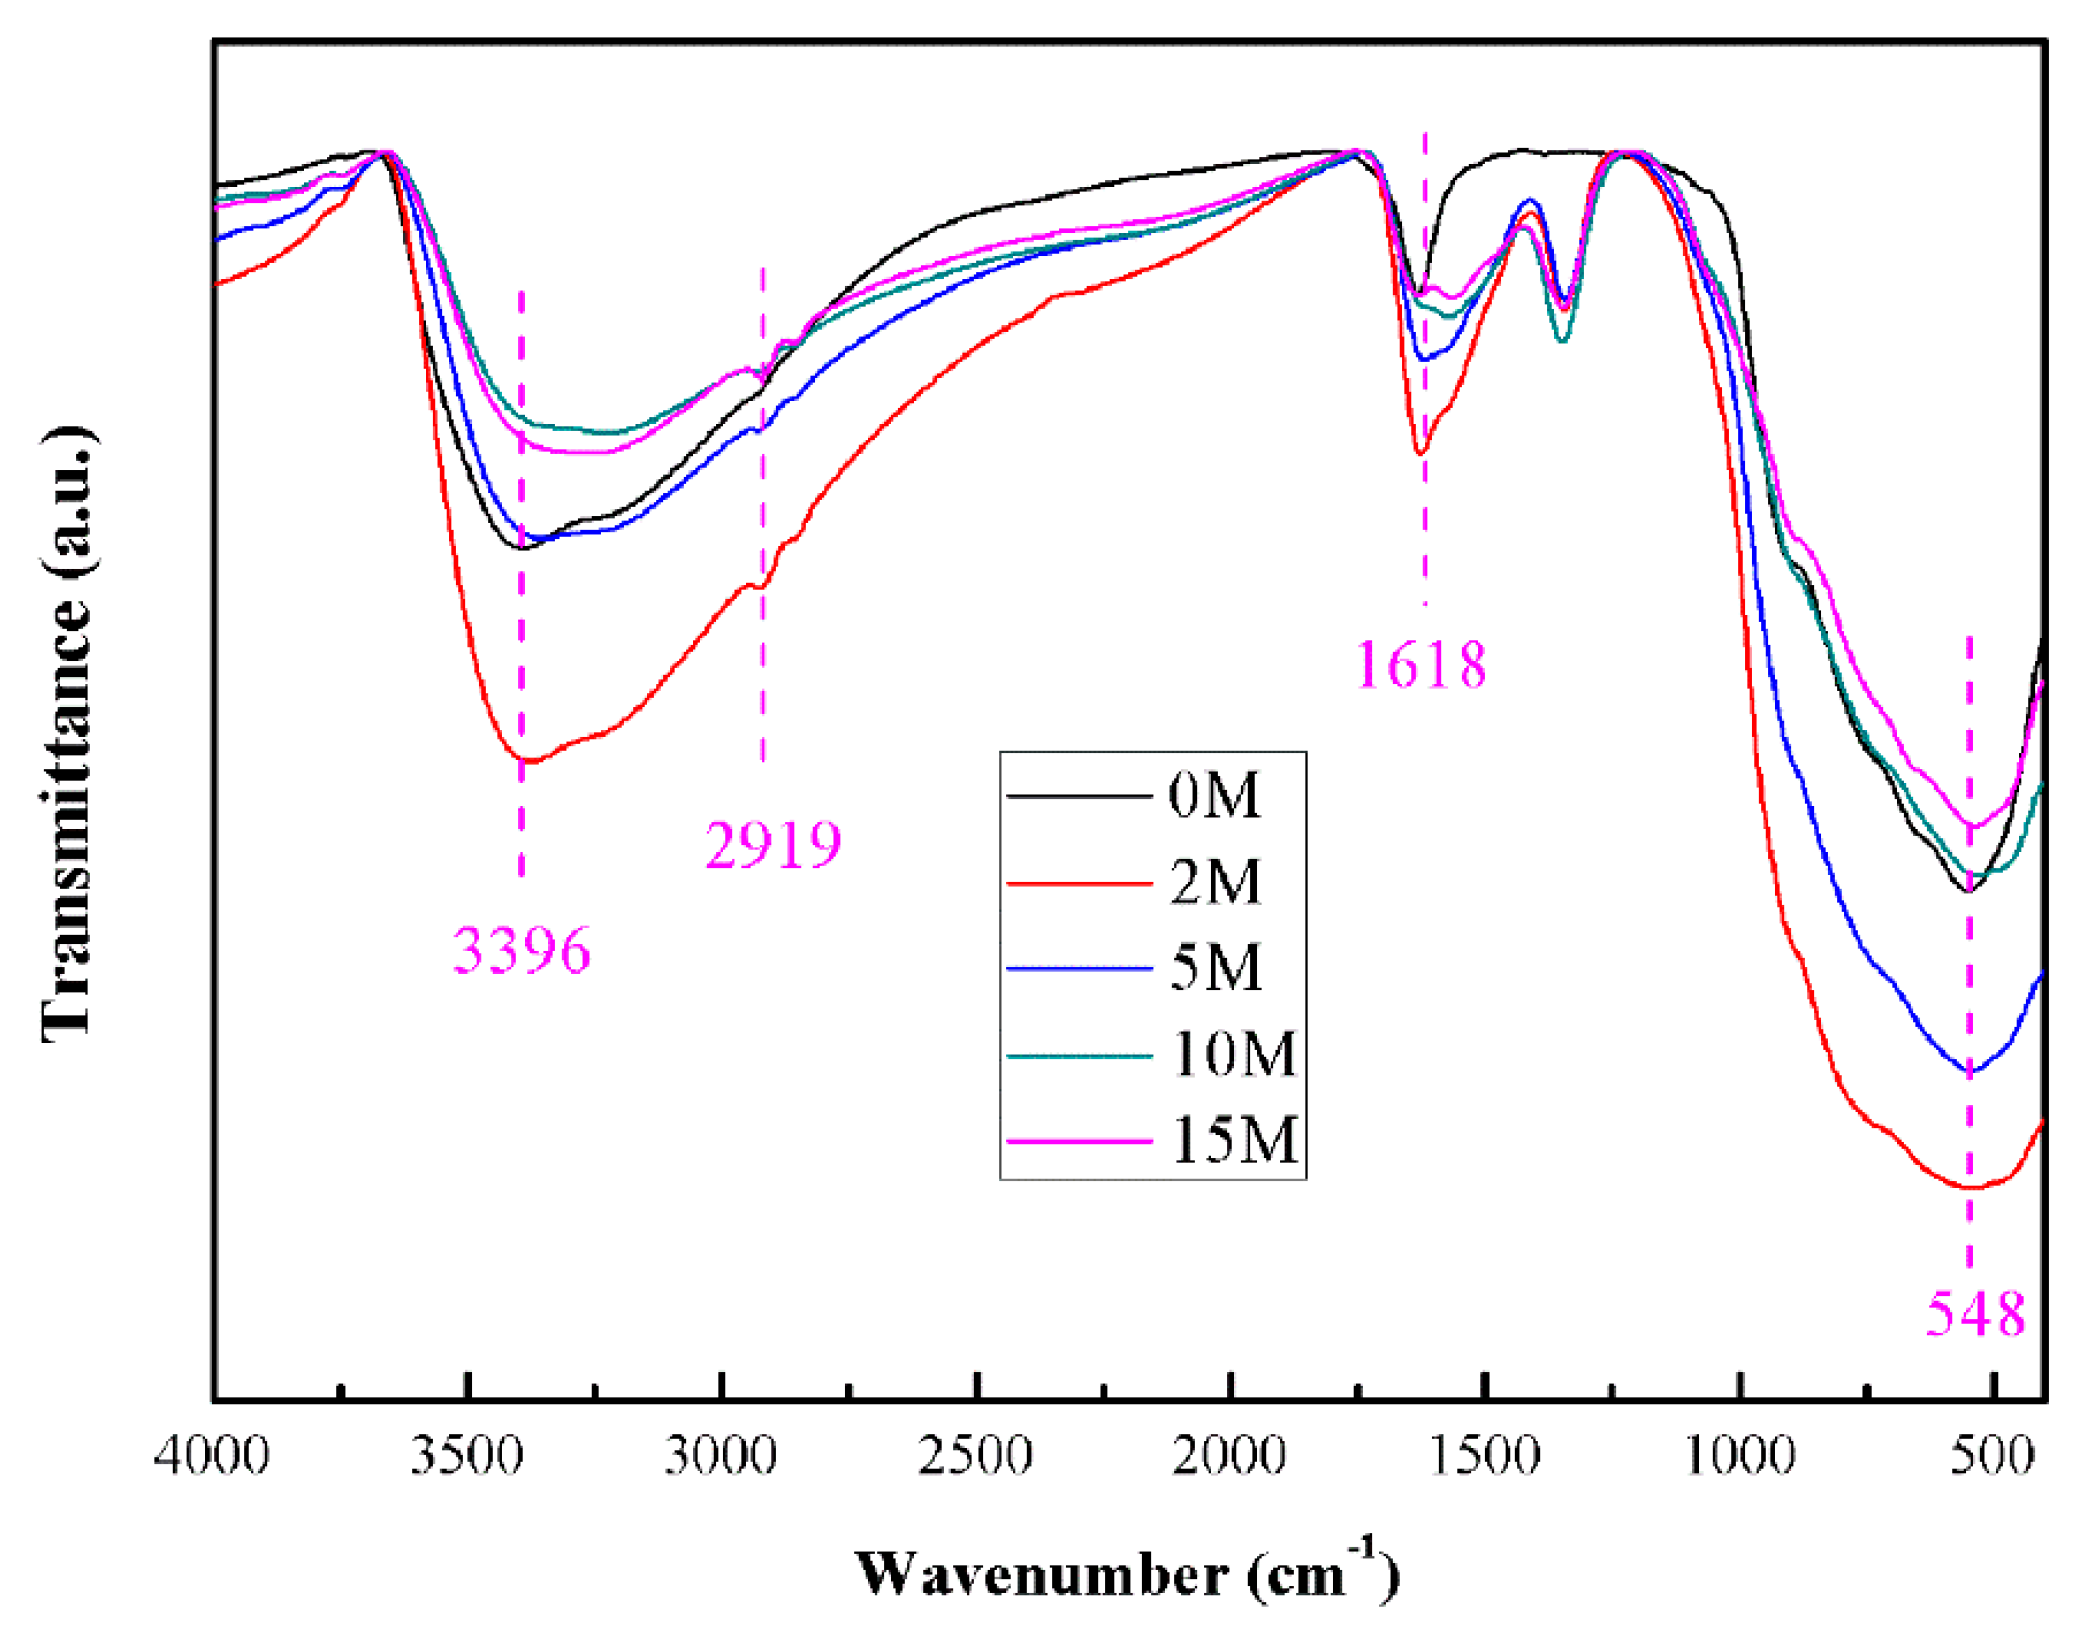
2.6. FT-IR Analysis
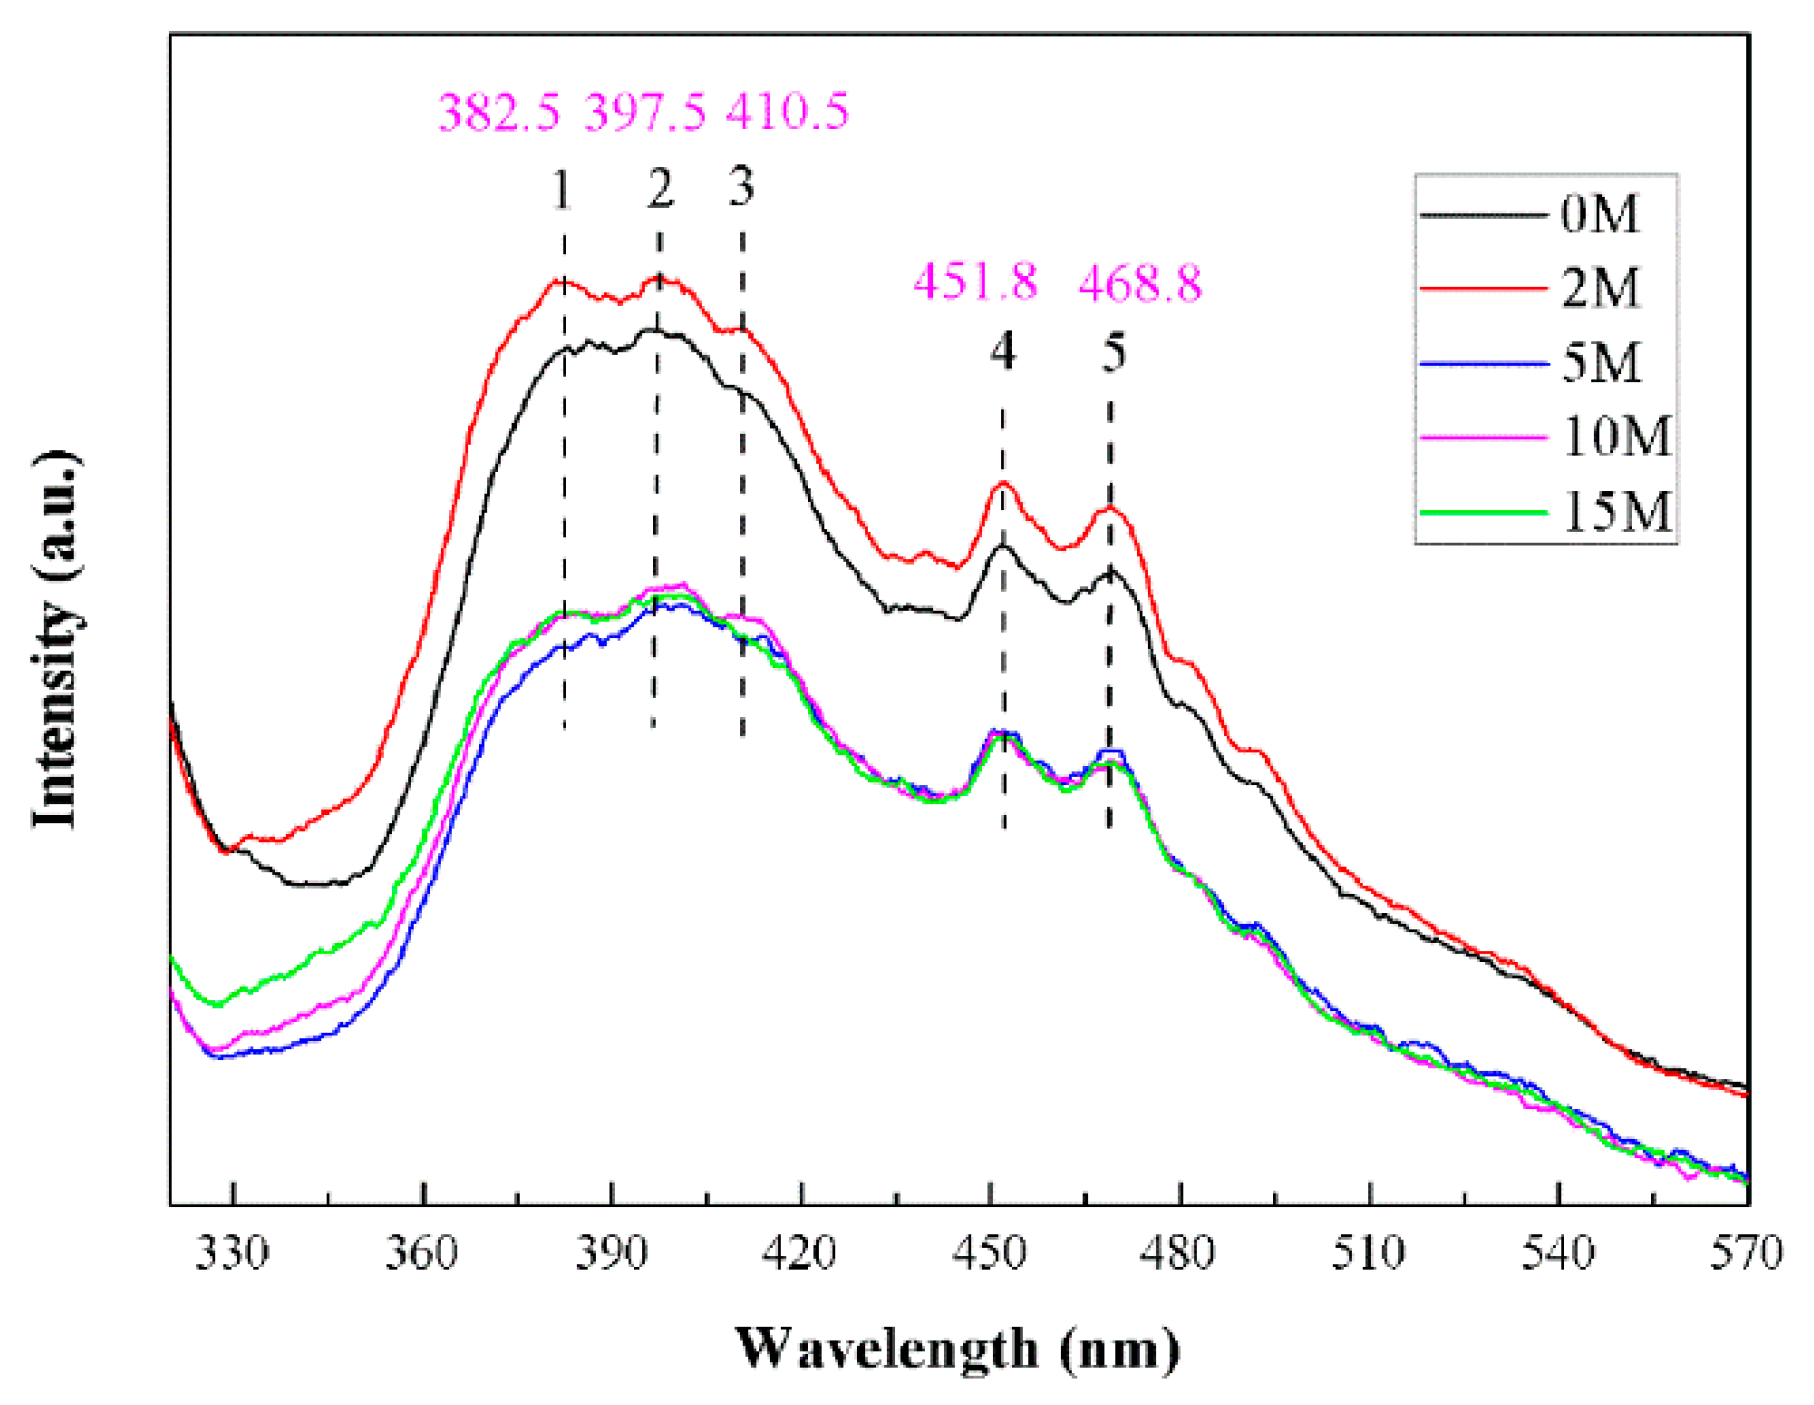
2.7. Photoluminescence Analysis
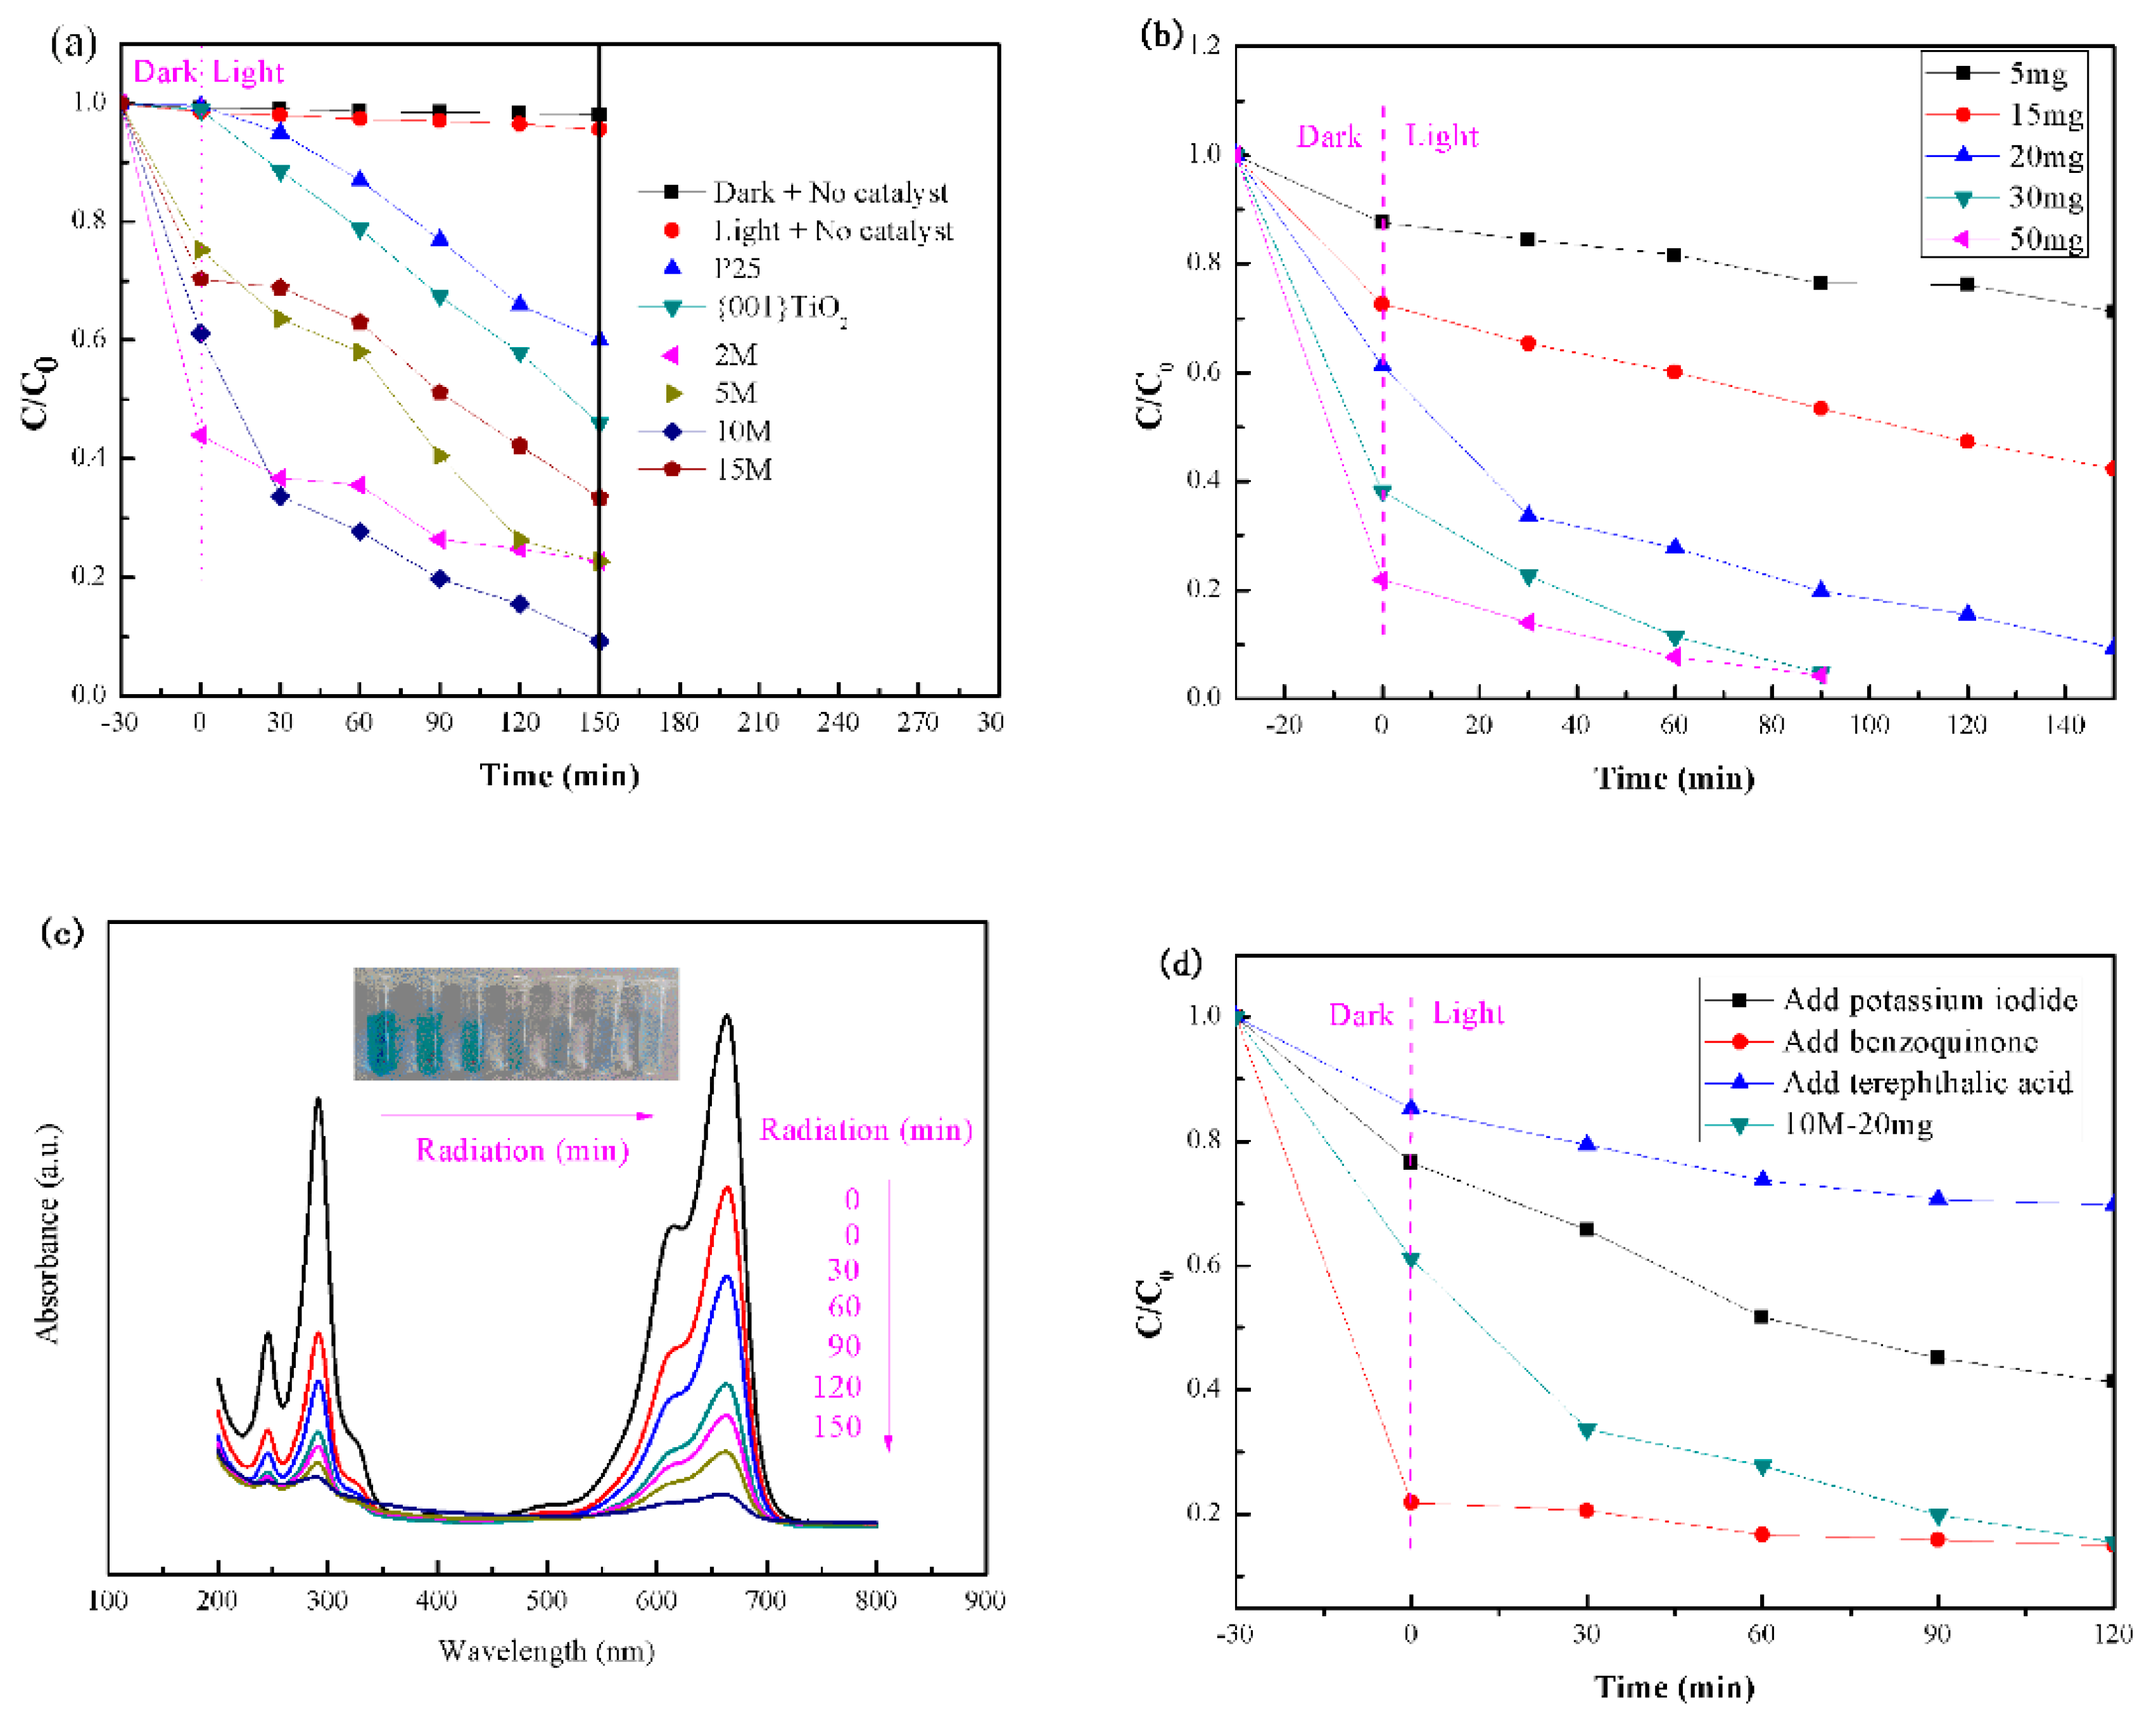
2.8. Photocatalytic Activity
3. Discussion
4. Materials and Methods
4.1. Materials
4.2. Preparation of Catalysts
4.3. Catalyst Characterization
4.4. Photocatalytic Activity Tests
4.5. Radical Scavenging Experiment
5. Conclusions
Author Contributions
Acknowledgments
Conflicts of Interest
References
- Ochiai, T.; Fujishima, A. Photoelectrochemical properties of TiO2 photocatalyst and its applications for environmental purification. Photochem. Photobiol. 2012, 13, 247–262. [Google Scholar] [CrossRef]
- Wang, Y.F.; Tao, J.J.; Wang, X.Z.; Wang, Z.; Zhang, M.; Gang, H.; Sun, Z.Q. A unique Cu2O/TiO2 nanocomposite with enhanced photocatalytic performance under visible light irradiation. Ceram. Int. 2017, 43, 4866–4872. [Google Scholar] [CrossRef]
- Joseph, N.; Vellayan, K.; González, B.; Vicente, M.A.; Gil, A. Effective degradation of methylene blue in aqueous solution using Pd supported Cu-doped Ti-pillared montmorillonite catalyst. Appl. Clay Sci. 2019, 168, 7–10. [Google Scholar] [CrossRef]
- Samsudin, M.F.; Sufian, S.; Bashiri, R.; Mohamed, N.M.; Siang, L.T.; Ramli, R.M. Optimization of photodegradation of methylene blue over modified TiO2/BiVO4 photocatalysts: Effects of total TiO2 loading and different type of co-catalyst. Mater. Today Proc. 2018, 5, 21710–21717. [Google Scholar] [CrossRef]
- Khaksar, M.; Amini, M.; Boghaei, D.M.; Chae, K.H.; Gautam, S. Mn-doped ZrO2 nanoparticles as an efficient catalyst for green oxidative degradation of methylene blue. Catal. Commun. 2015, 72, 1–5. [Google Scholar] [CrossRef]
- Kong, L.; Diao, Z.; Chang, X.; Chen, D. Synthesis of recoverable and reusable granular MgO-SCCA-Zn hybrid ozonation catalyst for degradation of methylene blue. J. Environ. Chem. 2016, 4, 4385–4391. [Google Scholar] [CrossRef]
- Abbas, M.; Rao, B.P.; Reddy, V.; Kim, C. Fe3O4/TiO2 core/shell nanocubes: Single-batch surfactantless synthesis, characterization and efficient catalysts for methylene blue degradation. Ceram. Int. 2014, 40, 11177–11186. [Google Scholar] [CrossRef]
- Mishra, D.D.; Tan, G. Visible photocatalytic degradation of methylene blue on magnetic SrFe12O19. J. Phys. Chem. Solids 2018, 123, 157–161. [Google Scholar] [CrossRef]
- Adeleke, J.T.; Theivasanthi, T.; Thiruppathi, M.; Swaminathan, M.; Akomolafe, T.; Alabi, A.B. Photocatalytic degradation of methylene blue by ZnO/NiFe2O4 nanoparticles. Appl. Surf. Sci. 2018, 455, 195–200. [Google Scholar] [CrossRef]
- Huang, D.; Ma, J.; Fan, C.; Wang, K.; Zhao, W.; Peng, M.; Komarneni, S. Co-Mn-Fe complex oxide catalysts from layered double hydroxides for decomposition of methylene blue: Role of Mn. Appl. Clay Sci. 2018, 152, 230–238. [Google Scholar] [CrossRef]
- Ganesh, R.S.; Durgadevi, E.; Navaneethan, M.; Sharma, S.K.; Binitha, H.S.; Ponnusamy, S.; Muthamizhchelvan, C.; Hayakawa, Y. Visible light induced photocatalytic degradation of methylene blue and rhodamine B from the catalyst of CdS nanowire. Chem. Phys. Lett. 2017, 684, 126–134. [Google Scholar] [CrossRef]
- Liao, G.; Li, Q.; Zhao, W.; Pang, Q.; Gao, H.; Xu, Z. In-situ construction of novel silver nanoparticle decorated polymeric spheres as highly active and stable catalysts for reduction of methylene blue dye. Appl. Catal. A Gen. 2018, 549, 102–111. [Google Scholar] [CrossRef]
- Veziroglu, S.; Kuru, M.; Ghori, M.Z.; Dokan, F.K.; Hinz, A.M.; Strunskus, T.; Faupel, F.; Aktas, O.C. Ultra-fast degradation of methylene blue by Au/ZnO-CeO2 nano-hybrid catalyst. Mater. Lett. 2017, 209, 486–491. [Google Scholar] [CrossRef]
- Ali, W.; Jaffari, G.H.; Khan, S.; Liu, Y. Morphological control of 1D and 3D TiO2 nanostructures with ammonium hydroxide and TiO2 compact layer on FTO coated glass in hydrothermal synthesis. Mater. Chem. Phys. 2018, 214, 48–55. [Google Scholar] [CrossRef]
- Sasahar, A.; Murakami, T.; Tu, L.T.U.; Tomitori, M. Nanoscale characterisation of TiO2(110) annealed in air. Appl. Surf. Sci. 2018, 428, 1000–1005. [Google Scholar] [CrossRef]
- Zhang, Q.; Fu, Y.; Wu, Y.; Zhang, Y.N.; Zuo, T. Low-cost Y-doped TiO2 nanosheets film with highly reactive {001} facets from CRT waste and enhanced photocatalytic removal of Cr(VI) and methyl orange. ACS Sustain. Chem. Eng. 2016, 4, 1794–1803. [Google Scholar] [CrossRef]
- Zhao, J.; Yang, Y.Y.; Li, Y.; Zhao, L.; Wang, H.; Song, G.L.; Tang, G.Y. Microencapsulated phase change materials with TiO2-doped PMMA shell for thermal energy storage and UV-shielding. Sol. Energy Mater. Sol. Cells 2017, 168, 62–68. [Google Scholar] [CrossRef]
- Endres, P.J.; Tatjana, P.; Stefan, V.; Meade, T.J.; Woloschak, G.E. DNA-TiO2 nanoconjugates labeled with magnetic resonance contrast agents. J. Am. Chem. Soc. 2007, 129, 15760–15761. [Google Scholar] [CrossRef] [PubMed]
- Fitra, M.; Daut, I.; Irwanto, M.; Gomes, N.; Irwan, Y.M. Effect of TiO2 thickness dye solar cell on charge generation. Energy Procedia 2013, 36, 278–286. [Google Scholar] [CrossRef]
- Pu, S.H.; Long, D.B.; Liu, Z.H.; Yang, F.Y.; Zhu, J.M. Preparation of RGO-P25 Nanocomposites for the Photocatalytic Degradation of Ammonia in Livestock Farms. Catalysts 2018, 8, 189. [Google Scholar] [CrossRef]
- Zuo, S.; Jiang, Z.; Liu, W.; Yao, C.; Chen, Q.; Liu, X. Synthesis and Characterization of Urchin-like Mischcrystal TiO2 and Its Photocatalysis. Mater. Charact. 2014, 96, 177–182. [Google Scholar] [CrossRef]
- Ma, Q.L.; Zhang, H.X.; Cui, Y.Q.; Deng, X.Y.; Guo, R.N.; Cheng, X.W.; Xie, M.Z.; Cheng, Q.F. Fabrication of Cu2O/TiO2 nano-tube arrays photoelectrode and its enhanced photoelectrocatalytic performance for degradation of 2,4,6-trichlorophenol. J. Ind. Eng. Chem. 2018, 57, 181–187. [Google Scholar] [CrossRef]
- Wei, C.; Wang, Y.H.; Liu, S.; Li, G.; Mao, L.Q.; Fan, Z.Y.; Shang, G.W.F.; Jiang, Z. Non-noble metal Cu as a cocatalyst on TiO2 nanorod for highly efficient photocatalytic hydrogen production. Appl. Surf. Sci. 2018, 445, 527–534. [Google Scholar] [CrossRef]
- Angkaew, S.; Limsuwan, P. Preparation of silver-titanium dioxide core-shell (Ag@TiO2) nanoparticles: Effect of Ti-Ag mole ratio. Procedia Eng. 2012, 32, 649–655. [Google Scholar] [CrossRef]
- Vipul, S.; Suneel, K.; Venkata, K. Shape Selective Au-TiO2 Nanocomposites for Photocatalytic Applications. Mater. Today Proc. 2016, 3, 1939–1948. [Google Scholar] [CrossRef]
- Barmeh, A.; Nilforoushan, M.R.; Otroj, S. Wetting and photocatalytic properties of Ni-doped TiO2 coating on glazed ceramic tiles under visible light. Thin Solid Films 2018, 666, 137–142. [Google Scholar] [CrossRef]
- Chen, Y.Z.; Li, A.X.; Li, Q.; Hou, X.M.; Wang, L.N.; Huang, Z.H. Facile fabrication of three-dimensional interconnected nanoporous N-TiO2 for efficient photoelectrochemical water splitting. J. Mater. Sci. Technol. 2018, 34, 955–960. [Google Scholar] [CrossRef]
- Zhang, G.Y.; Sun, Y.B.; Zhang, C.X.; Yu, Z.Q. Decomposition of acetaminophen in water by a gas phase dielectric barrier discharge plasma combined with TiO2-rGO nanocomposite: Mechanism and degradation pathway. J. Hazard. Mater. 2017, 323, 719–729. [Google Scholar] [CrossRef] [PubMed]
- Mohammad, B.A.; Zoha, T.B.; Majid, S.; Sedigheh, B.D.; Payam, V. Synthesis of TiO2 nanoparticles and decorated multi-wall carbon nanotube (MWCNT) with anatase TiO2 nanoparticles and study of optical properties and structural characterization of TiO2/MWCNT nanocomposite. Optik 2017, 149, 447–454. [Google Scholar] [CrossRef]
- Li, G.; Wu, L.; Li, F.; Xu, P.; Zhang, D.; Li, H. Photoelectrocatalytic degradation of organic pollutants via a CdS quantum dots enhanced TiO2 nanotube array electrode under visible light irradiation. Nanoscale 2013, 5, 2118–2125. [Google Scholar] [CrossRef] [PubMed]
- Zhou, W.; Yin, Z.; Du, Y.; Huang, X.; Zeng, Z.; Fan, Z.; Liu, H.; Wang, J.; Zhang, H. Synthesis of few-layer MoS2 nanosheet-coated TiO2 nanobelt heterostructures for enhanced photocatalytic activities. Small 2013, 9, 140–147. [Google Scholar] [CrossRef] [PubMed]
- Yu, S.Q.; Ling, Y.H.; Wang, R.G.; Zhang, J.; Qin, F.; Zhang, Z.J. Constructing superhydrophobic WO3@TiO2 nanoflake surface beyond amorphous alloy against electrochemical corrosion on iron steel. Appl. Surf. Sci. 2018, 436, 527–537. [Google Scholar] [CrossRef]
- Zhou, L.; Wang, L.Z.; Lei, J.Y.; Liu, Y.D.; Zhang, J.L. Fabrication of TiO2/Co-g-C3N4 heterojunction catalyst and its photocatalytic performance. Catal. Commun. 2017, 89, 125–128. [Google Scholar] [CrossRef]
- Mohamed, M.A.; Sandhya, K.Y. Selective photodegradation and enhanced photo electrochemical properties of titanium dioxide-graphene composite with exposed (001) facets made by photochemical method. Sol. Energy Mater. Sol. Cells 2016, 144, 748–757. [Google Scholar] [CrossRef]
- Lazzeri, M.; Vittadini, A.; Selloni, A. Erratum: Structure and energetic of stoichiometric TiO2 anatase surfaces. Phys. Rev. B 2002, 65, 1–5. [Google Scholar] [CrossRef]
- Diebold, U. The surface science of titanium dioxide. Surf. Sci. Rep. 2003, 48, 53–229. [Google Scholar] [CrossRef]
- Yang, H.G.; Sun, C.H.; Qiao, S.Z.; Zou, J.; Liu, G.; Smith, S.C.; Cheng, H.M.; Lu, G.Q. Anatase TiO2 single crystals with a large percentage of reactive facets. Nature 2008, 453, 638–641. [Google Scholar] [CrossRef] [PubMed]
- Zhang, Y.; Wang, T.; Zhou, M.; Wang, Y.; Zhang, Z.G. Hydrothermal preparation of Ag-TiO2 nanostructures with exposed {001}/{101} facets for enhancing visible light photocatalytic activity. Ceram. Int. 2017, 43, 3118–3126. [Google Scholar] [CrossRef]
- Zhang, J.; Zhang, L.L.; Shi, Y.X.; Xu, G.L.; Zhang, E.P.; Wang, H.B.; Zhe, K.; Xi, J.H.; Jia, Z.G. Anatase TiO2 nanosheets with coexposed {101} and {001} facets coupled with ultrathin SnS2 nanosheets as a face-to-face n-p-n dual heterojunction photocatalyst for enhancing photocatalytic activity. Appl. Surf. Sci. 2017, 420, 839–848. [Google Scholar] [CrossRef]
- Zhang, J.; Huang, L.H.; Lu, Z.D.; Jin, Z.L.; Wang, X.Y.; Xu, G.L.; Zhang, E.P.; Wang, H.B.; Zhe, K.; Xi, J.H.; et al. Controllable synthesis of Bi2WO6(001)/TiO2(001) heterostructure with enhanced photocatalytic activity. J. Alloy. Compd. 2016, 676, 37–45. [Google Scholar] [CrossRef]
- Zhang, J.; Huang, L.H.; Lu, Z.D.; Jin, Z.L.; Wang, X.Y.; Xu, G.L.; Zhang, E.P.; Wang, H.B.; Zhe, K.; Xi, J.H.; et al. Crystal face regulating MoS2/TiO2(001) heterostructure for high photocatalytic activity. J. Alloy. Compd. 2016, 688, 840–848. [Google Scholar] [CrossRef]
- Xiang, Q.J.; Lv, K.L.; Yu, J.G. Pivotal role of fluorine in enhanced photocatalyticactivity of anatase TiO2 nanosheets with dominant (001) facets for the photocatalytic degradation of acetone inair. Appl. Catal. B Environ. 2010, 96, 557–564. [Google Scholar] [CrossRef]
- Nie, L.; Yu, J.; Li, X.; Cheng, B.; Liu, G.; Jaroniec, M. Enhanced Performance of NaOH-Modified Pt/TiO2 toward Room Temperature Selective Oxidation of Formaldehyde. Environ. Sci. Technol. 2013, 47, 2777–2783. [Google Scholar] [CrossRef] [PubMed]
- Hou, C.; Liu, W.; Zhu, J. Synthesis of NaOH-Modified TiOF2 and Its Enhanced Visible Light Photocatalytic Performance onRhB. Catalysts 2017, 7, 243. [Google Scholar] [CrossRef]
- Wang, H.; Yi, G.; Tan, M.; Zu, X.; Luo, H.; Jiang, X. Initial reactant controlled synthesis of double layered TiO2 nanostructures and characterization of its spectra of absorption and photoluminescence. Mater. Lett. 2015, 148, 5–8. [Google Scholar] [CrossRef]
- Park, H.; Choi, W. Photocatalytic Reactivities of Nafion-Coated TiO2 for the Degradation of Charged Organic Compounds under UV or Visible Light. J. Phys. Chem. B 2005, 109, 11667–11674. [Google Scholar] [CrossRef] [PubMed]
- Yuan, L.; Weng, B.; Colmenares, J.C.; Sun, Y.; Xu, Y.-J. Multichannel charge transfer and mechanistic insight in metal decorated 2D-2D Bi2WO6-TiO2 cascade with enhanced photocatalytic performance. Small 2017, 13, 1702253. [Google Scholar] [CrossRef] [PubMed]
- Hou, C.T.; Liu, W.L. One-stepsynthesisof OH-TiO2/TiOF2 nanohybrids and their enhanced solar light photocatalytic performance. R. Soc. Open Sci. 2018, 5, 172005. [Google Scholar] [CrossRef] [PubMed]


| Samples | IR (2θ = 27.24°) | IA (2θ = 25.28°) | XR |
|---|---|---|---|
| 0 M | - | 307.87 | _ |
| 2 M | - | 233.31 | _ |
| 5 M | - | 176.88 | _ |
| 10 M | 69.36 | 112.84 | 43.48% |
| 15 M | 69.09 | 76.83 | 52.91% |
| Samples | BET Surface Area (m²/g) | Pore Volume (cm3/g) | Pore Size (nm) |
|---|---|---|---|
| 0 M | 21.31 | 0.08 | 14.73 |
| 2 M | 136.19 | 0.14 | 4.22 |
| 5 M | 109.25 | 0.12 | 4.50 |
| 10 M | 63.65 | 0.16 | 10.14 |
| 15 M | 45.65 | 0.09 | 7.48 |
© 2018 by the authors. Licensee MDPI, Basel, Switzerland. This article is an open access article distributed under the terms and conditions of the Creative Commons Attribution (CC BY) license (http://creativecommons.org/licenses/by/4.0/).
Share and Cite
Hou, C.; Hu, B.; Zhu, J. Photocatalytic Degradation of Methylene Blue over TiO2 Pretreated with Varying Concentrations of NaOH. Catalysts 2018, 8, 575. https://doi.org/10.3390/catal8120575
Hou C, Hu B, Zhu J. Photocatalytic Degradation of Methylene Blue over TiO2 Pretreated with Varying Concentrations of NaOH. Catalysts. 2018; 8(12):575. https://doi.org/10.3390/catal8120575
Chicago/Turabian StyleHou, Chentao, Bo Hu, and Jiaming Zhu. 2018. "Photocatalytic Degradation of Methylene Blue over TiO2 Pretreated with Varying Concentrations of NaOH" Catalysts 8, no. 12: 575. https://doi.org/10.3390/catal8120575
APA StyleHou, C., Hu, B., & Zhu, J. (2018). Photocatalytic Degradation of Methylene Blue over TiO2 Pretreated with Varying Concentrations of NaOH. Catalysts, 8(12), 575. https://doi.org/10.3390/catal8120575