2.1. Catalyst Characterization
The Cu/Zn atomic ratio in the synthesized catalyst precursor determined by XRF was 1.6, i.e., very close to that expected from the chemical composition of the solution of copper and zinc nitrates used in the precipitation (1.5). Moreover, it was assumed that all catalyst samples prepared by different thermal treatments had the same chemical composition.
The phase composition of the catalyst precursor, as well as that of the final catalysts, was investigated by XRD. The XRD pattern of the as-prepared CuZn precursor (
Figure 1) revealed that this sample was a mixture of two phases, zincian malachite ((Cu
0.8 Zn
0.2)
2(OH)
2CO
3; Ref. Code No. 01-079-7851) and aurichalcite (Cu
2Zn
3(CO
3)
2(OH)
6; Ref. Code No. 04-010-3227), found in almost equal amounts.
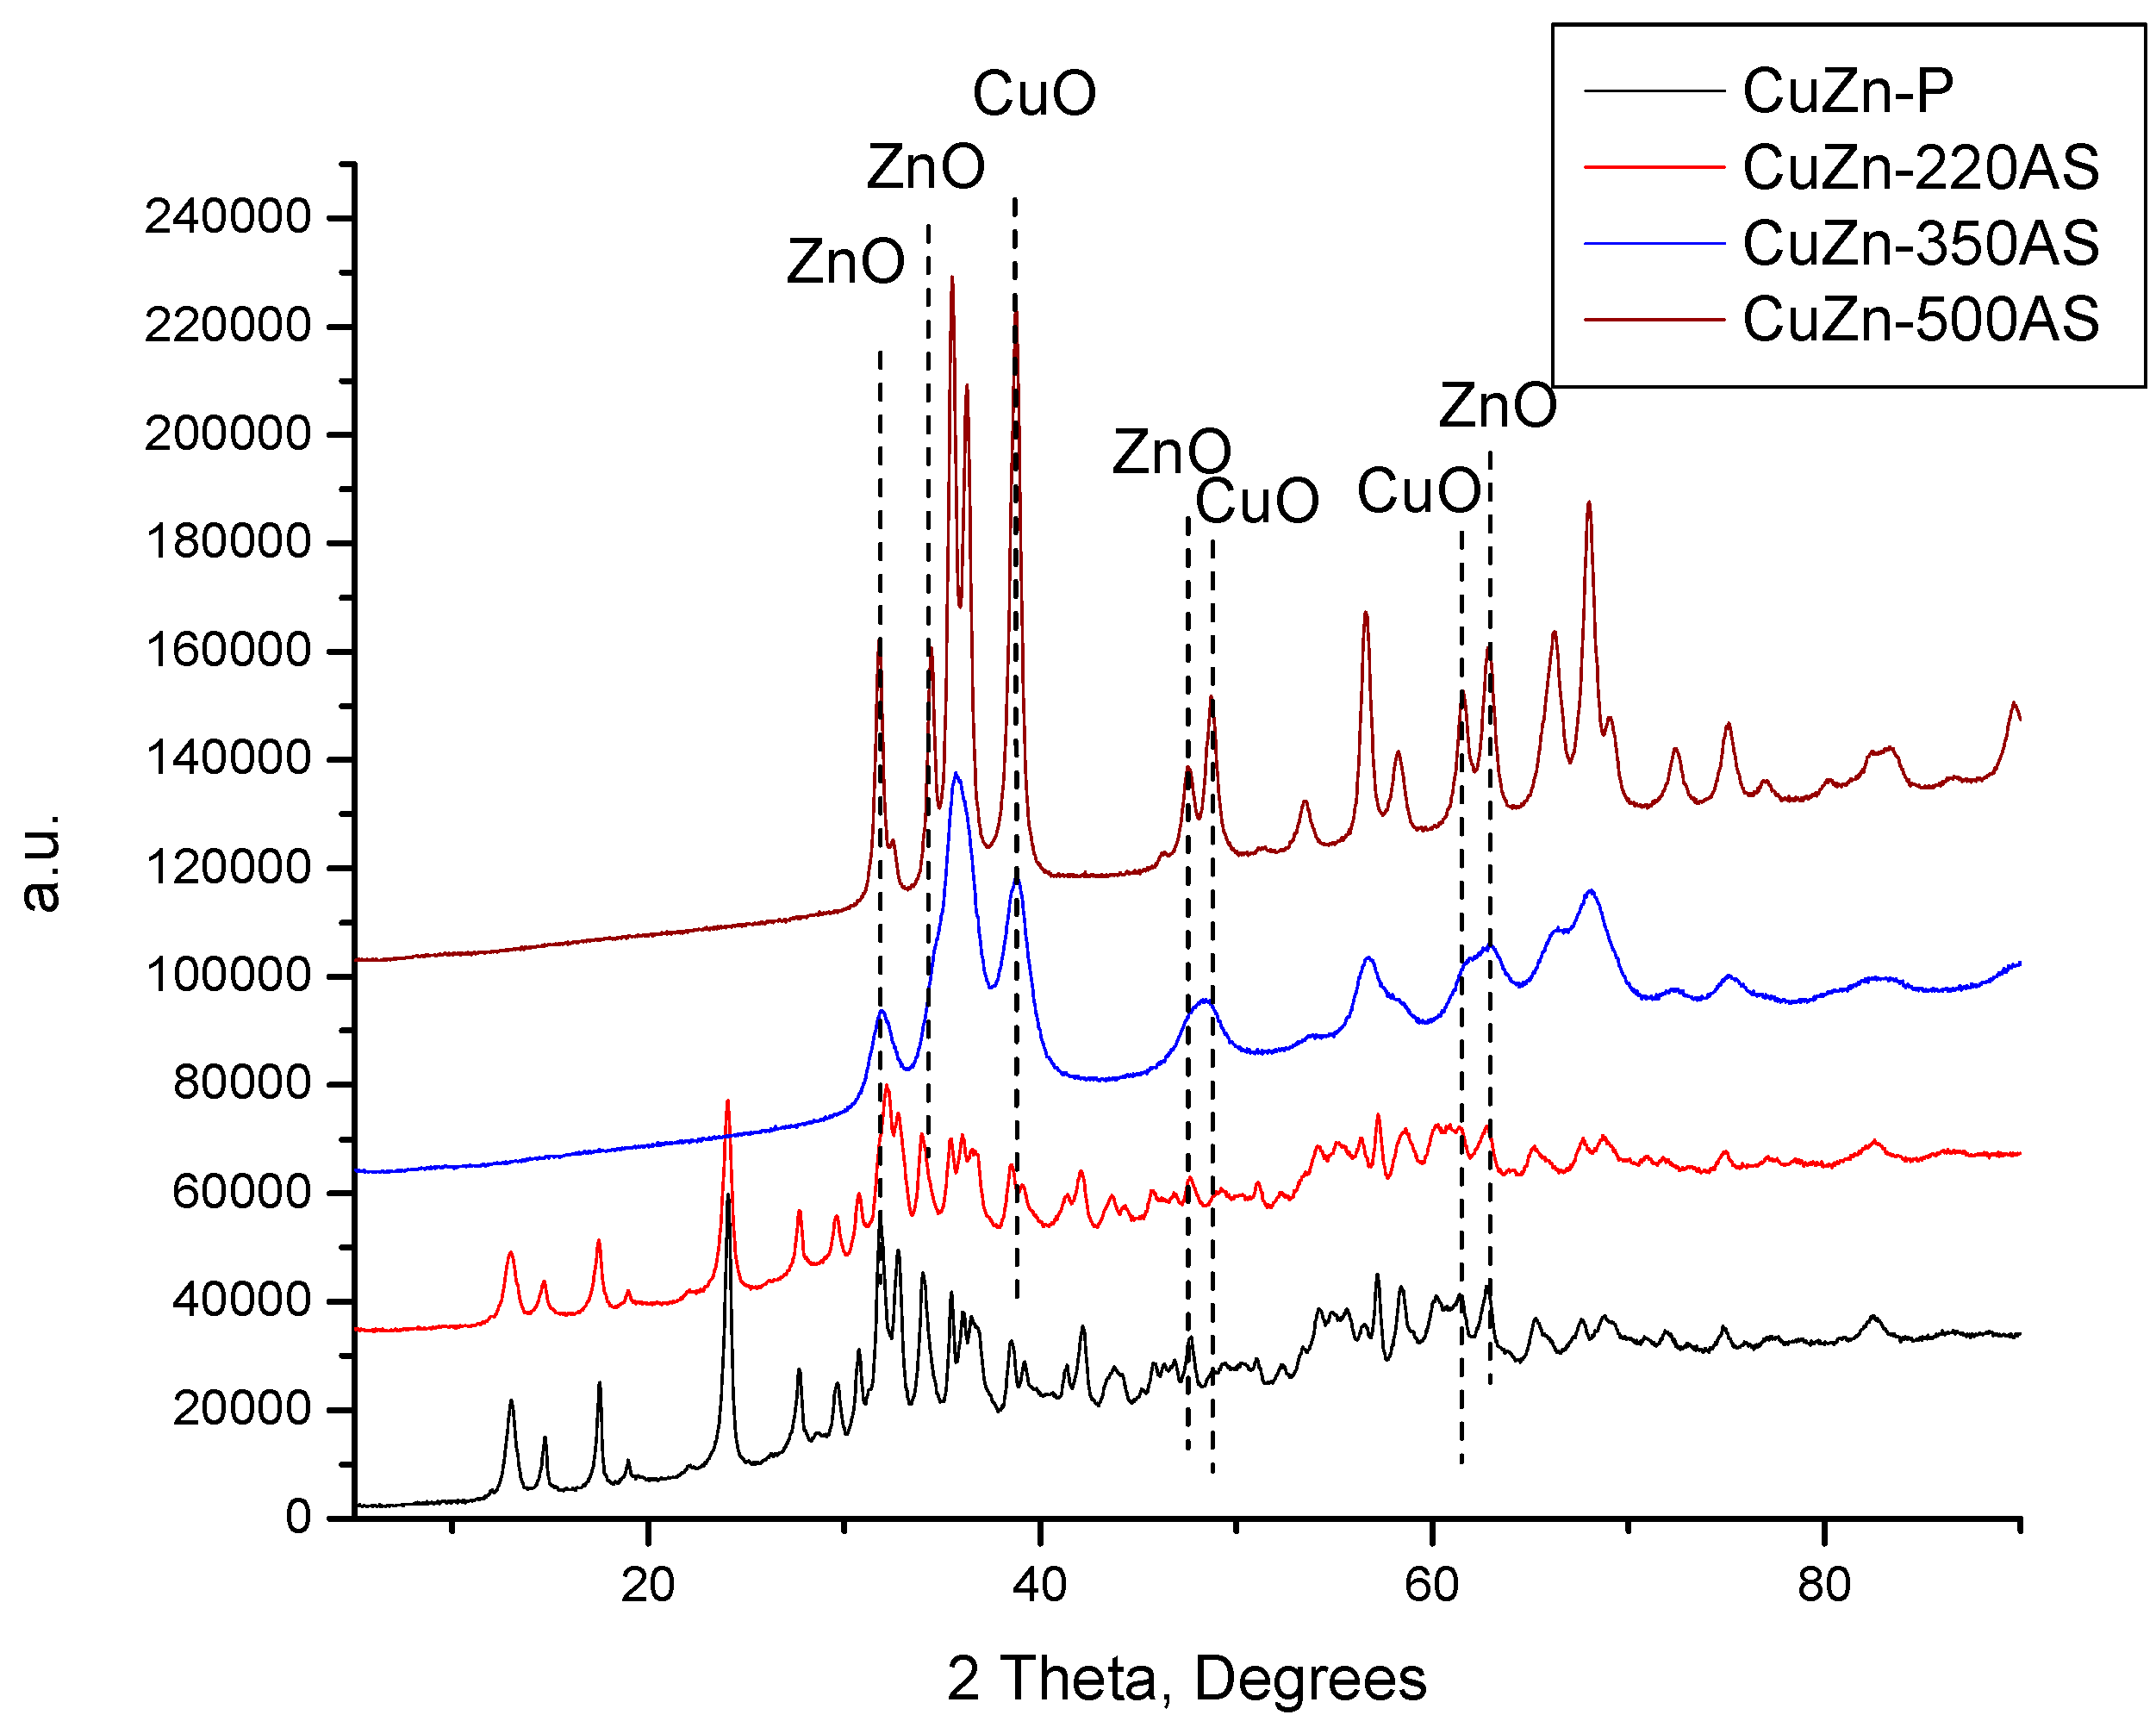
The XRD patterns of the catalysts prepared by calcination in static air at the three calcination temperatures (220, 350, and 500 °C) are compared with the XRD pattern of the catalyst precursor in
Figure 1. When the catalyst precursor was treated at 220 °C, the phase composition did not change, although the intensity of the XRD reflexes decreased slightly. This can be attributed to the good thermal stability of zincian malachite and aurichalcite. It was reported that zincian malachite and aurichalcite are stable up to 270 °C and 360 °C, correspondingly [
14,
15]. When the calcination temperature was increased to 350 °C, the zincian malachite and aurichalcite crystalline domains present in the CuZn catalyst precursor decomposed completely and the CuO and ZnO crystalline particles were formed. A further increase in the calcination temperature to 500 °C did not change the phase composition of the catalyst anymore, i.e., the CuZn-500AS sample consisted exclusively of a mixture of CuO and ZnO. However, the intensity of the XRD reflexes notably increased, suggesting a growth of the crystallites size of both CuO and ZnO.
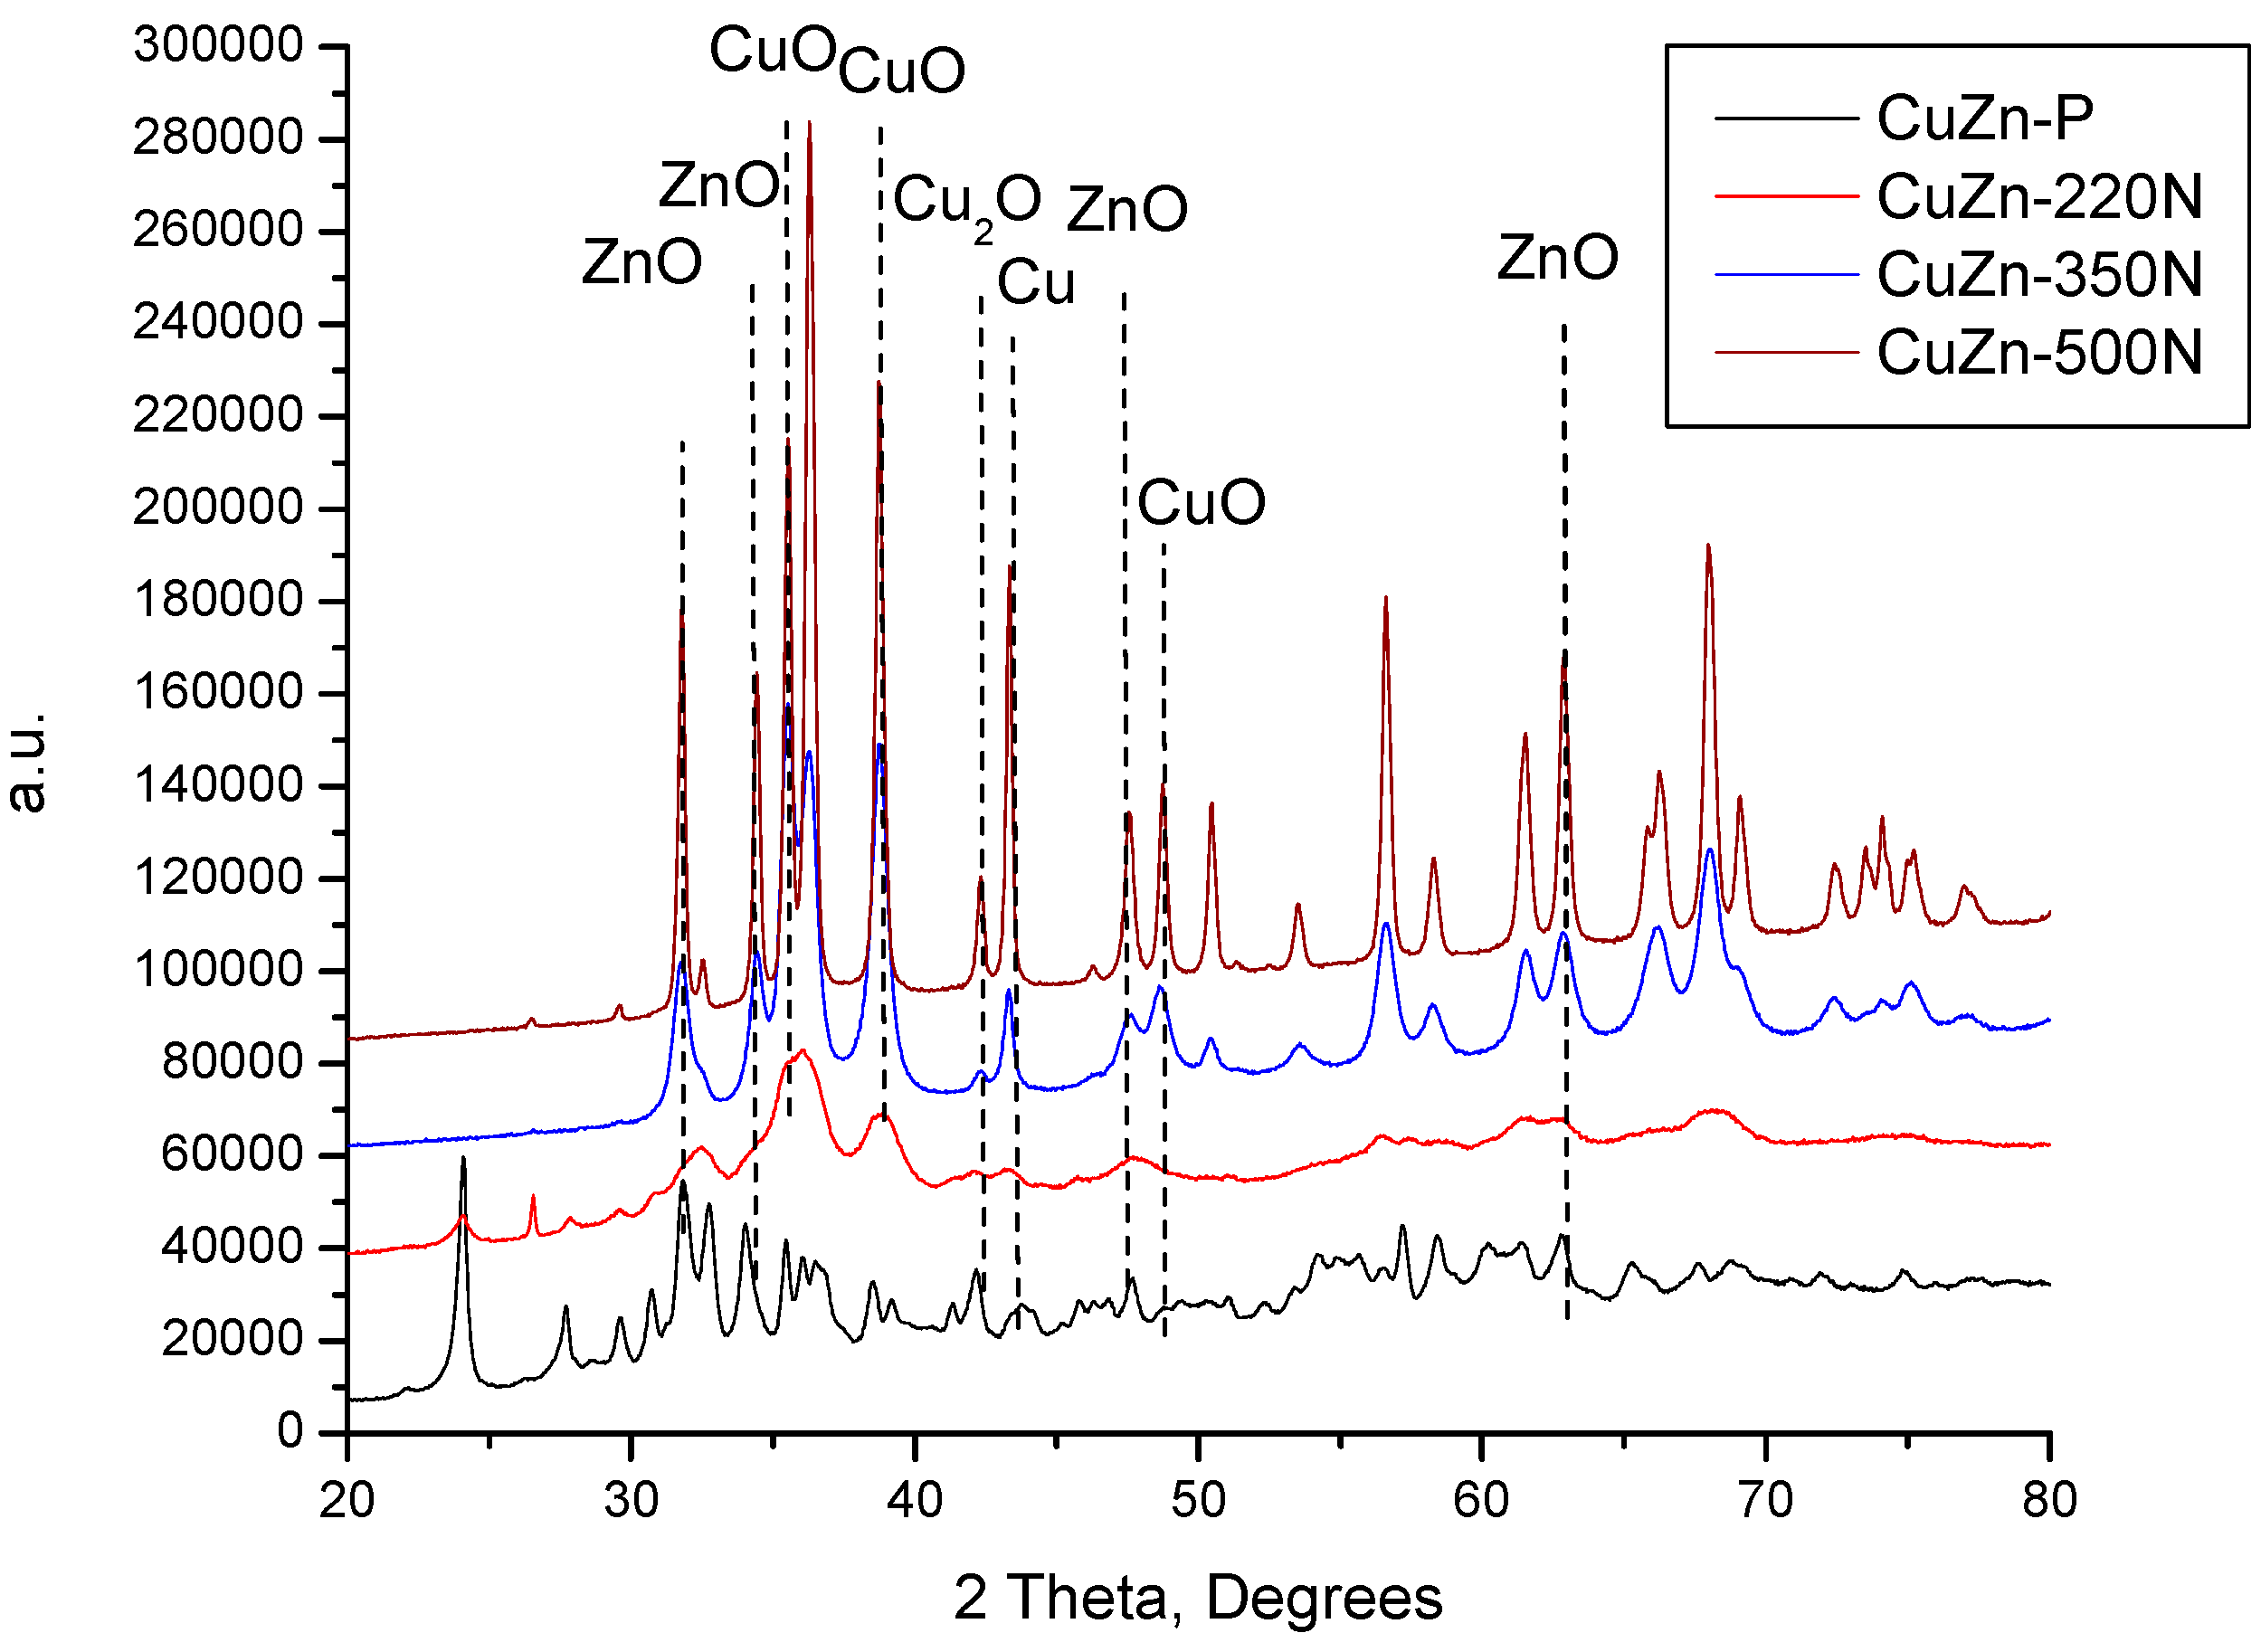
The XRD patterns of the catalysts prepared by calcination in nitrogen again at temperatures 220, 350, and 500 °C were compared with the XRD pattern of the catalyst precursor in
Figure 2. Unlike in the case of treatment in static air at 220 °C, the thermal treatment of the CuZn-P in a nitrogen atmosphere at 220 °C (underflow conditions) resulted in a change in the phase composition of the prepared catalyst sample (CuZn-220N). Although the reflexes of zincian malachite and aurichalcite are still present (
Figure 2), they are accompanied by the reflexes of CuO and ZnO. This evidences that the thermal decomposition of the initial crystalline phases has started under these calcination conditions. This difference can be explained by the different experimental setups, in particular, by the flow conditions or the partial local overheating of the precursor sample inside the autoclave (the sample is in contact with the autoclave wall while the thermocouple measuring the temperature is not). An increase in the treatment temperature to 350 °C resulted in a total disappearance of the reflexes of zincian malachite and aurichalcite accompanied by an increase in the intensity of the reflexes of CuO and ZnO. Additionally, the reflexes belonging to Cu
2O and Cu were identified in the XRD pattern of CuZn-350N as well (
Figure 2). Because of the significant overlapping of the XRD reflexes of the different phases, only several characteristic reflexes are shown in
Figure 2.
The exclusive formation of CuO resulting from the calcination of malachite in air (Equation (1)) and the possible formation of Cu
2O during the calcination of malachite in an inert atmosphere was reported previously [
15]. It was explained by CO
2 decomposition to CO and subsequent reduction of CuO by CO (Equations (2) and (3)) [
16]. The decomposition of both zincian malachite, and aurichalcite in nitrogen, by analogy with malachite, can be expected to yield Cu
2O in addition to CuO. If CuO is reduced by CO originating from CO
2 to Cu
2O, the consecutive reduction step, i.e., the reduction of Cu
2O to Cu, is plausible as well. A further increase in the treatment temperature to 500 °C did not change the phase composition of the catalyst anymore, but the intensity of reflexes of all phases increased substantially due to the increased crystallite size of all phases. With a closer inspection of
Figure 2, it can be established that the intensity of the reflexes corresponding to Cu
2O and Cu increased more than those belonging to CuO and ZnO (
Figure 2).
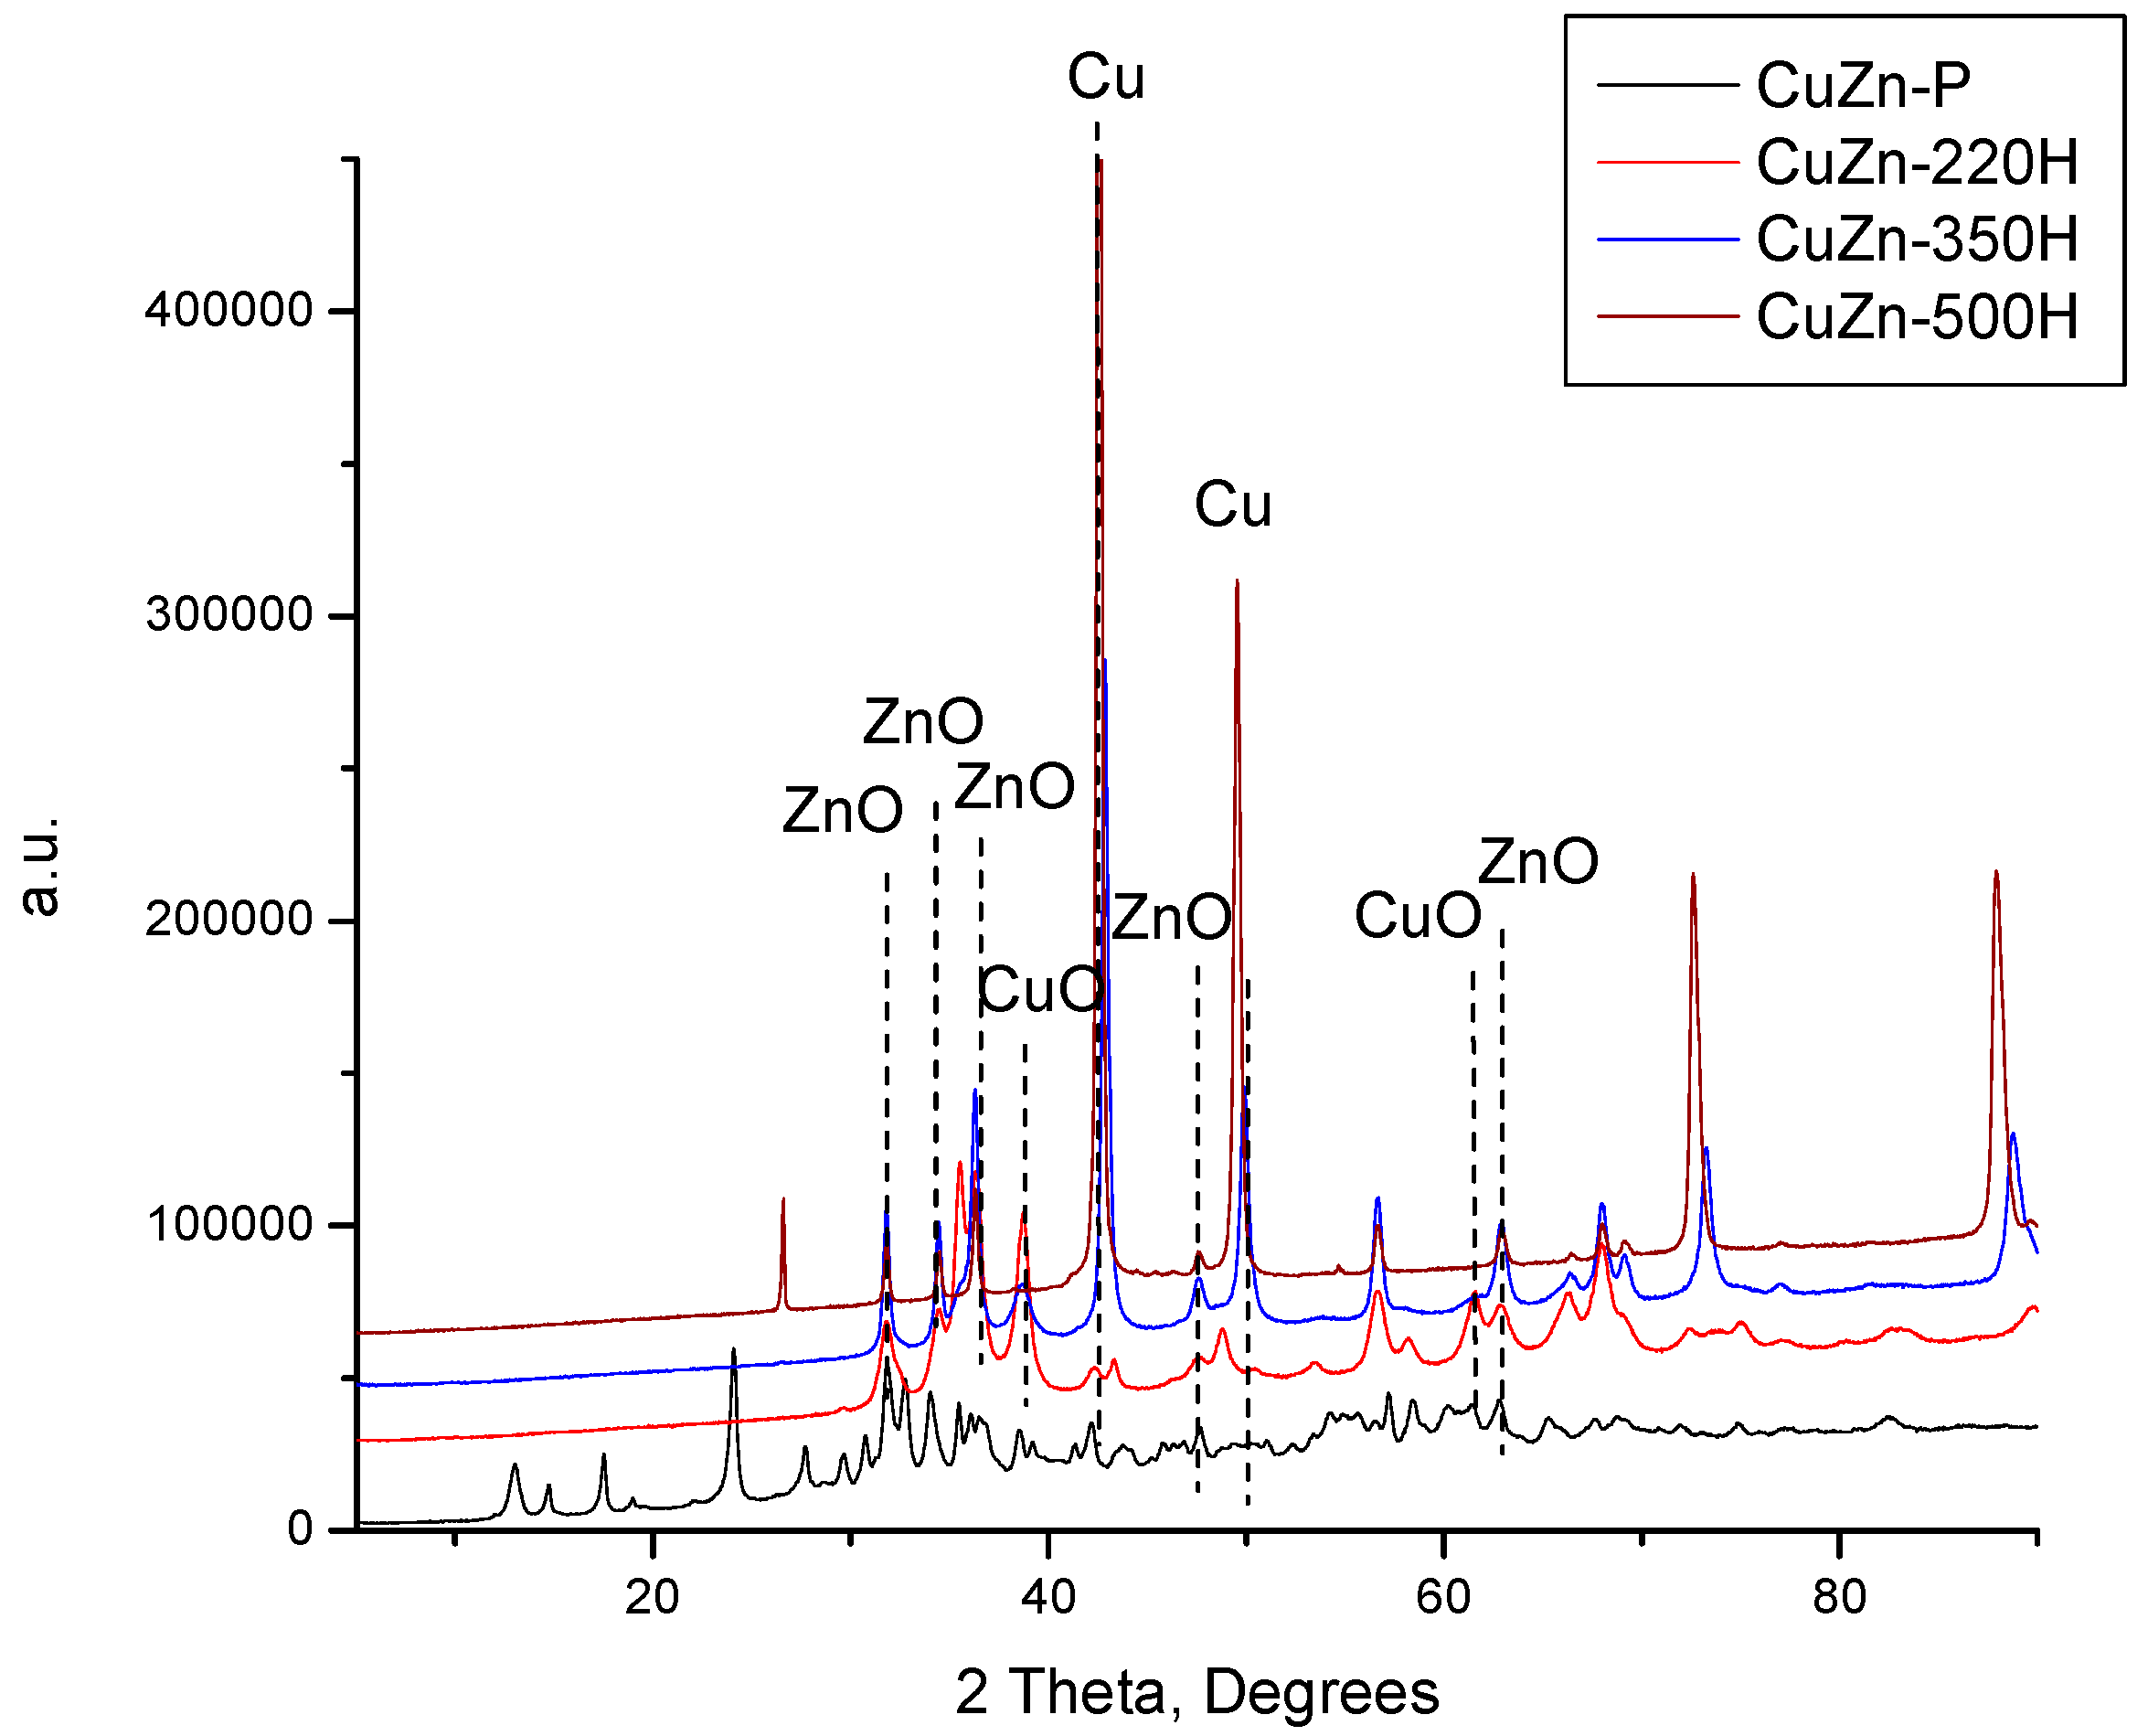
Finally, the catalyst precursor was also treated in flowing hydrogen at 220, 350, and 500 °C. The resulting XRD patterns are shown in
Figure 3 together with the XRD pattern of the catalyst precursor. In contrast to the treatment in air and nitrogen at 220 °C, there are no reflexes of the initial hydroxycarbonate phases in the XRD pattern of the CuZn-220H, i.e., a catalyst obtained by treatment in a hydrogen atmosphere at 220 °C. Instead, low-intensive reflexes of ZnO, CuO, Cu
2O, and Cu appeared (
Figure 3). As the treatment temperature increased from 220 °C to 500 °C, the intensity of the reflexes of the oxidic Cu phases declined while that of the metallic copper substantially increased (
Figure 3). Simultaneously, the intensity of the reflexes of ZnO also increased. This can be attributed to the increase in the crystallite size of ZnO and Cu (discussed below) and to the gradual reduction of the oxidic Cu phases to metallic Cu.
The XRD results demonstrate that 220 °C is a sufficient temperature to completely decompose hydroxycarbonates (zincian malachite and aurichalcite) in a hydrogen atmosphere, but not in air or nitrogen atmospheres. The lowered thermal stability of both hydroxycarbonate phases may be a consequence of a direct reduction of the hydroxycarbonate Cu species in zincian malachite and/or aurichalcite structures according to the proposed overall reaction (Equation (4)). This conclusion is further corroborated by the observed partial destruction of the hydroxycarbonate phase under nitrogen at 220 °C. The partial destruction is caused by the transformation of the inert atmosphere into a partially reducing atmosphere due to the formation of CO during the treatment.
Nevertheless,
Figure 3 also evidences that CuZn-220H still contained CuO in its composition after the calcination step (it can be considered as a reduction step at the same time), which is another distinctive feature of the experiment performed in hydrogen at 220 °C. This is rather unexpected since the reduction of CuO to metallic copper in CuO/γ-Al
2O
3 [
17] or in CuO/ZnO [
11] occurred at temperatures around 200 °C. On the other hand, the reduction of Cu
2+ in bulky CuO was reported to occur at 300 °C [
11]. It was proposed that the low-temperature reduction of CuO to metallic Cu took place for highly dispersed copper oxide species while the bulky CuO was reduced at higher temperatures [
15,
17]. The presence of oxidic Cu species in CuZn-220H allows for the assumption that the treatment conditions considerably influenced the properties (oxidation state, dispersion, etc.) of the Cu atoms in the resulting catalyst sample. Indeed, dedicated experiments showed (
Figure A1) that the treatment of the CuZn-350AS sample (which is a mixture of ZnO and CuO phases; see
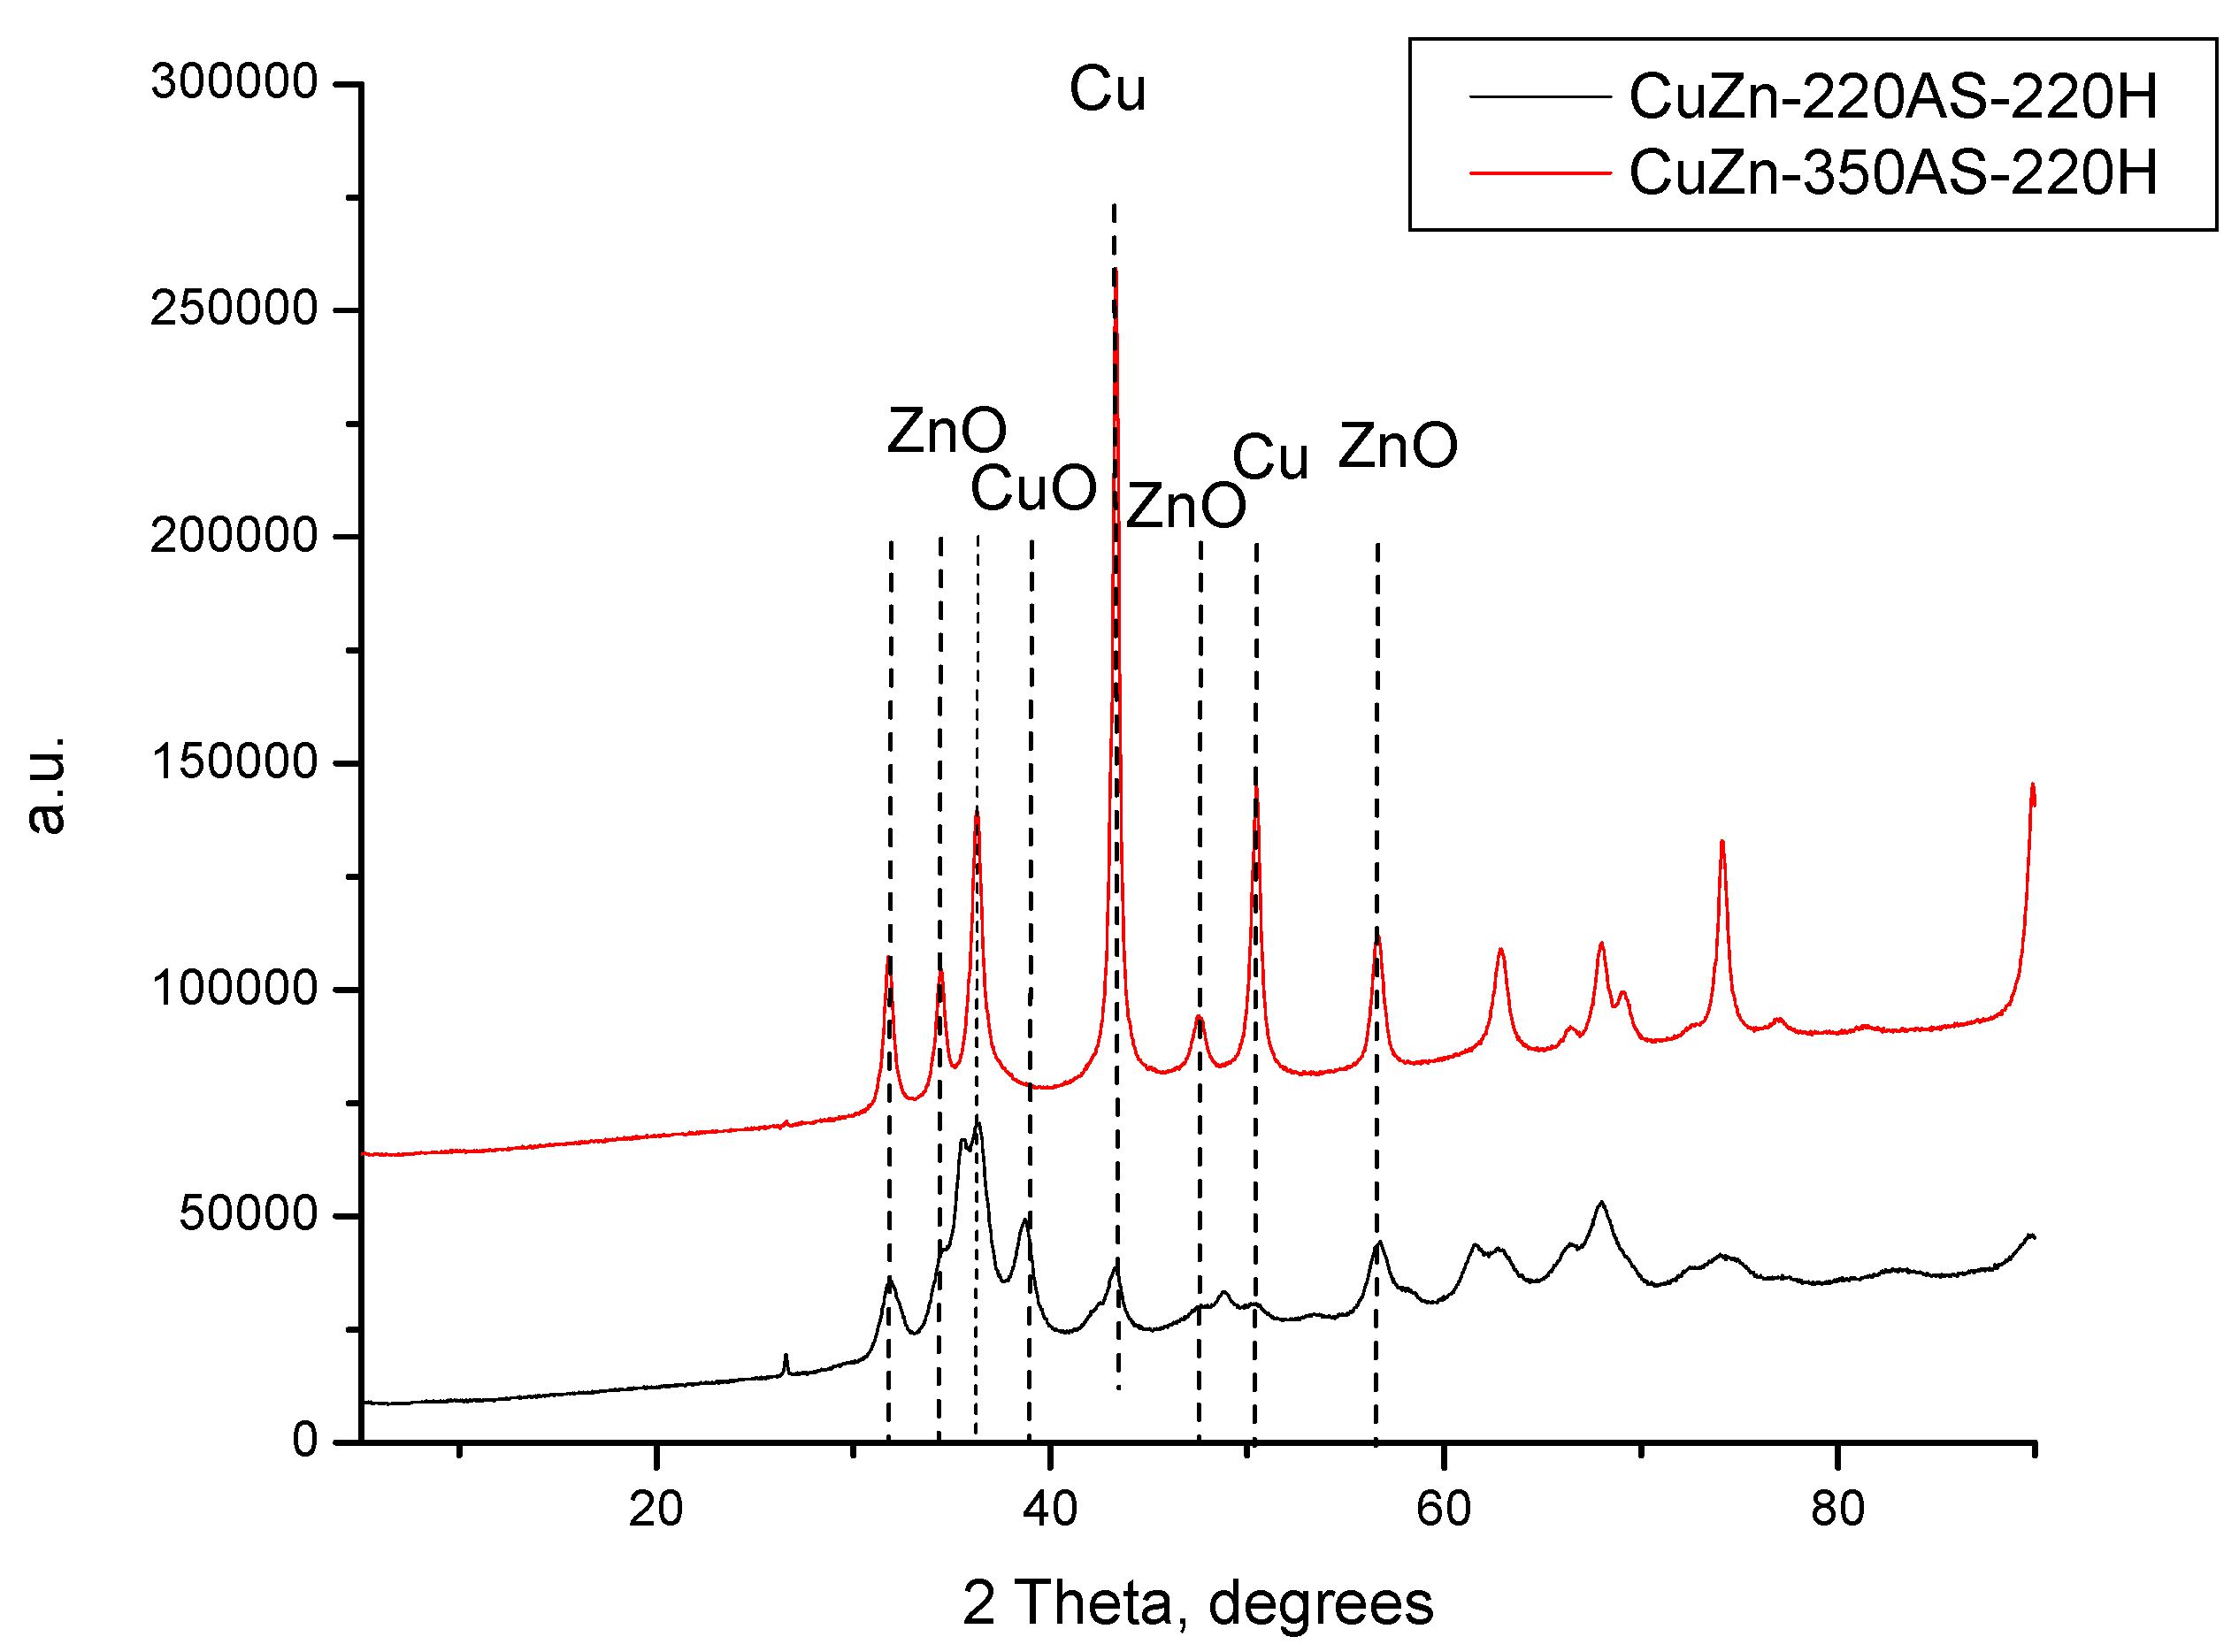
Figure 1) in a hydrogen atmosphere at 220 °C resulted in the total reduction of copper oxide to metallic copper. Moreover, the exclusive presence of the reflexes of metallic copper, i.e., without any oxidic phases detected suggests that these metallic domains are not susceptible to an easy re-oxidation in the air. In contrast, the treatment of CuZn-P firstly in the air at 220 °C (yielding the CuZn-220AS sample) and then in hydrogen at the same temperature (
Figure A1) resulted in the decomposition of zincian malachite and aurichalcite structures. The XRD pattern of CuZn-220AS-220H contained reflexes of CuO together with reflexes of metallic Cu at very low intensities. Thus, the existence of oxidic copper domains in the sample after a reductive treatment at 220 °C is undoubtedly a consequence of the sample preparation under specific conditions and their sequence.
The collected XRD patterns allowed for the calculation of the crystallite size of all phases detected in the catalysts using the Scherrer equation [
18]. The sizes of the crystallites of zinc and copper compounds were calculated from the width of the corresponding diffraction lines that did not overlap with the lines belonging to other phases. As expected, the crystallite size depended on the pretreatment temperature and, more interestingly, on the calcination atmosphere (
Table 1).
Due to the increasing pretreatment temperature in static air from 350 °C to 500 °C, the size of the ZnO and CuO crystallites increased from 5.1 nm and 7.7 nm to 15.8 and 11.9 nm, correspondingly. When the pretreatment was performed in a non-oxidizing atmosphere, either in nitrogen or in hydrogen, the size of the produced oxidic particles was larger compared to the corresponding experiments in static air (
Table 1). Moreover, at a given temperature, the size of ZnO crystallites was larger in the catalysts prepared by calcination in nitrogen or hydrogen in comparison with those prepared in air (
Table 1). This allows for the suggestion of a mutual stabilization of the CuO and ZnO domains if these are in intimate contact with each other. This conclusion is further supported by the larger size of the Cu crystallites obtained by direct reduction (calcination in hydrogen) than those obtained by calcination in air followed by reduction at 220 °C (
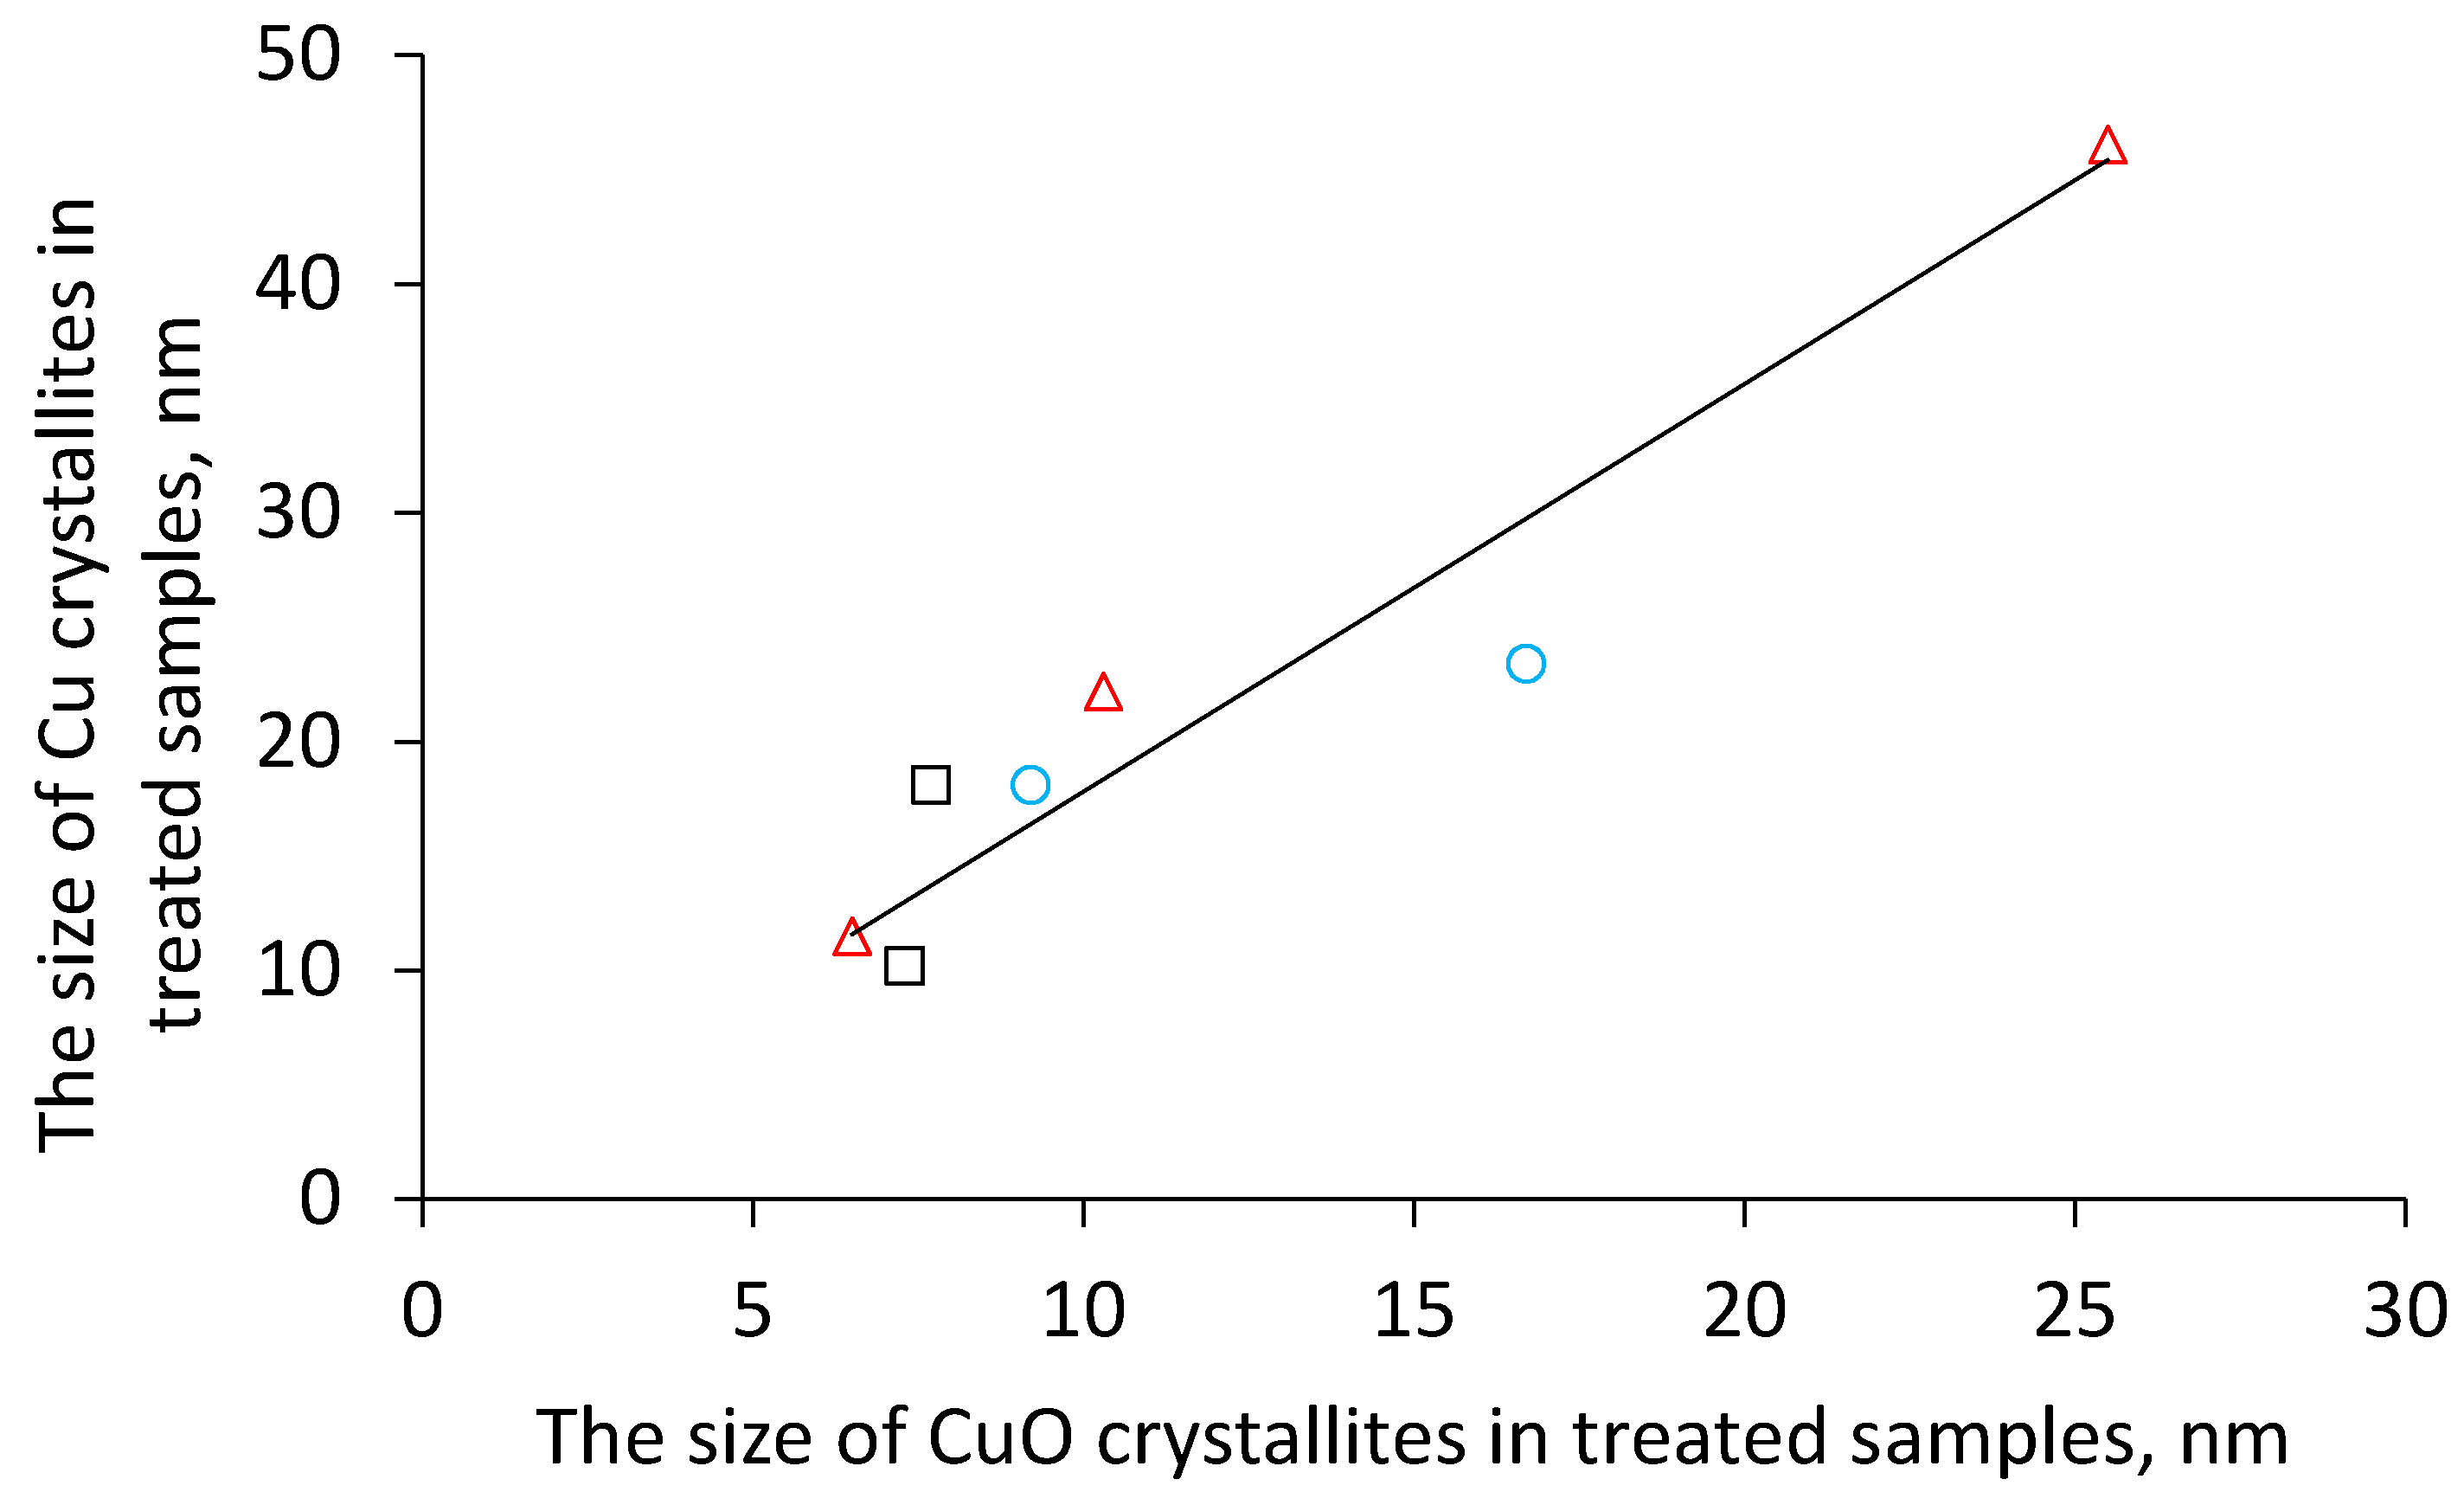
Table 1). In addition, the size of metallic copper increased in comparison with the size of its oxidic precursors which indicates copper sintering during the reduction step. It is interesting to note that (i) the catalysts reduced after previous calcination in air, (ii) catalysts obtained by calcination in nitrogen (copper formed due to reduction by in-situ formed CO) and (iii) catalysts prepared by calcination in hydrogen (i.e., by direct reduction) exhibit a common linear dependency between the CuO crystallite size and the resulting Cu crystallite size (
Figure 4). This might indicate that Cu is formed during the calcination of the hydroxycarbonate precursors either via CuO or that the formation of both crystallites is related in another way.
The calcination atmosphere and temperature significantly affected the textural properties of the final catalysts. The results are summarized in
Table 2. Among the samples calcined in air, CuZn-350AS possessed the best textural properties with respect to the BET surface, the external surface, pore volume, and average nanoparticle size. The CuZn-220AS had only slightly worse parameters compared to CuZn-350AS despite their substantially different phase composition. This could be attributed to the fact that CuZn-220AS was a mixture of hydroxycarbonates rather than of oxides. The increase in the calcination temperature to 500 °C resulted in a dramatic decrease in the textural properties of CuZn-500AS. On the other hand, the trend in the change in all characteristics observed for the samples prepared in nitrogen and hydrogen is more unambiguous. The BET surface, the external surface, and the pore volume substantially decreased while the average nanoparticle size, accordingly, increased with the increasing calcination temperature. It should also be noted that the samples prepared in hydrogen had worse adsorption characteristics, except for the micropore surface, compared with the similar samples prepared in nitrogen. Besides,
Table 2 evidences that the pore diameter of differently prepared catalysts was approximately the same in the range of 13–39 nm and showed no dependence on either the atmosphere or calcination temperature.
2.2. Activity and Selectivity of the Catalysts
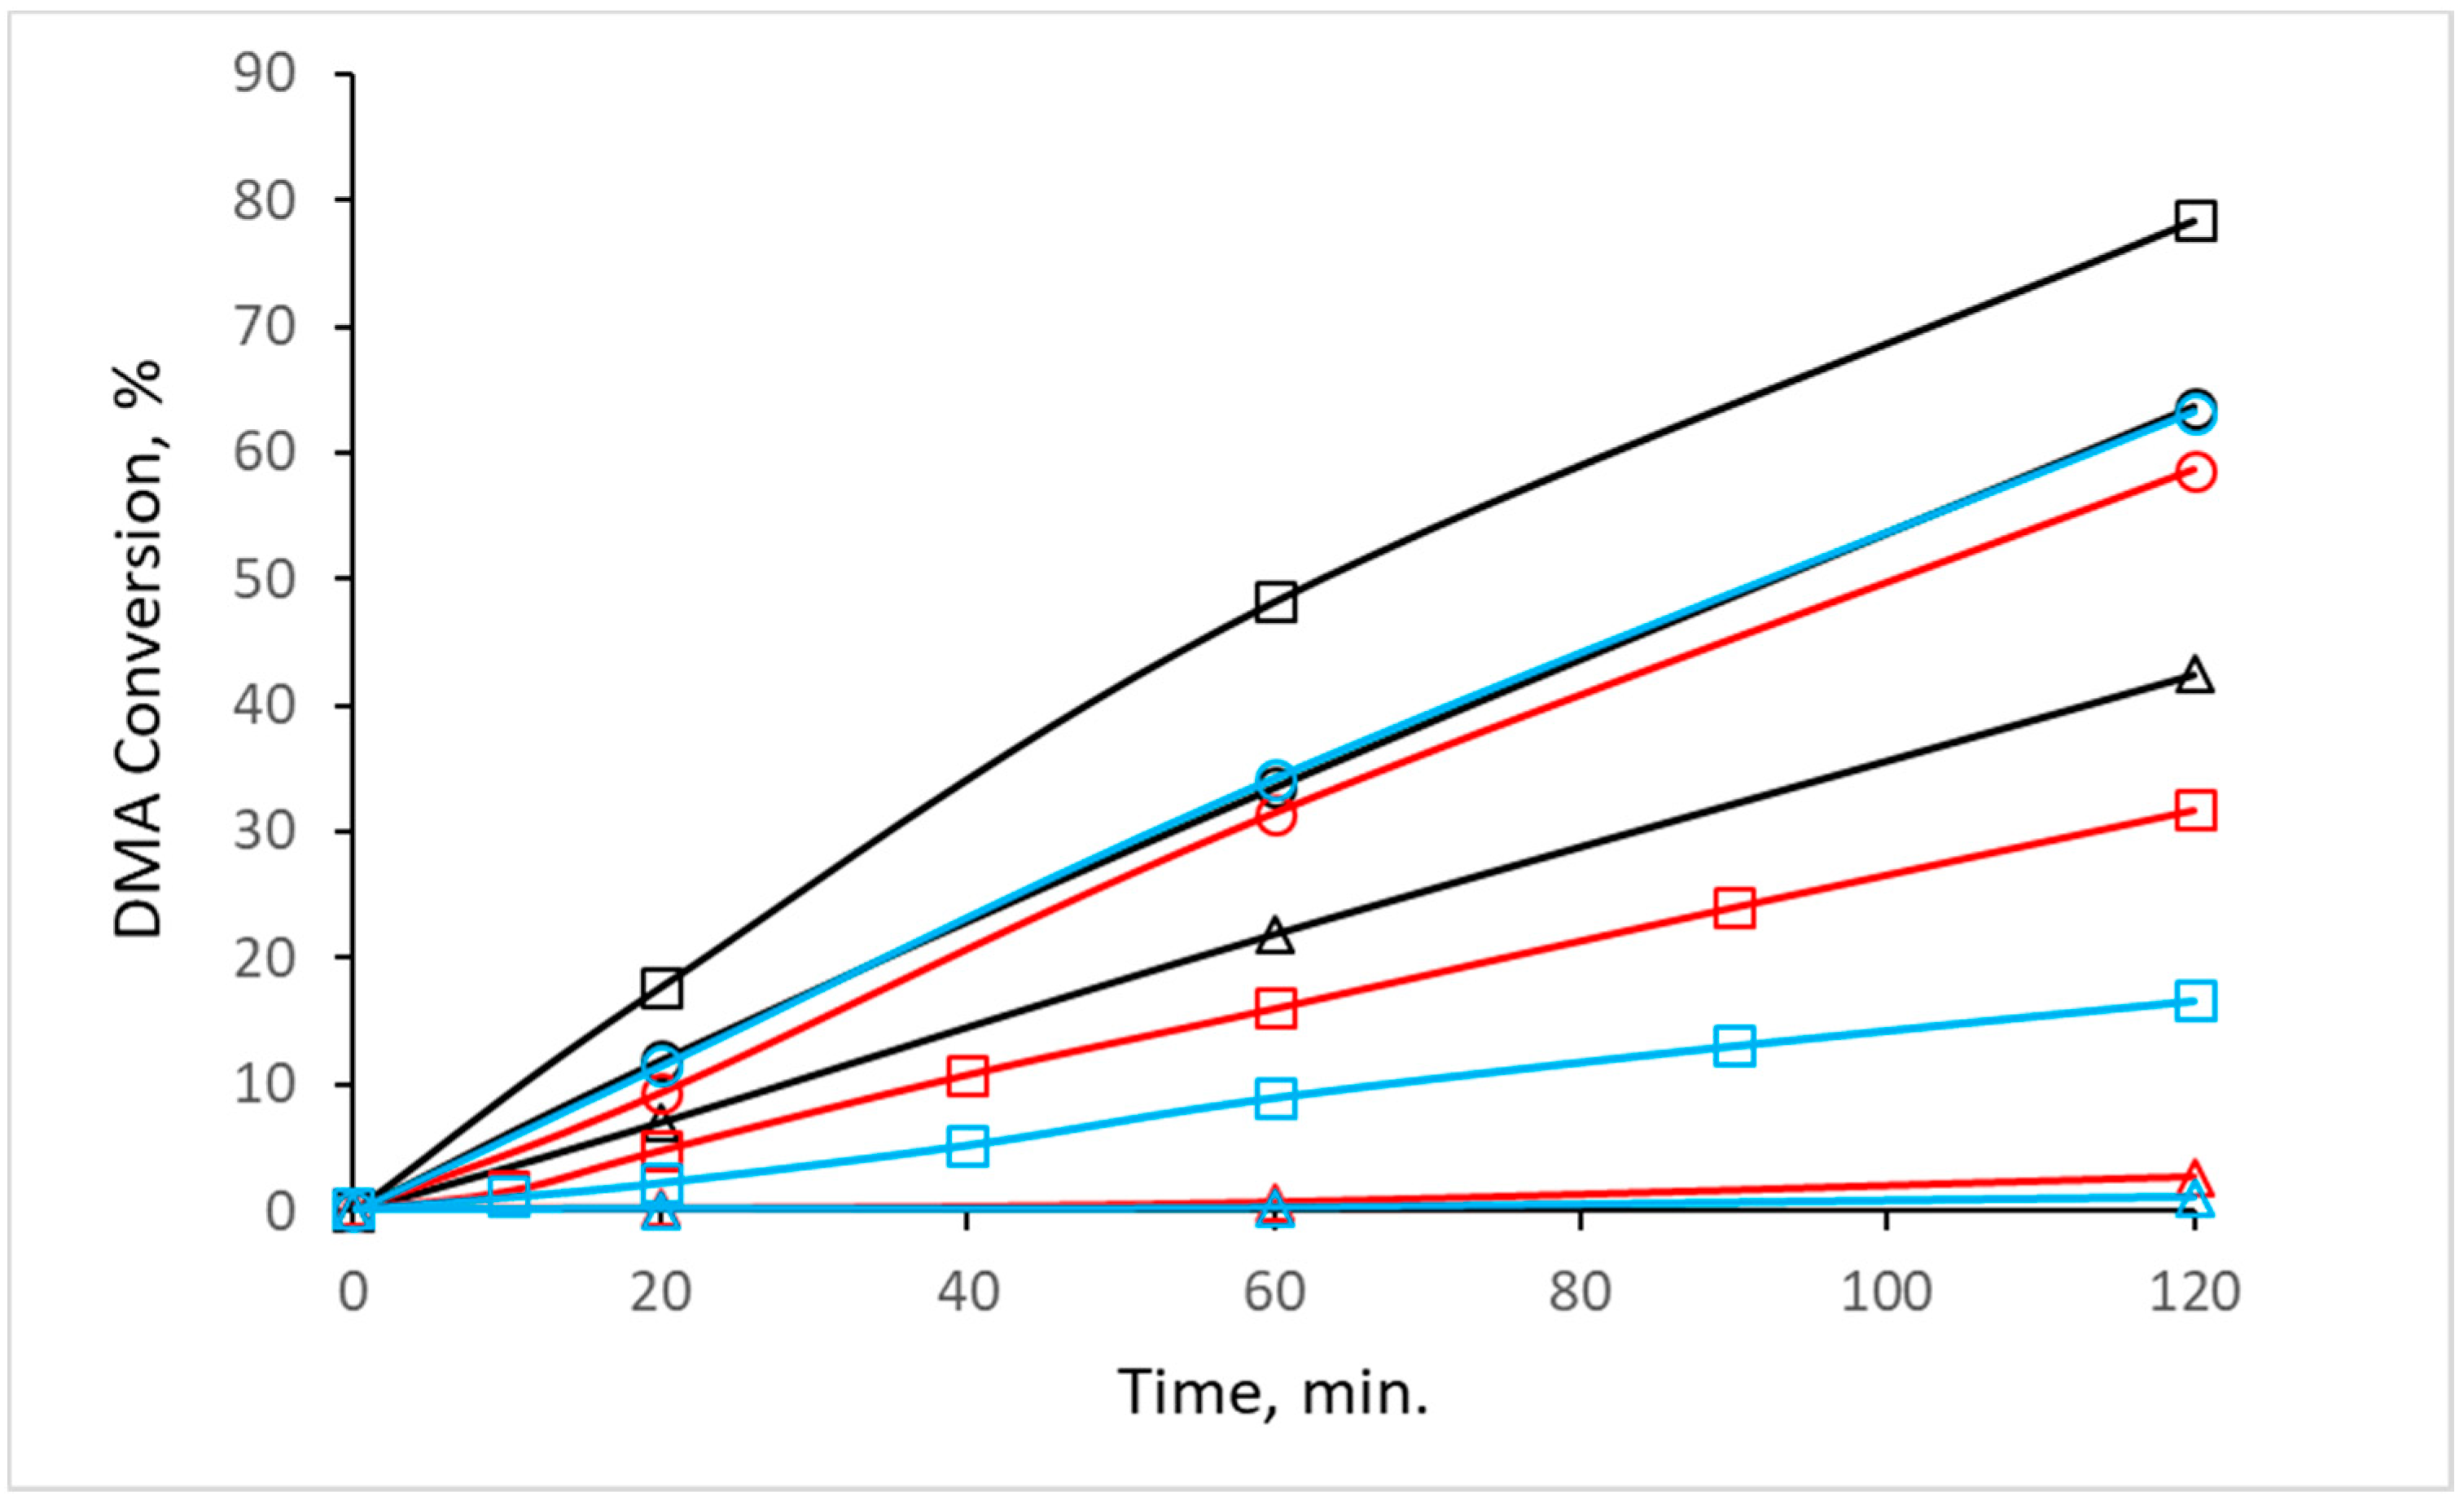
Figure 5 depicts the dependency of the DMA conversion on the pretreatment conditions (i.e., different calcination atmosphere and temperature) applied to the synthesized CuZn-P precursor. CuZn-220AS prepared by a mild heating in static air possessed a reasonable activity in the reaction with DMA; the DMA conversion reached 64% after 2 h. When the calcination temperature was increased to 350 °C, the catalytic performance of the catalyst further improved; the DMA conversion amounted to 78% after 2 h (
Figure 5). The observed increase is in agreement with the improvement in the textural properties of CuZn-220AS and CuZn-350 AS (
Table 2). Additionally, the phase composition of the calcined catalysts after reduction has to be considered as well. The catalyst CuZn-220AS, if exposed to hydrogen at 220 °C for 2 h, still contained Cu in the oxidic state (
Figure 4, sample CuZn-220AS-220H). On the other hand, the XRD pattern of this catalyst after the reaction (will be discussed further) revealed the presence of only metallic Cu clusters. This suggests the occurrence of a subsequent reduction of the oxidic Cu species during the reaction. In contrast, the catalyst CuZn-350AS exclusively contained metallic Cu clusters after the reduction step, so no additional activation during the reaction was necessary. This difference in the state of Cu in the catalysts, although inexplicable at the moment, could explain the difference in the catalytic performance of CuZn-220AS and CuZn-350AS together with their different textural properties. A further increase in the calcination temperature in air to 500 °C resulted in a decrease in the activity of the catalyst CuZn-500AS with the DMA conversion of 43% after 2 h (
Figure 5).
The observed decrease in conversion can be attributed to the increase in the size of the copper crystallites determined from the XRD patterns (
Table 1). The increase in the calcination temperature caused an increase in the size of copper crystallites leading to a decrease in the number of available catalytically active centers. A similar dependence of the catalytic performance of Cu-containing catalysts on the particle size of copper being influenced by the calcination temperature was also reported for the hydrogenolysis of ethyl acetate to ethanol [
4]. In contrast, Peng Yuan et al. [
5] observed an increase in the DMA conversion over a Cu–Zn–Al catalyst as the calcination temperature was increased from 400 °C to 500 °C.
The catalysts prepared by calcination in nitrogen and hydrogen also showed a trend of decreasing the DMA conversion with the increasing calcination temperature. For CuZn catalysts prepared by calcination in nitrogen, the DMA dropped significantly (from 59 to 3%) when the calcination temperature was increased from 220 °C to 500 °C (
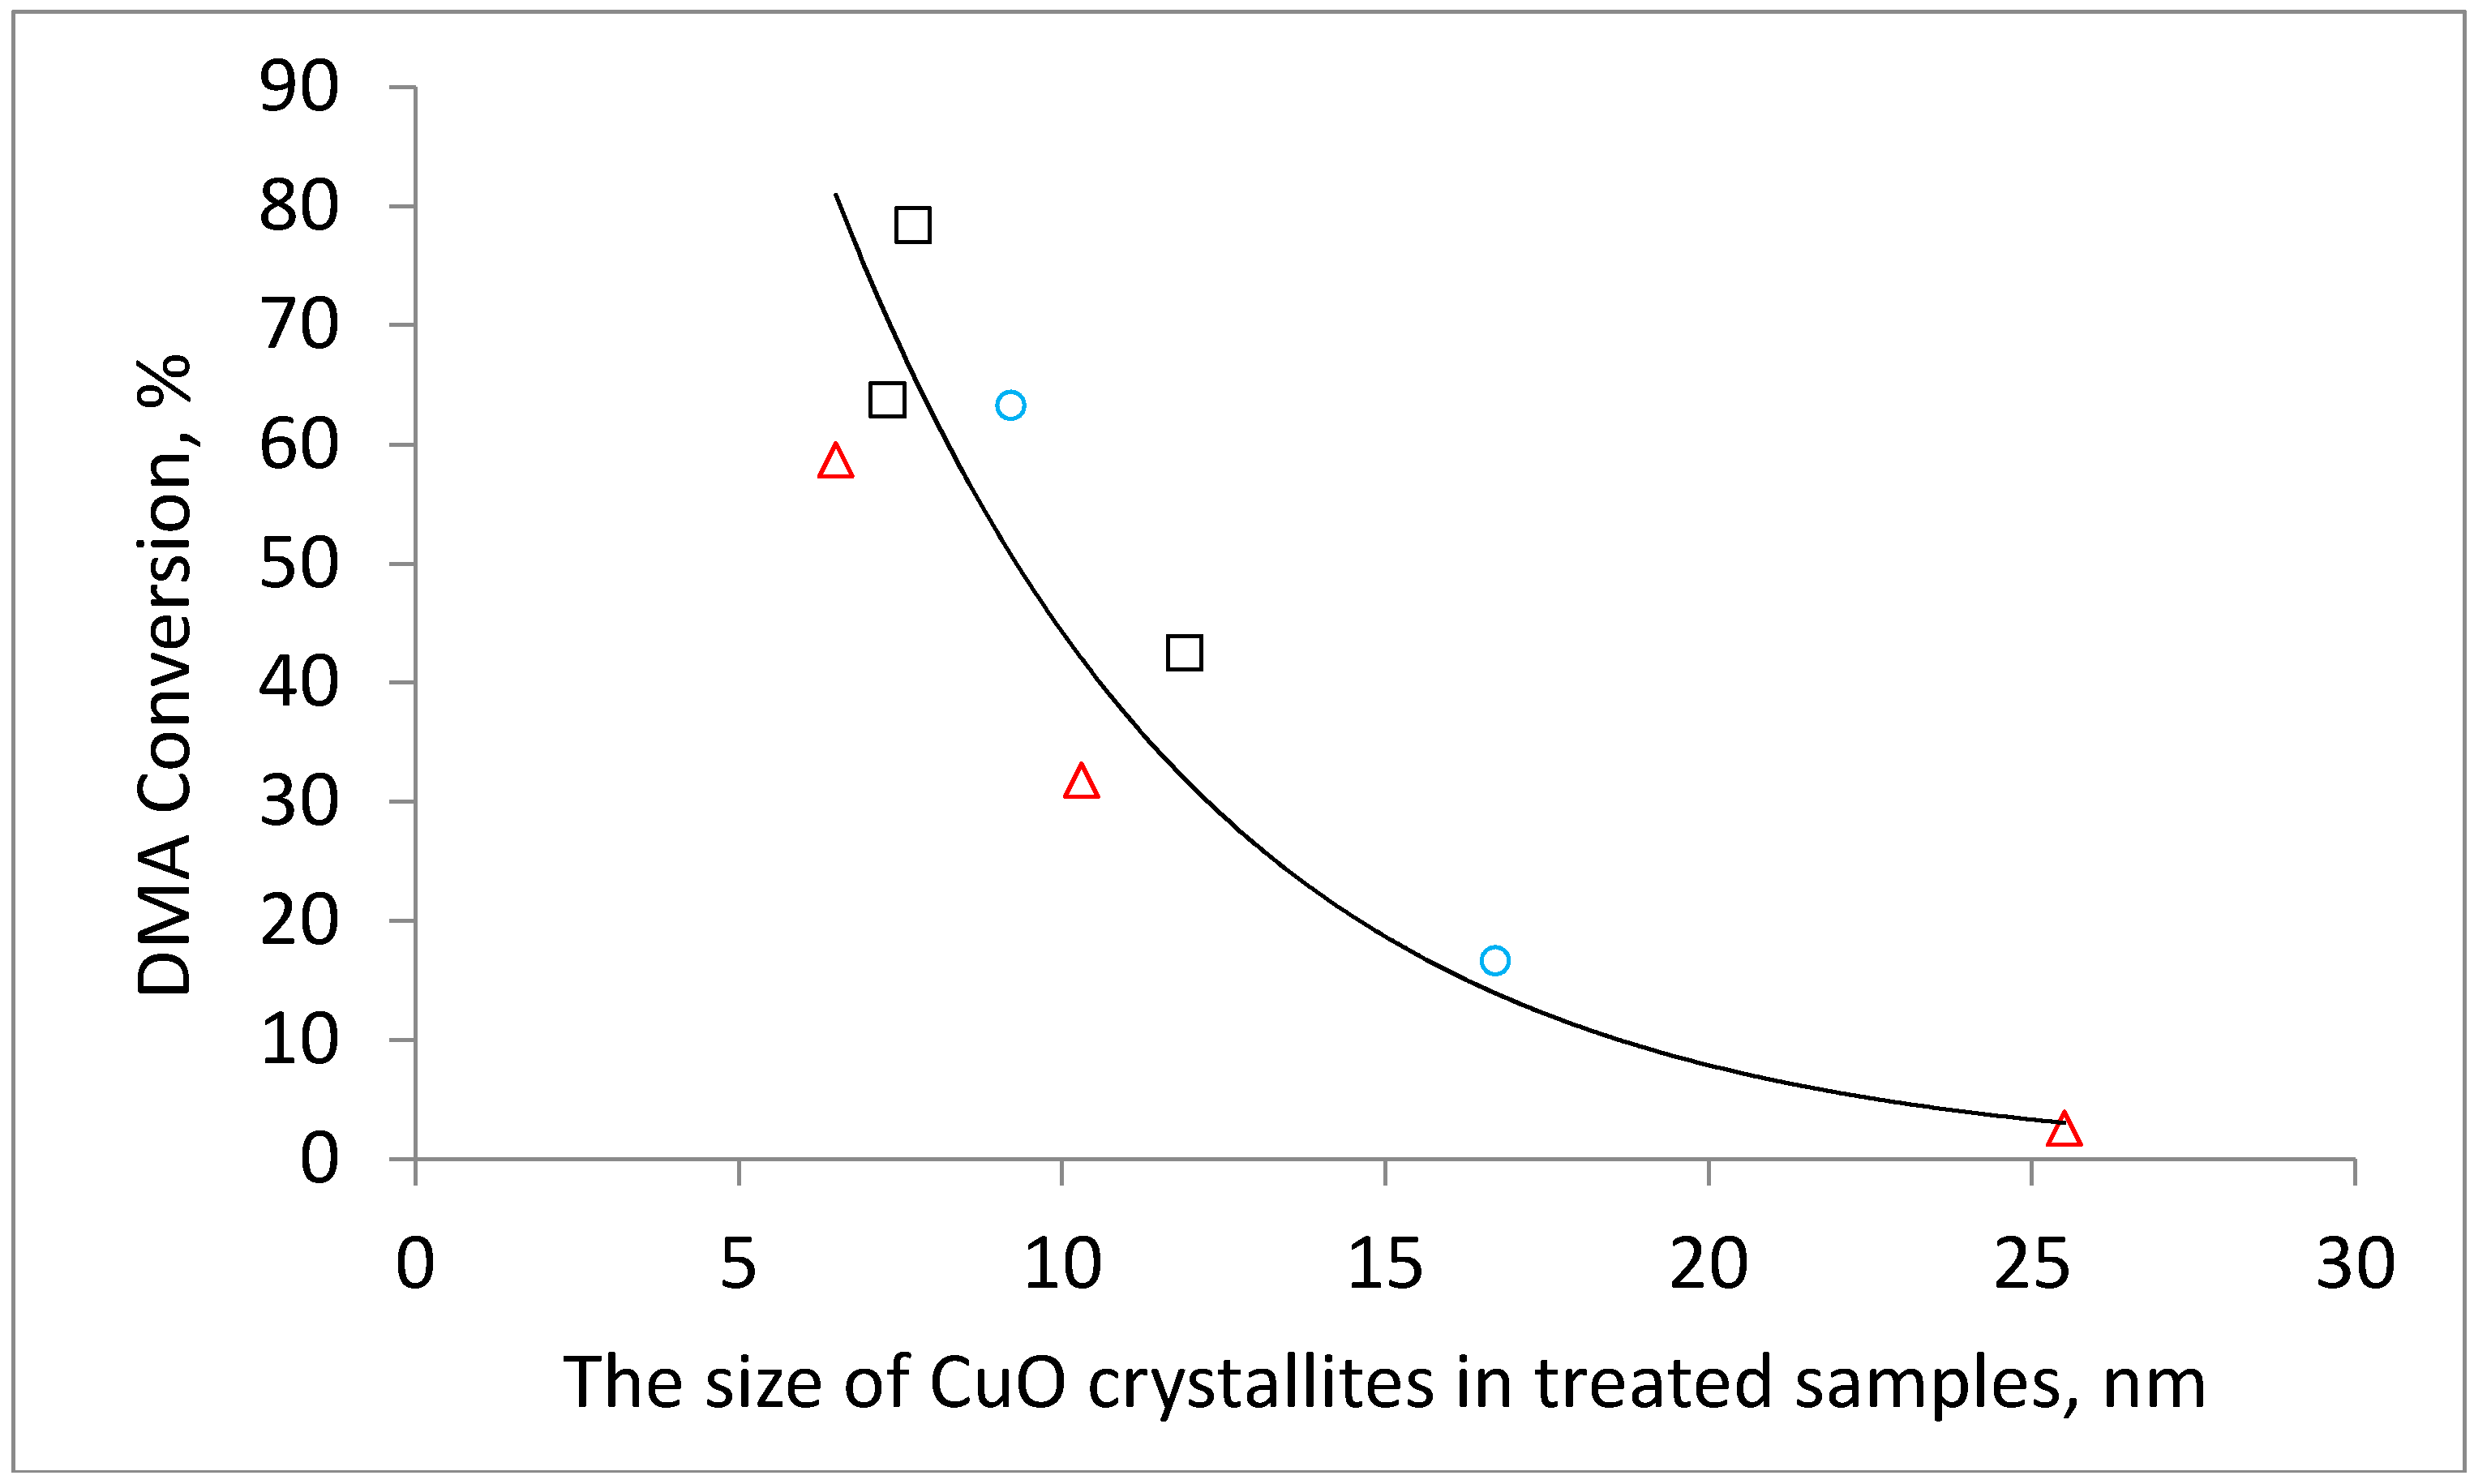
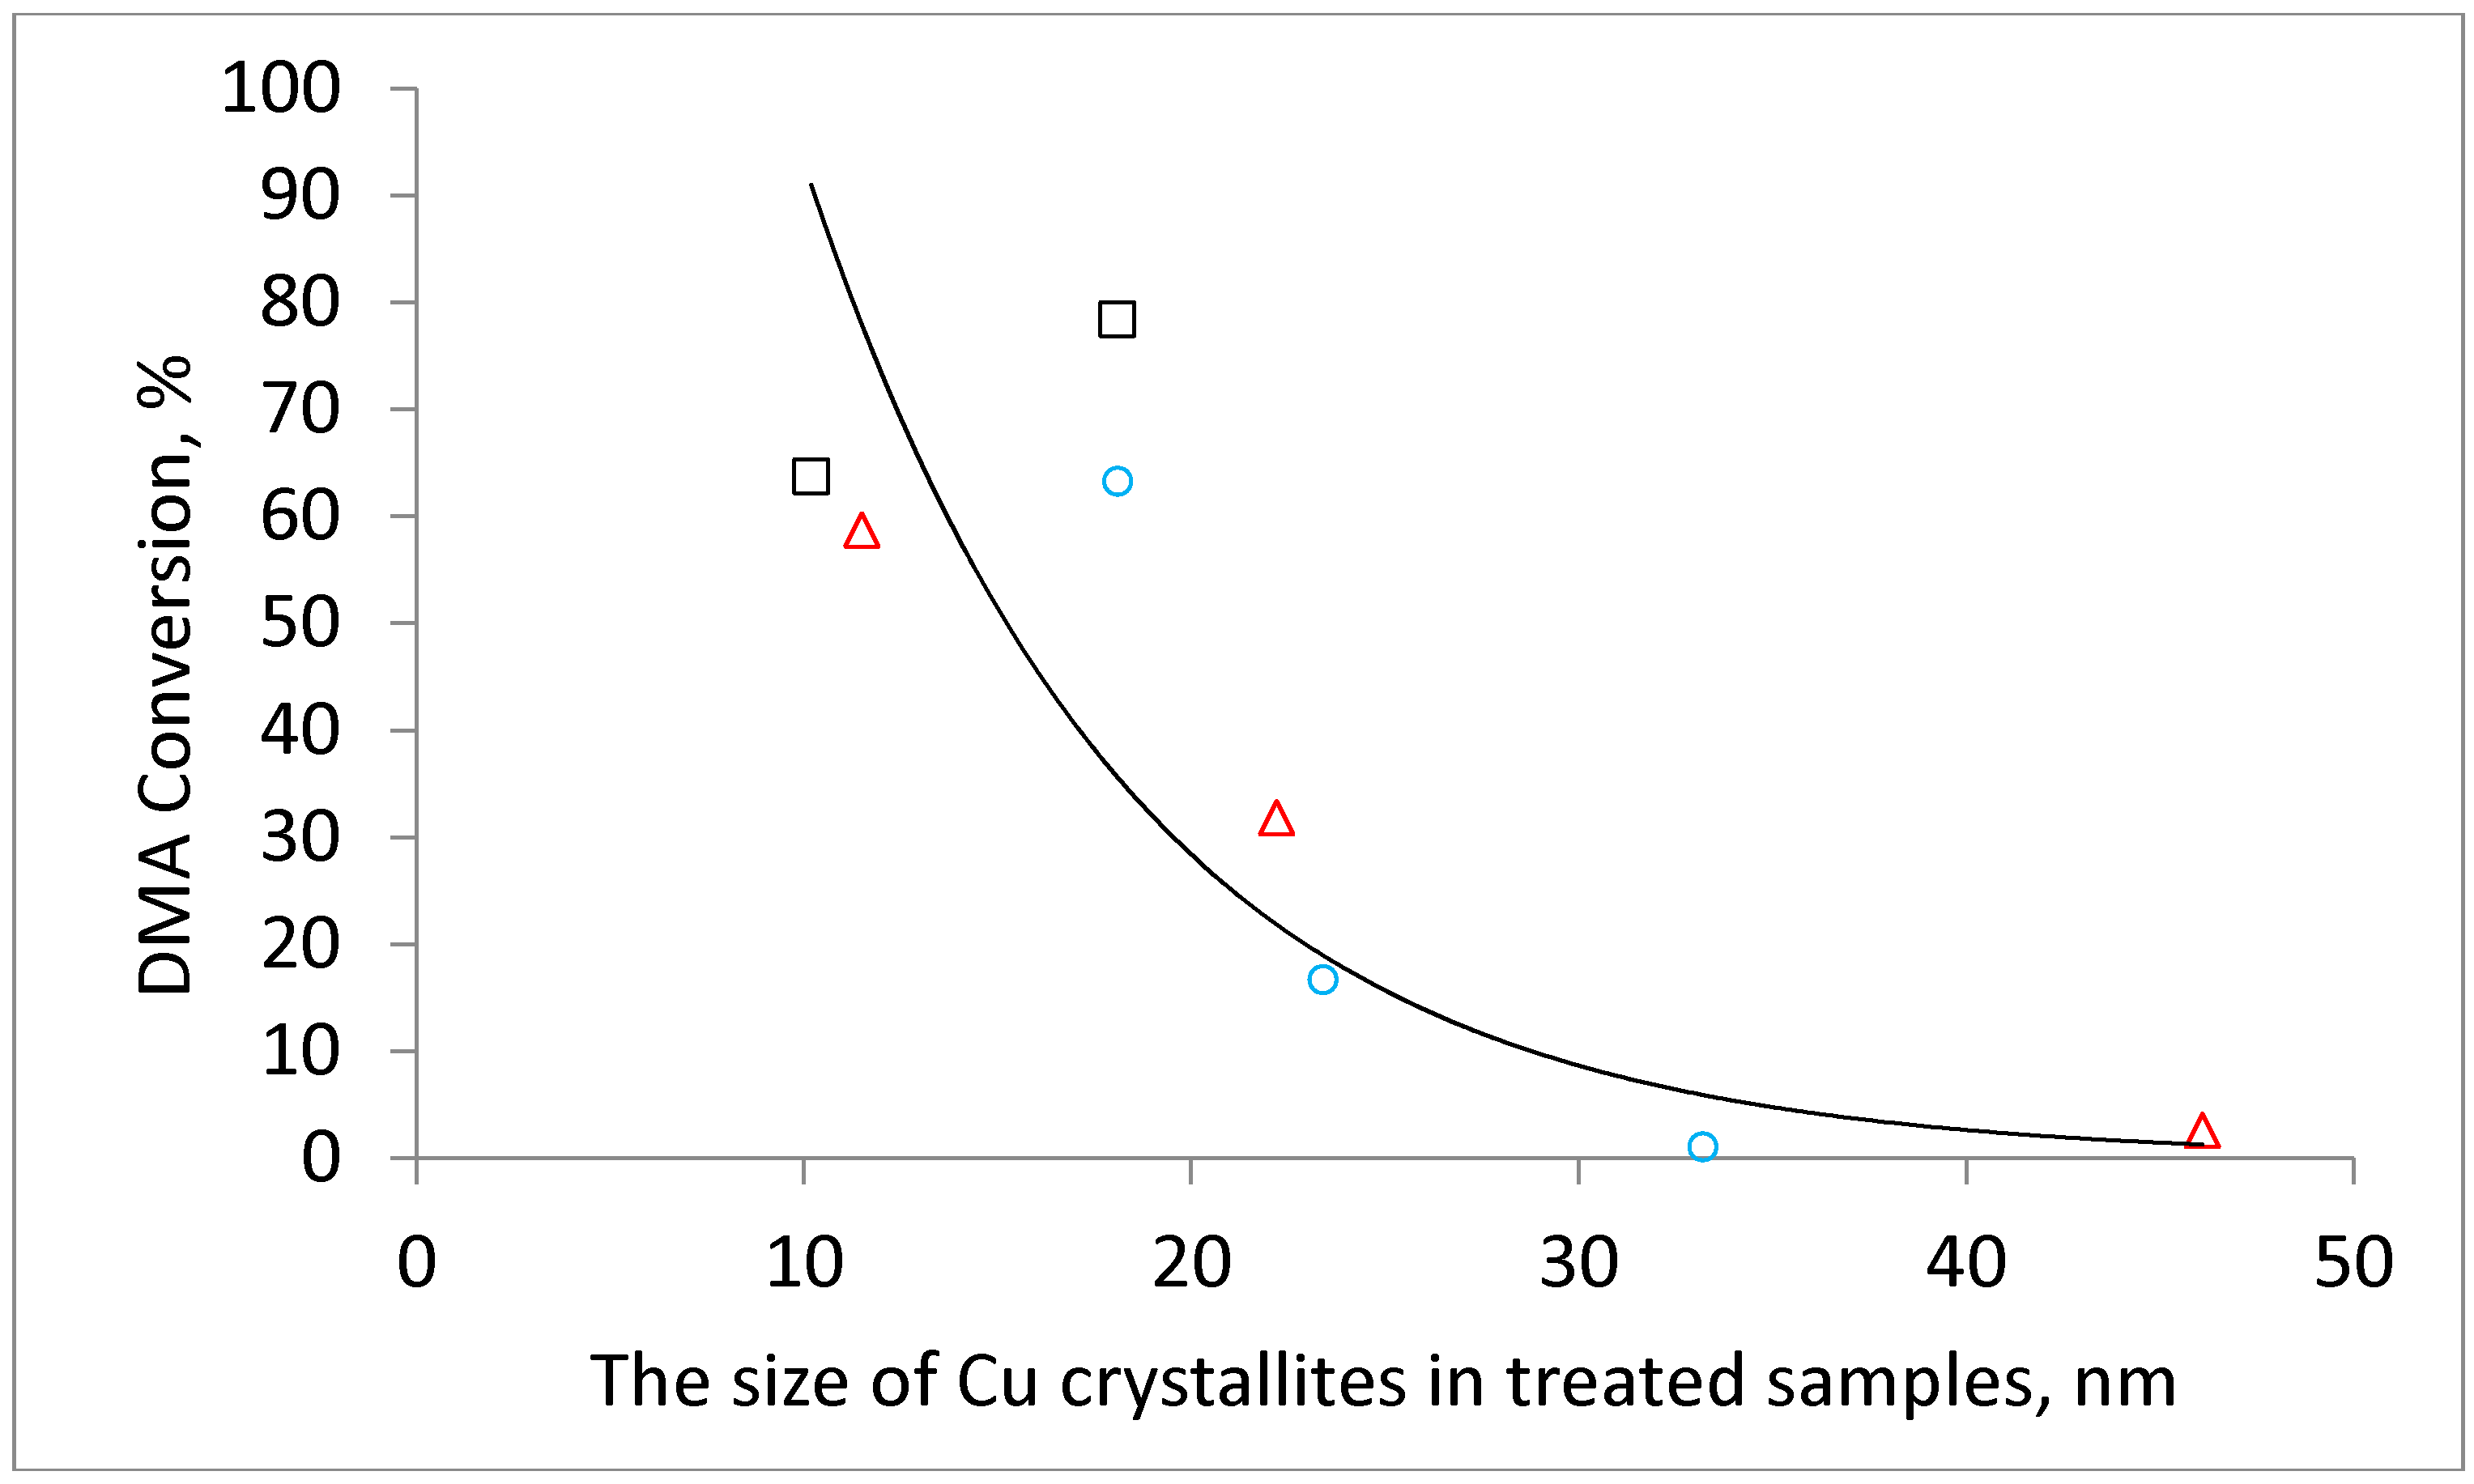
Figure 5). The effect of the hydrogen calcination atmosphere was even more pronounced. The DMA conversion decreased from 63% to a negligible 1% when the calcination temperature was increased from 220 °C to 500 °C. The physicochemical characterization of the catalysts allows the attributing of this behavior to the increase in the Cu crystallite size with increasing calcination temperature and to the worse textural properties of catalysts prepared by calcination at high temperatures. The dependence of the conversion on crystallite size is obvious when the DMA conversion is plotted as a function of CuO or Cu crystallites (
Figure 6 and
Figure A2).
The observed correlation between the catalytic performance of CuZn catalysts prepared in the present study and the size of the Cu domains can be expected since the performance of the Cu-containing catalysts in different reactions has been repeatedly shown to depend on copper particle size [
5,
11,
17]. Nevertheless, the treatment of the starting precursor in air, on the one hand, and in nitrogen or hydrogen, on the other hand, introduces some unique (previously not described) features to the performance of the CuZn hydrogenolysis catalyst. Regardless of the atmosphere used, all catalysts which were thermally treated at 220 °C exhibited approximately the same catalytic activity. The DMA conversion was in the range 59–64% (
Figure 5) despite their phase composition after calcination differing significantly (
Table 1). Moreover, the comparison of catalytic results with the physicochemical properties of the prepared catalysts exhibits no clear correlation between the catalytic performance of the catalysts and their textural properties.
On the other hand, catalytic results suggest that the high DMA conversion over catalysts prepared at 220 °C is observed provided that the samples possess small-size copper crystallites (
Table 1). An increase in the calcination temperature to 350 °C resulted in an increase in the DMA conversion to 78% for CuZn-350AS while the activity of CuZn-350N and CuZn350H markedly decreased. According to XRD, CuZn-350AS represents a mixture of ZnO and CuO whereas the other samples contain notable amounts of Cu
2O and Cu besides CuO and ZnO. The crystallite size of Cu
2O and Cu is significantly larger than that of CuO and ZnO and they are plausibly present as separate phases that are not in intimate contact with the ZnO phase. This difference in the phase composition of the samples allows for the suggestion that an intimate contact between the CuO and ZnO crystallites because of the thermal treatment could be an important factor that stabilizes the small size of the Cu domains. Consequently, a high activity of CuZn catalysts is achieved. When calcining in air, the increase in the calcination temperature from 220 °C to 350 °C resulted in a complete destruction of the zincian malachite and aurichalcite structures. This led to an increased number of CuO and ZnO crystallites, thus, promoting the probability of close contact between the two phases. Additionally, the very small size of ZnO crystallites (
Table 1) could also contribute to the high dispersion of the CuO domains. In contrast, the presence of the Cu
2O and Cu crystallites in samples prepared in N
2 and H
2 reduced the probability of the necessary interaction between CuO and ZnO. As a result, the number of potentially active sites formed on the interface between the CuO and ZnO domains after the reduction differs for catalysts prepared by the calcination in different atmospheres. Additionally, the existence of the said interfaces contributes to the stabilization of the Cu crystallites in ZnO surroundings. As a result, CuZn-350AS has a higher BET surface area, external surface, and pore volume with lower crystallites size values than CuZn-350N and CuZn-350H. As can be deduced from
Table 1, the absence of intimate CuO-ZnO contact resulted in a more facile sintering of both the Cu and Zn domains at elevated temperatures. Consequently, the DMA conversion over CuZn-350AS was the highest among all catalysts (78%), while the DMA conversion observed over CuZn-350N and CuZn-350H was much lower, i.e., 32% and 17%, respectively. The significantly lower conversion over CuZn-350H in comparison with CuZn-350N is the consequence of a more extensive reduction of CuZn-350H during calcination and, hence, the lower probability to stabilize the CuO domains by intimate contact with ZnO. Consequently, the CuO and ZnO crystallites are approximately 17–20 nm large in CuZn-350H whereas only 10–11 nm in CuZn-350N (
Table 1).
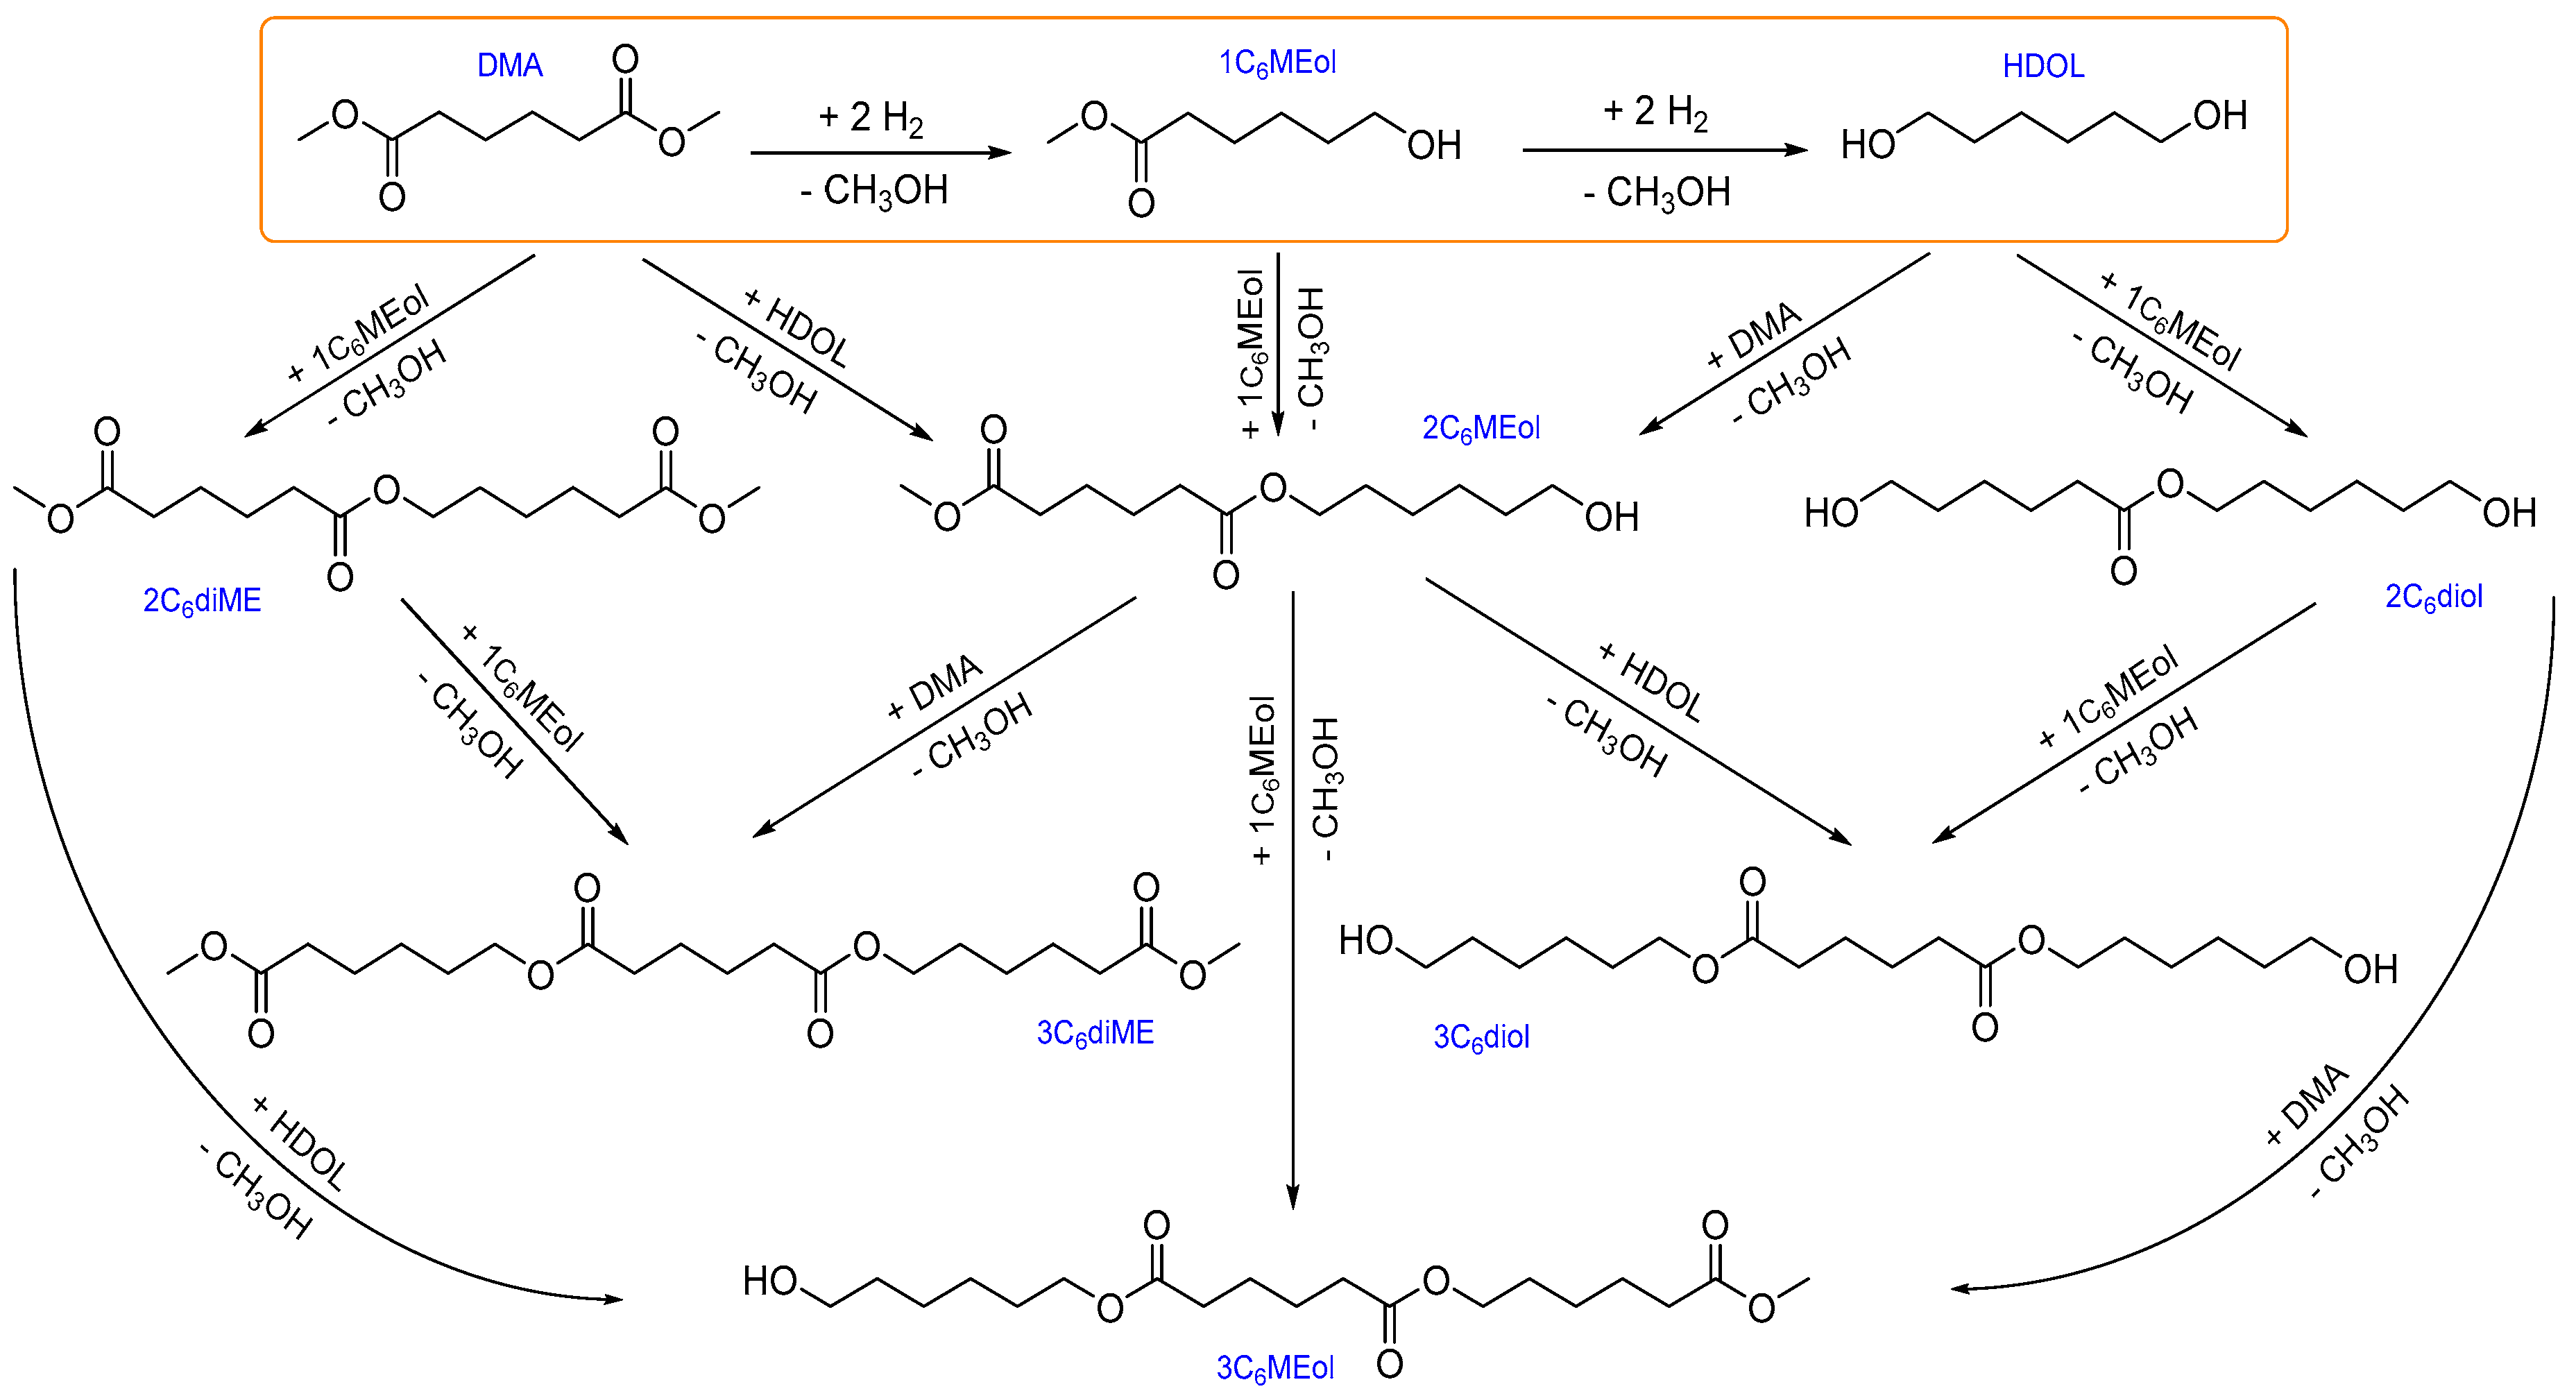
As reported previously [
6], CuZn catalysts catalyze not only hydrogenolysis, but higher-molecular-weight products originating from transesterification reactions between DMA, 1,6-hexanediol (1,6-HDO), and partially hydrogenolyzed DMA (1HMEol) are also formed. These transesterification products consist of products with two C
6 backbones in their molecules (denoted H2) or with three C
6 backbones in their molecules (denoted H3). Thus, the selectivity to and yields of different products allow for obtaining additional important information on the performance of catalysts particularly with respect to the origins of the transesterification activity of the CuZn catalysts.
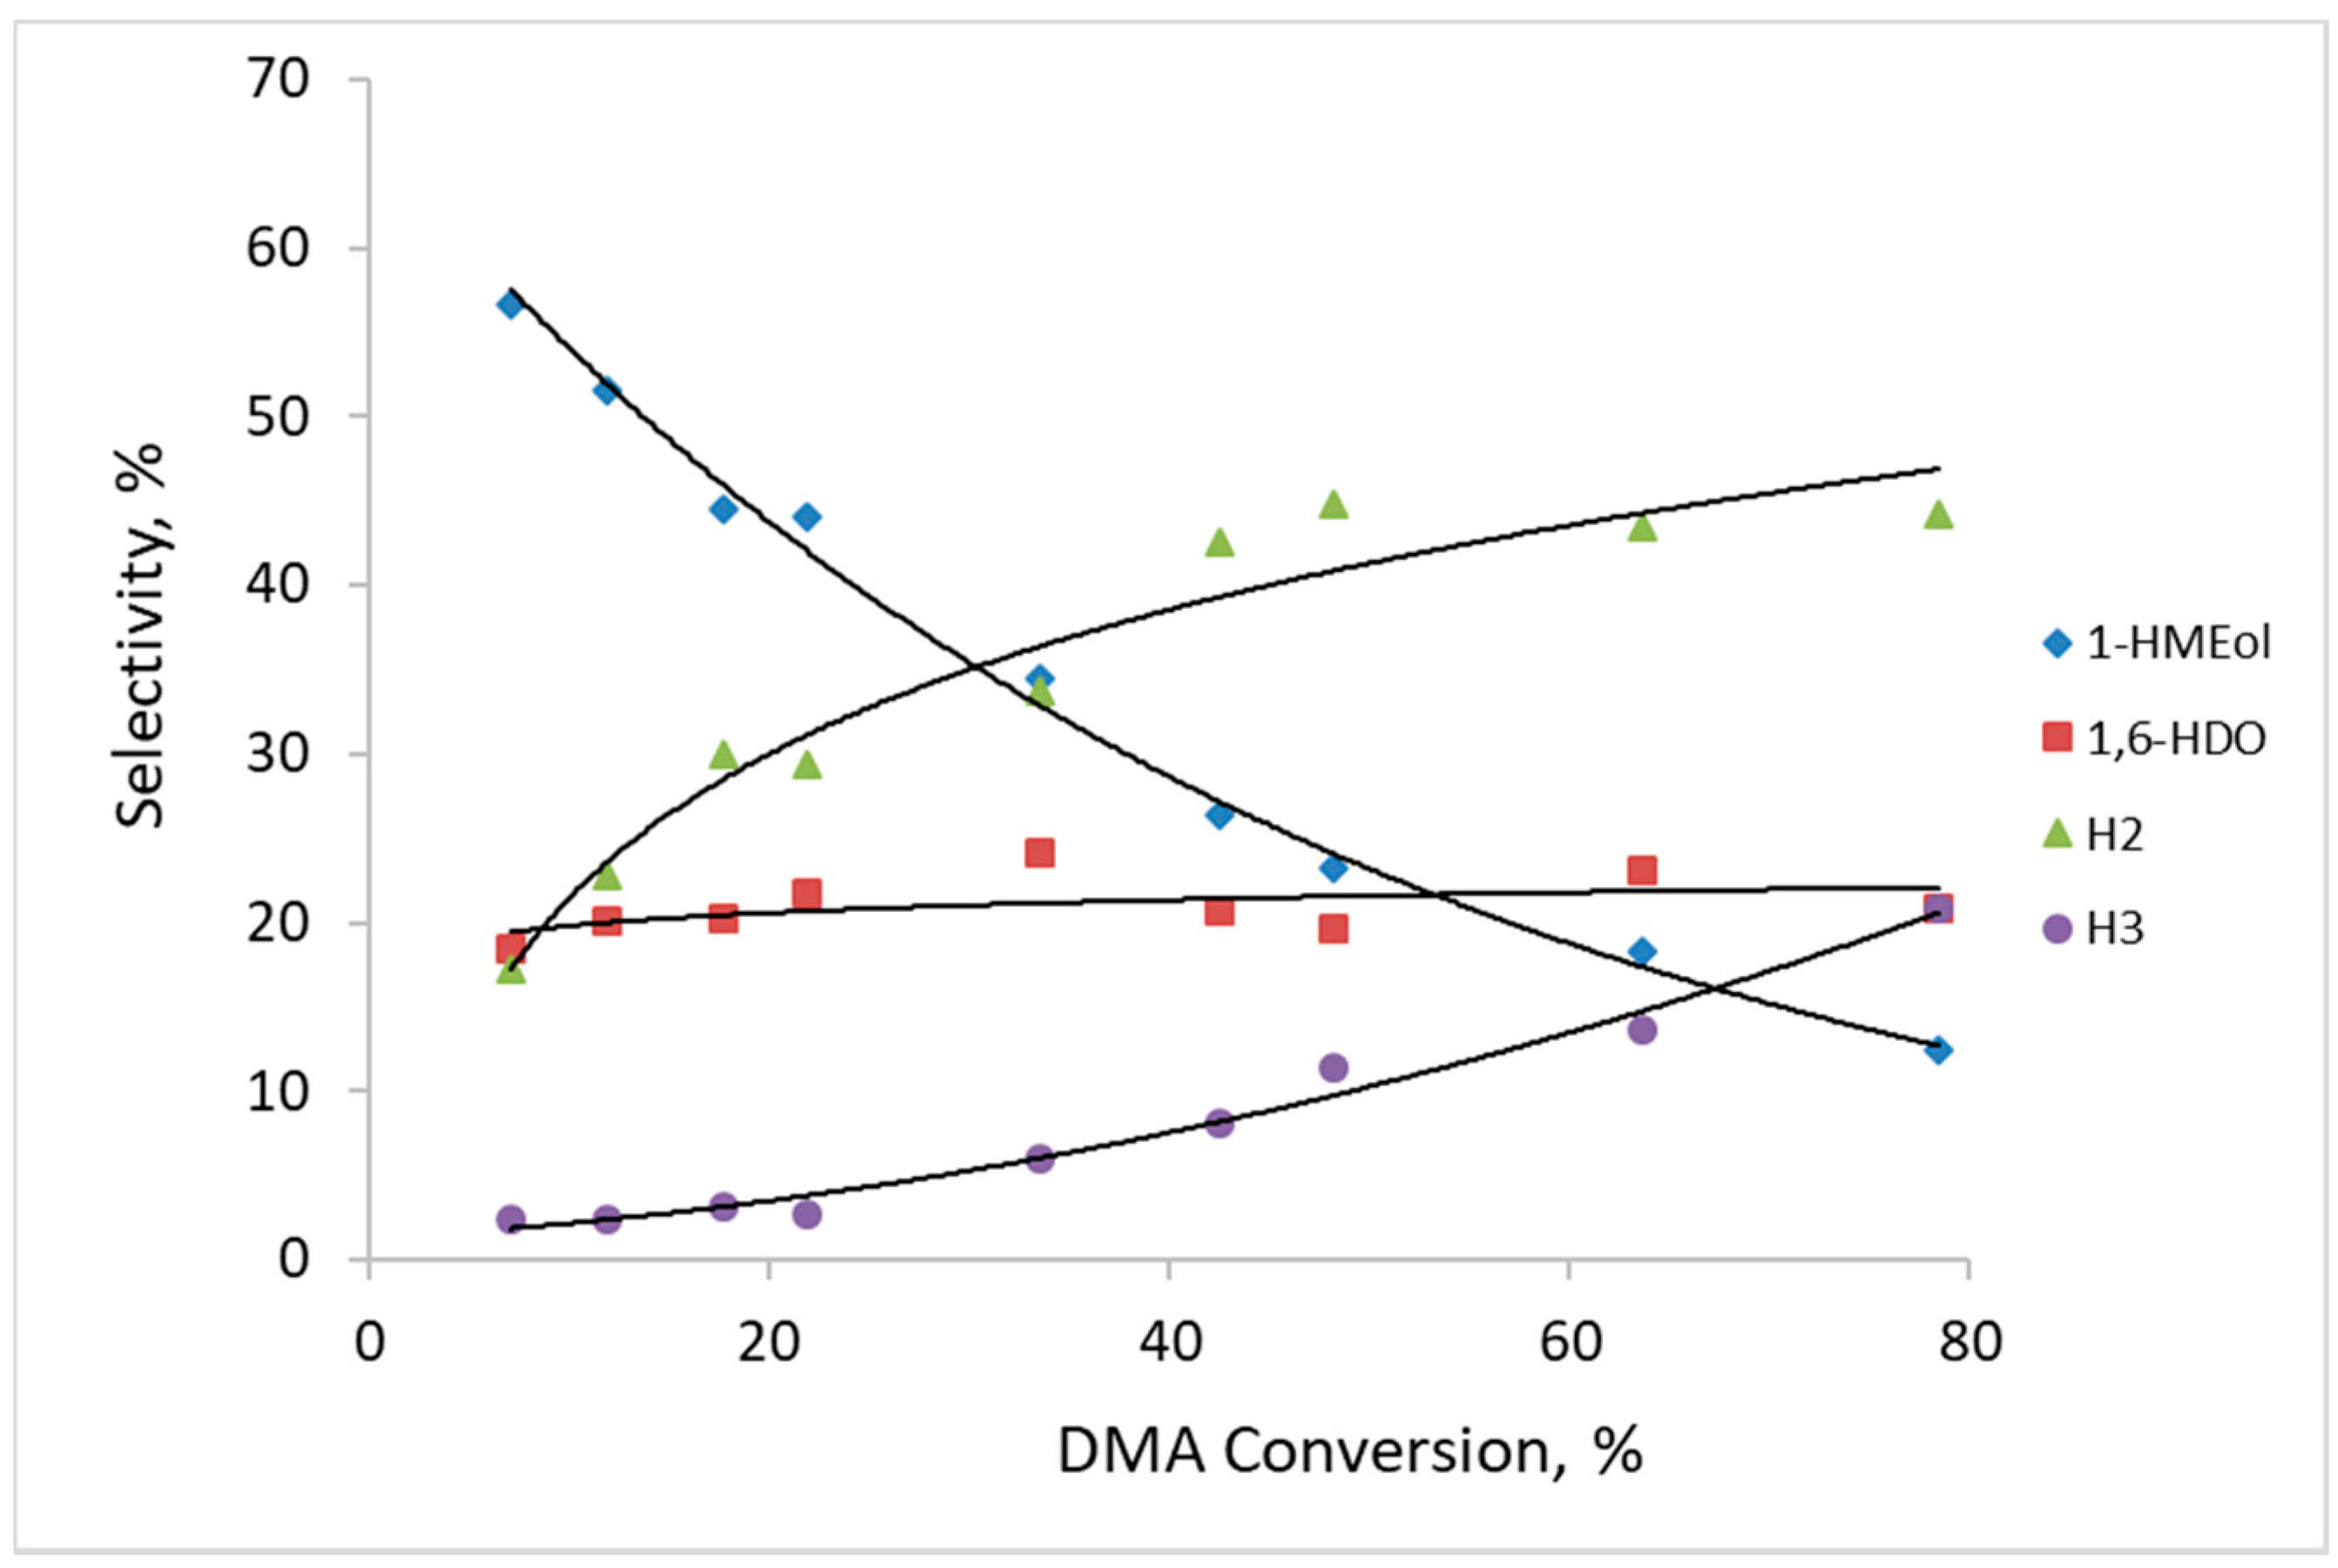
Figure 7 depicts the selectivity towards reaction products formed by DMA hydrogenolysis over catalysts prepared by the thermal activation of CuZn-P in air. Regardless, the calcination temperature selectivity to the reaction products observed over the three CuZn-
TAS catalysts followed the same trend as a function of DMA conversion. To maintain readability of the graph, the selectivities over all CuZn-
TAS catalysts were not distinguished according to the calcination temperature (
Figure 7).
The composition of the main reaction products and their tendency to change with the increasing DMA conversion is consistent with the results from our previous work [
6]. 1HMEol is evidently a primary product formed by the hydrogenolysis of only one ester group of the two present in the DMA. Its selectivity approached 100% at DMA conversion close to zero. Subsequently, 1HMEol can be transformed either by the hydrogenolysis of the second ester group yielding 1,6-HDO or by participating in transesterification reactions yielding bulky H2 and H3 molecules (for structures and chemical names, see
Scheme 1). The hydrogenolysis of the second ester group in the DMA, i.e., the ester group in 1HMEol, also proceeded very fast on the catalysts prepared by calcination in air. Consequently, the selectivity to 1,6-HDO reached 20% at a DMA conversion as low as 12%. However, once 1HMEol and 1,6-HDO were formed, the transesterification reactions involving DMA, 1HMEol, and/or 1,6-HDO became possible and resulted in a formation of bulky compounds with either two or three “hexane backbones” in their molecule, denoted as H2 and H3 (for structures, see
Scheme 1). During the reaction, the formation of the heavy H2 and H3 compounds became prevalent. Therefore, at DMA conversion of about 80%, the selectivity to H2 and H3 attained 44% and 21%, respectively. In addition, other reaction products, including cyclic ones (due to intramolecular transesterification), have also been identified among the reaction products. Their amount was small and they were excluded from further consideration. It can be inferred that the transesterification reactions are preferred to the second ester group hydrogenolysis under the studied reaction conditions as the selectivity to 1,6-HDO increased at a much more moderate rate with the increasing DMA conversion than the selectivity to the H2 and H3 products.
It has been reported that the hydrogenolysis of both ester functions in the DMA molecule does not occur at the same rate [
5,
19]. Hence, a ratio between the selectivities to HDO and the sum of the H2 and H3 products can help in evaluating the contribution of different reaction routes to the total composition of the reaction products. The ratio S
HDO/S
H2+H3 observed for CuZn catalysts calcined in air varied only slightly for the three calcination temperatures; it was in the range of 0.61–0.94 at a DMA conversion ≈10%. This shows that the ratio between the active sites responsible for hydrogenolysis and transesterification, respectively, is approximately the same in these catalysts and does not change significantly due to different calcination temperature in air.
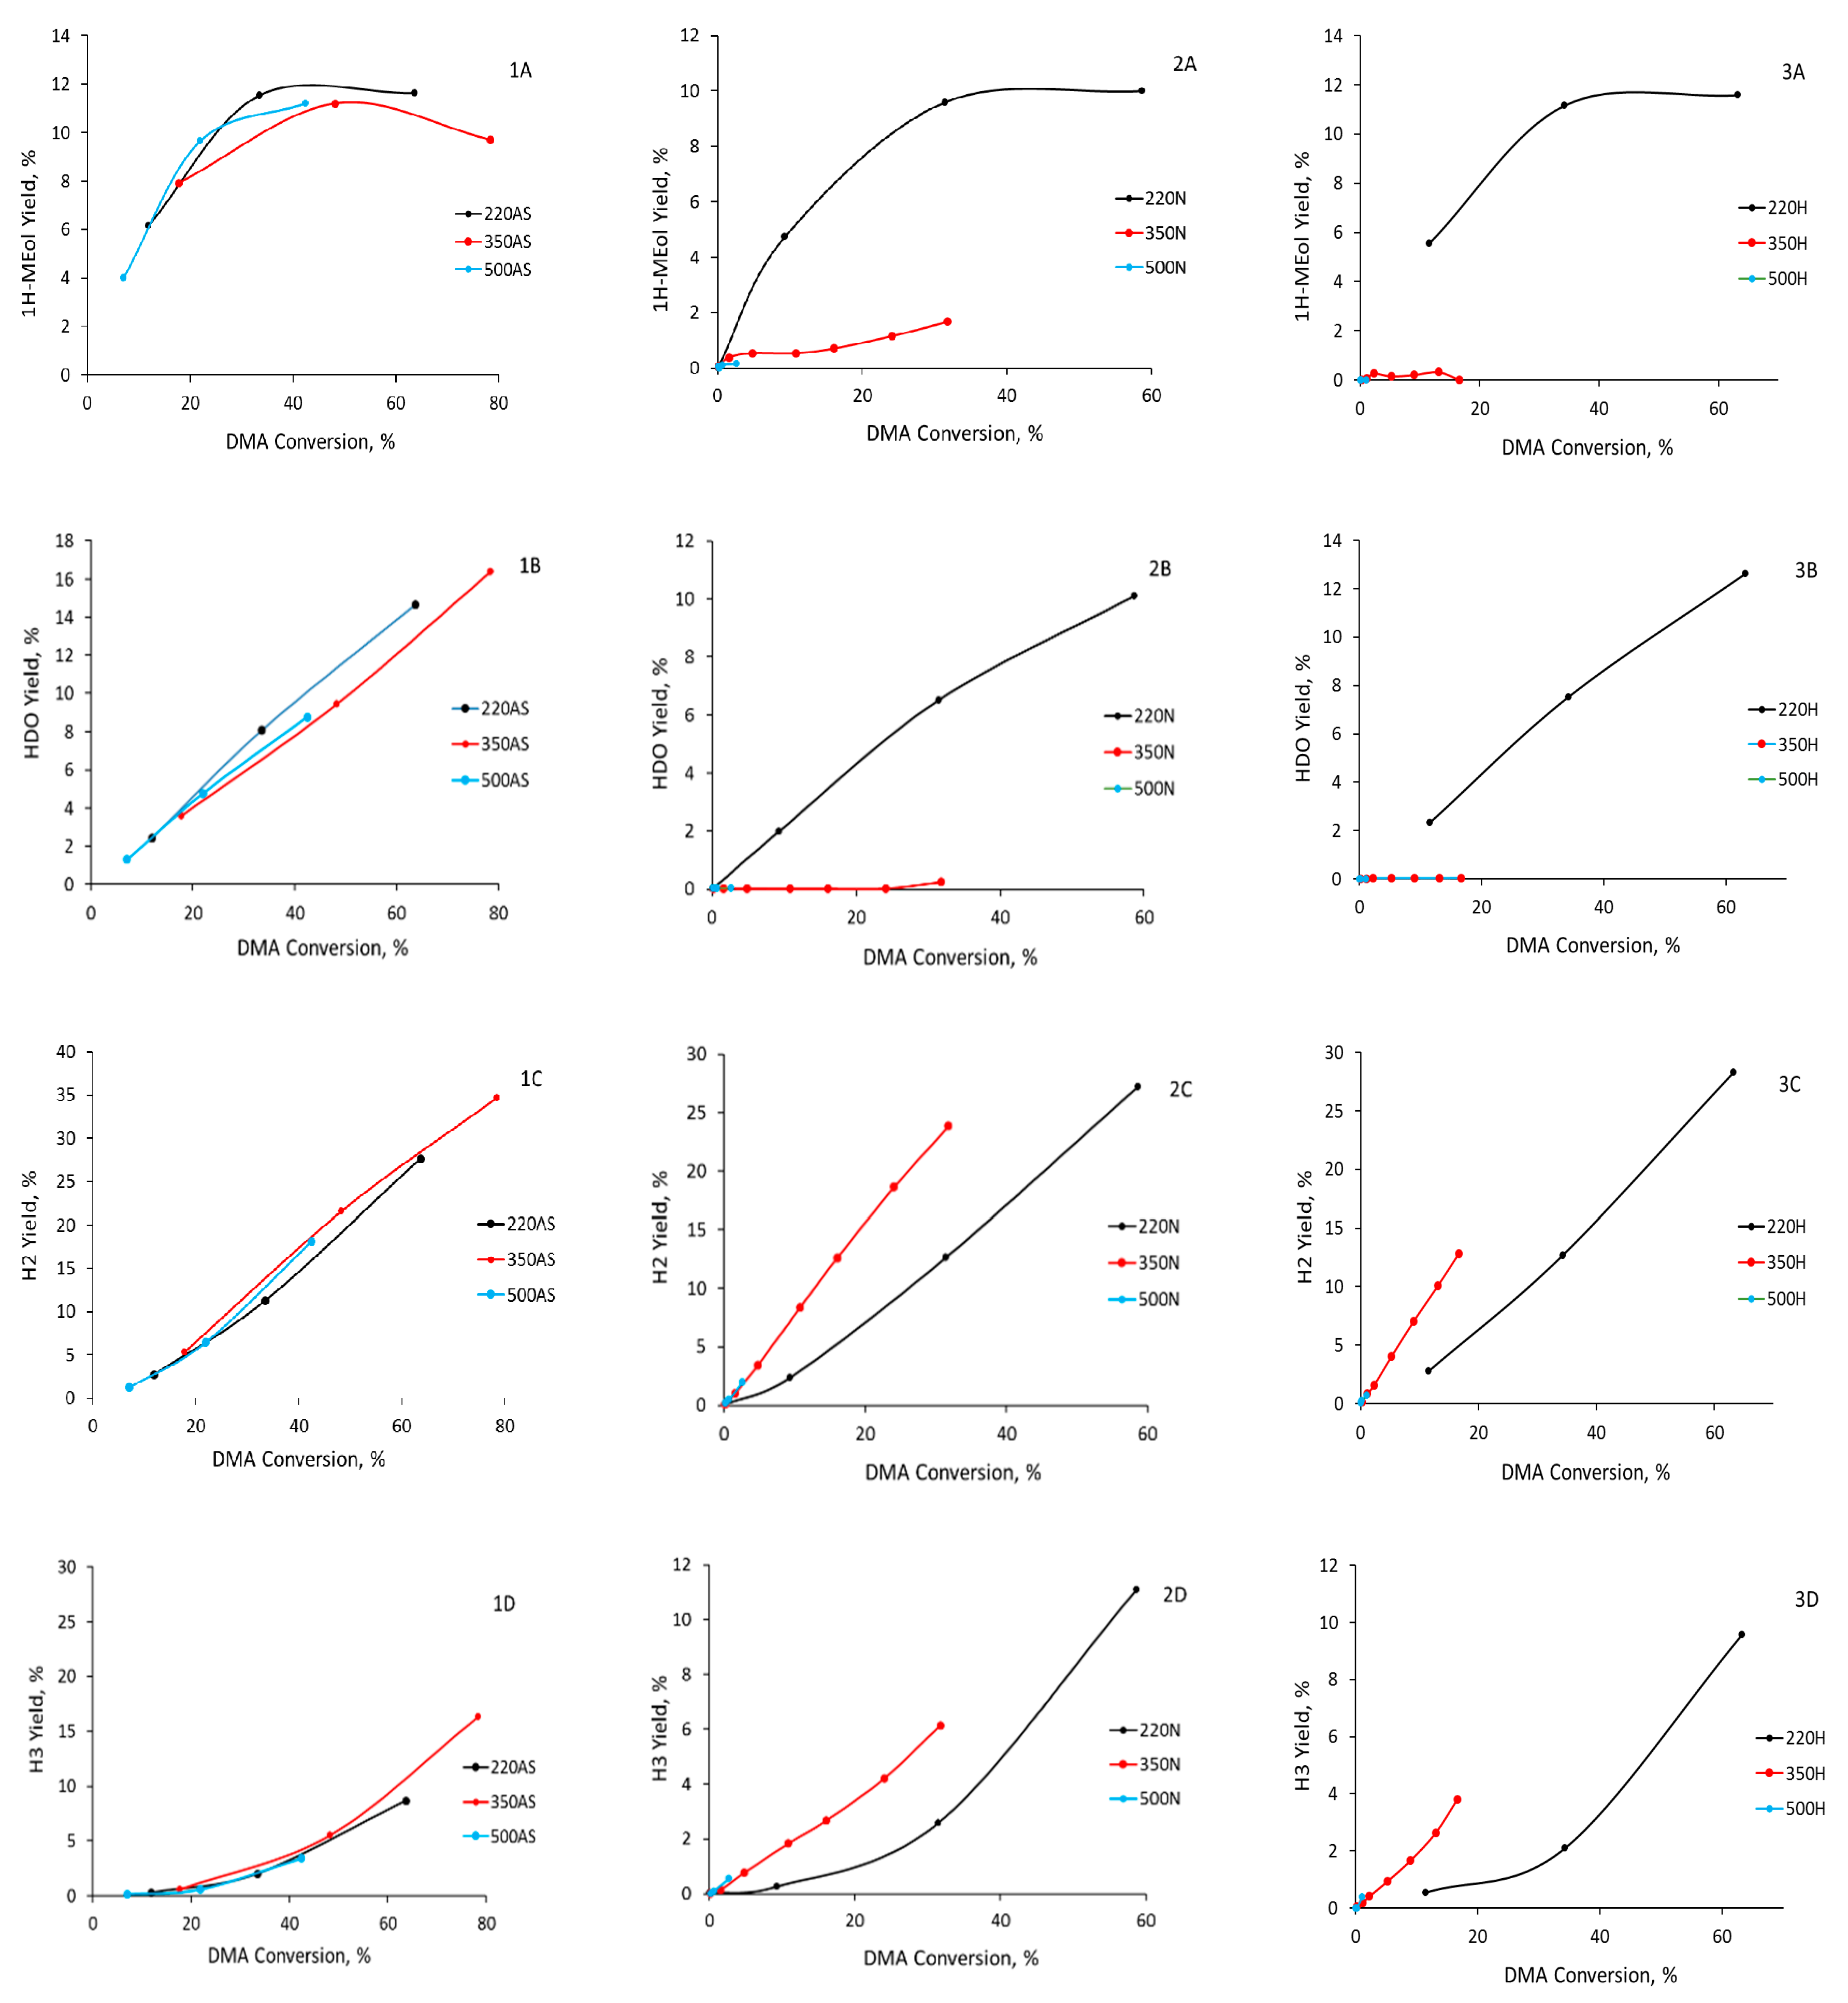
In the case of catalysts prepared by calcination in nitrogen and hydrogen at 220 °C (CuZn-220N and CuZn-220H, respectively), the maximum yield of 1HMEol reached ca. 10–12% at a DMA conversion of ca. 40%. The same maximum yield of 1HMEol was also obtained for all three catalysts prepared by calcination in air (
Figure 8(1A,2A,3A)), suggesting that all catalysts prepared by calcination at 220 °C have a similar distribution of the Cu active sites regardless of the calcination atmosphere. Consequently, the S
HDO/S
H2+H3 calculated for CuZn-220N and CuZn-220H at DMA conversion ≈10% was 0.77 and 0.7, correspondingly, which is within the range of values observed for the catalysts prepared by the calcination in air. Similar to the air-calcined CuZn catalysts, the selectivity to H2 and H3 increased markedly with the increase in the DMA conversion for CuZn-220N and CuZn-220H catalysts, implying the secondary nature of H2 and H3 formation.
A different selectivity character was observed in the case of samples prepared by the calcination of the CuZn-P precursor at 350 and 500 °C in nitrogen or hydrogen. The yields of the 1HMEol were minor—the maximum yield of 1HMEol was achieved over CuZn-350N and amounted to 2% at a DMA conversion of 30%. This is significantly less than the samples calcined at 220 °C in nitrogen, hydrogen, or in air (ca. 10–12% yield at a 30% DMA conversion). The 1,6-HDO yields were virtually 0%, which is again dramatically lower than the other catalysts that yielded 4–6% HDO at comparable conversions (
Figure 8(1B,2B,3B)). Surprisingly, the esters (H2 and H3 products) requiring 1HMEol and/or HDO in addition to DMA were the prevailing reaction products. At a given conversion, their yield significantly exceeded the yield of esters formed over the CuZn catalysts calcined at 220 °C (in all atmospheres) and all catalysts calcined in air (i.e., calcined at 220, 350, or 500 °C); see
Figure 8(1C,2C,3C,1D,2D,3D). It can be inferred that the calcination temperature in a non-oxidizing atmosphere had a severe impact on the hydrogenolysis activity of the CuZn catalysts, as the S
HDO/S
H2+H3 dropped to values as low as 0.002 for catalysts calcined at 350 °C in N
2 or H
2. The results, thus, provide strong evidence that the hydrogenolysis of the methyl ester function and the transesterification reaction leading to the formation of bulky molecules, H2 and H3, occur on different active sites. Obviously, both the calcination atmosphere and temperature strongly affect the performance of the CuZn catalysts. The identification (and possibly also quantification) of the active sites, however, remains a task for forthcoming studies.


