Review

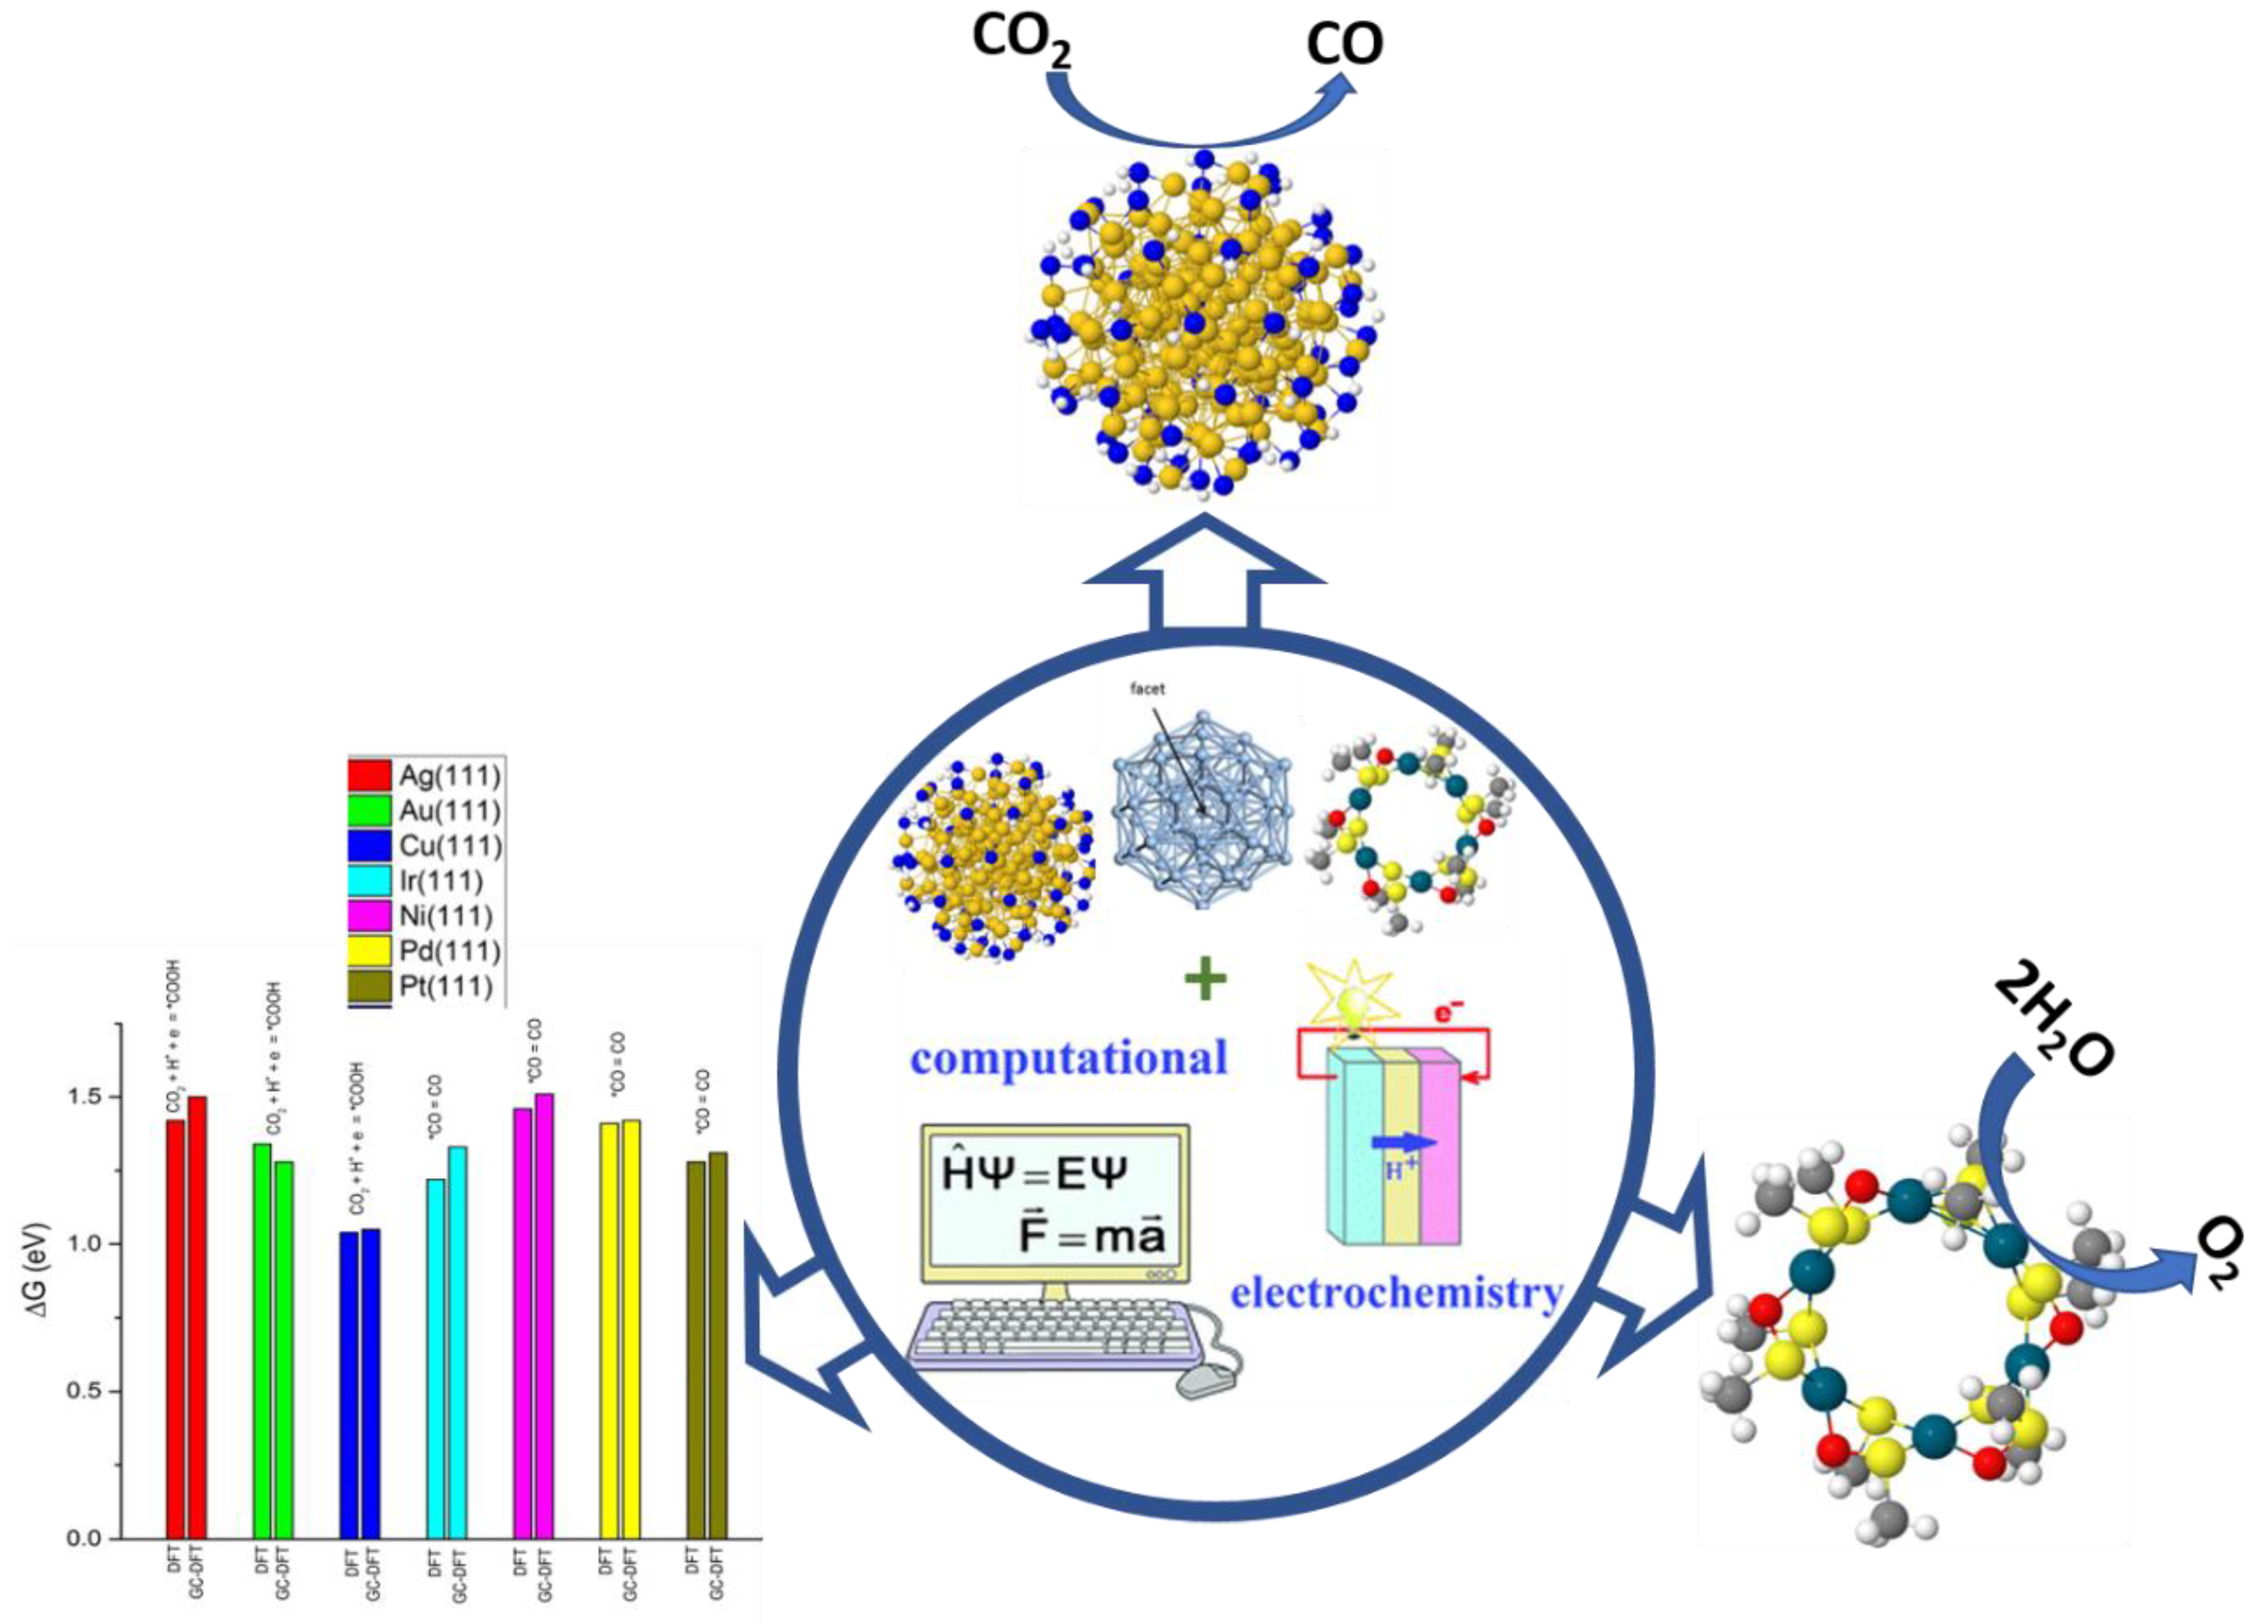
First-Principles Modeling in Heterogeneous Electrocatalysis

by
Dominic R. Alfonso
1,*,
De Nyago Tafen
1,2 and
Douglas R. Kauffmann
1
1
National Energy Technology Laboratory, U.S. Department of Energy, Pittsburgh, PA 15236, USA
2
AECOM, P.O. Box 618, South Park, PA 15129, USA
*
Author to whom correspondence should be addressed.
Catalysts 2018, 8(10), 424; https://doi.org/10.3390/catal8100424
Submission received: 7 September 2018 / Revised: 20 September 2018 / Accepted: 27 September 2018 / Published: 28 September 2018
(This article belongs to the Special Issue Active Sites in Catalytic Reaction)

Abstract

:
The last decade has witnessed tremendous progress in the development of computer simulation based on quantum mechanical description of the interactions between electrons and between electrons and atomic nuclei with electrode potentials taken into account–promoting the possibility to model electrocatalytic reactions. The cornerstone of this development was laid by the widely used computational hydrogen electrode method which involves a posteriori correction of standard constant charge first principles studies in solvent environment. The description of this technique and its contribution to our effort to understand electrocatalytic reactions on the active sites of metal-based nanoparticles are reviewed. The pathways and energetics of the relevant elementary reactions are presented. We also discussed a recent attempt in the literature to account for the inflow and outflow of electrons from the electrode as electrochemical reactions proceed, which has been greatly assisted by the development of density functional theory within the grand canonical framework. Going beyond the computational hydrogen electrode method by explicit incorporation of electrode potential within the calculations permits access to more detailed insights without requiring extra computational burden.

Graphical Abstract

1. Introduction

Electrochemical fuel generation whose basic principle is to catalytically produce valuable chemical compounds from inert reactants under mild conditions is predicted to become an important component of future energy infrastructures [1,2,3,4,5,6]. The electrode potential, adsorbates, catalyst structure and solution in the electrode/electrolyte interface lie at the heart of the electrochemical process. Experimental measurements are the usual path to characterize the interface as it is capable of providing observable characteristics such as surface tension, work function and interfacial capacitance [7]. However, experiments are limited to measurements of macroscopic equilibrium observables as virtually no instruments exist to elucidate the atomic level details of electrochemistry during operation. The lack of such probes makes it difficult to establish atomic scale interpretation of experimental data crucial for catalyst selection, design and application. Computations are usually performed using mean field equations such as the Gouy-Chapman theory which assumes that the ions in the electrical double layer are point charges that interact only through Coulomb interactions [8]. However, these mesoscopic models are not generally transferable as they rely on system parameters fitted to experimental data. For these reasons, atomic level insights on cell electrochemistry remain elusive for these techniques, at least to date.
Aided by the concurrent advances in ab initio technique, computer hardware and numerical analysis over the last few decades, first principles modeling has made significant inroads into the simulation of electrochemical reactions catalyzed by solid surfaces [7,8]. It has become a valuable complementary tool to experiments as it provides molecular level description of the bond breaking and forming on the catalyst coupled with electron and ion transfer from one reactant to another allowing deconvolution of the plethora of atomic processes at work. Recent advances have allowed the efficient accounting of the influences of the solvent on the catalyst interfacial properties [9]. Modeling the full details of the electrochemical phenomena has also become increasingly accurate due to the development of quantum theory that explicitly includes the electrochemical potential [10]. Aside from hard to measure geometric structures and electronic properties, the output from the simulation includes reaction pathways and free energy profiles. Another key observable is the predicted trends that underlines the catalytic reactions, providing parameters for development of optimal catalysts and identifying fundamental and practical barriers that needed to be surmounted [5]. Indeed, elucidation of the otherwise ambiguous potentials from voltammetry and how they relate to atomic processes at the electrochemical interface can now be achieved from theory-experiment interplay.
In this account, we provided an overview of key concepts that enter into the theoretical modeling of electrochemistry. We first discussed the so-called zeroth-energy level protocol based on the electrochemical free-energy correction introduced by Norskov and co-workers which was used in large majority of simulations of heterogeneous electrocatalysis [11]. In this approach, the influence of electrode voltage is included a posteriori to reaction energy differences that involve electron transfer with either a dielectric continuum or atomistic representation of the solvent. We reviewed our specific application of this technique to the study of electrocatalytic CO2 reduction, hydrogen evolution reaction and water oxidation on metal-based nanoclusters. In subsequent sections, we discussed recent efforts to improve on the aforementioned approach by explicit inclusion of the electrochemical potential into the first-principles calculations [10].

2. Computational Hydrogen Electrode Approach

The computational hydrogen electrode (CHE) approach pioneered by Norskov and co-workers represents a very promising way to enable modeling of electrochemistry by quantitatively incorporating insights from first-principles calculations [11]. The inclusion of quantum mechanical data imparts predictive capability and eliminates the need to make drastic simplifying assumption in the model. At the core of this approach is a specified reaction mechanism and the evaluation of the free energy of the corresponding elementary steps, Δ G = Δ H T Δ S . The key gateway to introduce electronic structure information into the model is via the free energy of individual component, G i = H i T S i , in each of the elementary step. The enthalpy of component i:
  H i = E e l   + E s o l v   +   E z p e   + E t h e r m a l + P V  
consists of the sum of electronic energy ( E e l ), solvation energy ( E s o l v ), zero-point vibrational energy ( E z p e ), thermal energy ( E t h e r m a l ), and the PV term. The electronic energy may be calculated by a very high level of direct wave-function based approaches such as post Hartree-Fock methods [12]. Such computations, however, have a cost that grows very rapidly with the number of electrons in the system. Density functional theory (DFT) which reformulates the Schrodinger equation in terms of three-dimensional electron density without drastically compromising accuracy provides a cost-effective alternative [13]. Vast majority of first-principles CHE calculations have been done in combination with the DFT method.
Solvent effects are important in electrochemistry. The E s o l v term accounts for the interaction of the species with the solvent which can be evaluated either by inclusion of bilayer of water or thru implicit solvation model. A particular advantage of the latter approach is that it circumvents phase space sampling difficulties associated with explicit solvation treatments. A homogeneous constant dielectric continuum is employed to model the solvent but nevertheless can reproduce significant solvation energies in most situations [14]. The zero-point energy correction is defined as:
  E z p e = 1 2 h v i  
and the thermal energy includes translational, rotational and vibrational contributions:
  E t r a n s = 3 2 R T  
E r o t ( nonlinear   molecule ) =   3 2 R T  
  E r o t ( linear   molecule ) = R T  
and
  E v i b = R h v i / k B e h v i / k B T 1  
where k B , h and R are the Boltzmann, Planck and gas constants. The vibrational frequencies νi can be efficiently calculated via DFT using the harmonic oscillator approximation by diagonalization of the mass-weighted Hessian matrix in internal coordinates. The corresponding translational, rotational and vibrational contributions to the entropy Si are:
S t r a n s = R ( ln ( ( 2 π m k B T ) 3 2   h 3 ) + ln ( k B T P ) + 5 2 )  
S r o t ( nonlinear   molecule ) = R ( ln ( 8 π 2   8 π 3 I x I y I z ( k B T ) 3 2 σ   h 3 ) + 3 2 )  
S r o t ( linear molecule ) = R ( ln ( 8 π 2   I   k B T σ   h 2 ) + 1 )  
and
S v i b = R i ( h ν i / k B T e h ν i / k B T 1 ln ( 1 e h ν i / k B T ) )  
where m is the mass of the species, P is the pressure, I x , I y , I z are the three principal moments of inertia for nonlinear molecule, I is the moment of inertia for the linear molecule and σ is the rotational symmetry number.
For the Hi of gaseous molecule, E s o l v is neglected in Equation (1) and PV is set to RT assuming ideal gas. The translational, rotational and vibrational contributions to the Si are considered. Evaluation of the entropy for the gaseous species can also be alternatively done using the Shomate equation:
  S i = A ln ( t ) + B t + C t 2 2 + D t 3 3 E 2 t 2 + G  
where t = T/1000. The corresponding parameters A, B, C, D, E and G are tabulated in the NIST database [15]. For its solvated counterpart, E s o l v is included, PV is neglected and the three contributions to the entropic term are retained. For the solvated adsorbed species, the PV term is also excluded. However, for the thermal energy and entropy terms, only the vibrational component is considered. Thus, the free energy for the adsorbate is: G a d s = E e l   +   E s o l v +   E z p e   + E v i b T S v i b .
Within the CHE method, the influence of applied bias U in an electrochemical step is included by setting the total energy of the electron in the electrode to -qU where q is the fundamental charge. Thus, the free energy of each step will vary with U according to:
  Δ G ( U ) =   Δ G ( reduction   step ,   0   V ) +   n q U  
  Δ G ( U ) =   Δ G ( oxidation   step ,   0   V )   n q U  
where n is the number of electrons transferred. Additionally, the free energy of H+ + e are referenced to that of H2 molecule using the standard hydrogen electrode (½ H2 H+ + e, ΔG = 0 at USHE = 0 V, pH = 0, p = 1 atm, T = 298 K) which leads to the following expression:
  1 2 G H 2 = G ( H + + e )  
This permits the use of gas phase values of H2 in lieu of the energetics of solvated proton and electron pair in the liquid phase.
Explicit accounting of electrolytes effects is also crucial for the prediction of relative stabilities under electrochemical conditions. For example, for the adsorption of CO2 within CO2RR, in the absence of cations (i.e., Na+ or K+) co-adsorption, the CHE method would yield adsorption energy which is independent of the electrode potential. However, when co-adsorbing relevant intermediates with cations, the concomitant step would become an electrochemical one since cations and electron transfer are coupled. Therefore, in the presence of electrolyte co-adsorption the CHE method is no longer a reliable approximation to evaluate the adsorption energies.

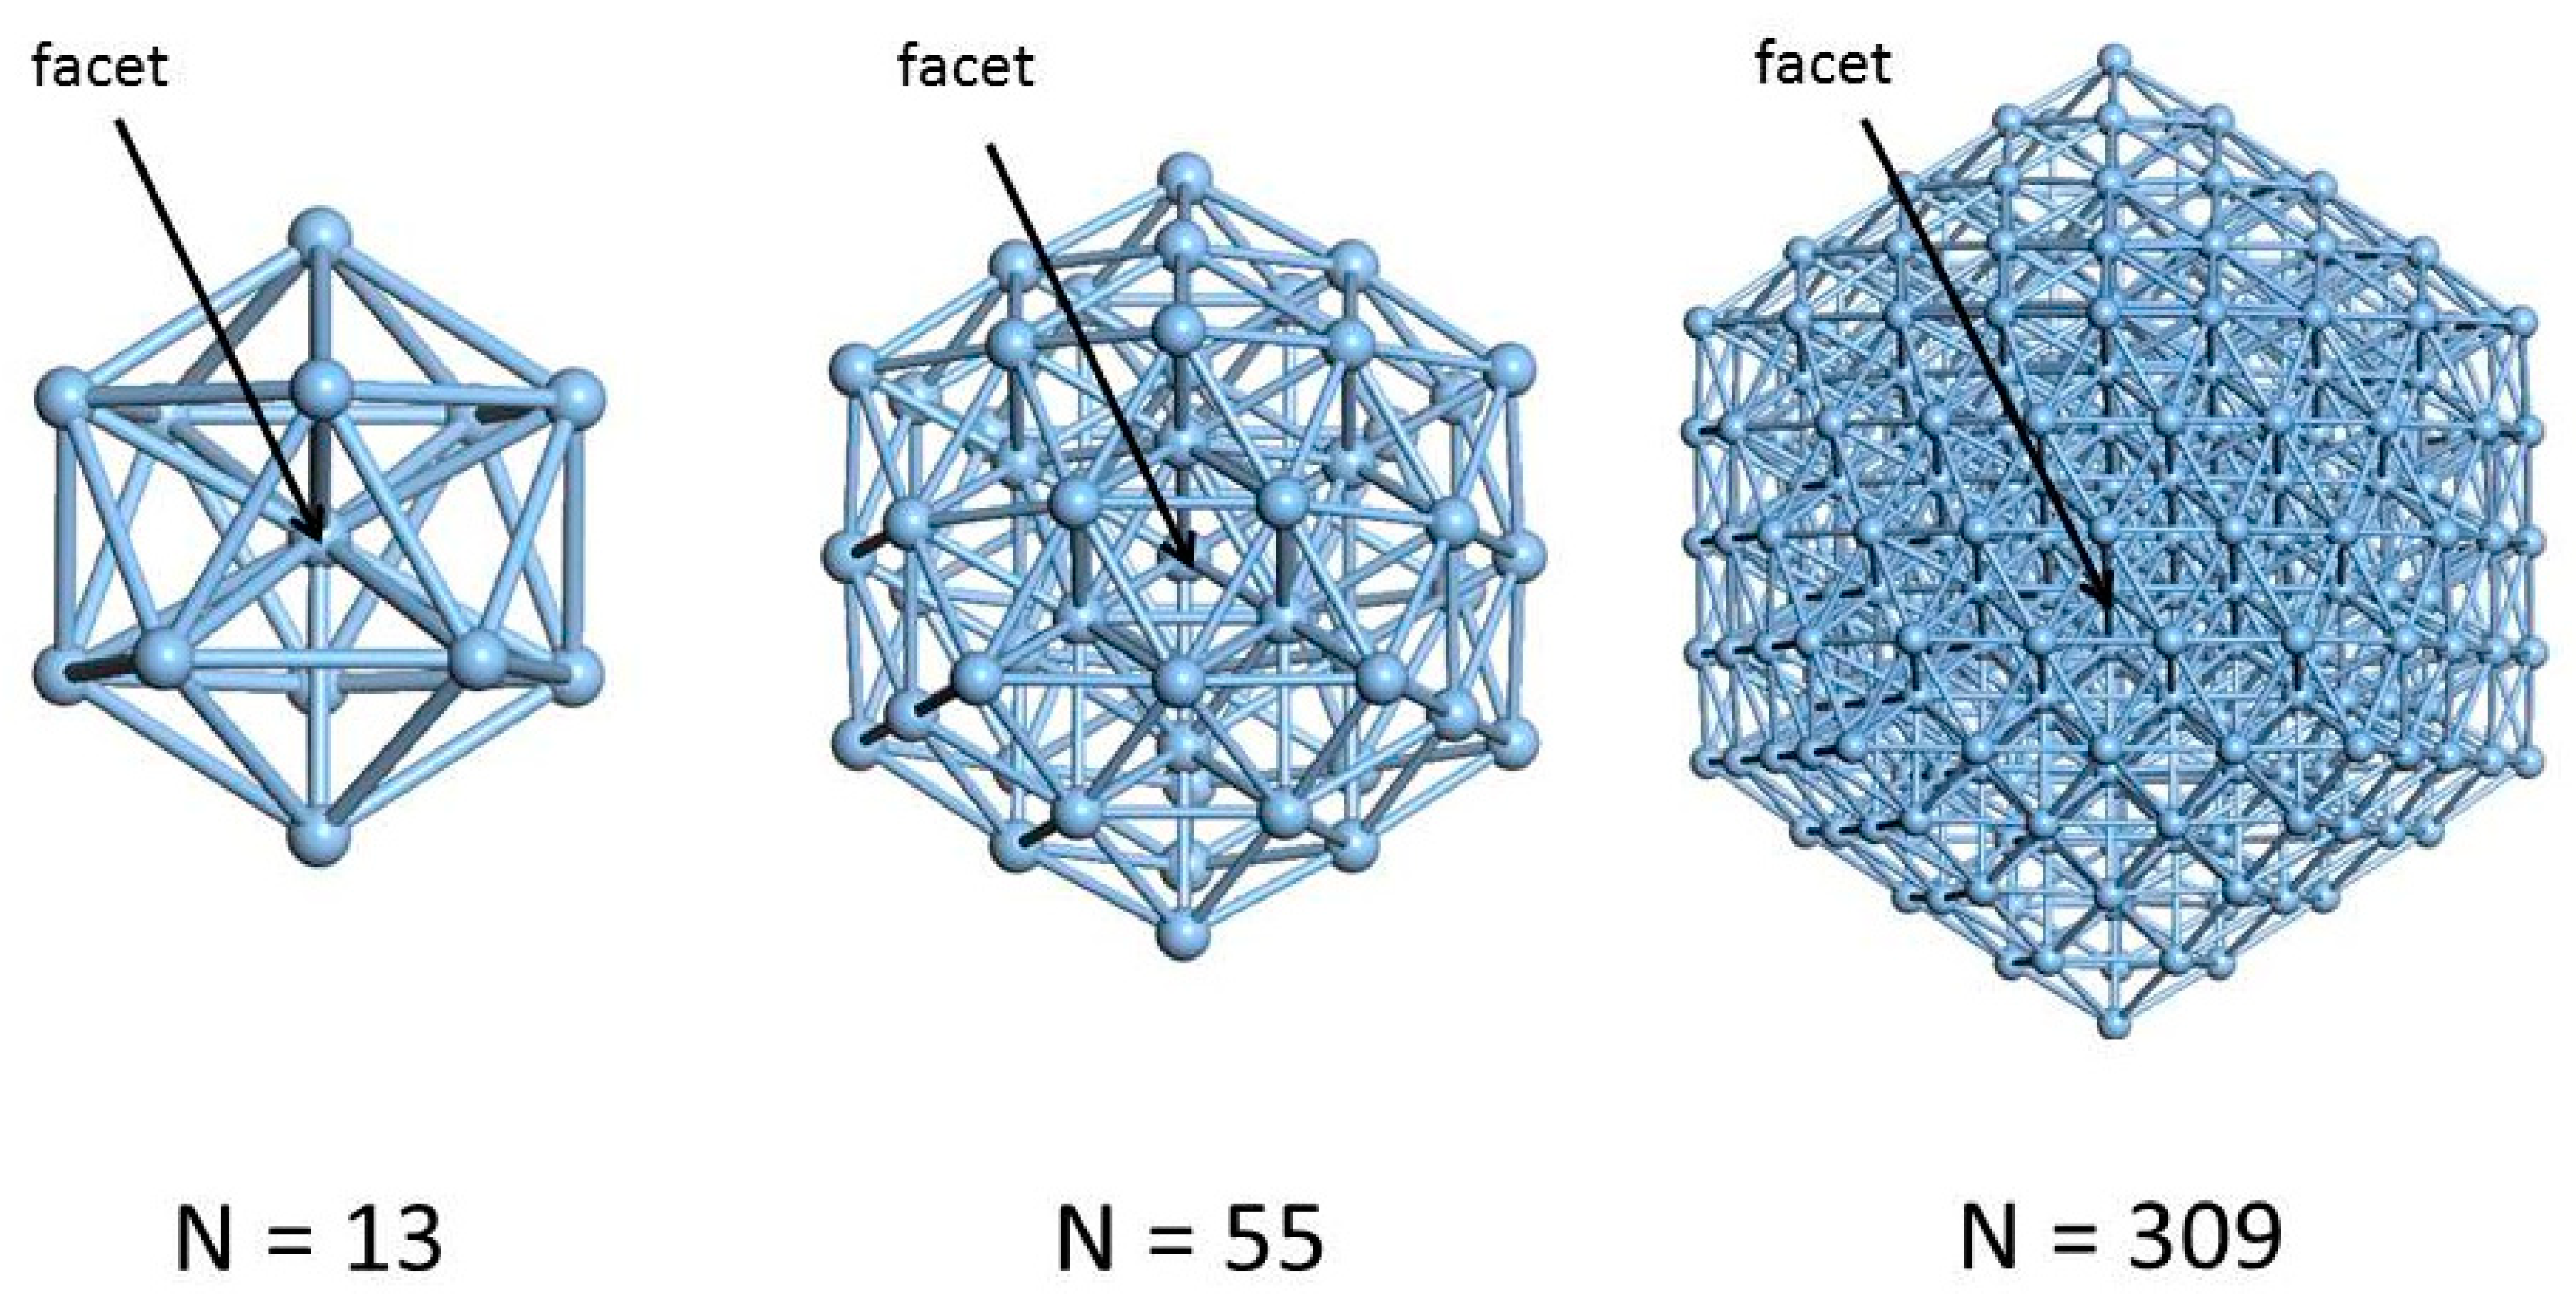
3. CHE Approach to Electro-Catalytic Reactions on the Active Sites of Nanoparticles

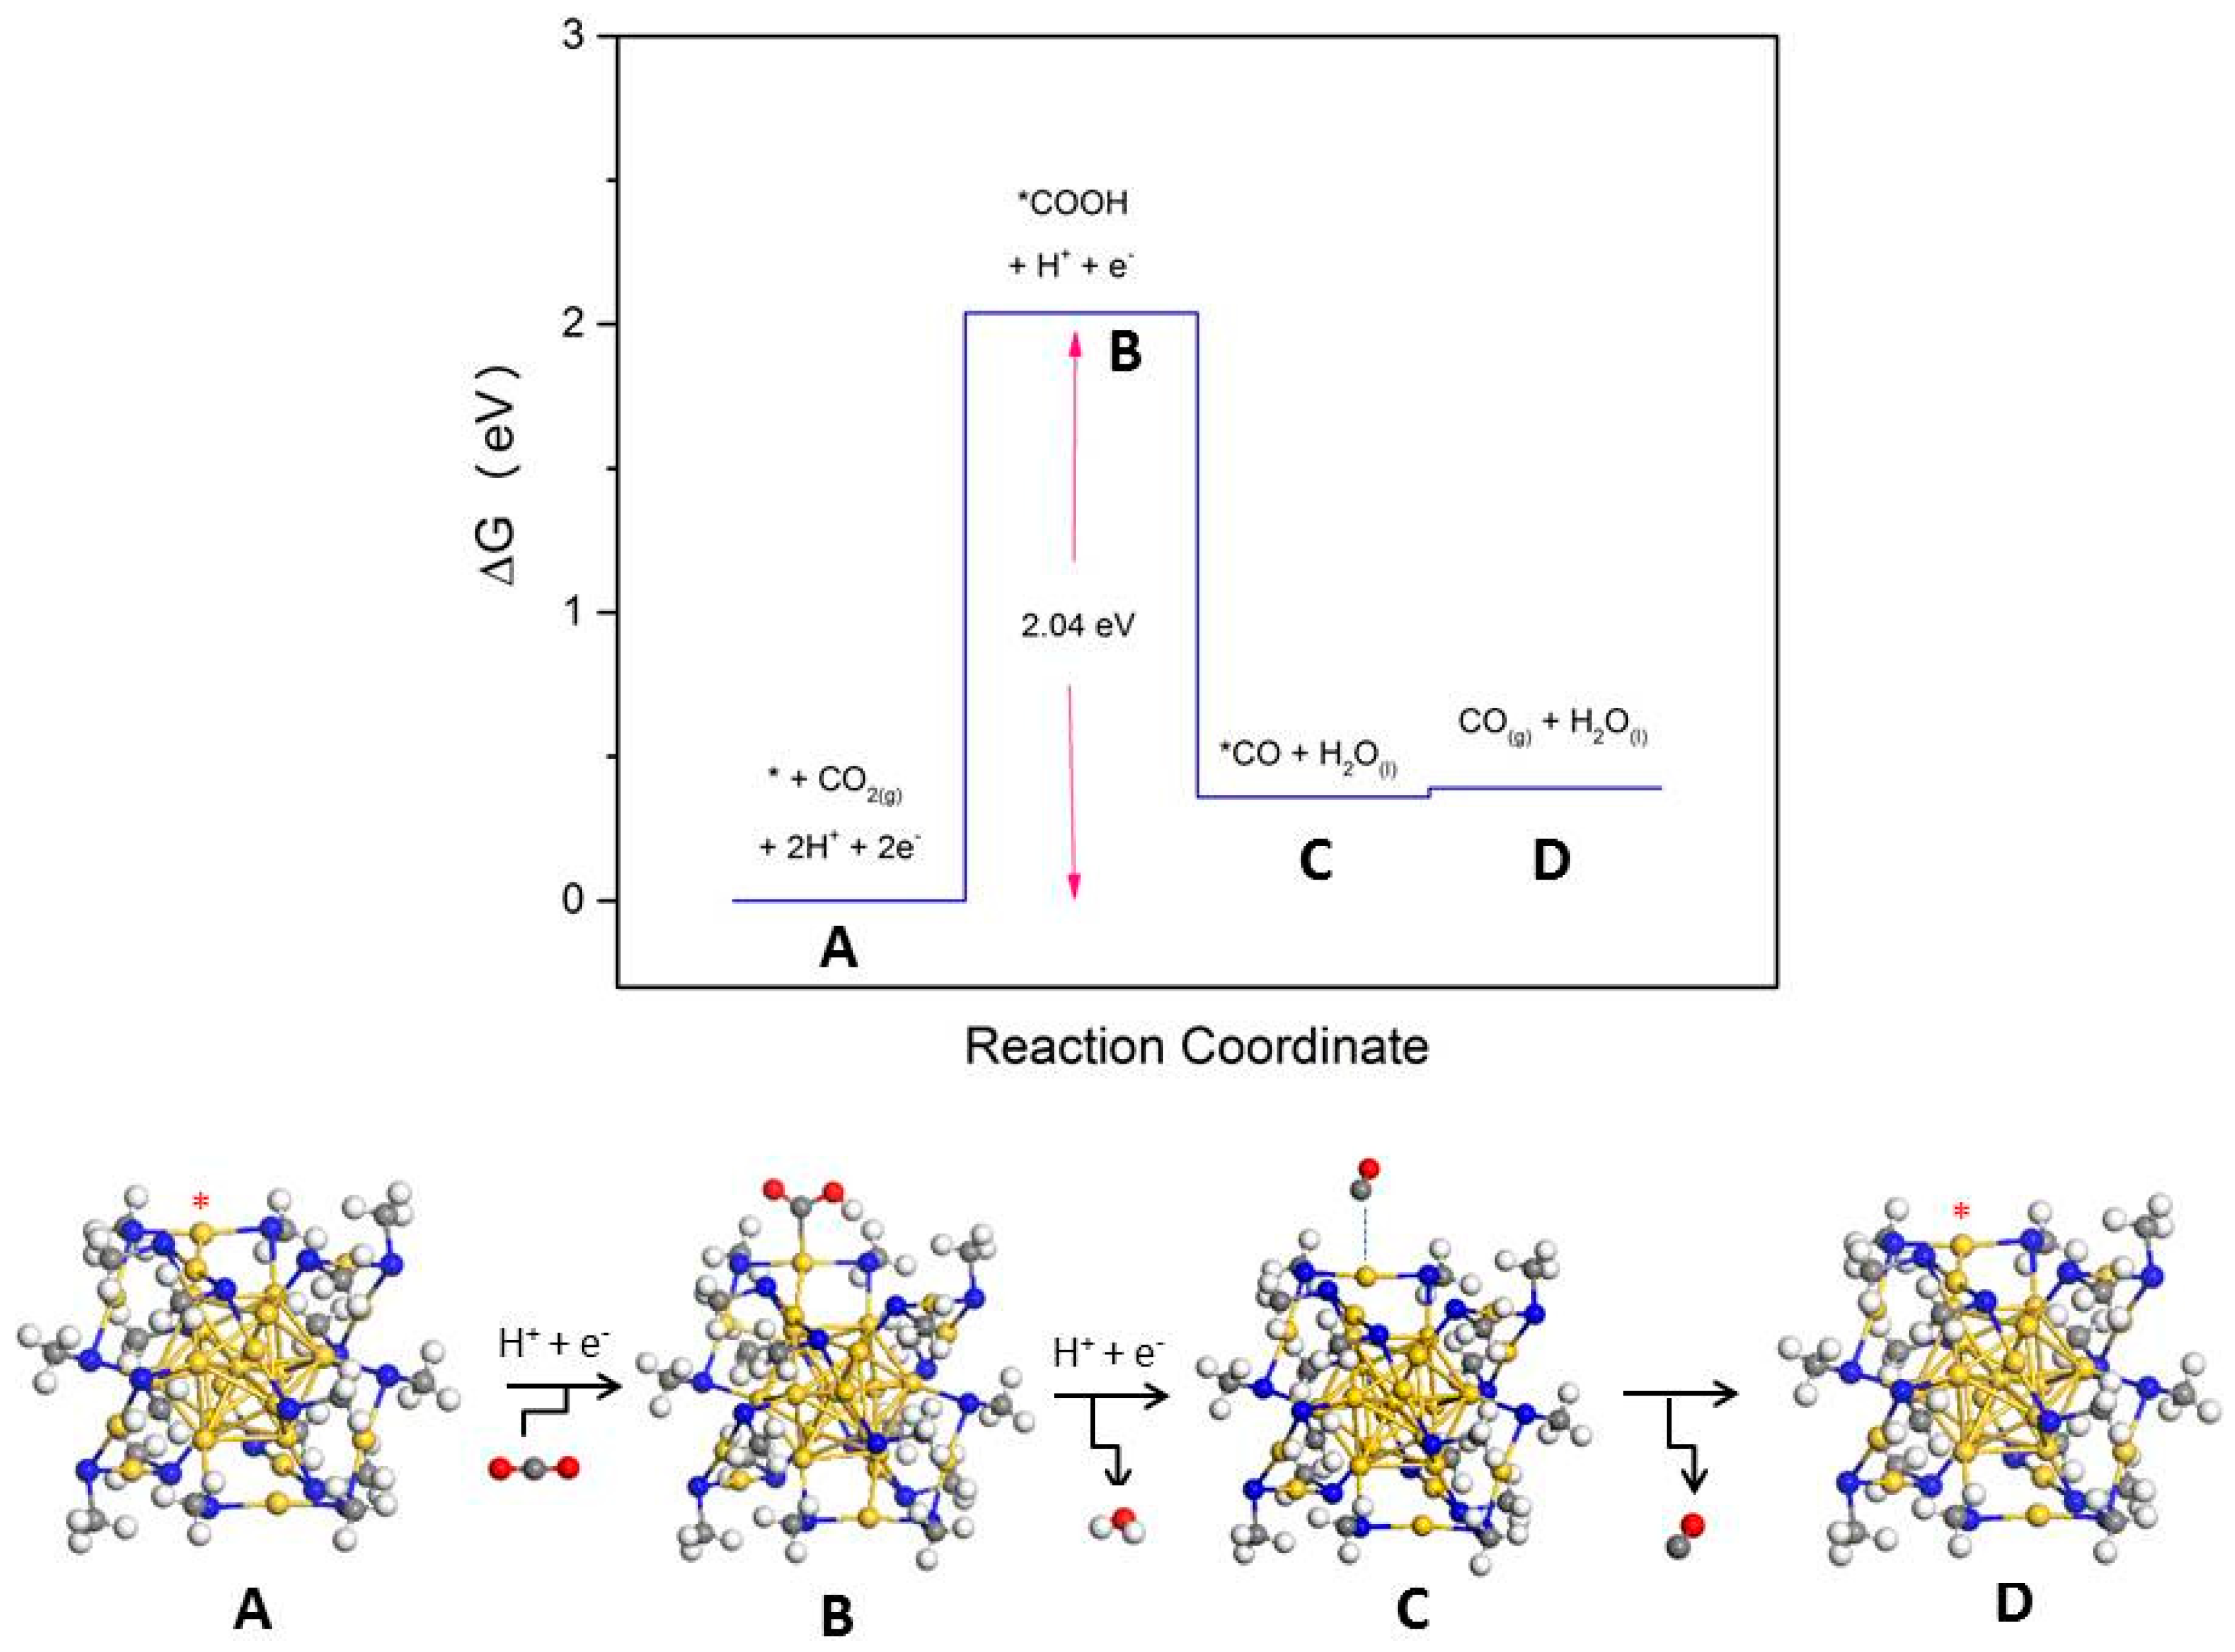
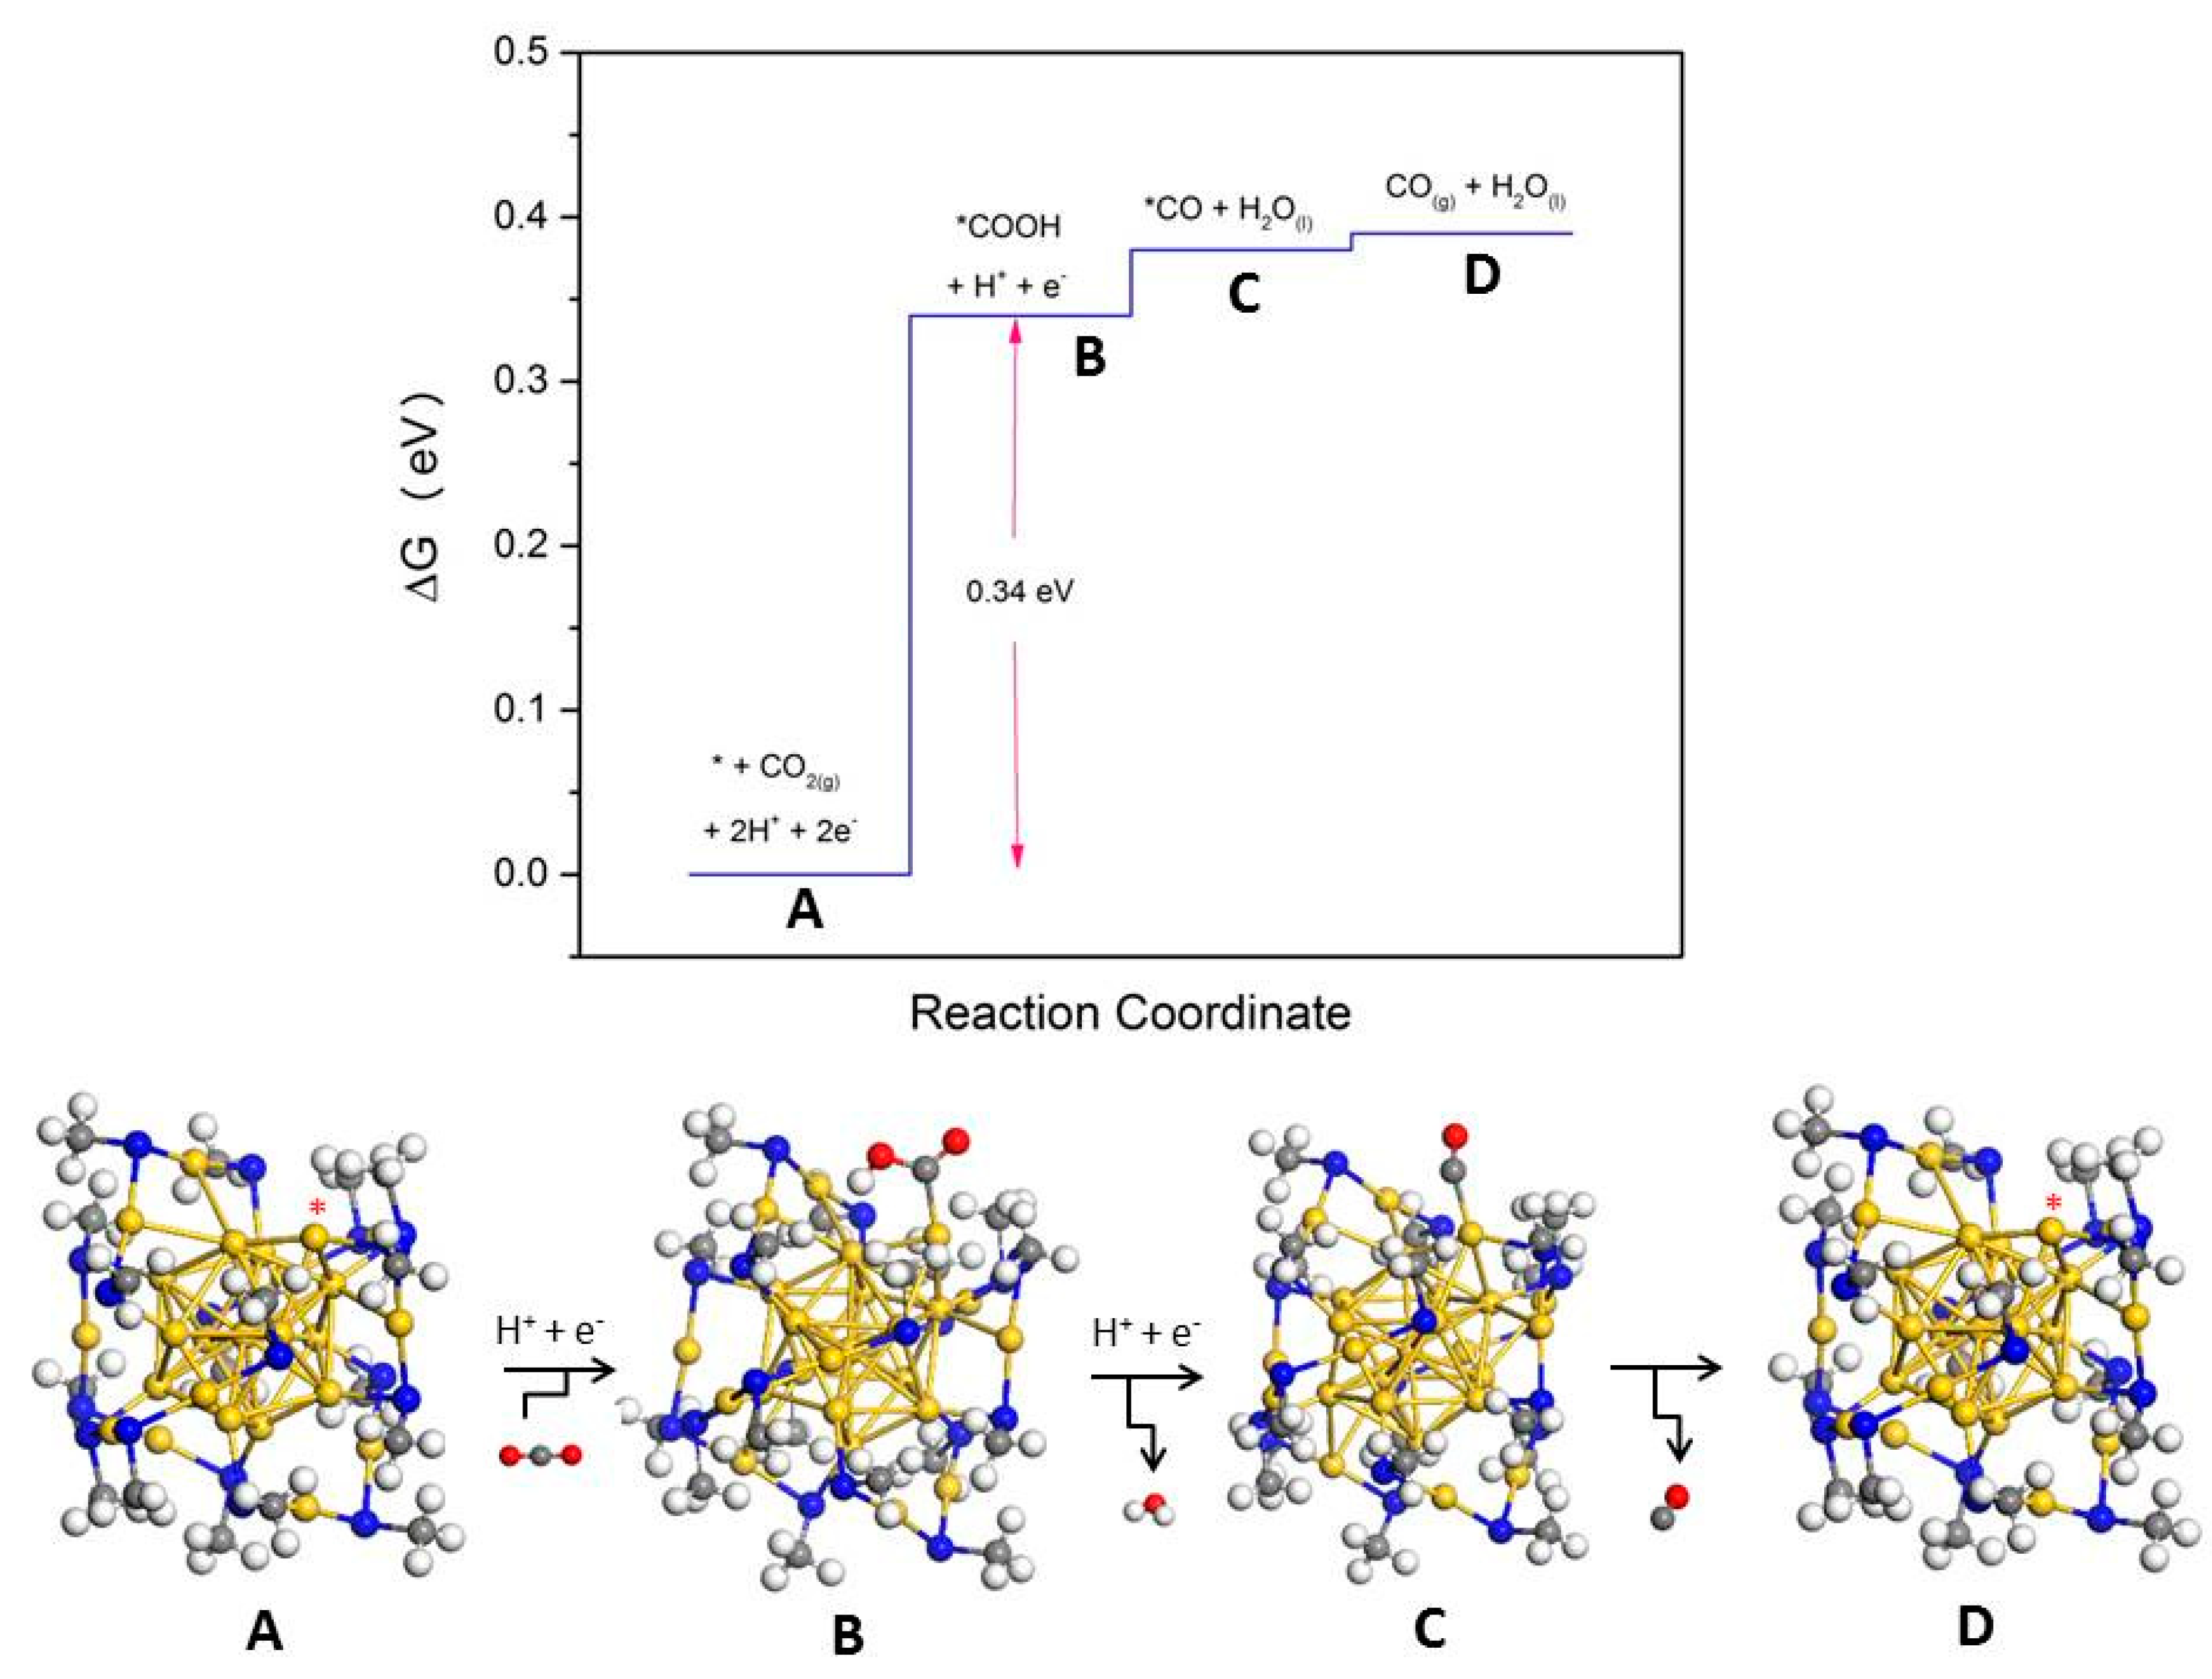
3.1. CO2RR on Ligand Protected Au25 Cluster

The atomically precise ligand protected gold clusters have emerged as a hotly pursued class of nanoscale matter with potential applications as building blocks of nanostructured materials and devices as they show fascinating size-specific properties that are different from their bulk and traditional nanoparticle counterpart [16,17,18,19,20]. Aside from tremendous advances achieved in understanding their structures and electronic properties, efforts were undertaken to address their potential catalytic properties. For example, the negatively charged thiolate-protected Au25(SR)18 cluster (denoted hereon as Au25) has a structure containing an icosahedral Au13 core with a protective gold thiolate layer of six RS-Au-RS-Au-RS oligomeric subunits [21,22,23]. In the protective subunit, the Au atoms are linked by bridging thiolate groups covalently linked to the core by sulfur in an approximately atop positions. It was detected to be markedly active for oxidation of styrene and cyclohexane, hydrogenation of aldehydes and ketones and electrochemical reduction of O2 [24,25,26]. Our group also reported the ability of this material to produce CO via electrochemical reduction of CO2 in aqueous solution [27]. The product begins to form at an onset potential of −0.193 V vs the reversible hydrogen electrode (RHE) at ambient conditions. A current efficiency of nearly 100% for CO formation was achieved at −1 V vs RHE with concomitant rate that is much higher compared to bulk Au catalysts. It was suggested from our DFT calculations that the predicted stable adsorption of CO2 on specific pocket sites on the intact cluster was the key step in the conversion process.
We subsequently revisited this process employing the CHE method with the objective of further characterizing the reaction mechanism [28]. From an atomic-scale perspective, the CO2 reduction reaction (CO2RR) is suggested to proceed via two-electron pathway according to [29,30]:
Step I
CO2(g) + H+(aq) + e + * → *COOH
Step II
*COOH + H+(aq) + e → *CO + H2O(aq)
Step III
*CO → CO(g) + *
where *, *COOH and *CO represents a binding site, adsorbed COOH and adsorbed CO. In this reaction sequence, the binding strength of COOH and CO will be a key predictor to the performance. That is, the energetic stabilization and reduction of *COOH (steps I–II) dictates the ease of formation of CO.
The analysis was begun by looking at the CO2RR on the fully ligand protected cluster and the result at 0 V vs RHE is shown in Figure 1. The reaction onset potential is an important parameter that can be extracted from the calculated free energy diagrams and directly compared with experimental data. This is defined as the potential at which in the product direction, all reaction steps become downhill or exothermic in free energy, namely U o n s e t = max ( ( Δ G I , Δ G I I , Δ G I I I ) / e ) where Δ G i is the free energy for reaction step i at U = 0 V while e is the charge of an electron [31]. Thus, the onset potential is the minimum applied potential required to facilitate the formation of relevant intermediates. We see that the pathway on the intact cluster has a predicted onset potential of Uonset = −2.04 V with CO2(g) + H+(aq) + e + * → *COOH as the corresponding potential determining step. This value is far larger than the experimentally determined value of −0.193 V. However, if we now consider the onset potential on a model defective cluster generated by removal of a single thiolate ligand exposing a gold atom, we see a dramatic difference (Figure 2). The key outcome is that *COOH formation is dramatically stabilized on the dethiolated cluster compared with the intact one with corresponding Uonset = −0.34 V which is relatively much closer to the experimental value. The very high predicted Uonset suggests that CO2 reduction on the fully ligand protected species is ruled out unless very high potentials are applied. The most feasible pathway requires a condition in which at least a thiolate ligand is lost and a free gold atom is now exposed in the cluster. Mpourmpakis and co-workers have subsequently confirmed the exposed free gold atom resulting from removal of thiolated ligands is the active site for this process [32].

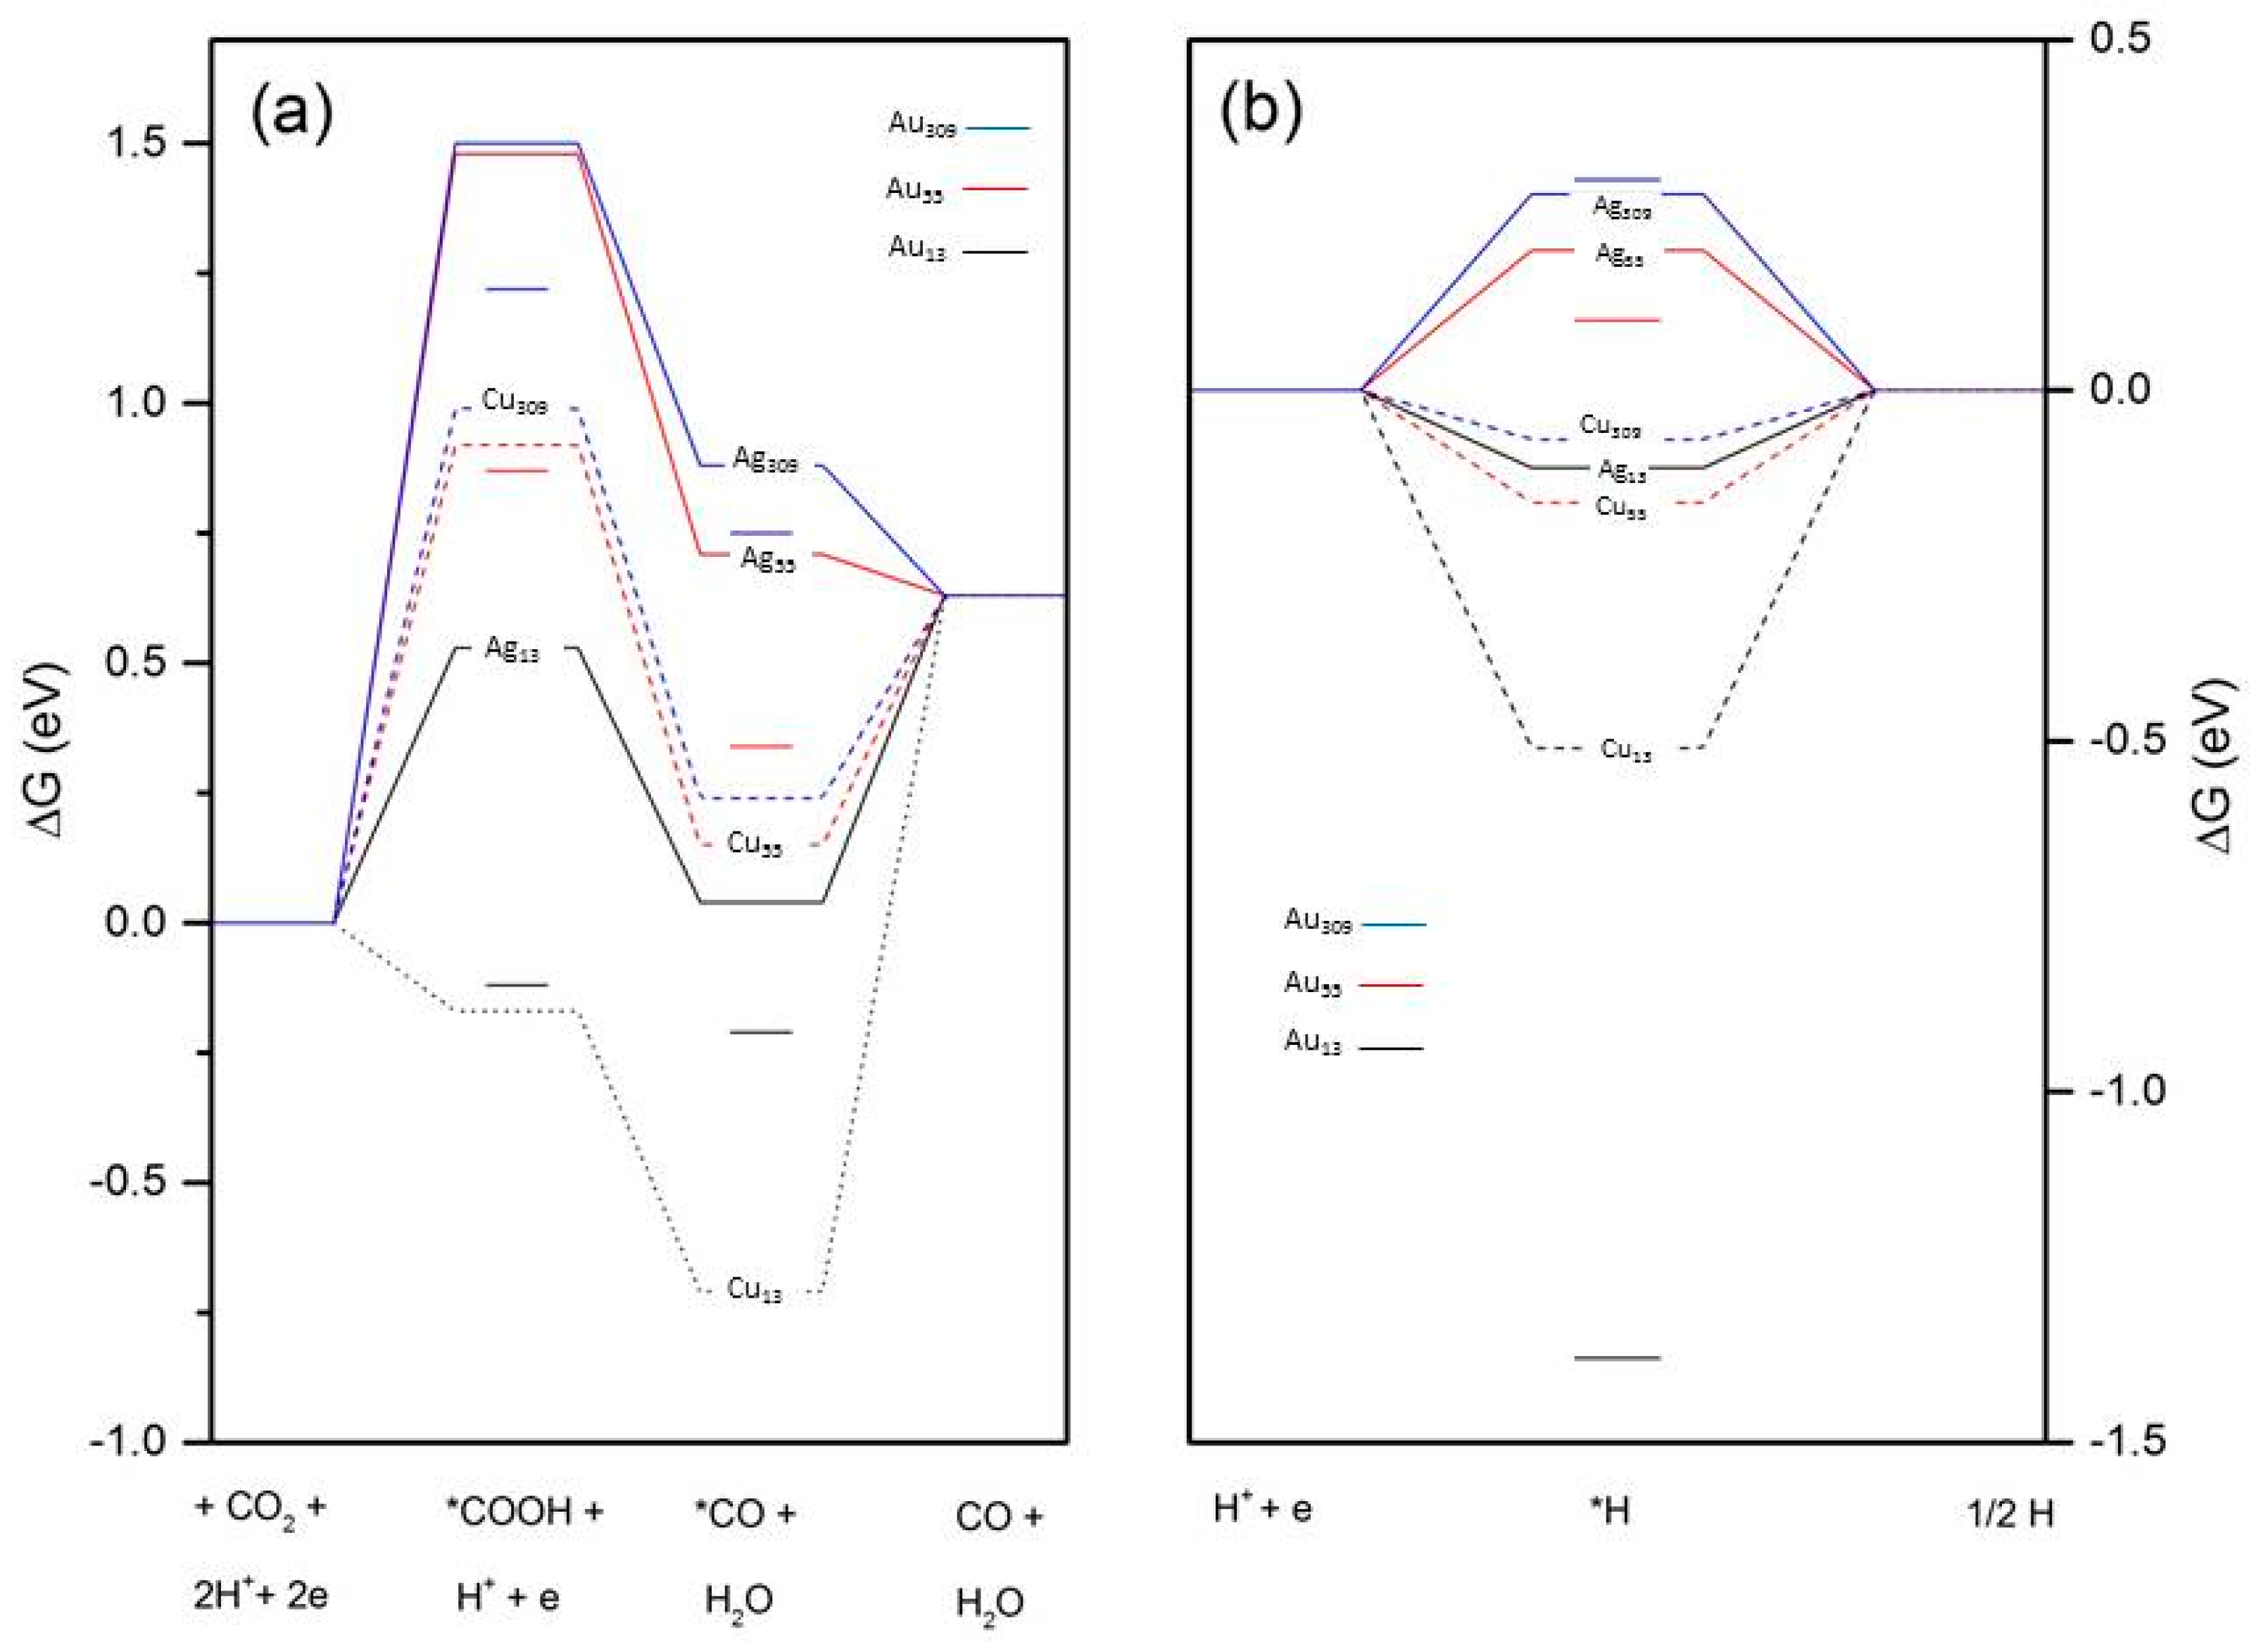
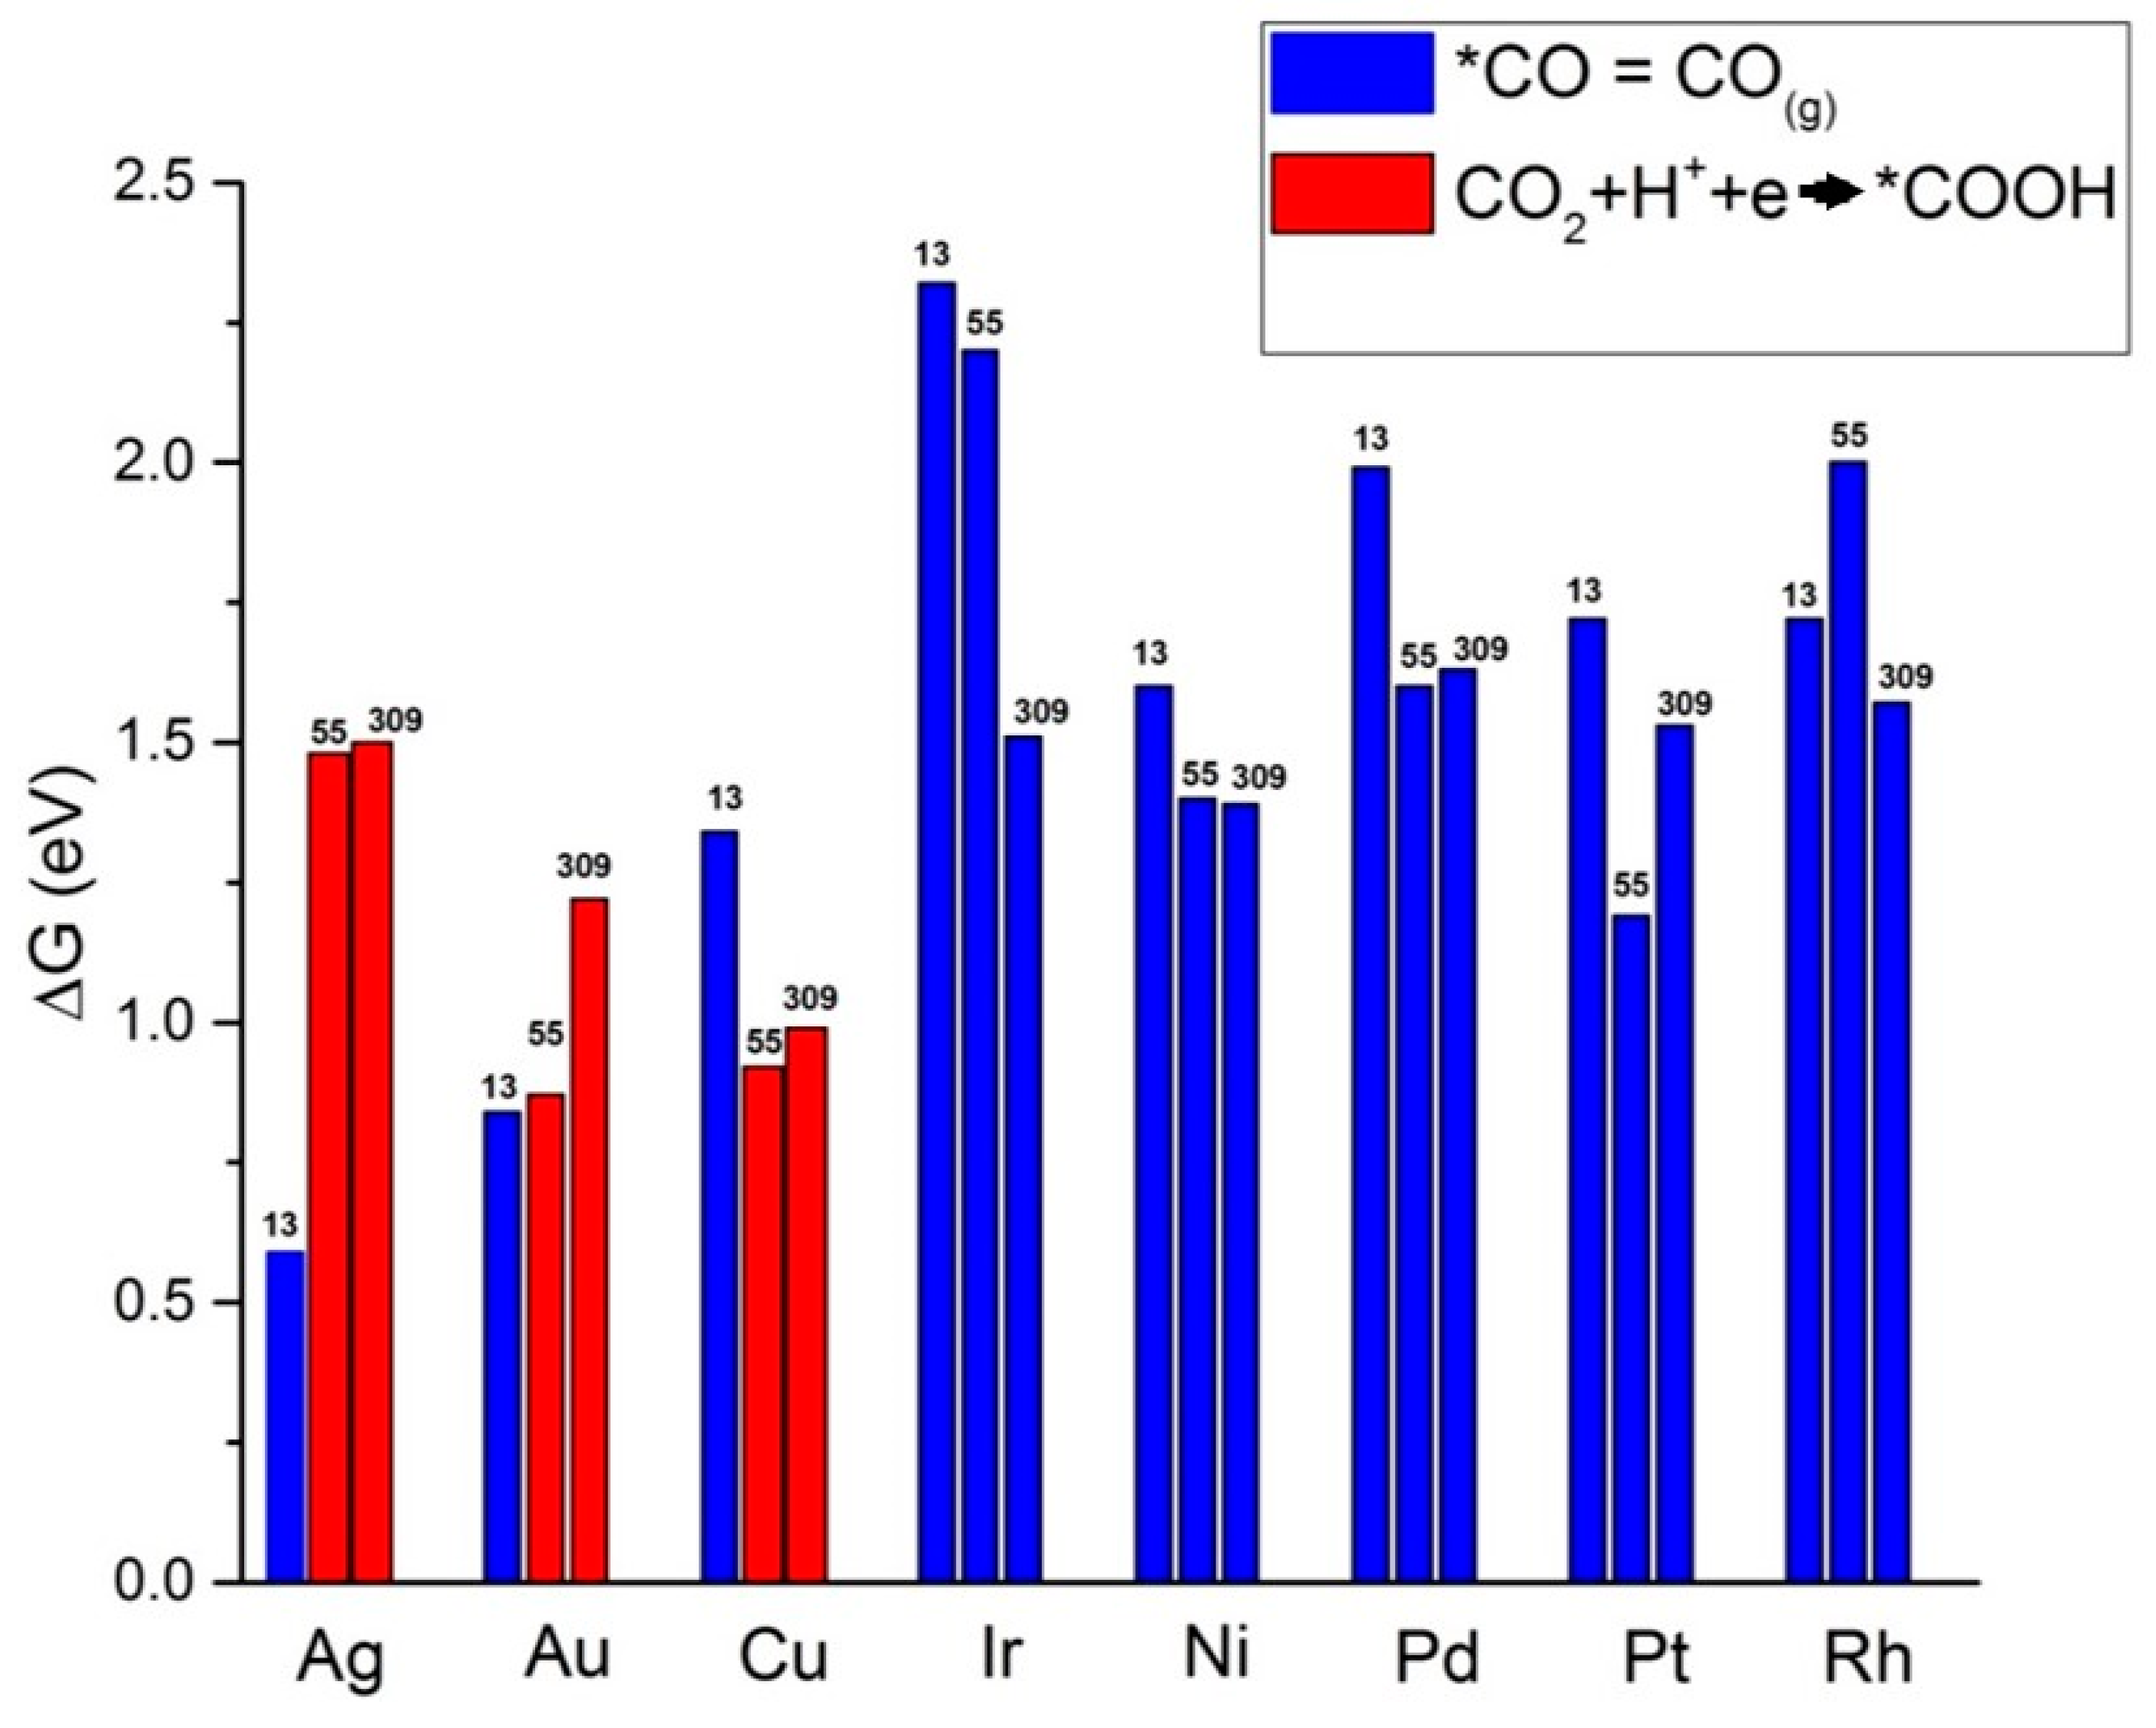
3.2. CO2RR vs HER on Metal Nanoparticles

Reports of using metal nanoclusters as systems for providing platforms for CO2 electrocatalytic conversion have begun to increase with Au, Cu and Pd as the metal components [33,34,35,36]. These structures maximize the area of catalytic active sites and also show size dependent catalytic properties. For example, Mistry et al. fabricated Au nanoparticles with size ranging from 1.1–7.7 nm to ascertain their performance for CO2 electroreduction [34]. With decreasing size, samples were found to exhibit jump in the overall catalytic activity at −1.2 V vs SHE with the hydrogen evolution process (HER) becoming more dominant for those below 5 nm. The concomitant DFT calculations suggest substantial stabilization of intermediates attributed to the decrease of coordination number of the active sites. Similar to Au, the decrease in the coordination number in Cu and Pd nanoparticles is linked to their significant change in the activity and product distribution [35,36].
We previously reported the use of the CHE approach to further explore these phenomena. The CO2RR on Au, Ag, Cu, Ir, Ni, Pd, Pt and Rh nanoparticles with different sizes were examined including the impact of the competing HER [37]. Model icosahedron metal nanoparticles between ~0.5 to ~2.0 nm in diameter (particle size of 13, 55 and 309 atoms) were considered (Figure 3). For CO2RR, steps I-III was adopted while the HER consisted of two consecutive proton-electron pair steps [34,38]:
Step IV
H+(aq) + e + * → *H
Step V
*H + H+(aq) + e → * + H2
First, considering the CO2RR on the coinage metals (Figure 4a), we see that *COOH formation is limiting the reaction at 0 V for the 55 and 309 atom clusters with reduction in thermodynamic barrier as the size decreases. *COOH is generally more stabilized at Cu55 and Cu309, and they are expected to more efficiently reduce CO2 into COOH compared with Ag and Au. In all cases, stabilization of *COOH is accompanied by concomitant stabilization of *CO. Though *COOH formation remains the most difficult step on Cu55 and Cu309, the production of CO is predicted to be more difficult since the corresponding desorption event becomes more energetically unfavorable. In contrast, the most energetically difficult step for the smallest 13 atom cluster is the desorption or further reduction of *CO, and CO poisoning is a likely problem. In the case of HER, the H+ + e → *H step becomes more favorable with decreasing particle size (Figure 4b). On all Cu, it is favorable due to strong *H adsorption. The reduction step becomes spontaneous for the smallest cluster while the desorption step becomes uphill.
Having established the CO2RR and HER for the coinage metals, we then looked at trends across the other metals. For a given size, the transition metals are predicted to bind COOH species more strongly than coinage metals, meaning that *COOH formation is a relatively favorable step on the transition metals. However, this is offset by stronger *CO binding affinity. Figure 5 shows the most difficult step in the CO2RR pathway and the associated free energy barriers at all NPs. These results predict the release of gaseous CO would be sluggish for all transition metal NPs. For the coinage metals, only the 13-atom clusters exhibit this behavior. It should be noted that the other obstacle preventing efficient CO2 reduction is the potential hydrogen poisoning of the active site. Comparison of the ΔG for *H and *COOH formation at all NPs indicate that *H formation is more favorable. Thus, the calculations predict that all NPs will preferentially adsorbed hydrogen at cathodic potentials.
Our predicted trends for the CO2RR and HER on icosahedral Au13 NP are consistent with the previous DFT work of Zhu et al. using the revised PBE (RPBE) electron correlation functional [33]. For example, the *COOH and *CO formation at low coordination sites are endothermic and exothermic, respectively, with the desorption of strongly bound *CO as the thermodynamic limiting step. The ΔG of *H is also found to be more favorable than that of *COOH, leading them to suggest that CO2RR would be suppressed on this cluster particularly at low applied bias.
The NP size effect at cuboctahedral Au55 and truncated-octahedron Au38 NPs, Au(111) and Au(211) was also modeled using DFT-PBE by Mistry et al. [34]. The predicted CO2RR diagram shows reduced ΔG for *COOH and *CO for the smaller particle in comparison to the flat and stepped surfaces with likely increased H2 evolution from the NP. The stabilization of *COOH and *CO intermediates with decreasing particle size was also found in this work. Preferential HER was also predicted here for smaller particles as the ΔG of *H formation is less positive than that of *COOH formation.
The comparative binding of *COOH, *CO and *H on icosahedral Au and Ag NP were investigated with DFT-RPBE [39]. Systematic studies of adsorption of the intermediates on the corner sites with different sizes (N = 13, 55, 147, 309) were conducted. Their results reveal a general pattern of strong binding with decreasing size with the adsorption on Au more favored compared to Ag. Quantum size effects are found to be significant particularly for the smallest size 13-atom clusters. Studies of CO2RR to CO and HER processes on both Au309 and Ag309 reveal the preference to bind *H over *COOH so that these NP are more prone to produce H2. All these predicted trends are seen in our results. Previous DFT calculations also predicted enhanced *COOH and *CO binding at cuboctahedral Pd55 and truncated-octahedron Pd38, with *CO desorption the most difficult step compared with bulk surfaces [36].
There have been a number of studies aimed at optimizing materials for HER processes. It was previously shown that uniaxially strained tungsten carbide (WC) show improved HER activity when compared to the unperturbed one [40]. The DFT studies linked this phenomenon to the weakening of hydrogen surface bond which promotes desorption of H2 molecule. In contrast, tensile strain gave rise to low HER activity attributed to enhanced interaction of hydrogen with the surface. Surface hydrogen would prefer to accumulate rather than undergoing desorption. This behavior was also seen in the low facet surface of Au, Cu and Pt, namely, the uniaxially strained material has better HER activity compared to the tensile strained ones [41]. Another potential route to tailor the materials activity is to reduce its dimensionality. Advances in fabrication techniques have opened the door to the development of low-cost and lightweight two-dimensional materials for energy conversion application under electrochemical environment [42]. For example, ultra–thin Cu nanosheets stabilized by Ni(OH)2 is found to be selective for electrochemical CO2 to CO conversion with Faradaic efficiency of 92% at less than −0.5 V over potential [6]. The DFT studies revealed the critical role of under coordinated sites at the edge as responsible for its chemical activity. It is intriguing to explore whether the various nanoparticles considered here will display different activity under strain or under reduced dimensionality. Obviously, there are still many open questions related to this point and they should continue to provide opportunities for fruitful research for many years to come.

3.3. Water Splitting on Organometallic Complexes

Organometallics complexes composed of earth-abundant metals have been reported to efficiently electrocatalyze hydrogen and oxygen evolution reactions [43,44,45]. The water splitting reaction in particular gives rise to an important energy carrier, H2, which can be used as feedstock within the context of CO2RR. Unlike heterogeneous catalysts, the reactive surface structure of these small organometallics can be accurately described, and the active sites identified. In our group we recently synthesized and characterized small size metal thiolate complexes M6(SCH3)12 with M = Ni, Fe, Pd, and Rh to electrocatalyze oxygen evolution reactions using computational techniques and thermodynamic analysis [44,45]. These stable complexes possess a tiara-like structure stabilized by metal-S π bonds, where the six metal atoms are distributed in a nearly hexagonal ring with twelve bridging sulfur atoms (see Figure 6a). In these materials, the OER occurs at potentials that are more anodic than the transition metal oxidation wave [44]. Therefore, the reactive surfaces are covered with 5/6 oxygen monolayer leaving one metal cation vacant as active site (Figure 6a).
It has been shown that the onset potential and corresponding potential determining steps can be extracted from OER free energy diagrams [31,46]. Typically, OER involves four major steps and each step is accompanied with a release of a proton and electron. The reaction initiates from the oxidation of a water molecule with adsorption of OH* on the free metal site. The adsorbed OH* then oxidized into O* which reacts with another water molecule to form OOH*. After further oxidation, the OOH* intermediate is desorbed from the electrode, releasing O2 gas as final product (Figure 6a,b). Analysis of the thermodynamics barriers indicates that for Rh and Fe complexes, all the steps are uphill energetically. In the case of Pd complex, the last step is downhill. We predicted the onset potential of these complexes to increase as Ni < Rh < Pd < Fe, with the theoretical potential of Ni being within ~0.14 V of the experimentally determined value. This increase was directly associated to the binding affinity of the transition metal with the intermediates. We noted that the adsorption strength of O, OH, and OOH follows the order Pd < Ni < Rh < Fe, with the strongest adsorption on Fe which results to a larger overpotential (Figure 6c). We also observed that these adsorption strengths (energies) correlated linearly with the ring diameter of the oxidized complexes. Moreover, the predicted overpotential showed a maximum activity at Ni complex when plotted against the diameter of the hexagonal ring, suggesting that the ring diameter of the oxidized complexes can be used as descriptors for OER activity (Figure 6d) [45].
To improve OER activity, surface modification through doping/substitution has proven to be an efficient strategy. For example, Liao and co-workers increase the OER activity of hematite by doping it with Ni and Co [47]. Garcia-Mota and co-workers tailored the activity for OER on rutile TiO2 surface by transition-metal substitution and found a lower overpotential for the doped-TiO2 [48]. We modified the surface of these organometallics by substituting the metal active site in M6(SCH3)12 (M = Rh, Pd, Fe) with a Ni atom. We found a reduction of the onset potential by approximately 0.45 and 0.29 V for Pd and Rh complexes, respectively. The enhanced overpotential is caused by a shift of the binding energies of intermediates with Ni active sites surrounded by Pd or Rh toward that of Ni6(SCH3)O5.
While the 4 electron-proton transfers direct-mechanism have been commonly used in water splitting, a less explored mechanism involves a 2-electron pathway with formation of hydrogen peroxide (H2O2) [49,50]. The production of H2O2 from the electrochemical reduction of O2 occurs in acidic environments since H2O2 decomposes under alkaline conditions. This process involves 2 coupled electron transfers and one reaction intermediate (OOH*). Although several electrocatalysts have been explored to produce H2O2, their performance has been modest due to the dominating pathway to H2O [51,52,53]. Much work needs to be done to find suitable catalysts with high selectivity towards H2O2.

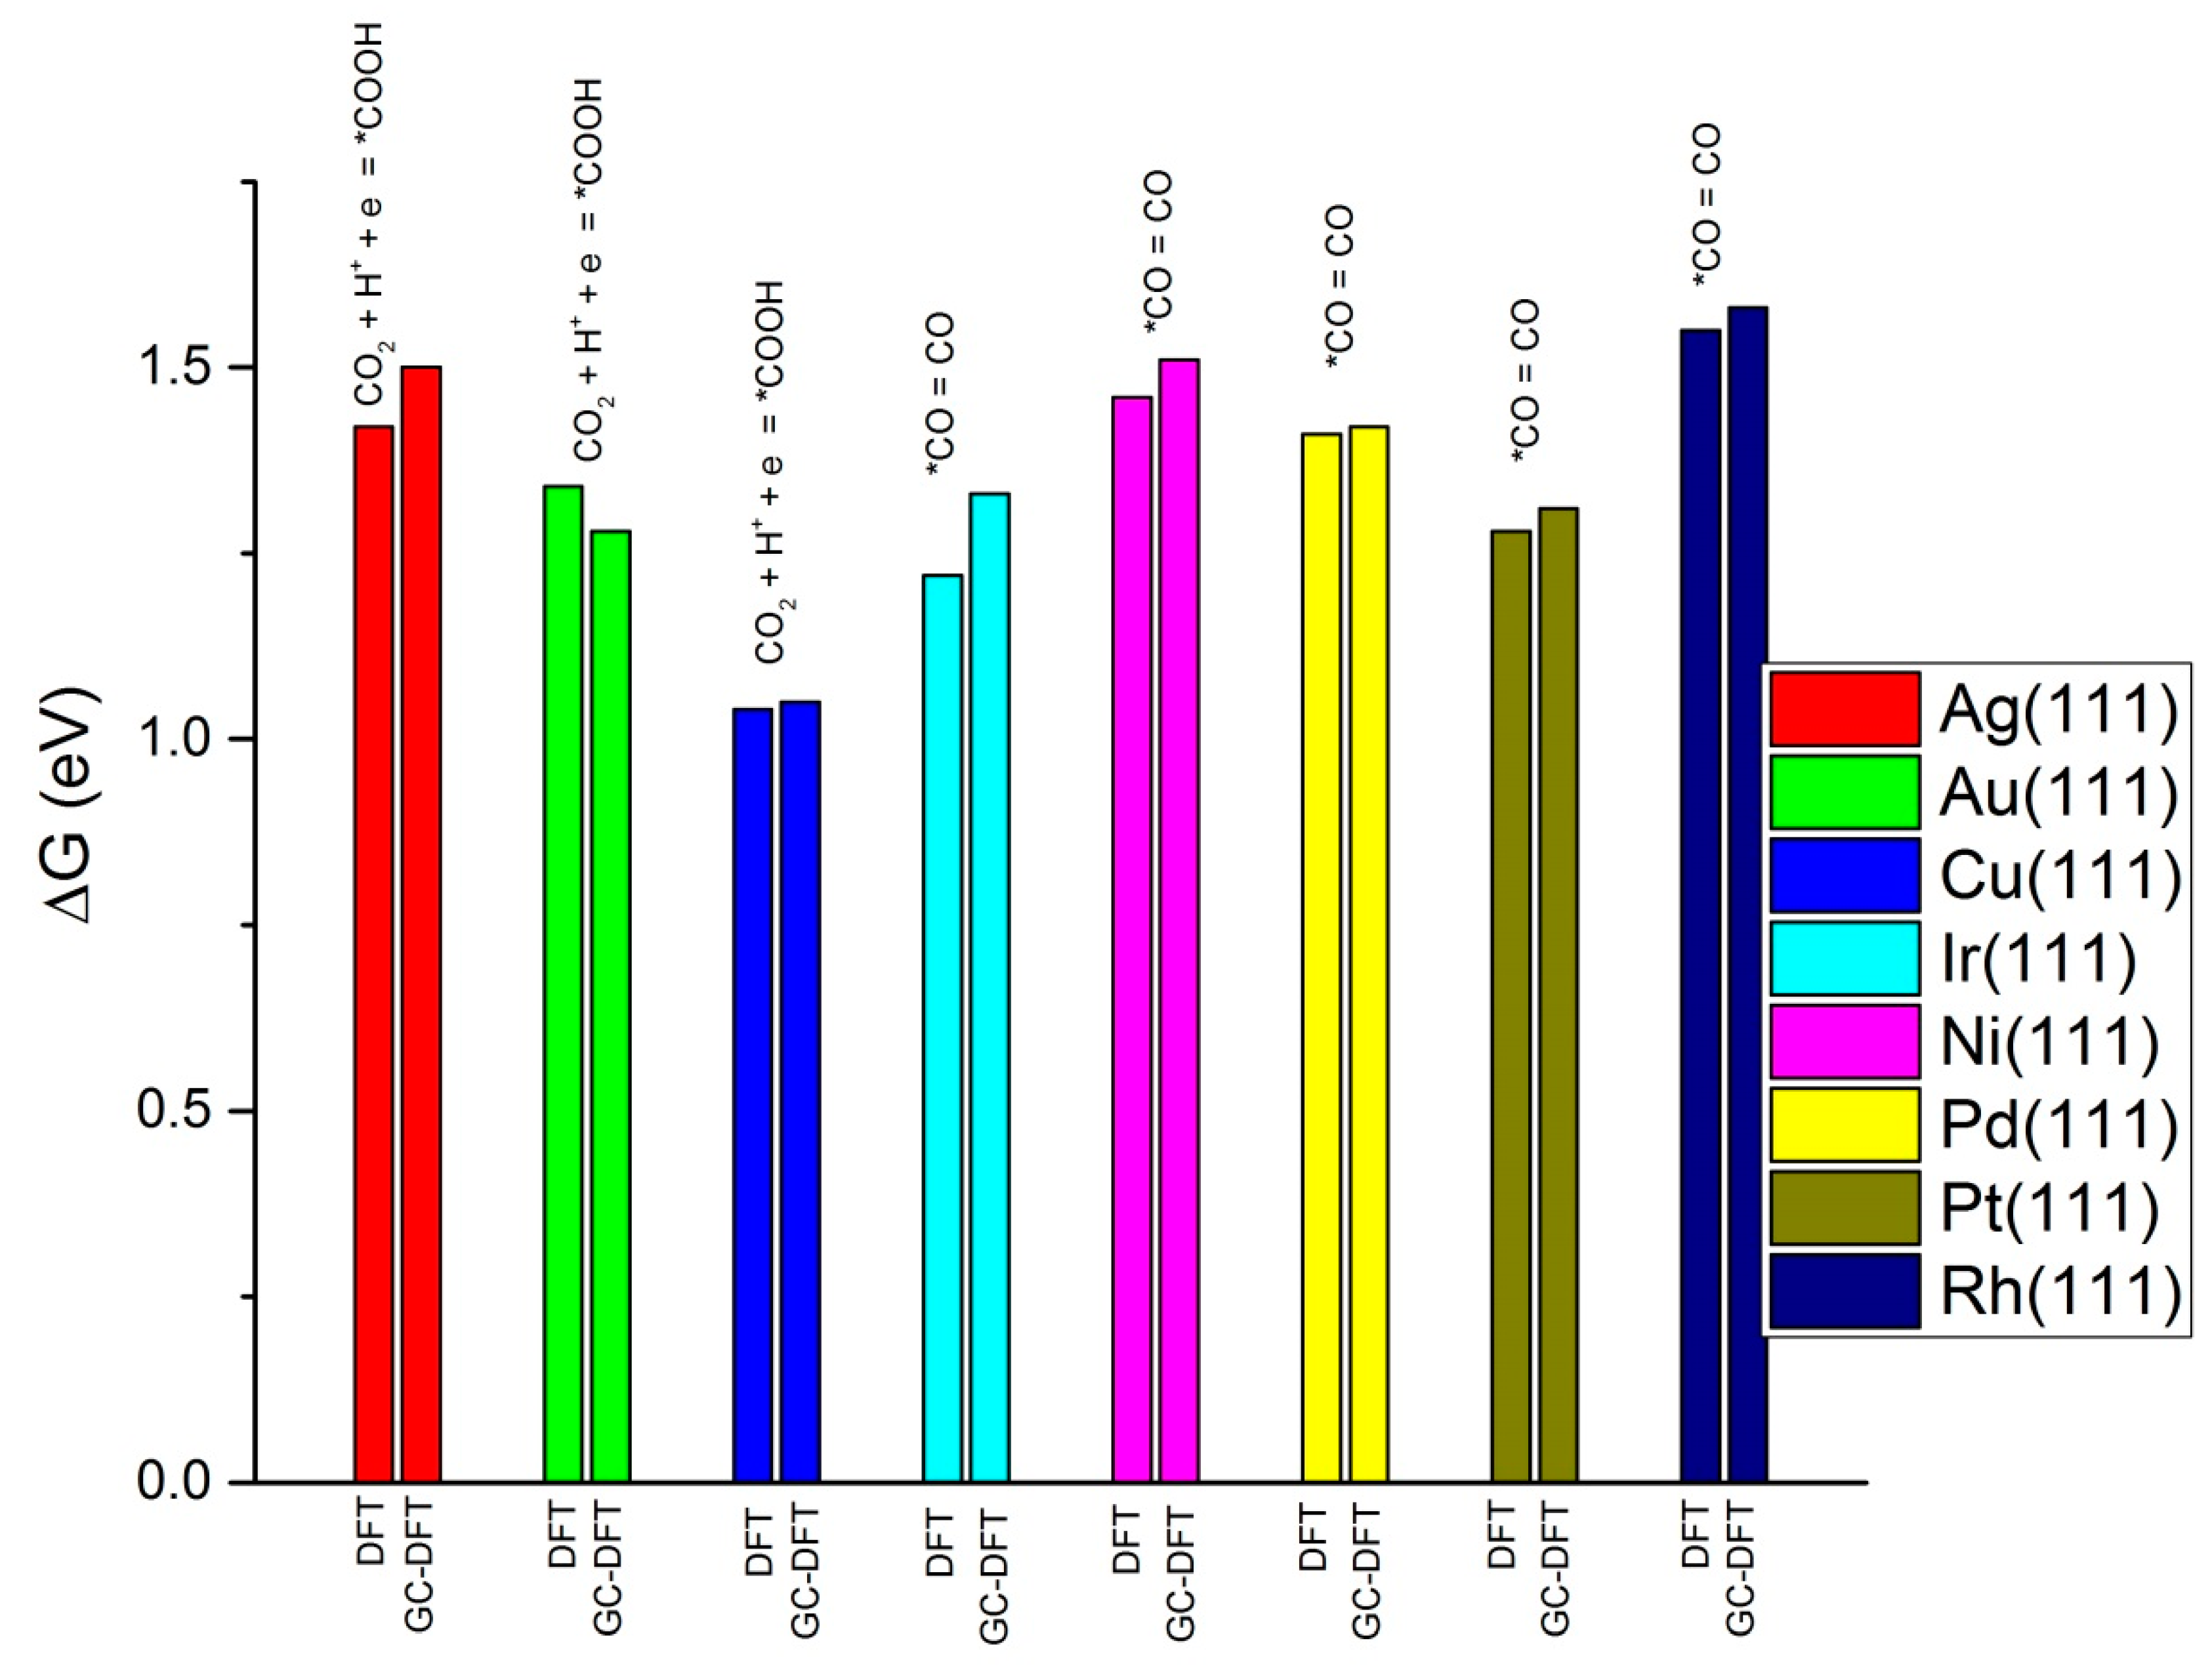
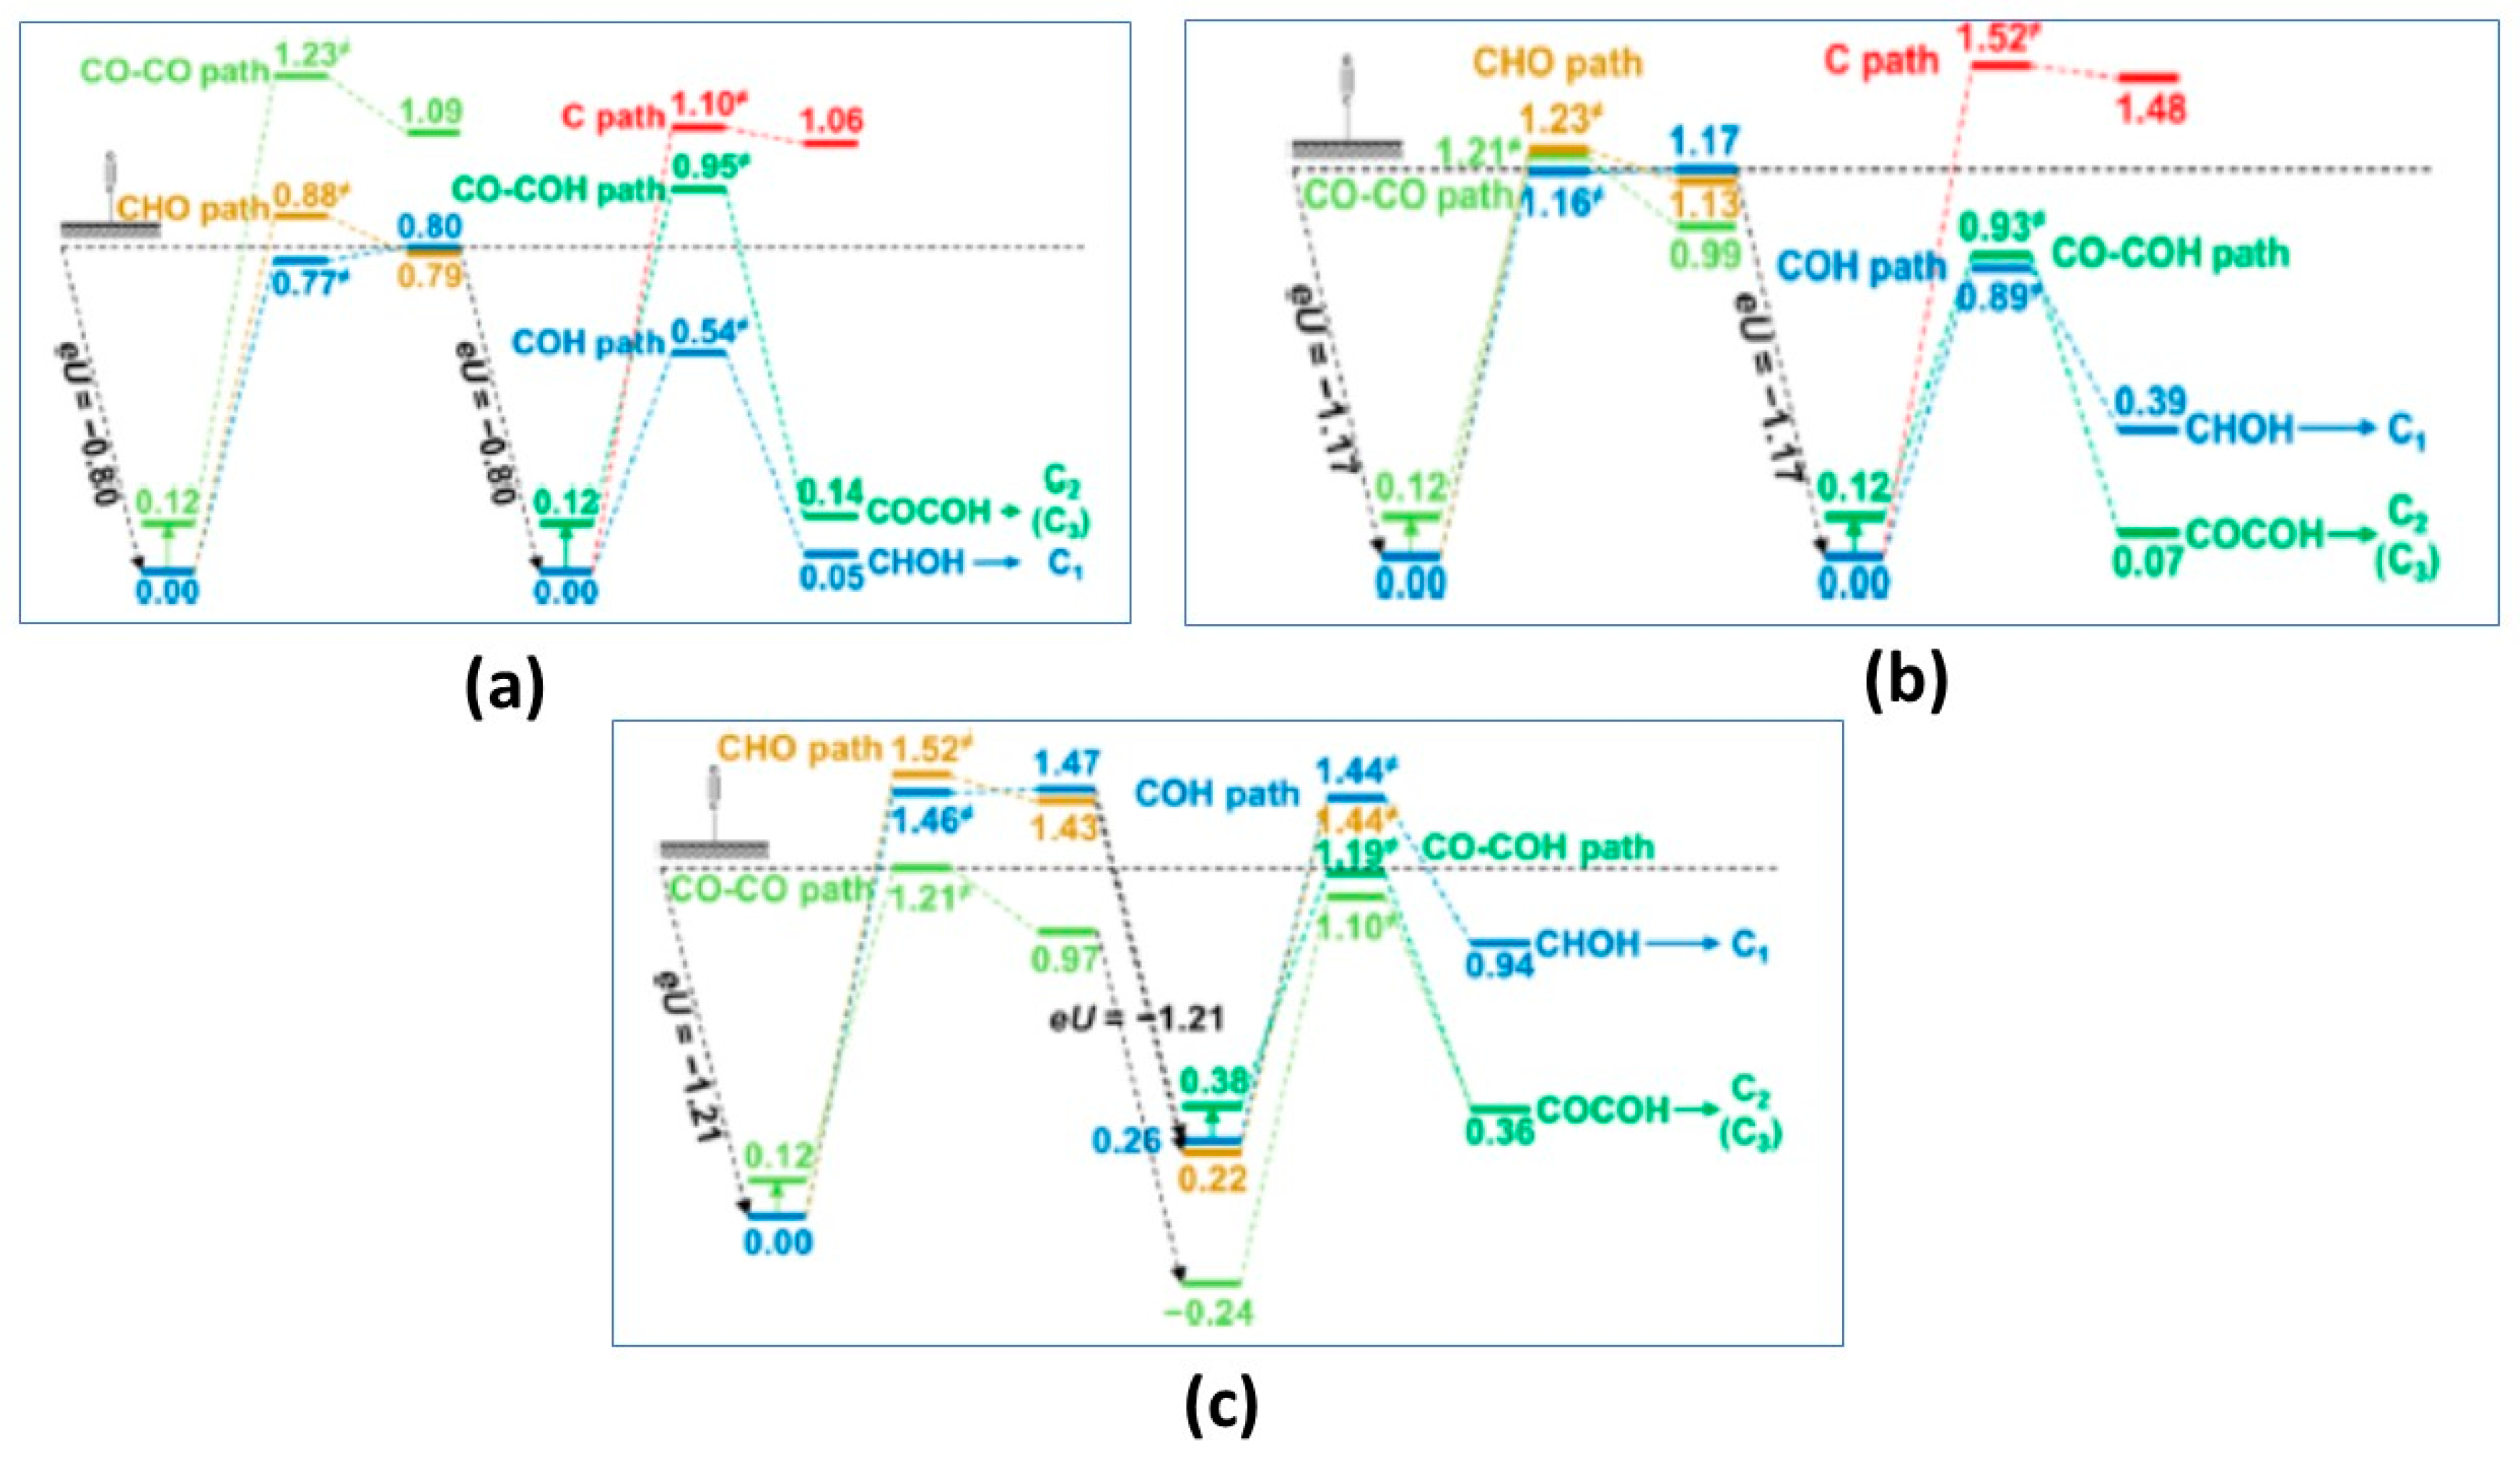
4. Beyond the Computational Hydrogen Electrode Method: The Grand Canonical Density Functional Theory Approach

Any method that aims to improve over the CHE method has to take into account the full details of the influence of the interaction between species and the electrode itself at a specific potential. Efforts have been made by Filhol and Neurock to go beyond the thermodynamic approximation by adding and removing fractions of electrons coupled with the inclusion of a uniform background countercharge [54]. In the approach of Ottani and Sugino, external potential is included by dragging electrons from one side of the periodic slab to another [55]. The scheme of Skulason et al. involves varying proton/electron concentration to study a system as a function of electrode potential [56]. In a different approach Rossmeisl et al. rely on the use of different supercell sizes and then extrapolating calculated energies from canonical, constant charge DFT simulations to constant electrode potential. In this method, the electrode potential is controlled indirectly by varying the concentration of solvated protons [57]. While these schemes are conceptually simple, the computational expense can be immense, especially for modeling larger systems such as nanoparticles.
In recent years, advances have been accomplished in the implementation of constant potential schemes within the framework of quantum mechanical approaches. This elegant solution involves treating the electrons in the grand canonical ensemble allowing the number of electrons to change during the electronic structure self-consistency loop. In the scheme proposed by Goodpaster, the electrochemical potential was set by relating the applied potential to the Fermi energy and then calculating the number of electrons required by the simulation cell for that specific Fermi energy [58]. Sundararaman et al. presented an alternative scheme for carrying out constant chemical potential µ calculations based on finite temperature grand canonical density functional theory (GCDFT) ansatz where the number of electrons N adjusts accordingly as dependent variables [10]. The relevant free energy minimized at equilibrium is the grand free energy:
  Ω = A   μ N  
where A is defined as:
  A = A J D F T [ n ( r ) , N α ( r ) ] +   d r V ( r ) n ( r ) + α d r V a ( r )  
The last two terms represent effects due to external electron potential and the external potential on the liquid nuclei. The first term AJDFT is a universal functional independent of these external potentials expressed as a sum of Hohenberg-Kohn electronic density functional for the solute and a solvation term in which the liquid is described directly in terms of its average density rather than individual configurations. Therefore, this model combines solvent treatment and explicit accounting of the electrochemical potential.
Another crucial point is the convergence of the overall scheme. The conventional route such as the one by Goodpaster is to converge the energy given an initial number of electrons. The number of electrons is then changed by ΔN to obtain a new value for μ. This procedure is carried out until a converged wave function is obtained at the desired value of the chemical potential. The disadvantage of this approach is that the number of iterations needed can be fairly high, resulting into considerable computational overhead. Direct minimization of the free energy functional Ω with respect to the Kohn-Sham orbitals adopted by Sundaraman et al. represents an attempt to simultaneously achieve computational efficiency and accuracy. Briefly, the algorithm employs a robust analytically continued functional for energy minimization instead of the typical self-consistent field schemes. The readers are referred to Ref. [10] for further details.
In the following, we highlight the preliminary results of our application of this scheme to the study of CO2 electro-reduction on the close packed facets of Au, Ag, Cu, Pt, Pd, Ni, Ir, and Rh. The free energies of reaction species were calculated using plane wave grand canonical DFT as implemented in the software program JDFTx [59]. Calculations were performed on the (1 1 1) facet of the face centered cubic metals. The surfaces were modeled using a periodic 3 × 3 unit cell with three layers of metal atoms and 15 Å of vacuum between successive slabs. The metal atoms in the bottom layer were fixed at their optimized bulk positions. Adsorption was permitted on only one of the two exposed surfaces. The Kohn-Sham one electron states are expanded in a series of plane waves with an energy cutoff of 520 eV. All calculations in this work employed the PBE exchange correlation functional and for Brillouin zone integration, we used a Fermi smearing and a Monkhorst-Pack 3 × 3 × 1 k-point mesh. We used the CANDLE solvation model to describe the effect of liquid water and Debye screening due to 0.1 M electrolyte [60].
Figure 7 shows the most difficult step on close packed facets of the metals and the associated thermodynamic barrier. Results from the simple CHE method (left) and explicitly accounting for electrode potential through the grand canonical DFT are both included. We begin our analysis by describing GCDFT trends across all metals studied. The formation of *COOH intermediate is found to be the most energy demanding step for the coinage metals. We rank the difficulty of C–surface bond formation barriers listed in ascending order as Cu (1.05 eV) < Ag (1.28 eV) < Au (1.50 eV). For the transition metals, the release of gaseous CO is predicted to be the most difficult step. Because the removal of CO adatoms is very sluggish, either the catalyst essentially becomes poisoned or CO is further subject to protonation steps under reducing conditions.
The corresponding CHE results show a similar trend, with *COOH formation and CO desorption as the limiting step on coinage and transition metals, respectively. The fact that the predicted thermodynamic barriers differ from the GCDFT values by no more than ~0.2 eV reflects a good quantitative agreement. This preliminary comparison shows that for the considered systems, explicitly accounting for the electrode potential may not be crucial for the prediction of semiquantitative thermodynamic trends under electrochemical conditions. It should be noted that our analysis neglects the presence of transition states and charged intermediates on the surface. Systems involving transition states are particularly computationally challenging for the CHE method as it requires sampling of many configurations such as the above mentioned Rossmeisl scheme in order to adjust the electron number so that it matches experimentally relevant electrode potentials. Each configuration would involve self-consistent DFT calculations with fixed number of electrons within a conventional canonical ensemble algorithm. GCDFT efficiently mimics the experimental conditions through the adjustment of the number of electrons to maintain a target electrode potential, thereby allowing direct first principles treatment of electrochemical phenomena.
This is representatively exemplified in the use of this methodology to examine reduction of CO on Cu(111) to methane and ethene [61]. The minimum energy pathways and corresponding activation energy barriers for all potential steps were calculated. Explicit constant electrochemical potential calculations were performed upon all initial states, transition states and final states geometries. Three mechanisms which are differentiated by pH are found: (1) a mechanism at acidic condition whereby the methane formation occurs through COH → CHOH pathway with multi-carbon production route kinetically hindered (Figure 8a). This is in agreement with experiment that shows that there is no C2H4 formation on Cu(111) at pH = 1; (2) a mechanism at neutral pH in which COH intermediate formation is not the limiting reaction rate for multi-carbon products (Figure 8b). This confirms the experimental conclusion that CH4 and C2H2 formation proceeds through the same intermediate on Cu(111) at pH = 7; (3) a mechanism at basic pH which favors CO dimerization rather than COH formation (Figure 8c). Consequently, the kinetic blocking of the single carbon pathway boosts the selectivity for multi-carbon products. The calculated onset potentials for each mechanism are accurate to within 0.05 eV with respect to experiment.

5. Concluding Remarks

The field of theoretical density functional theory studies on electrocatalytic reactions is rapidly expanding and developing. This short article serves to summarize the computational framework of the CHE method popularized by Norskov and coworkers. We discussed our group’s application of this technique to understand (i) mechanisms of CO2 reduction on ligand protected Au25 cluster and the origin of the small barrier to the CO2 reduction; (ii) aspects of CO2 reduction and hydrogen evolution reaction on metal nanoparticles and the concomitant size effects; (iii) mechanism of Ni-S based organometallic nanoparticles and their doped counterparts.
Computational modeling of electrochemistry using the CHE method is however hampered by the simple fact that the electrode potential is not an explicit variable in the quantum mechanical calculations. One approximate approach is to generate an electrochemical half-cell model where the number of electrons would match the desired experimental electrode potentials. But such approach is computationally demanding as it requires large super sales with statistically meaningful sampling of the aqueous portion. Recently, Sundararaman and coworkers have implemented DFT within the grand canonical framework which allow the number of electrons to fluctuate during the reaction. This non-constant charge picture is more adequate for electrochemistry where all the intermediates should be treated at the same potential. By investigating the CO2 electro-reduction on close packed surfaces of various metals, we have compared the CHE and the GCDFT methods. The present study shows that the CHE method is a valuable tool for quick assessment of general thermodynamic trends that uniform neutral intermediates. The situation is dramatically modified when transition states in particular are included in the reaction profile for which treatment with the GCDFT approach would present less computational challenge.

Author Contributions

Conceptualization, D.R.A; Writing-Original Draft Preparation, D.R.A. and D.N.T, Writing-Review & Editing, D.R.A., D.N.T. and D.R.K.

Funding

This research received no external funding.

Acknowledgments

This report was prepared as an account of work sponsored by an agency of the United States Government. Portions of this work were performed in support of the National Energy Technology Laboratory’s ongoing research under the RES contract DE-FE0004000. Our research group is greatly indebted to R. Sundararaman for his help with his JDFTx code. Neither the United States Government nor any agency thereof, nor any of their employees, makes any warranty, express or implied, or assumes any legal liability or responsibility for the accuracy, completeness, or usefulness of any information, apparatus, product, or process disclosed, or represents that its use would not infringe privately owned rights. Reference herein to any specific commercial product, process, or service by trade name, trademark, manufacturer, or otherwise does not necessarily constitute or imply its endorsement, recommendation, or favoring by the United States Government or any agency thereof. The views and opinions of author(s) expressed herein do not necessarily state or reflect those of the United States Government or any agency thereof.

Conflicts of Interest

The authors declare no conflict of interest.

References

  1. Gattrell, M.; Gupta, N.; Co, A. A review of the aqeous electrochemical reduction of CO2 to hydrocarbons at copper. J. Electroanal. Chem. 2006, 594, 1–19. [Google Scholar] [CrossRef]
  2. Hori, Y. Modern Aspects of Electrochemistry; Springer: New York, NY, USA, 2008. [Google Scholar]
  3. Aresta, M. Carbon Dioxide as Chemical Feedstock; Wiley: Wienheim, Germany, 2010. [Google Scholar]
  4. Ganesh, I. Conversion of carbon dioxide into methanol-A potential liquid fuel: Fundamental challenges and opportunity. Renew. Sustain. Energy Rev. 2014, 31, 221–257. [Google Scholar] [CrossRef]
  5. Seh, Z.W.; Kibsgaard, J.; Dickens, C.F.; Chorkendorff, I.; Nørskov, J.K.; Jaramillo, T.F. Combining theory and experiment in electrocatalysis: Insights into materials design. Science 2017, 355, eaad4998. [Google Scholar] [CrossRef] [PubMed]
  6. Jin, H.; Guo, C.; Liu, X.; Liu, J.; Vasileff, A.; Jiao, Y.; Zheng, Y.; Qiao, S.-Z. Emerging two-dimensional nanomaterials for electrocatalysis. Chem. Rev. 2018, 118, 6337–6408. [Google Scholar] [CrossRef] [PubMed]
  7. Calle-Vallejo, F.; Koper, M.T.M. First-principles computational electrochemistry; achievements and challenges. Electrochim. Acta 2012, 84, 3–11. [Google Scholar] [CrossRef]
  8. Steinmann, S.N.; Michel, C.; Schwiedernoch, R.; Sautet, P. Impacts of electrode potentials and solvents on the electroreduction of CO2: A comparison of theoretical approaches. Phys. Chem. Chem. Phys. 2015, 17, 13949–13963. [Google Scholar] [CrossRef] [PubMed]
  9. Letchworth-Weaver, K.; Arias, T.A. Joint density functional theory of the electrode-electrolyte interface: Application to fixed electrode potentials, interfacial capacitances, and potentials of zero charge. Phys. Rev. B 2012, 86, 075140. [Google Scholar] [CrossRef]
  10. Sundararaman, R.; Goddard, W.A.; Arias, T.A. Grand canonical electronic density-functional theory: Algorithms and applications to electrochemistry. J. Chem. Phys. 2017, 146, 114104. [Google Scholar] [CrossRef] [PubMed] [Green Version]
  11. Nørskov, J.K.; Rossmeisl, J.; Logadottir, A.; Lindqvist, L.; Kitchin, J.R.; Bligaard, T.; Jónsson, H. Origin of the overpotential for oxygen reduction at a fuel-cell cathode. J. Phys. Chem. B 2004, 108, 17886–17892. [Google Scholar] [CrossRef]
  12. Gubbins, K.E.; Moore, J.D. Molecular modeling of matter: Impact and prospects in engineering. Ind. Eng. Chem. Res. 2010, 49, 3026–3046. [Google Scholar] [CrossRef]
  13. Hafner, J. Ab-initio simulations of materials using vasp: Density-functional theory and beyond. J. Comp. Chem. 2008, 29, 2044–2078. [Google Scholar] [CrossRef] [PubMed]
  14. Mathew, K.; Sundararaman, R.; Letchworth-Weaver, K.; Arias, T.A.; Hennig, R.G. Implicit solvation model for density-functional study of nanocrystal surfaces and reaction pathways. J. Chem. Phys. 2014, 140, 084106. [Google Scholar] [CrossRef] [PubMed] [Green Version]
  15. Shen, V.K.; Siderius, D.W.; Krekelberg, W.P.; Hatch, H.W. Nist Standard Reference Simulation Website; Nist Standard Reference Database 173; National Institute of Standards and Technology: Gaithersburg, MD, USA, 2017.
  16. Daniel, M.-C.; Astruc, D. Gold nanoparticles:  Assembly, supramolecular chemistry, quantum-size-related properties, and applications toward biology, catalysis, and nanotechnology. Chem. Rev. 2004, 104, 293–346. [Google Scholar] [CrossRef] [PubMed]
  17. Sardar, R.; Funston, A.M.; Mulvaney, P.; Murray, R.W. Gold nanoparticles: Past, present, and future. Langmuir 2009, 25, 13840–13851. [Google Scholar] [CrossRef] [PubMed]
  18. Rodriguez, P.; Kwon, Y.; Koper, M.T.M. The promoting effect of adsorbed carbon monoxide on the oxidation of alcohols on a gold catalyst. Nat. Chem. 2011, 4, 177–182. [Google Scholar] [CrossRef] [PubMed]
  19. Jin, R. Quantum sized, thiolate-protected gold nanoclusters. Nanoscale 2010, 2, 343–362. [Google Scholar] [CrossRef] [PubMed]
  20. Parker, J.F.; Fields-Zinna, C.A.; Murray, R.W. The story of a monodisperse gold nanoparticle: Au25L18. Acc. Chem. Res. 2010, 43, 1289–1296. [Google Scholar] [CrossRef] [PubMed]
  21. Heaven, M.W.; Dass, A.; White, P.S.; Holt, K.M.; Murray, R.W. Crystal structure of the gold nanoparticle [N(C8H17)4][Au25(SCH2CH2Ph)18]. J. Am. Chem. Soc. 2008, 130, 3754–3755. [Google Scholar] [CrossRef] [PubMed]
  22. Zhu, M.; Aikens, C.M.; Hollander, F.J.; Schatz, G.C.; Jin, R. Correlating the crystal structure of a thiol-protected Au25 cluster and optical properties. J. Am. Chem. Soc. 2008, 130, 5883–5885. [Google Scholar] [CrossRef] [PubMed]
  23. Akola, J.; Walter, M.; Whetten, R.L.; Häkkinen, H.; Grönbeck, H. On the structure of thiolate-protected Au25. J. Am. Chem. Soc. 2008, 130, 3756–3757. [Google Scholar] [CrossRef] [PubMed]
  24. Zhu, Y.; Qian, H.; Jin, R. Catalysis opportunities of atomically precise gold nanoclusters. J. Mater. Chem. 2011, 21, 6793–6799. [Google Scholar] [CrossRef]
  25. Zhu, Y.; Qian, H.; Drake, B.A.; Jin, R. Atomically precise Au25(SR)18 nanoparticles as catalysts for the selective hydrogenation of α,β-unsaturated ketones and aldehydes. Angew. Chem. Int. Ed. 2010, 49, 1295–1298. [Google Scholar] [CrossRef] [PubMed]
  26. Chen, W.; Chen, S. Oxygen electroreduction catalyzed by gold nanoclusters: Strong core size effects. Angew. Chem. Int. Ed. 2009, 48, 4386–4389. [Google Scholar] [CrossRef] [PubMed]
  27. Kauffman, D.; Alfonso, D.; Matranga, C.; Qian, H.; Jin, R. Experimental and computational investigation of au25 clusters and CO2: A unique interaction and enhanced electrocatalytic activity. J. Am. Chem. Soc. 2012, 134, 10237–10243. [Google Scholar] [CrossRef] [PubMed]
  28. Alfonso, D.R.; Kauffman, D.; Matranga, C. Active sites of ligand-protected Au25 nanoparticle catalysts for CO2 electroreduction to CO. J. Chem. Phys. 2016, 144, 184705. [Google Scholar] [CrossRef] [PubMed]
  29. Peterson, A.A.; Abild-Pedersen, F.; Studt, F.; Rossmeisl, J.; Norskov, J.K. How copper catalyzes the electroreduction of carbon dioxide into hydrocarbon fuels. Energy Environ. Sci. 2010, 3, 1311–1315. [Google Scholar] [CrossRef]
  30. Hansen, H.A.; Varley, J.B.; Peterson, A.A.; Norskov, J. Understanding trends in the electrocatalytic activity of metals and enzymes for CO2 reduction to CO. J. Phys. Chem. Lett. 2013, 4, 388–392. [Google Scholar] [CrossRef] [PubMed]
  31. Rossmeisl, J.; Qu, Z.W.; Zhu, H.; Kroes, G.J.; Nørskov, J.K. Electrolysis of water on oxide surfaces. J. Electroanal. Chem. 2007, 607, 83–89. [Google Scholar] [CrossRef]
  32. Zhao, S.; Austin, N.; Li, M.; Song, Y.; House, S.D.; Bernhard, S.; Yang, J.C.; Mpourmpakis, G.; Jin, R. Influence of atomic-level morphology on catalysis: The case of sphere and rod-like gold nanoclusters for CO2 electroreduction. ACS Catal. 2018, 8, 4996–5001. [Google Scholar] [CrossRef]
  33. Zhu, W.; Michalsky, R.; Metin, O.; Lv, H.; Guo, S.; Wright, C.J.; Sun, X.; Peterson, A.A.; Sun, S. Monodisperse au nanoparticles for selective electrocatalytic reduction of CO2 to CO. J. Am. Chem. Soc. 2013, 135, 16833–16836. [Google Scholar] [CrossRef] [PubMed]
  34. Mistry, H.; Reske, R.; Zeng, Z.; Zhao, Z.-J.; Greeley, J.; Strasser, P.; Roldan Cuenya, B. Exceptional size-dependent activity enhancement in the electroreduction of CO2 over Au nanoparticles. J. Am. Chem. Soc. 2014, 136, 16473–16476. [Google Scholar] [CrossRef] [PubMed]
  35. Reske, R.; Mistry, H.; Behafarid, F.; Cuenya, B.; Strasser, P. Particle size effects in the catalytic electroreduction of CO2 on Cu nanoparticles. J. Am. Chem. Soc. 2014, 136, 6978–6986. [Google Scholar] [CrossRef] [PubMed]
  36. Gao, D.; Zhou, H.; Wang, J.; Miao, S.; Yang, F.; Wang, G.; Wang, J.; Bao, X. Size-dependent electrocatalytic reduction of CO2 over Pd nanoparticles. J. Am. Chem. Soc. 2015, 137, 4288–4291. [Google Scholar] [CrossRef] [PubMed]
  37. Alfonso, D.R.; Kauffman, D.R. Assessment of trends in the electrochemical CO2 reduction and H2 evolution reactions on metal nanoparticles. MRS Commun. 2017, 7, 601–606. [Google Scholar] [CrossRef]
  38. Zhu, W.; Zhang, W.J.; Zhang, H.; Lv, H.; Li, Q.; Michalski, R.; Peterson, A.A.; Sun, S. Active and selective conversion of CO2 to CO on ultrathin Au nanowires. J. Am. Chem. Soc. 2014, 136, 16132–16135. [Google Scholar] [CrossRef] [PubMed]
  39. Back, S.; Yeom, M.S.; Jung, Y. Active sites of Au and Ag nanoparticle catalysts for CO2 electroreduction to CO. ACS Catal. 2015, 5, 5089–5096. [Google Scholar] [CrossRef]
  40. Yan, K.; Kim, S.K.; Khorshidi, A.; Guduru, P.R.; Peterson, A.A. High elastic strain directly tunes the hydrogen evolution reaction on tungsten carbide. J. Phys. Chem. C 2017, 121, 6177–6183. [Google Scholar] [CrossRef]
  41. Yan, K.; Maark, T.A.; Khorshidi, A.; Sethuraman, V.A.; Peterson, A.A.; Guduru, P.R. The influence of elastic strain on catalytic activity in the hydrogen evolution reaction. Angew. Chem. Int. Ed. 2016, 55, 6175–6181. [Google Scholar] [CrossRef] [PubMed]
  42. Khan, A.H.; Ghosh, S.; Pradhan, B.; Dalui, A.; Shrestha, L.K.; Acharya, S.; Ariga, K. Two-dimensional (2D) nanomaterials towards electrochemical nanoarchitectonics in energy-related applications. Bull. Chem. Soc. Jpn. 2017, 90, 627–648. [Google Scholar] [CrossRef]
  43. Helm, M.L.; Stewart, M.P.; Bullock, R.M.; DuBois, M.R.; DuBois, D.L. A synthetic nickel electrocatalyst with a turnover frequency above 100,000 s-1 for H2 production. Science 2011, 333, 863–866. [Google Scholar] [CrossRef] [PubMed]
  44. Kauffman, D.R.; Alfonso, D.; Tafen, D.N.; Lekse, J.; Wang, C.; Deng, X.; Lee, J.; Jang, H.; Lee, J.-S.; Kumar, S.; et al. Electrocatalytic oxygen evolution with an atomically precise nickel catalyst. ACS Catal. 2016, 6, 1225–1234. [Google Scholar] [CrossRef]
  45. Tafen, D.N.; Kauffman, D.R.; Alfonso, D.R. Electrocatalytic oxygen evolution with pure and substituted M6(SR)12 (M = Pd, Fe, Rh) complexes. Comp. Mater. Sci. 2018, 150, 283–290. [Google Scholar] [CrossRef]
  46. Bajdich, M.; García-Mota, M.; Vojvodic, A.; Nørskov, J.K.; Bell, A.T. Theoretical investigation of the activity of cobalt oxides for the electrochemical oxidation of water. J. Am. Chem. Soc. 2013, 135, 13521–13530. [Google Scholar] [CrossRef] [PubMed]
  47. Liao, P.; Keith, J.A.; Carter, E.A. Water oxidation on pure and doped hematite (0001) surfaces: Prediction of Co and Ni as effective dopants for electrocatalysis. J. Am. Chem. Soc. 2012, 134, 13296–13309. [Google Scholar] [CrossRef] [PubMed]
  48. García-Mota, M.; Vojvodic, A.; Metiu, H.; Man, I.C.; Su, H.-Y.; Rossmeisl, J.; Nørskov, J.K. Tailoring the activity for oxygen evolution electrocatalysis on rutile TiO2 by transition-metal substitution. ChemCatChem 2011, 3, 1607–1611. [Google Scholar] [CrossRef]
  49. Siahrostami, S.; Verdaguer-Casadevall, A.; Karamad, M.; Deiana, D.; Malacrida, P.; Wickman, B.; Escudero-Escribano, M.; Paoli, E.A.; Frydendal, R.; Hansen, T.W.; et al. Enabling direct H2O2 production through rational electrocatalyst design. Nat. Mater. 2013, 12, 1137–1143. [Google Scholar] [CrossRef] [PubMed]
  50. Dai, L.; Xue, Y.; Qu, L.; Choi, H.-J.; Baek, J.-B. Metal-free catalysts for oxygen reduction reaction. Chem. Rev. 2015, 115, 4823–4892. [Google Scholar] [CrossRef] [PubMed]
  51. Ford, D.C.; Nilekar, A.U.; Xu, Y.; Mavrikakis, M. Partial and complete reduction of O2 by hydrogen on transition metal surfaces. Surf. Sci. 2010, 604, 1565–1575. [Google Scholar] [CrossRef]
  52. Jirkovský, J.S.; Panas, I.; Ahlberg, E.; Halasa, M.; Romani, S.; Schiffrin, D.J. Single atom hot-spots at Au–Pd nanoalloys for electrocatalytic H2O2 production. J. Am. Chem. Soc. 2011, 133, 19432–19441. [Google Scholar] [CrossRef] [PubMed]
  53. Shi, X.; Siahrostami, S.; Li, G.-L.; Zhang, Y.; Chakthranont, P.; Studt, F.; Jaramillo, T.F.; Zheng, X.; Nørskov, J.K. Understanding activity trends in electrochemical water oxidation to form hydrogen peroxide. Nat. Commun. 2017, 8, 701. [Google Scholar] [CrossRef] [PubMed] [Green Version]
  54. Filhol, J.-S.; Neurock, M. Elucidation of the electrochemical activation of water over Pd by first principles. Angew. Chem. Int. Ed. 2006, 45, 402–406. [Google Scholar] [CrossRef] [PubMed]
  55. Otani, M.; Sugino, O. First-principles calculations of charged surfaces and interfaces: A plane-wave nonrepeated slab approach. Phys. Rev. B 2006, 73, 115407. [Google Scholar] [CrossRef]
  56. Skulason, E.; Tripkovic, V.; Bjorketum, M.E.; Gudmunsdottir, S.; Karlberg, G.; Rossmeisl, J.; Bligaard, T.; Jonsson, H.; Norskov, J.J. Modeling the electrochemical hydrogen oxidation and evolution reactions on the basis of density functional theory calculations. J. Phys. Chem. C 2010, 114, 18182–18197. [Google Scholar]
  57. Rossmeisl, J.; Skúlason, E.; Björketun, M.E.; Tripkovic, V.; Nørskov, J.K. Modeling the electrified solid–liquid interface. Chem. Phys. Lett. 2008, 466, 68–71. [Google Scholar] [CrossRef]
  58. Goodpaster, J.D.; Bell, A.T.; Head-Gordon, M. Identification of possible pathways for C–C bond formation during electrochemical reduction of CO2: New theoretical insights from an improved electrochemical model. J. Phys. Chem. Lett. 2016, 7, 1471–1477. [Google Scholar] [CrossRef] [PubMed]
  59. Sundararaman, R.; Letchworth-Weaver, K.; Schwarz, K.A.; Gunceler, D.; Ozhabes, Y.; Arias, T.A. JDFTx: Software for joint density-functional theory. SoftwareX 2017, 6, 278–284. [Google Scholar] [CrossRef] [PubMed]
  60. Sundararaman, R.; Goddard, W.A. The charge-asymmetric nonlocally determined local-electric (candle) solvation model. J. Chem. Phys. 2015, 142, 064107. [Google Scholar] [CrossRef] [PubMed]
  61. Xiao, H.; Cheng, T.; Goddard, W.A.; Sundararaman, R. Mechanistic explanation of the pH dependence and onset potentials for hydrocarbon products from electrochemical reduction of CO on Cu (111). J. Am. Chem. Soc. 2016, 138, 483–486. [Google Scholar] [CrossRef] [PubMed]
Figure 1. Free energy diagram for electrochemical reduction of CO2 to CO on the intact cluster at T = 298 K, pH = 0 and zero applied potential. White, gray, blue, gold and red balls represent H, C, S, Au atom and O atoms, respectively. Reprinted from Ref. [28] with the permission of AIP Publishing. Copyright (2016) AIP Publishing.
Catalysts 08 00424 g001
Figure 2. Free energy diagram for electrochemical reduction of CO2 to CO on the dethiolated cluster at T = 298 K, pH = 0 and zero applied potential. White, gray, blue, gold and red balls represent H, C, S, Au atom and O atoms, respectively. Reprinted from Ref. [28] with the permission of AIP Publishing. Copyright (2016) AIP Publishing.
Catalysts 08 00424 g002
Figure 3. Schematic view of model icosahedron nanoparticles with different sizes showing the location of the “facet” active + sites.
Catalysts 08 00424 g003
Figure 4. Free energy diagrams for (a) CO2RR and (b) HER on Au, Ag and Cu NPs. Adapted and reprinted with permission from Ref [37]. Copyright (2017) Materials Research Society.
Catalysts 08 00424 g004
Figure 5. Calculated free energy barrier for the most difficult step in the reduction pathway for each metal. The blue and red bars correspond to *CO desorption and *COOH formation, respectively. For each metal, the left, center and right bars represent 13, 55 and 309 atom clusters. Reprinted with permission from Ref. [37]. Copyright (2017) Materials Research Society.
Catalysts 08 00424 g005
Figure 6. Schematic of the OER on M6(SCH3)12O5 (M = Fe, Pd, Rh) at room temperature and zero applied potential. (a) Predicted structures for all intermediates on Rh6(SCH3)12O5. The adsorbed OER intermediates are highlighted with red dashed circle; the active site is an O-free metal atom marked with an asterisk. Cyan, yellow, red, grey, and white are Rh, S, O, and C, respectively. (b) Gibbs free energy of reactions; (c) Trends in ΔGOH and ΔGOOH described by the diameter of the O-covered M6S12 ring, DMS Least-squares fits are provided together with the correlation coefficients. (d) Plot of the onset potential, Uonset, versus the diameter of the O-covered M6S12 (M = Fe, Rh, Ni, Pd) ring. Also included are the doped complexes (maroon color). The dashed lines are to guide the eyes. Adapted and reprinted with permission, from Ref. [45]. Copyright (2018) Elsevier B. V.
Catalysts 08 00424 g006
Figure 7. The most difficult CO2 reduction step on close packed facets of the various metals considered. For each metal, the left bar corresponds to the CHE method while the right bar corresponds to the GCDFT method. The free energies of reaction species were calculated using plane wave grand canonical DFT as implemented in the software program JDFTx [59]. Calculations were performed on the (1 1 1) facet of the face centered cubic metals. The surfaces were modeled using a periodic 3 × 3 unit cell with three layers of metal atoms and 15 Å of vacuum between successive slabs. The metal atoms in the bottom layer were fixed at their optimized bulk positions. Adsorption was permitted on only one of the two exposed surfaces. The Kohn-Sham one electron states are expanded in a series of plane waves with an energy cutoff of 520 eV. All calculations in this work employed the PBE exchange correlation functional and for Brillouin zone integration, we used a Fermi smearing and a Monkhorst-Pack 3 × 3 × 1 k-point mesh. We used the CANDLE solvation model to describe the effect of liquid water and Debye screening due to 0.1 M electrolyte [60].
Catalysts 08 00424 g007
Figure 8. CO electro-reduction profiles as various pH. (a) pH = 1. The blue line is the kinetically dominant pathway. (b) pH = 7. Blue and green lines are the dominant pathway with the rate for the green line 20% of that of the blue line. (c) pH = 12. The light green line is the most dominant pathway. Adapted and reprinted with permission from Ref. [61]. https://pubs.acs.org/doi/abs/10.1021%2Fjacs.5b11390. Further permissions related to the material excerpted should be directed to the ACS.
Catalysts 08 00424 g008

