Article

Influence of Bio-Oil Phospholipid on the Hydrodeoxygenation Activity of NiMoS/Al2O3 Catalyst

1
Competence Centre for Catalysis, Chemical Engineering, Chalmers University of Technology, SE-41296 Gothenburg, Sweden
2
Department of Chemical Engineering and Polymer Science, Shahjalal University of Science and Technology, Sylhet 3114, Bangladesh
3
Preem, SE-41296 Gothenburg, Sweden
*
Author to whom correspondence should be addressed.
Catalysts 2018, 8(10), 418; https://doi.org/10.3390/catal8100418
Submission received: 15 August 2018 / Revised: 13 September 2018 / Accepted: 20 September 2018 / Published: 25 September 2018
(This article belongs to the Special Issue Catalysis for the Production of Sustainable Fuels and Chemicals)

Abstract

:
Hydrodeoxygenation (HDO) activity of a typical hydrotreating catalyst, sulfided NiMo/γ-Al2O3 for deoxygenation of a fatty acid has been explored in a batch reactor at 54 bar and 320 °C in the presence of contaminants, like phospholipids, which are known to be present in renewable feeds. Oleic acid was used for the investigation. Freshly sulfided catalyst showed a high degree of deoxygenation activity; products were predominantly composed of alkanes (C17 and C18). Experiments with a major phospholipid showed that activity for C17 was greatly reduced while activity to C18 was not altered significantly in the studied conditions. Characterization of the spent catalyst revealed the formation of aluminum phosphate (AlPO4), which affects the active phase dispersion, blocks the active sites, and causes pore blockage. In addition, choline, formed from the decomposition of phospholipid, partially contributes to the observed deactivation. Furthermore, a direct correlation was observed in the accumulation of coke on the catalyst and the amount of phospholipid introduced in the feed. We therefore propose that the reason for the increased deactivation is due to the dual effects of an irreversible change in phase to aluminum phosphate and the formation of choline.

Graphical Abstract

1. Introduction

Fossil fuel depletion, caused by increasing demands and finite resources, as well as concern about greenhouse gas (GHG) emissions, has led to a search for alternative renewable sources of energy [1,2]. Biomass is considered a possible alternative future fuel source to minimize CO2 emissions. The type of biomass employed can be of different kinds, but mainly: carbohydrates, lignocellulosic material, and waste animal fats or waste/non-edible oils have been considered [3]. All of these renewable resources are suitable for upgrading to liquid biofuel in many different processes, for example, to bio-ethanol by fermentation of sugar or starch, to bio-diesel by transesterification of fat/oil, and to renewable diesel through catalytic hydrodeoxygenation of triglycerides and fatty acids [4,5]. Chemically, animal fats and non-edible oils are composed of triglycerides, with high amounts of oxygen. They also can contain minor, but varying, amounts of free fatty acids, phospholipids, sterols, pigments, and waxes. Hence, the challenge for bio-oil upgrading depends on its viability, properties, composition, competition with the food grade biomass, and presence of impurities.
In the last few years, extensive studies have been performed concerning the catalytic upgrading of triglyceride feedstocks to diesel range fuel with high cetane numbers [4,6,7,8]. Several catalysts have already been reported to be able to perform effectively, but the most common are Ni or Co promoted MoS2 on alumina [5,9]. Despite the type of catalyst employed, upgrading involves a cascade of catalytic reactions, e.g., hydrogenation, hydrodeoxygenation, decarboxylation/decarbonylation (DCO), isomerization, dehydration, cracking, etc., which predominantly produces a mixture of liquid hydrocarbons. Thereby, the process reduces the oxygen content and increases the stability and quality of the fuel to be used as transportation fuel. However, the process involves high pressure, temperature, and high H2 consumption [10]. On the other hand, the ultimate advantages of these processes are the reduction of GHG emissions, more flexibility of feedstocks, and higher carbon yields of the liquid hydrocarbon fraction. The physical and chemical properties of the products resemble the quality of conventional diesel; thus, they are named as green or renewable diesel. Although being commercially employed [11,12,13], such a process still deserves continued attention since the selectivity and deactivation of the catalyst may be highly sensitive to variations in biomass feedstocks during the actual processing conditions [14]. The amount and types of impurities present in a biomass feedstock depends on the prior production process for, e.g., liquefaction/pyrolysis/supercritical oxidation, its conditions, and treatment of the feedstocks [15]. Bio-oil impurities include sulfur, nitrogen, phosphorus bearing compounds, alkali, and alkaline earth materials, such as Na, Ca, Fe, Mg, etc. [12,16,17].
Despite the feedstock pretreatment (e.g. degumming, refining etc.), varying amounts of phosphorus (P) can be present in the bio-oil/biomass feedstocks (e.g. vegetable/algal oils) in the form of phospholipids and other cell forming constituents [18,19,20]. Phospholipids are amphipathic molecules having both a polar phosphate group and non-polar long fatty acid tails. Major phospholipids identified in naturally occurring bio/algal-oil are phosphatidylcholine, phosphatidic acid, phosphatidylethanolamines, phosphatidyl-glycerols, etc. [20,21]. Additionally, some of the most common algae species, with the potential of biofuel production, contain as much as 40% of the cell weight as phosphatidylcholine [22]. It should be noted that removal of phospholipid is an energy intensive step and consumes a large amount of water in current industrial practice. In crude form, the bio/algal oil phospholipid content can be up to 5% or higher, whereas after modern degumming/refining processes, it is expected to be much lower (<0.05%) in the refined oil to be hydrotreated [23]. Although some of the phospholipids (non-hydratable) are difficult to remove from oil and may not be removed completely, it is critical to investigate to what extent they affect the catalytic hydrotreatment process. There are only a few studies available in the literature regarding this topic [17,21].
Nevertheless, phosphorus has mostly been studied as a second promoter in the bimetallic CoMo or NiMo/γ-Al2O3 catalyst system for hydrodesulphurization (HDS) and hydrodenitrogenation (HDN) [24,25,26,27,28]. Interestingly, a promoting effect of P was reported for low loading (typically in the range of 1 to 3 wt.%) and it is considered to enhance the dispersion of the active phases (NiMoS/MoS2) by weakening the metal/support interaction and changing the geometry/dispersion of the active components from tetrahedral Ni/Mo to more active octahedral Ni/Mo [27,28,29,30].
As known, heterogeneous catalysts can be deactivated by several reasons, but mainly by poisoning, fouling or physical blockage, thermal degradation, vapor formation and/or leaching, attrition or crushing, and vapor-solid and/or solid-solid interactions [14,17,31]. There are excellent reviews/articles on the deactivation of hydroprocessing catalysts [32,33]. Several deactivation studies of HDO catalysts have been carried out considering possible bio-oil impurities, like trap grease phospholipid, chlorine (Cl), potassium (K), and iron (Fe) [12,16,17]. Mortensen et al. [16] concluded that irreversible K deactivation of NiMoS2/ZrO2 catalyst was due to the occupancy of vacant sites near the MoS2 slab edges. Recently, Arora et al. [12] showed that Fe preferentially blocks the Ni sites to shift the activity and selectivity of NiMoS/Al2O3. Kubička and Horáček [17] exemplified that the deactivation of a sulfided commercial CoMo/γ-Al2O3 by rapeseed oils and trap grease was primarily due to synergic effects between phospholipids and alkali metals causing coking and pore plugging. Murzin and co-workers claimed that phosphorus blocks the active Pd sites during decarboxylation of behenic acids [34]. The effect of hydrotreating products, such as H2O, NH3, and H2S, on such catalyst systems has also been the subject of many studies [6,8,35,36,37]. Laurent and Delmon [6] reported that ammonia inhibits more strongly than water, although the presence of H2S promoted deoxygenation of esters. Such effects by H2S and different sulfiding agents have also been studied in detail for various oxygenate upgrading catalysts [38,39,40].
However, there are to our knowledge no studies available where a detailed investigation of the bio-oil phospholipids on the HDO activity of NiMoS/Al2O3 has been explored. Therefore, the focus of this study is to systematically examine the effect of a major bio-oil phospholipid, phosphatidylcholine (PC), toward the HDO activity of a presulfided NiMo/γ-alumina catalyst while upgrading a major fatty acid (oleic acid), which, for example, is present in canola oil (61%), Jatropha oil (42%), microalgal oil (23%), tall oil (15%), etc. [12]. We considered oleic acid a good model compound because it includes both a double bond on the carbon chain and a carboxylic group as other unsaturated fatty acids, like linoleic acid. Activity and selectivity changes observed during the reaction led us to investigate the spent catalyst to examine the cause of deactivation. In this regard, transmission electron microscopy (TEM), X-ray photoelectron spectroscopy (XPS), Inductively Coupled Plasma (ICP)-Sector Field Mass Spectroscopy (SFMS), and Temperature Programmed Oxidation (TPO) and Elemental Analysis (EM) were performed with the spent catalysts.

2. Results and Discussions

2.1. HDO Activity of NiMo/Al2O3

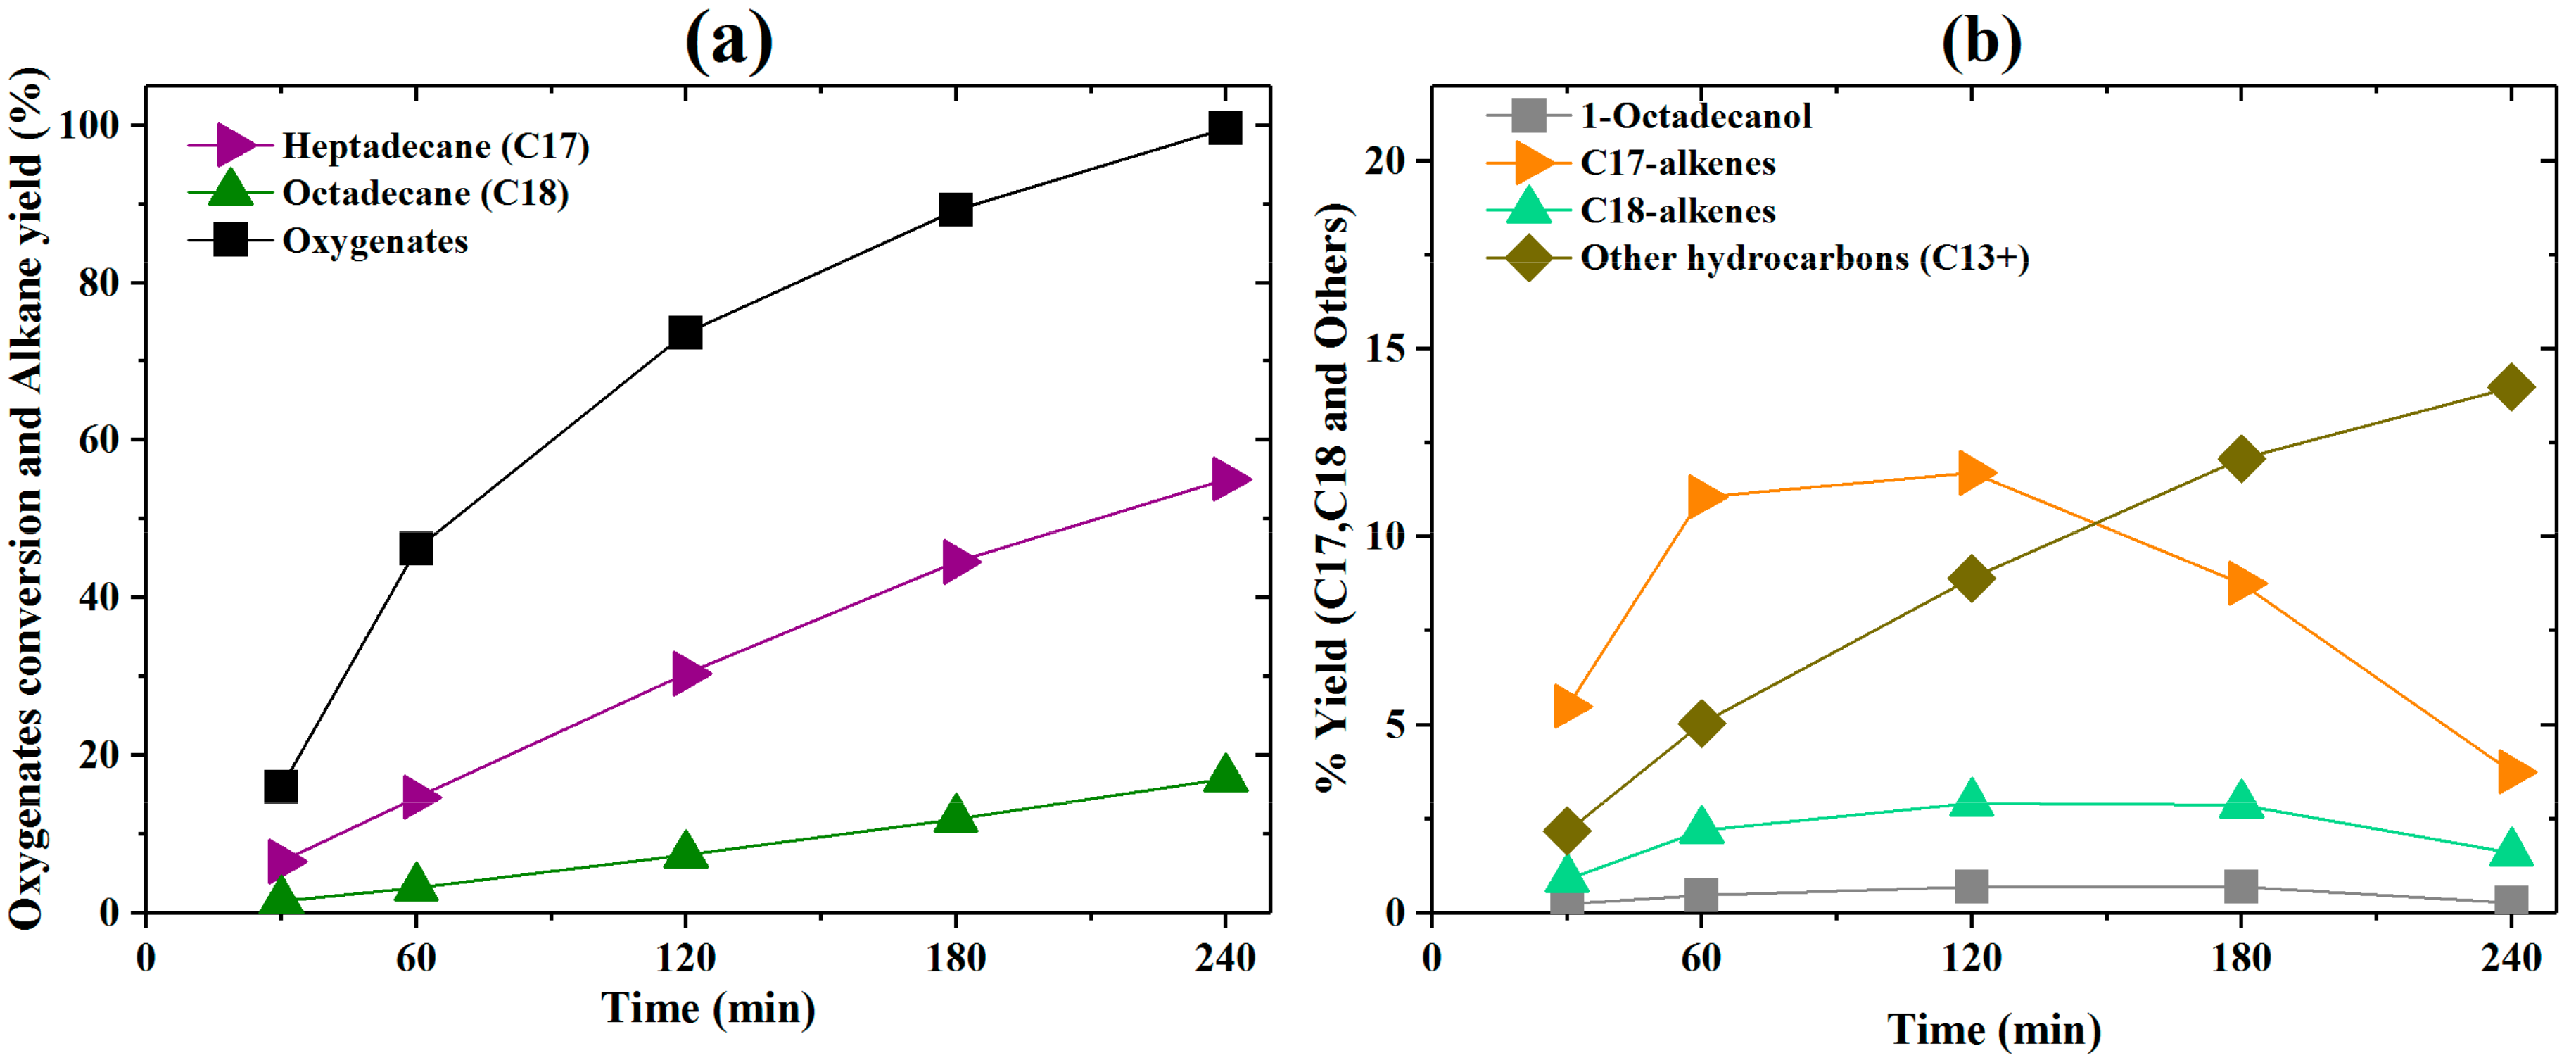
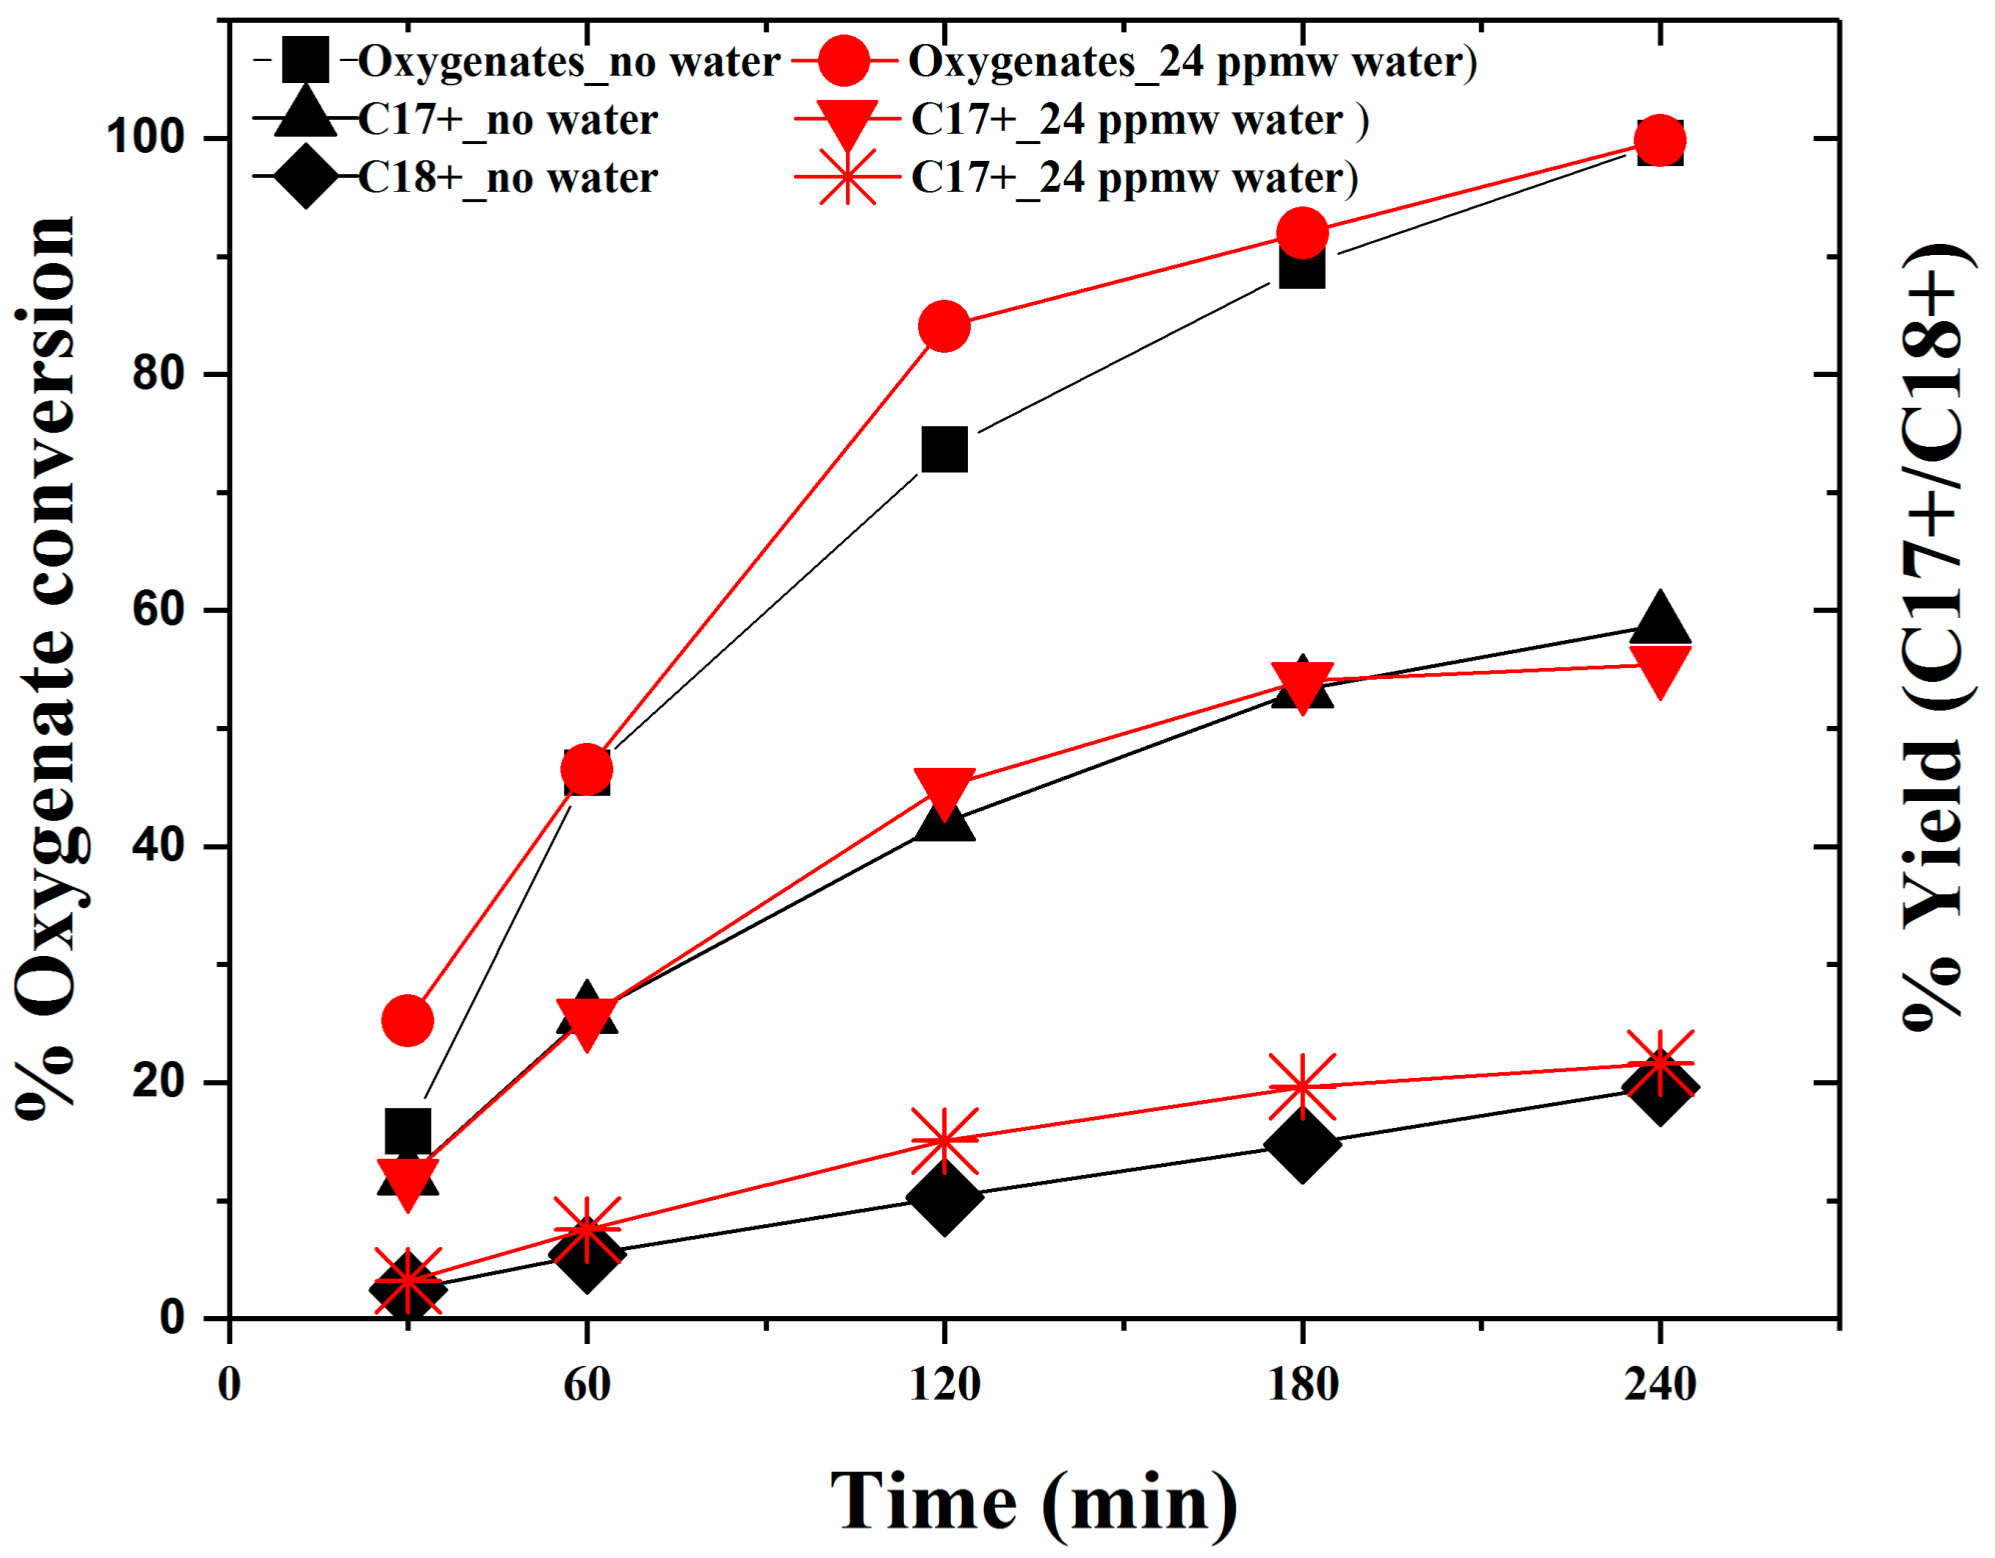
2.1.1. Activity Measurements without Phospholipid

Figure 1 presents the reactant and product profiles throughout the course of the reaction. The overall oxygenate conversion (sum of oleic acid and stearic acid) was >99% after 240 min of HDO. As seen from Figure 1, heptadecane (C17) and octadecane (C18) formation increases over time and encompasses 70% of the final yield of products from oleic acid.
With the reaction conditions employed, oleic acid (OA) is first converted to stearic acid (SA) through hydrogenation of its double bond. Further hydrogenation of it to fatty alcohol is reported to occur very slowly [39,41]. Instead, it can be reduced readily at the catalyst surface via hydrogen to form an aldehyde, 1-octadecanal, which undergoes keto-enol tautomerism to form 1-octadecanol [42]. Interestingly, deoxygenation of both 1-octadecanal and 1-octadecanol yields C17 and C18 alkenes, which are further hydrogenated to form their corresponding alkanes. Clearly, C17 formation implies loss of a carbon atom either as CO or CO2, whereas C18 formation occurs without carbon loss, but oxygen removal as H2O. The former route is so-called decarboxylation/decarbonylation (DCOx) and the latter direct hydrodeoxygenation (HDO). These are the typical overall reactions over sulfided NiMo catalysts in the presence of a sulfiding agent, DMDS/H2S [12,39,43]. We have observed very small amounts of 1-octadecanol (Figure 1b) as the reaction intermediate. This indicates its rapid conversion to hydrocarbons via protonation of the hydroxyl group.
The trend shows that DCOx dominated during the entire period whereas the direct-HDO route had a lower rate of reaction. It also indicates that the process is less selective for the enol formation route in this case. It should be mentioned that the DMDS used decomposes to form H2S to maintain the sulfidity of the catalyst and prevent possible metal-oxide formation. These results are in line with previous deoxygenation studies of oleic acid with sulfided NiMo/γ-alumina [4,12,39,42,44].
Figure 1b summarizes the other products and intermediates formed during the reaction. Alkenes (C17 and C18) formed via DCOx and direct-HDO are converted to their corresponding alkanes upon hydrogenation. Formation of shorter hydrocarbons, like tri-, tetra-, penta-, and hexadecane (C13–C16), and longer alkanes, like nonadecane (C19) and eicosane (C20), were due mainly to the presence of other acids in the feedstock. We grouped them here as ‘other hydrocarbons (C13+)’. Although C17 and C18-alkenes are congregated together, several isomers of them were identified by GC-MS analysis. Furthermore, small amounts of an esterification product (stearyl stearate) was observed in very low quantities (less than 0.5%) due to the reaction between stearic acid and 1-octadecanol. Trace amounts of S-bearing compounds identified by the GC-MS in the liquid phase were predominantly thiols, like tert-hexadecanethiol (C16H34S) and 2,4,6-tri-t-butylbenzenethiol (C18H30S). This indicates that minor sulfur contamination of the liquid phase occurred.
The overall mole balance for each experiment was found to be in the range of 100 ± 10%. For the sake of brevity, C17/C18 alkanes and alkenes are grouped together as C17+ and C18+ in the following sections unless otherwise stated.

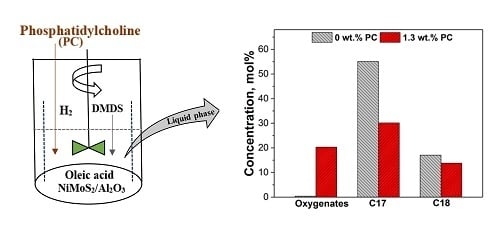
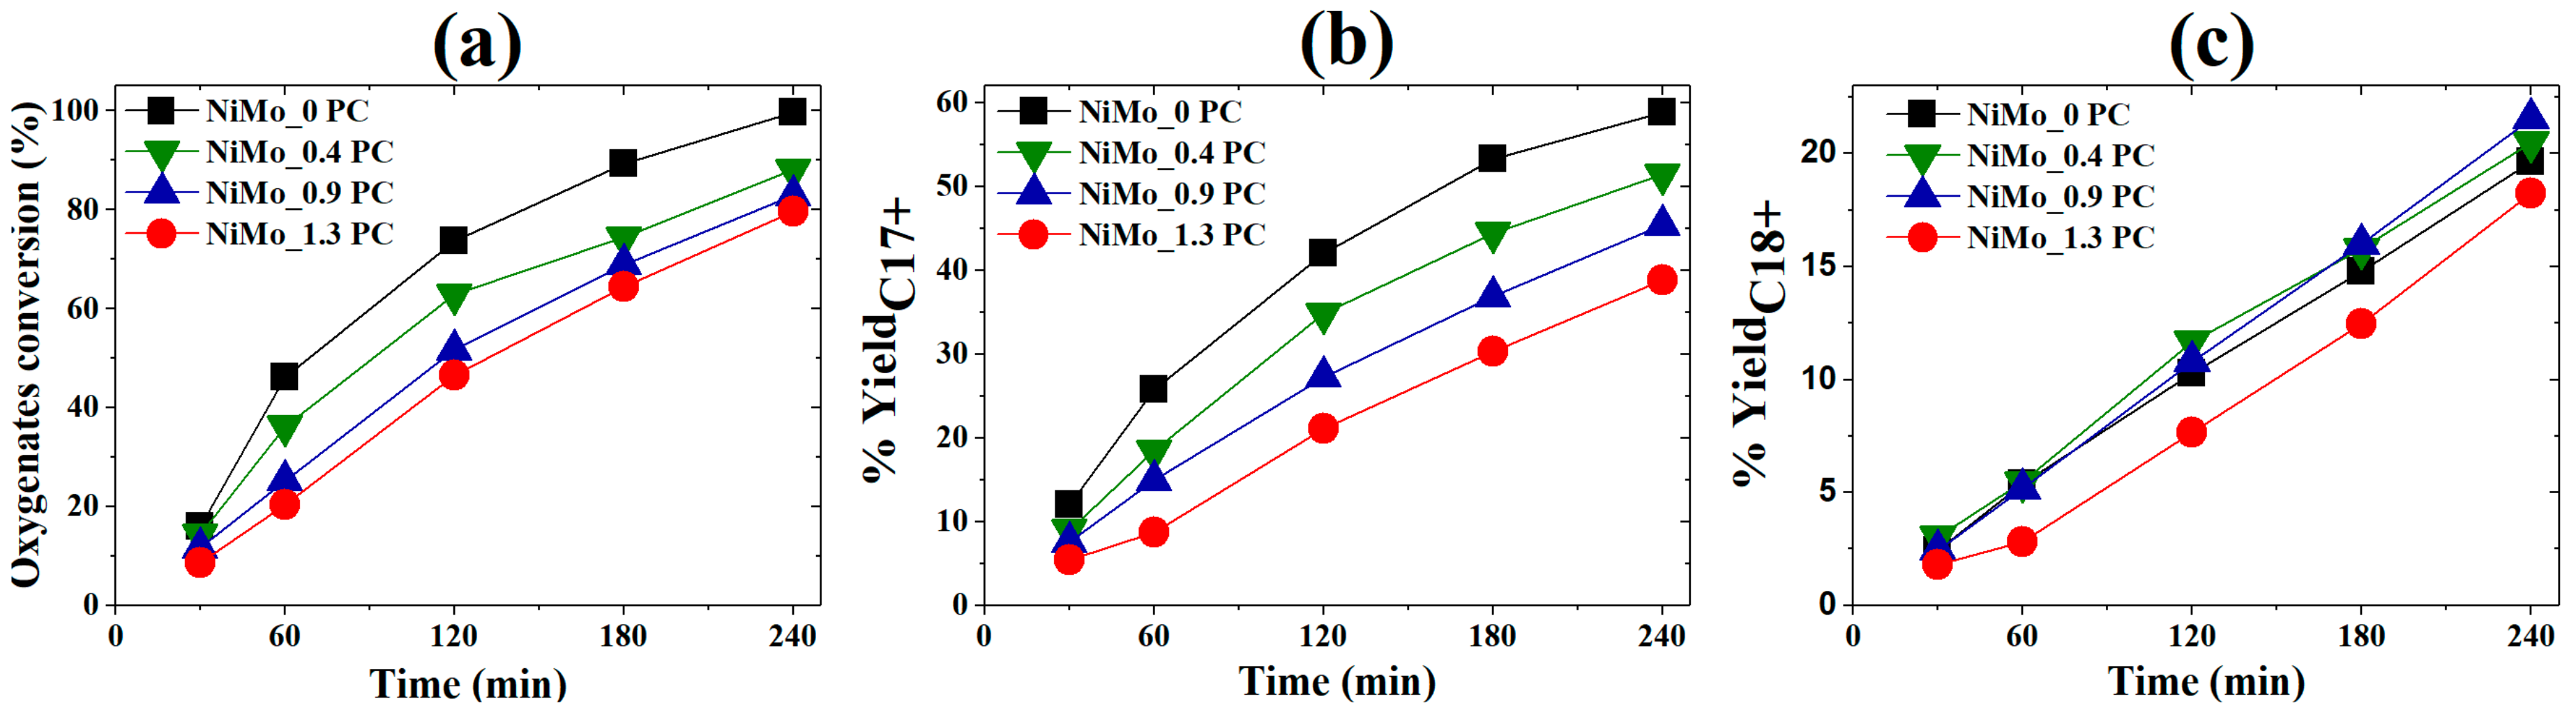
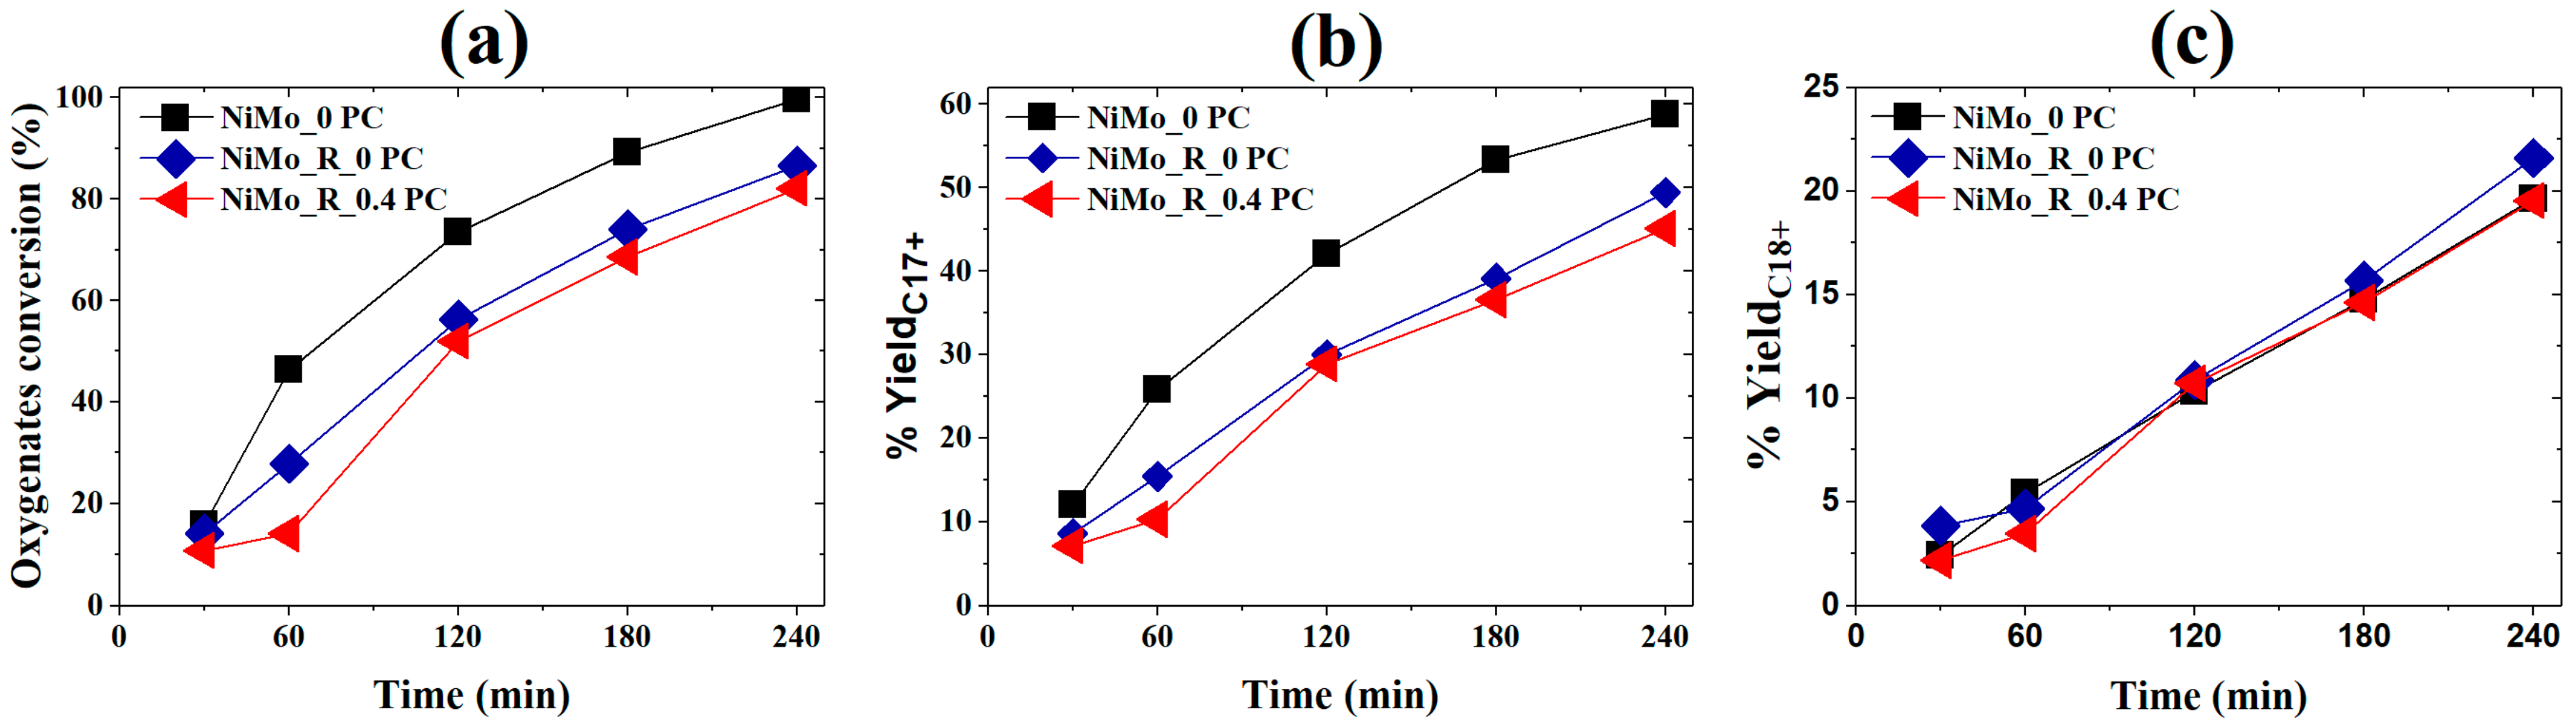
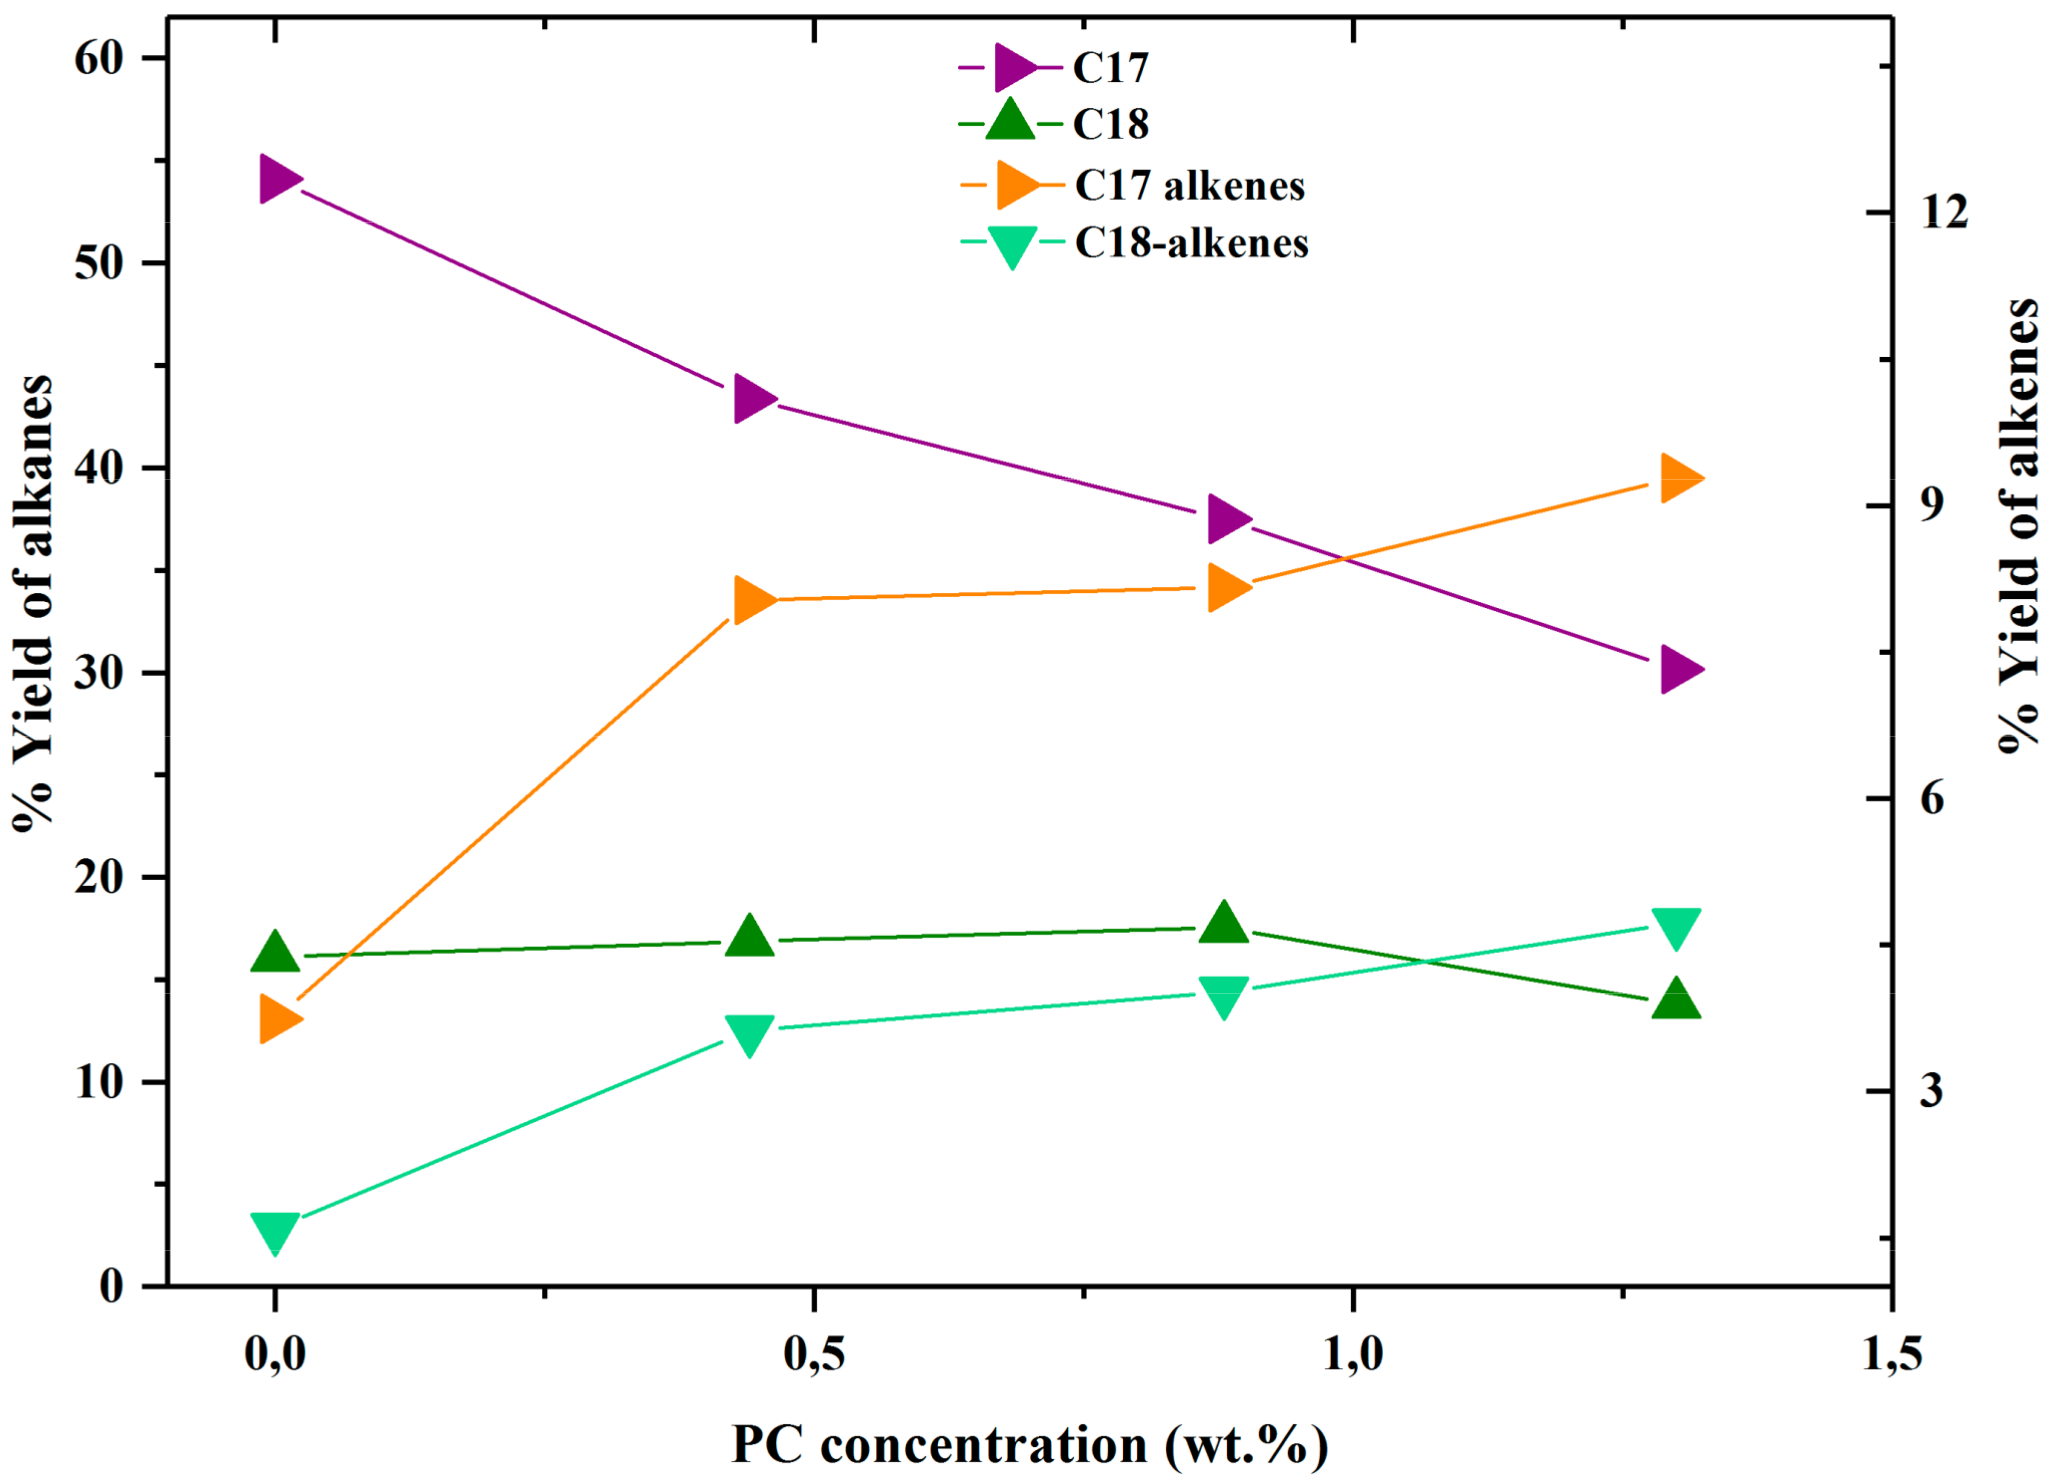
2.1.2. Activity Measurements with Phospholipid

In the presence of phosphatidylcholine (PC), a notable impact in the HDO activity and selectivity was observed (Figure 2). It is evident from Figure 2a that oxygenate conversion decreases with the increasing PC concentration in the feed. Overall, hydrocarbon yield (Figure 2b,c) decreases with an increasing amount of PC, leading to higher amounts of oxygenates remaining after 240 min of HDO.
A lower amount of PC in the feed (0.2%, not shown in figure) in the absence of DMDS appears to have very little effect on the HDO of OA. However, higher concentrations of PC in the feed or catalyst that are run two times in the presence of PC (Figure 2 and Figure 3) exhibit significant deactivation, even for saturation of the double bonds (hydrogenation), which is a rather quick reaction in these conditions. Consequently, the conversion of oxygenates to any other products is delayed. The initial rate of oxygenate conversion drops noticeably form 59.1 mmol/g catalyst/h (without PC) to 27.6 mmol/g catalyst/h for the highest amount of PC tested in this study (Table 1). PC addition also caused a higher amount of SA compared to OA to be observed after 240 min of HDO. This implies that the influence on OA hydrogenation is less severe than on the intermediate SA conversion by HDO.
Likewise, the formation rate and yield of C17+ decreased with the gradual increase of PC feed (Table 1 and Figure 2b). Interestingly, the loss in the C17+ yield is directly proportional to the amount of PC introduced (Figure 4). Conversely, the yield of C18+ is not altered significantly except for the experiment with the highest phospholipid (PC) addition. The overall selectivity for heptadecane and its isomers dropped from 0.8 to 0.4 while selectivity for octadecane and its isomers remained constant at ca. 0.2. Moreover, the amount of C17 and C18 alkenes and their isomers were relatively higher in experiments with PC (Figure 4). This also indicates the inhibition of the hydrogenation step by PC. These results suggest that the DCOx route is affected most severely in the presence of phospholipid (PC).
The underlying cause for these observations can be attributed to the products formed by the decomposition of the PC at the reaction conditions. As mentioned earlier, PC is comprised of a non-polar hydrocarbon tail, a hydrophilic phosphate group, and an organic choline group containing nitrogen. It can undergo decomposition via acid hydrolysis to form mainly fatty acids, glycerol, phosphoric acid, and choline with an intermediate glycerophosphate/ phosphorylcholine [45,46]. It is stated that the presence of oleic acid and phosphoric acid can even enhance the PC decomposition [45]. Hence, we consider that PC has been decomposed fully with the reaction conditions and time employed with no glycerophosphate/phosphorylcholine intermediates remaining. The fatty acid contribution from the PC can be as high as 6.7 wt.% of OA in the feed and has been accounted for in the above experiments. Glycerol formed can be converted to propane [47]. It has been reported that phosphoric acid can act as a polymerization/ oligomerization catalyst and lead to the formation of carbonaceous compounds, and thereby hinder access to the active sites [17]. However, the effect of choline on such a catalyst system has not been explored, and rather has been ignored. Laurent and Delmon [6] reported that increasing amounts of di-aminopropane affects severely the decarboxylation selectivity during deoxygenation of di-ethyldecanedioate. Like amine compounds, choline has a strong Lewis base character and can affect the acidity of the catalyst and/or neutralize the effect of H2S. Also, choline, upon heating, can be converted to trimethylamine, which can strongly bind to the catalyst surface or can react with the fatty acids/intermediates. To understand the extent of the effect of choline, experiments with choline hydroxide addition (48 wt.% in water) have been performed. To explicate, the experiment was performed with an equivalent amount of choline present as 1.3% PC in the feed and the results are shown in Figure 5.
It is apparent from Figure 5 that the presence of choline decreases the C17+ yield by 16% relative to the baseline experiment (NiMo_0 PC) whereas for the phospholipid (1.3% PC) it is about 34%. This indicates again higher deactivation in the presence of phospholipid (PC) rather than choline only. Interestingly, about a 26% increase in C18+ yield has been noticed. In addition, liquid phase analysis by GC-MS revealed the formation of small amounts of octadecanamides and octadecanitrile, which would be due to the reaction between fatty acids/intermediate alcohols with the amines formed from choline. Such products can bind to the catalytic surfaces as well. Gas phase analysis from the experiment with PC and choline showed no ammonia formation. Henceforth, we discard the possibility that choline decomposed into ammonia at these reaction conditions.
Since choline also contains water, it is possible that the water also influenced the reaction. To exclude this possibility an additional experiment was performed with an equivalent amount of water and the results are shown in Figure 6. The results clearly show that these water levels do not influence the results.
Based on the above results, we conclude that the observed deactivation can be related to the combined effects of phosphoric acid and choline formed upon decomposition of the phospholipid (PC). Moreover, the results also demonstrate that poisoning caused by the phosphorus part is more severe than that from the choline moiety. To further understand the cause of these changes, a detailed characterization of the recovered catalysts has been performed, which will be discussed in the next section.

2.2. Catalyst Characterization

2.2.1. Textural Properties of the Catalyst

Nitrogen physisorption results shows that the catalyst surface area, pore volume, and pore size drop pointedly even in the presence of small amounts of PC in the feed (Table 2). It is well known that carbon deposition occurs mainly due to chemisorbed species formed by undesirable side reactions. For example, formation of alkenes can enhance the coke formation by oligomerization in the presence of phosphoric acid [48]. It has been observed that about 11% of the BET surface area has been blocked by coke formed in the experiment without phospholipid whereas this increases to 27% in presence of the lowest amount of PC (NiMo_0.4 PC) tested. This infers that severe pore blocking, and subsequent pore volume and pore size reduction, occurs in the presence of PC.
Elemental analysis shows the carbon, hydrogen, sulfur, and nitrogen content of the studied catalysts in Table 3. Sulfur loss relative to the sulfided and unused catalyst can be ascribed to oxygen incorporation into the active sulfide phase during the reaction or the loss of loosely bound sulfur species on the support to the reaction mixture. Since all the recovered catalyst samples have undergone a similar amount of sulfur loss and all values are above the minimum stoichiometric amount required for complete sulfidation of the Ni promoted MoS2 phase (5.1%), deactivation due to sulfur loss or sulfur loss promoted by PC addition can be ruled out. However, the carbon content of the catalysts treated with PC mostly increased with an increasing addition of PC. Additionally, a comparable amount of nitrogen can be seen in all experiments with phospholipid (PC). This validates the presence of nitrogen as amines/amides on the catalyst surface, which is likely due to choline formation.

2.2.2. ICP-SFMS on the Recovered Catalyst and Liquid Samples

To verify the phosphorus content, the spent catalyst and liquid phase samples after the reaction were further analyzed by ICP-SFMS. The results are reported in Table 4. The atomic ratio of Ni/(Ni + Mo) for the spent catalysts remained close to those for the as-synthesized catalyst and thus we consider that no leaching of metals occurred. Analysis shows that lower amounts of P were deposited on the spent catalyst compared to the maximum value estimated considering complete decomposition of the phosphatidylcholine and assuming all P added to the liquid phase becomes deposited on the catalyst. Moreover, the amount of P remaining in the liquid phase after reaction is very small.
Surprisingly, the amount of P on the catalyst from ICP analysis is not proportional to the total P added initially to the liquid phase. This might be related to different amounts of loosely bound phosphorus species were washed away by ethanol during treatment of the recovered catalysts. However, the phosphorus concentration for the spent catalyst that had been run two times is significantly higher compared to that for the NiMo_0.4 PC sample, which is reasonable. The elemental analysis indicates that catalysts exposed to PC are enriched in P more than N, which shows that more phosphorus is remaining on the surface.

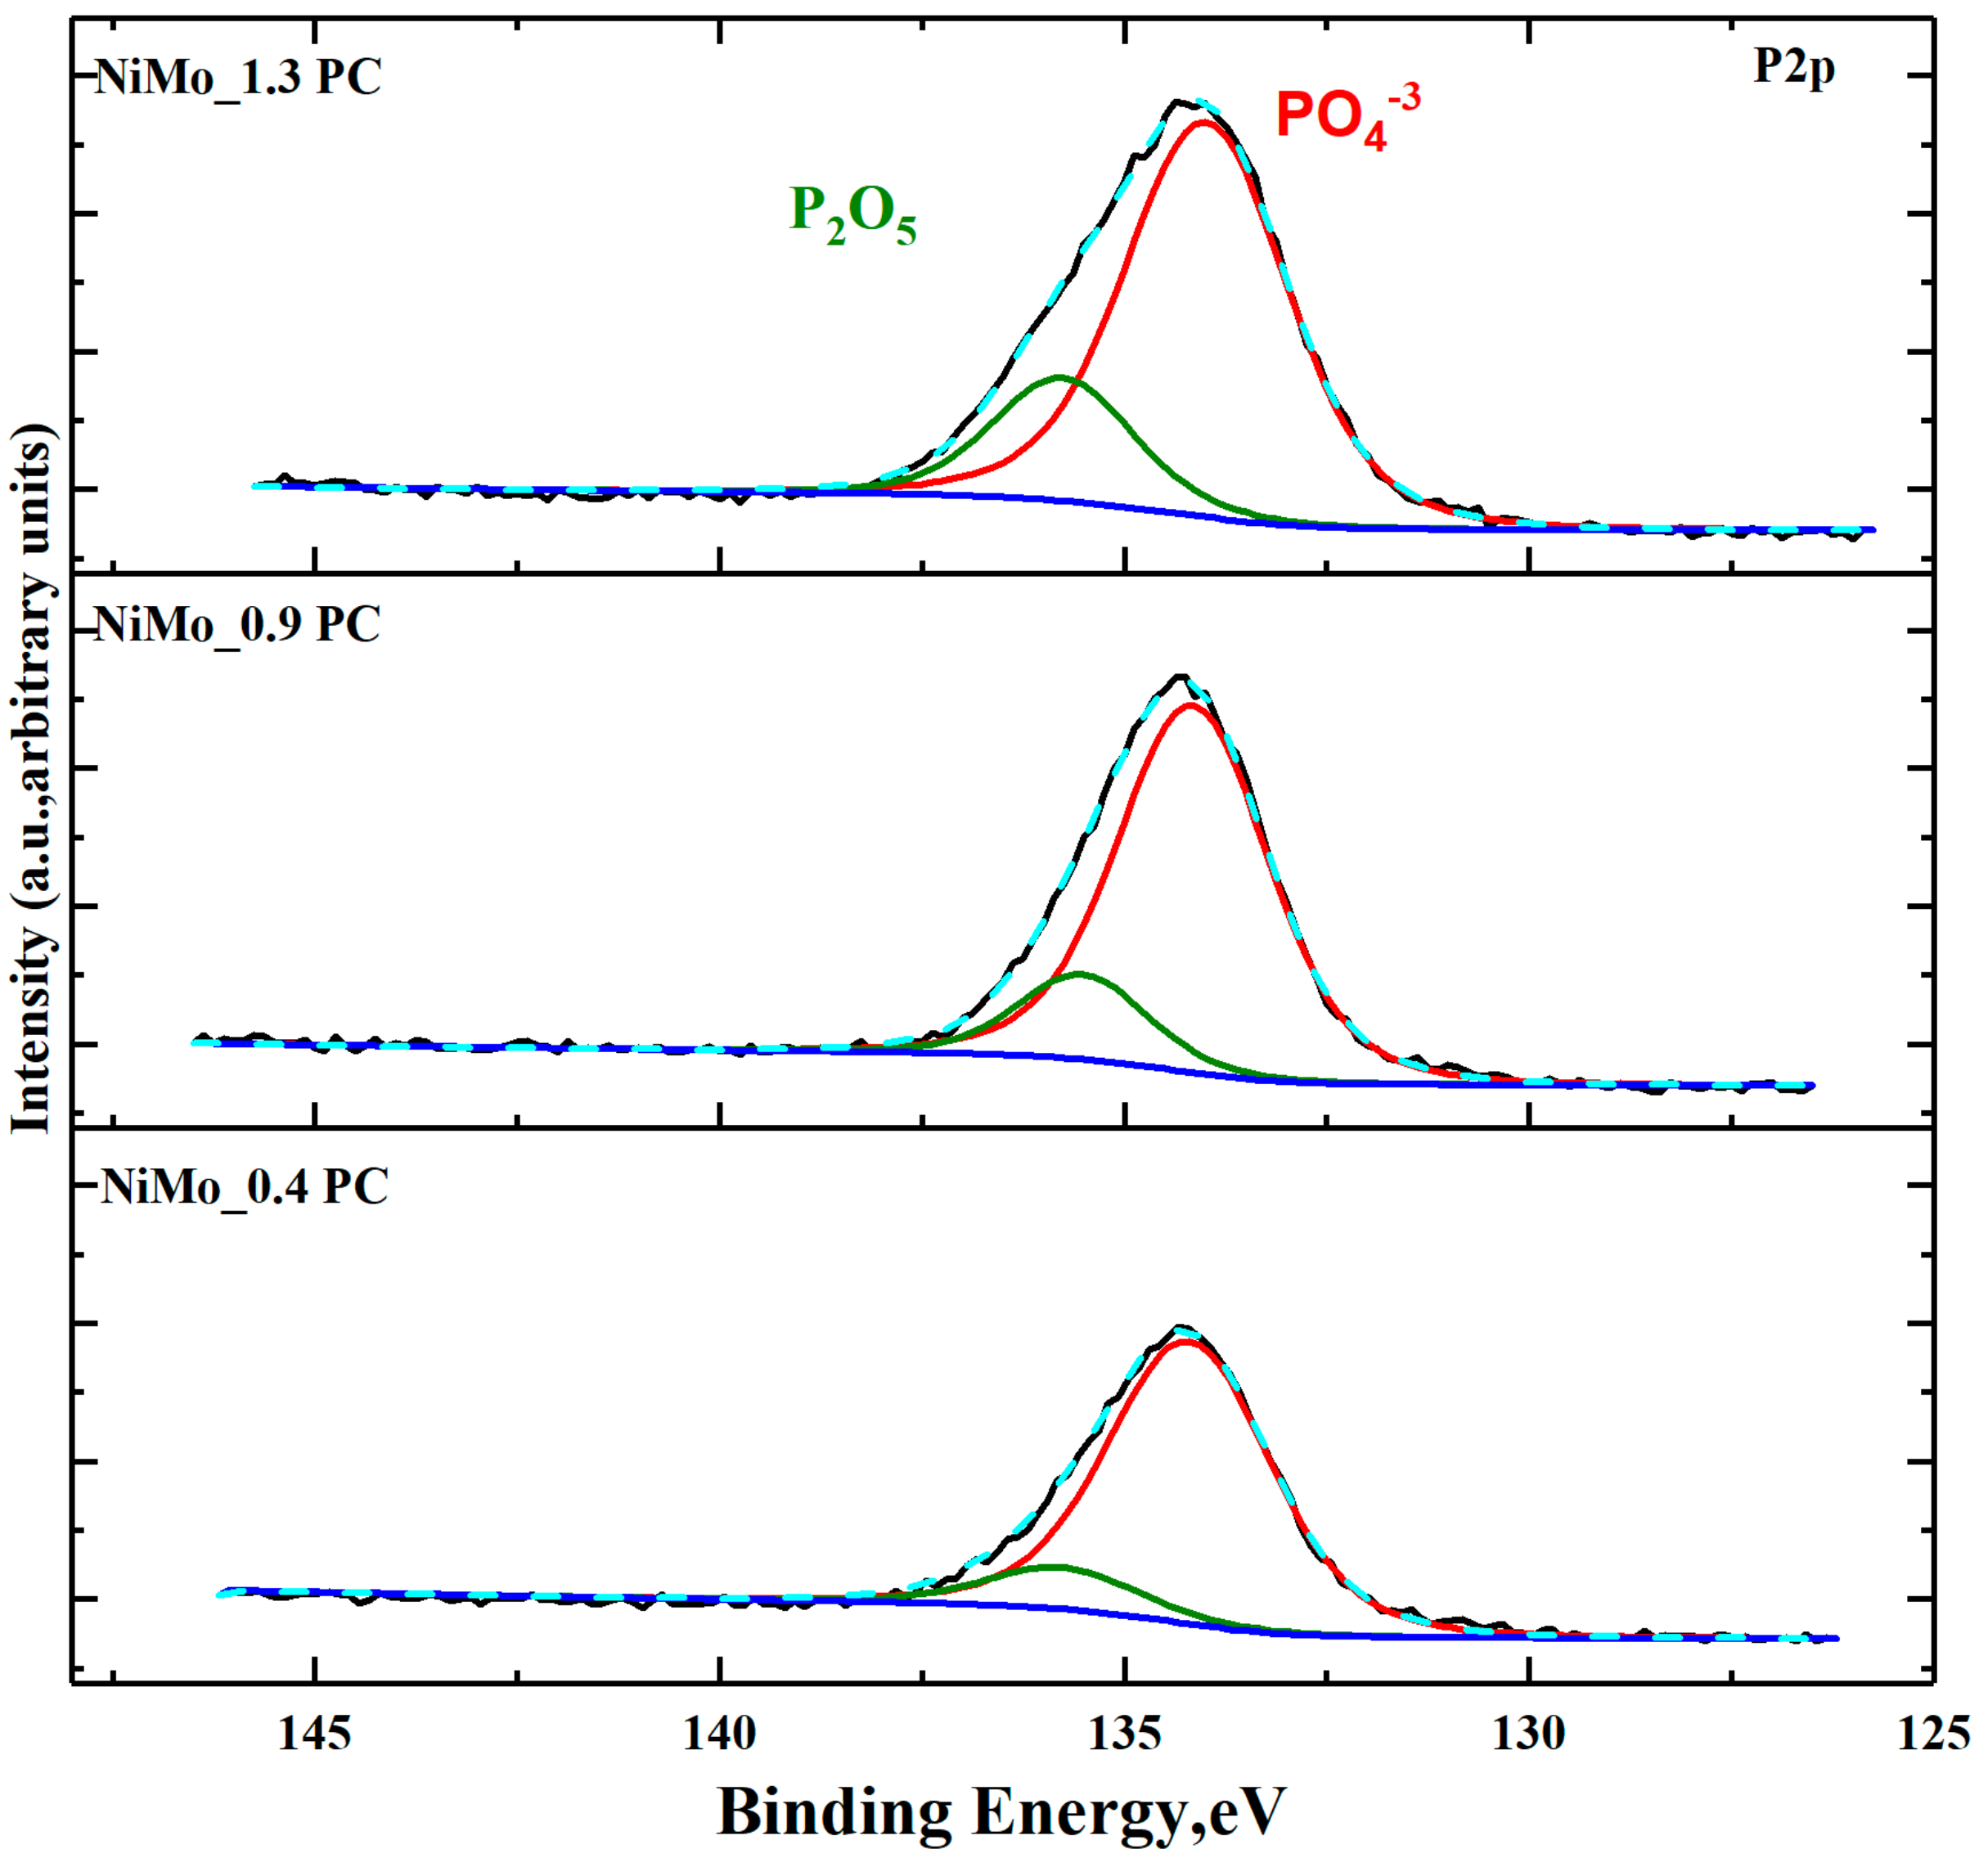
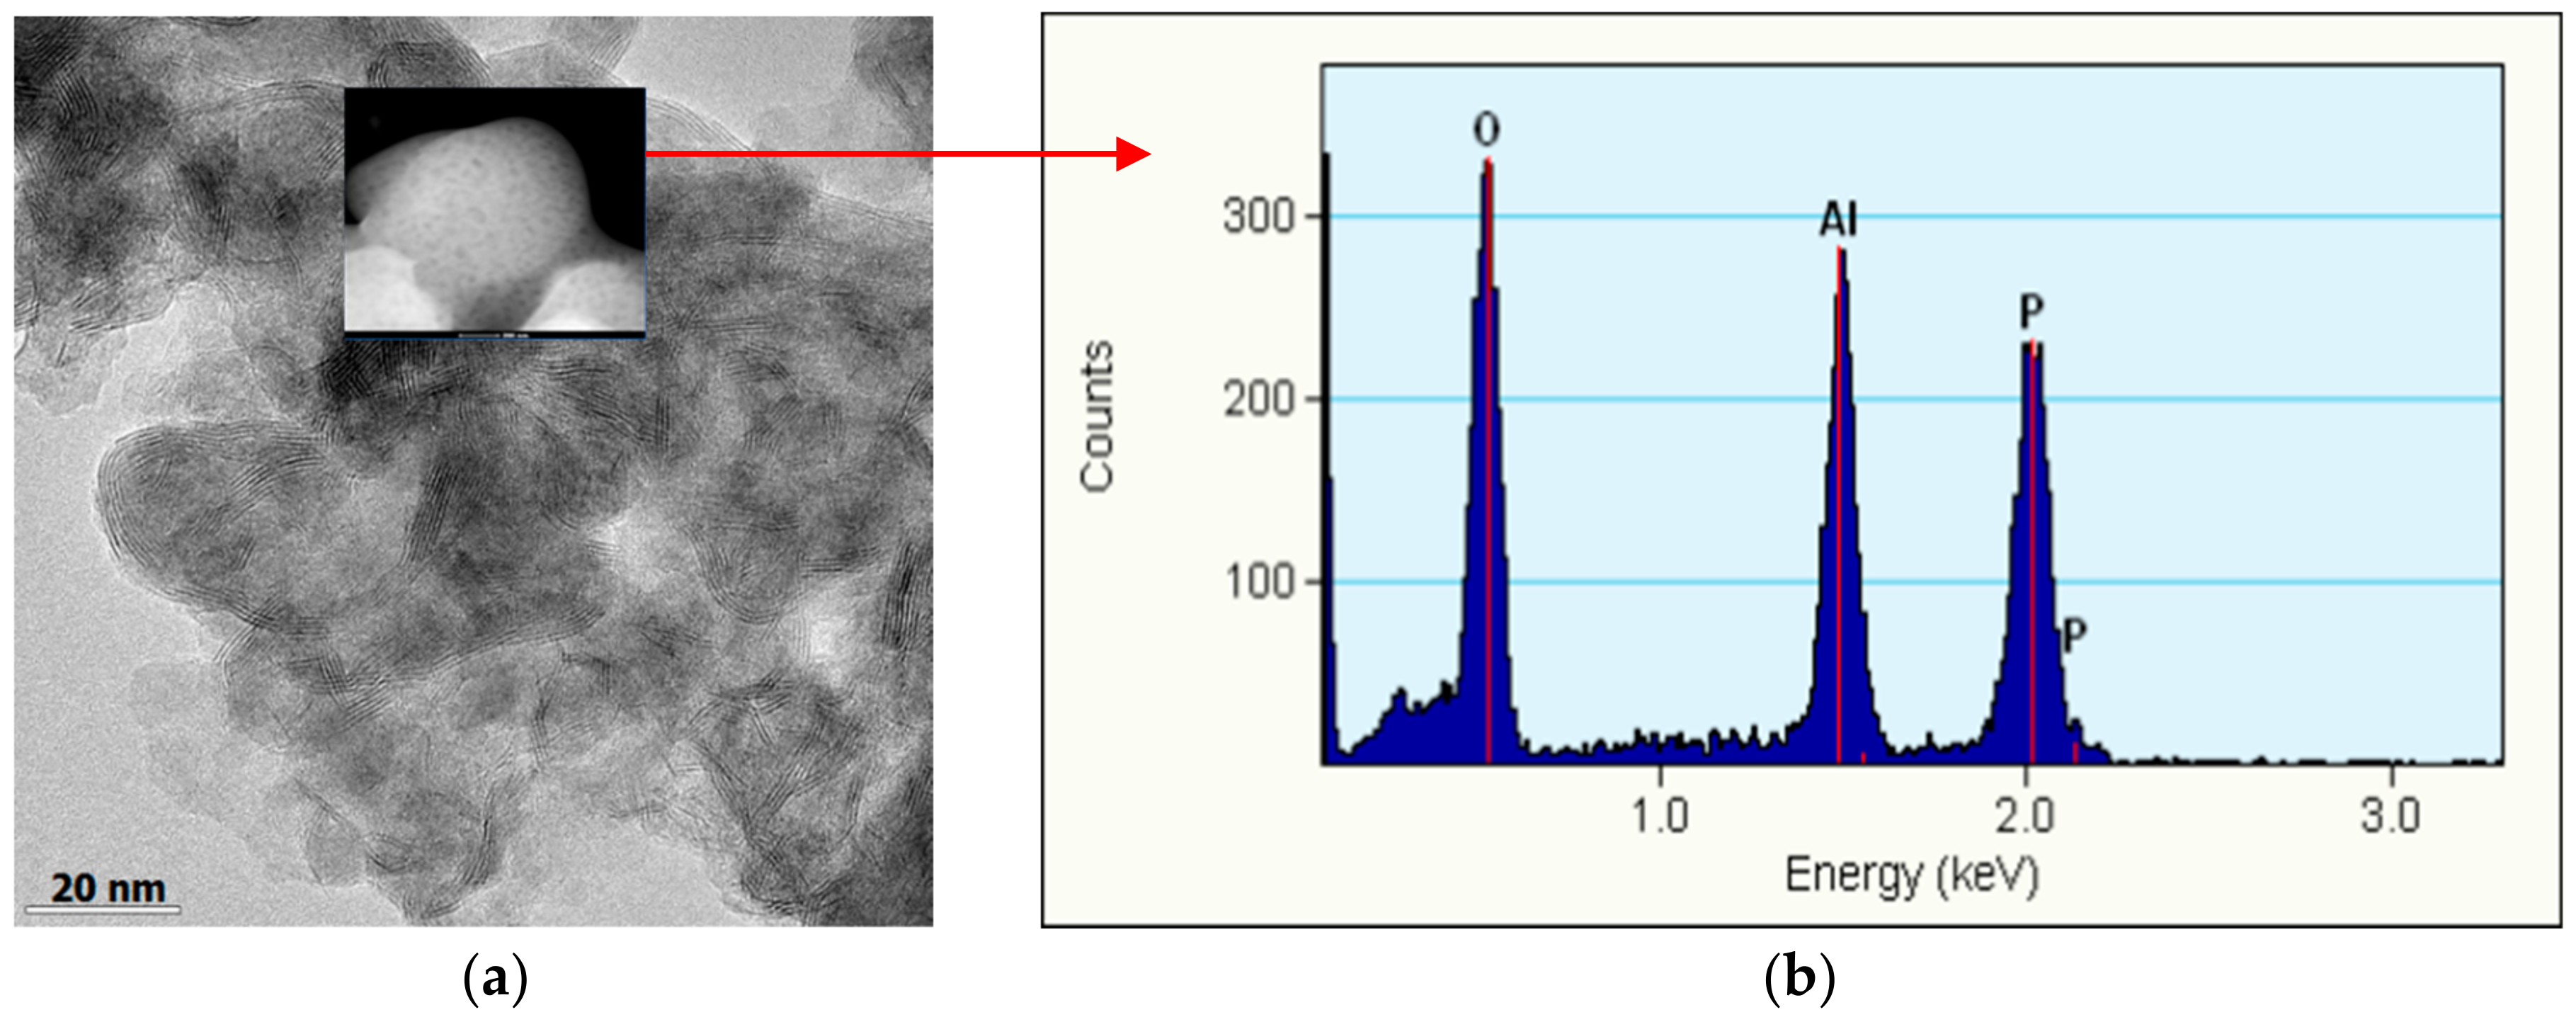
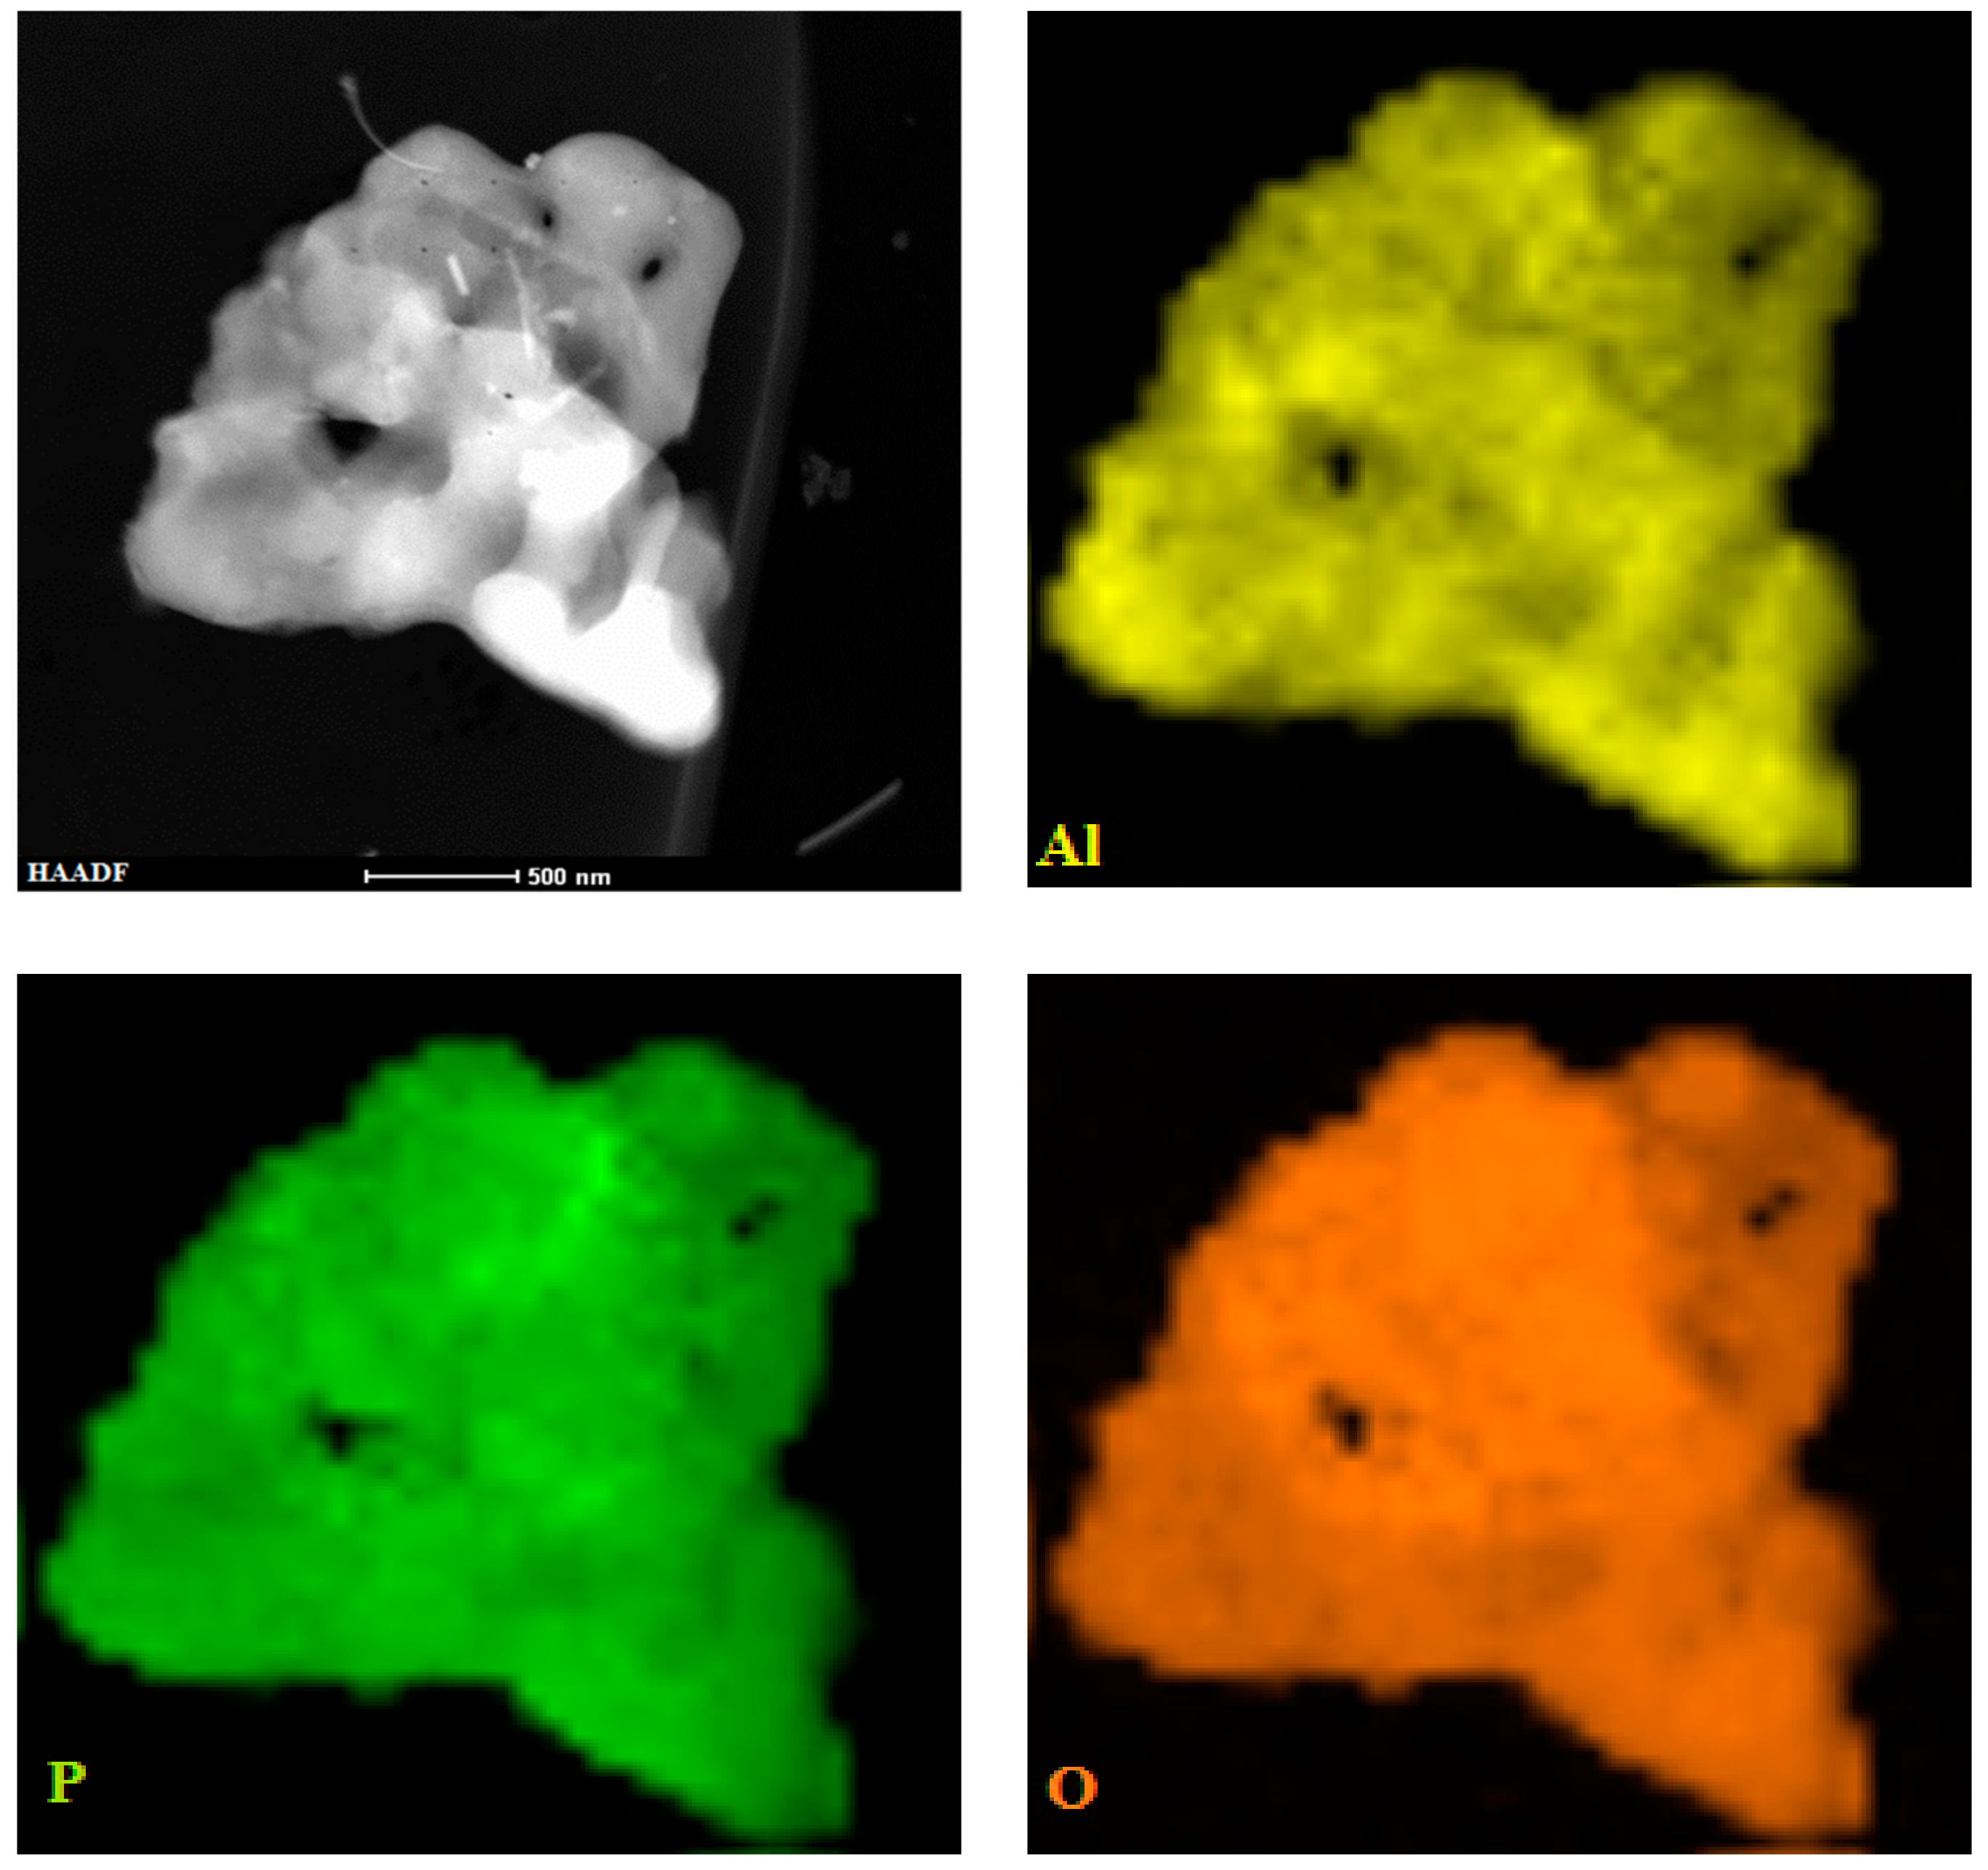
2.2.3. XPS and TEM Analysis

XPS analysis of the catalyst samples recovered after being exposed to the PC are presented in Figure 7. P2p signals from the samples exposed to PC indicates the presence of phosphates. Such a peak at 133.8 ± 0.2 eV implies the formation of metal-phosphate complexes, which can affect the activity of the catalyst in several ways. However, broadening of the phosphate peak area validates an increasing P deposition on the catalyst with the increasing phospholipid (PC) in the feed. Phosphate species can affect the active surface area, pore plugging, active phase dispersion, or morphology of the catalyst, which, consequently, can reduce the active site density and imposes steric hindrance for the incoming molecule to adsorb on them [49]. Indeed, pore plugging and surface area reduction is confirmed by the BET results (Table 2). Furthermore, no additional peak below the binding energy of 130 eV ruled out the formation of metal phosphides at these reaction conditions.
However, to understand the active phase dispersion and morphology, TEM analysis was performed on the catalyst (NiMo_1.3 PC) collected from the experiment with the highest amount of PC (Figure 8a). Bright Field (BF) micrographs (Figure 8a) showed the characteristic lamellar pattern of the Ni promoted active MoS2 phase [16]. Comparing this pattern to the catalyst (NiMo_0 PC) without PC (Figure S1) indicates an increase in the stacking degree of MoS2 to 4.4 ± 1.7 with PC exposure compared to 2.3 ± 1 without. Similarly, an average slab length of 5.3 ± 3.2 nm compared to 3.8 ± 1.7 nm in NiMo_0 PC has been measured based on 150 slabs. Since higher stacking leads to more inactive basal planes of MoS2 to be accessed by edge atoms (Ni), the changes observed indicate a lower dispersion of the active MoS2 phases on the support caused by PC [50]. Such an effect gives lower coordination between Ni and MoS2 to maintain the active NiMoS phase relative to the baseline catalyst. This can be one possible reason for the activity and selectivity changes observed with these PC addition studies.
Furthermore, STEM-EDX analysis on the magnified image in Figure 8a showed a particle with only Al2O3, where P was present. In other TEM images, P has been observed with all other elements in the catalyst. NiMoS, NiS phases were observed without interference from phosphorus while some areas showed only MoS2 (Figure S2). It is reported that γ-alumina can easily interact with phosphoric acid through surface hydroxyl groups to form phosphates [51]. Eijsbouts et al. [28] mention that alumina has a strong affinity for polar phosphate groups. Therefore, from the decomposition of PC, phosphoric acid thus formed can interact with the support to form aluminum phosphates (AlPO4), which is consistent with the XPS studies and TEM-EDX mapping (Figure 8b). Moreover, elemental maps over a particle shown in HAADF-STEM imaging and EDX mapping is shown in Figure 9. It is clear from the mapping that phosphorous is well distributed over the Al2O3 particle. This result suggests that phosphorus is strongly bound to the support alumina.

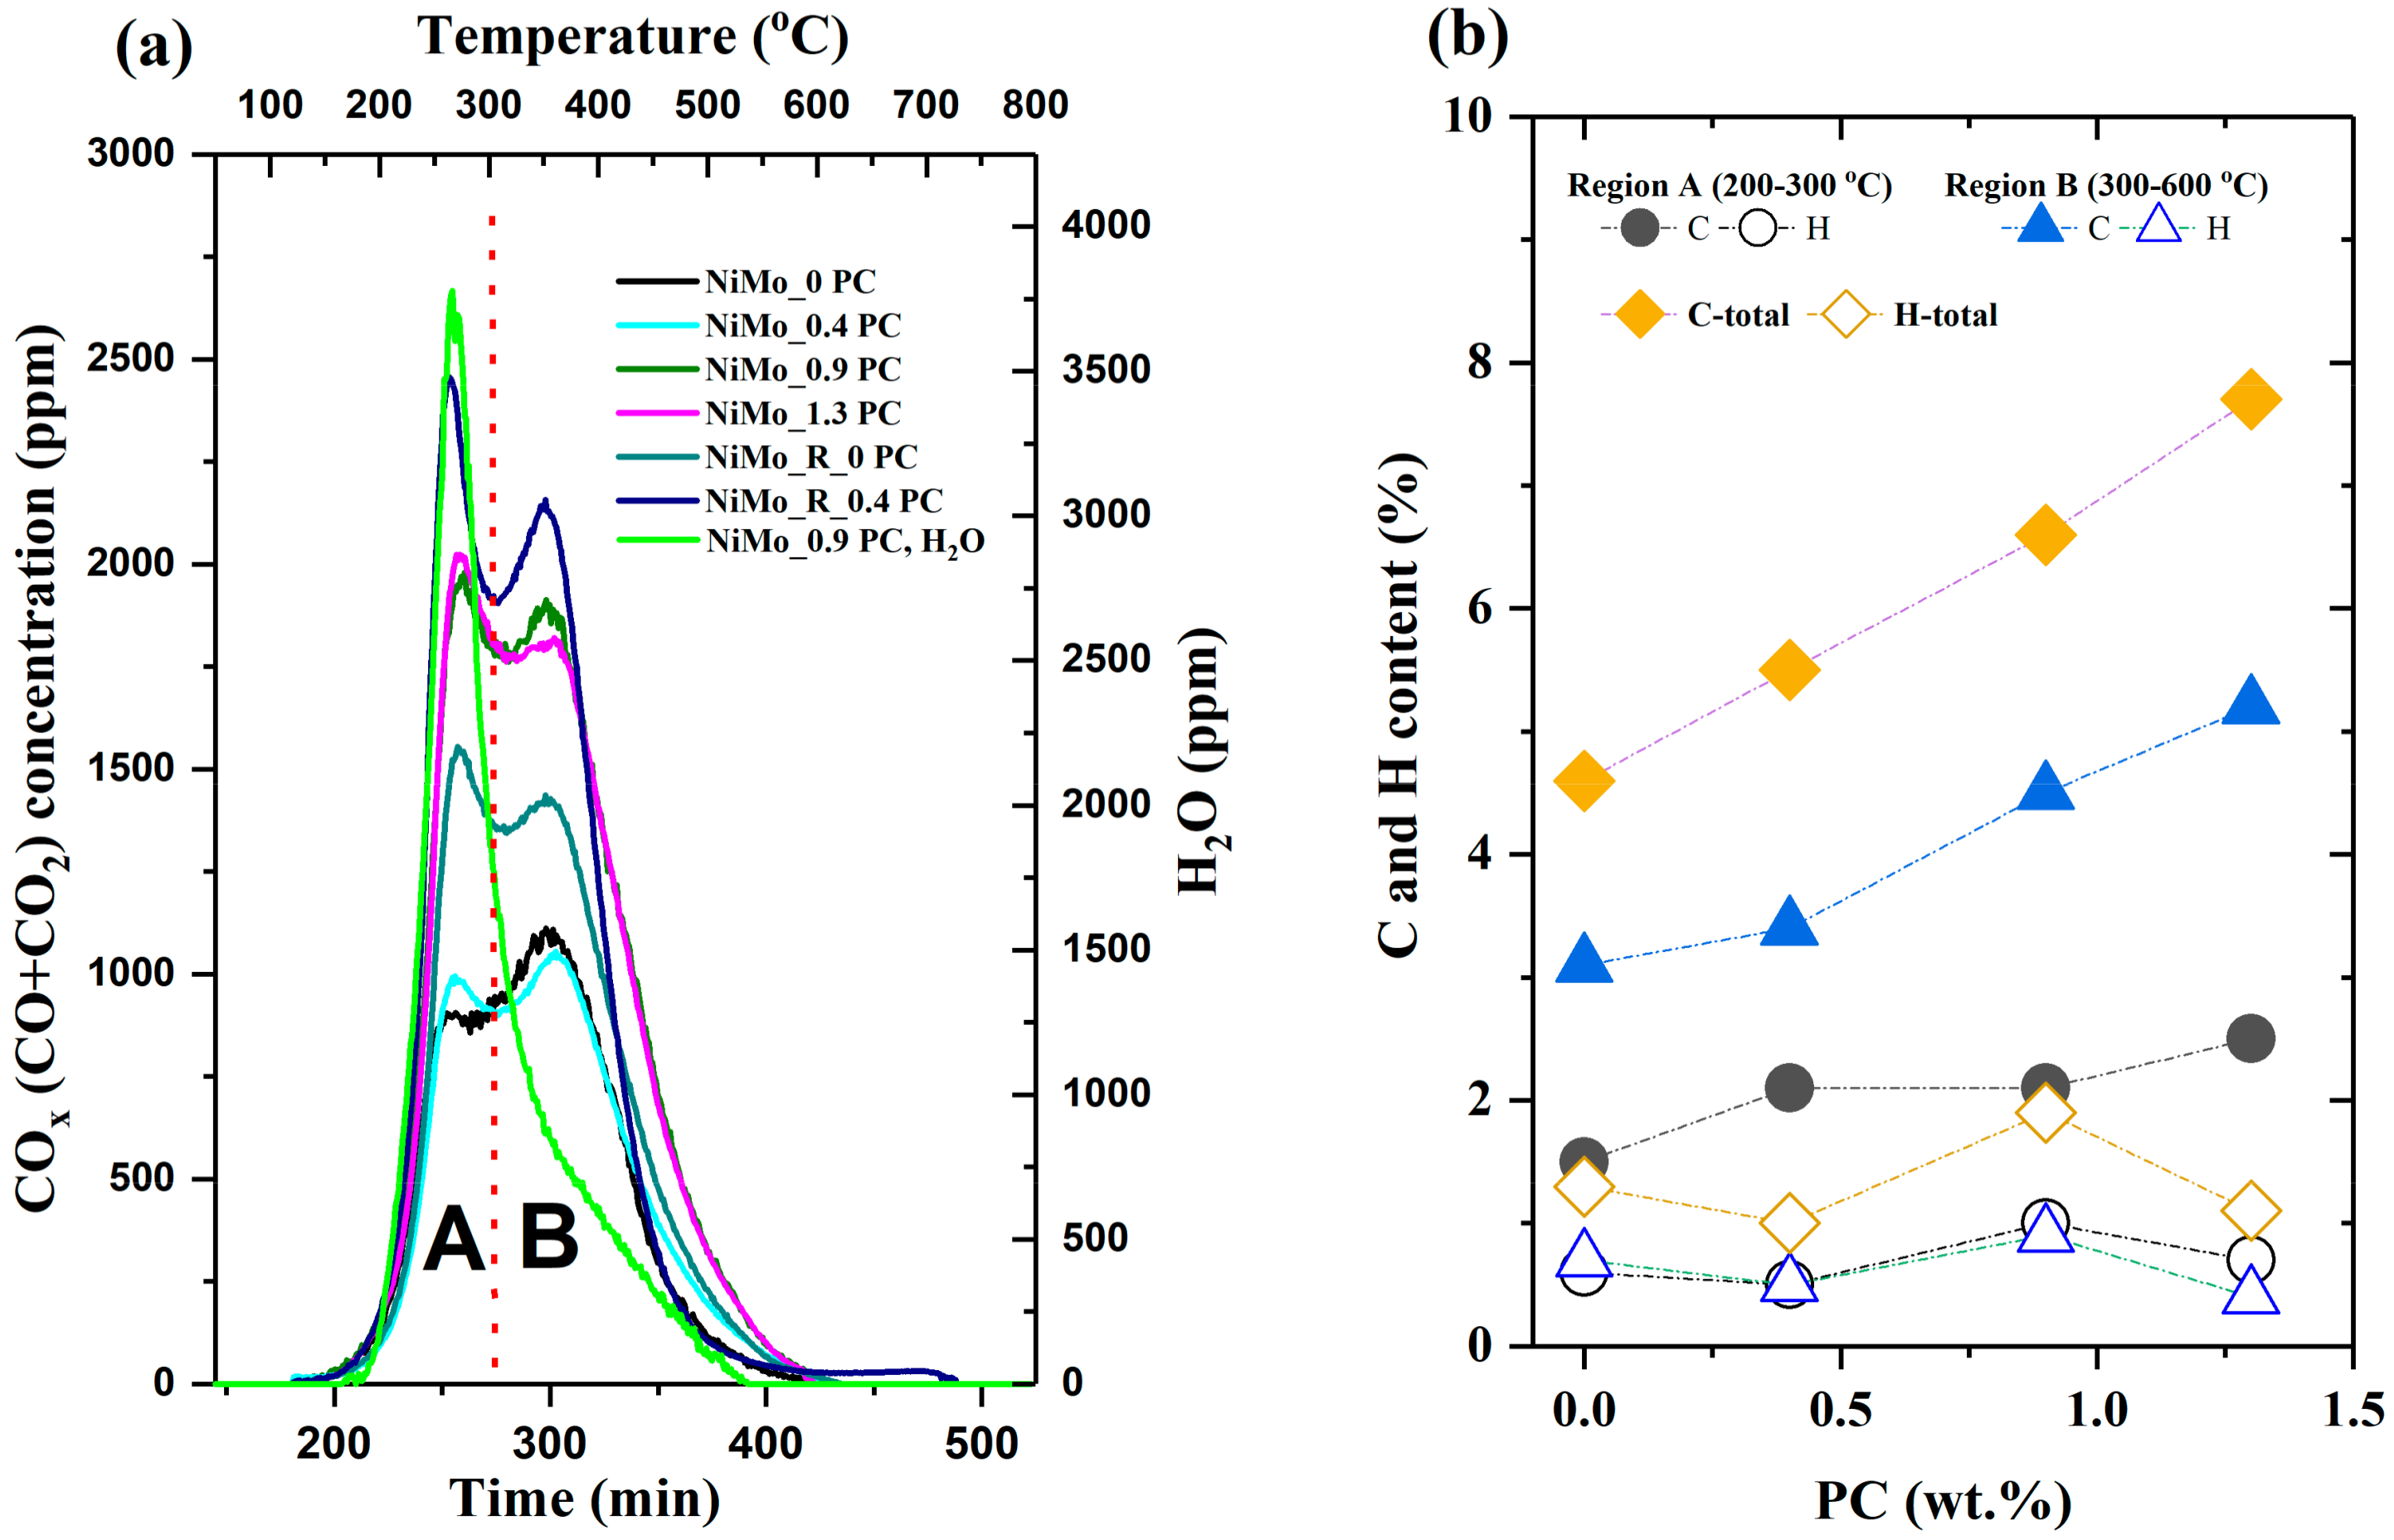
2.2.4. Temperature Programmed Oxidation (TPO) of Recovered Catalysts

Coke formation on the catalyst surfaces can block the active site and reduce pore volumes to cause deactivation. Diez et al. [33] concluded that coke species can block the edges and corners of the active MoS2 crystallites to hinder its activity. Figure 10a shows the profile of combined carbon oxides (CO + CO2) and water (H2O) formation during the TPO of recovered catalyst samples. The H2O profile for the spent catalyst, NiMo_1.3 PC, is shown in Figure 10a for comparison. A similar trend for H2O has been observed for all samples. Two distinct regions of coke formation are apparent. In the first region, A (200–300 °C), water formation was found to be much higher than in the second region, B (300–600 °C). This fraction of coke in region A, which will be referred to here as soft coke, is mainly composed of residual adsorbed reactants and intermediate species deposited on the catalyst surface with higher hydrogen content that is combusted readily at low temperatures. Whereas the coke in region B is more of a refractory/advanced nature. Refractory coke is also more likely to be strongly bound to the catalyst/support surface (chemisorbed) with a lower hydrogen content and hence requires higher temperature for combustion [52]. Formation of such coke is also known to be influenced by the support acidity [53]. On the other hand, soft coke is at least partially reversibly adsorbed to the catalyst surface and burns off easily at lower temperatures. Hence, the initial coke formation on all spent catalyst samples can be attributed to the formation of both soft and refractory coke.
Table S1 and Figure 10b summarizes the amount of coke formed on each recovered catalyst sample with the distribution of carbon (C) and hydrogen (H) contents in the two regions above. The C content is higher in the higher temperature region than the low temperature one. Likewise, carbonaceous deposits are rich in H in the low temperature region while leaner in H in the high temperature region. Both TPO and elemental C and H analysis (Table 3 and Table S1) are in very good agreement. By comparison with the spent catalysts, it is apparent that the carbon deposition increases with the quantity of PC added to the reactants (Figure 10b). It can be presumed that the higher amount of coke deposition is due to the adsorption of more reactants and intermediates on the catalyst surface from lower oxygenate conversion. However, in Figure 8 and Table S1, carbon, even in the high temperature region with low H content, increases with PC exposure. Hence, the higher carbon deposition stems directly from PC introduction, which contributes more to the formation of refractory coke.
On the other hand, coke deposition (Table S1) was found to be lower for the recovered catalyst after a second experiment with PC (NiMo_R_0.4 PC) compared to the same catalyst without PC (NiMo_R_0 PC). Interestingly, the oxygenate conversion was significantly lower on the PC poisoned catalyst compared to the experiment without PC (Figure 3). It is possible that the large amount of phosphorus on the spent catalyst (3.18%, Table 4) blocked more active sites and thereby lowered the coke deposition due to lower activity.

3. Materials and Methods

3.1. Catalyst Preparation

The catalyst (NiMo/γ-Al2O3) was prepared by a sequential wet impregnation process [44] using pre-calcined γ-alumina as the support material and deionized water as the solvent. Ammonium molybdate tetrahydrate (81–83% MoO3 basis, Sigma-Aldrich, St. Louis, MO, USA) and nickel (II) nitrate hexahydrate (98%, Sigma-Aldrich, St. Louis, MO, USA) were used for the impregnation of Mo and Ni, respectively. Initially γ-alumina was calcined in air at 550 °C for 2 h. Molybdenum was then impregnated in a pH stabilized aqueous solution of γ-alumina by adding an aqueous solution of ammonium molybdate tetrahydrate using a pH of 4.0. The resulting solution was then freeze dried under vacuum to remove the moisture. The dried sample was then calcined in air at 450 °C for 2 h. Likewise, Ni was impregnated using the same procedure mentioned above, but with a pH of 9.0. The solution pH was maintained using 10 wt.% HNO3 (Merck, Darmstadt, Germany) and 2 M NH4OH (Merck, Darmstadt, Germany), respectively. The final solution was freeze dried, followed by calcining the catalyst powder in air for 2 h at 450 °C.

3.2. Catalytic Activity Measurements

3.2.1. Sulfidation

The synthesized catalyst was sulfided before each activity test using DMDS (≥99.5%, Sigma-Aldrich, Poole, Dorset, UK) and hydrogen (AGA, 99.9%, Air Liquide Gas AB, Malmö, Sweden) in the batch reactor (300 mL, Parr Inc., Moline, IL, USA). About 500 mg of NiMo/Al2O3 catalyst was sulfided using 0.5 mL of DMDS and hydrogen following a procedure described in the bibliography [44]. The reactor was then cooled, depressurized, and kept under a nitrogen atmosphere.

3.2.2. Hydrodeoxygenation of Oleic Acid

Activity experiments were examined in three parts. In the first segment, activity of the freshly sulfided catalyst was explored. In the second step, the effects of PC were investigated. Finally, recovered catalysts from the first two parts were further tested to gain more insight into the phospholipid effect. All the experiments were performed in the autoclave reactor mentioned above.
With the freshly sulfided catalyst (ca. 500 mg), the reactor was filled with 150 mL of liquid consisting of 10 wt.% oleic acid (tested according to Pharmacopoeia Europaea, Ph. Eur., Fluka) in dodecane (≥99%, Sigma Aldrich, St. Louis, MO, USA). GC-MS analysis confirmed the purity of the oleic acid feed was 85 wt.%. Remaining fraction constituents included palmitoleic, myristic, palmitic, eicosanoic, and nonadecanoic acids. The reaction conditions were maintained at 320 °C, with 54 bar of H2 at a stirring rate of 1000 rpm, which are typical conditions for hydrotreating reactions in the literature [12,44,54]. Reaction samples were collected during the reaction (30, 60, 120, 180, 240 min) to analyze the liquid composition. The sampling line was purged with N2 after each sample withdrawal. Sample withdrawal caused a temporary pressure-drop of ca. 2 bar in the reactor. The reactor was repressurized to 54 bar with H2 immediately following each sample extraction.
After the reaction, the catalyst was recovered and washed with warm (50 °C) absolute ethanol (150 mL) to remove the adhering reactants, residual products, and intermediates. The collected catalyst was subsequently dried and further characterized.
For the studies with phospholipid, L-α-Phosphatidylcholine (≥99%, Sigma-Aldrich, St. Louis, MO, USA) was added to the feed. It contains a glycerol backbone, having a hydrophobic long hydrocarbon chain with fatty acid residues linked via an ester group to a polar phosphate group and an organic group, called choline containing nitrogen. Additional experiments were carried out with choline hydroxide (48% in water, Fluorochem, Glossop, UK) to elucidate the possible effects of choline produced from the decomposition of the PC. The approximate fatty acid composition in the PC is reported to be 33% 16:0 (palmitic), 13% 18:0 (stearic), 31% 18:1 (oleic), and 15% 18:2 (linoleic). A typical structure of it is shown below.
Catalysts 08 00418 i001
All other parts of the experiment were identical to the earlier described experiments. The amount of phosphatidylcholine added is presented here as a weight fraction based on the total liquid feed. The concentrations studied were ca. 0.4, 0.9, and 1.3 wt.% of PC, respectively. Table 5 shows these data, including the acronyms used in this study. The amount of fatty acid contribution from the PC was in the range of 2.2 to 6.7% of the oleic acid in the feed. Likewise, recovered catalysts from the first run of 0.4 wt.% PC were further tested with 0.4 wt.% PC to understand a more prolonged effect on the catalyst. Reproducibility of the experiments were also examined by repeated experiments with freshly sulfided and recovered catalysts, which gave a relative standard deviation of <5% for HDO activity based on the yields of the different alkane and olefin final products.

3.3. Product Analysis

Liquid phase samples were analyzed by the method described by our group [44] using GC-MS (Agilent 7890–5977A, Agilent, Wilmington, DE, USA). The collected samples were first heated in a water bath (60 °C) to dissolve the solidified contents of the reaction mixture. Then, 1 mL of the mixture was taken out and 0.2 mL of pyridine (Sigma, 99.9%) was added to obtain a single liquid phase. The mixture was then centrifuged (WIFUG Lab centrifuges, 500 E, WIFUG, Bradford, UK) at 1500 rpm for 2 min to separate the catalyst particles from the liquid. 0.2 mL of the clear solution was further treated with 30 μL BSTFA (N,O-Bis(trimethylsilyl)-trifluoroacetamide, (≥99.5%, Sigma-Aldrich, St. Louis, MO, USA) in a reaction vial to obtain a better separation of the products in the GC column. The mixture was then kept overnight (17 h) to complete the silylation reaction. Finally, the mixture was microfiltered to remove the fine catalyst particles and 1 μL of the filtrate was analyzed by GC-MS.
The oven ramp settings for the GC were as follows: 100 °C for 1 min, ramp at 10 °C/min to 190 °C, and continue to ramp at 30 °C/min to 300 °C. The GC was equipped with a HP-5 column, and a Flame Ionization Detector (set point was 335 °C). The injector temperature was kept at 325 °C. The retention times for the major products heptadecane and octadecane were 10.6 ± 0.2 and 11.4 ± 0.2min, respectively.
Conversion and yield of the reactant and products were calculated based on the following equations:
Oxygenate   conversion   ( % )   =   ( 1     Moles   of   oxygenate   left   at   any   time Moles   of   oxygenate   in   feed   )   × 100 Yield   ( % )   =   Moles   of   product   produced Moles   of   reactant   in   feed   × 100 Selectivity   =   Moles   of   product   ( C 17   or   C 18 )   produced   at   240   min Total   moles   of   C 17   and   C 18   produced   at   240   min Initial   reaction   rate   =   Moles   of   oxygenate   consumed   ( mmol ) Amount   of   catalyst   ( g )   ×   Elasped   time   ( h )

3.4. Catalyst Characterization

Freshly synthesized and spent catalyst was characterized by N2-physisorption and Inductively Coupled Plasma (ICP)-Sector Field Mass Spectroscopy (SFMS, ALS Scandinavia AB, Luleå, Sweden). Freshly sulfided catalyst was characterized by elemental analysis. Spent catalysts collected from each experiment were further characterized by XPS and TPO for their chemical states and to estimate the quantity of coke deposition, respectively. In addition, HAADF-STEM imaging was performed on the spent catalyst recovered from the experiment with 1.3 wt.% of PC.
The specific surface area, pore size, and pore volume of the synthesized catalyst were determined by nitrogen adsorption-desorption isotherms using a TriStar 3000 gas adsorption analyzer (Norcross, GA, USA). At first, the sample (~300 mg) was dried (degassing) at 225 °C under vacuum for 2 h in a flow of dry air. The sample was then placed in the apparatus for analysis. The specific surface area was calculated based on the Brunauer-Emmett-Teller equation (BET). The pore size was estimated based on the desorption isotherm using the Barret-Joyner-Halenda equation (BJH).
Elemental C, H, and N analysis was carried out on a CE Instruments elemental analyzer EA-1110 (CE Instruments, Milan, Italy), whereas a Fisons instrument elemental analyzer NA2000 (Fisons Instruments, Milan, Italy) was configured for S analysis. The analysis uses high temperature combustion followed by GC separation, detection by thermal conductivity, and quantification based on the calibration.
X-ray Photoelectron Spectroscopy (XPS) studies on sulfided and different spent catalysts were performed using a Perkin Elmer PHI 5000C ESCA system (Waltham, MA‎, USA). The monochromatic Al-Kα source with a binding energy of 1486.6 eV was used to record spectra for all samples. Samples were initially placed on a double-sided carbon tape on the sample holder. They were then placed on the manipulator fork of the pretreatment chamber under nitrogen atmosphere. The sample holder was then carefully transferred to the sample stage of the ultra-high vacuum chamber when the desired pressure had been reached (usually less than 2 × 10⁻⁸ torr). In the vacuum chamber, the sample was irradiated with the radiation source and emitted photoelectrons were detected by a spherical energy analyzer. The angle between the source and detector was 90°. In addition to the full scan data, high resolution spectra with a step of 0.125 eV were recorded for Ni, Mo, O, S, C, and P core level spectra. Data were analyzed by MultiPak software provided with the instrument and with CasaXPS. The C1s binding energy of 284.6 eV was taken as the reference for all spectra.
Samples for transmission electron microscopy (TEM) were prepared by applying a small amount of the dry powder onto a carbon coated copper grid. TEM analysis was performed using an FEI Titan 80-300 TEM (FEI, Inc., Hillsboro, OR, USA) operating at an accelerating voltage of 300 kV. Images were acquired in the scanning TEM (STEM) mode using a high angle annular dark field (HAADF) detector. Energy dispersive X-ray (EDX) analysis for chemical identification was also performed in the STEM mode using an Oxford X-sight detector. Spectrum acquisition and data analysis were performed using the TEM Imaging & Analysis (TIA). MoS2 slab length and stacking degree were measured by ImageJ software.
Temperature Programmed Oxidation (TPO) experiments were performed in a setup consisting of a manifold of mass flow controllers (MFC) for feed gas mixing, a Setaram Sensys differential scanning calorimeter with a quartz tube containing the catalyst sample, and a mass spectrometer (Hiden HPR-20 QUI, Hiden Analytical, Warrington, UK) for measuring the quantities of oxidation products in the outlet carrier gas. Ar was used as the carrier gas for all experiments. The total gas flow rate was maintained at 20 NmL/min through quartz tubes. Approximately 25 mg of the spent catalyst was placed on the sintered bed of the quartz tube. The sample was then heated to 250 °C at 25 °C min−1, followed by 2 h of isothermal operation, and cooling to 50 °C while the sample was continuously exposed to Ar only. Finally, the sample was heated to 800 °C at 2 °C min−1 with 21% O2 in Ar. The coke deposition on each of the spent catalyst samples was calculated based on a calibration for CO, CO2, and H2O in the carrier gas. Water calibration was done by completely oxidizing a set feed concentration of hydrogen and excess oxygen over a Pt/Al2O3 catalyst at 300 °C.

4. Conclusions

In this study, NiMo/γ-Al2O3 catalyst has been examined for HDO of oleic acid in the presence of a major bio/algal oil phospholipid, phosphatidylcholine. Activity tests with the freshly sulfided catalyst revealed high deoxygenation activity mainly by DCOx and direct HDO. Studies with different amounts of PC in the liquid feed shows that overall oxygenate conversion, fatty acid/olefin hydrogenation (saturation of the double bond), and subsequent C=O hydrogenolysis were affected significantly. Moreover, the decarboxylation/decarbonylation route was more influenced by PC compared to the direct HDO route and a proportional decrease in C17+ yield was observed as a function of the PC concentration in the feed. We propose that the observed deactivation is due to formation of both phosphoric acid and choline (a strong base) from the decomposition of the phosphatidylcholine.
The elemental analysis revealed that the sulfur amount was similar in all recovered catalyst samples, thus, the deactivation is not originating from a loss of sulfur. However, comparable amounts of nitrogen were observed on each catalyst after experiments with phospholipids, demonstrating the interaction of choline/amines with the catalyst. ICP-SFMS data on the recovered catalyst and liquid phase clearly show that P selectively deposited on the catalyst. Moreover, TEM-EDX showed that P was evenly distributed over the support alumina. It did not appear that P associated preferentially with the active NiS or NiMoS phase, but was instead distributed over the support, which lowered the dispersion of the MoS2 slabs and affected the Ni promotion. Hence, there was no direct evidence indicating P interaction with Ni and Mo species. This observation in combination with XPS led us to the conclusion that aluminum phosphate (AlPO4) is formed, which blocks the actives sites and pores, and thereby results in the observed deactivation. Nitrogen physisorption data on the recovered catalyst confirms severe pore blocking even in the presence of small amounts of phospholipid in the feed.
TPO of spent catalysts was used to quantify and characterize the coke formed. Two clear peaks for the COx (CO+CO2) were evident, and, in addition, large water peaks were observed that coincided with the low temperature COx peak. Analysis of these data clearly showed that the C/H ratio was much lower for the low temperature peak, and we therefore conclude that this peak mostly results from oxidation of residual adsorbed reactants and intermediate species, i.e. soft coke. The high temperature peak had a much lower hydrogen content, and this peak therefore originates from mainly advanced coke formation. However, an increasing trend of more advanced coke formation has been observed with the increasing PC concentration in the feed, likely resulting from the formation of phosphoric acid from the PC decomposition.

Supplementary Materials

The following are available online at https://www.mdpi.com/2073-4344/8/10/418/s1, Figure S1: BF-TEM micrograph of the catalyst collected from the baseline experiment (NiMo_0 PC) without PC, Figure S2: TEM-EDX data: The brighter areas show signal from Mo but no Ni, Table S1: Measurement of carbon (C) and hydrogen (H) content (wt.%) of the recovered catalyst by TPO.

Author Contributions

M.A.S., S.T. and L.O. planned the experiments; M.A.S. performed the experiments; M.A.S., D.C., P.A., S.T. and L.O. analyzed the data; M.A.S. wrote the paper; P.A., S.T., D.C., E.L.G. and L.O. reviewed and edited the paper; D.C. and L.O. supervised M.A.S.

Funding

This research was funded by [Preem] grant number [239-2012-1584] and [Formas] grant number [239-2014-164]

Acknowledgments

This work is performed at the Competence Centre for Catalysis (KCK), division of chemical reaction engineering at Chalmers University of Technology. We would like to acknowledge Preem, Formas (Contract: 239-2012-1584 and 239-2014-164) and Swedish Energy Agency for financial aid. We also like to acknowledge Stefan Gustafsson for his help with TEM analysis.

Conflicts of Interest

The authors declare no conflict of interest.

References

  1. Dauenhauer, P.J. Handbook of Plant-Based Biofuels; Ashok, P., Ed.; CRC Press: Boca Raton, FL, USA, 2010; Volume 3, pp. 386–387. ISBN 978-1-56022-175-3. [Google Scholar]
  2. Kubička, D.; Tukač, V. Hydrotreating of triglyceride-based feedstocks in refineries. Adv. Chem. Eng. 2012, 42, 141–194. [Google Scholar]
  3. Srifa, A.; Viriya-empikul, N.; Assabumrungrat, S.; Faungnawakij, K. Catalytic behaviors of Ni/γ-Al2O3 and Co/γ-Al2O3 during the hydrodeoxygenation of palm oil. Catal. Sci. Technol. 2015, 5, 3693–3705. [Google Scholar] [CrossRef]
  4. Kubička, D.; Kaluža, L. Deoxygenation of vegetable oils over sulfided Ni, Mo and NiMo catalysts. Appl. Catal. A Gen. 2010, 372, 199–208. [Google Scholar] [CrossRef]
  5. Mortensen, P.M.; Grunwaldt, J.-D.; Jensen, P.A.; Knudsen, K.G.; Jensen, A.D. A review of catalytic upgrading of bio-oil to engine fuels. Appl. Catal. A Gen. 2011, 407, 1–19. [Google Scholar] [CrossRef]
  6. Laurent, E.; Delmon, B. Study of the hydrodeoxygenation of carbonyl, carboylic and guaiacyl groups over sulfided CoMo/γ-Al2O3 and NiMo/γ-Al2O3 catalyst. Appl. Catal. A Gen. 1994, 109, 97–115. [Google Scholar] [CrossRef]
  7. Furimsky, E. Catalytic hydrodeoxygenation. Appl. Catal. A Gen. 2000, 199, 147–190. [Google Scholar] [CrossRef]
  8. Enol, O.İ.; Viljava, T.-R.; Krause, A.O.I. Hydrodeoxygenation of aliphatic esters on sulphided NiMo/γ-Al2O3 and CoMo/γ-Al2O3 catalyst: The effect of water. Catal. Today 2005, 106, 186–189. [Google Scholar]
  9. He, Z.; Wang, X. Hydrodeoxygenation of model compounds and catalytic systems for pyrolysis bio-oils upgrading. Catal. Sustain. Energy 2012, 1, 28–52. [Google Scholar] [CrossRef]
  10. Marafi, M.; Stanislaus, A.; Furimsky, E. Handbook of Spent Hydroprocessing Catalysts: Regeneration, Rejuvenation, Reclamation, Environment and Safety; Elsevier BV: Oxford, UK, 2010; ISBN 978-0-444-53556-6. [Google Scholar]
  11. Kalnes, T.N.; Koers, K.P.; Marker, T.; Shonnard, D.R. A technoeconomic and environmental life cycle comparison of green diesel to biodiesel and syndiesel. Environ. Prog. Sustain. Energy 2009, 28, 111–120. [Google Scholar] [CrossRef]
  12. Arora, P.; Ojagh, H.; Woo, J.; Grennfelt, E.L.; Olsson, L.; Creaser, D. Investigating the effect of Fe as a poison for catalytic HDO over sulfided NiMo alumina catalysts. Appl. Catal. B Environ. 2018, 227, 240–251. [Google Scholar] [CrossRef]
  13. Laakkonen, M.; Myllyoja, J.; Toukoniitty, B.; Hujanen, M.; Saastamoinen, A.; Toivo, A. Process for Manufacture of Liquid Fuel Componenst from Renewable Sources. U.S. Patent 13,646,250, 4 November 2013. [Google Scholar]
  14. Bartholomew, C.H. Mechanisms of catalyst deactivation. Appl. Catal. A Gen. 2001, 212, 17–60. [Google Scholar] [CrossRef]
  15. Beckman, D.; Elliott, D.C. Comparisons of the yields and properties of the oil products from direct thermochemical biomass liquefaction processes. Can. J. Chem. Eng. 1985, 63, 99–104. [Google Scholar] [CrossRef]
  16. Mortensen, P.M.; Gardini, D.; Damsgaard, C.D.; Grunwaldt, J.-D.; Jensen, P.A.; Wagner, J.B.; Jensen, A.D. Deactivation of Ni-MoS2 by bio-oil impurities during hydrodeoxygenation of phenol and octanol. Appl. Catal. A Gen. 2016, 523, 159–170. [Google Scholar] [CrossRef]
  17. Kubička, D.; Horáček, J. Deactivation of HDS catalysts in deoxygenation of vegetable oils. Appl. Catal. A Gen. 2011, 394, 9–17. [Google Scholar] [CrossRef]
  18. Popov, S.; Kumar, S. Renewable fuels via catalytic hydrodeoxygenation of lipid-based feedstocks. Biofuels 2013, 4, 219–239. [Google Scholar] [CrossRef]
  19. Dijkstra, A.J. About water degumming and the hydration of non-hydratable phosphatides. Eur. J. Lipid Sci. Technol. 2017, 119, 1600496. [Google Scholar] [CrossRef]
  20. Paisan, S.; Chetpattananondh, P.; Chongkhong, S. Assessment of water degumming and acid degumming of mixed algal oil. J. Environ. Chem. Eng. 2017, 5, 5115–5123. [Google Scholar] [CrossRef]
  21. Kiatkittipong, W.; Phimsen, S.; Kiatkittipong, K.; Wongsakulphasatch, S.; Laosiripojana, N.; Assabumrungrat, S. Diesel-like hydrocarbon production from hydroprocessing of relevant refining palm oil. Fuel Process. Technol. 2013, 116, 16–26. [Google Scholar] [CrossRef]
  22. Bailey, D.S.; Northcote, D.H. Phospholipid composition of the plasma membrane of the green alga, hydrodictyon africanum. Biochem. J. 1976, 156, 295–300. [Google Scholar] [CrossRef] [PubMed]
  23. Meng, X.; Pan, Q.; Ding, Y.; Jiang, L. Rapid determination of phospholipid content of vegetable oils by FTIR spectroscopy combined with partial least-square regression. Food Chem. 2014, 147, 272–278. [Google Scholar] [CrossRef] [PubMed]
  24. Fitz, C.W.; Rase, H.F. Effects of phosphorus on nickel-molybdenum hydrodesulfurization/hydrodenitrogenation catalysts of varying metals content. Ind. Eng. Chem. Prod. Res. Dev. 1983, 22, 40–44. [Google Scholar] [CrossRef]
  25. Chadwick, D.; Aitchison, D.W.; Badilla-Ohlbaum, R.; Josefsson, L. Influence of phosphorus on the HDS activity of Ni-Mo/γ-Al2O3 catalysts. Stud. Surf. Sci. Catal. 1983, 323–332. [Google Scholar]
  26. Bouwens, S.M.A.M.; Vissers, J.P.R.; de Beer, V.H.J.; Prins, R. Phosphorus poisoning of molybdenum sulfide hydrodesulfurization catalysts supported on carbon and alumina. J. Catal. 1988, 112, 401–410. [Google Scholar] [CrossRef] [Green Version]
  27. Rayo, P.; Ramírez, J.; Torres-Mancera, P.; Marroquín, G.; Maity, S.K.; Ancheyta, J. Hydrodesulfurization and hydrocracking of maya crude with P-modified NiMo/Al2O3 catalysts. Fuel 2012, 100, 34–42. [Google Scholar] [CrossRef]
  28. Eijsbouts, S.; Van Gestel, J.N.M.; Van Veen, J.N.M.; De Beer, V.H.J.; Prins, R. The effect of phosphate on the hydrodenitrogenation activity and selectivity of alumina-supported sulfided Mo, Ni, and Ni-Mo catalysts. J. Catal. 1991, 131, 412–432. [Google Scholar] [CrossRef]
  29. Mangnus, P.J.; van Langeveld, A.D.; de Beer, V.H.J.; Moulijn, J.A. Influence of phosphate on the structure of sulfided alumina supported cobalt-molybdenum catalysts. Appl. Catal. 1991, 68, 161–177. [Google Scholar] [CrossRef] [Green Version]
  30. Zhou, T.; Yin, H.; Liu, Y.; Han, S.; Chai, Y.; Liu, C. Effect of phosphorus content on the active phase structure of NiMoP/Al2O3 catalyst. J. Fuel Chem. Technol. 2010, 38, 69–74. [Google Scholar] [CrossRef]
  31. Argyle, M.; Bartholomew, C. Heterogeneous catalyst deactivation and regeneration: A review. Catalysts 2015, 5, 145–269. [Google Scholar] [CrossRef]
  32. Furimsky, E.; Massoth, F.E. Deactivation of hydroprocessing catalysts. Catal. Today 1999, 52, 381–495. [Google Scholar] [CrossRef]
  33. Diez, F.; Gates, B.C.; Miller, J.T.; Sajkowski, D.J.; Kukes, S.G. Deactivation of a nickel-molybdenum/.gamma.-alumina catalyst: Influence of coke on the hydroprocessing activity. Ind. Eng. Chem. Res. 1990, 29, 1999–2004. [Google Scholar] [CrossRef]
  34. Simakova, I.; Simakova, O.; Mäki-Arvela, P.; Murzin, D.Y. Decarboxylation of fatty acids over Pd supported on mesoporous carbon. Catal. Today 2010, 150, 28–31. [Google Scholar] [CrossRef]
  35. Laurent, E.; Delmon, B. Influence of water in the deactivation of a sulfided NiMoγ-Al2O3 catalyst during hydrodeoxygenation. J. Catal. 1994, 146, 281–291. [Google Scholar] [CrossRef]
  36. Froment, G.; Delmon, B.F. Catalyst Deactivation, 1st ed.; Elsevier: Amsterdam, The Netherlands, 1994; ISBN 9780080887388. [Google Scholar]
  37. Badawi, M.; Paul, J.F.; Cristol, S.; Payen, E.; Romero, Y.; Richard, F.; Brunet, S.; Lambert, D.; Portier, X.; Popov, A.; et al. Effect of water on the stability of Mo and CoMo hydrodeoxygenation catalysts: A combined experimental and dft study. J. Catal. 2011, 282, 155–164. [Google Scholar] [CrossRef]
  38. Şenol, O.İ.; Viljava, T.-R.; Krause, A.O.I. Effect of sulphiding agents on the hydrodeoxygenation of aliphatic esters on sulphided catalysts. Appl. Catal. A Gen. 2007, 326, 236–244. [Google Scholar] [CrossRef]
  39. Coumans, A.E.; Hensen, E.J.M. A model compound (methyl oleate, oleic acid, triolein) study of triglycerides hydrodeoxygenation over alumina-supported nimo sulfide. Appl. Catal. B Environ. 2017, 201, 290–301. [Google Scholar] [CrossRef]
  40. Ryymin, E.-M.; Honkela, M.L.; Viljava, T.-R.; Krause, A.O.I. Insight to sulfur species in the hydrodeoxygenation of aliphatic esters over sulfided NiMo/γ-Al2O3 catalyst. Appl. Catal. A Gen. 2009, 358, 42–48. [Google Scholar] [CrossRef]
  41. Dupont, C.; Lemeur, R.; Daudin, A.; Raybaud, P. Hydrodeoxygenation pathways catalyzed by MoS2 and NiMoS active phases: A DFT study. J. Catal. 2011, 279, 276–286. [Google Scholar] [CrossRef]
  42. Donnis, B.; Egeberg, R.G.; Blom, P.; Knudsen, K.G. Hydroprocessing of bio-oils and oxygenates to hydrocarbons. Understanding the Reaction Routes. Top. Catal. 2009, 52, 229–240. [Google Scholar] [CrossRef]
  43. Kubička, D. Future refining catalysis-introduction of biomass feedstocks. Collect. Czechoslov. Chem. Commun. 2008, 73, 1015–1044. [Google Scholar] [CrossRef]
  44. Ojagh, H.; Creaser, D.; Tamm, S.; Arora, P.; Nyström, S.; Grennfelt, E.L.; Olsson, L. Effect of dimethyl disulfide on activity of NiMo based catalysts used in hydrodeoxygenation of oleic acid. Ind. Eng. Chem. Res. 2017, 56, 5547–5557. [Google Scholar] [CrossRef]
  45. Changi, S.; Matzger, A.J.; Savage, P.E. Kinetics and pathways for an algal phospholipid (1,2-dioleoyl-sn-glycero-3-phosphocholine) in high-temperature (175–350 °C) water. Green Chem. 2012, 14, 2856–2867. [Google Scholar] [CrossRef]
  46. de Koning, A.J.; McMullan, K.B. Hydrolysis of phospholipids with hydrochloric acid. Biochim. Biophys. Acta, Lipids Lipid Metab. 1965, 106, 519–526. [Google Scholar] [CrossRef]
  47. Qu, L.; Prins, R. Hydrogenation of cyclohexene over in situ fluorinated NiMoS catalysts supported on alumina and silica-alumina. J. Catal. 2002, 207, 286–295. [Google Scholar] [CrossRef]
  48. De Klerk, A. Oligomerization of 1-hexene and 1-octene over solid acid catalysts. Ind. Eng. Chem. Res. 2005, 44, 3887–3993. [Google Scholar] [CrossRef]
  49. Iwamoto, R.; Grimblot, J. Influence of phosphorus on the properties of alumina-based hydrotreating catalysts. Adv. Catal. 1999, 44, 417–503. [Google Scholar]
  50. Liu, G.; Robertson, A.W.; Li, M.M.-J.; Kuo, W.C.H.; Darby, M.T.; Muhieddine, M.H.; Lin, Y.-C.; Suenaga, K.; Stamatakis, M.; Warner, J.H.; et al. MoS2 monolayer catalyst doped with isolated Co atoms for the hydrodeoxygenation reaction. Nat. Chem. 2017, 9, 810–816. [Google Scholar] [CrossRef] [PubMed]
  51. Sigurdson, S.; Sundaramurthy, V.; Dalai, A.K.; Adjaye, J. Phosphorus promoted trimetallic NiMoW/γ-Al2O3 sulfide catalysts in gas oil hydrotreating. J. Mol. Catal. A Chem. 2008, 291, 30–37. [Google Scholar] [CrossRef]
  52. Marafi, M.; Stanislaus, A. Effect of initial coking on hydrotreating catalyst functionalities and properties. Appl. Catal. A Gen. 1997, 159, 259–267. [Google Scholar] [CrossRef]
  53. Marafi, M.; Stanislaus, A. Influence of catalyst acidity and feedstock quality on hydrotreating catalyst deactivation by coke deposition. Pet. Sci. Technol. 2001, 19, 697–710. [Google Scholar] [CrossRef]
  54. Gong, S.; Shinozaki, A.; Shi, M.; Qian, E.W. Hydrotreating of jatropha oil over alumina based catalysts. Energy Fuels 2012, 26, 2394–2399. [Google Scholar] [CrossRef]
Figure 1. Products and reactant profile during the reaction at 54 bar, 320 °C, and 0.3 mL dimethyl disulfide (DMDS), (a) oxygenates conversion, C17 and C18 yield, (b) other products and intermediates.
Catalysts 08 00418 g001
Figure 2. Effect of phospholipid (PC) on the HDO of oleic acid at 54 bar and 320 °C using 0.3 mL DMDS; (a) oxygenates conversion, (b) yield of C17+, and (c) yield of C18+.
Catalysts 08 00418 g002
Figure 3. Effect of phospholipid (PC) on the HDO of oleic acid at 54 bar and 320 °C using 0.3 mL DMDS; (a) oxygenates conversion, (b) yield of C17+, (c) yield of C18+.
Catalysts 08 00418 g003
Figure 4. Effect of phospholipid (PC) on the formation of C17 and C18 alkanes/alkenes at the end of a 4 h reaction.
Catalysts 08 00418 g004
Figure 5. Effect of choline on the deoxygenation of oleic acid 54 bar and 320 °C using 0.3 mL DMDS; (a) oxygenates conversion, (b) yield of C17+, (c) yield of C18+.
Catalysts 08 00418 g005
Figure 6. Effect of an equivalent amount of water in choline hydroxide on the HDO of oleic acid at 54 bar, 320 °C, and 1000 rpm of stirring.
Catalysts 08 00418 g006
Figure 7. P2p core level spectra for the recovered catalysts with PC.
Catalysts 08 00418 g007
Figure 8. TEM analysis on the spent catalyst representing (a) BF-TEM micrograph, inset in (a) shows a characteristic area of the support and (b) energy dispersive X-ray (EDX) analysis on the characteristic area in (a).
Catalysts 08 00418 g008
Figure 9. HAADF-STEM imaging and EDX mapping on a single particle showing Al, O, and P elemental distribution.
Catalysts 08 00418 g009
Figure 10. (a) CO, CO2, and H2O profile during TPO of the recovered catalyst; (b) measurement of carbon (C) and hydrogen (H) content (wt.%) of the recovered catalysts from TPO.
Catalysts 08 00418 g010
Table 1. Initial rates of oxygenates and alkane formation measured at 1 h.
Catalystroxygenates
(mmol/g/h)
rC17+
(mmol/g/h)
rC18+
(mmol/g/h)
NiMo_0 PC59.165.813.8
NiMo_0.4 PC46.347.313.9
NiMo_0.9 PC32.238.213.2
NiMo_1.3 PC27.623.87.6
NiMo_Choline45.939.514.9
NiMo_R_0 PC35.739.411.9
NiMo_R_0.4 PC18.026.38.8
Table 2. Surface area (BET), pore volume, and pore size of the catalyst.
CatalystBET Surface Area (m2/g)Pore Volume (cm3/g)Average Pore Size (Å)
Synthesized1430.3362.3
NiMo_0 PC1260.2762.1
NiMo_0.4 PC1050.2255.2
Table 3. Elemental contents of carbon, hydrogen, sulfur, and nitrogen on the freshly sulfided and recovered catalyst samples.
CatalystC, wt.%H, wt.%S, wt.%N, wt.%
Sulfided0.41.39.22<0.05
NiMo_0 PC2.961.577.30<0.05
NiMo_0.4 PC5.341.657.390.36
NiMo_0.9 PC5.901.37.400.30
NiMo_1.3 PC7.741.737.470.37
NiMo_R_0 PC7.261.877.12<0.05
NiMo_R_0.4 PC6.311.427.050.26
Table 4. ICP-SFMS data for spent catalyst and liquid phase.
CatalystP Added in Liquid, ppmTheoretical Maximum P in Catalyst, wt.%Actual P in Catalyst (ICP), wt.%Atomic Ratio of Ni/(Ni +Mo)P Remaining in Liquid Phase (ICP) ppm
As Synthesized---0.37-
NiMo_0.9 PC53212.161.270.4111.1
NiMo_0.4 PC179 4.091.980.398.37
NiMo_R_0.4 PC *1798.183.180.3910.6
* Refers to recovered catalyst from the first experiment.
Table 5. Concentration of phospholipid studied and acronyms used in this article.
PC in Feed (wt.%)Catalyst (NiMo/Al2O3)
0NiMo_0 PC
0.44NiMo_0.4 PC
0.88NiMo_0.9 PC
1.3NiMo_1.3 PC
0NiMo_R_0 PC *
0.44NiMo_R_0.4 PC *
* Refers to recovered catalyst from the first experiment.

