Article

Effect of H2O and O2 on the Adsorption and Degradation of Acetaldehyde on Anatase Surfaces—An In Situ ATR-FTIR Study

by
Stephanie Melchers
1,*,
Jenny Schneider
1,
Alexei V. Emeline
2 and
Detlef W. Bahnemann
1,2
1
Institut für Technische Chemie, Leibniz Universität Hannover, Callinstr. 5, 30167 Hannover, Germany
2
Laboratory “Photoactive Nanocomposite Materials”, Saint-Petersburg State University, Ulyanovskaya str. 1, Peterhof, Saint-Petersburg 198504, Russia
*
Author to whom correspondence should be addressed.
Catalysts 2018, 8(10), 417; https://doi.org/10.3390/catal8100417
Submission received: 10 September 2018 / Revised: 21 September 2018 / Accepted: 21 September 2018 / Published: 25 September 2018
(This article belongs to the Special Issue Photocatalysis Science and Engineering in Europe)

Abstract

:
The effect of H2O and O2 on the adsorption and degradation of gaseous acetaldehyde on the anatase TiO2 surface has been studied, in the dark and upon UV illumination, at ambient temperatures. The processes occurring at the surface have been elucidated by means of in situ ATR–FTIR (Attenuated Total Reflection—Fourier Transform Infrared) spectroscopy, while gas detectors allowed the analysis of the adducts and products in the gas phase. In the dark and under dry conditions acetaldehyde reacts independently of the atmosphere, upon aldol condensation to crotonaldehyde. However, under humid conditions, this reaction was prevented due to the replacement of the adsorbed acetaldehyde molecules, by water molecules. Upon UV illumination under oxygenic conditions, acetaldehyde was decomposed to acetate and formate. Under an N2 atmosphere, the formation of acetate and formate was observed during the first hour of illumination, until all adsorbed oxygen had been consumed. In the absence of molecular oxygen acetate, methane, and CO2 were detected, the formation of which most likely involved the participation of the bridging O atoms, within the TiO2 lattice.

Graphical Abstract

1. Introduction

Nowadays, the demand for clean and fresh indoor air is a public health issue. Herein, one major indoor air pollutant is acetaldehyde, which is a potential human carcinogen [1], whose maximum occupational exposure levels are set in Europe, and in the USA [2,3]. In this context, photocatalysis might be a sustainable and environmentally friendly solution to decrease the concentration of acetaldehyde. Upon UV(A) illumination, TiO2 is able to catalyze the decomposition of organic compounds, yielding CO2, H2O, and traces of mineral acids as reaction products [4]. The photocatalytic efficiency of this process can be further improved, provided that the reaction mechanism and the limitations are known.
In situ ATR–FTIR (Attenuated Total Reflection–Fourier Transform Infrared) spectroscopy is an established technique that provides a deeper understanding of the interfacial processes occurring at the semiconductor/water interface. This technique allows the monitoring of the molecule adsorption from gaseous and from liquid phase on solid surfaces, as well as the detection of intermediates and products of photocatalytic processes [5,6].
Employing FTIR spectroscopy it has been reported that under dry conditions in the dark an aldol condensation of two acetaldehyde molecules occurs on the TiO2 surface resulting in the formation of crotonaldehyde [7]. Subsequently, 3-Hydroxybutanal has also been identified as a short-lived intermediate [8,9]. Batault et al. [10] investigated the adsorption of acetaldehyde on the TiO2 surface under dry and humid conditions. These authors reported that under dry conditions acetaldehyde is mostly irreversibly adsorbed on the TiO2 surface, while under 50% relative humidity (RH) acetaldehyde adsorption only occurs as a reversible physical adsorption. The effect of humidity on the formation of crotonaldehyde was not discussed.
Ohko et al. [11] and Muggli et al. [12] investigated the photocatalytic degradation of acetaldehyde over TiO2, under weak UV illumination, in the presence of O2. These authors proposed the reaction mechanism shown in Figure 1. According to this mechanism, acetaldehyde is first oxidized to acetic acid, followed by the decarboxylation of acetic acid, yielding CO2. The remaining methyl radical is transformed into formaldehyde which can be further oxidized to formic acid and eventually to CO2.
The previously mentioned reaction pathway was proposed for the degradation of acetaldehyde in the presence of O2. To the best of our knowledge, the degradation of gaseous acetaldehyde over TiO2 in the absence of molecular O2 has not been reported yet. In photocatalysis O2 usually plays an important role preventing the charge carrier recombination by trapping the photogenerated electrons upon formation of a superoxide radical O2˙ which can be further reduced leading to the formation of a strong oxidant that is the hydroxyl radical. Furthermore, O2 is involved in free radical chain reactions occurring during the photocatalytic degradation of organic compounds [13].
In this study, the effect of water vapor on the adsorption of acetaldehyde and on the formation of crotonaldehyde on the TiO2 surface were investigated, in the dark. Furthermore, the photocatalytic degradation of gaseous acetaldehyde over TiO2 was investigated, upon UV illumination in the N2 atmosphere, in order to examine the photocatalytic degradation mechanism of acetaldehyde, in the absence of O2. In situ ATR-FTIR spectra were recorded to elucidate the processes occurring on the TiO2 surface while adducts and evolved products in the gas phase, were analyzed by mass spectrometry (MS) and GC.

2. Results and Discussion

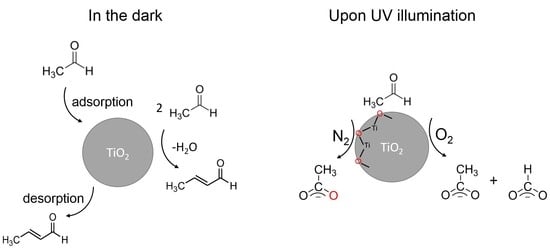
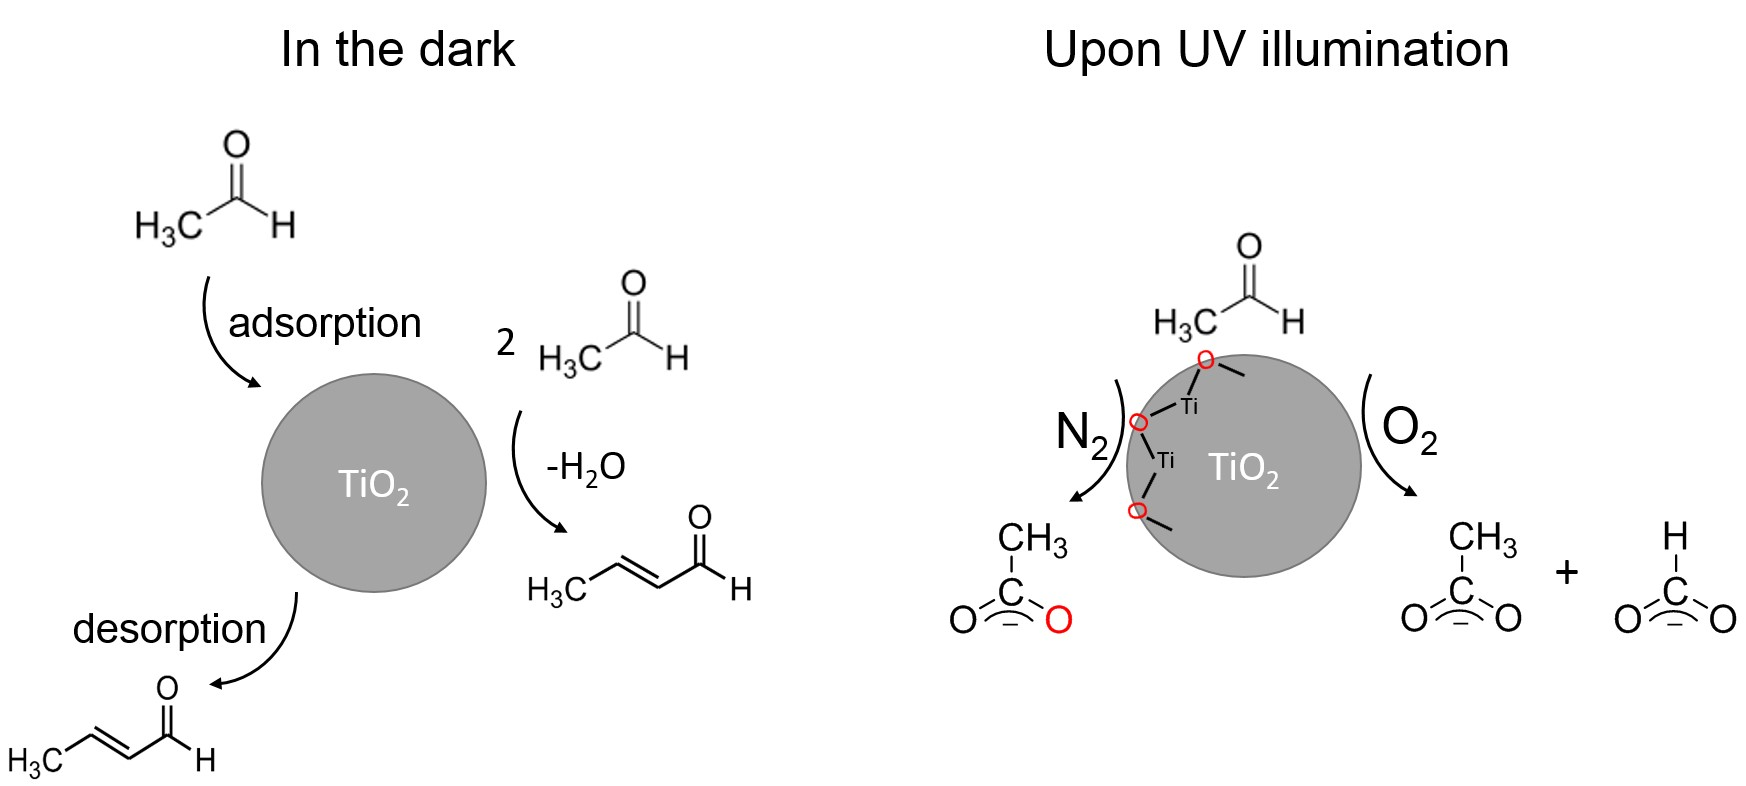
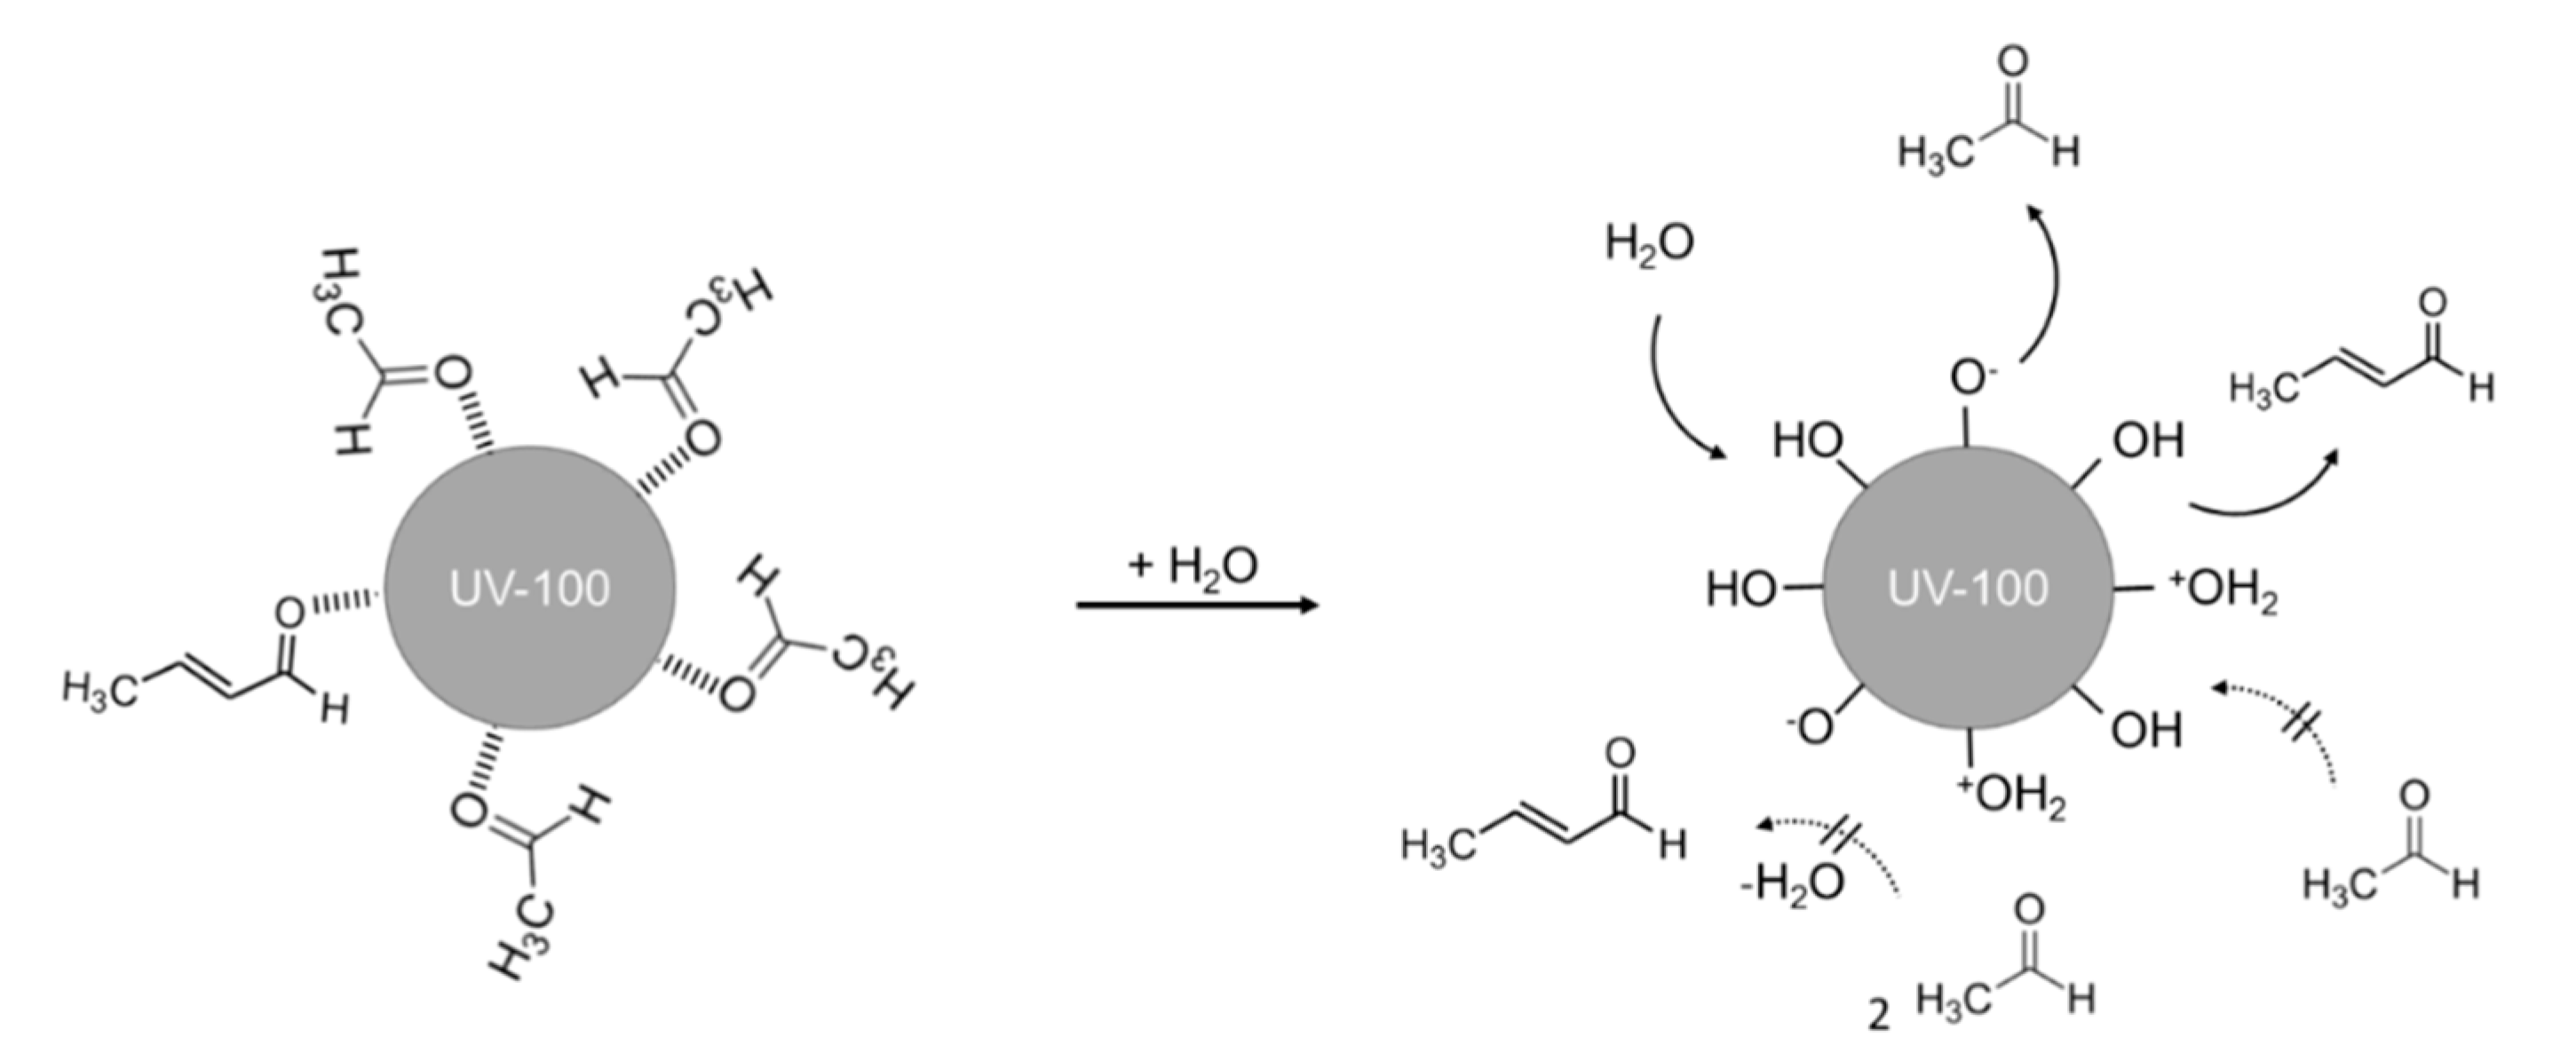
2.1. Effect of H2O on the Acetaldehyde Adsorption

Figure 2 shows the change in the acetaldehyde concentration, over time, measured in the presence of air, in dry and in humid conditions, in the dark. When a TiO2 film was treated with 1000 ppb gaseous acetaldehyde, under dry conditions, a decrease in the concentration of acetaldehyde, from 1000 ppb to about 700 ppb was observed (Figure 2, left). Surprisingly, the reduced concentration remained constant even after several hours of treatment (Figure S1). In contrast, the presence of humid air led to a short lowering of the acetaldehyde concentration, indicating an adsorption on the anatase surface, until all adsorption sites were occupied, and the initial concentration was reached again (Figure 2, right).
ATR-FTIR analysis of a TiO2 film treated with acetaldehyde was performed to figure out the reason behind the constant low amount of acetaldehyde detected at the reactor outlet, under dry conditions, in the dark. Figure 3 shows the FTIR spectra in the wavenumber range between 1000 cm−1 and 1800 cm−1, which were recorded during the gaseous purging of acetaldehyde over a TiO2 film, for two hours, in the dark. Different bands appeared and increased in intensity, during the acetaldehyde dosing. In Table 1, the positions of the bands are assigned to the specific molecular vibrations of acetaldehyde and crotonaldehyde. These band assignments were in accordance to literature, where an adsorption of acetaldehyde on TiO2 had also been reported by the FTIR spectroscopy [9,14,15]. The carbonyl group of acetaldehydes could form hydrogen bonds with the surface hydroxyl groups of the TiO2. It could be stabilized on the TiO2 surface, via an interaction between the oxygen lone pair, with the Lewis surface sites of TiO2 [14,16], the corresponding vibrational position was located at ν(C=O) 1699 cm−1. Additional characteristic bands of acetaldehyde, such as the ρ(CH3) and ν(C-C) were also detected and these can be seen in Table 1.
Besides acetaldehyde, bands characteristic for the molecular vibrations of crotonaldehyde were observed. Singh et al. [8] showed by IR spectroscopy, that an aldol condensation of two acetaldehyde molecules which then forms crotonaldehyde, takes place on the TiO2 surface. Here, it is noteworthy to mention, that the ρ(CH3), ν(C-C), and ν(C=O) showed a higher increase in intensity during the second hour of treatment, as compared to the first hour (see pink and green curve). This could be explained by the fact that for the formation of crotonaldehyde, two acetaldehyde molecules needed to be adsorbed on the anatase surface, reacting via an aldol condensation. A higher amount of crotonaldehyde was formed during the second hour of treatment, because a certain time was required to achieve a sufficient adsorption of acetaldehyde on the TiO2 surface. Taking into account the continuous small acetaldehyde concentration of 700 ppb measured at the reactor exit (see Figure 2, left), it was proposed that the evolved crotonaldehyde was continuously desorbed from the TiO2 surface and replaced by the new acetaldehyde molecules, which again reacted to the crotonaldehyde (see Figure 4).
This assumption was confirmed by mass spectrometry (MS) analysis. Herein, 50 ppm of acetaldehyde were directed over an anatase film and the gas at the outlet was continuously analyzed by MS (Figure S2). The QMS (quadrupole mass spectrometer) signal of the mass of 41 m/z, corresponding to the crotonaldehyde, steadily increased until it reached a stable value after 15 h. When the acetaldehyde gas flow was turned off, the QMS signal decreased again. Accordingly, crotonaldehyde was desorbed from the anatase surface and it could be detected in the gas phase. Similar results were reported by Rekoske et al. [17]. The authors have investigated the competition between the adsorption of acetaldehyde and of crotonaldehyde on rutile surfaces and figured out that the evolved crotonaldehyde could be readily displaced through continuous exposure of acetaldehyde. However, these authors claimed that crotonaldehyde cannot be formed on anatase surfaces.
For a better understanding of the processes occurring under dry and humid conditions, the experiment shown in Figure 2 was repeated and a TiO2 film was treated with a gas flow of 1000 ppb of acetaldehyde, under dry conditions. A constant low amount of 700 ppb acetaldehyde was observed again (see Figure 5) evincing that acetaldehyde was adsorbed on the TiO2 surface where it reacted to the crotonaldehyde. Hence, crotonaldehyde and acetaldehyde were present on the surface. When the gas flow was changed to the bypass mode, the concentration of acetaldehyde increased to the initial value again. Water was subsequently added to a washing flask to generate a humidified gas flow that was directed over the anatase film again. The concentration of acetaldehyde increased drastically to 6 ppm (6000 ppb) indicating a favorable adsorption of water on the anatase surface which resulted in a desorption of acetaldehyde molecules from the surface. After 2 h, the concentration decreased again to the initial value of 1 ppm (1000 ppb). Hence, in the humid conditions, crotonaldehyde was not generated due to the minor adsorption of acetaldehyde molecules, which were not able to react with each other (see Figure 6).
For verification of the latter results, and to prove the desorption of acetaldehyde and crotonaldehyde from the anatase surface in the presence of water vapor, ATR-FTIR spectra were recorded of a TiO2 layer. For this purpose, a TiO2 film was purged with acetaldehyde, in air, for 2 h, in the dark. Figure 7 shows the expected bands characteristic for acetaldehyde and crotonaldehyde. After the adsorption of acetaldehyde and the formation of crotonaldehyde, water was added to the washing flask to generate a humidified gas flow. The bands of acetaldehyde and crotonaldehyde decreased rapidly within five minutes, indicating a fast desorption of acetaldehyde and crotonaldehyde from the anatase surface. Hence, the adsorption of acetaldehyde on anatase surfaces was reversible, because acetaldehyde and crotonaldehyde could be easily replaced by water molecules. Batault et al. [10]. reported that acetaldehyde adsorption, under dry conditions, mostly occurred irreversibly on the P25 surface. However, these authors heated their TiO2 samples to 400 °C, before each experiment, consequently, decreasing the number of surface hydroxyl groups. In this study the TiO2 film was prepared at ambient temperature, therefore, the number of surface hydroxyl groups should be higher. Batault et al. [10] also reported that under 50% RH, the adsorption on P25 only occurred as a reversible physical adsorption. The total surface hydroxylation prevented acetaldehyde to adsorb, irreversibly, since a complete surface hydroxylation already occurred below a RH of 10% [19]. With regards to the reaction mechanism for the crotonaldehyde formation proposed by Singh et al. [8], the acetaldehyde molecules needed to be adsorbed through the carbonyl group C=O to the Ti atoms, in order to react with each other. However, when the surface was hydroxylated and water was adsorbed, the carbonyl group C=O of acetaldehyde molecules was not able to interact with the Ti-atoms. El-Maazawi et al. [20] discovered the formation of mesityl oxide from acetone, both in the presence and in the absence of H2O, in the dark. In the presence of H2O, a minor amount of mesityl oxide was generated, which the authors explained by the fact that water was a product of the aldol condensation, therefore its presence did not favor the formation of mesityl oxide.
The following adsorption and degradation experiments of acetaldehyde, over TiO2, in the presence and absence of O2, were performed under dry conditions, because ATR-FTIR spectra of acetaldehyde and crotonaldehyde could be recorded, while under humidity, bands of acetaldehyde and crotonaldehyde did not appear.

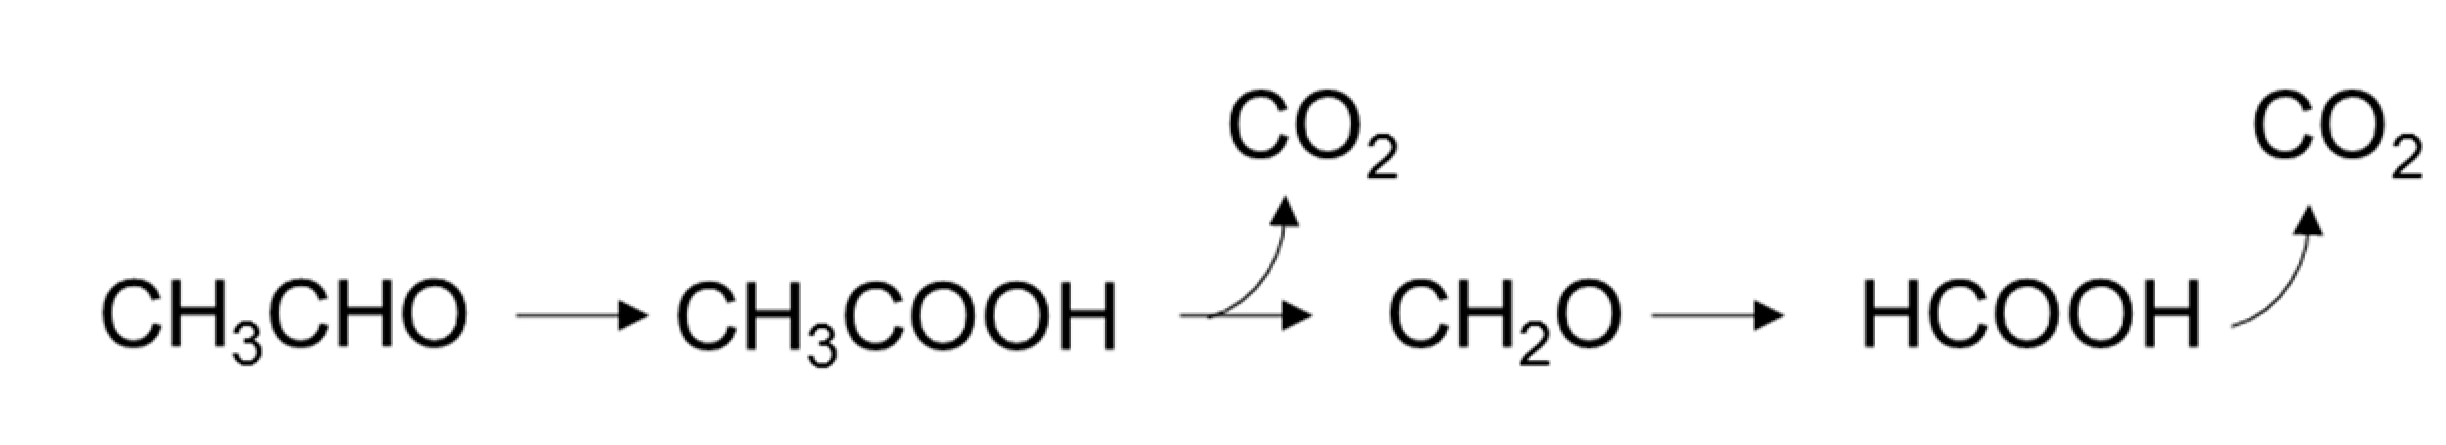
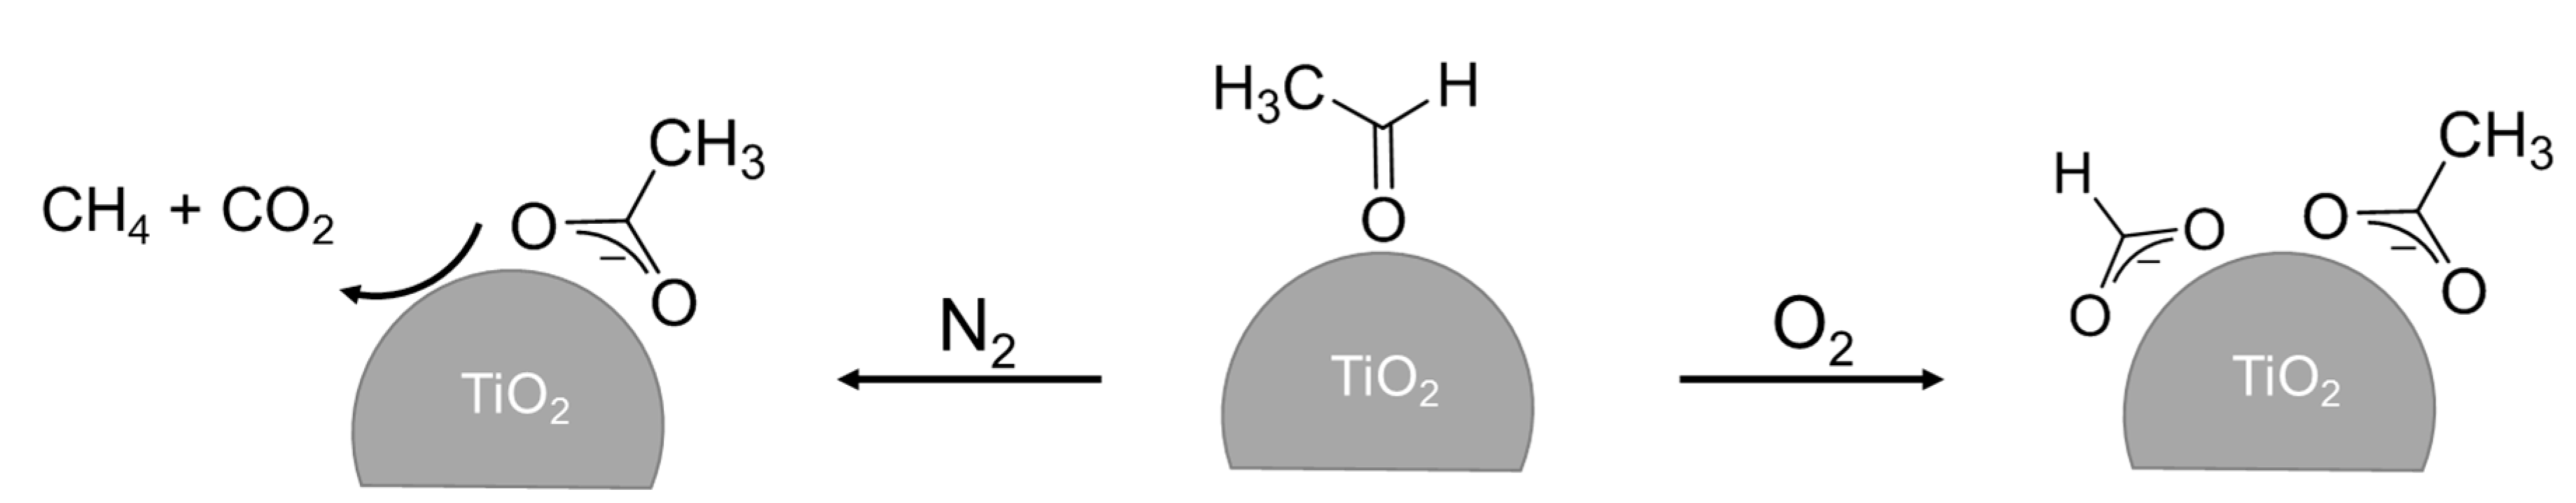
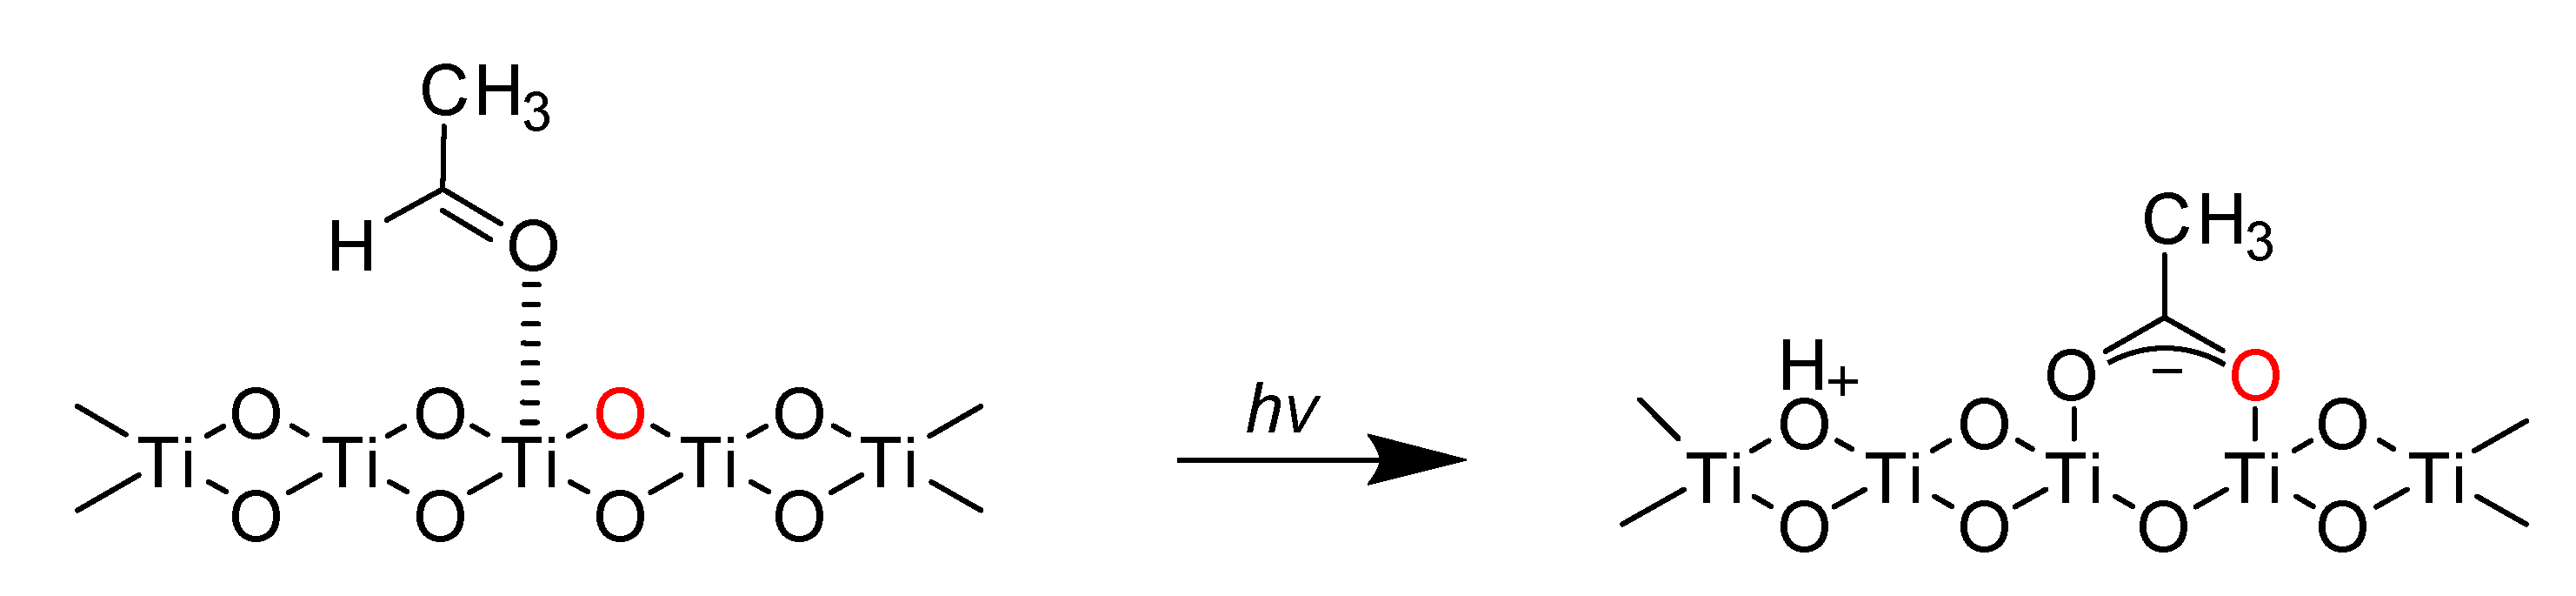
2.2. Effect of O2 on the Adsorption and Degradation of Acetaldehyde

For investigations concerning the effect of O2 on the adsorption of acetaldehyde, the concentration of acetaldehyde as a function of time was monitored, after acetaldehyde had been directed over a TiO2 film, in the presence of O2 (Figure S3, left) and its absence (Figure S3, right). We have calculated that 5.8 × 10¹⁶/cm2 acetaldehyde molecules were adsorbed on the TiO2 surface at the steady-state conditions, in the dark. Furthermore, ATR-FTIR spectra were recorded during acetaldehyde treatment of TiO2 in O2 (Figure S4, left) and in N2 (Figure S4, right) atmosphere. As expected O2 did not have an effect on the adsorption of acetaldehyde, ATR-FTIR spectra, as well as gaseous analysis revealed similar curve progressions in the O2 and the N2 atmosphere.
After the gaseous acetaldehyde treatment in the dark, the samples were illuminated by UV light, for 6 h, in the O2 and in the N2 atmosphere. The corresponding curves, showing the concentration of acetaldehyde as a function of time are displayed in Figure 8 in the presence (left) and in the absence of O2 (right). In both, the O2 and the N2 atmosphere, the concentration of acetaldehyde decreased from 700 ppb to 580 ppb, in the beginning, indicating a degradation of acetaldehyde by TiO2. In the presence of O2, the concentration remained at a constant low, during the UV illumination, thereby evincing a steady decomposition of acetaldehyde, in the O2 atmosphere. After 6 h of UV illumination, the lamp was turned off and the acetaldehyde concentration increased again. In the N2 atmosphere, a different trend was observed. While in the beginning, the concentration of acetaldehyde was as low as in the O2 atmosphere, it increased with increasing illumination time. When the UV lamp was turned off again, the concentration rose further.
ATR-FTIR spectra (Figure 9) of a TiO2 film, treated with acetaldehyde, were recorded in the presence (left) and in the absence (right) of O2, during 6 h of UV illumination, in order to understand the different kinetic curves obtained for the acetaldehyde concentration in the O2 and in the N2 atmosphere (Figure 8). Both graphs show a decrease in the intensity of the bands characteristic for the acetaldehyde and the crotonaldehyde, indicating a decomposition of these molecules. Simultaneously, new bands appeared which increased in intensity, during the illumination time. In Table 2 the observed vibrational frequencies are displayed and correlated with the mode assignments of the intermediates formed during the decomposition of acetaldehyde. Both graphs show bands characteristic for the formate and the acetate/acetic acid formation. The bands of the νs(COO) and νas(COO) of acetate, as well as the ν(C=O) of acetic acid, show similar trends in intensity, in the O2 and N2 atmosphere. When comparing the intensity of the νs(COO) and νas(COO) bands of formate, a difference was observed in the O2 and the N2 atmosphere. While during the first 30 min of illumination the bands were similar (black to purple), afterward, they showed a higher increase in intensity in the O2 atmosphere, than in the N2 atmosphere. Therefore, under oxygenic conditions, a decomposition from the acetate/acetic acid to formate occurred, while under N2, the formation was suppressed and the acetate/acetic acid accumulated on the surface. In the absence of O2, surface-adsorbed O2 was consumed for the formation of the acetate and the formate, in the first 30 min of illumination. When the adsorbed O2 was consumed, only a small amount of acetaldehyde was decomposed into the formate. In the presence of O2, acetate was decomposed into the formate, as indicated by an increase of the νs(COO) and νas(COO) bands of the formate, with the illumination time.
For a better understanding of the reaction mechanism for the photocatalytic degradation of acetaldehyde in the absence of O2, the evolved gaseous products were detected by MS. For that purpose, a TiO2 film was treated with 50 ppm of acetaldehyde, upon UV illumination and the gas at the outlet was constantly analyzed by MS. Figure S5 demonstrates the QMS signal, as a function of time of the masses 44 m/z and 16 m/z, corresponding to CO2 and CH4. Both QMS signals increased upon UV illumination and decreased again when the UV light was turned off.
A schematic illustration of the intermediates formed in the O2 and the N2 atmosphere was presented in Figure 10. When correlating the ATR-FTIR results with the acetaldehyde concentration vs. time curves, it was concluded that during the first 30 min of illumination the decomposition of acetaldehyde was similar in the O2 and in the N2 atmosphere. Both showed a decrease in the concentration of acetaldehyde and the formation of acetate and formate. In the N2 atmosphere, surface adsorbed O2 was consumed for the decomposition of acetaldehyde, to form acetate and formate, while in the O2 atmosphere there was an adequate amount of O2 available from the gas phase for the degradation of acetaldehyde. After 30 min, upon UV illumination in the presence of O2, a constant low amount of acetaldehyde was observed. The ATR-FTIR spectra revealed a decomposition of acetaldehyde forming both formate and acetic acid/acetate, because a sufficiently high amount of O2 was available for the decomposition of acetaldehyde. In contrast to that, after 30 min, a depletion of O2 occurred in the N2 atmosphere, because most of the surface adsorbed O2 was consumed. As can be seen from the ATR-FTIR spectra, at the beginning of the illumination time, the band at ~1560 cm−1 showed a higher intensity than the band at ~1400 cm−1, because both acetate and formate were generated. At longer illumination times, the intensities of the bands became equal, since acetate was no longer decomposed into formate, due to the depletion of O2. Acetate was rather accumulated on the surface and the degradation of acetaldehyde was suppressed. Therefore, the concentration of acetaldehyde detected, after passing the TiO2 film increased. However, acetate was also degraded to a small extent, forming CH4 and CO2, in the absence of O2.
In Figure 11, a reaction mechanism is proposed to explain the formation of acetate in the absence of O2. Acetaldehyde was adsorbed on the TiO2 surface through its oxygen lone pair to a TiIV center. Upon UV illumination, a proton in the α-position of acetaldehyde was abstracted by a bridging-oxygen, resulting in the formation of a surface hydroxyl species. The neighboring bridging-oxygen (Figure 11, red) atom of the TiIV center was consumed for the formation of an acetate molecule.
In the future, isotopic studies on the degradation of acetaldehyde, using Ti18O2, will be done. Here, the evolved CO2 should contain 18O, in order to prove the assumption that lattice oxygen was involved in the formation of acetate. El-Maazawi et al. [20] and Szanyi et al. [26] investigated the degradation of acetone, in the presence and in the absence of O2, and reported that under oxygenic conditions acetone was completely degraded to CO2, while in the absence of O2, acetate and formate formation proceeded only to a limited extent. Furthermore, when O2 was depleted, acetate and formate were accumulated on the TiO2 surface, and there was not any (or very limited) complete decomposition, forming CO2. These authors proposed that lattice oxygen was involved in the mineralization of acetone. Montoya et al. [27] investigated the photocatalytic degradation of benzene, under anaerobic conditions, employing Ti18O2 as photocatalyst and they were able to show that the evolved CO2 contained lattice 18O atoms from Ti18O2.

3. Materials and Methods

3.1. Materials

The commercial TiO2 photocatalyst Hombikat UV-100, containing 100% anatase (XRD pattern is shown in Figure S6, BET surface 280 m2/g), was provided by Sachtleben Chemie GmbH (Duisburg, Germany). Acetaldehyde gas, containing 251 ppm in N2, was supplied by the Linde Gas AG (Munich, Germany).

3.2. TiO2 Film Preparation

For the ATR-FTIR measurement, a suspension of 5.75 g L−1 UV-100, in deionized water, was sonicated for 15 min, in an ultrasonic bath. Afterward, an aliquot of 400 µL was placed on a ZnSe crystal and was distributed by gently balancing the crystal. The crystal had a size of 6.8 × 72 mm with an area of 490 mm2. After evaporation of the water, a homogeneous film was obtained which had a particle layer of 2.3 g m−2 and a thickness of 1.7 ± 0.3 µm, according to Hug and Sulzberger [28].
For the acetaldehyde degradation measurements, the powder was pressed into a poly(methyl methacrylate) (PMMA) holder with an average size of 4.3 × 4.3 cm. The resulting pellet had a surface size of 18.49 cm2 and was pre-illuminated by UV light (365 nm, 1 mW/cm2, Philips CLEO 100W-R), for at least 24 h, in order to eliminate organic residues from the surface.
For the measurements using MS, an aliquot of 4 mL of a UV-100 suspension (5.75 g L−1) was placed into a PMMA holder with a size of 4.3 × 9.2 cm. After evaporation of the H2O, a homogeneous film was obtained.

3.3. ATR-FTIR Spectroscopy

ATR-FTIR spectra were recorded on a Bruker IFS 66 equipped, with a deuterated triglycine sulfate (DTGS) detector, and an internal reflection element made of ZnSe, with an angle of incidence of 45°, and 9 reflections on the upper face. The interferometer and the infrared light path in the spectrometer were constantly purged with argon, in order to avoid H2O and CO2 contamination. Each spectrum was an average of 300 scans, with a resolution of 4 cm−1. Before each experiment, a sequence of spectra taken, in the dark, for 2 h, and upon UV illumination, for 6 h, without acetaldehyde, were recorded. These spectra were used as blank reference spectra. After the blank spectra had been monitored, spectra in the dark (2 h) and upon UV illumination (6 h), with acetaldehyde, were recorded. The final spectra were obtained by subtraction of the blanks from the ones in the presence of the acetaldehyde.
For experiments under humidity (58%), O2 was directed through a washing flask to generate a humidified gas flow. An LED lamp (LED Flächenstrahler, Omicron-Laserage, Rodgau-Dudenhofen, Germany) was used as the UV illumination source, which had a maximum emission wavelength of 365 nm, and an intensity of 1 mW cm−2. The gas flow was set to 100 mL min−1 and was controlled by mass flow controllers (SIERRA®, Monterey, CA, USA). The acetaldehyde concentration was maintained at 63 ppm. A closed compartment made of Plexi-Glass® (PMMA, Polymethylmethacrylate) was built and attached to the upper part of the ZnSe crystal, in order to generate a continuous gas flow (see Figure S7). The PMMA holder did not affect the photodegradation of acetaldehyde, because a contact did not exist between the reactor and the TiO2 film.

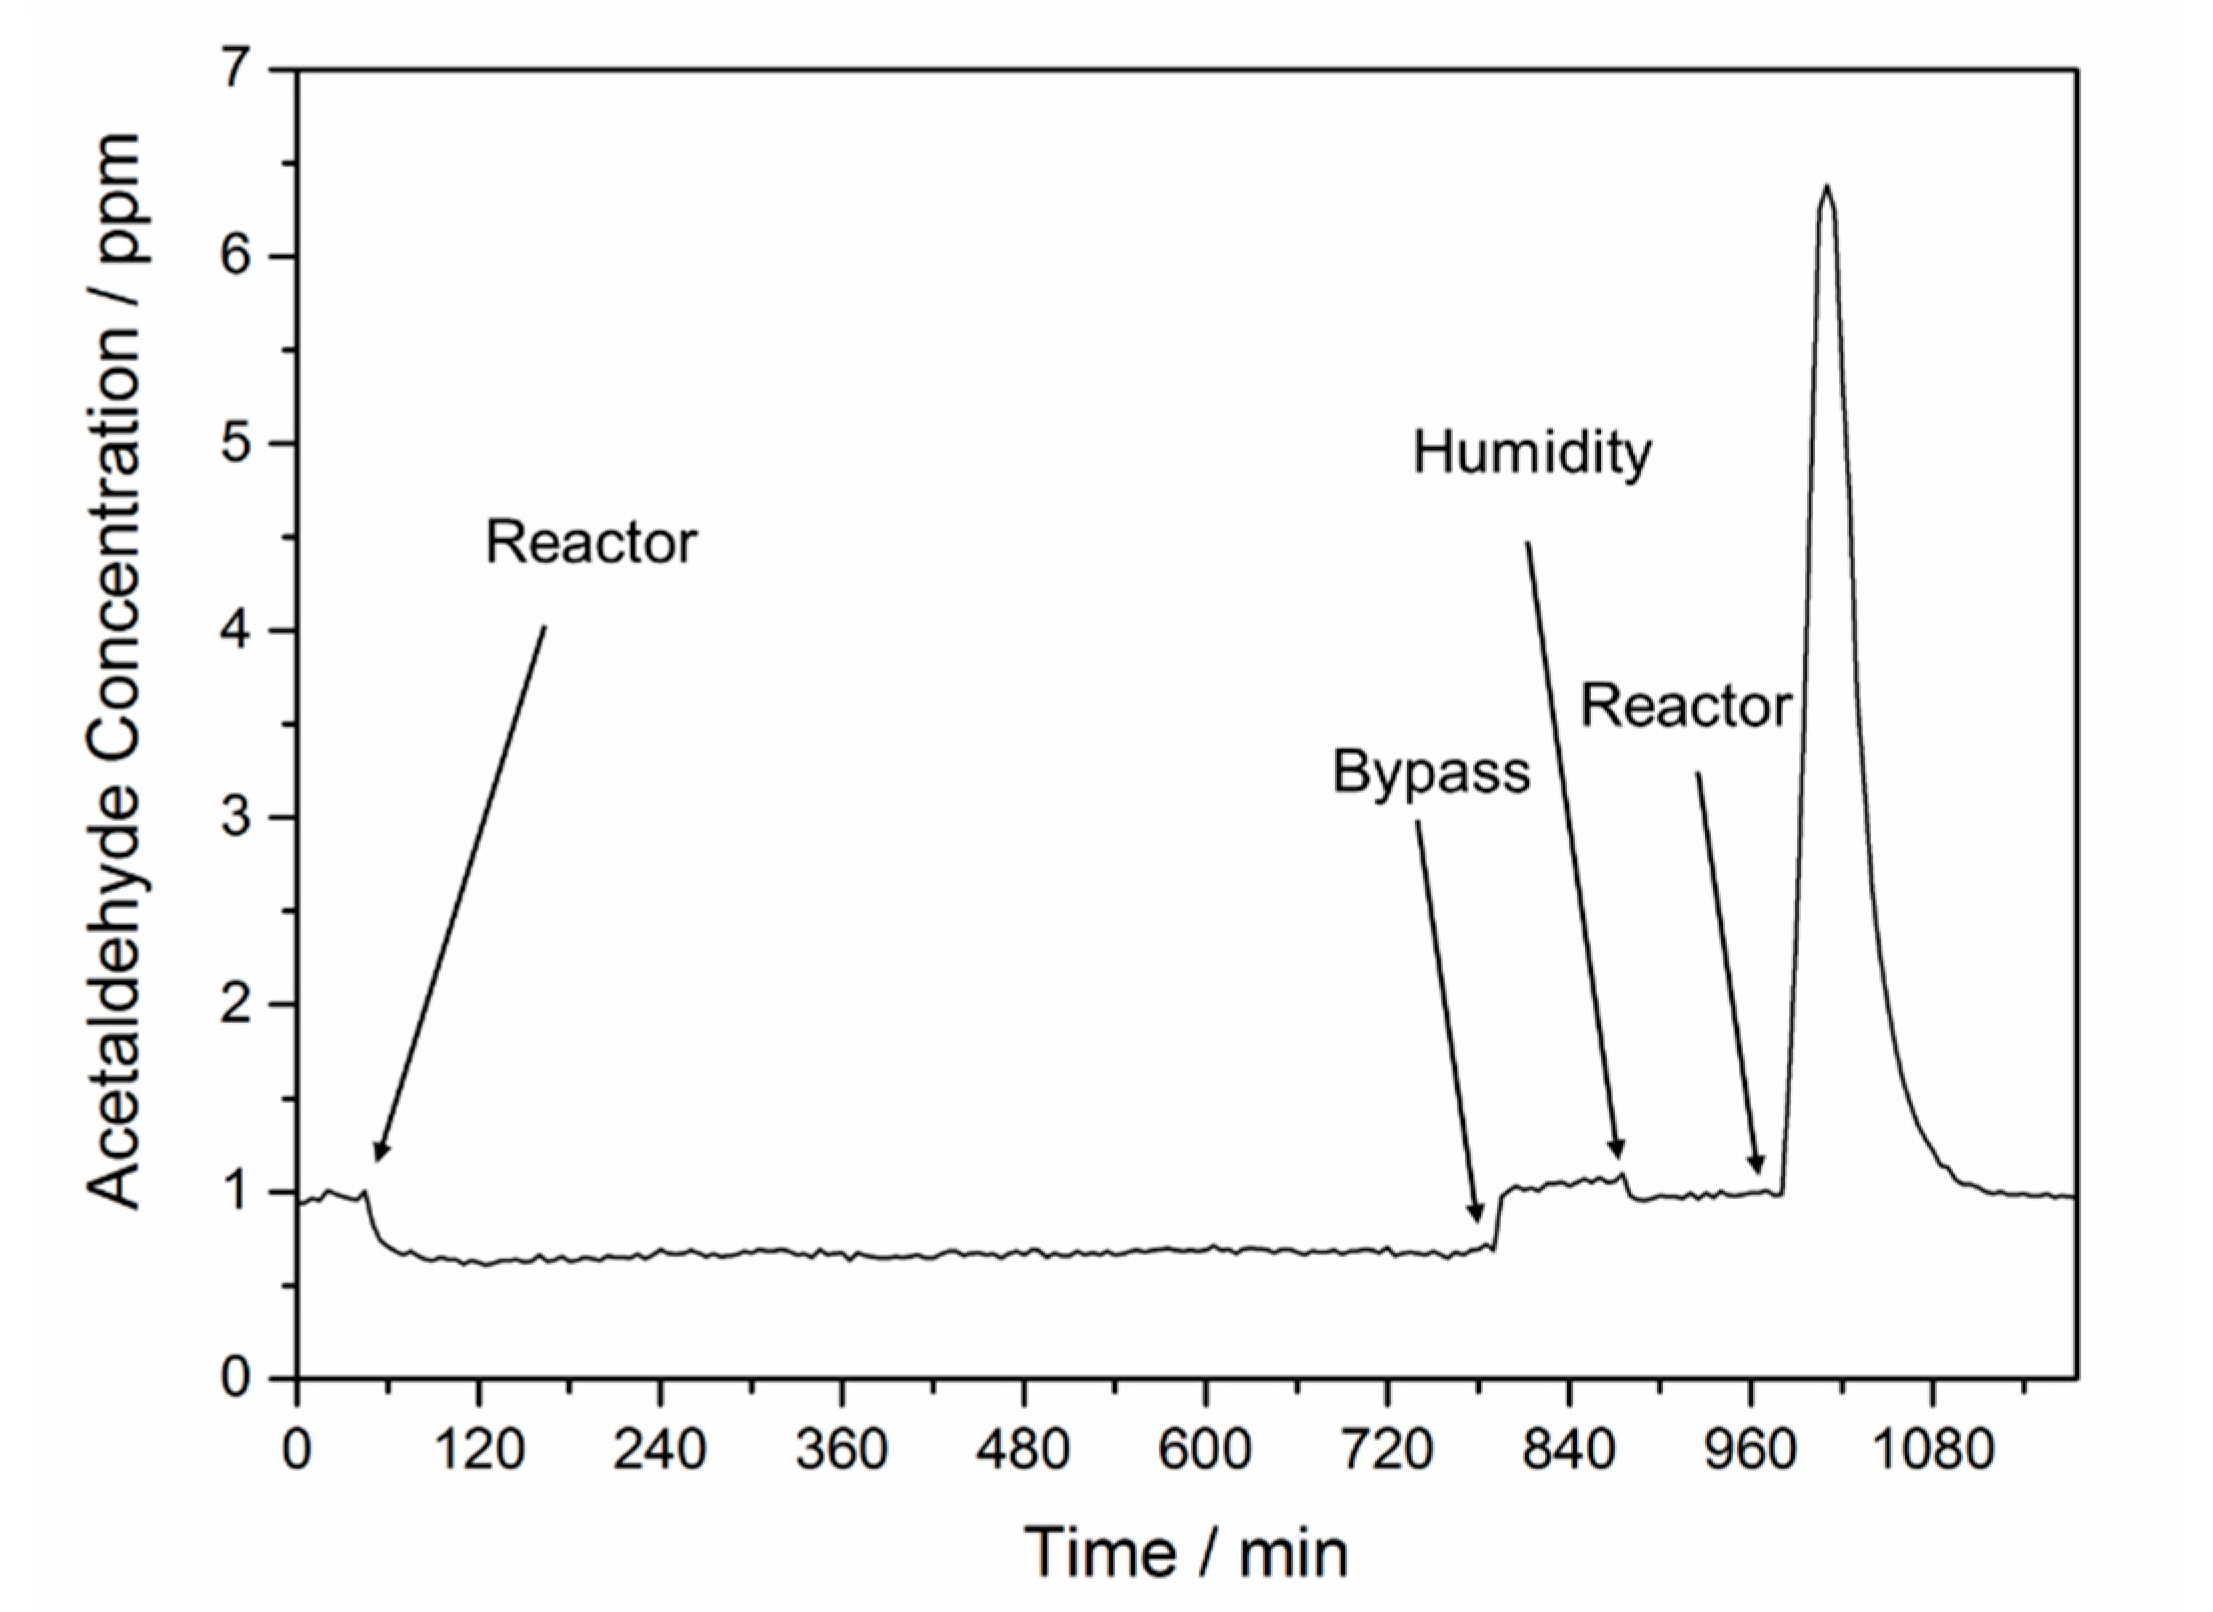
3.4. Acetaldehyde Degradation

The experimental set-up to monitor the concentration of acetaldehyde, as a function of time, is illustrated in Figure S8. UV-100 was treated with 1 ppm acetaldehyde, in O2 and in the N2 atmosphere. The gas flow was set to 1 L min−1 and was controlled by mass flow controllers (Brooks Instruments, Hatfield, PA, USA). For experiments under 50% humidity, air was directed through a washing flask. After passing the reactor, which was made of PMMA, the gas was analyzed, every 5 min, by a gas chromatograph equipped with a photoionization detector (GC/PID, SYNTECH Spectras GC 955, Groningen, Netherlands). The concentration of acetaldehyde was monitored for 2.5 h, in the dark, and for 6 h, upon UV illumination. The light source used was a Philips CLEO compact fluorescent tube and had an emission wavelength of λmax = 365 nm and an intensity of 1 mW cm−2.

3.5. Mass Spectrometry

The experimental set-up for the detection of gaseous products is illustrated in Figure S9. Herein, a UV-100 film, placed in a reactor made of PMMA, was treated with 50 ppm of acetaldehyde in N2, for 2 h, in the dark, and for 6 h, upon UV illumination. The gas flow was set to 75 mL min−1 (SIERRA®, Monterey, CA, USA) and was constantly analyzed by a mass spectrometer at the outlet (Hiden HPR-20, Warrington, United Kingdom). An LED lamp (Flächenstrahler, Omicron-Laserage, Rodgau-Dudenhofen, Germany) with an intensity of 1 mW cm−2 was used as the UV illumination source.

4. Conclusions

In this study, the effect of O2 and H2O on the adsorption and the photocatalytic degradation of acetaldehyde, in the presence of TiO2, were investigated at ambient temperatures. In the dark, the adsorption of acetaldehyde and the formation of crotonaldehyde were detected, both in O2 and in the N2 atmosphere, by ATR-FTIR spectroscopy. On the anatase surface, crotonaldehyde was formed by an aldol condensation of two acetaldehyde molecules. When using a continuous acetaldehyde gas flow, the concentration of acetaldehyde was constantly lowered, after passing the TiO2 film, because the generated crotonaldehyde was desorbed from the surface and was replaced by new acetaldehyde molecules reacting again with each other, to form crotonaldehyde. When using a humidified acetaldehyde gas flow, such a constantly lowered concentration was not observed. Under these conditions, the formation of crotonaldehyde was limited, because water was more favorably adsorbed on the anatase surface, as compared to acetaldehyde. Therefore, the possibility of the two acetaldehyde molecules reacting with each other to form crotonaldehyde on the anatase surface was significantly decreased.
Upon UV illumination both, acetaldehyde and crotonaldehyde were degraded. At the beginning of the illumination time, the results under the O2 and the N2 atmosphere showed similar trends. Both acetate and formate were detected on the surface. It was proposed that adsorbed O2 was consumed for the decomposition of acetaldehyde to form acetate and formate, in the N2 atmosphere. After 1 h of illumination, a depletion of O2 occurred and the rate of formate formation decreased. Acetate was not decomposed to formate, anymore, but accumulated on the TiO2 surface, instead. Thus, the concentration of acetaldehyde in the gas phase increased, because acetaldehyde was incompletely degraded, in the absence of a sufficient amount of O2. It was proposed that the lattice oxygen atoms from the TiO2 matrix were consumed for the formation of acetate, in the presence of N2. In the presence of O2 the concentration of acetaldehyde was constantly low, since O2 was present in high concentrations, and therefore acetaldehyde was readily decomposed to acetate and formate, as was detected by ATR-FTIR.

Supplementary Materials

The following are available online at https://www.mdpi.com/2073-4344/8/10/417/s1, Figure S1: Acetaldehyde concentration as a function of time in the O2 atmosphere in the dark. Figure S2: Time evolution of the QMS signal of the mass 41 m/z corresponding to crotonaldehyde. Figure S3: Comparison between the acetaldehyde concentration as a function of time in O2 (left) and in N2 (right) atmosphere in the dark. Figure S4: ATR-FTIR spectra recorded during gaseous treatment of acetaldehyde over an anatase film in O2 (left) and N2 (right) atmosphere for two hours in the dark. Figure S5: QMS signal as a function of the time of the masses 16 m/z and 44 m/z corresponding to CH4 and CO2. Figure S6: XRD pattern of UV-100. Figure S7: Experimental setup for the ATR-FTIR measurement. Figure S8: Experimental set up to monitor the concentration of acetaldehyde as a function of time. Figure S9: Experimental set up for the detection of gaseous products generated during acetaldehyde treatment of a UV-100 film in the dark and upon UV illumination.

Author Contributions

S.M. performed experiments; S.M. and J.S. wrote the manuscript; scientific support: A.V.E. and D.W.B.; Supervision: D.W.B.

Funding

This work was funded by the German Federal Ministry of Education and Research (contract No. 13N13350, PureBau—Untersuchung von Werkstoffsystemen für photokatalytisch hocheffiziente Baustoffe-Teilvorhaben: Oberflächenchemie der Photokatalysatoren und der Werkstoffe). A.V.E. and D.W.B. acknowledge the support by a Mega-grant of the Government of the Russian Federation within the Project “Establishment of the Laboratory ‘Photoactive Nanocomposite Materials’” No. 14Z50.31.0016. The publication of this article was funded by the Open Access fund of Leibniz Universität Hannover.

Acknowledgments

The authors wish to thank Sachtleben Chemie GmbH for providing the TiO2 material and Luis Granone for the XRD analysis.

Conflicts of Interest

The authors declare no conflict of interest.

References

  1. Altshuller, A.P. Production of aldehydes as primary emissions and from secondary atmospheric reactions of alkenes and alkanes during the night and early morning hours. Atmos. Environ. Part A Gen. Top. 1993, 27, 21–32. [Google Scholar] [CrossRef]
  2. European Agency for Safety and Health at Work. European Risk Observatory Report. Exploratory Survey of Occupational Exposure Limits for Carcinogens, Mutagens and Reprotoxic substances at EU Member States Level. 2009. Available online: https://osha.europa.eu/en/publications/reports/548OELs/view (accessed on 1 July 2017).
  3. Occupational Safety and Health Administration (OSHA). Permissible Exposure Limits, Occupational Safety and Health Administration; OSHA: Washington, DC, USA, 2005. [Google Scholar]
  4. Sopyan, I.; Watanabe, M.; Murasawa, S.; Hashimoto, K.; Fujishima, A. An efficient TiO2 thin-film photocatalyst: Photocatalytic properties in gas-phase acetaldehyde degradation. J. Photochem. Photobiol. A Chem. 1996, 98, 79–86. [Google Scholar] [CrossRef]
  5. Atitar, M.F.; Belhadj, H.; Dillert, R.; Bahnemann, D.W. The Relevance of ATR-FTIR Spectroscopy in Semiconductor Photocatalysis. In Emerging Pollutants in the Environment—Current and Further Implications; Larramendy, M.L., Ed.; InTech: London, UK, 2015; pp. 203–229. [Google Scholar]
  6. Mendive, C.B.; Bredow, T.; Blesa, M.A.; Bahnemann, D.W. ATR-FTIR measurements and quantum chemical calculations concerning the adsorption and photoreaction of oxalic acid on TiO2. Phys. Chem. Chem. Phys. 2006, 8, 3232–3247. [Google Scholar] [CrossRef] [PubMed]
  7. Idriss, H.; Barteau, M.A. Selectivity and mechanism shifts in the reactions of acetaldehyde on oxidized and reduced TiO2(001) surfaces. Catal. Lett. 1996, 40, 147–153. [Google Scholar] [CrossRef]
  8. Singh, M.; Zhou, N.; Paul, D.K.; Klabunde, K.J. IR spectral evidence of aldol condensation: Acetaldehyde adsorption over TiO2 surface. J. Catal. 2008, 260, 371–379. [Google Scholar] [CrossRef]
  9. Hauchecorne, B.; Terrens, D.; Verbruggen, S.; Martens, J.A.; Van Langenhove, H.; Demeestere, K.; Lenaerts, S. Elucidating the photocatalytic degradation pathway of acetaldehyde: An FTIR in situ study under atmospheric conditions. Appl. Catal. B Environ. 2011, 106, 630–638. [Google Scholar] [CrossRef]
  10. Batault, F.; Thevenet, F.; Hequet, V.; Rillard, C.; Le Coq, L.; Locoge, N. Acetaldehyde and acetic acid adsorption on TiO2 under dry and humid conditions. Chem. Eng. J. 2015, 264, 197–210. [Google Scholar] [CrossRef]
  11. Ohko, Y.; Tryk, D.A.; Hashimoto, K.; Fujishima, A. Autoxidation of Acetaldehyde Initiated by TiO2 Photocatalysis under Weak UV Illumination. J. Phys. Chem. B 1998, 102, 2699–2704. [Google Scholar] [CrossRef]
  12. Muggli, D.S.; McCue, J.T.; Falconer, J.L. Mechanism of the Photocatalytic Oxidation of Ethanol on TiO2. J. Catal. 1998, 173, 470–483. [Google Scholar] [CrossRef]
  13. von Sonntag, C. Free-Radical-Induced DNA Damage and Its Repair; Schreck, S., Ed.; Springer: Berlin/Heidelberg, Germany, 2006. [Google Scholar]
  14. Topalian, Z.; Stefanov, B.I.; Granqvist, C.G.; Österlund, L. Adsorption and photo-oxidation of acetaldehyde on TiO2 and sulfate-modified TiO2: Studies by in situ FTIR spectroscopy and micro-kinetic modeling. J. Catal. 2013, 307, 265–274. [Google Scholar] [CrossRef]
  15. Stefanov, B.I.; Topalian, Z.; Granqvist, C.G.; Österlund, L. Acetaldehyde adsorption and condensation on anatase TiO2: Influence of acetaldehyde dimerization. J. Mol. Catal. A Chem. 2014, 381, 77–88. [Google Scholar] [CrossRef]
  16. János, R.; Kiss, J. Adsorption and surface reactions of acetaldehyde on TiO2, CeO2 and Al2O3. Appl. Catal. A Gen. 2005, 287, 252–260. [Google Scholar]
  17. Rekoske, J.E.; Barteau, M.A. Competition between Acetaldehyde and Crotonaldehyde during Adsorption and Reaction on Anatase and Rutile Titanium Dioxide. Langmuir 1999, 15, 2061–2070. [Google Scholar] [CrossRef]
  18. Wu, W.-C.; Yang, S.-J.; Ho, C.-H.; Lin, Y.-S.; Liao, L.-F.; Lin, J.-L. Crotonaldehyde Formation from Decomposition of ICH2CH2OH on Powdered TiO2. J. Phys. Chem. B 2006, 110, 9627–9631. [Google Scholar] [CrossRef] [PubMed]
  19. Coronado, J.M.; Zorn, M.E.; Tejedor-Tejedor, I.; Anderson, M.A. Photocatalytic oxidation of ketones in the gas phase over TiO2 thin films: A kinetic study on the influence of water vapor. Appl. Catal. B Environ. 2003, 43, 329–344. [Google Scholar] [CrossRef]
  20. El-Maazawi, M.; Finken, A.N.; Nair, A.B.; Grassian, V.H. Adsorption and Photocatalytic Oxidation of Acetone on TiO2: An in Situ Transmission FT-IR Study. J. Catal. 2000, 191, 138–146. [Google Scholar] [CrossRef]
  21. Liao, L.-F.; Lien, C.-F.; Lin, J.-L. FTIR study of adsorption and photoreactions of acetic acid on TiO2. Phys. Chem. Chem. Phys. 2001, 3, 3831–3837. [Google Scholar] [CrossRef]
  22. Busca, G. Infrared studies of the reactive adsorption of organic molecules over metal oxides and of the mechanisms of their heterogeneously-catalyzed oxidation. Catal. Today 1996, 27, 457–496. [Google Scholar] [CrossRef]
  23. Liao, L.-F.; Wu, W.-C.; Chen, C.-Y.; Lin, J.-L. Photooxidation of Formic Acid vs Formate and Ethanol vs Ethoxy on TiO2 and Effect of Adsorbed Water on the Rates of Formate and Formic Acid Photooxidation. J. Phys. Chem. B 2001, 105, 7678–7685. [Google Scholar] [CrossRef]
  24. Backes, M.J.; Lukaski, A.C.; Muggli, D.S. Active sites and effects of H2O and temperature on the photocatalytic oxidation of 13C-acetic acid on TiO2. Appl. Catal. B Environ. 2005, 61, 21–35. [Google Scholar] [CrossRef]
  25. Belhadj, H.; Hakki, A.; Robertson, P.K.J.; Bahnemann, D.W. In situ ATR-FTIR study of H2O and D2O adsorption on TiO2 under UV irradiation. Phys. Chem. Chem. Phys. 2015, 17, 22940–22946. [Google Scholar] [CrossRef] [PubMed] [Green Version]
  26. Szanyi, J.; Kwak, J.H. Photo-catalytic oxidation of acetone on a TiO2 powder: An in situ FTIR investigation. J. Mol. Catal. A Chem. 2015, 406, 213–223. [Google Scholar] [CrossRef]
  27. Montoya, J.F.; Ivanova, I.; Dillert, R.; Bahnemann, D.W.; Salvador, P.; Peral, J. Catalytic Role of Surface Oxygens in TiO2 Photooxidation Reactions: Aqueous Benzene Photooxidation with Ti18O2 under Anaerobic Conditions. J. Phys. Chem. Lett. 2013, 4, 1415–1422. [Google Scholar] [CrossRef]
  28. Hug, S.J.; Sulzberger, B. In situ Fourier Transform Infrared Spectroscopy Evidence for the Formation of Several Different Surface Complexes of Oxalate on TiO2 in the Aqueous Phase. Langmuir 1994, 10, 3587–3597. [Google Scholar] [CrossRef]
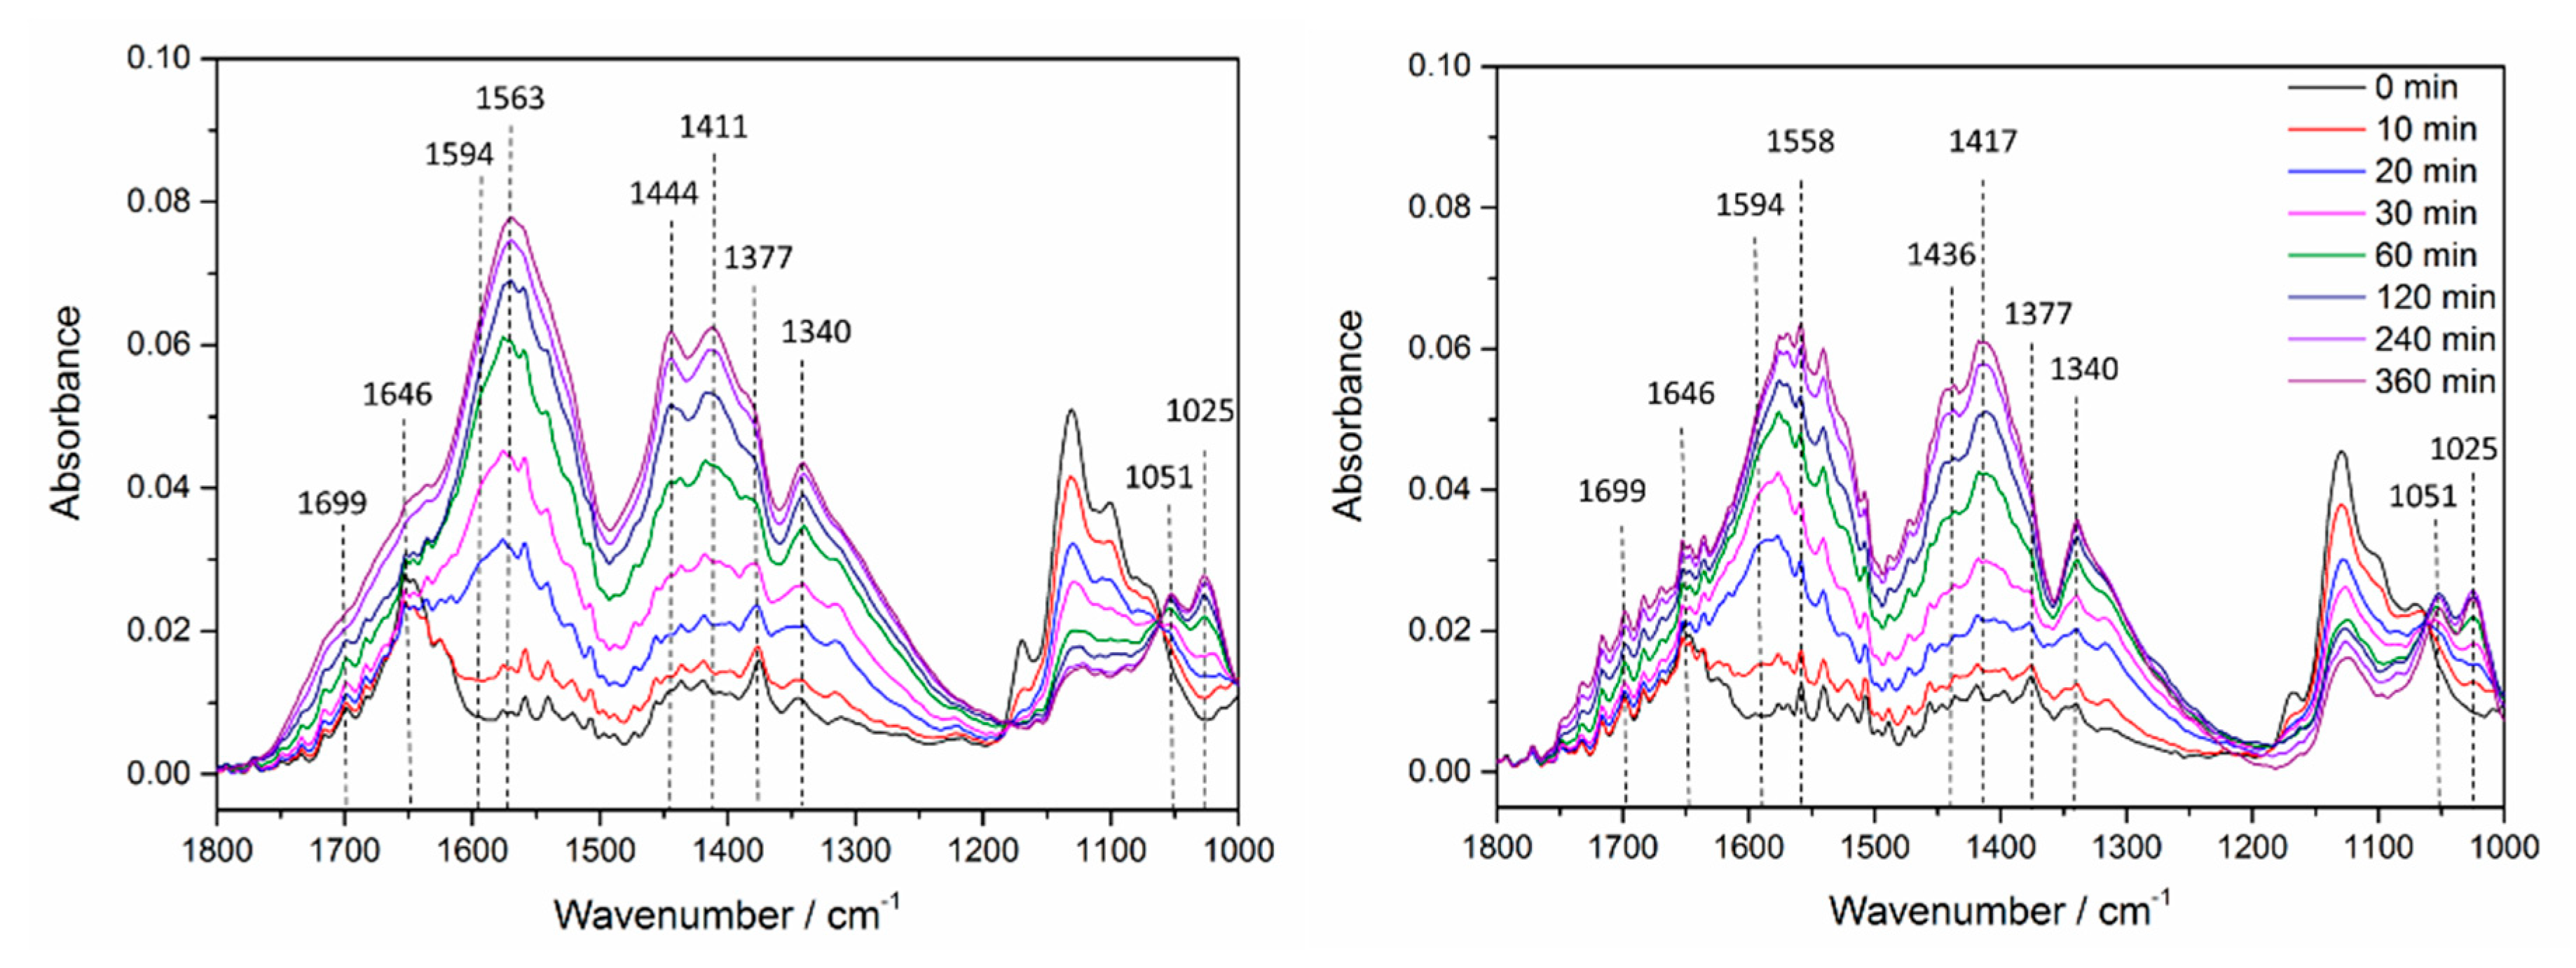
Figure 1. The proposed reaction mechanism for the photocatalytic degradation of acetaldehyde by TiO2, under weak UV illumination. First, acetaldehyde is oxidized to acetic acid, which can be transformed into CO2 and formaldehyde. Formaldehyde is then oxidized to formic acid and eventually to CO2.
Catalysts 08 00417 g001
Figure 2. The concentration of acetaldehyde as a function of time, under dry (Left) and humid (Right) conditions, in air and in the dark. During the first 60 min, the gas flow was held constant, in bypass mode. Afterward, it was directed over a TiO2 film, for 2.5 h, in the dark, before it was turned back to the bypass mode again.
Catalysts 08 00417 g002
Figure 3. ATR-FTIR spectra recorded during the gaseous treatment of acetaldehyde in air over a TiO2 film, for 2 h, under dry conditions, in the dark.
Catalysts 08 00417 g003
Figure 4. Adsorption and reaction of acetaldehyde on the anatase surface, in the dark. Acetaldehyde molecules were adsorbed on the TiO2 surface and reacted, via an aldol condensation, to the crotonaldehyde. Crotonaldehyde was desorbed from the surface and was replaced by new acetaldehyde molecules, which further reacted with each other.
Catalysts 08 00417 g004
Figure 5. The concentration of acetaldehyde as a function of time obtained in the dark. Firstly, an anatase film was treated with acetaldehyde, under dry conditions. A decrease in the concentration of acetaldehyde was observed when the gas flow was directed into the reactor. Under humidified conditions, the concentration of acetaldehyde detected at the gas outlet increased to 6 ppm, before it decreased to the initial value of 1 ppm again.
Catalysts 08 00417 g005
Figure 6. On the left side, the adsorption of acetaldehyde and crotonaldehyde is shown under dry conditions. Under humidified conditions, acetaldehyde was desorbed from the surface and was replaced by H2O molecules. Crotonaldehyde was not formed anymore, because only a minor amount of acetaldehyde was adsorbed.
Catalysts 08 00417 g006
Figure 7. ATR-FTIR spectra recorded after purging an anatase film with acetaldehyde for 2 h, under dry conditions (black). In the presence of humidity, the band’s characteristics for acetaldehyde and crotonaldehyde decreased in intensity, within 5 min, indicating a desorption of both molecules (red).
Catalysts 08 00417 g007
Figure 8. Acetaldehyde concentration as a function of time upon UV illumination in O2 (left) and N2 (right) atmosphere.
Catalysts 08 00417 g008
Figure 9. ATR-FTIR spectra of a TiO2 film recorded during gaseous treatment of acetaldehyde in O2 (left) and N2 (right) atmosphere, upon UV-illumination, for 6 h.
Catalysts 08 00417 g009
Figure 10. Schematic illustration of the different intermediates formed from acetaldehyde on the anatase surface, and in the gas phase in the O2 and the N2 atmosphere, observed by ATR-FTIR and MS.
Catalysts 08 00417 g010
Figure 11. Proposed reaction mechanism of the acetaldehyde reaction with bridging-oxygen atoms to form acetate, in the absence of O2.
Catalysts 08 00417 g011
Table 1. Vibrational frequencies and mode assignments of the observed FTIR bands (cm−1) during purging of acetaldehyde in air, over a TiO2 film in the dark.
Position/cm−1Assignment [8,17,18]
1072ρ(CH3) Ti-O=CHCH3
1100ρ(CH3) Ti-O=CH(CH)2CH3
1128ν(C-C) Ti-O=CHCH3
1166ν(C-C) Ti-O=CH(CH)2CH3
1346δ(CH3) Ti-O=CHCH3
1374δ(CH) Ti-O=CHCH3
1437δ(CH3) Ti-O=CH(CH)2CH3
1626ν(C=C) Ti-O=CH(CH)2CH3
1650ν(C=O) Ti-O=CH(CH)2CH3
1699ν(C=O) Ti-O=CHCH3
Table 2. Vibrational frequencies and mode assignments of the observed FTIR bands (cm−1) during the acetaldehyde treatment of an anatase film, upon UV illumination.
Position/cm−1Assignment [21,22,23,24,25]
1025ρ(CH3) CH3COO
1051ν(C-C) CH3COO
1340νs(COO) HCOO
1377ν(C-H) HCOO
1411/1417δ(CH3) CH3COO
1436/1444νs(COO) CH3COO
1558/1563νas(COO) CH3COO
1594νas(COO) HCOO
1646δ(H2O)
1699ν(C=O) CH3COOH

