Article

Improved CO Oxidation Activity of 3DOM Pr-Doped Ceria Catalysts: Something Other Than an Ordered Macroporous Structure

by
Arantxa Davó-Quiñonero
1,
Jorge González-Mira
1,
Ion Such-Basañez
2,
Jerónimo Juan-Juan
2,
Dolores Lozano-Castelló
1 and
Agustín Bueno-López
1,*
1
Department of Inorganic Chemistry, University of Alicante, Carretera de San Vicente s/n, E03080 Alicante, Spain
2
Technical Research Services (SSTTI), University of Alicante, Carretera de San Vicente s/n, E03080 Alicante, Spain
*
Author to whom correspondence should be addressed.
Catalysts 2017, 7(2), 67; https://doi.org/10.3390/catal7020067
Submission received: 10 January 2017 / Revised: 10 February 2017 / Accepted: 11 February 2017 / Published: 17 February 2017
(This article belongs to the Special Issue Ceria-based Catalysts)

Abstract

:
It is demonstrated that the synthesis procedure for preparing three-dimensionally ordered macroporous (3DOM) Pr-doped ceria catalysts using a polymethylmethacrylate (PMMA) template not only affects the porous structure, but also the chemistry of the ceria surface. The PMMA template does not affect the crystalline features (type of phases, crystallite size, and cell parameter) of Pr-doped ceria, Ce and Pr location into the particles, and the bulk reduction of the Ce-Pr mixed oxide catalysts. On the contrary, the utilization of the PMMA template improves both the porosity and surface redox properties. 3DOM Ce-Pr mixed oxide catalysts combine micro, meso, and macropores, the most area being in the macropore range, while a reference unshaped catalyst presents poor porosity in all ranges. However, the catalyzed CO oxidation rates do not correlate with the surface area of the catalysts (neither micro nor meso/macro). The Ce-Pr-3DOM catalyst also presents improved surface reducibility with regards to the counterpart reference material prepared without the template, and improved redox behavior under reaction conditions; that is, it has a higher area and this area is reduced and reoxidized more easily. X-ray photoelectron spectroscopy analysis evidences that this is mainly attributed to praseodymium cations, which accomplish redox cycles more easily than cerium cations.

1. Introduction

Three-dimensionally ordered macroporous (3DOM) solids have been successfully developed in the last few years for a number of catalytic applications. Ceria-based 3DOM catalysts have demonstrated improved diesel soot combustion activity with regards to disordered counterparts, and this improvement has been attributed to the enhanced solid-solid contact between the soot and catalyst particles [1,2,3,4,5]. The same argument has been appealed to explain, for instance, the high soot combustion activity of 3DOM cobalt-based perovskites [6].
3DOM CuO-CeO2 catalysts have been also successfully used for the preferential oxidation of CO in the presence of H2 for fuel cell applications, and it has been suggested that the ordered macropores favor mass transfer [7]. Au/3DOM-CeO2 has shown better catalytic performance for formaldehyde oxidation than similar unshaped catalysts, and this improvement was attributed to the good Au dispersion and higher Au loading content [8].
All these examples evidence that the macroporous structure of 3DOM solids benefits the catalytic performance due to improvements related to this particular morphology, but little is known about the effect of the 3DOM synthesis procedure on the chemical features and behavior of the 3DOM ceria surfaces. For instance, Ji et al. [9] suggested that the improved catalytic activity of Co- and Fe-based 3DOM catalysts for toluene oxidation with regards to bulk catalysts could be related to the presence of a higher concentration of adsorbed oxygen species and better low-temperature reducibility, and the same argument has been used by Si et al. [10] to explain the high toluene oxidation capacity of 3DOM MnO2/LaMnO3 catalysts.
It is well known that the surface properties of pure and ceria-based mixed oxides play a key role in their catalytic performance. These properties include the crystal size (or surface/bulk ratio), cation distribution in the surface and bulk, surface reducibility, surface oxygen mobility and oxygen mobility from the bulk to surface and vice-versa, surface species (such as hydroxyls, superoxides, or peroxides), and so on [11,12].
The goal of the current study is to demonstrate that the synthesis procedure followed to obtain 3DOM ceria catalysts not only affects the porous structure of the solids, but also the chemistry of the 3DOM ceria surfaces. As a proof of concept, Pr-doped ceria catalysts have been prepared with 3DOM and an uncontrolled structure, and CO oxidation in excess oxygen has been used as a test reaction.

2. Results and Discussion

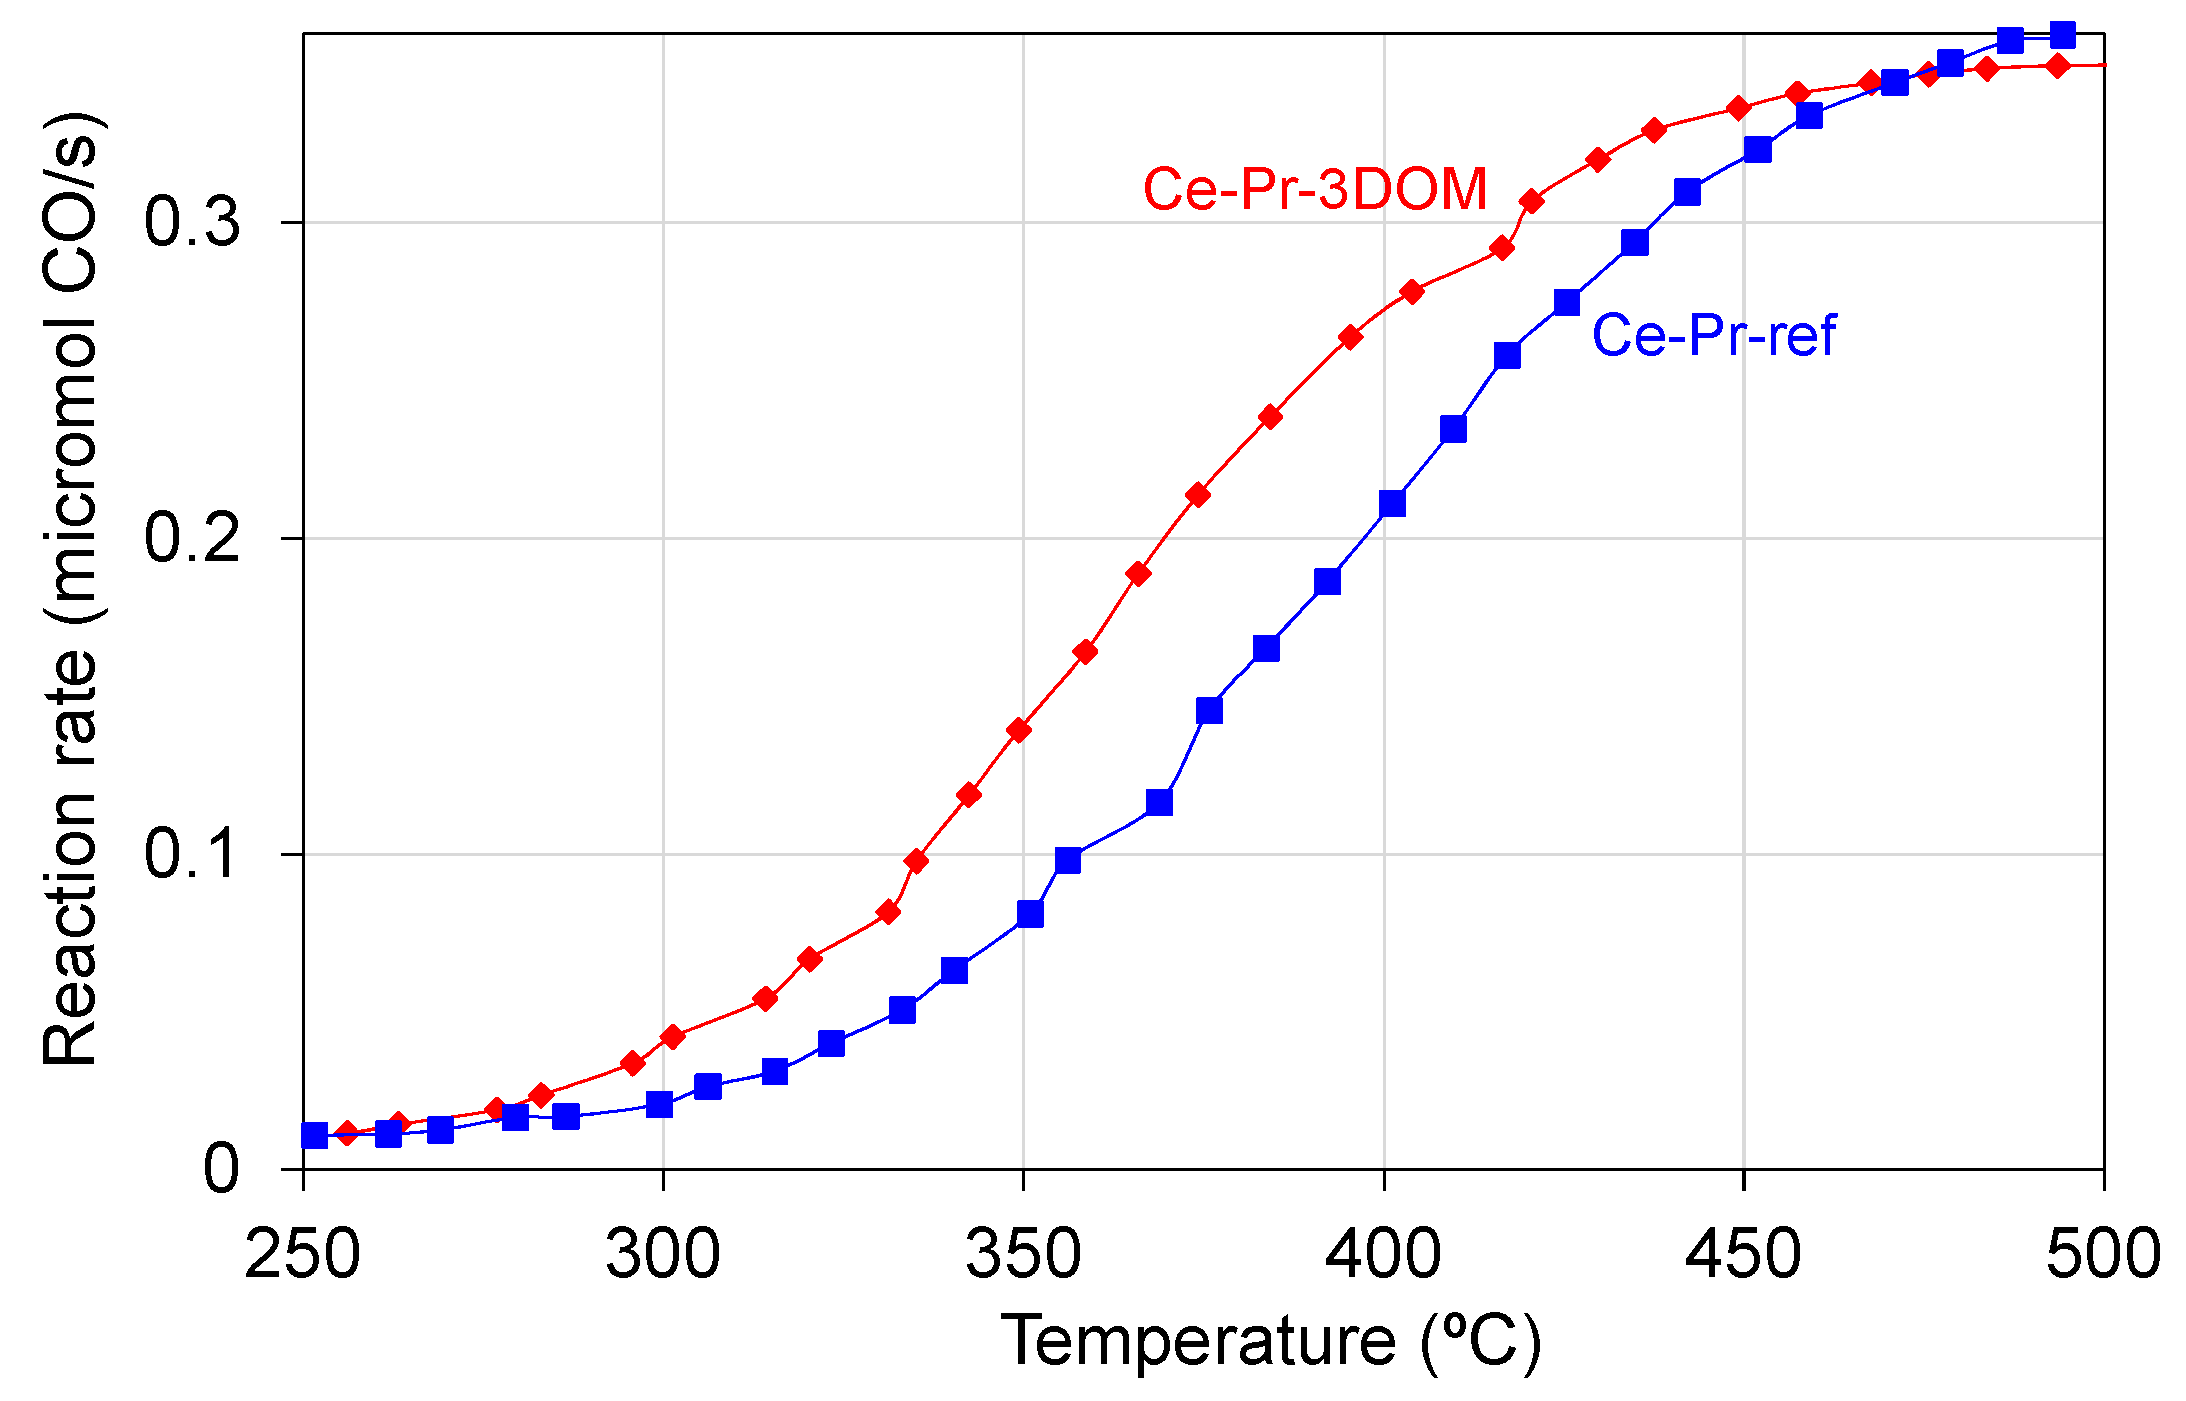
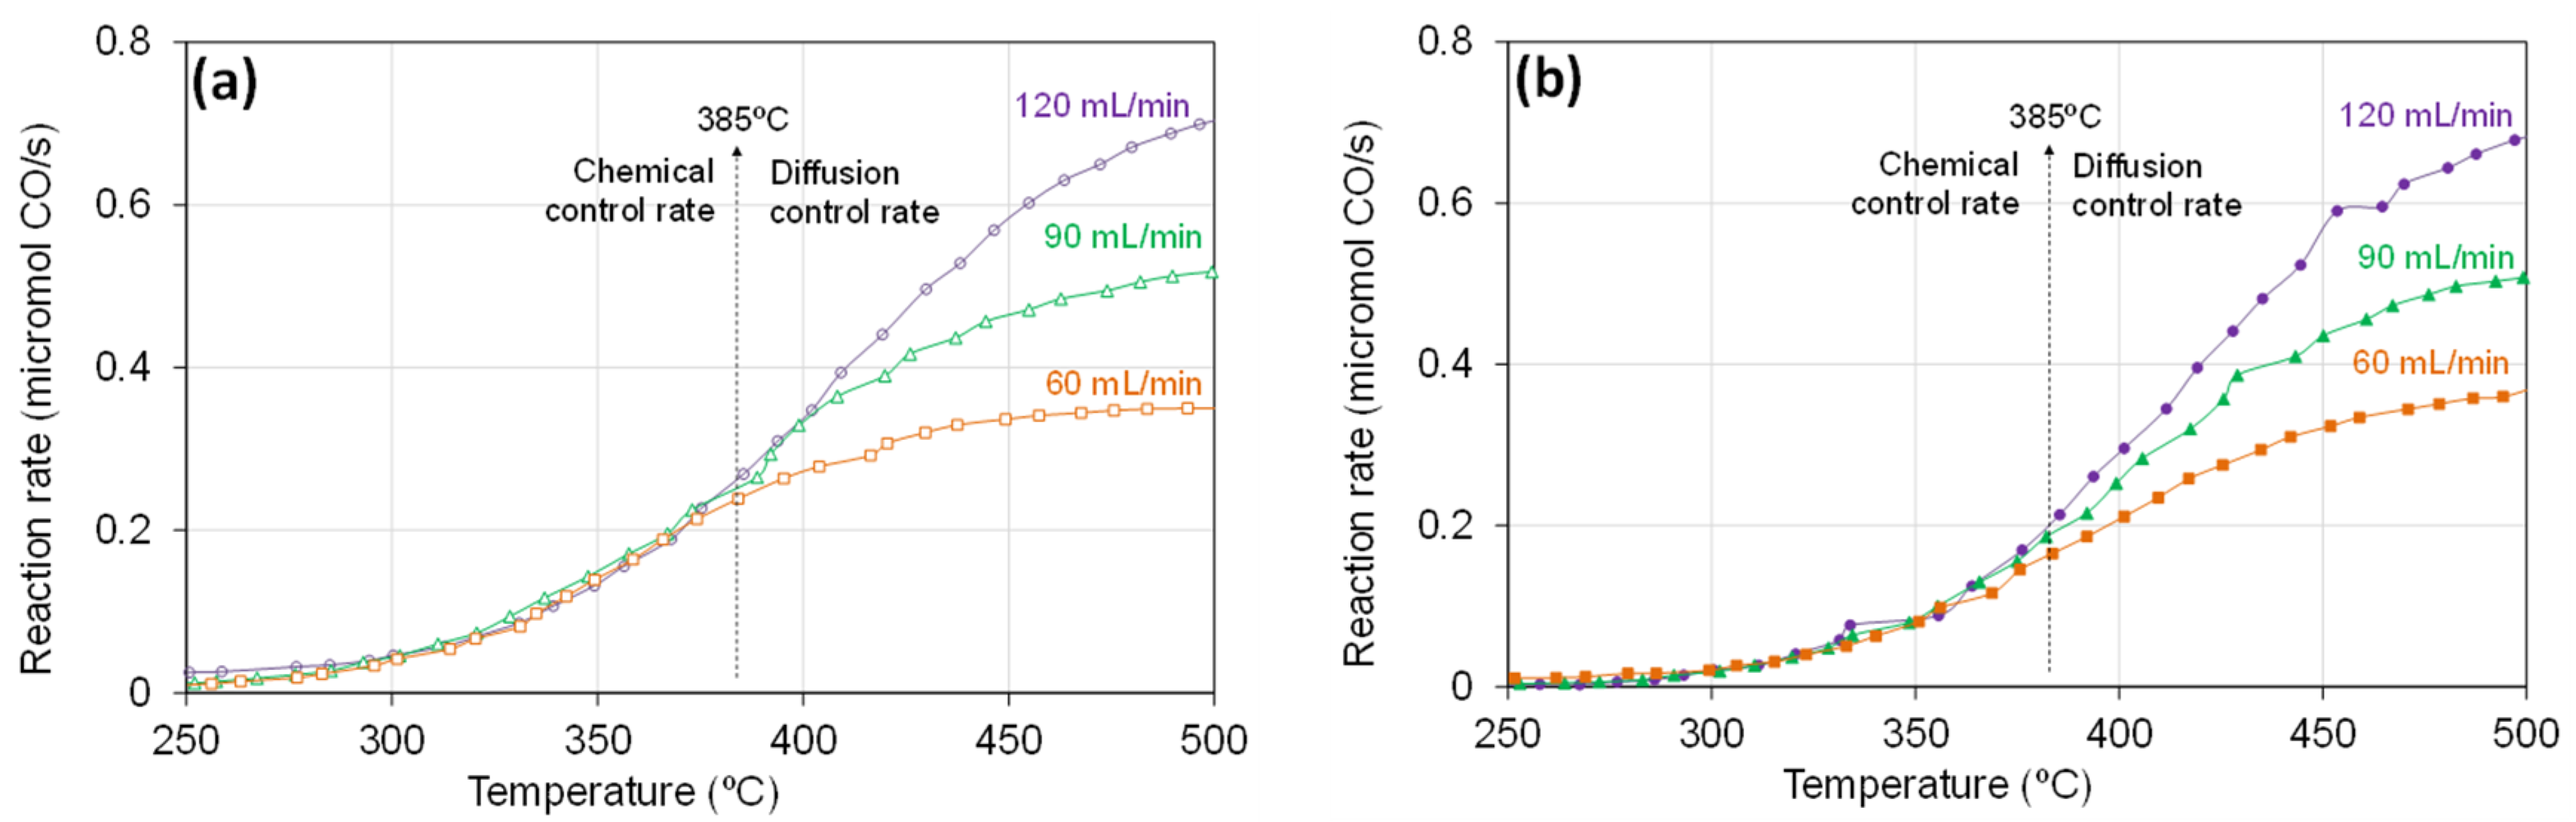
2.1. Catalytic Oxidation of CO

Two catalysts with the nominal composition Ce0.9Pr0.1O2 have been prepared, which are referred to as Ce-Pr-3DOM and Ce-Pr-ref. The former has a three dimensionally ordered macroporous (3DOM) structure while the latter is a reference material of similar composition but synthetized without control of the structure. Figure 1 shows the CO oxidation rates for the catalytic experiments performed with a total flow of 60 mL/min. The catalytic activity of the macroporous mixed oxide Ce-Pr-3DOM is higher to that of the reference counterpart (Ce-Pr-ref), with an onset CO oxidation temperature of 275 °C and higher oxidation rates at all temperatures. The mass balances of carbon and oxygen were properly closed for both catalysts, supporting that the steady-state was achieved at each temperature. These experiments were repeated three times with the same parcel of each catalyst, confirming their stability under the experimental conditions (these results are not included for the sake of brevity).
Similar experiments to those shown in Figure 1 were performed for different total gas flows, keeping the CO and O2 concentrations constant in the inlet gas and the mass of the catalyst. The CO oxidation rates obtained are included in Figure 2a,b for Ce-Pr-3DOM and Ce-Pr-ref, respectively, and are in agreement with the results in Figure 1; Figure 2 confirms that the catalytic activity of Ce-Pr-3DOM is higher to that of Ce-Pr-ref for all the total gas flows screened.
The results in Figure 2 also show that the reaction rate does not depend on the total gas flow for temperatures lower than 385 °C, which means that the reaction takes place under chemical control of the rate. On the contrary, above 385 °C, the CO oxidation rate depends on the total gas flow (the higher the flow, the higher the rate), and it is concluded that the reaction behaves under diffusion control of the rate. This threshold temperature (385 °C) is the same for both catalysts, which suggests that differences in the porous structure of the mixed oxides does not significantly affect the rate control regime for these particular catalysts.

2.2. Catalyst Characterization

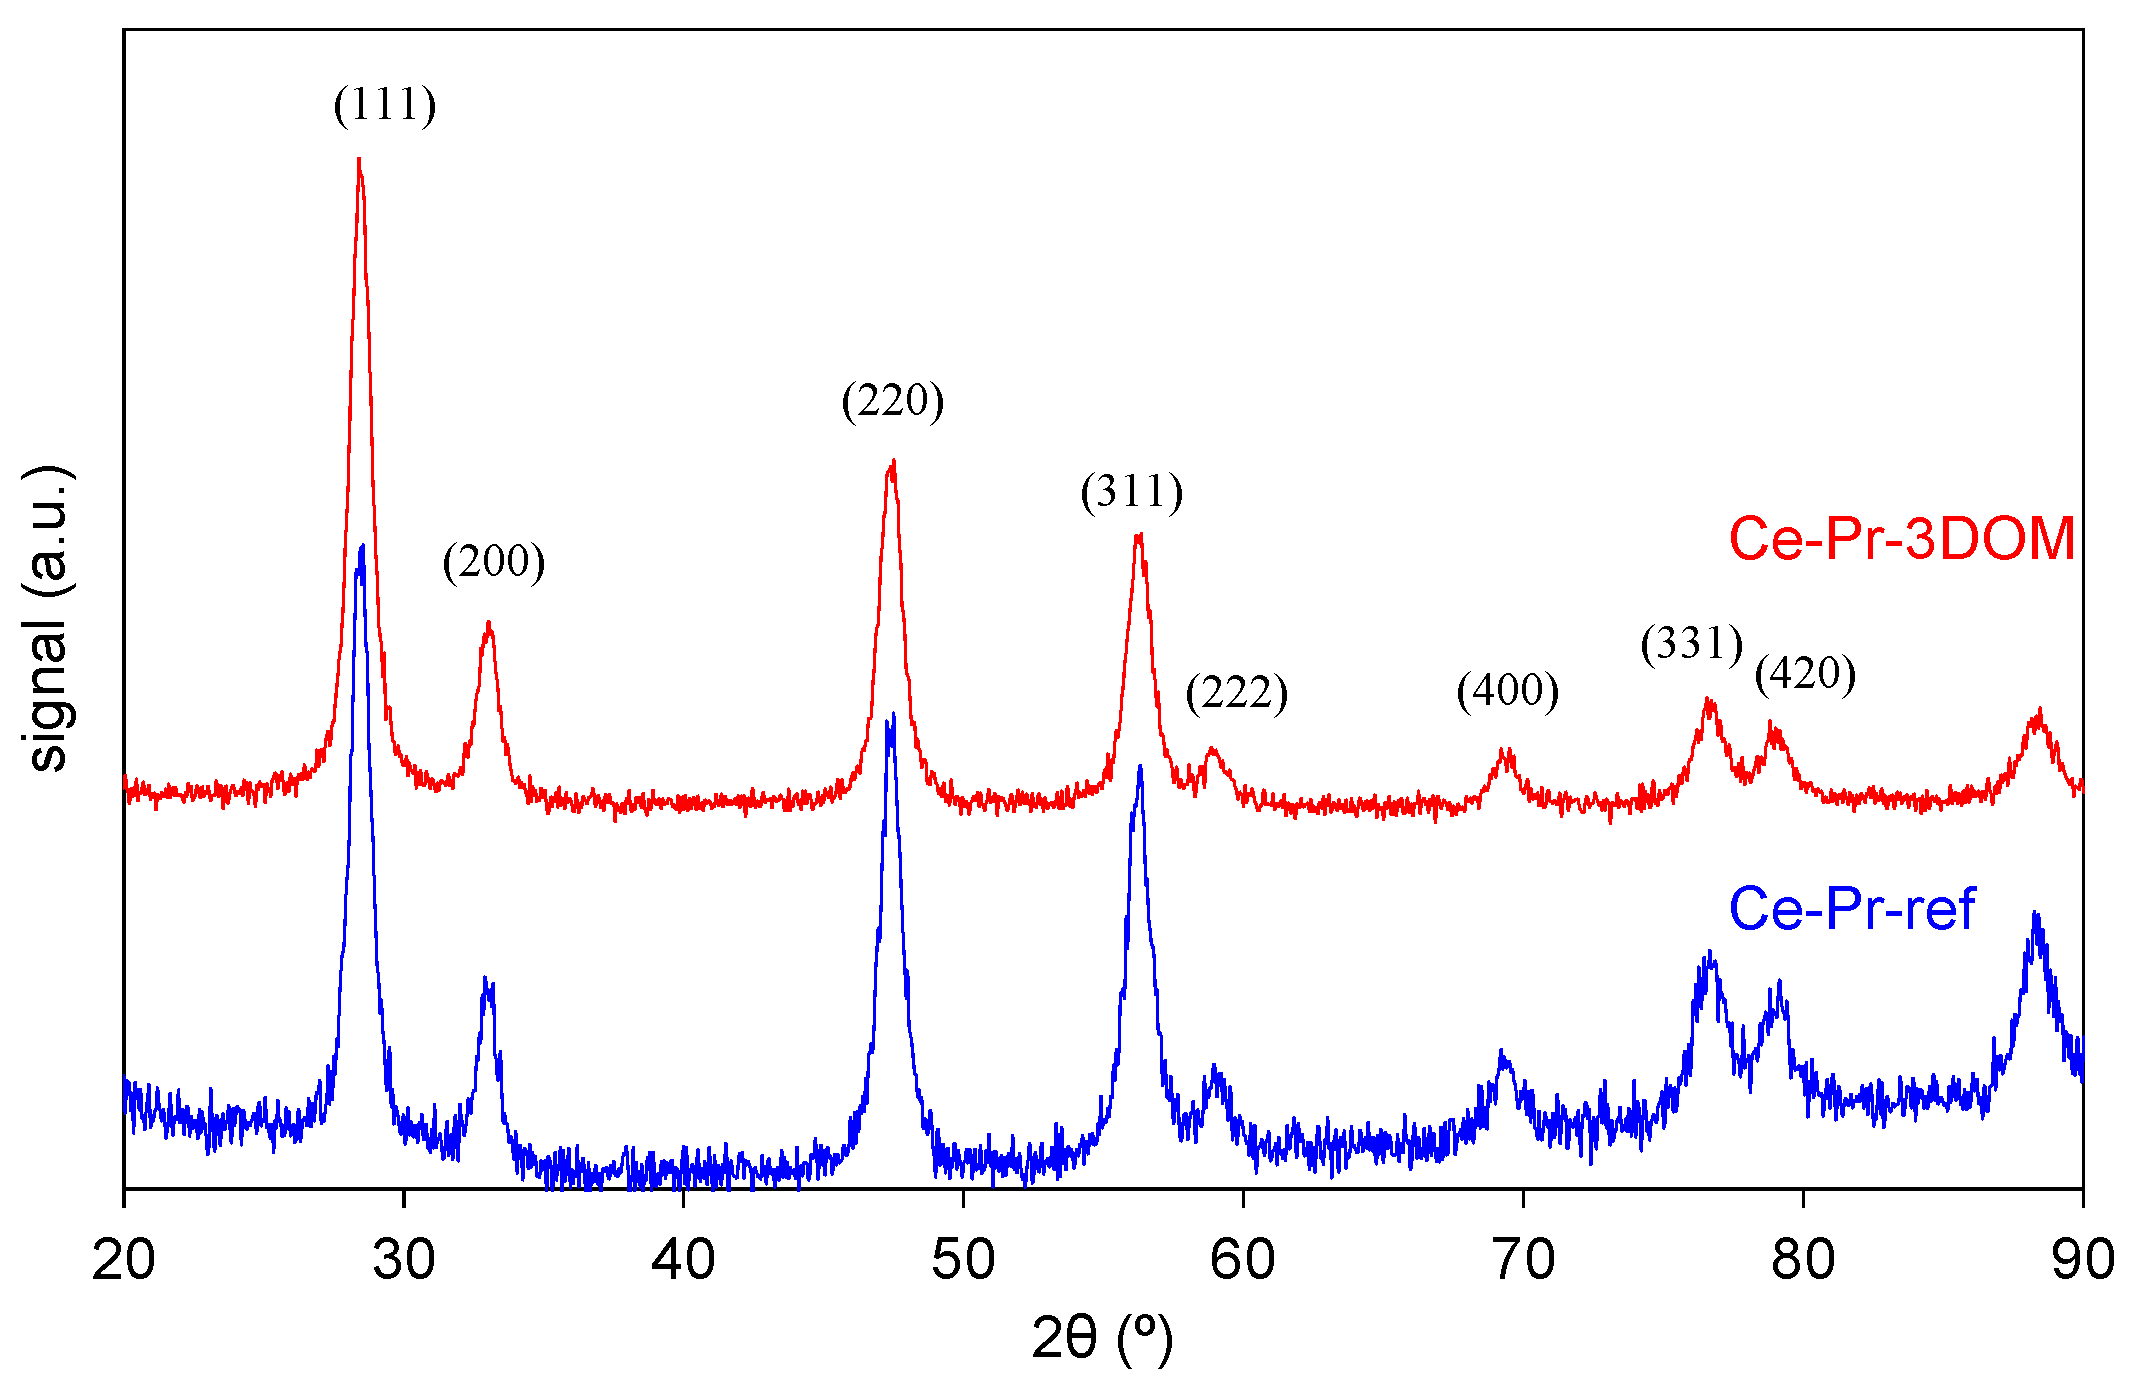
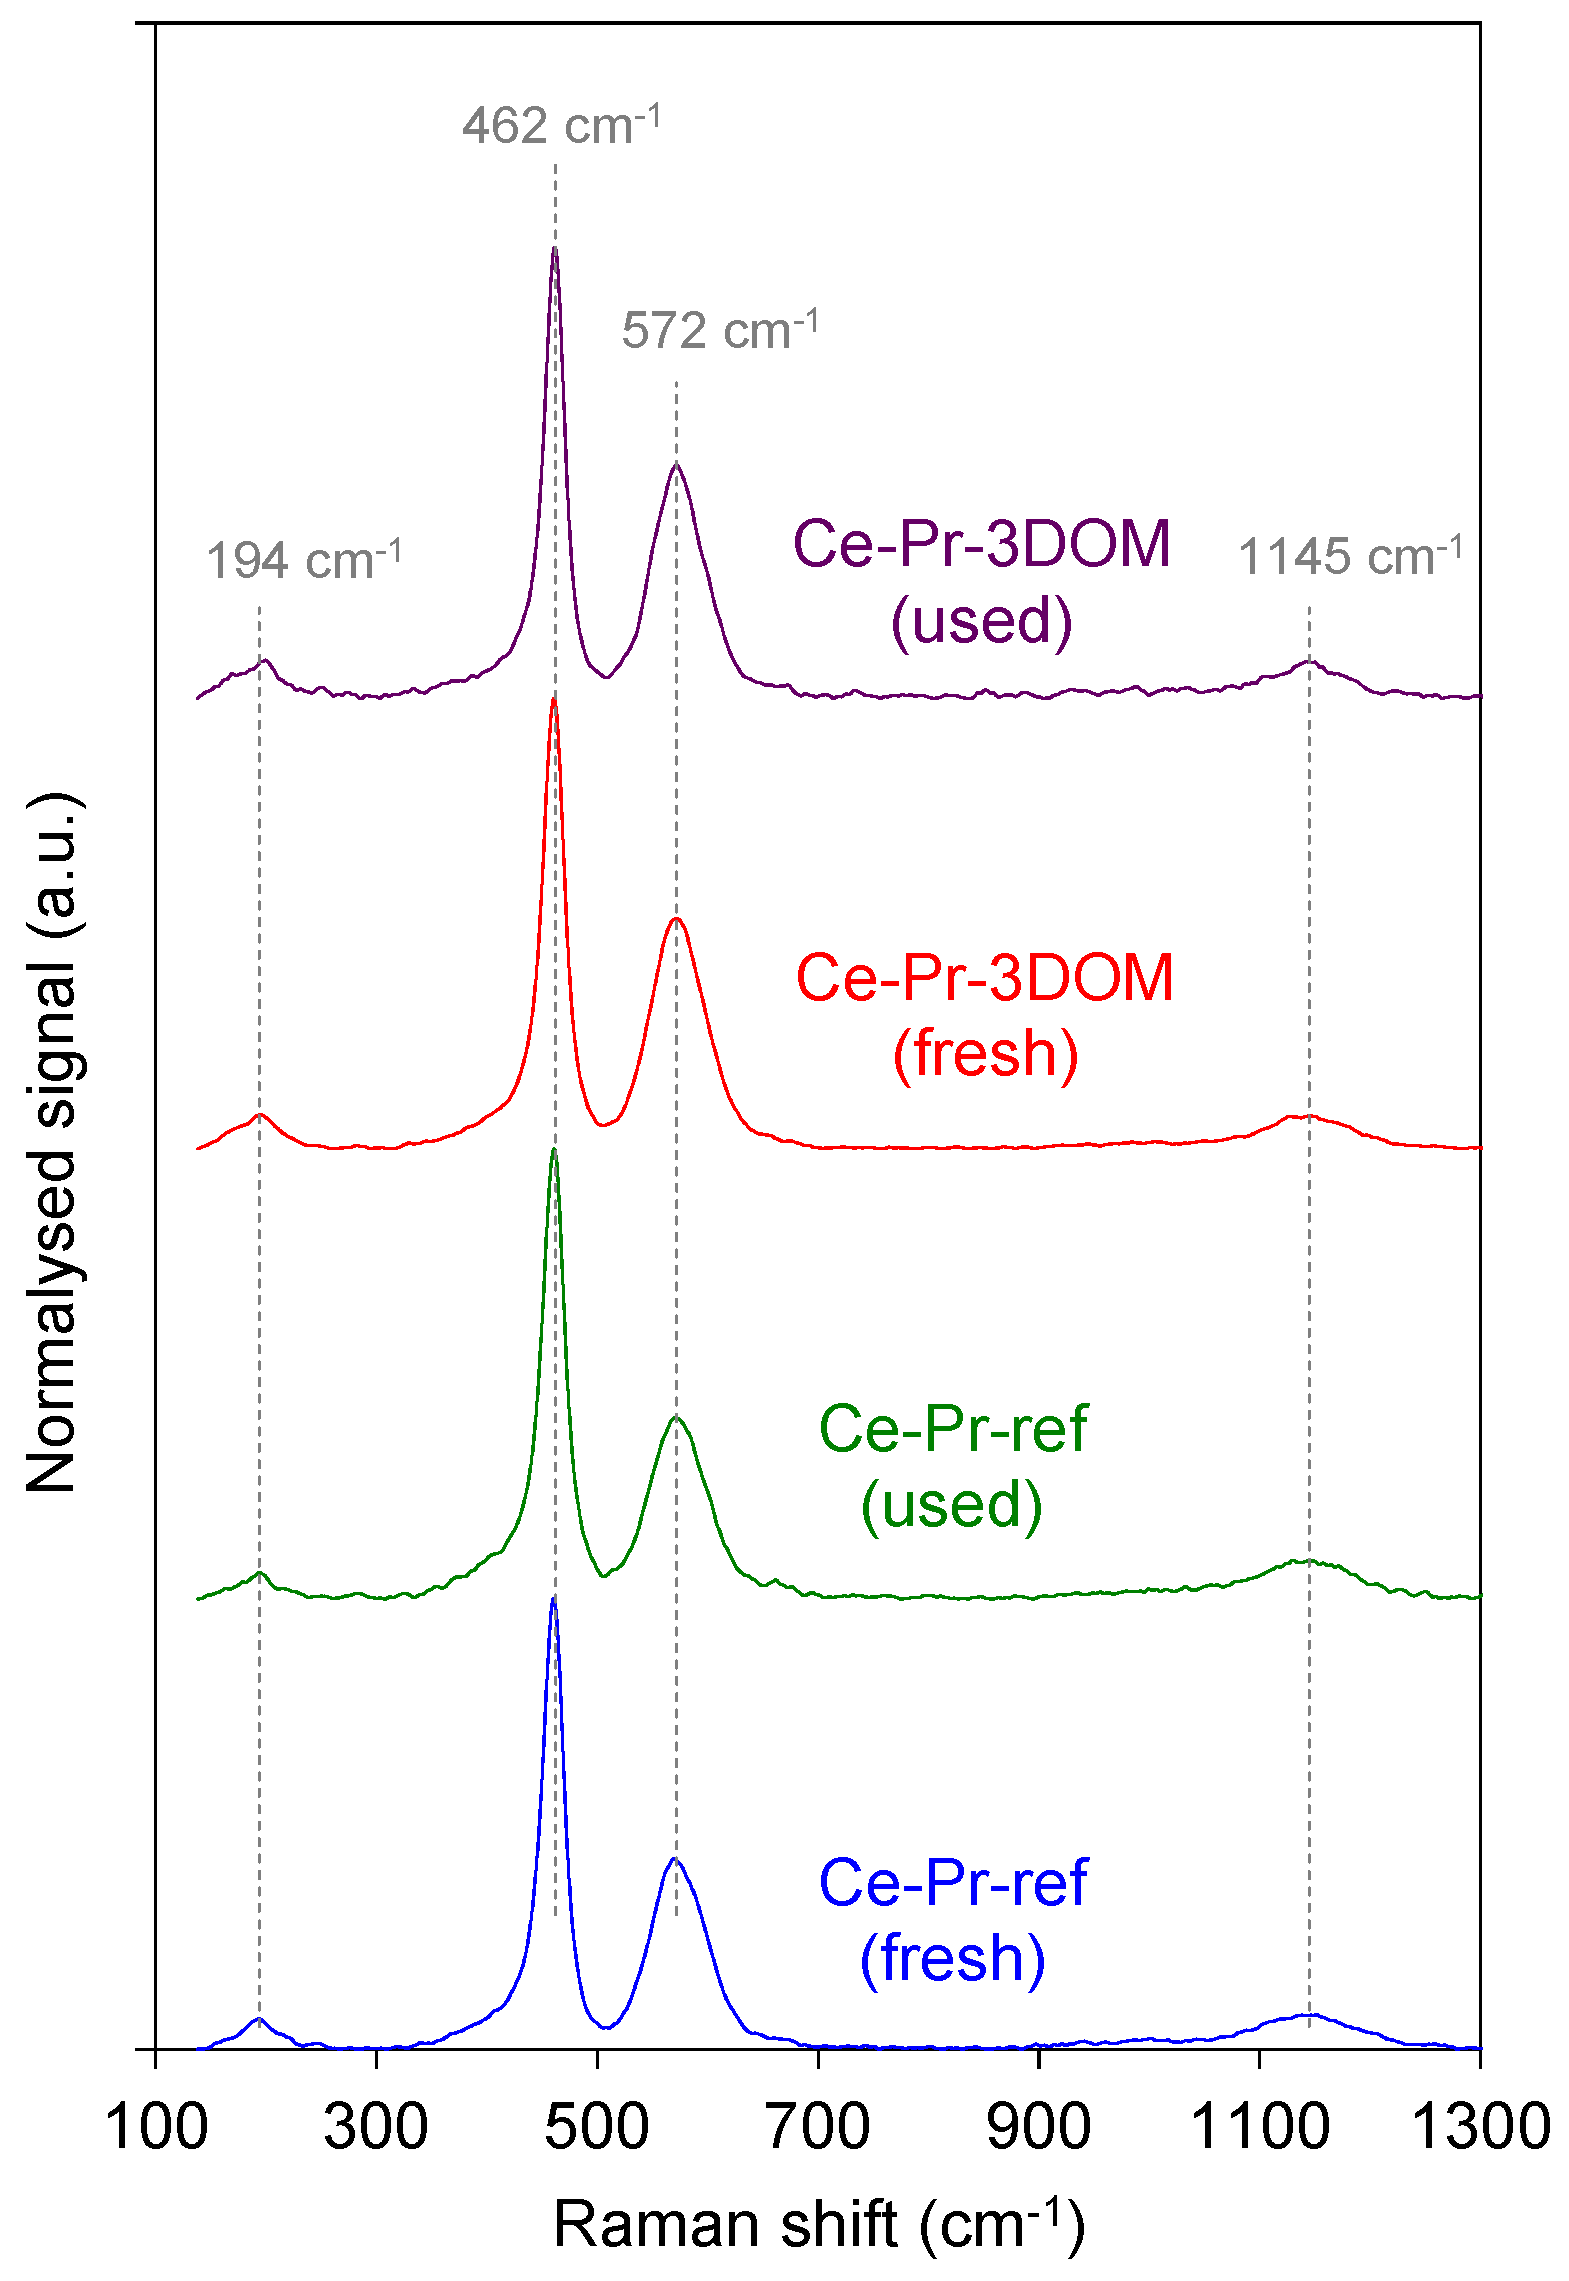
2.2.1. Characterization of the Catalysts’ Crystallinity by Raman Spectroscopy, X-ray Diffraction (XRD), and Helium Picnometry

The crystalline structure of the catalysts was studied, and Figure 3 shows the X-ray diffractograms.
These diffractograms include the characteristic peaks attributed to the fluorite structure of ceria (JCPDS 34-0394), and are similar for the two catalysts. The cell parameters and the crystallite sizes, compiled in Table 1, were obtained from these diffractograms, and are also equal for both Ce-Pr-3DOM and Ce-Pr-ref. The crystallite sizes are 10 nm and the cell parameter is 0.5429 nm, this value being in agreement with the cell parameters reported in the literature for materials of similar composition [13].
The density of the two catalysts, which was determined by helium picnometry (Table 1), is also the same. This is additional evidence of the similar structure of the primary crystals of both Ce-Pr-3DOM and Ce-Pr-ref.
The conclusions shown by XRD and He picnometry are supported by Raman spectroscopy. Figure 4 shows the Raman spectra of the fresh and used catalysts, all of them being qualitatively similar.
A single band centered at 462 cm−1 is shown, which is the F2g band of the typical fluorite structure of ceria. In this structure, cerium cations are located at the corners and center of the faces of a cubic unit cell and oxygen anions are placed in the octahedral positions. The F2g band is related to the oxygen anions’ vibration around the octahedral position [14,15].
The maximum of the F2g band is located at 462 cm−1 in all spectra, and this value is slightly lower to that reported for pure ceria (465 cm−1 [14,16]). This shift towards low values can be related to the partial substitution of Ce4+ cations (0.097 nm) by Pr3+ cations (0.113 nm), the latter being larger than the former. Note that both cerium and praseodymium can adopt the +3 and +4 oxidation states, but praseodymium is reduced more easily than cerium [17]. Therefore, the Raman spectra in Figure 4 provide evidence of Ce-Pr solid solution formation in both catalysts.
In addition to the F2g band at 465 cm−1, ceria also presents two low-intensity bands around 260 and 595 cm−1 [14,18,19], and our spectra in Figure 4 show bands at 194 and 572 cm−1 that could be consistent with these two features. Our spectra also show a band at 1145 cm−1 that has been assigned to surface oxygen species. The small band around 572 cm−1 has been related to oxygen vacancies, and relevant differences in the intensity of the vacancies bands have been detected for the two catalysts. The intensity ratio of the vacancies (572 cm−1) and F2g (462 cm−1) bands are compiled in Table 2 for all spectra.
The relative intensity of the vacancies band is higher for the Ce-Pr-3DOM catalyst than for the reference catalyst (Ce-Pr-ref), and the vacancies’ population is preserved during the catalytic tests. These results point out that the formation of the Ce-Pr solid solution into the PMMA template enhances the formation of oxygen vacancies. A more detailed analysis of the presence of 3+ and 4+ cations on the catalysts and their reducibility was carried out by X-ray photoelectron spectroscopy (XPS) and Temperature-programmed reduction with H2 (H2-TPR), respectively, and the results are discussed later on.
As a summary, it can be concluded that according to the Raman spectroscopy, XRD, and helium density results, the utilization of the PMMA template does not affect the crystalline features (type of phases, crystallite sizes, and cell parameters) of the catalysts, which seem to be related to the chemistry and thermal history of the synthesis process. However, evidences of different populations of vacant sites have been provided by Raman spectroscopy, suggesting that the PMMA template affects this parameter. These results allow the interpretation of the differences in catalytic activity, paying attention only to the porous structure of the catalysts and to the chemical properties of their surface, and ruling out differences in the structure of the primary crystals.

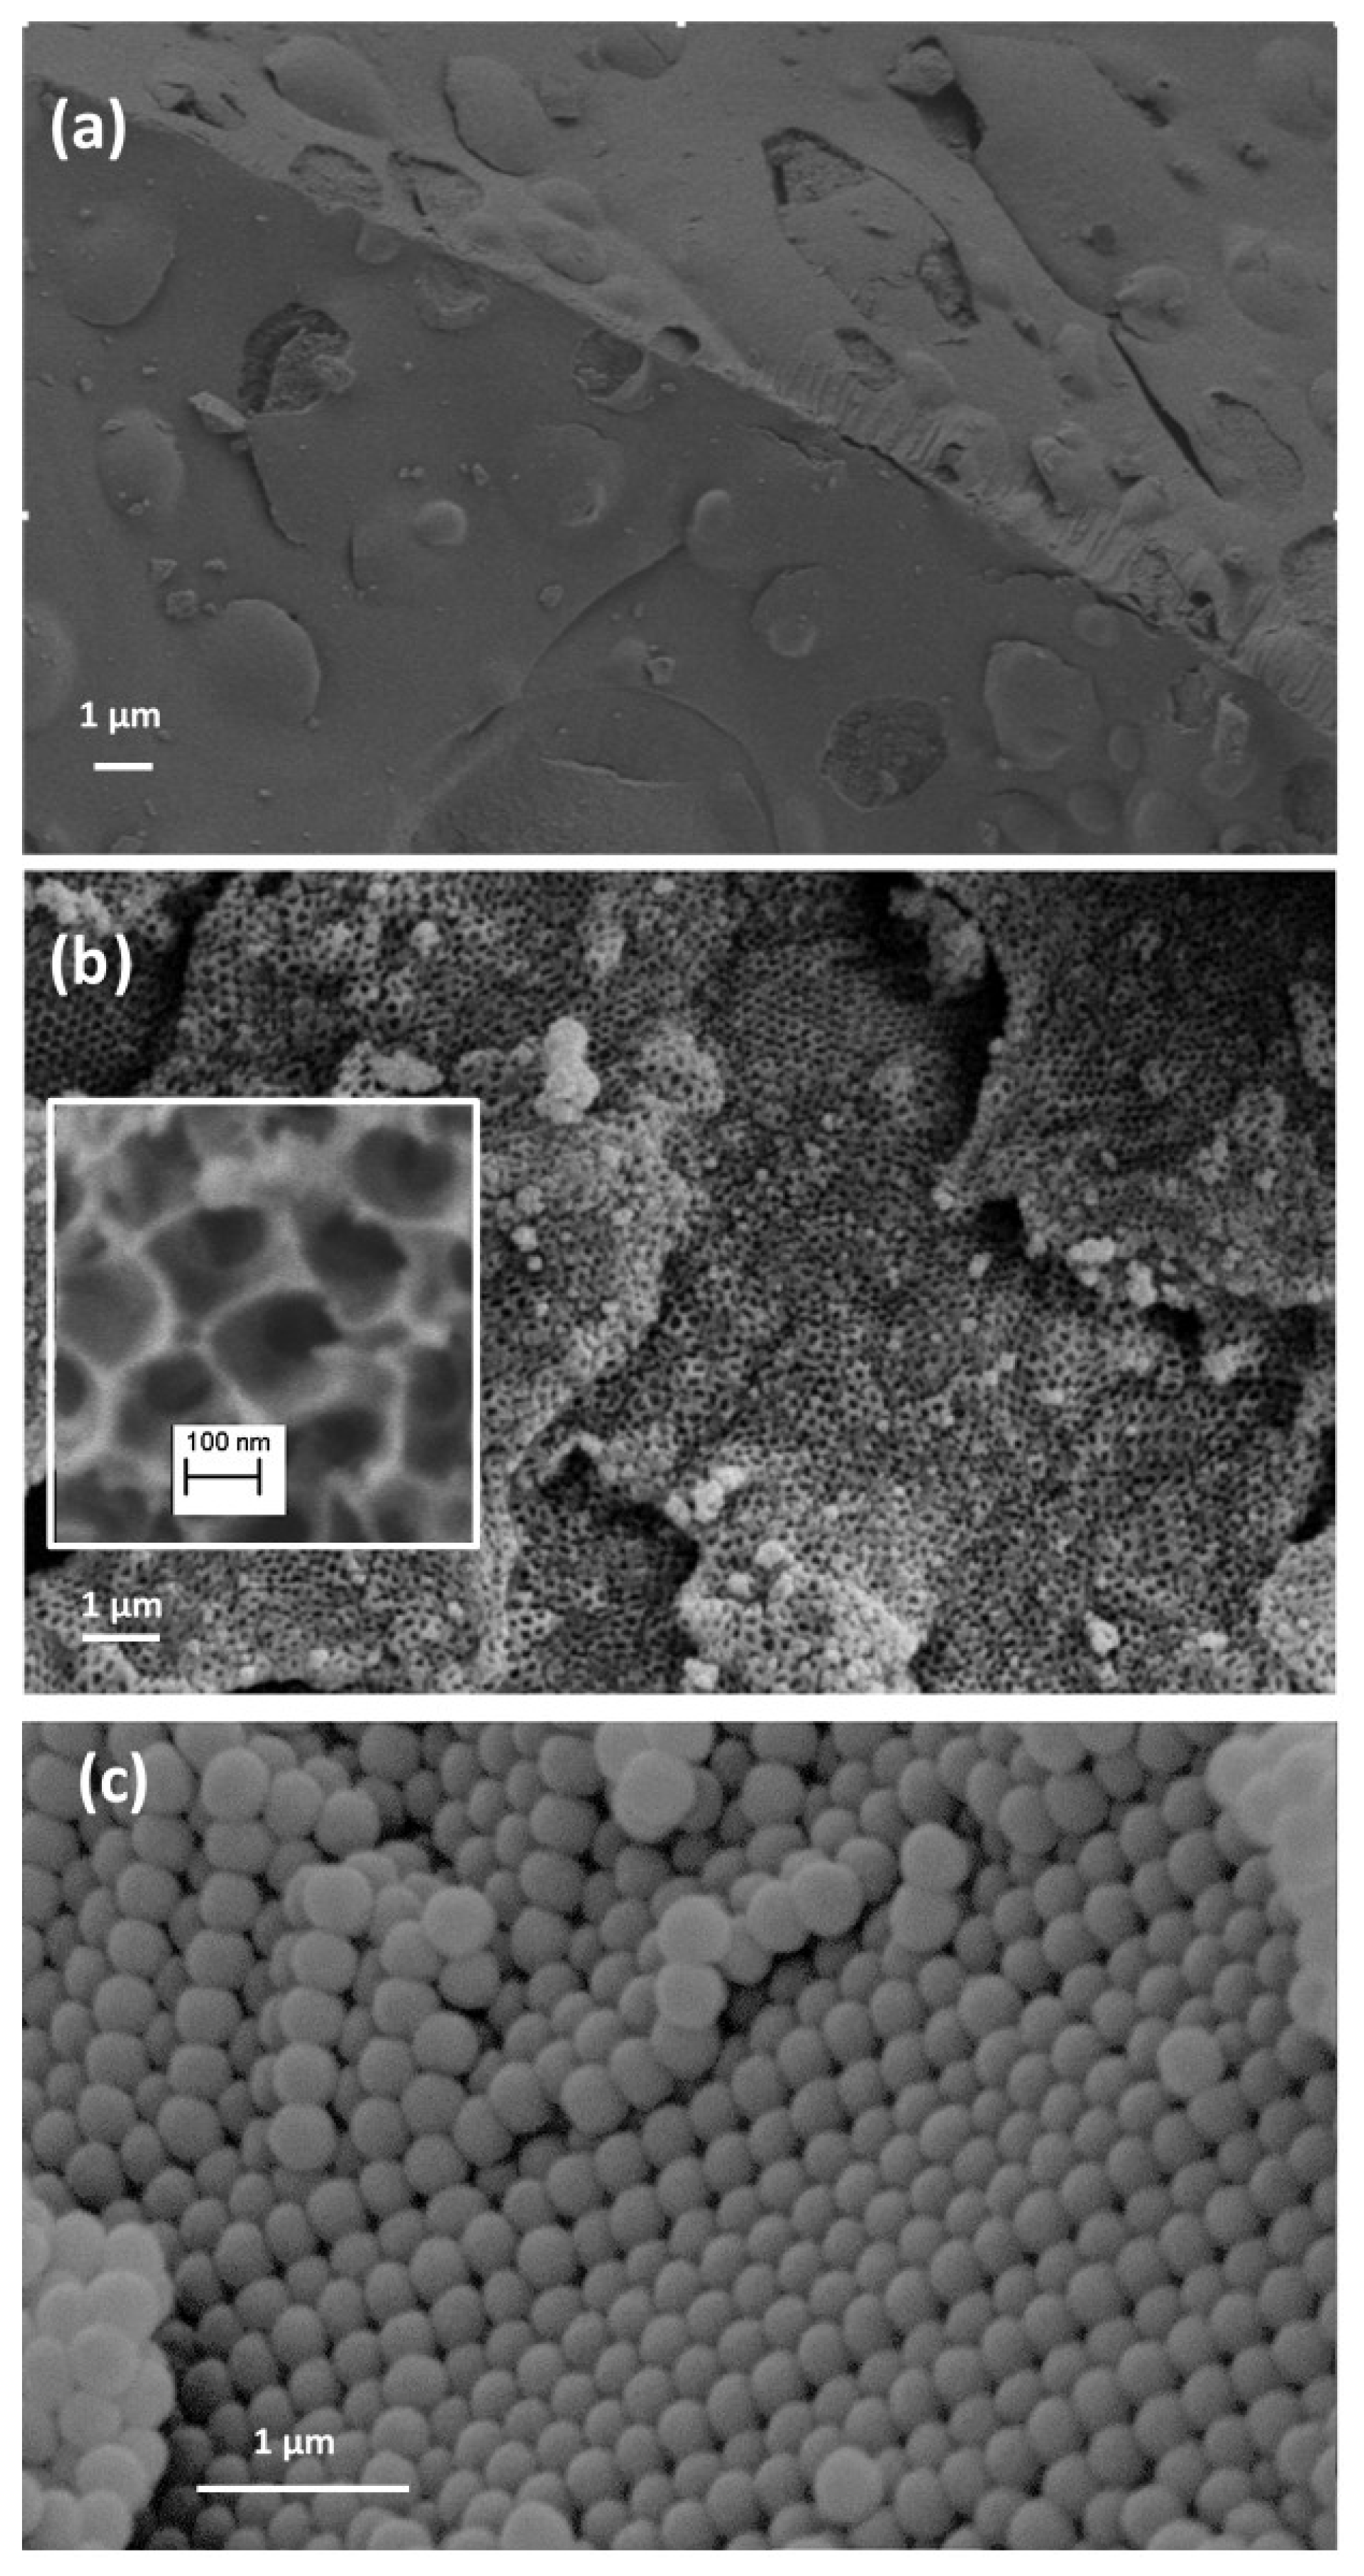
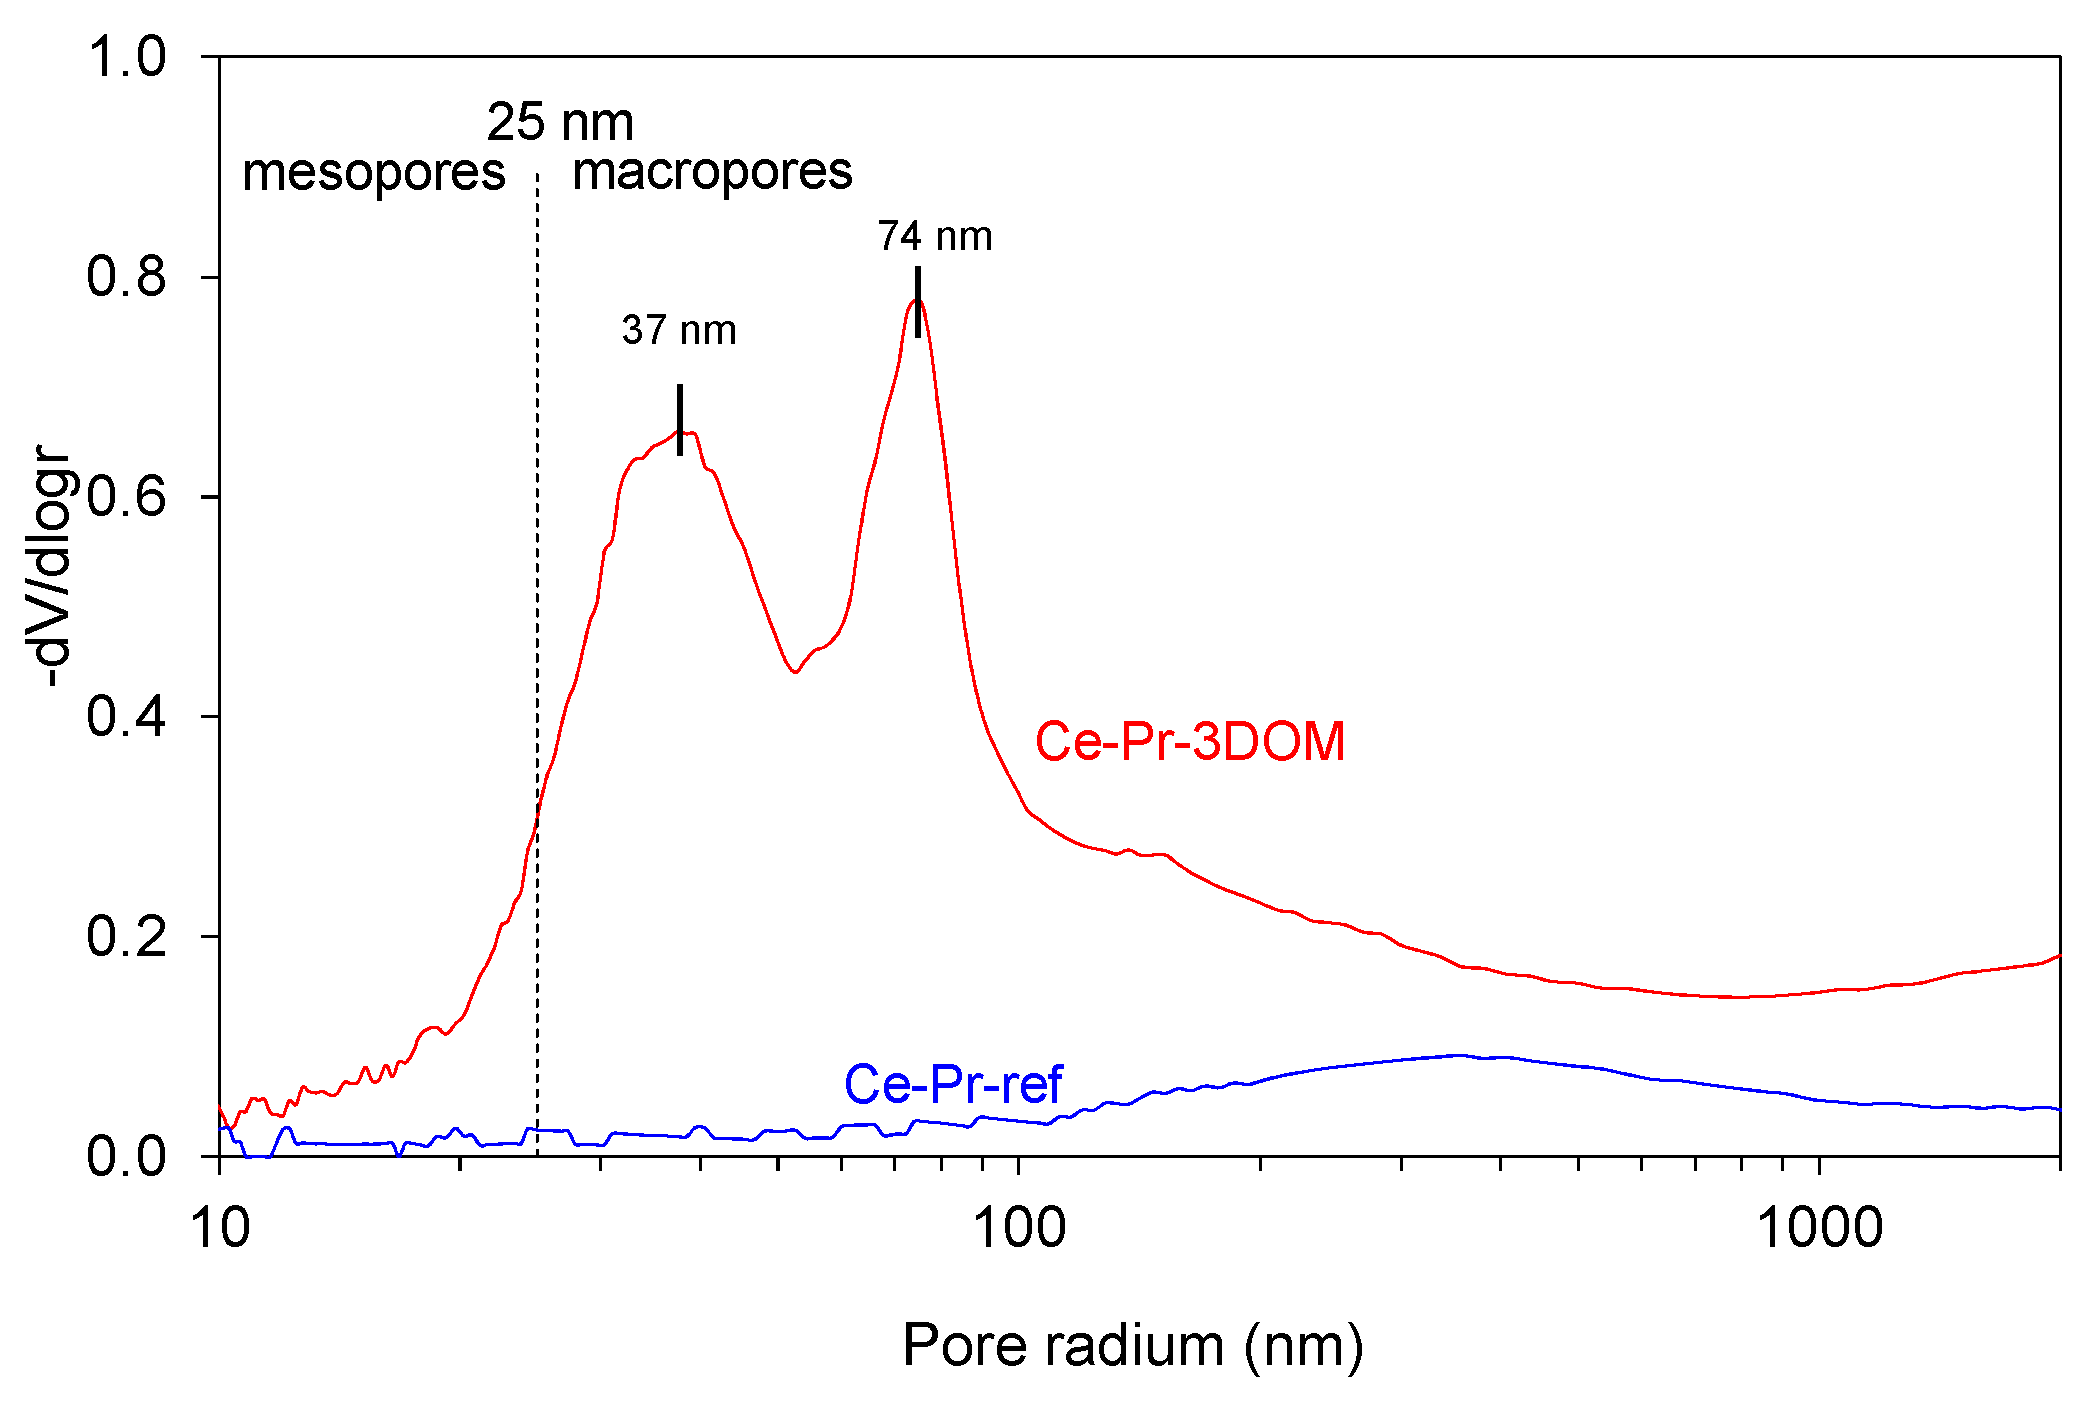
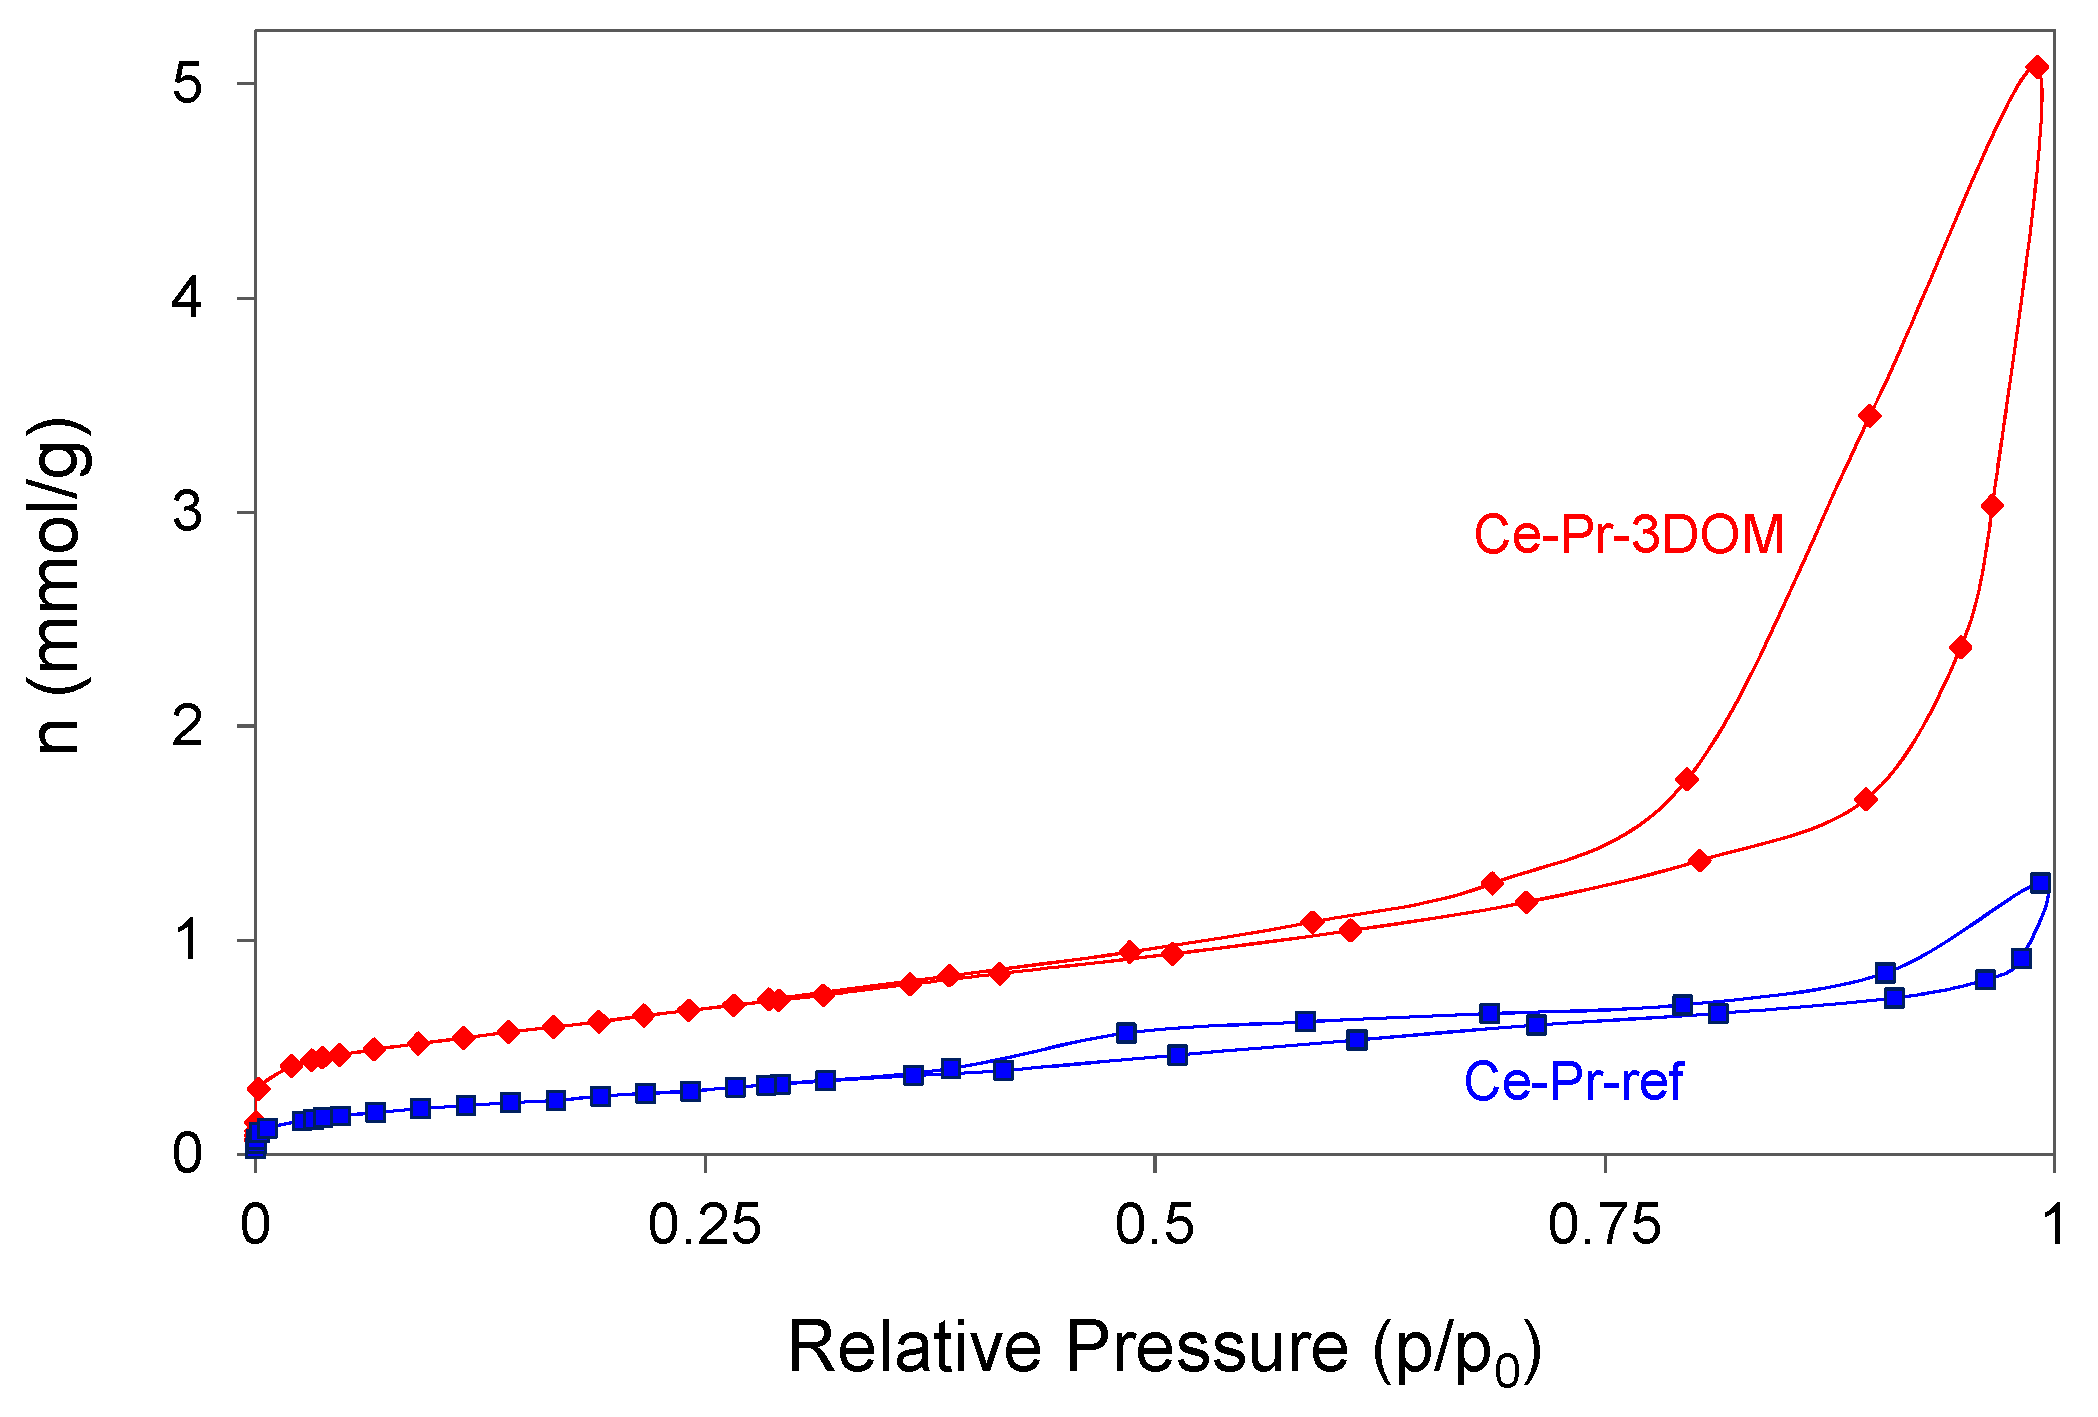
2.2.2. Characterization of the Catalysts’ Surface by Scanning electron microscopy (SEM), Mercury Intrusion Porosimetry, and N2 Adsorption

The morphology of the catalysts was studied by SEM microscopy, and representative images are shown in Figure 5 together with one image of the PMMA template. The reference catalyst (Figure 5a; Ce-Pr-ref), prepared without the template, shows a flat surface without evident porosity. Monodisperse spheres of PMMA with about 200 nm diameter are observed in Figure 5c, which are packed in regular planes forming the colloidal crystal, and the catalyst prepared by infiltration into the PMMA template (Figure 5b; Ce-Pr-3DOM) shows the opposite morphology. Large spherical macropores with roughly 80 nm diameter are arranged in the same way as the PMMA spheres. This shrinkage from 200 to 80 nm (60%) is quite similar to that reported by other authors for other 3DOM-ceria catalysts [20]. The inset in Figure 2b shows that the spherical macropores are linked by smaller windows, which are necessary for the gases to diffuse into the solid structure during the catalytic reactions.
These important differences in the SEM images are consistent with differences in the meso and macroporosity measured by mercury intrusion porosimetry (Figure 6). The reference catalyst Ce-Pr-ref has almost negligible area in the range of meso and macropores, while the catalyst prepared by infiltration into the PMMA template shows two well-defined peaks in the macropore range. The area of these meso and macropores was estimated from the mercury intrusion curves (Table 1), being 41 m2/g for Ce-Pr-3DOM while only 3 m2/g for Ce-Pr-ref.
In addition, the catalyst Ce-Pr-3DOM also presents much more developed microposority than the reference catalyst Ce-Pr-ref, as deduced from the N2 adsorption-desorption isotherms included in Figure 7.
The shape of the Ce-Pr-3DOM isotherm is Type IV, according to the IUPAC classification [21]. This isotherm combines N2 adsorption at very low partial pressures with a certain adsorption in the whole range of partial pressures and a well-defined hysteresis loop. This type of isotherm is attributed to solids with both micro and mesopores. The shape of the hysteresis loop also suggests the presence of macropores, in agreement with the mercury intrusion results, since the adsorption near saturation pressure does not reach horizontal values but keeps increasing.
On the contrary, the N2 adsorption-desorption isotherm of the Ce-Pr-ref catalyst shows little N2 adsorption in the whole range of partial pressures and the hysteresis loop is almost negligible, evidencing that this solid has a very poor porosity. In agreement with the shape of the isotherms, the BET specific surface area of Ce-Pr-3DOM (51 m2/g; data shown in Table 1) is also much higher to that of Ce-Pr-ref (24 m2/g).
Additional information about the porosity of both solids is obtained by comparing the BET specific surface areas with the areas determined by mercury intrusion porosimetry (Table 1). The BET surface areas include the whole porosity, while the surface area determined by mercury intrusion porosimetry provides information about the meso and macropores. The areas of Ce-Pr-3DOM (41 and 51 m2/g for mercury intrusion and N2 adsorption areas, respectively; Table 1) confirm that this solid combines micro, meso, and macropores, with the most area lying in the macropore range.
According to these surface characterization results, it could be argued that the better catalytic activity of Ce-Pr-3DOM with regards to Ce-Pr-ref is related to its higher surface area, since it has more surface available for CO to be adsorbed and oxidized. However, different attempts have been performed in order to normalize the reaction rate per square meter of catalyst surface (considering BET surface areas and areas in different ranges determined by mercury intrusion) and all of them have failed. This leads us to think that, probably, it is partially true that the higher surface area leads to higher catalytic activity, but surface area differences alone are not enough to explain the differences in activity. In other words, if the only reason for the better catalytic activity of Ce-Pr-3DOM with respect to Ce-Pr-ref was its higher surface area, much higher differences in the CO oxidation rates would be expected. Raman spectroscopy evidenced the higher population of vacant sites on the Ce-Pr-3DOM catalyst and, as demonstrated in the next section, the nature of the surface must also be taken into account. The surface of the Ce-Pr-3DOM catalyst seems to be more efficient than that of Ce-Pr-ref, that is, the formation of the Ce-Pr solid solution into the PMMA porosity framework has benefits in catalytic activity with respect to crystallization without the template, in addition to the improved porosity.

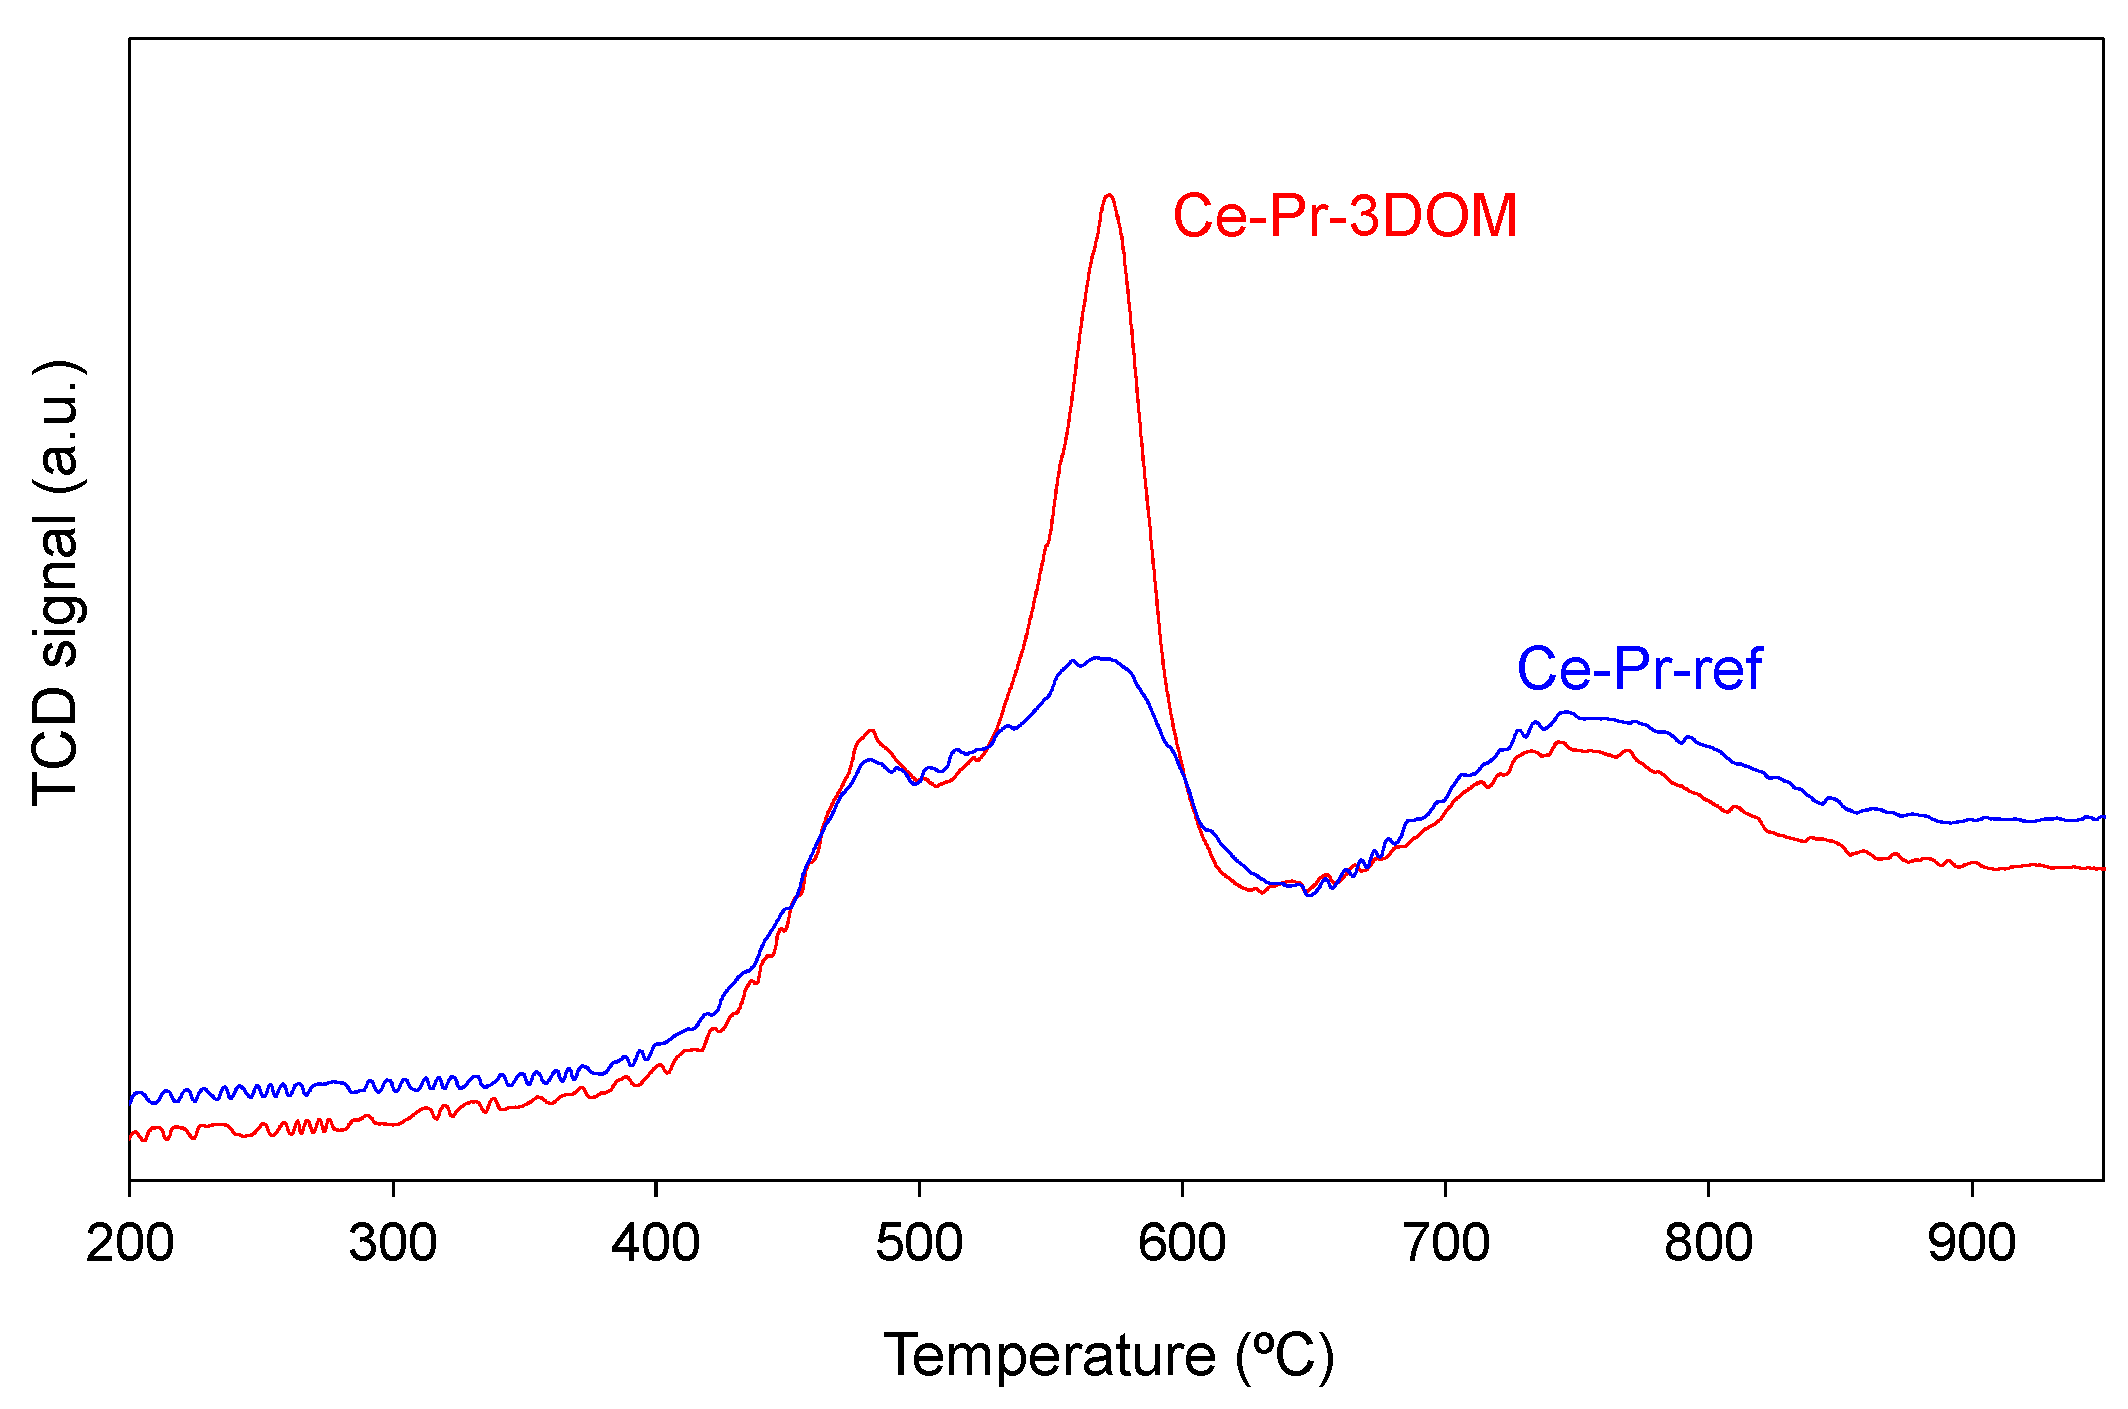
2.2.3. Characterization of the Chemical Properties of the Catalysts’ Surface by Temperature-Programmed Reduction with H2 (H2-TPR) and X-ray Photoelectron Spectroscopy (XPS).

Finally, the catalysts were characterized by H2-TPR and XPS, and important differences in the surface properties were noticed. Figure 8 shows the H2 reduction profiles, and three different reduction peaks are distinguished. The high-temperature peak at 750 °C can be assigned to the bulk reduction of the catalysts and the peak at 575 °C to surface reduction. The small peak at 450 °C is not easily assigned, because it could be produced by the desorption of hydroxyls and/or carbonates together with actual reduction events. The main difference in the reduction profiles of the two catalysts is the intensity of the surface reduction peak at 575 °C, which is much more intense for Ce-Pr-3DOM than for Ce-Pr-ref.
These H2-TPR experiments confirm that the surface reducibility of the 3DOM catalyst is much higher than that of Ce-Pr-ref, while bulk reduction is more or less equal for both materials. This is consistent with the previous characterization, where it was confirmed that the primary Ce-Pr mixed oxide crystals are equal, and therefore they are reduced in the same way, while the main differences are in their surfaces.
The catalysts’ surface was characterized by XPS and the Ce/Pr ratio and percentages of +3 cations were estimated (Table 3). The XPS spectra are included in a Supplementary Materials file (Figure S1: XPS spectra in the energy range of Ce 3d and Figure S2: XPS spectra in the energy range of Pr 3d). The Ce/Pr surface ratio is the same for both catalysts (~4.2), and the ratio is lower than the nominal value (9), that is, there is more Pr in the solid solutions’ bulk than on their surface, while the opposite occurs with Ce.
The total percentage of 3+ cations (Ce3+ + Pr3+) are similar for both fresh catalysts (34%), but the contribution of Ce3+ and Pr3+ cations to these total values is different for Ce-Pr-3DOM (fresh) and Ce-Pr-ref (fresh). The percentage of reduced Pr3+ cations is much higher in the Ce-Pr-3DOM catalyst (fresh) (54%) than in the reference counterpart (Ce-Pr-ref (fresh); 38%), while the opposite occurs in the Ce3+ percentage.
The percentages of 3+ cations change during the catalytic tests, as deduced from the XPS results obtained with the used catalysts, and these changes affect the Ce-Pr-3DOM catalyst to a higher extent than they affect the Ce-Pr-ref catalyst. The total percentage of 3+ cations on the Ce-Pr-3DOM catalyst decreases from 34% to 26% during the catalytic tests, an evidence of severe modification of the surface’s oxidation degree, this fact being consistent with the redox mechanisms taking place, while the 3+ cations in the Ce-Pr-ref catalyst only change from 34% to 32%. The higher extent of the surface modification of the Ce-Pr-3DOM catalyst during the catalytic experiments agrees with its higher catalytic activity (Figure 1 and Figure 2), and suggests that the better performance of the Ce-Pr-3DOM catalyst is not only related with its higher surface area but also with the nature of its surface. The higher reducibility of the Ce-Pr-3DOM catalyst surface observed by H2-TPR (Figure 8) is also in line with this observation, that is, it seems that crystallization of the Ce-Pr solid solutions into the PMMA template improves both the surface and the redox properties of the catalyst. Additional information is obtained from the individual percentages of the Ce3+ and Pr3+ cations on the catalyst’s surface before and after the catalytic tests. As deduced from the data in Table 3, the main changes during the catalytic tests affect the oxidation of the Pr3+ cations of the Ce-Pr-3DOM catalyst.
In conclusion, the utilization of the PMMA template for the preparation of Ce-Pr-3DOM improves the porosity of the material, in agreement with the literature, but also the redox properties of the catalyst. The Ce-Pr solid solution prepared with the PMMA template has improved surface reducibility with regards to the counterpart reference material prepared without the template, and improved redox behavior under reaction conditions, that is, it has higher area and this area is reduced and reoxidized more easily. This is mainly attributed to praseodymium cations, which seem to accomplish redox cycles more easily.

3. Materials and Methods

3.1. Catalyst Preparation

For Ce-Pr-3DOM preparation, a polymethylmethacrylate (PMMA) colloidal crystal template has been firstly synthetized. This template consists of monodisperse PMMA spheres packed in a three dimensional structure, which is known as a colloidal crystal. The PMMA spheres were prepared by polymerization in a boiling aqueous solution of methylmethacrylate, methacrylic acid, and divinylbenzene in a 100:1:5 volume ratio. The polymerization was conducted for 75 min, and started upon K2S2O8 addition to the mixture. After cooling, the PMMA spheres’ colloidal crystal was obtained by centrifugation.
For Ce-Pr 3DOM preparation, Ce(NO3)3·6H2O and Pr(NO3)3·6H2O were dissolved in ethanol in a 9:1 molar ratio, and citric acid was added to the solution in an equimolar proportion to the 3+ cation content. This dissolution was added dropwise to the PMMA template, and the excess was removed under soft vacuum. After drying at 60 °C the impregnation was repeated, and the PMMA template was finally removed by calcination at 500 °C for 2 h.
The reference catalyst (Ce-Pr-ref) was prepared following the same protocol but by skipping the impregnation step into the PMMA template, that is, the dissolution with citric acid and the Ce and Pr precursors were directly dried and calcined.

3.2. Catalytic Tests

CO oxidation in excess oxygen was selected as the test reaction. Experiments were performed in a U-shaped fixed-bed reactor with 16 mm inner diameter, using 50 mg of catalyst and different gas flows (60, 90, and 120 mL/min) of a gas stream with 1% CO and 17% O2 in N2. The gas composition was monitored by gas chromatography in a HP 6890 gas chromatograph equipped with a TCD detector and two columns (Porapak Q, for CO2 separation and Molecular Sieve 13X, for O2 and CO separation).
Experiments were carried out in ramp conditions by increasing the temperature from 25 to 500 °C at 2 °C/min. Once the maximum temperature was achieved, CO was removed from the mixture, and the catalyst was cooled down under an O2/N2 atmosphere. Following this protocol, all experiments were performed with the same parcel of catalyst in consecutive runs. The reproducibility of results and the stability of the catalysts were confirmed in consecutive experiments and, under these experimental conditions, a pseudo steady-state at each temperature can be assumed.

3.3. Catalyst Characterization

The crystalline structure of the catalysts was studied by XRD and Raman spectroscopy. The X-Ray diffractograms were recorded between 10 and 90° (2θ) with a step of 0.025° in a Bruker D8-Advance diffractometer, using CuKα radiation (λ = 0.15418 nm). Raman spectra were recorded in a Jasco NRS-5100 dispersive Raman spectrometer using a laser source of 632.8 nm and a 4-stage Peltier cooled CCD detector. The Raman signal was collected using a 20× (0.45 NA) objective. The laser power, calibrated on the sample, was kept close to 1.8 mW. The Raman shift was calibrated using the 520.7 cm−1 line of crystalline silicon prior to the sample analysis.
The density of the samples was assessed by He picnometry by using an automatic helium pycnometer (MicroUltrapyc 1200e, Quantachrome, Boynton Beach, FL, USA).
SEM images of the PMMA template and of the two catalysts were obtained in a JEOL microscope, Tokyo, Japan, model JSM-840.
The surface composition of the catalysts was characterized by XPS in a VG-Microtech Multilab electron spectrometer using a MgKα (1253.6 eV) radiation source and a pressure of 5 × 10⁻¹⁰ mbar. The binding energy (BE) and the kinetic energy (KE) scales were adjusted by setting the C 1s transition at 284.6 eV. The Ce3+(%), with regards to total cerium, was calculated with the procedure reported by Romeo et al. [22] and the Pr3+(%), with regards to total praseodymium, was estimated as proposed by Borchet et al. [23].
N2 adsorption and mercury porosimetry were used to determine the porosity of the catalysts. N2 adsorption-desorption isotherms were measured at −196 °C in an automatic volumetric system (Autosorb-6, Quantachrome) after outgassing the catalysts at 150 °C for 4 h. Mercury intrusion porosimetries were carried out in a Poremaster 60 GT (Quantachrome, Boynton Beach, FL, USA), which is able to intrude mercury in pores up to 3.6 nm (60,000 psi), and the analysis in low and high pressure modes were consecutively performed. The powdered catalysts were outgassed at 50 °C under vacuum (13 mbar) for 12 h. A contact angle (θ) of 140° and a value of mercury surface tension (γ) of 0.48 J/m2 were used. The Washburn equation was used to relate the intrusion pressure and the pore diameter. Note that obtained pore diameter relates to the entrance of the pore while the pore diameter through the channel may vary [24].
The reducibility of the catalysts was studied by Temperature Programmed Reduction with H2 (H2-TPR) in a Micromeritics Pulse ChemiSorb 2705 device with a TCD detector located after a cold trap at −89 °C. The experiments were performed with 40 mg of catalyst and 40 mL/min of gas with 5 vol % H2 in Ar. The heating rate was 10 °C/min from room temperature to 1000 °C.

4. Conclusions

Ce0.9Pr0.1O2 catalysts have been prepared with and without the infiltration of Ce and Pr precursors into a PMMA colloidal crystal template, and have been deeply characterized and tested for CO oxidation, and the following conclusions can be drawn:
Ce and Pr precursor infiltration into the PMMA template does not affect the crystalline features (type of phases, crystallite size, and cell parameter) of the catalysts, which seem to be related to the chemistry and thermal history of the synthesis process. Consequently, the bulk reduction of the Ce-Pr mixed oxides is not affected by PMMA utilization during the synthesis. According to XPS results, the Ce and Pr location in the Ce-Pr mixed oxide particles is not affected by the synthesis using PMMA.
Utilization of the PMMA template for the preparation of Ce-Pr mixed oxides improves both the porosity and surface redox properties of the catalyst. The catalyst prepared upon PMMA infiltration combines micro, meso, and macropores, with the most area being in the macropore range, while the reference unshaped catalyst presents poor porosity in all ranges. However, the catalyzed CO oxidation rates do not correlate with the surface area of the catalysts (neither micro nor meso/macro).
The Ce-Pr solid solution prepared with the PMMA template also presents improved surface reducibility with regards to the counterpart reference material prepared without the template, and improved redox behavior under reaction conditions, that is, it has a higher area and this area is reduced and reoxidized more easily. This is mainly attributed to praseodymium cations, which accomplish redox cycles more easily than cerium cations.

Supplementary Materials

The following are available online at www.mdpi.com/2073-4344/7/2/67/s1, Figure S1: XPS spectra in the energy range of Ce 3d. Figure S2: XPS spectra in the energy range of Pr 3d.

Acknowledgments

The authors thank the financial support of Generalitat Valenciana (Project PROMETEOII/2014/010), the Spanish Ministry of Economy and Competitiveness (Projects MAT2014-61992-EXP and CTQ2015-67597-C2-2-R), the Spanish Ministry of Education, Culture and Sports (grant FPU14/01178) and the UE (FEDER funding).

Author Contributions

All authors contributed equally to this article.

Conflicts of Interest

The authors declare no conflict of interest. The founding sponsors had no role in the design of the study; in the collection, analyses, or interpretation of data; in the writing of the manuscript, and in the decision to publish the results.

References

  1. Zhang, G.; Zhao, Z.; Liu, J.; Jiang, G.; Duan, A.; Zheng, J.; Chen, S.; Zhou, R. Three dimensionally ordered macroporous Ce1−xZrxO2 solid solutions for diesel soot combustion. Chem. Commun. 2010, 46, 457–459. [Google Scholar] [CrossRef] [PubMed]
  2. Zhang, G.; Zhao, Z.; Xu, J.; Zheng, J.; Liu, J.; Jiang, G.; Duan, A.; He, H. Comparative study on the preparation, characterization and catalytic performances of 3DOM Ce-based materials for the combustion of diesel soot. Appl. Catal. B 2011, 107, 302–315. [Google Scholar] [CrossRef]
  3. Wei, Y.; Liu, J.; Zhao, Z.; Duan, A.; Jiang, G. The catalysts of three-dimensionally ordered macroporous Ce1−xZrxO2-supported gold nanoparticles for soot combustion: The metal–support interaction. J. Catal. 2012, 287, 13–29. [Google Scholar]
  4. Wei, Y.; Liu, J.; Zhao, Z.; Duan, A.; Jiang, G.; Xu, C.; Gao, J.; He, H.; Wang, X. Three-dimensionally ordered macroporous Ce0.8Zr0.2O2-supported gold nanoparticles: synthesis with controllable size and super-catalytic performance for soot oxidation. Energy Environ. Sci. 2011, 4, 2959. [Google Scholar] [CrossRef]
  5. Jin, B.; Wei, Y.; Zhao, Z.; Liu, J.; Yu, X.; Li, Y.; Li, J. Synthesis of three-dimensionally ordered macroporous Al–Ce mixed oxide catalysts with high catalytic activity and stability for diesel soot combustion. Catal. Today 2015, 258, 487–497. [Google Scholar] [CrossRef]
  6. Xu, J.; Liu, J.; Zhao, Z.; Xu, C.; Zheng, J.; Duan, A.; Jiang, G. Easy synthesis of three-dimensionally ordered macroporous La1−xKxCoO3 catalysts and their high activities for the catalytic combustion of soot. J. Catal. 2011, 282, 1–12. [Google Scholar] [CrossRef]
  7. Zhang, Y.; Liang, H.; Gao, X.Y.; Liu, Y. Three-dimensionally ordered macro-porous CuO–CeO2 used for preferential oxidation of carbon monoxide in hydrogen-rich gases. Catal. Commun. 2009, 10, 1432–1436. [Google Scholar] [CrossRef]
  8. Zhang, J.; Jin, Y.; Li, C.; Shen, Y.; Han, L.; Hu, Z.; Di, X.; Liu, Z. Creation of three-dimensionally ordered macroporous Au/CeO2 catalysts with controlled pore sizes and their enhanced catalytic performance for formaldehyde oxidation. Appl. Catal. B 2009, 91, 11–20. [Google Scholar] [CrossRef]
  9. Ji, K.; Dai, H.; Deng, J.; Li, X.; Wang, Y.; Gao, B.; Bai, G.; Au, C.T. A comparative study of bulk and 3DOM-structured Co3O4, Eu0.6Sr0.4FeO3, and Co3O4/Eu0.6Sr0.4FeO3: Preparation, characterization, and catalytic activities for toluene combustion. Appl. Catal. A 2012, 447–448, 41–48. [Google Scholar] [CrossRef]
  10. Si, W.; Wang, Y.; Zhao, S.; Hu, F.; Li, J. A Facile Method for in Situ Preparation of the MnO2/LaMnO3 Catalyst for the Removal of Toluene. Environ. Sci. Technol. 2016, 50, 4572–4578. [Google Scholar] [CrossRef] [PubMed]
  11. Trovarelli, A. Catalytic Properties of Ceria and CeO2-Containing Materials. Catal. Rev. Sci. Eng. 1996, 38, 439–520. [Google Scholar] [CrossRef]
  12. Sun, C.; Li, H.; Chen, L. Nanostructured ceria-based materials: Synthesis, properties, and applications. Energy Environ. Sci. 2012, 5, 8475–8505. [Google Scholar] [CrossRef]
  13. Poggio-Fraccari, E.; Irigoyen, B.; Baronetti, G.; Mariño, F. Ce-Pr mixed oxides as active supports for Water-gas Shift reaction: Experimental and density functional theory characterization. Appl. Catal. A 2014, 485, 123–132. [Google Scholar] [CrossRef]
  14. Weber, W.H.; Hass, K.C.; McBride, J.R. Raman study of CeO2: Second-order scattering, lattice dynamics, and particle-size effects. Phys. Rev. B 1993, 48, 178. [Google Scholar] [CrossRef]
  15. Nineshige, A.; Taji, T.; Muroi, Y.; Kobune, M.; Fujii, S.; Nishi, N.; Inaba, M.; Ogumi, Z. Oxygen chemical potential variation in ceria-based solid oxide fuel cells determined by Raman spectroscopy. Solid State Ion. 2000, 135, 481–485. [Google Scholar] [CrossRef]
  16. Twu, J.; Chuang, C.J.; Chang, K.I.; Yang, C.H.; Chen, K.H. Raman spectroscopic studies on cerium oxide. Appl. Catal. B 1997, 12, 309–324. [Google Scholar]
  17. Bernal, S.; Blanco, G.; Calvino, J.J.; Perez Omil, J.A.; Pintado, J.M. Some major aspects of the chemical behavior of rare earth oxides: An overview. J. Alloys Compd. 2006, 408–412, 496–502. [Google Scholar] [CrossRef]
  18. Liu, S.; Wu, X.; Liu, W.; Chen, W.; Ran, R.; Li, M.; Wen, D. Soot oxidation over CeO2 and Ag/CeO2: Factors determining the catalyst activity and stability during reaction. J. Catal. 2016, 337, 188–198. [Google Scholar] [CrossRef]
  19. Choudhury, B.; Choudhury, A. Ce3+ and oxygen vacancy mediated tuning of structural and optical properties of CeO2 nanoparticles. Mater. Chem. Phys. 2012, 131, 666–671. [Google Scholar] [CrossRef]
  20. Wu, Q.Z.; Shen, Y.; Liao, J.F.; Li, Y.G. Synthesis and characterization of three-dimensionally ordered macroporous rare earth oxides. Mater. Lett. 2004, 58, 2688. [Google Scholar] [CrossRef]
  21. Thommes, M.; Kaneko, K.; Neimark, A.V.; Olivier, J.P.; Rodriguez-Reinoso, F.; Rouquerol, J.; Sing, K.S.W. Physisorption of gases, with special reference to the evaluation of surface area and pore size distribution, IUPAC Technical Report. Pure Appl. Chem. 2015, 87, 1051–1069. [Google Scholar] [CrossRef]
  22. Romeo, M.; Bak, K.; El Fallah, J.; le Normand, F.; Hilaire, L. XPS Study of the reduction of cerium dioxide. Surf. Interf. Anal. 1993, 20, 508–512. [Google Scholar] [CrossRef]
  23. Borchet, H.; Frolova, Y.V.; Kaichev, V.V.; Prosvirin, I.P.; Alikina, G.M.; Lukashevich, A.I.; Zaikovskii, V.I.; Moroz, E.M.; Trukhan, S.N.; Ivanov, V.P.; et al. Electronic and Chemical Properties of Nanostructured Cerium Dioxide Doped with Praseodymium. J. Phys. Chem. B 2005, 109, 5728–5738. [Google Scholar] [CrossRef] [PubMed]
  24. Lowell, S.; Shields, J.; Thomas, M.; Thommes, M. Characterization of Porous Solids and Powders: Surface Area, Pore Size and Density; Springer: Berlin/Heidelberg, Germany, 2004. [Google Scholar]
Figure 1. CO oxidation rate as a function of temperature for catalytic tests performed with Ce-Pr-3DOM and Ce-Pr-ref. (Total gas flow 60 mL/min; 1% CO + 17% O2 in N2; 50 mg of catalyst).
Catalysts 07 00067 g001
Figure 2. CO oxidation rate as a function of temperature for catalytic tests performed with (a) Ce-Pr-3DOM and (b) Ce-Pr-ref with different total gas flows. (1% CO + 17% O2 in N2; 50 mg of catalyst).
Catalysts 07 00067 g002
Figure 3. X-ray diffractograms of the fresh catalysts.
Catalysts 07 00067 g003
Figure 4. Raman spectroscopy characterization of the fresh and used catalysts.
Catalysts 07 00067 g004
Figure 5. SEM images of (a) catalyst Ce-Pr-ref; (b) catalyst Ce-Pr-3DOM; and (c) PMMA colloidal crystal template.
Catalysts 07 00067 g005
Figure 6. Pore size distribution of the fresh catalysts determined by mercury intrusion porosimetry.
Catalysts 07 00067 g006
Figure 7. N2 adsorption-desorption isotherms of the fresh catalysts.
Catalysts 07 00067 g007
Figure 8. Characterization of the fresh catalysts by Temperature-programmed reduction with H2.
Catalysts 07 00067 g008
Table 1. Quantitative results of the fresh catalysts’ characterization by X-ray diffraction, helium picnometry, N2 adsorption, and mercury intrusion porosimetry.
CatalystHg porosimetry Area (Meso and Macropores; m2/g)BET * (m2/g)Helium Density (g/cm3)Crystallite Size Scherrer (nm)Cell Parameter (nm)
Ce-Pr-3DOM41516.2100.5429
Ce-Pr-ref3246.3100.5429
* Specifec surface area determined with the Brunauer-Emmett-Teller (BET) model.
Table 2. Relative signal of selected Raman bands (vacancies/F2g).
CatalystSignal at 572 cm−1/Signal at 462 cm−1
Ce-Pr-3DOM (fresh)0.51
Ce-Pr-3DOM (used)0.52
Ce-Pr-ref (fresh)0.42
Ce-Pr-ref (used)0.40
Table 3. XPS characterization of the fresh and used catalysts’ surface.
CatalystCe/Pr *Ce3+ (%)Pr3+ (%)Total Ce3+ + Pr3+ (%)
Ce-Pr-3DOM (fresh)4.3295434
Ce-Pr-3DOM (used)4.7281426
Ce-Pr-ref (fresh)4.2333834
Ce-Pr-ref (used)4.7304432
* Nominal Ce/Pr 9.

