Alcohol Dehydrogenation on Kraft Lignin-Derived Chars with Surface Basicity


 ,
, 
 ,
, 

Abstract
:1. Introduction
2. Results and Discussion
2.1. Characterization of the Catalysts
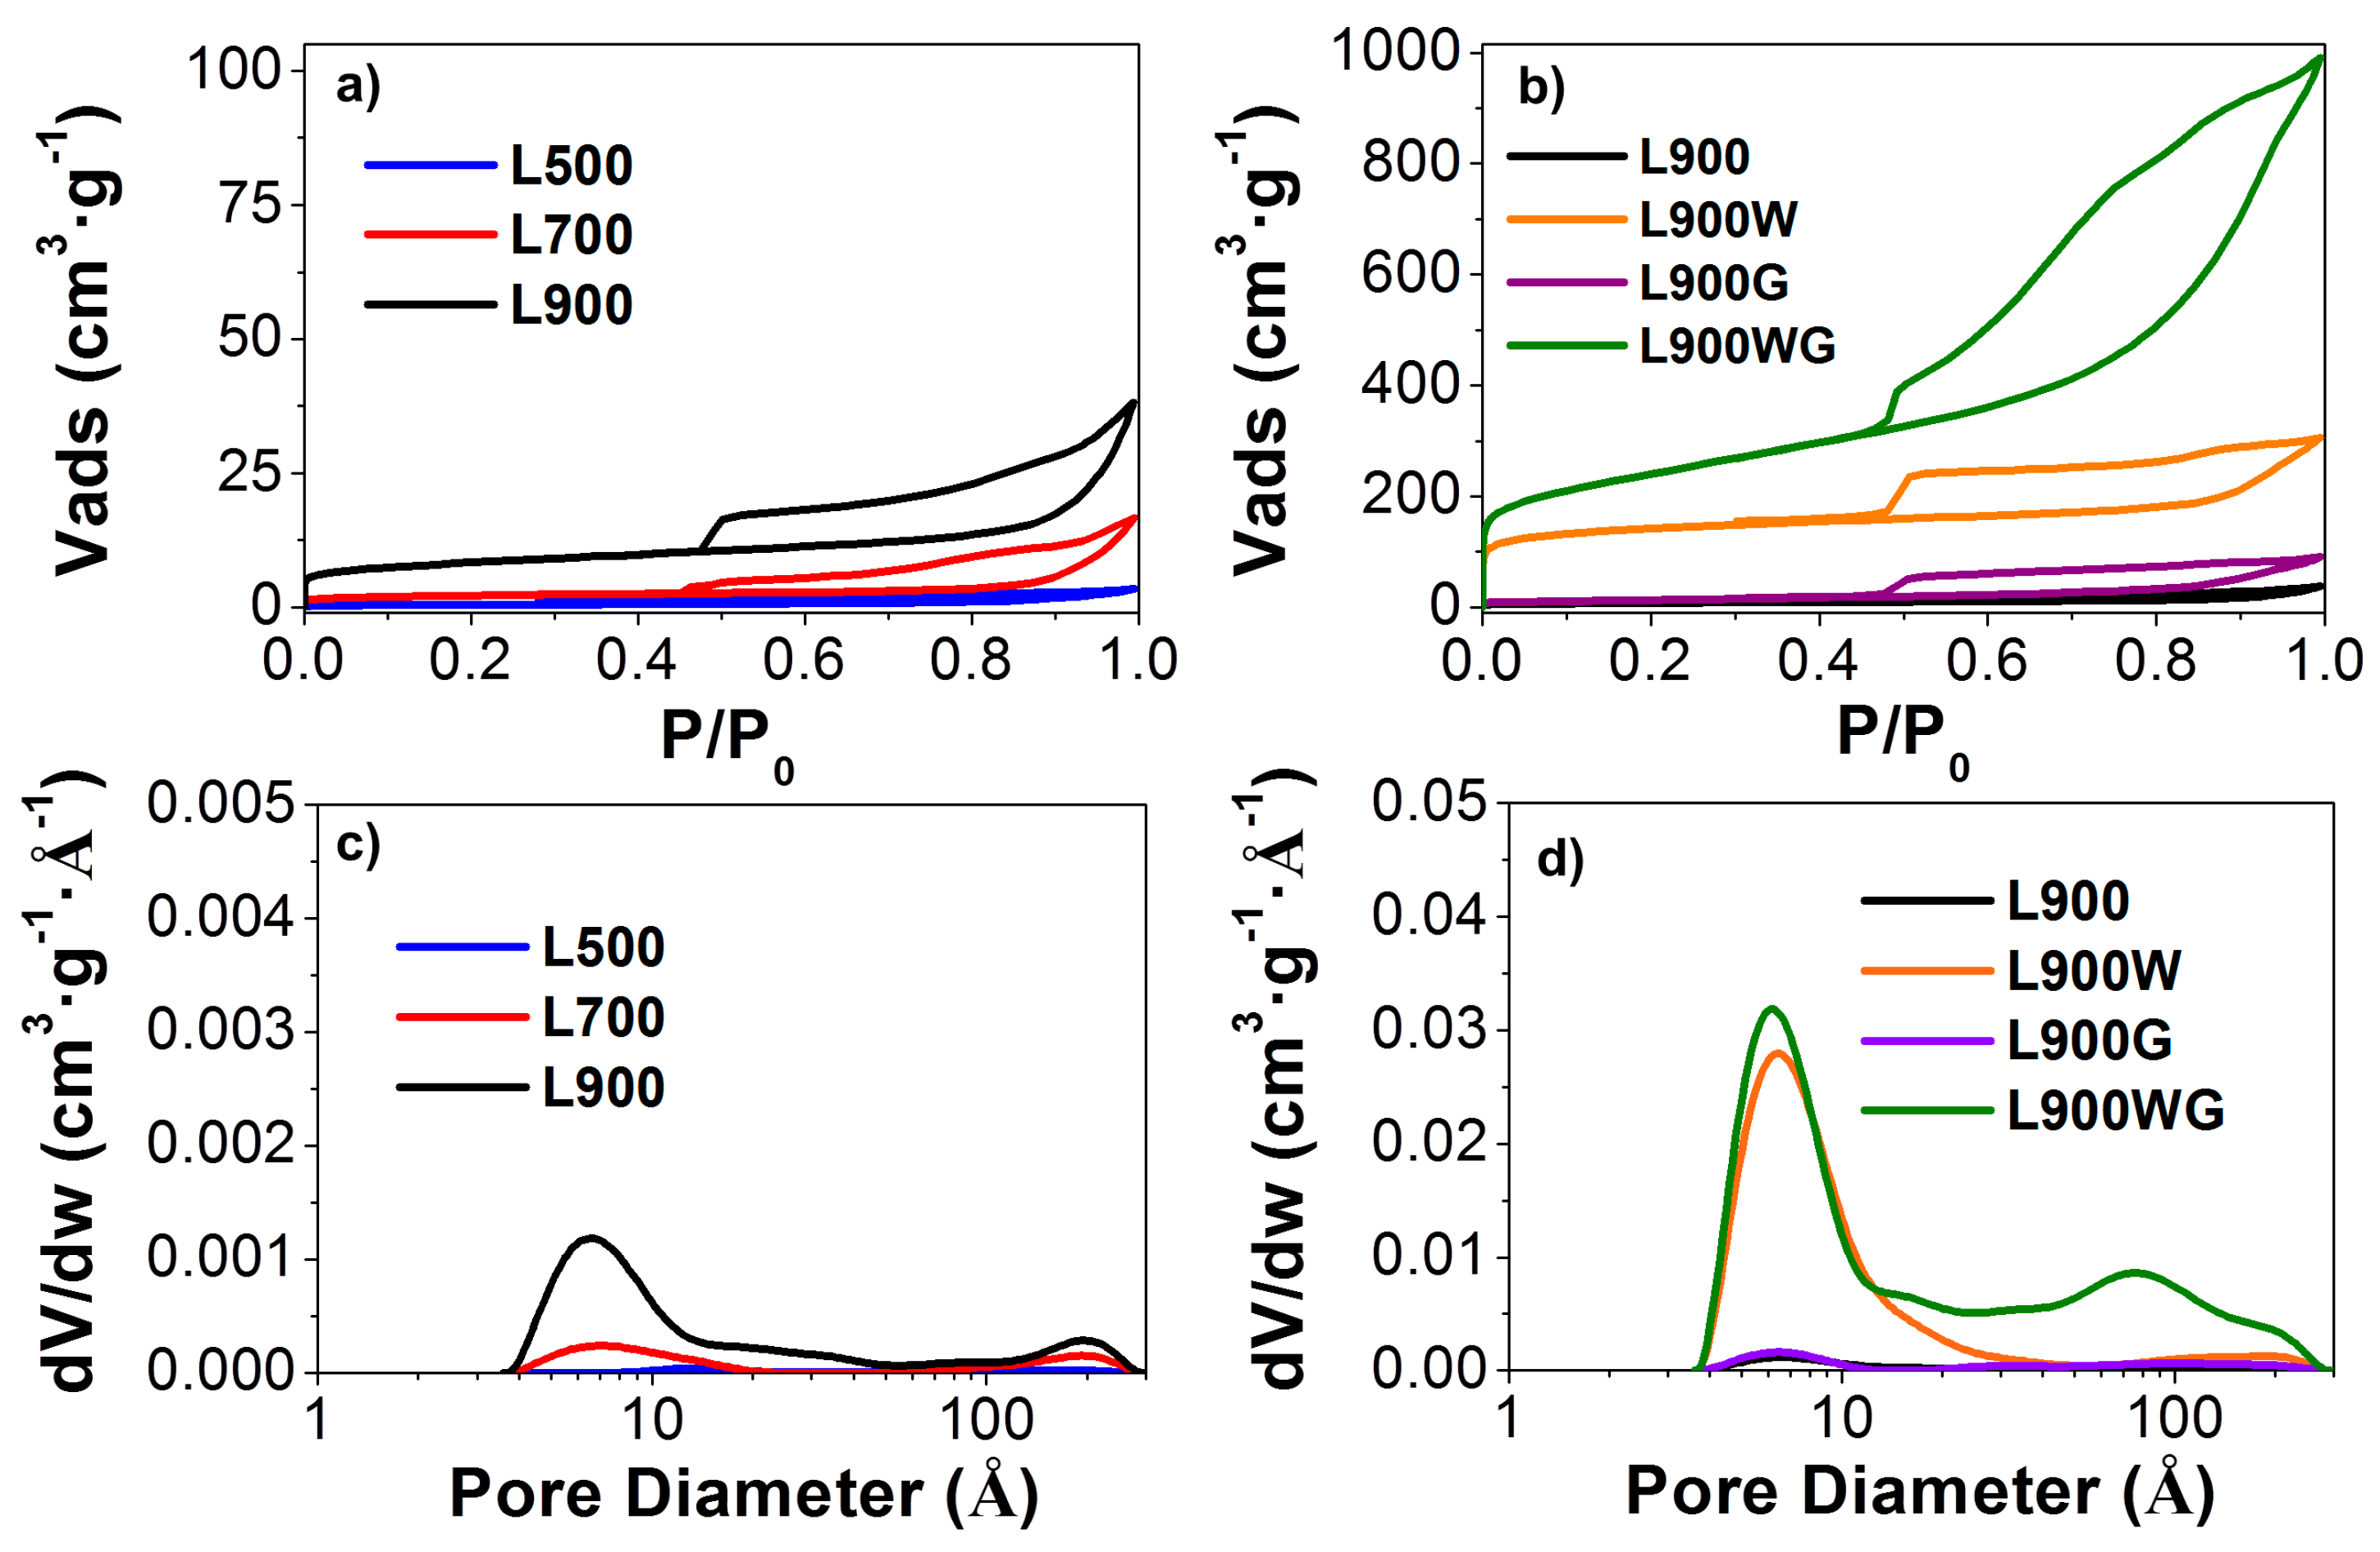
2.1.1. Textural Properties
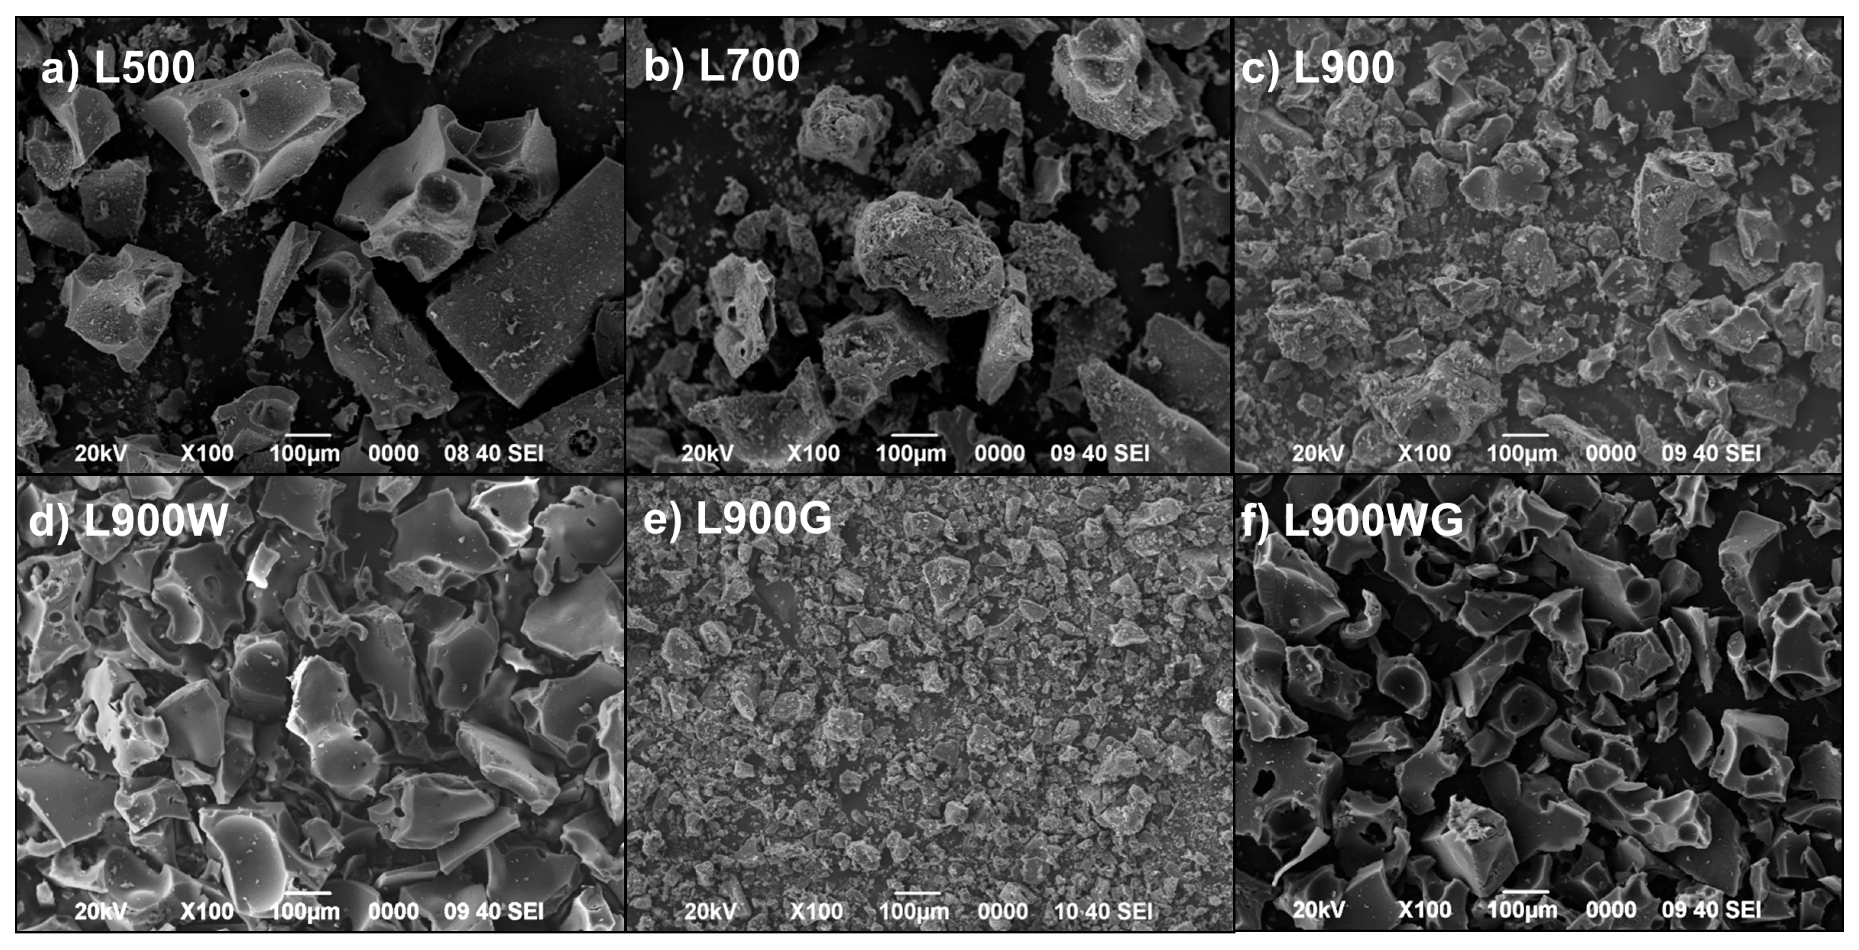
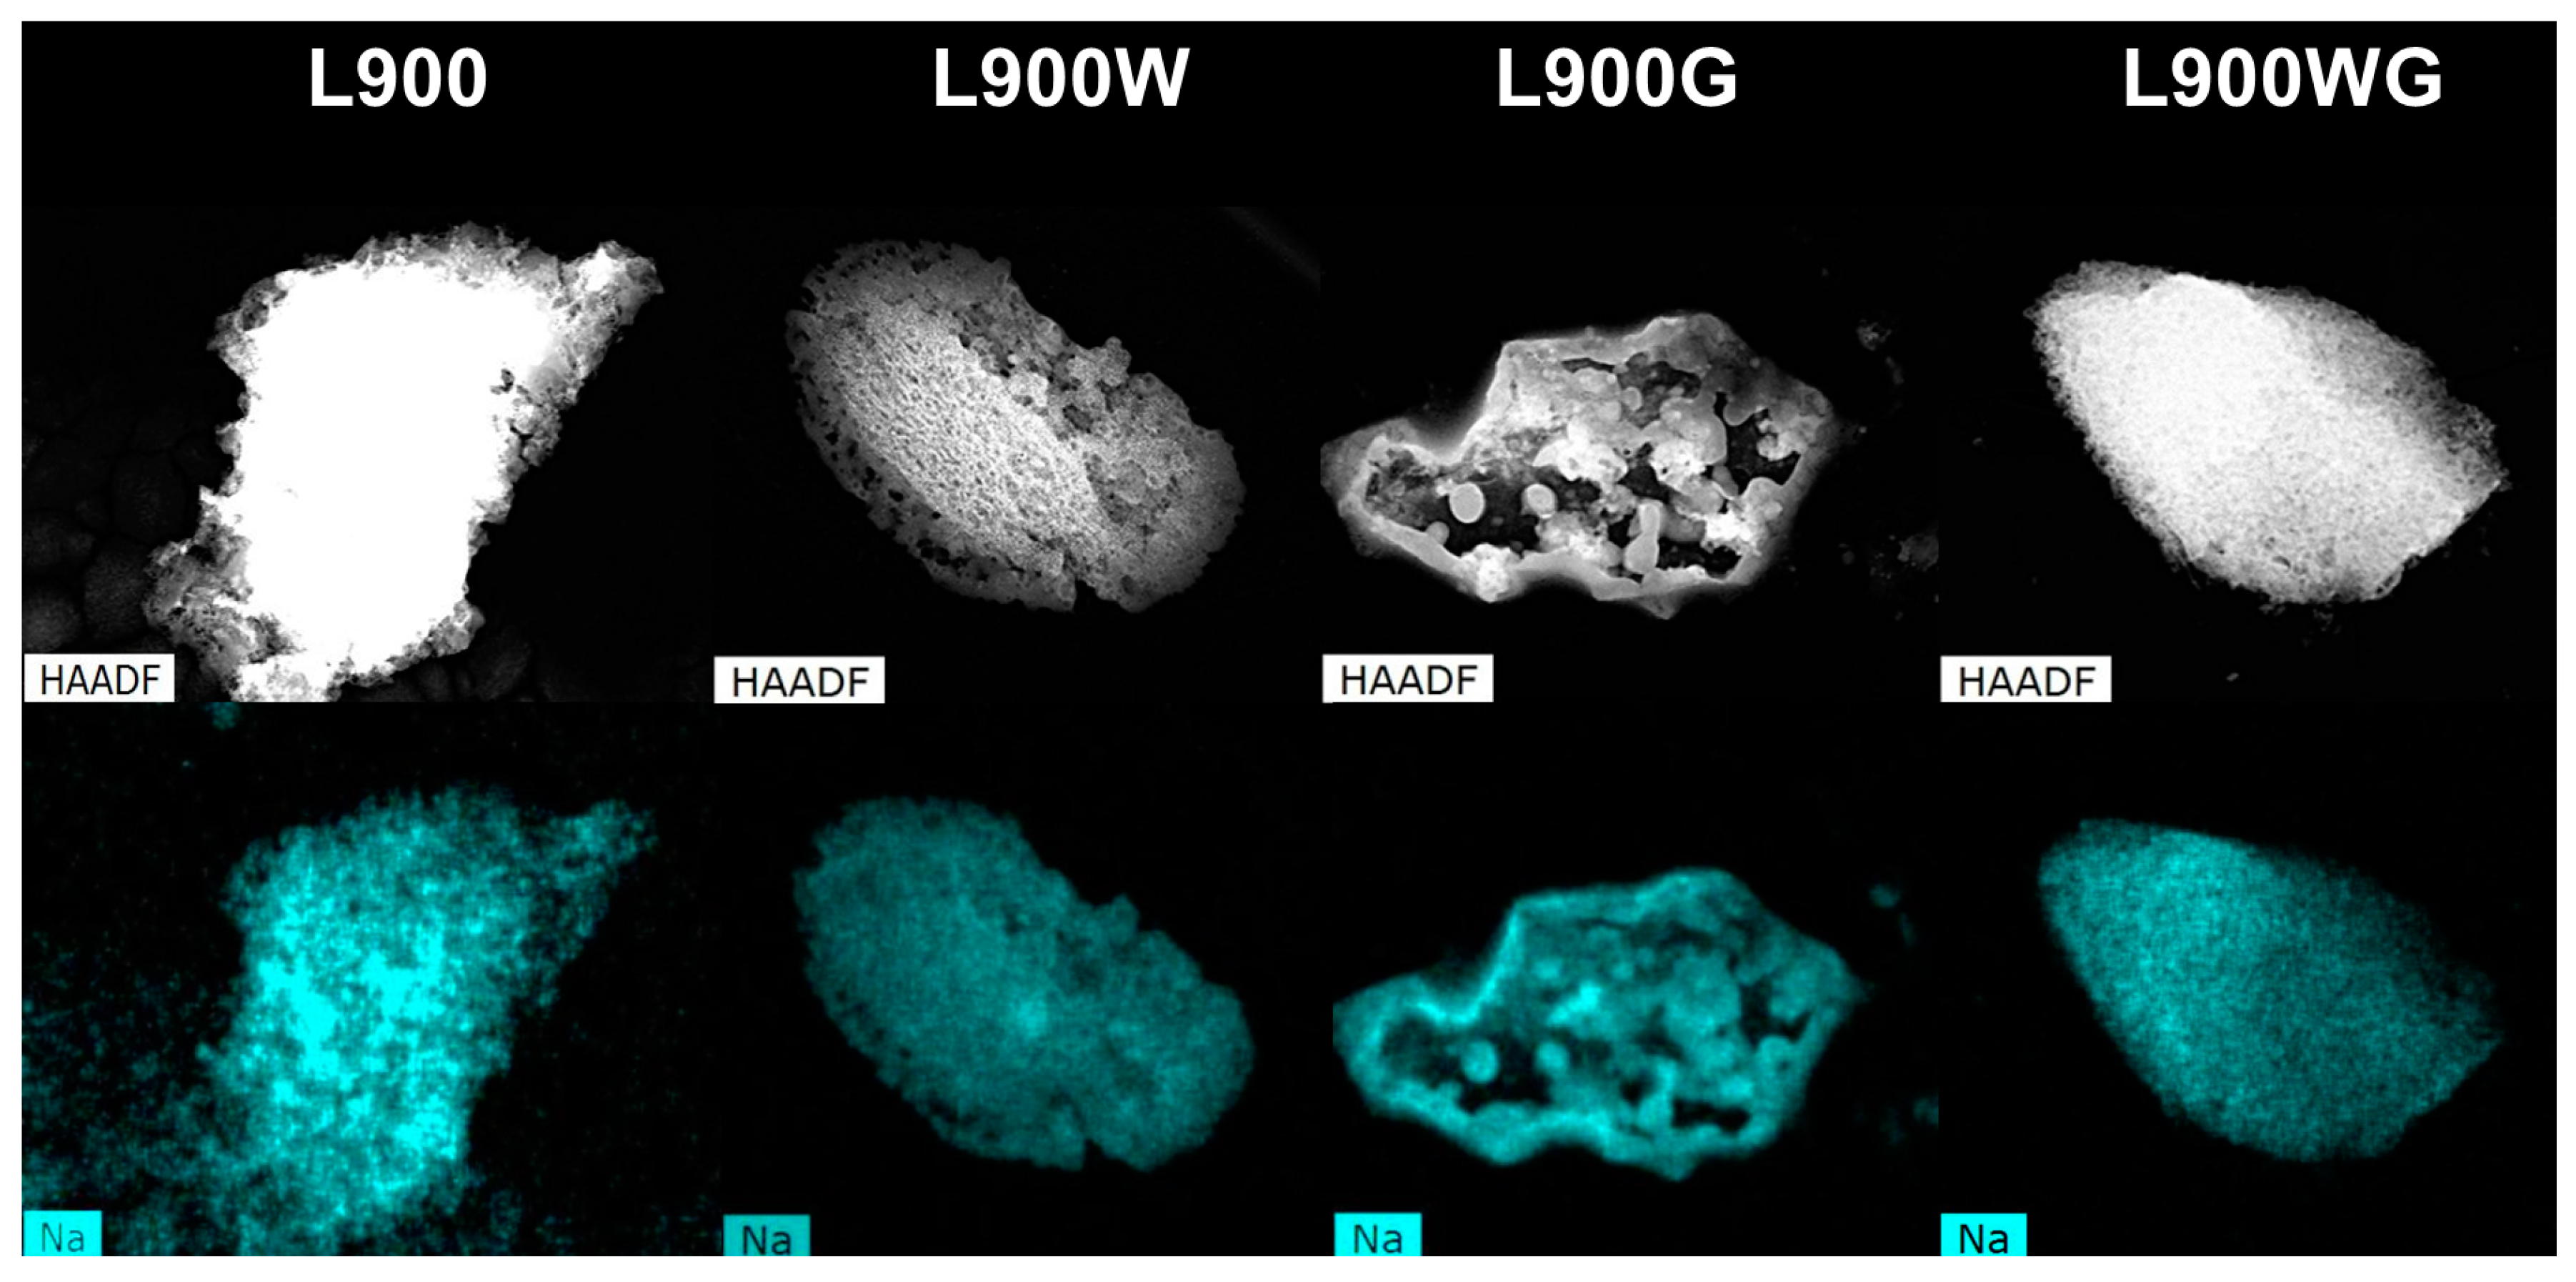
2.1.2. Surface Morphology
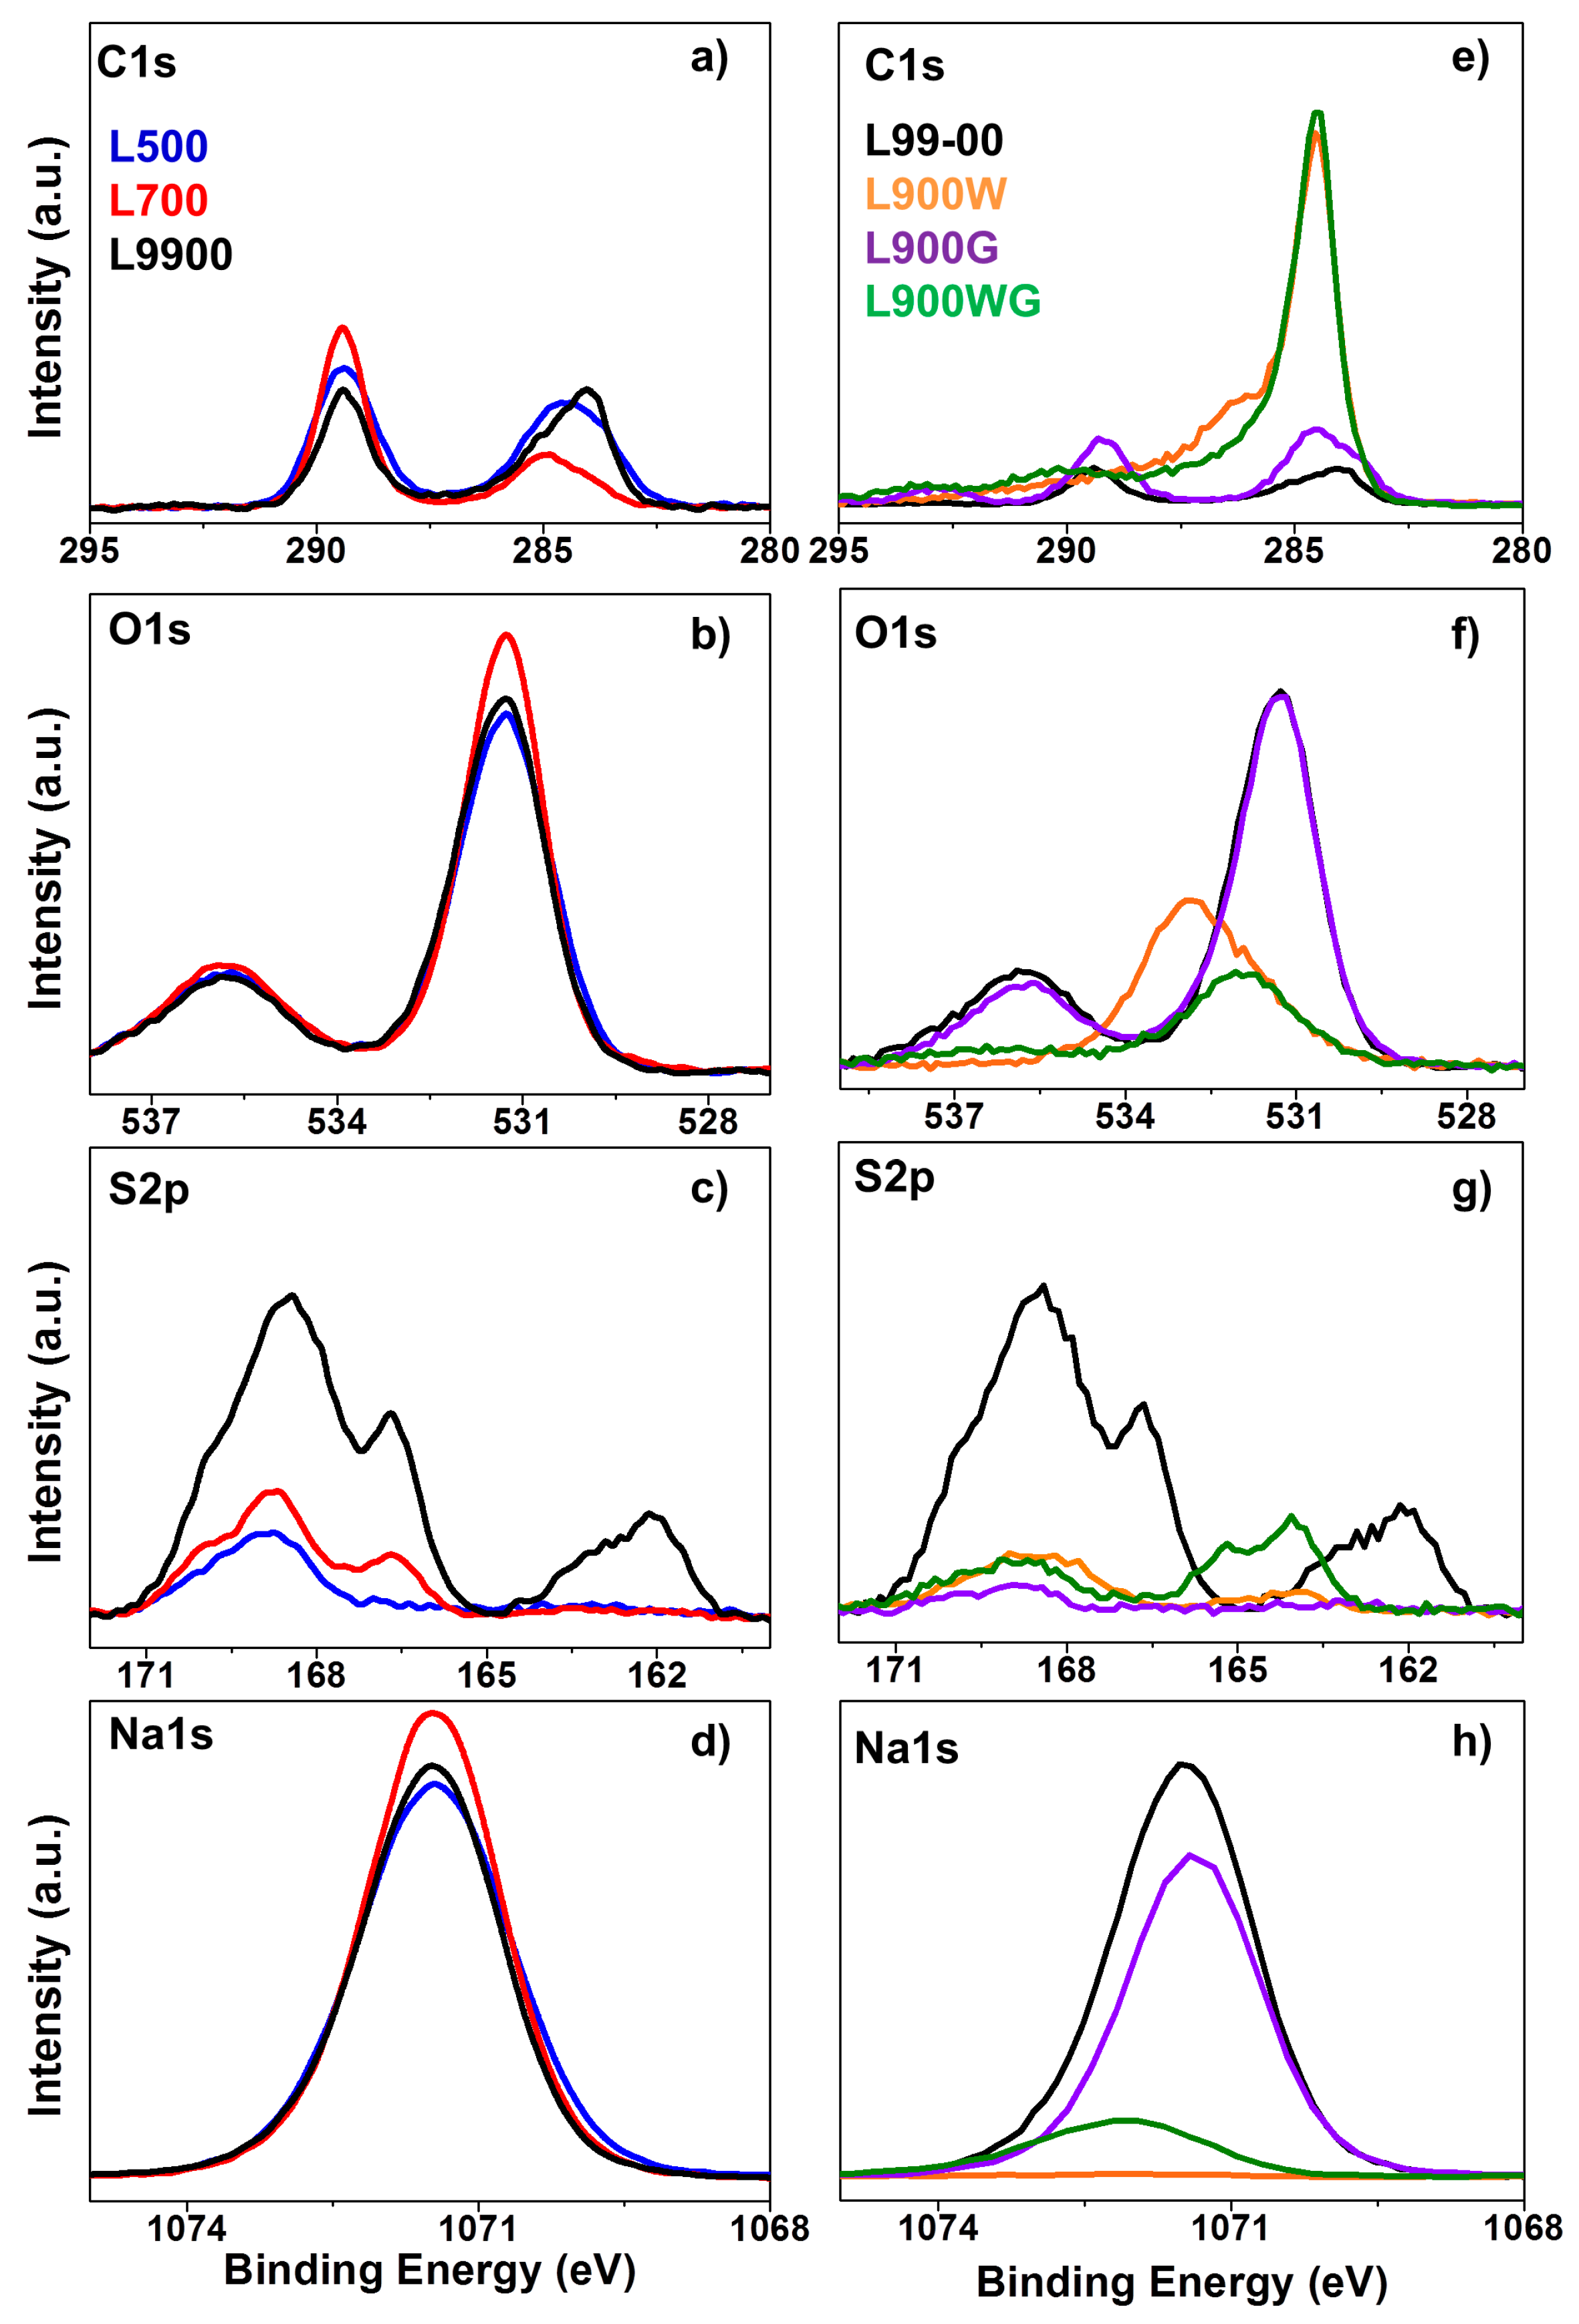
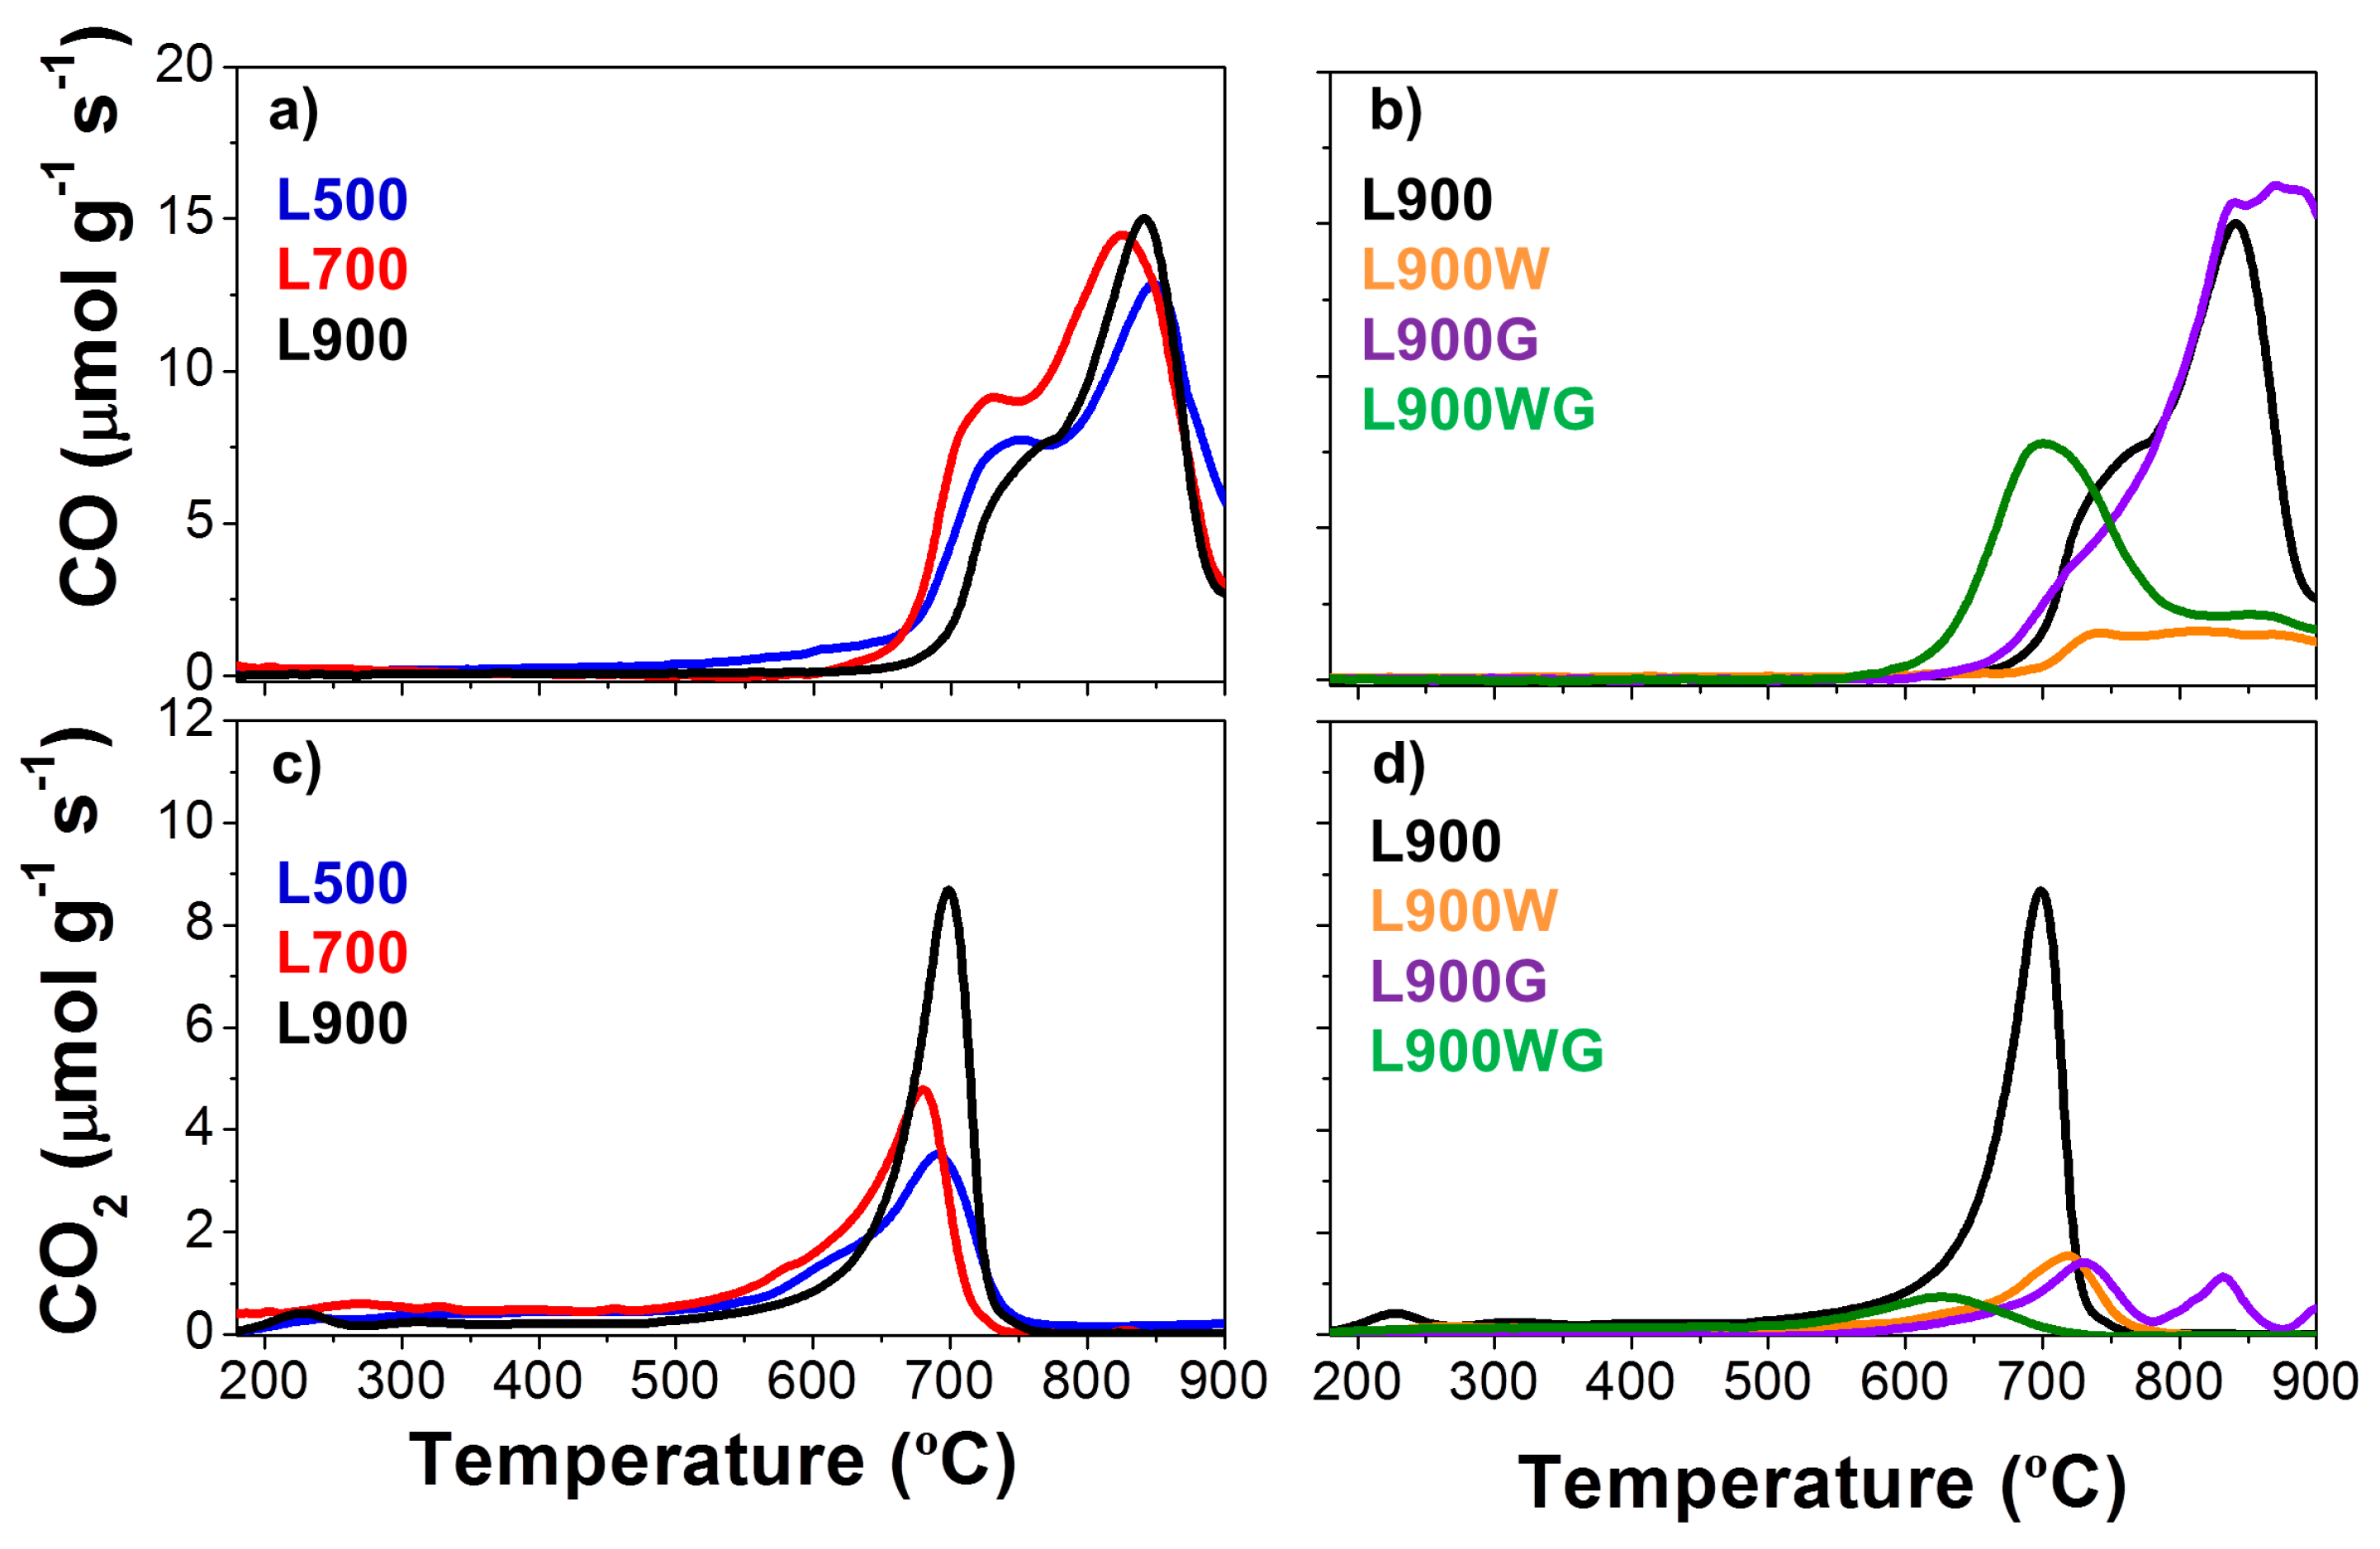
2.1.3. Surface Chemistry
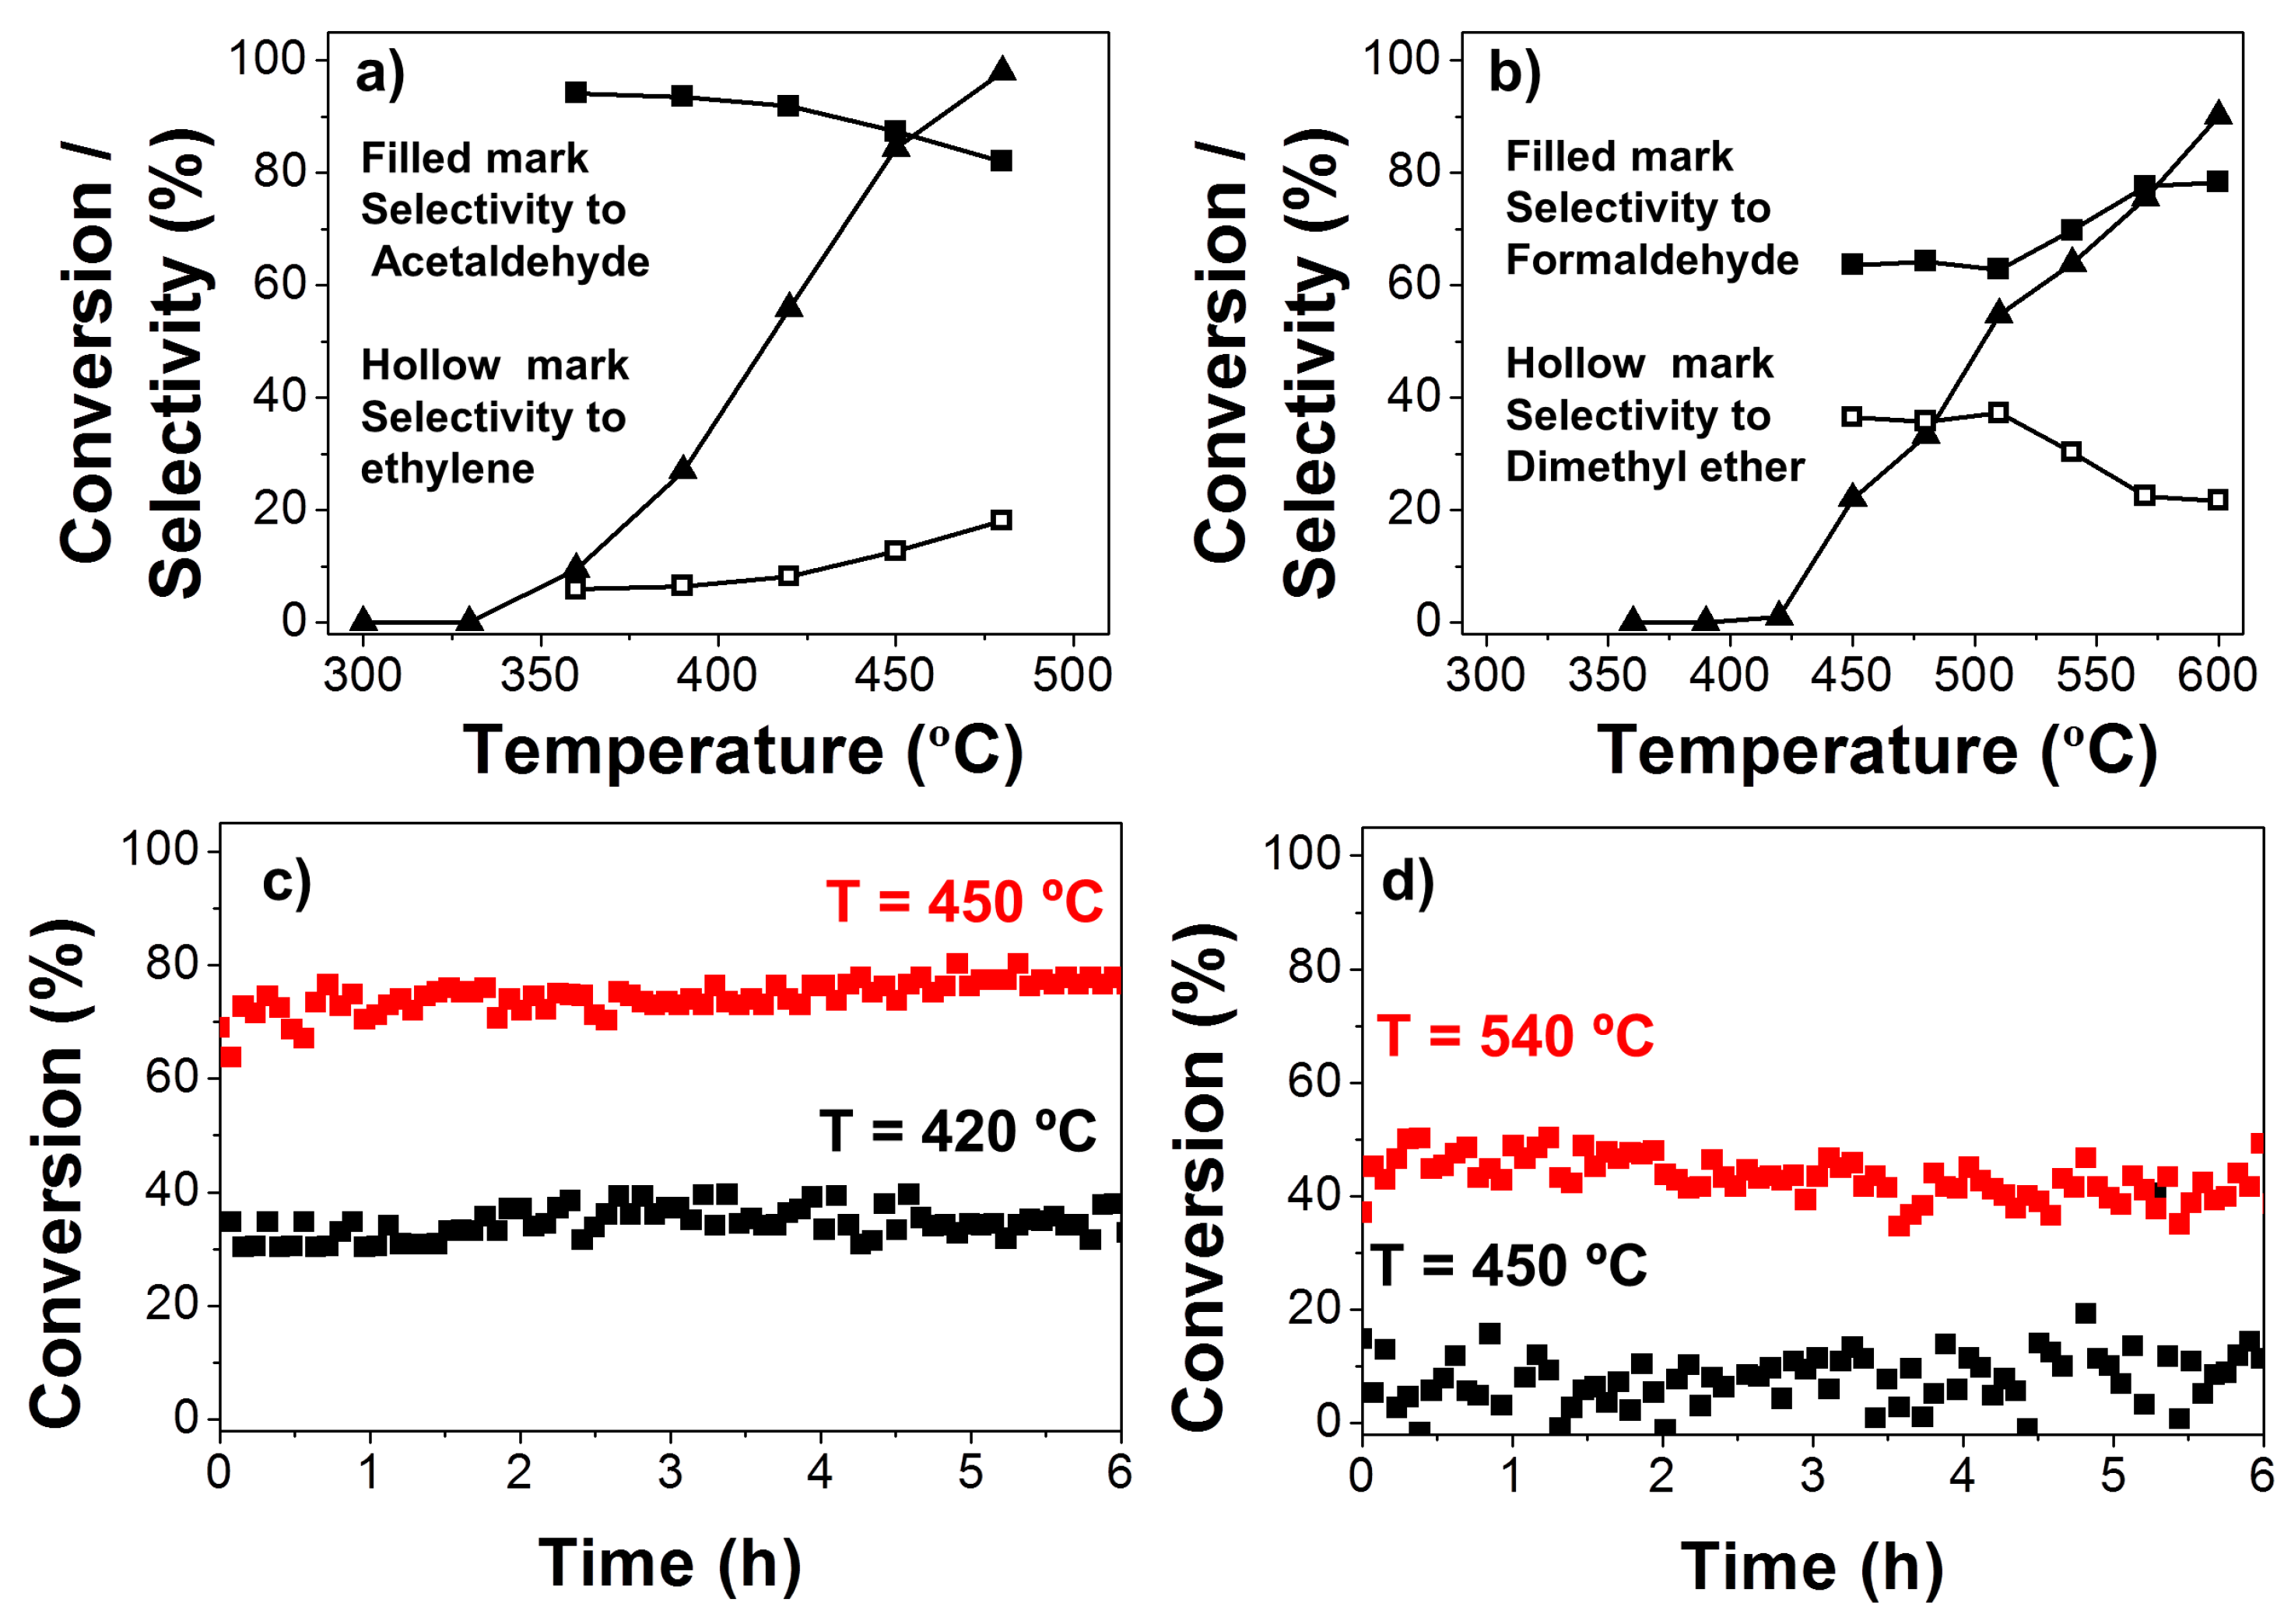
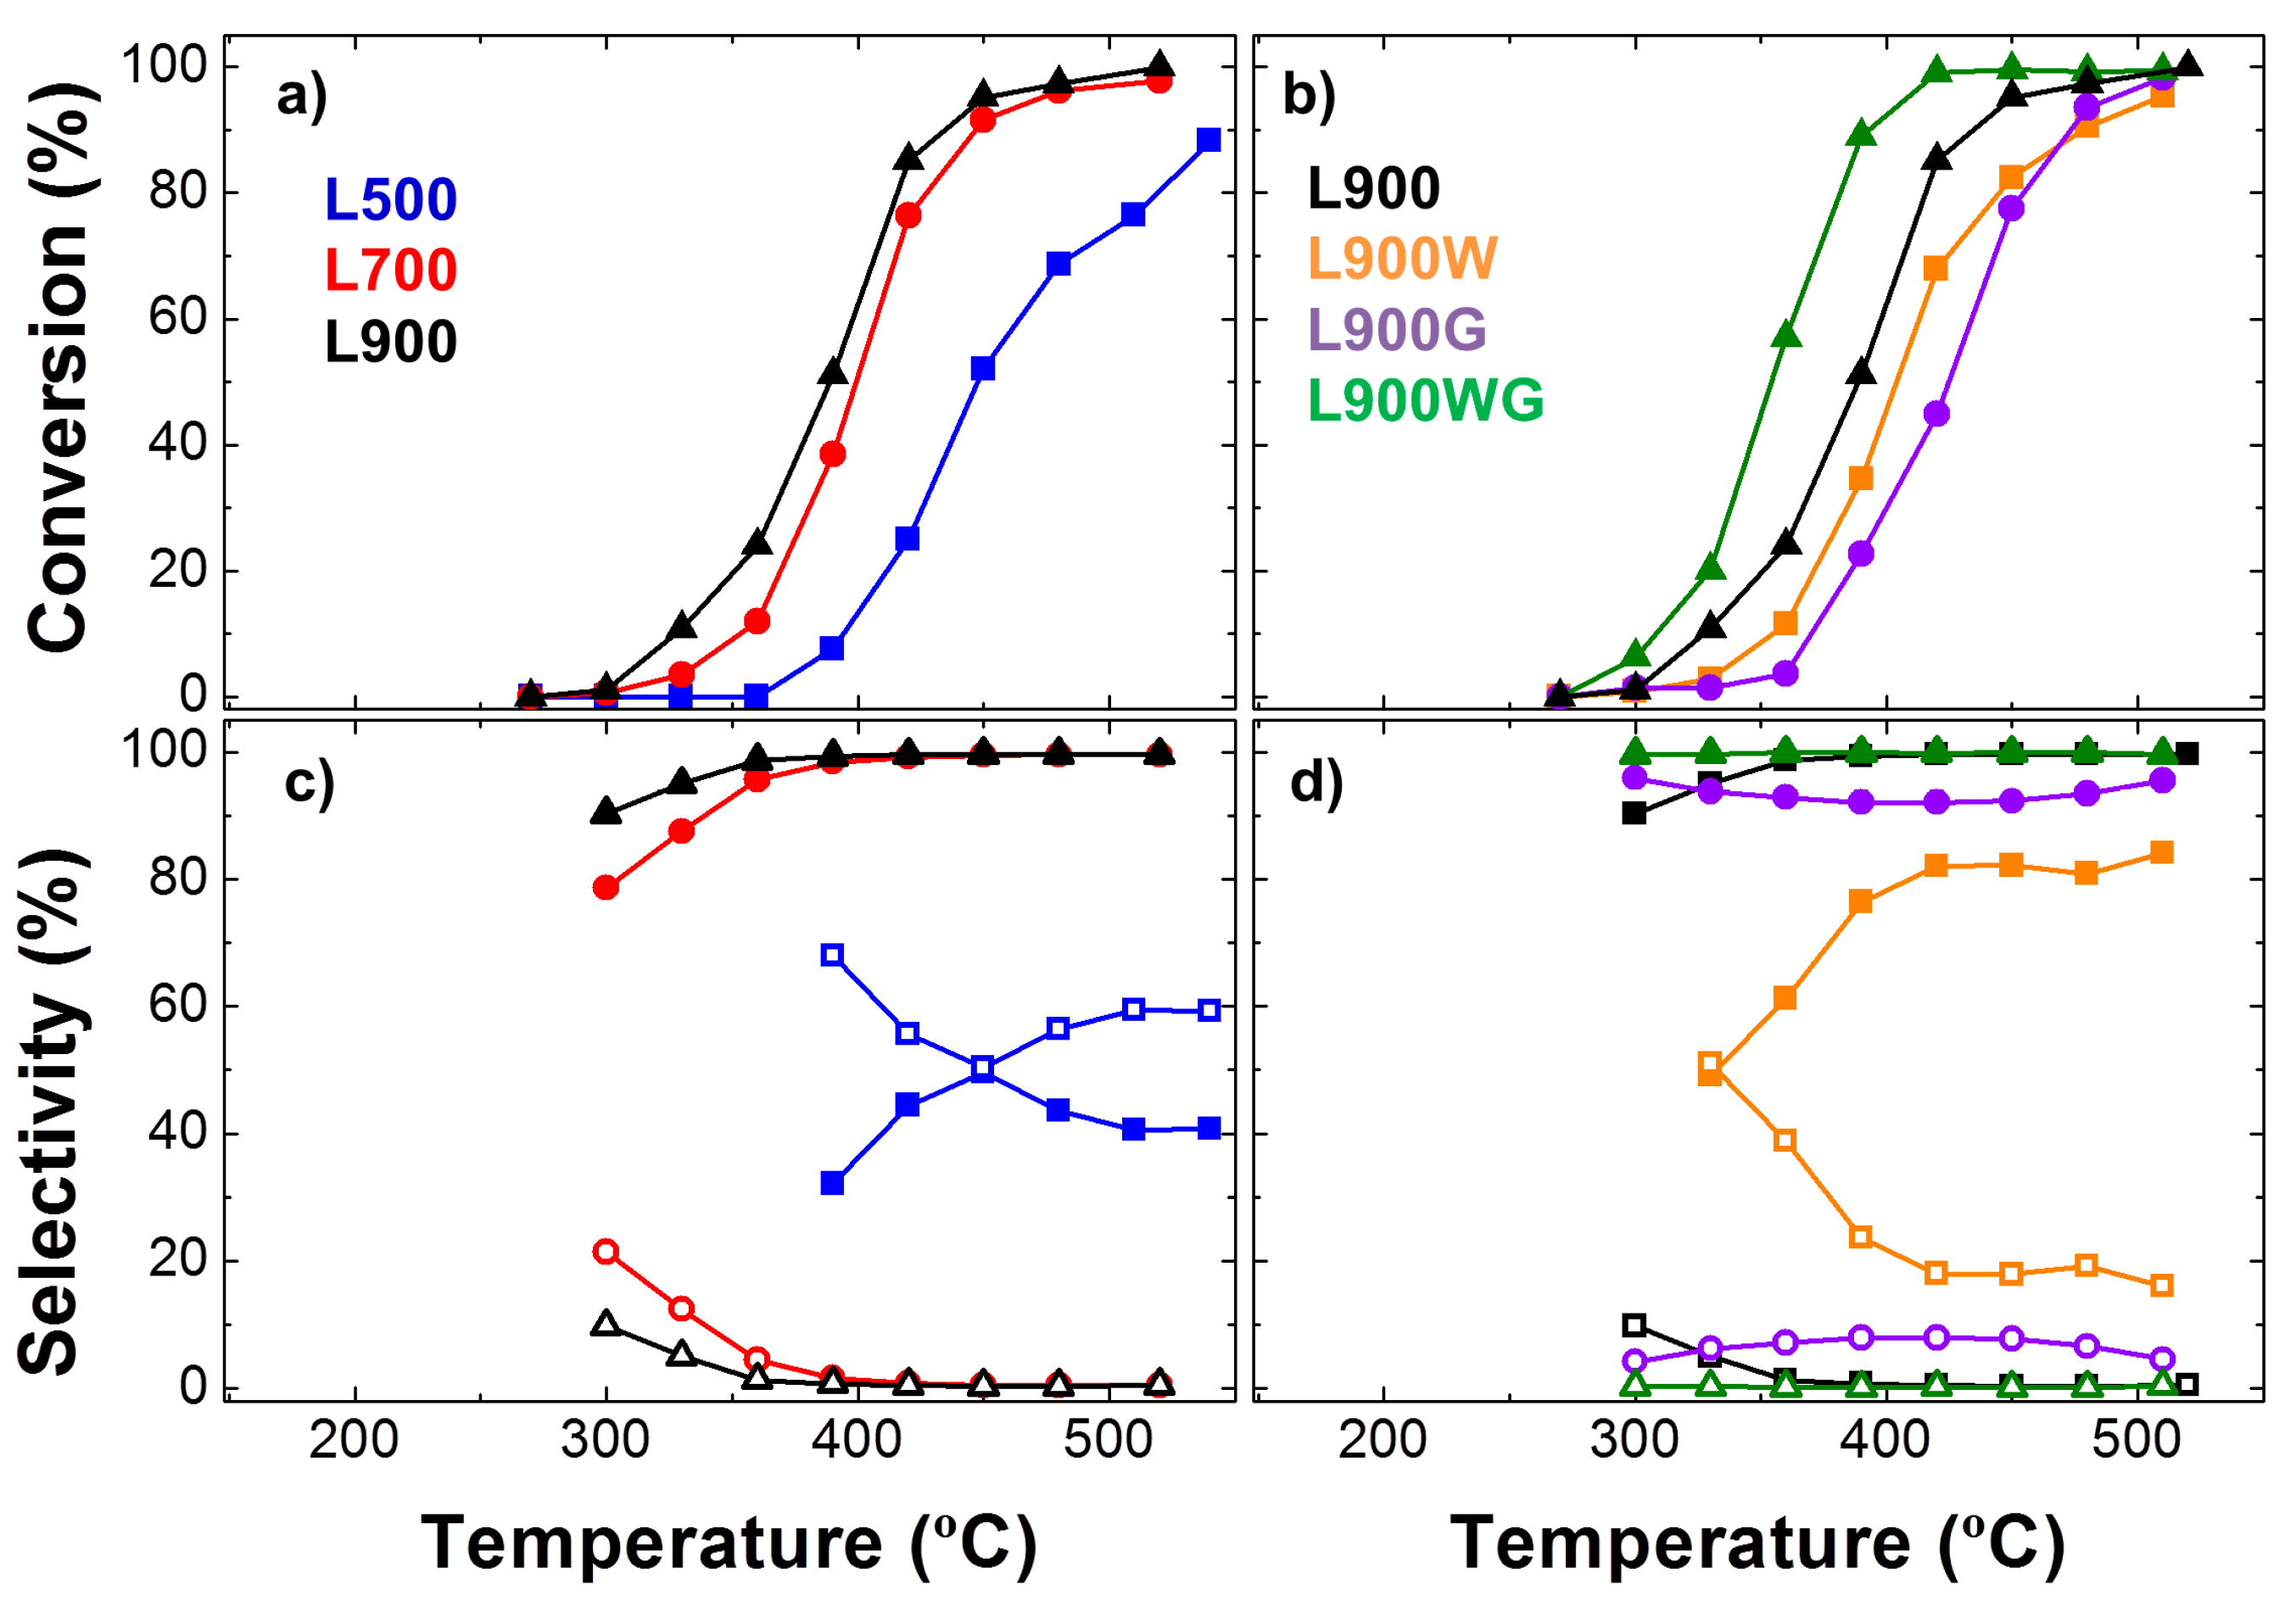
2.1.4. Catalytic Activity
3. Materials and Methods
3.1. Catalyst Preparation
3.2. Catalyst Characterization
3.3. Alcohol Dehydration
4. Conclusions
Acknowledgments
Author Contributions
Conflicts of Interest
References
- Chen, H.Z. Biotechnology of Lignocellulose: Theory and Practice; Chemical Industry Press: Beijing, China; Springer: Dordrecht, The Netherlands, 2014; ISBN 978-9-4-0076897-0. [Google Scholar]
- Production of Biofuels and Chemicals from Lignin; Zhen, F.; Richard, L.S., Jr. (Eds.) Springer: Berlin, Germany, 2016; ISBN 978-981-10-1964-7. [Google Scholar]
- Handbook of Composites from Renewable Materials, Structure and Chemistry; Vijay, K.T.; Manju, K.T.; Michael, R.K. (Eds.) Wiley: Hoboken, NJ, USA, 2017. [Google Scholar]
- Rosas, J.M.; Berenguer, R.; Valero-Romero, M.J.; Rodriguez-Mirasol, J.; Cordero, T. Preparation of different carbon materials by thermochemical conversion of lignin. Front. Mater. 2014, 1, 1–17. [Google Scholar] [CrossRef]
- Rodríguez, J.J.; Cordero, T.; Rodríguez-Mirasol, J. Carbon Materials from Lignin and Their Applications. In Production of Biofuels and Chemicals from Lignin; Zh, F., Richard, L.S., Jr., Eds.; Springer: Berlin, Germany, 2016; Chapter 8; ISBN 978-981-10-1964-7. [Google Scholar]
- Rodríguez-Mirasol, J.; Cordero, T.; Rodríguez, J.J. Preparation and characterization of activated carbons from eucalyptus kraft-lignin. Carbon 1993, 31, 87–95. [Google Scholar] [CrossRef]
- Rodríguez-Mirasol, J.; Cordero, T.; Rodríguez, J.J. Activated carbons from CO2 partial gasification of eucalyptus kraft lignin. Energy Fuel 1993, 7, 133–138. [Google Scholar] [CrossRef]
- Gonzalez-Serrano, E.; Cordero, T.; Rodriguez-Mirasol, J.; Rodrıguez, J.J. Development of porosity upon chemical activation of kraft lignin with ZnCl2. Ind. Eng. Chem. Res. 1997, 36, 4832–4838. [Google Scholar] [CrossRef]
- Gonzalez-Serrano, E.; Cordero, T.; Rodriguez-Mirasol, J.; Cotoruelo, L.M.; Rodrıguez, J.J. Removal of water pollutants with activated carbons prepared from H3PO4 activation of lignin from kraft black liquors. Water Res. 2004, 38, 3043–3050. [Google Scholar] [CrossRef] [PubMed]
- Cotoruelo, L.M.; Marques, M.D.; Diaz, F.J.; Rodriguez-Mirasol, J.; Rodriguez, J.J.; Cordero, T. Adsorbent ability of lignin-based activated carbons for the removal of p-nitrophenol from aqueous solutions. Chem. Eng. J. 2012, 184, 176–183. [Google Scholar] [CrossRef]
- Bedia, J.; Rosas, J.M.; Rodriguez-Mirasol, J.; Cordero, T. Pd supported on mesoporous activated carbons with high oxidation resistance as catalysts for toluene oxidation. Appl. Catal. B Environ. 2010, 94, 8–18. [Google Scholar] [CrossRef]
- Guillen, E.; Rico, R.; Lopez-Romero, J.M.; Bedia, J.; Rosas, J.M.; Rodriguez-Mirasol, J.; Cordero, T. Pd-activated carbon catalysts for hydrogenation and Suzuki reactions. Appl. Catal. A Gen. 2009, 368, 113–120. [Google Scholar] [CrossRef]
- Rodríguez-Mirasol, J.; Cordero, T.; Rodriguez, J.J. High temperature carbons from lignin. Carbon 1996, 34, 43–52. [Google Scholar] [CrossRef]
- Valero-Romero, M.J.; Márquez-Franco, E.M.; Bedia, J.; Rodríguez-Mirasol, J.; Cordero, T. Hierarchical porous carbons by liquid phase impregnation of zeolite templates with lignin solution. Microporous Mesoporous Mater. 2014, 196, 68–78. [Google Scholar] [CrossRef]
- Ruiz-Rosas, R.; Valero-Romero, M.J.; Salinas-Torres, D.; Rodríguez-Mirasol, J.; Cordero, T.; Morallón, E.; Cazorla-Amorós, D. Electrochemical performance of hierarchical porous carbon materials obtained from the infiltration of lignin into zeolite templates. ChemSusChem 2014, 7, 1458–1467. [Google Scholar] [CrossRef] [PubMed]
- Lallave, M.; Bedia, J.; Ruiz-Rosas, R.; Rodriguez-Mirasol, J.; Cordero, T.; Otero, J.C.; Marquez, A.; Barrero, A.; Loscertales, I.G. Filled and hollow carbon nanofibers by coaxial electrospinning of Alcell lignin without binder polymers. Adv. Mater. 2007, 19, 4292–4296. [Google Scholar] [CrossRef]
- Ruiz-Rosas, R.; Bedia, J.; Lallave, M.; Loscertales, I.G.; Barrero, A.; Rodriguez-Mirasol, J.; Cordero, T. The production of submicron diameter carbon fibers by the electrospinning of lignin. Carbon 2010, 48, 696–705. [Google Scholar] [CrossRef]
- Berenguer, R.; García-Mateos, F.J.; Ruiz-Rosas, R.; Cazorla-Amorós, D.; Morallon, E.; Rodriguez-Mirasol, J.; Cordero, T. Biomass-derived binderless fibrous carbon electrodes for ultrafast energy storage. Green Chem. 2016, 18, 1506–1515. [Google Scholar] [CrossRef]
- García-Mateos, F.J.; Cordero-Lanzac, T.; Berenguer, R.; Morallón, E.; Cazorla-Amorós, D.; Rodríguez-Mirasol, J.; Cordero, T. Lignin-derived Pt supported carbon (submicron) fiber electrocatalystsfor alcohol electro-oxidation. Appl. Catal. B Environ. 2017, 211, 18–30. [Google Scholar] [CrossRef]
- Bedia, J.; Rosas, J.M.; Marquez, J.; Rodriguez-Mirasol, J.; Cordero, T. Preparation and characterization of carbon based acid catalysts for the dehydration of 2-propanol. Carbon 2009, 47, 286–294. [Google Scholar] [CrossRef]
- Bedia, J.; Ruiz-Rosas, R.; Rodríguez-Mirasol, J.; Cordero, T. A kinetic study of 2-propanol dehydration on carbon acid catalysts. J. Catal. 2010, 271, 33–42. [Google Scholar] [CrossRef]
- Bedia, J.; Ruiz-Rosas, R.; Rodríguez-Mirasol, J.; Cordero, T. Kinetic study of the decomposition of 2-butanol on carbon- based acid catalyst. AIChE J. 2010, 56, 1557–1568. [Google Scholar] [CrossRef]
- Rosas, J.M.; Bedia, J.; Rodríguez-Mirasol, J.; Cordero, T. On the preparation and characterization of chars and activated carbons from orange skin. Fuel Process. Technol. 2010, 91, 1345–1354. [Google Scholar] [CrossRef]
- Rodríguez-Reinoso, F.; Garrido, J.; Martín-Martínez, J.M.; Molina-Sabio, M.; Torregrosa, M. The combined use of different approaches in the characterization of microporous carbons. Carbon 1989, 27, 23–32. [Google Scholar] [CrossRef]
- Rosas, J.M.; Ruiz-Rosas, R.; Rodríguez-Mirasol, J.; Cordero, T. Kinetic study of the oxidation resistance of phosphorus-containing activated carbons. Carbon 2012, 50, 1523–1537. [Google Scholar] [CrossRef]
- Zhubrikov, A.V.; Legurova, E.A.; Gutkin, V.; Uvarov, V.; Khitrov, N.V.; Lev, O.; Tripol’skaya, T.A.; Prikhodchenko, P.V. XPS characterization of sodium percarbonate granulated with sodium silicate. Russ. J. Inorg. Chem. 2009, 54, 1455–1458. [Google Scholar] [CrossRef]
- Bansal, R.C.; Donnet, J.B.; Stoeckli, H.F. Active Carbon; Marcel Dekker: New York, NY, USA, 1988. [Google Scholar]
- Figueiredo, J.L.; Pereira, M.F.R.; Freitas, M.M.A.; Orfao, J.J.M. Modification of the surface chemistry of activated carbons. Carbon 1999, 37, 1379–1389. [Google Scholar] [CrossRef]
- Nevskaia, D.M.; Santianes, A.; Muñoz, V.; Guerrero-Ruiz, A. Interaction of aqueous solutions of phenol with commercial activated carbon: An adsorption and kinetic study. Carbon 1999, 37, 1065–1074. [Google Scholar] [CrossRef]
- Bedia, J.; Rodriguez-Mirasol, J.; Cordero, T. Water vapour adsorption on lignin-based activated carbons. J. Chem. Technol. Biotechnol. 2007, 82, 548–557. [Google Scholar] [CrossRef]
- Lillo-Ródenas, M.A.; Cazorla-Amorós, D.; Linares-Solano, A. Understanding chemical reactions between carbons and NaOH and KOH. An insight in to the chemical activation mechanism. Carbon 2003, 41, 267–275. [Google Scholar] [CrossRef]
- Bedia, J.; Barrionuevo, R.; Rodríguez-Mirasol, J.; Cordero, T. Ethanol dehydration to ethylene on acid carbon catalysts. Appl. Catal. B Environ. 2011, 103, 302–310. [Google Scholar] [CrossRef]
- Sato, A.G.; Volanti, D.P.; Meira, D.M.; Damyanova, S.; Longo, E.; Bueno, J.M.C. Effect of the ZrO2 phase on the structure and behavior of supported Cu catalysts for ethanol conversion. J. Catal. 2013, 307, 1–17. [Google Scholar] [CrossRef]
- Freitas, I.C.; Damyanova, S.; Oliveira, D.C.; Marques, C.M.P.; Bueno, J.M.C. Effect of Cu content on the surface and catalytic properties of Cu/ZrO2 catalyst for ethanol dehydrogenation. J. Mol. Catal. A Chem. 2014, 381, 26–37. [Google Scholar] [CrossRef]
- Qian, M.; Liauw, M.A.; Emig, G. Formaldehyde synthesis from methanol over silver catalysts. Appl. Catal. A Gen. 2003, 238, 211–222. [Google Scholar] [CrossRef]
- Ruiz-Rosas, R.; Bedia, J.; Rosas, J.M.; Lallave, M.; Loscertales, I.G.; Rodríguez-Mirasol, J.; Cordero, T. Methanol decomposition on electrospun zirconia nanofibers. Catal. Today 2012, 187, 77–87. [Google Scholar] [CrossRef]


| Catalysts | Preparation Yields (%) | Ash (%) | Ultimate Analysis (d.a.f.) | ||||
|---|---|---|---|---|---|---|---|
| C (%) | H (%) | N (%) | S (%) | O* (%) | |||
| L | -- | 16.9 | 40.6 | 5.1 | 0.1 | 3.5 | 50.7 |
| L500 | 60.5 | 28 | 62.6 | 1.7 | 0.3 | 6.5 | 28.9 |
| L700 | 53.2 | 30 | 62.6 | 0.7 | 0.3 | 5.9 | 30.5 |
| L900 | 38.0 | 31 | 61.6 | 0.4 | 0.3 | 7.2 | 30.5 |
| L900W | 18.0 | 4 | 78.6 | 1.0 | 0.3 | 3.2 | 16.9 |
| L900G | 21.3 (B.O. 44%) | 44 | 31.8 | 1.2 | 0.2 | 0.0 | 66.8 |
| L900WG | 7.8 (B.O. 57%) | 8 | 76.6 | 0.4 | 0.2 | 0.4 | 22.3 |
| Catalysts | N2 Isotherm | CO2 Isotherm | |||||
|---|---|---|---|---|---|---|---|
| ABET (m2 g−1) | At (m2 g−1) | Vt (cm3 g−1) | Vtot (cm3 g−1) | Vmes (cm3 g−1) | ADR (m2 g−1) | VDR (cm3 g−1) | |
| L500 | 2 | 2 | 0.000 | 0.005 | 0.005 | 214 | 0.086 |
| L700 | 8 | 3 | 0.002 | 0.026 | 0.024 | 173 | 0.069 |
| L900 | 30 | 12 | 0.009 | 0.059 | 0.050 | 48 | 0.019 |
| L900W | 528 | 83 | 0.194 | 0.474 | 0.280 | 471 | 0.189 |
| L900G | 48 | 46 | 0.002 | 0.140 | 0.138 | 18 | 0.007 |
| L900WG | 847 | 586 | 0.126 | 1.532 | 1.406 | 271 | 0.109 |
| Catalysts | XPS Surface Composition (wt %) | TPD | ||||
|---|---|---|---|---|---|---|
| C | O | S | Na | CO (mmol g−1) | CO2 (mmol g−1) | |
| L500 | 15.7 | 41.6 | 1.7 | 41.0 | 12.8 | 2.5 |
| L700 | 10.6 | 44.4 | 2.4 | 42.6 | 13.8 | 3.1 |
| L900 | 12.5 | 40.8 | 7.6 | 39.1 | 10.8 | 3.7 |
| L900W | 81.3 | 17.0 | 1.2 | 0.5 | 2.4 | 1.1 |
| L900G | 30.2 | 39.6 | 0.7 | 29.5 | 15.4 | 1.2 |
| L900WG | 79.9 | 12.0 | 2.1 | 6.0 | 6.9 | 0.8 |
© 2017 by the authors. Licensee MDPI, Basel, Switzerland. This article is an open access article distributed under the terms and conditions of the Creative Commons Attribution (CC BY) license (http://creativecommons.org/licenses/by/4.0/).
Share and Cite
García-Mateos, F.J.; Moulefera, I.; Rosas, J.M.; Benyoucef, A.; Rodríguez-Mirasol, J.; Cordero, T. Alcohol Dehydrogenation on Kraft Lignin-Derived Chars with Surface Basicity. Catalysts 2017, 7, 308. https://doi.org/10.3390/catal7100308
García-Mateos FJ, Moulefera I, Rosas JM, Benyoucef A, Rodríguez-Mirasol J, Cordero T. Alcohol Dehydrogenation on Kraft Lignin-Derived Chars with Surface Basicity. Catalysts. 2017; 7(10):308. https://doi.org/10.3390/catal7100308
Chicago/Turabian StyleGarcía-Mateos, Francisco J., Imane Moulefera, Juana M. Rosas, Abdelghani Benyoucef, José Rodríguez-Mirasol, and Tomás Cordero. 2017. "Alcohol Dehydrogenation on Kraft Lignin-Derived Chars with Surface Basicity" Catalysts 7, no. 10: 308. https://doi.org/10.3390/catal7100308
APA StyleGarcía-Mateos, F. J., Moulefera, I., Rosas, J. M., Benyoucef, A., Rodríguez-Mirasol, J., & Cordero, T. (2017). Alcohol Dehydrogenation on Kraft Lignin-Derived Chars with Surface Basicity. Catalysts, 7(10), 308. https://doi.org/10.3390/catal7100308