2. Results and Discussion
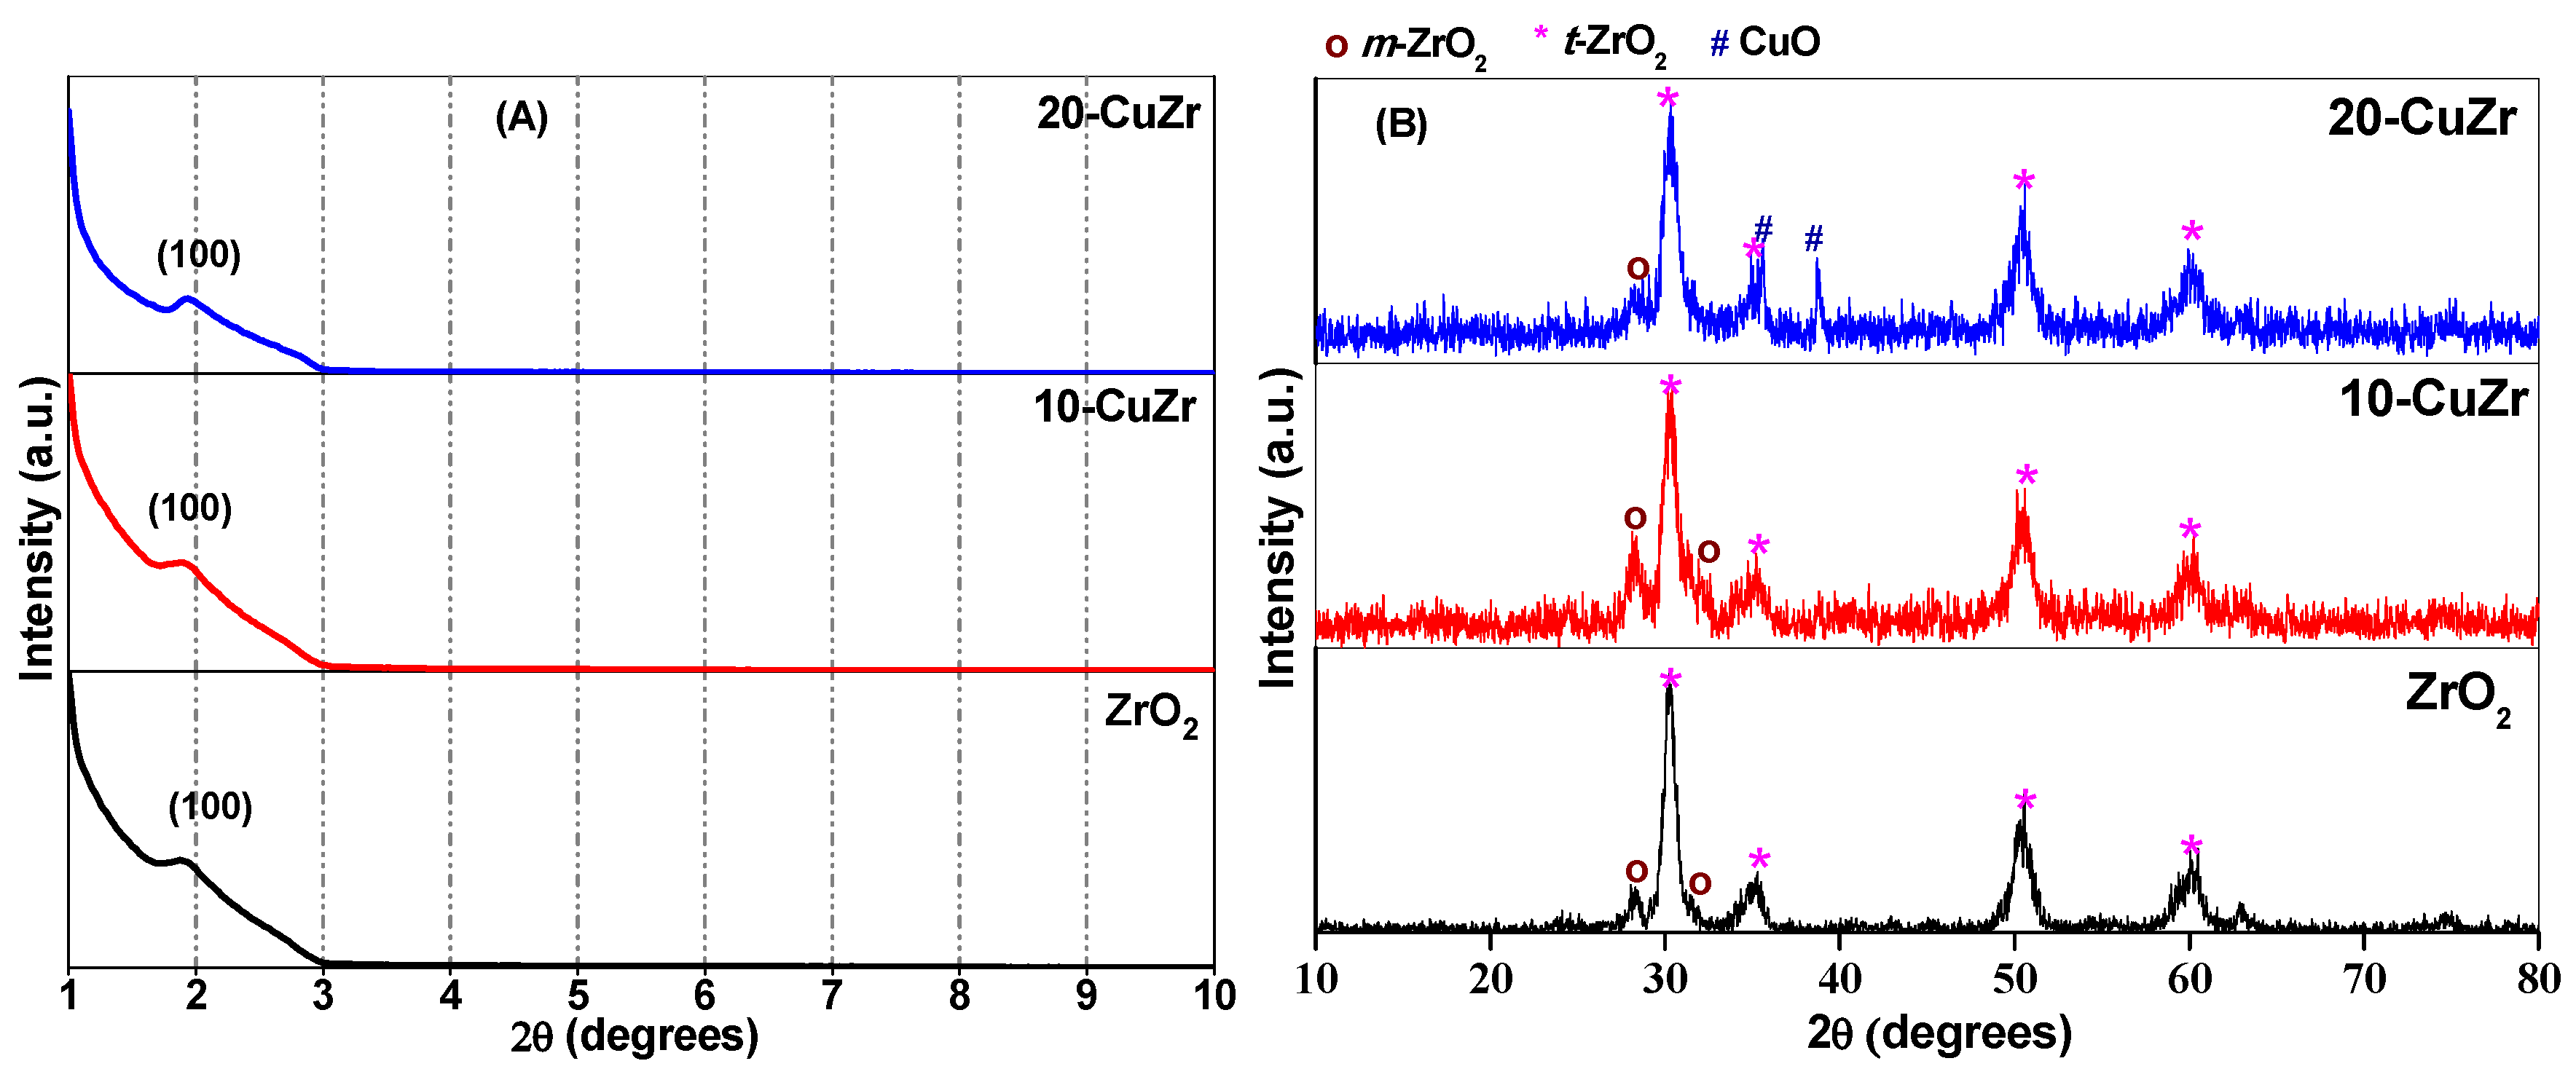
The low angle XRD patterns were obtained for bare ZrO
2 and CuO-ZrO
2 nanocomposite samples in order to record the mesoporous nature of the materials. As observed in
Figure 1A, ZrO
2 sample show well-defined and relatively broad diffraction peaks centered at 2θ of 2°, which indicates the presence of mesopores in the pure ZrO
2 support. It is known that XRD reflections appear at low angles due to regular separation between single channel walls [
21]. The presence of low-angle XRD peak in both calcined CuO-ZrO
2 materials indicates that mesopores were preserved in these samples. The broad shape and lower intensity of the low angle diffraction peak for the samples suggests that the synthesized materials possessed mesopores with a small coherent domain size.
High angle XRD patterns of bare ZrO
2 support and calcined CuO-ZrO
2 nanocomposite samples are shown in
Figure 1B. Broad and intense diffraction peaks at 2θ = 30.2°, 35.2°, 50.6° and 60.2° corresponding to the tetragonal phase of ZrO
2 (JCPDS 80-0965) along with a minor peak at 2θ = 28.2° corresponding to major reflection of monoclinic ZrO
2 phase (JCPDS 37-1484) could be observed for bare ZrO
2 support. No reflections due to crystalline CuO phase were observed in XRD pattern of 10-CuZr sample, suggesting that CuO might be well dispersed on the surface of ZrO
2 support. There is a possibility that the absence of crystalline CuO reflections in the high angle XRD pattern for 10-CuZr sample as the particles might be less than 4 nm in size, which is below the detection range of XRD technique. In addition to the characteristic reflections of tetragonal and monoclinic ZrO
2 phases, reflections corresponding to crystalline CuO (tenorite) phase (JCPDS 48-1548) at 2θ = 35.5° and 38.7° were observed for 20-CuZr sample. Broad X-ray diffraction reflections are observed for all the samples, pointing to nanocrystalline nature of ZrO
2.
The change in the ZrO
2 phase with CuO loading was determined by calculating the volume percent of monoclinic and tetragonal ZrO
2 phases presented in the samples. We used the Equations (1) and (2) reported in the literature [
22] to calculate volume percent of monoclinic and tetragonal ZrO
2 phases.
where,
vm is volume fraction of the monoclinic phase and that of tetragonal phase is
vt = 1 −
vm and
Xm can be calculated by Equation (2)
where,
Im (
11) is the line intensity of the (
11) reflection (at 2θ = 28.2°) for the monoclinic phase (
m-ZrO
2) and
It (101) is the intensity of the reflection (101) (at 2θ = 30.2°) for tetragonal phase (
t-ZrO
2) of the synthesized samples.
The percentages of monoclinic and tetragonal phases were found to be 10.3% and 89.7% respectively for bare ZrO
2 support sample (
Table 1). It is interesting to note that, after impregnating 10 wt. % CuO, the volume percentage of monoclinic ZrO
2 phase increased to 27.4% and with further increase of CuO loading to 20 wt. %, it decreased to 4.4%. This observation indicates that the amount of CuO has an influence on the stabilization of ZrO
2 phase. Dongare
et al. [
23] prepared CuO-ZrO
2 catalysts by sol-gel method and observed that Cu content from 2–20 mol% in CuO-ZrO
2 catalysts stabilized the ZrO
2 in cubic fluorite structure. The observed difference in the final phase of CuO-ZrO
2 catalysts could be due to the adaptation of different preparation methods.
The average crystallite size of bare ZrO
2, 10-CuZr and 20-CuZr samples were calculated using Scherrer’s equation (
Table 1). The calculated average crystallite size of monoclinic and tetragonal phases of all the samples was 24 nm for bare ZrO
2. The average particle size of ZrO
2 remained same after loading 10 wt. % CuO. However, a decrease of particle size (22 nm) was observed in the case of the 20-CuZr sample.
Raman spectroscopy is a well-known technique to distinguish the changes in ZrO
2 phases. Yamamoto
et al. [
24] reported that the tetragonal ZrO
2 phase shows a strong Raman band at 263 cm
−1 and several other bands at 148, 325, 472, 608 and 640 cm
−1. On other hand, the monoclinic ZrO
2 phase shows strong bands at 173, 185 and 472 cm
−1 and some other bands at 140, 216, 260, 301, 328, 342, 500, 553 and 632 cm
−1 [
25]. The Raman spectra for all the samples are shown in
Figure S1 (supporting information). The bare ZrO
2 and 10-CuZr samples showed strong bands corresponding to both tetragonal and monoclinic ZrO
2 phases, indicating the coexistence of both phases in these two samples. The Raman spectrum of 20-CuZr sample showed low intense minor bands due to the monoclinic ZrO
2 phase and high intense major bands due to the tetragonal ZrO
2 phase. The intensity of the Raman bands due to monoclinic ZrO
2 is very low as the volume percentage (calculated from XRD results) for monoclinic ZrO
2 is very small. These results are in accordance with the XRD results.
It was reported that nine Raman bands with different symmetries (4A
u + 5B
u +A
g + 2B
g) are possible for the crystalline CuO phase. However, only three (A
g + 2B
g) modes are Raman active [
26]. Xu
et al. [
27] observed three Raman bands at 282, 330 and 616 cm
−1 for CuO nanomaterial. It is interesting that we have not observed any bands due to presence of CuO particles in the Raman spectrum of 20-CuZr sample, even though XRD pattern of this sample showed reflections due to crystalline CuO. Xu
et al. [
27] also reported that the intensity Raman bands due to CuO phase is related to the particle size. Stronger and sharper Raman bands could be observed for larger CuO particles and, in addition, bands could shift to longer wavenumbers with increasing CuO particle size. The absence of Raman bands due to CuO phase indicates that some of the impregnated CuO could have deposited inside the pores of the ZrO
2.
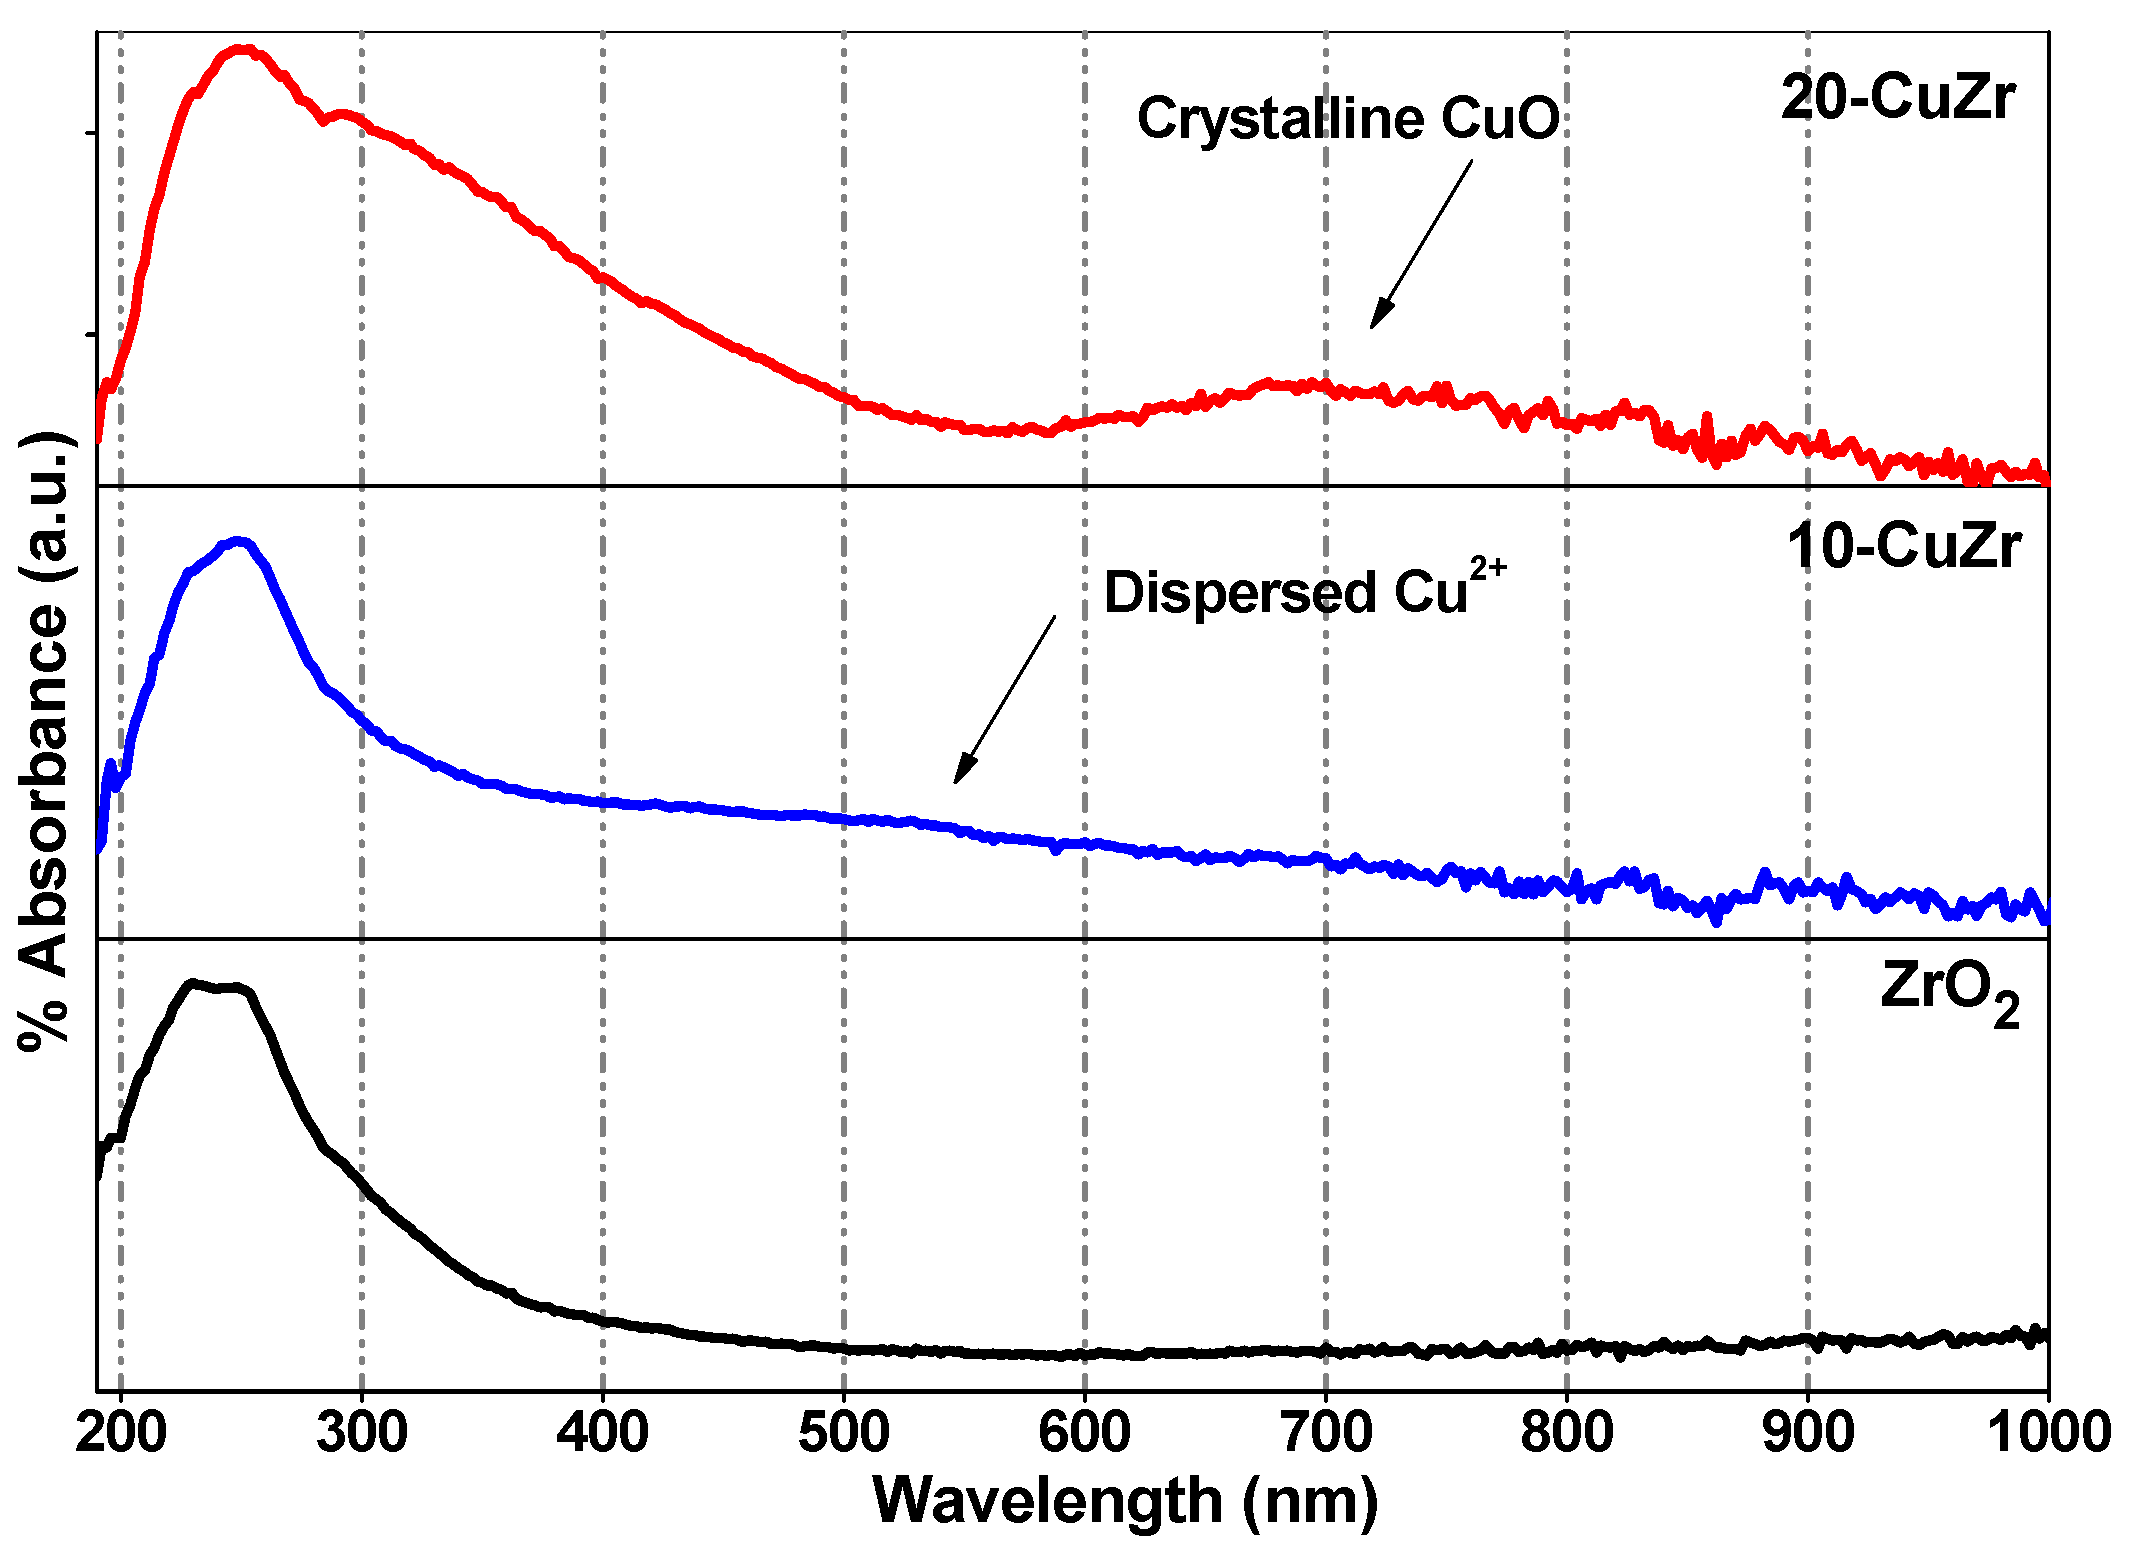
Information corresponding to the coordination and different oxidation states of metal (Cu and Zr) ions presented in the samples was studied by diffuse reflectance UV-vis spectroscopy by measuring the
d-d transitions and oxygen-metal ion charge-transfer bands.
Figure 2 shows DR UV-vis spectra for bare ZrO
2 and CuZr nanocomposite samples. Sahu
et al. [
28] reported that ZrO
2 support showed the main absorption band to be located at 228 nm and a broad shoulder around 275 nm. In the present study, the bare ZrO
2 support showed two absorption bands at 230 nm and 275 nm; therefore, these two bands can be assigned to inter band and low-coordinated surface O
2−→Zr
4+ transitions respectively in tetragonal and monoclinic ZrO
2. This observation is in good agreement with the XRD results (
Figure 1B). The spectrum of 20-CuZr sample showed absorption features in 290–500 nm region and above 720 nm, much different from the spectrum of bare ZrO
2 support. The observed peaks for 20-CuZr sample are mainly due to O
2−→Cu
2+ charge transfer (CT) and
d-d transitions in oligomeric Cu-O-Cu species and CuO crystallites, respectively [
29]. The absorption band centered at around 550 nm for 10-CuZr sample could be assigned to highly dispersed Cu
2+ ions situated in an octahedral environment [
30]. Interestingly, the 10-CuZr sample did not exhibited the absorption peaks around 250 nm and above 740 nm, typical for
d-d transitions for O
2−→Cu
2+ CT in CuO crystallites. The observed differences in DR UV-vis spectra of 10-CuZr sample is due to the presence of finely dispersed Cu species on porous ZrO
2 support, which is approximately in accordance with XRD and Raman spectroscopy results. The above results reveal that in the 10-CuZr sample, the dispersed CuO species dominates, while isolated Cu
2+ and crystalline CuO coexist in 20-CuZr sample.
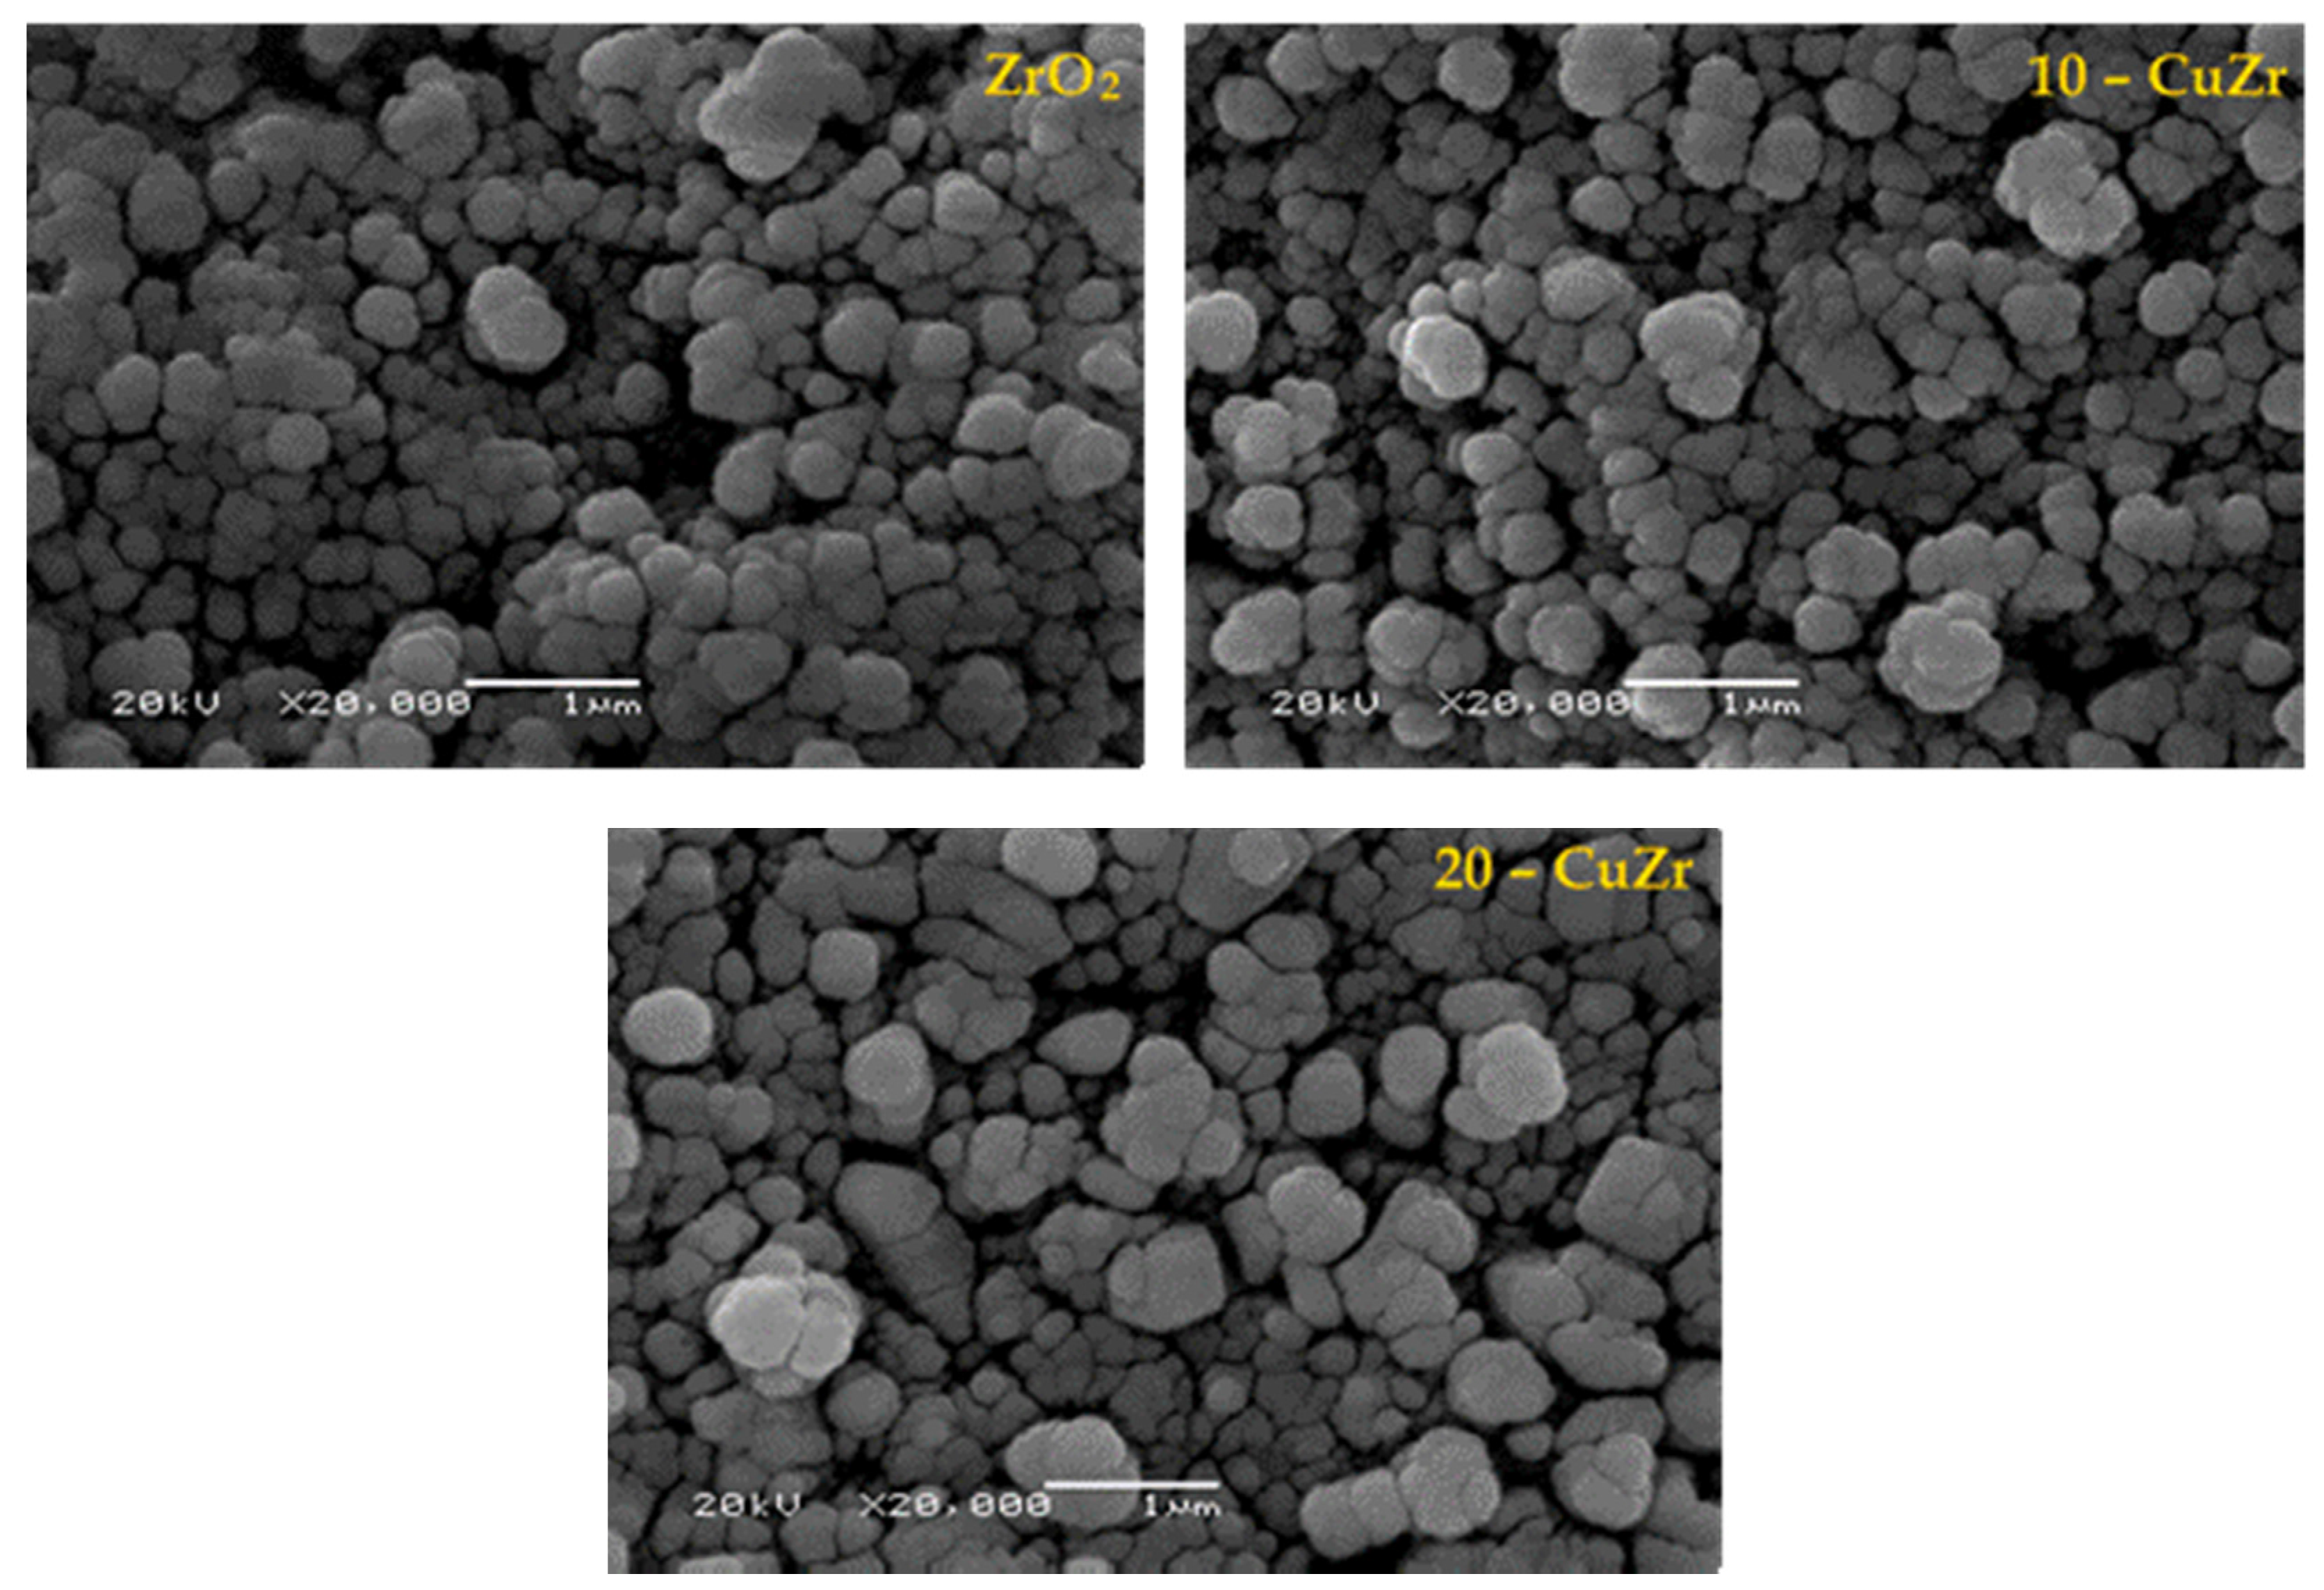
The morphology of synthesized porous ZrO
2 and CuO-ZrO
2 samples was studied by SEM analysis. SEM images (
Figure 3) of the samples did not show any major differences; however, SEM analysis is useful to determine the particle size and elemental composition at specific regions of the particles. It can be observed that samples possessed irregular spherical shaped particles with size in the range of 40 to 100 nm. The morphology of ZrO
2 and CuO-ZrO
2 composite powders was uneven and agglomerated. The samples had also been examined by EDX technique (
Figure S2), where two distinct phases, Cu and ZrO
2 were clearly observed.
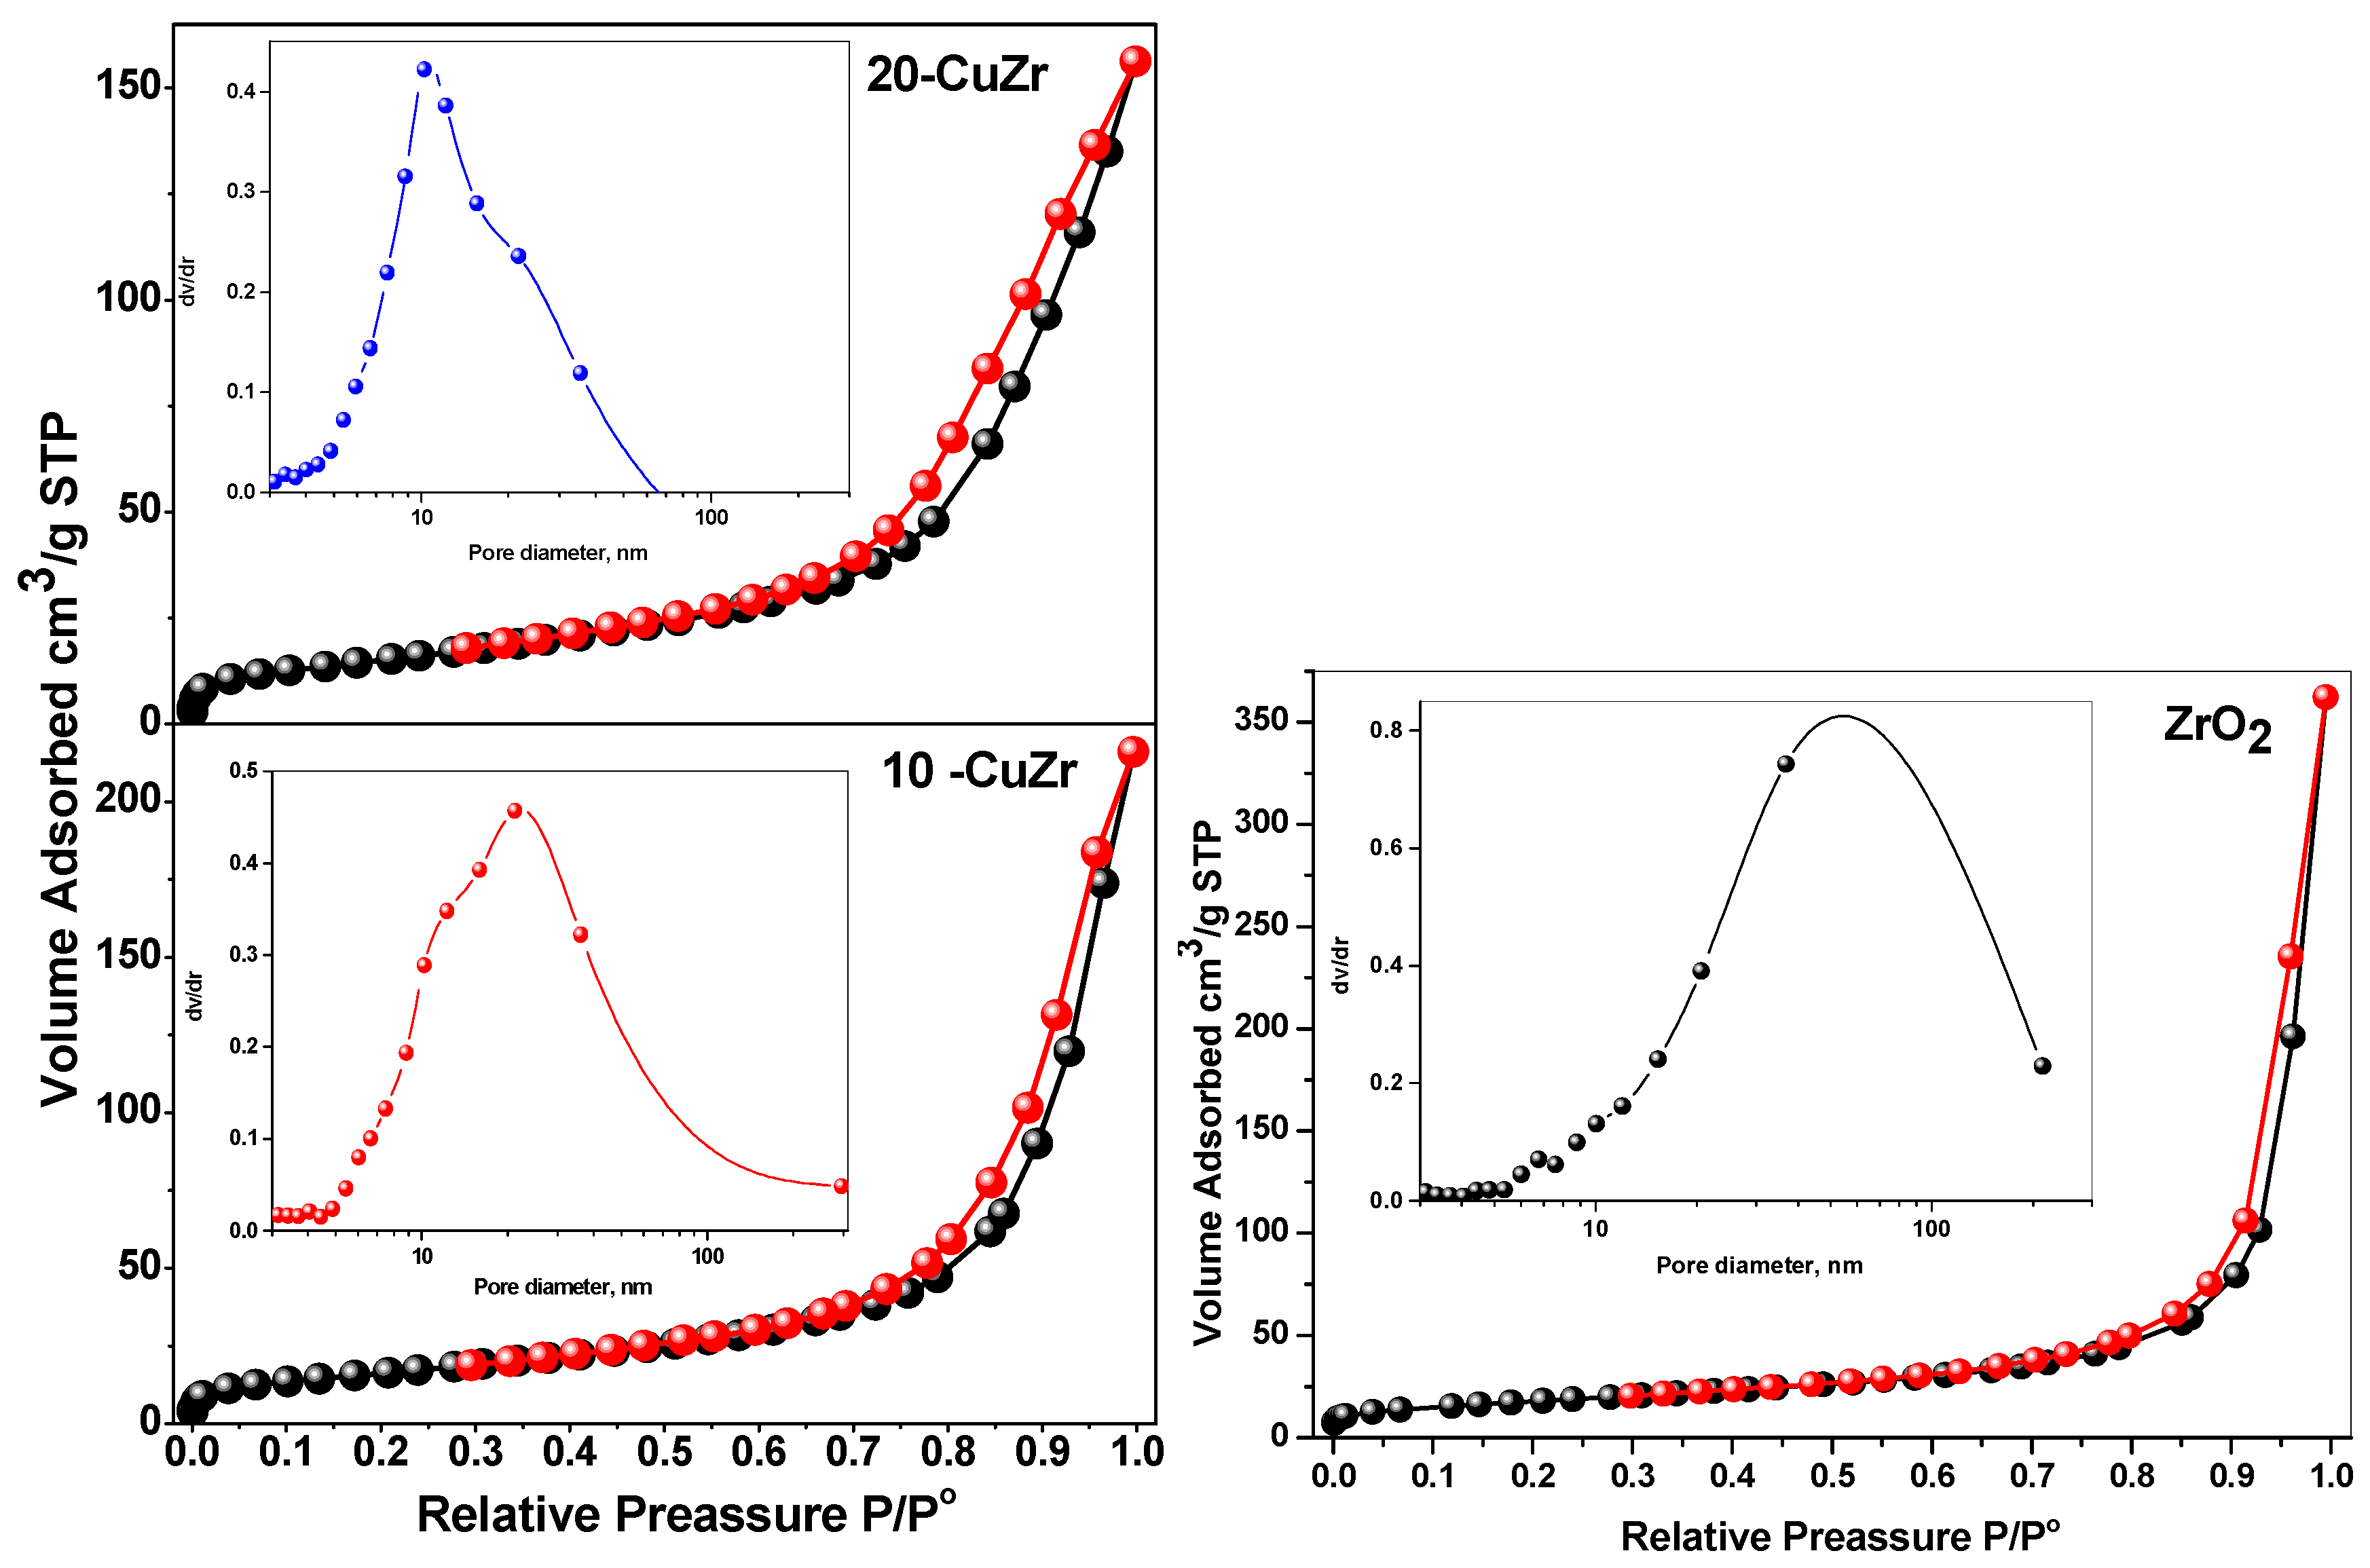
Figure 4 represents N
2 adsorption-desorption isotherms with the pore size distribution patterns being shown in the inset for ZrO
2 and CuZr samples. The textural properties of the samples are tabulated in
Table 2. All the synthesized samples showed type II isotherm with an H3 type hysteresis loop typical of macroporous materials. Bare ZrO
2 sample possessed a specific surface area of 64 m
2·g
−1 with large pore size distribution ranging from 7 to 200 nm. With impregnation of CuO, a decrease of specific surface area and pore size was observed. This observation suggests that partial pore blocking occurs with impregnation of CuO. This effect is small in case of 10-CuZr sample, this could be due to the dominant deposition of finely dispersed CuO species on the surface of ZrO
2 support. Significant decrease in the pore volume (from 0.3342 to 0.2413 cm
3·g
−1) and specific surface area (from 59 to 45 m
2·g
−1) after 20 wt. % CuO loading. This result clearly indicates that crystalline CuO species presented in the 20-CuZr block the ZrO
2 macropores.
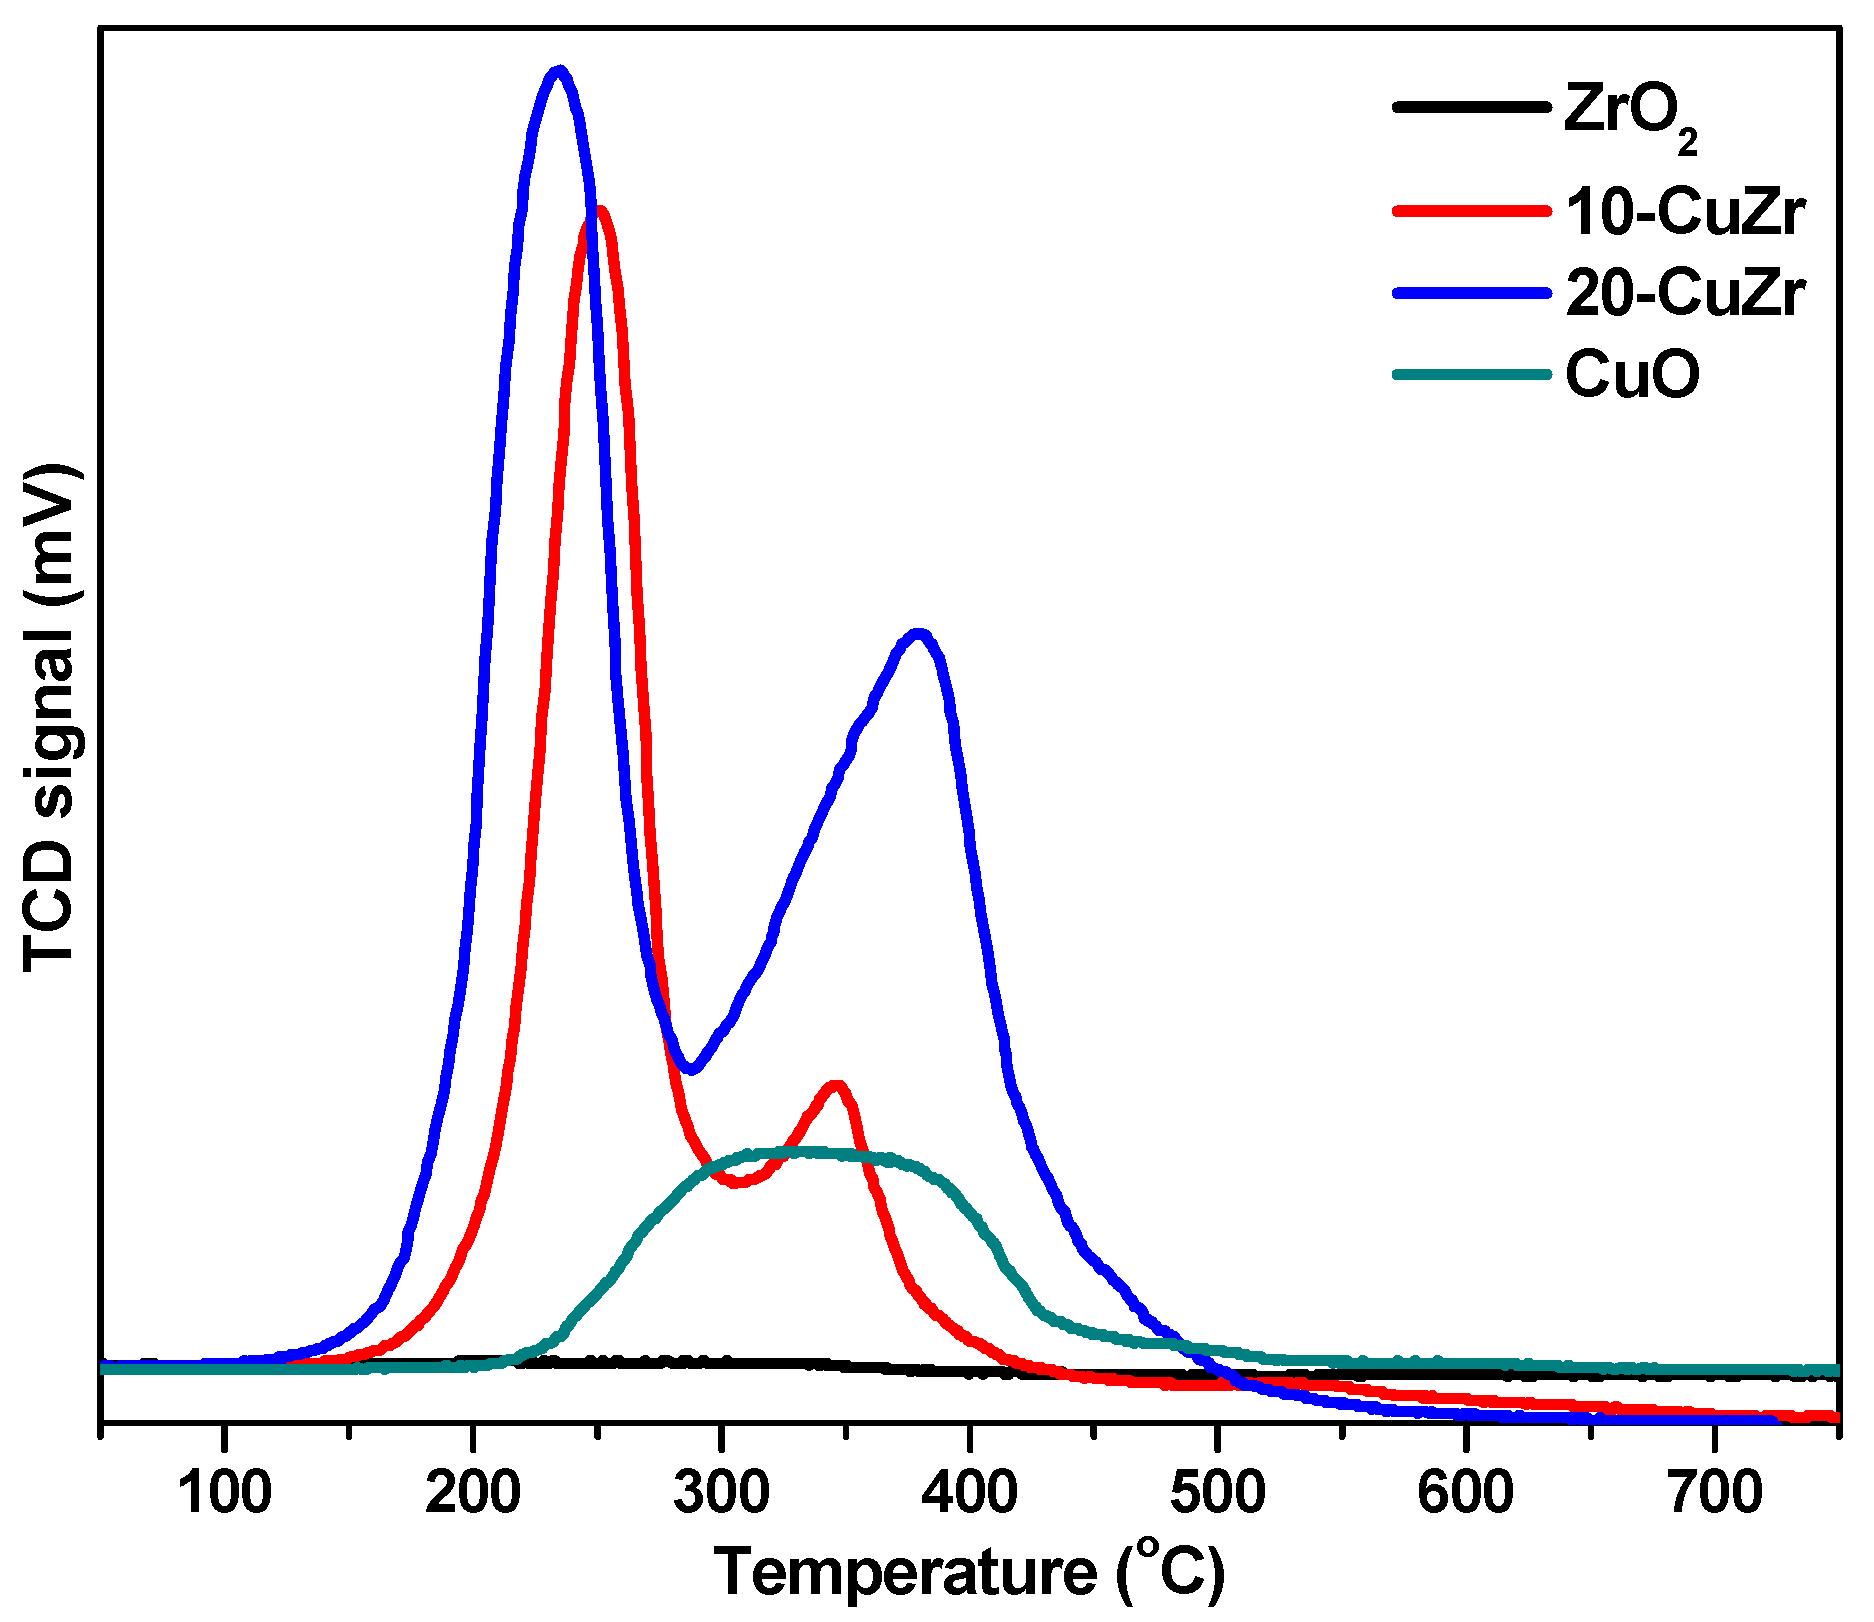
H
2-TPR analysis was used to determine the reduction behavior of the catalysts and also understand the interaction between CuO and ZrO
2.
Figure 5 shows H
2-TPR profiles of calcined ZrO
2 and CuO-ZrO
2 samples along with the H
2-TPR profile of bulk CuO sample for comparison. The ZrO
2 sample did not exhibit any reduction peak below 600 °C. On other hand, bulk CuO sample produced a broad reduction peak in the range of 220–420 °C. The H
2-TPR profile of 10-CuZr sample showed two reduction peaks: the first peak appeared at 250 °C and second one at 345 °C. The 20-CuZr sample also showed two reduction peaks, but at different temperatures, first peak was appeared at 235 °C and second one is at 380 °C. In addition, the intensities of the peaks for 20-CuZr sample is higher and broader than the peaks observed for 10-CuZr sample. It is clear that the reduction of Cu species in the CuO-ZrO
2 samples occurred at lower temperatures compared with pure CuO, suggesting that ZrO
2 promotes the dispersion of CuO and enhances the reducibility of Cu species, which is in good agreement with the reported literature [
31].
The appearance of two reduction peaks in the H
2-TPR profiles of CuO-ZrO
2 samples instead of the single broad peak as observed in pure CuO suggests that CuO-ZrO
2 samples possessed presence of more than one copper oxide species. The first peak at lower temperature for CuO-ZrO
2 samples could be attributed to the reduction of isolated copper oxide particles and the second peak at high temperature can be assigned to highly dispersed Cu species, which are interacted with the ZrO
2 support as well as to well-crystallized CuO in weak interaction with ZrO
2 [
32].
The first reduction peak appears at a much lower temperature (235 °C) for 20-CuZr sample. In contrast, the second peak appears at a lower temperature for 10-CuZr sample (345 °C). Usually, dispersed CuO reduces more easily than larger CuO particles; however, it was reported that the interaction between CuO and ZrO
2 depends on the CuO dispersion and crystallinity as well as on the ZrO
2 phase. It was also observed that CuO-supported tetragonal ZrO
2 exhibited an intensive peak, but in a lower temperature region compared to CuO-supported amorphous ZrO
2 and CuO-supported monoclinic ZrO
2. These results demonstrate that the CuO loading affects the dispersion state of the CuO species. Total hydrogen uptake values are presented in
Table 1, the total hydrogen uptake was observed to be in the order: 10-CuZr > 20-CuZr > ZrO
2, which indicates that H
2 uptake is influenced by the CuO loading and its interaction with ZrO
2 support. Liu
et al. [
33] observed similar results that indicated that CuO-ZrO
2 catalysts showed two TPR peaks; the high temperature peak could be due to the CuO, which was strongly interacted with ZrO
2 and the lower temperature peak to the CuO which has little interaction with ZrO
2. Based on these observations, the increase of the peak temperature with CuO loading indicates diminishing interaction between the Cu oxide and ZrO
2.
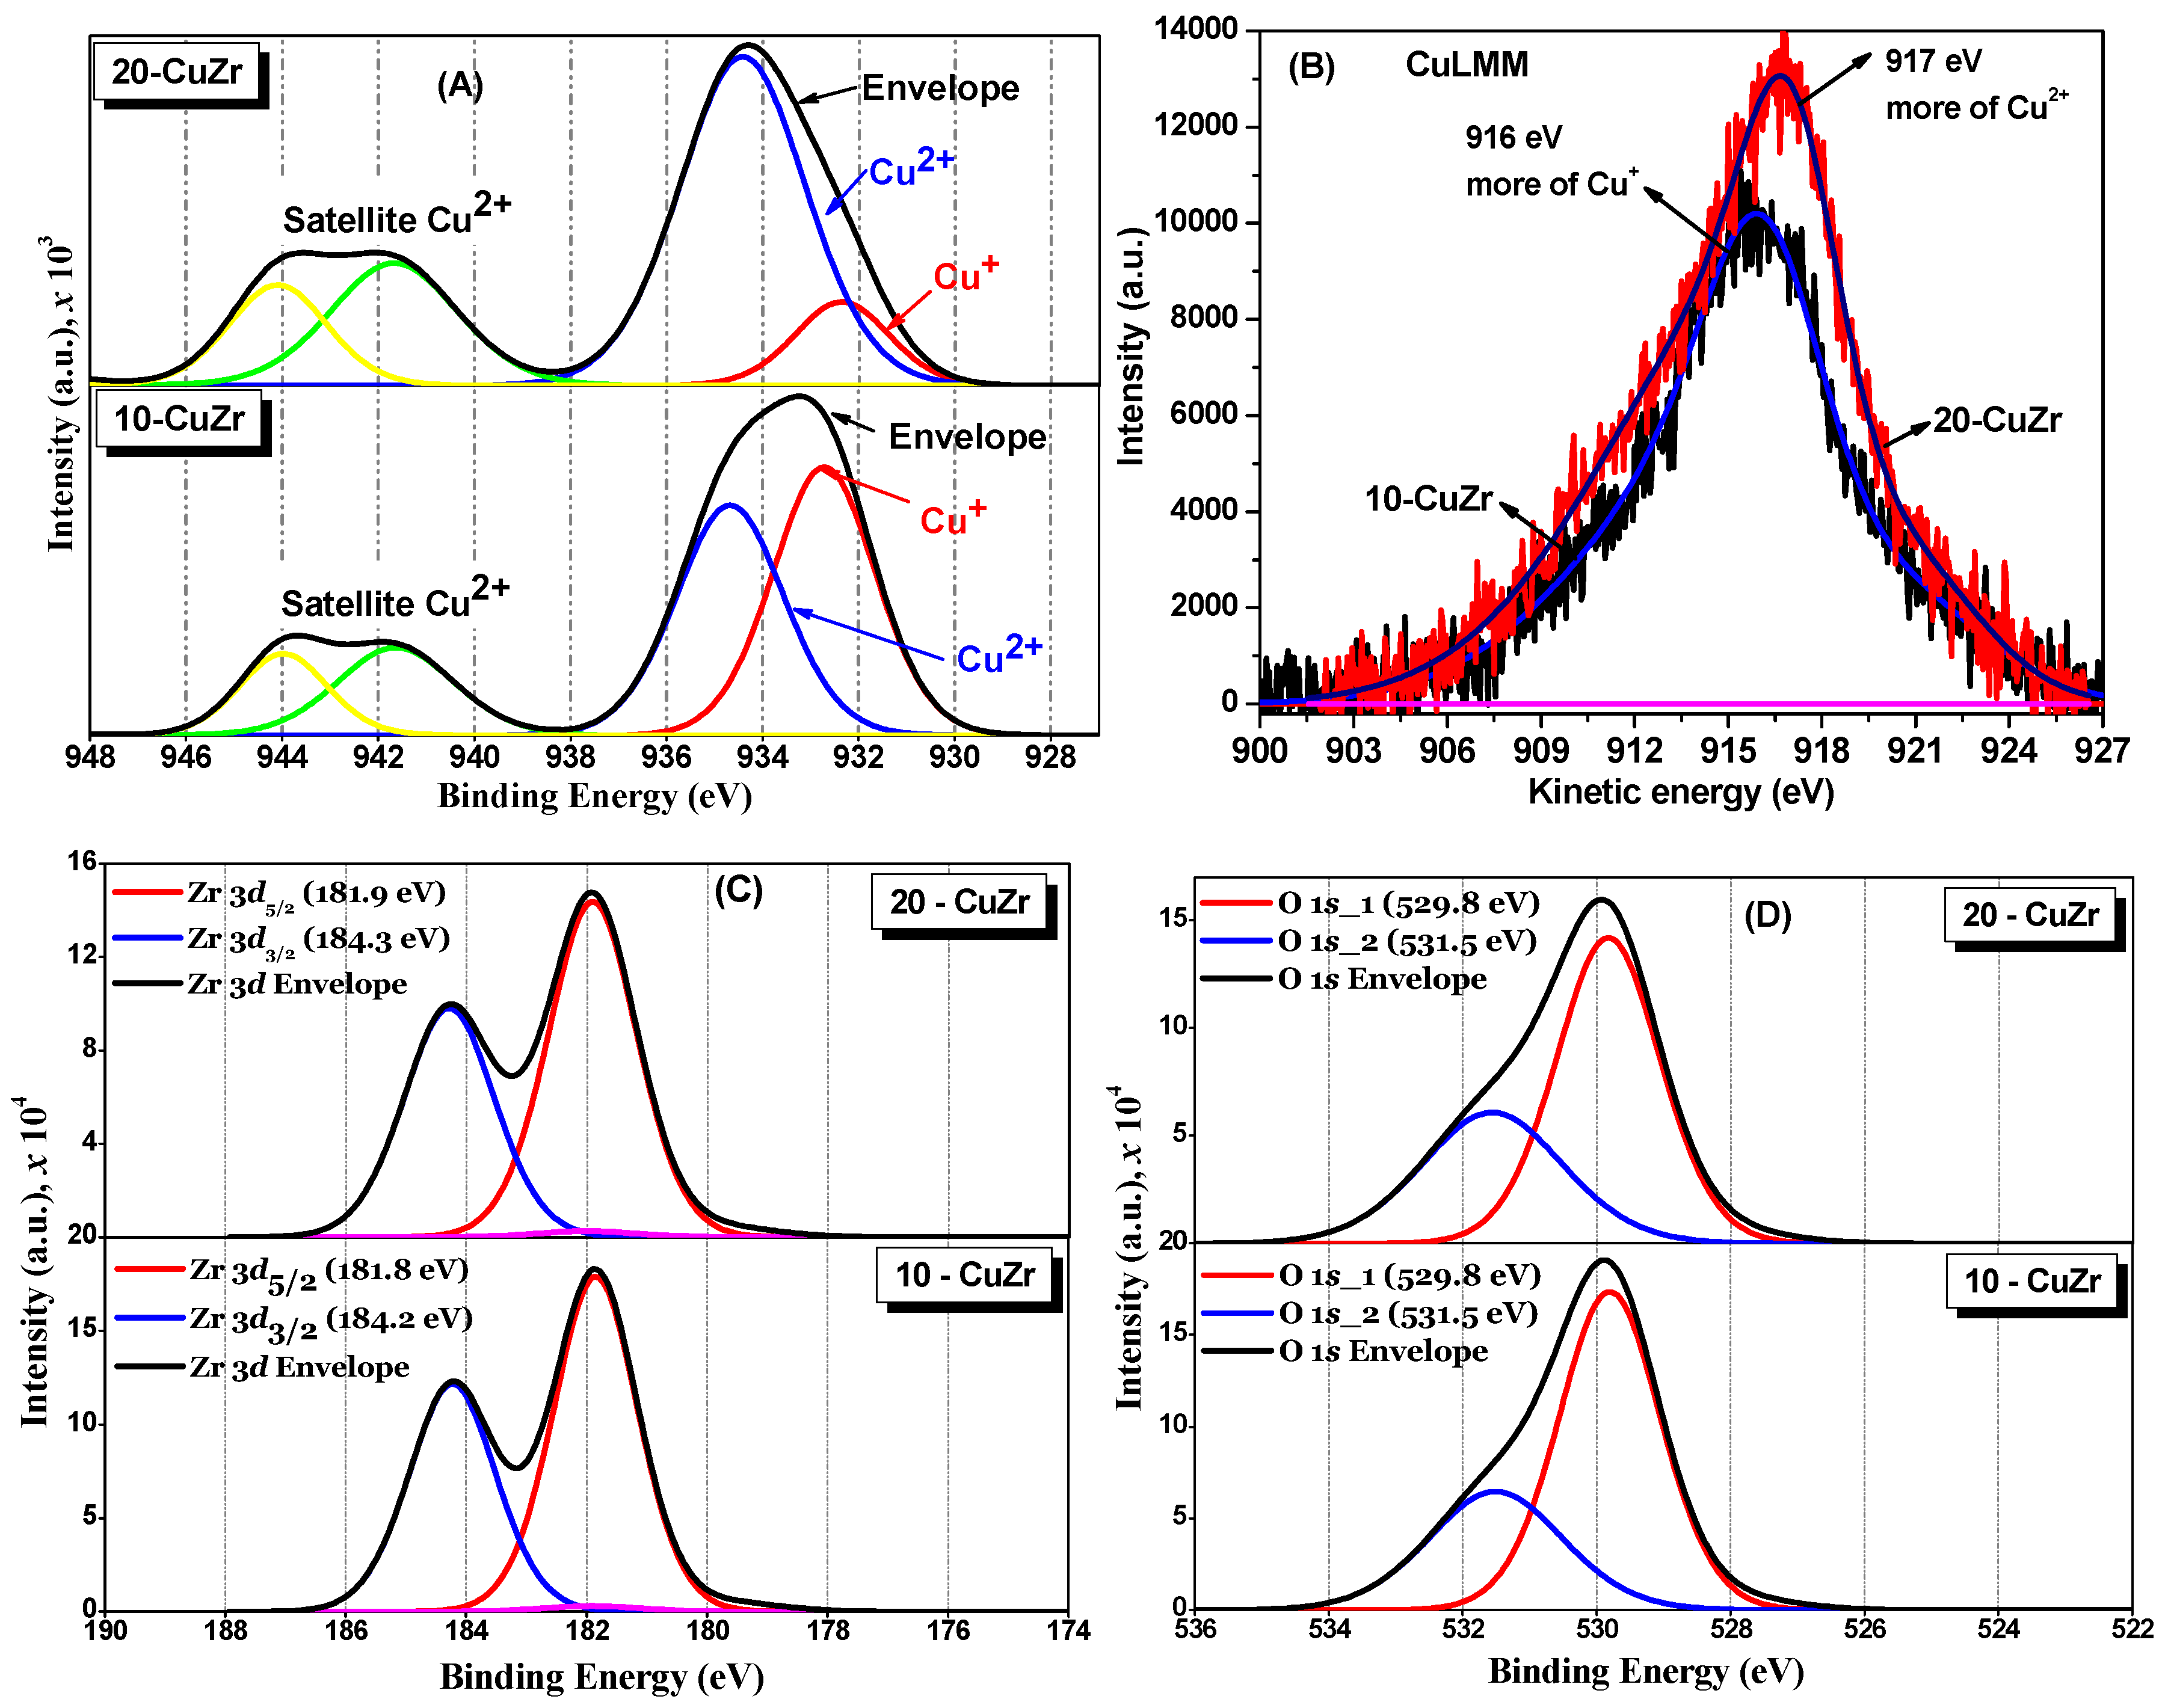
The chemical states of Cu, Zr and O atoms in the catalysts were evaluated by XPS technique. Cu
2p, CuLMM Auger, Zr
3d and O
1s XP spectra for ZrO
2 and CuZr samples are shown in
Figure 6A–D respectively. A shake-up satellite at about 942 eV was clearly observed in both CuZr samples, which suggests the presence of Cu
2+ species in these samples, irrespective of the CuO loading. Furthermore, appearance of Cu
2p3/2 at 934 eV with consistent satellite peak also suggests a contribution of tenorite CuO phase, which is in accordance with the XRD results. It was reported that Cu
+ or Cu
0 species generally do not show any satellite peaks due to completely filled
3d shells [
34].
Deconvolution of Cu
2p3/2 XP peaks suggests the presence of two kinds of Cu species in their chemical environments. From the curve fitting, the binding energies (BE) of the two Cu
2p3/2 components at two different BE (932.2 eV and 935.2 eV) were obtained. The Cu
2p3/2 XP peak at 935.2 eV can be assigned to bulk CuO species [
35]. The other peak at 932.2 eV therefore belongs to species such as Cu
+ or Cu
0. It was reported that distinguishing Cu
0 and Cu
+ species is quite difficult, because their BE values are so close (0.1 eV difference) that they overlap each other [
34]. However, we do not believe there is Cu
0 in 10-CuZr and 20-CuZr samples due to the calcination being carried out under the air.
The X-ray induced Cu LMM Auger peaks for 10-CuZr and 20-CuZr samples were obtained in high resolution energy mode to check the presence of Cu
+ and Cu
0. The CuLMM Auger spectra for 10-CuZr and 20-CuZr samples can be seen in
Figure 6B. A difference can be observed in the kinetic energy maximum of CuLMM Auger photoelectron spectra of the CuZr samples (10-CuZr: 916 eV and 20-CuZr: 917 eV), most probably due to the difference in interaction at the interface between the ZrO
2 and CuO. It was reported that Cu
2+ species have a kinetic energy of the Auger transition at
ca. 917–918 eV [
36]. The transitions at 913–914 eV and 918.8–919.3 eV were assigned to CuO aggregates and Cu
0 species, respectively [
37]. These observations indicated that 20-CuZr sample possessed Cu
2+ species.Oon other hand, 10-CuZr sample had more like Cu
+ species. Grünert
et al. [
38] observed a reduction of Cu
2+ species to Cu
+ under vacuum and X-ray irradiation in the case of Cu-ZSM-5 catalysts. Di Castro and Piredda [
39] also observed very similar phenomenon in the case of catalysts that contained well dispersed CuO species that were supported on SiO
2. Thus, according to the literature reports, we could explain these experimental results in the following way: better Cu dispersion (in 10-CuZr) provides higher photoreduction of Cu
2+, due to the X-ray irradiation during the XPS measurement [
40]. The stabilization of Cu
+ ions on the surface of the catalyst is mainly due to the strong support interfacial interaction with these Cu species [
41]. Therefore, the low energy XPS peak observed at 932.2 eV could be assigned to Cu
+ species which are interacted with ZrO
2. It is interesting to note that Moretti
et al. [
42] assigned lower BE values for interactive Cu species and they explained that the reason for that is the formation of more covalent Cu–O bond due to strong interaction between CuO and ZnO. These observations lead to the fact that CuO and ZrO
2 in CuZr samples are not a physical mixture, but a chemical interaction existed between them. Furthermore, the existence of two different Cu species is also consistent with the H
2-TPR results, where we observed two TPR peaks corresponding to two reducible species. The contribution of the area under the peak at 932.2 eV is higher for 10-CuZr than 20-CuZr sample, indicating that the amount of the interactive species is higher in the case of 10-CuZr than the 20-CuZr sample.
The Zr
3d XP spectra for CuZr samples are shown in
Figure 6C. A spin-orbit doublet was observed for Zr
3d5/2 and
3d3/2 core levels centered at 181.8 eV and 184.2 eV respectively. The BE value of
ca. 181.8 eV measured for Zr
3d5/2 indicates the presence of ZrO
2 with an oxidation state of +4 [
43]. It was also reported that the BE of Zr
4+ species in pure ZrO
2 is around 182.6 eV [
44]; slightly lower values were observed in case of CuZr samples compared to that of stoichiometric ZrO
2. This is probably due to oxygen deficiency. The shift in the BE toward the lower value might be associated with the holes created by oxygen vacancies in the ZrO
2 lattice [
45].
The deconvoluted XP O
1s spectra for CuZr samples (
Figure 6D) show two peaks at 530 eV and 531.5 eV. Wu
et al. [
46] observed two types of oxygen species for the Cu-supported ZrO
2 catalysts: oxygen species of ZrO
2 and/or CuO and oxygen species of Zr–OH, whose binding energy is in the range of 529.8–530.3 eV and 530.9–532.2 eV, respectively. Navio
et al. [
47] also observed two types of oxygen species in the ZrO
2 sample: oxygen species of ZrO
2 and oxygen species of Zr–OH, whose binding energy is in the range of 529.8 to 530.3 and 530.9 to 532.2 eV, respectively. The three samples showed XPS peaks corresponding to oxygen species corresponding to ZrO
2 and/or CuO and oxygen species of Zr–OH in different proportions.
The degree of dispersion of Cu and Zr atoms on the surface of the catalysts, estimated from XPS results, are shown in
Table 2. From these values, as expected, the surface of the 20-CuZr catalyst was enriched with Cu and Zr atoms compared with 10-CuZr sample. The bulk chemical composition of catalysts determined from ICP analysis (
Table 2) clearly differs from the surface composition. The quantity of Cu on the surface of both the catalysts is less than in the bulk. This is most probably due to deposition of Cu species inside the mesopores of ZrO
2 support. A very similar behavior was observed in case Fe
2O
3 supported mesoporous ZrO
2 catalysts [
20].
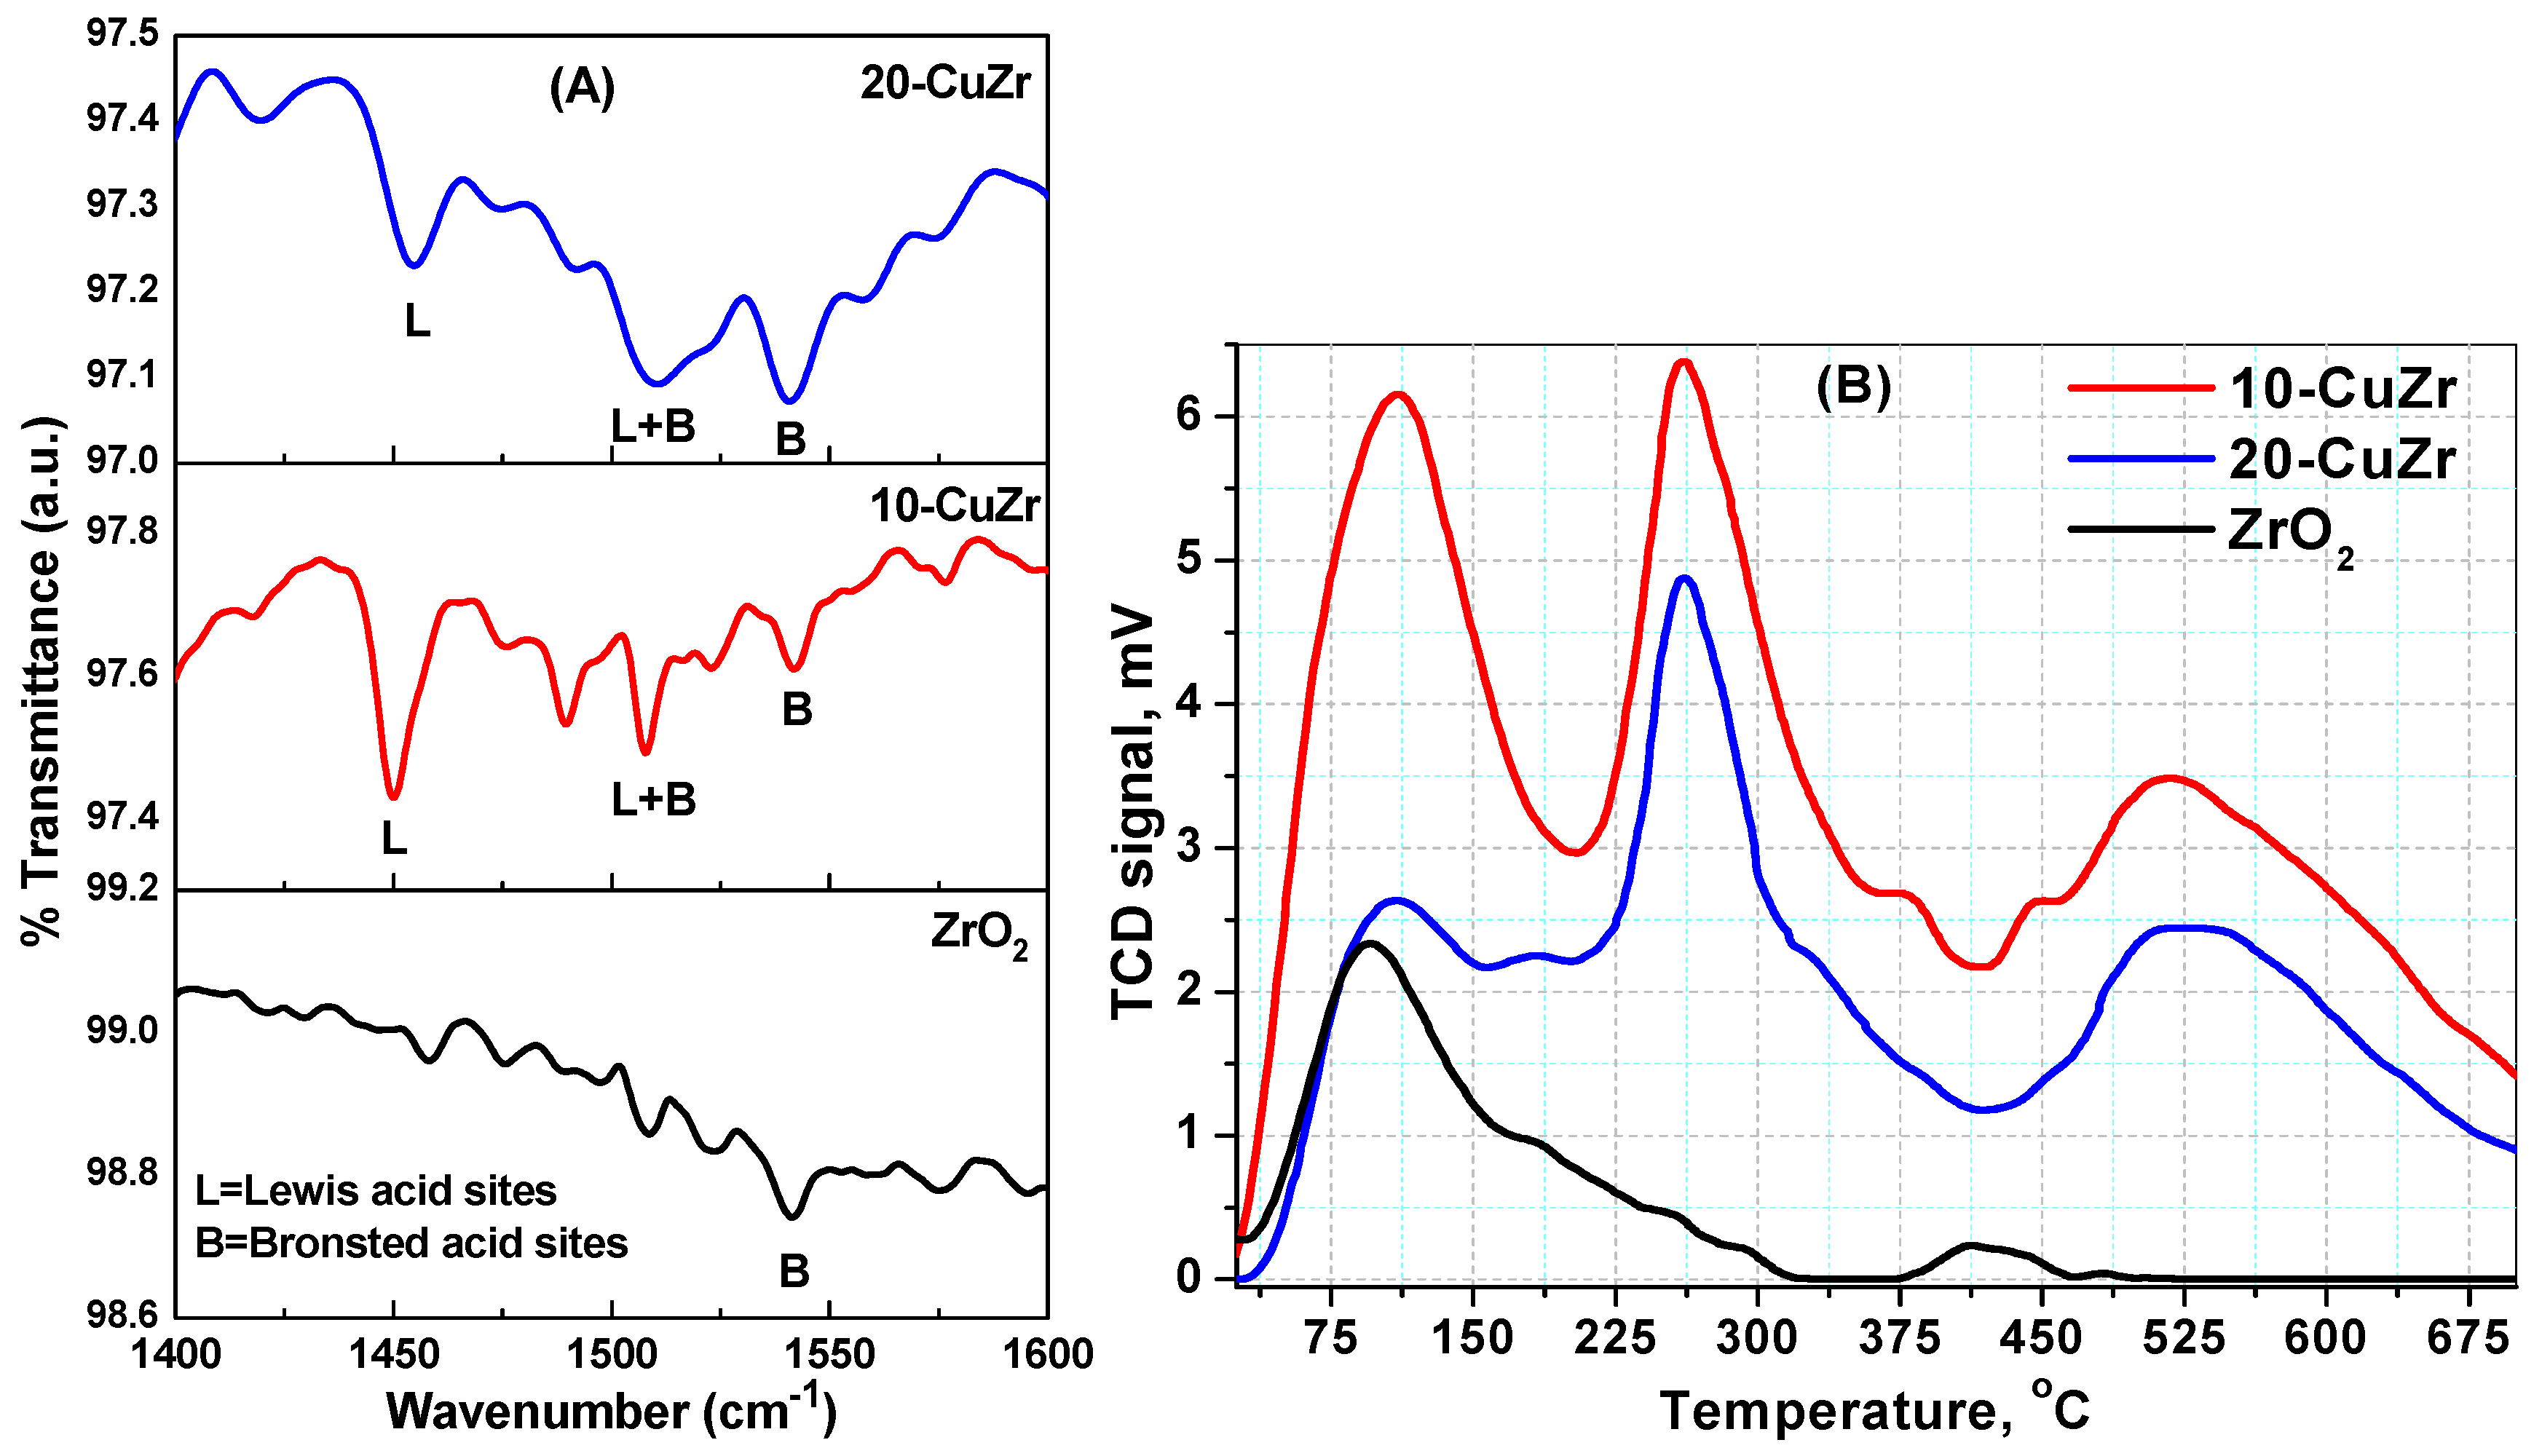
The acidic properties of bare ZrO
2 and porous CuO-ZrO
2 samples were evaluated using FTIR spectroscopy following pyridine adsorption and NH
3-TPD techniques. The results of the analysis are shown in
Figure 7 and
Table 3. The spectrum of bare ZrO
2 sample showed only a small peak corresponding to Brönsted acid sites. In contrast, the nanocomposite samples showed peaks due to Brönsted and Lewis acid sites. In comparison, 20-CuZr sample showed a lower number of Brönsted and Lewis acid sites than the 10-CuZr sample. The spectra of these two samples displayed well resolved bands at 1443, 1490 and 1545 cm
−1. It is well known that the band at 1443 cm
−1 could be ascribed to Lewis-coordinated pyridine (L), whereas Brönsted coordinated pyridine (B) generally shows a band at 1545 cm
−1. Another band at 1490 cm
−1 could be assigned to Lewis and Brönsted-coordinated pyridine (L + B) [
48].
The 10-CuZr sample possessed dominant Lewis acid sites with a small number of Brönsted acid sites. As expected, 20-CuZr sample showed a similar trend as 10-CuZr sample; existence of higher number of Lewis acid sites than Brönsted acid sites. The concentration of the Brönsted (B) and Lewis (L) acid sites for each catalyst was determined by calculating the intensities of the FTIR bands corresponding to respective acid sites [
49]. Quantitative data was obtained by using the Lambert-Beer equation [
50] and the data is presented in
Table 3. The results presented in
Table 3 clearly indicate that an increase of CuO loading to 20 wt. % resulted in a decrease of the both Brönsted and Lewis acid sites concentration.
The NH
3-TPD technique was used to investigate the strength and number of acidic sites presented in the samples.
Figure 8B shows the NH
3-TPD profiles obtained for all the samples. The number of total acidic sites were measured from intensity of NH
3 desorption peaks and the density of total acidic sites of each catalyst was obtained by dividing the number of total acidic sites by surface area of the catalyst [
51]. It is widely accepted that the NH
3 desorption temperature provides the information about the strength of acidic sites presented in the samples; desorption peaks appearing below 200 °C could be attributed to weak acidic sites and desorption peaks between 200 and 450 °C could be due to the presence of acidic sites with medium strength, while ammonia desorption peaks appearing at high temperatures (more than 450 °C) could be representative of strong acidic sites.
Synthesized ZrO
2 and CuZr samples showed desorption peaks in the temperature range of 40 to 700 °C, which is an indication that the samples possessed weak, medium and strong acid sites. All the samples showed broad desorption peak at low temperature in the range of 75–200 °C, whichcorresponds to weak acid sites. Desorption of NH
3 from weak acidic sites is known to be a result of hydrogen bonded NH
3 rather than desorption of ammonia from the acidic sites on the surface of the sample. On other hand, CuZr nanocomposite samples showed desorption peaks at 270 °C and 525 °C, which can be attributed to the medium and strong acid sites, respectively. Impregnation of CuO on ZrO
2 support resulted a notable increase in the number of acid sites. The 20-CuZr sample exhibited a lower NH
3 desorption amount than 10-CuZr sample, as can be deduced by the comparison between the areas of desorption peaks for these two samples. These results clearly indicate the formation of a great number of acid sites in the CuZr nanocomposites. This is probably due to the effect of fine dispersion of CuO on the surface of ZrO
2 [
52].
The density of acidic sites for all the catalysts are presented in
Table 3. Increase of CuO loading affected the total number of acidic sites of CuZr catalysts, particularly Lewis acid sites. It is reported in the literature [
53] that monoclinic ZrO
2 has more acidic sites compared to tetragonal ZrO
2. In addition, enhancement of surface acidity was observed in case of Cu and Zr mixed oxide catalysts because of increase in number of oxygen deficient sites accompanied with the charge imbalance based on the generation of Cu–O–Zr interactive species [
54]. XRD results clearly indicate that the 10-CuZr sample possessed more tetragonal ZrO
2 volume percent than the 20-CuZr sample.
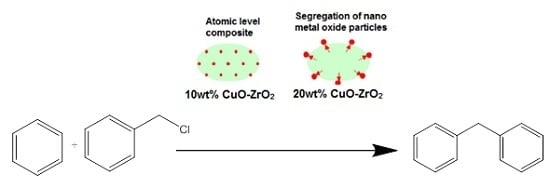
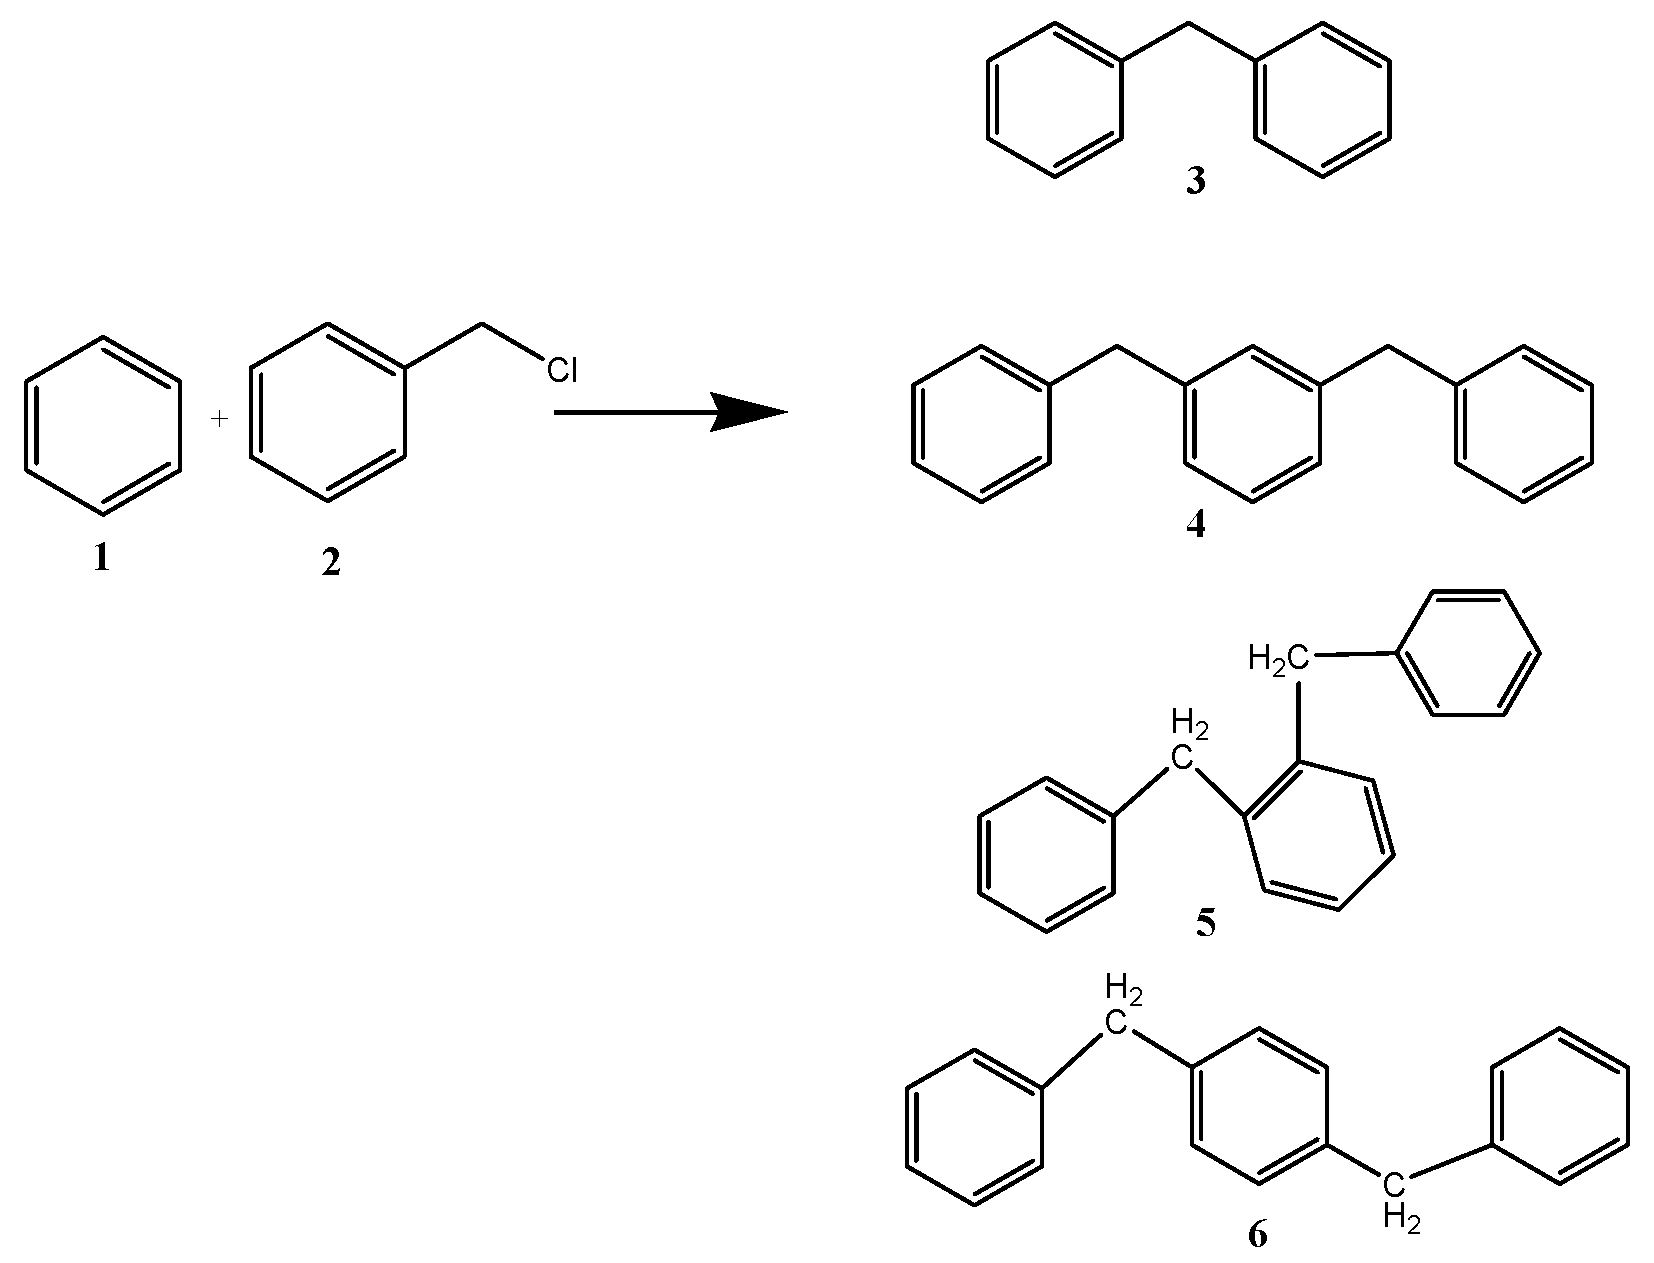
The catalytic performance of ZrO
2 support and CuZr nanocomposite samples are tested for benzylation of benzene with benzyl chloride (
Scheme 1). Benzylation of benzene (
1) with benzyl chloride (
2) as an alkylating agent produces mainly diphenylmethane (
3). As the Friedel-Crafts reaction is always accompanied by di- and poly-alkylations, due to higher reactivity of the product than the reactant, the benzylation reaction could also give dibenzylation products (
4–
6) as side products. Thus, dibenzylbenzene, tribenzylbenzene,
etc., may be formed in the reaction,with dibenzylbenzene being the most prominent side product.
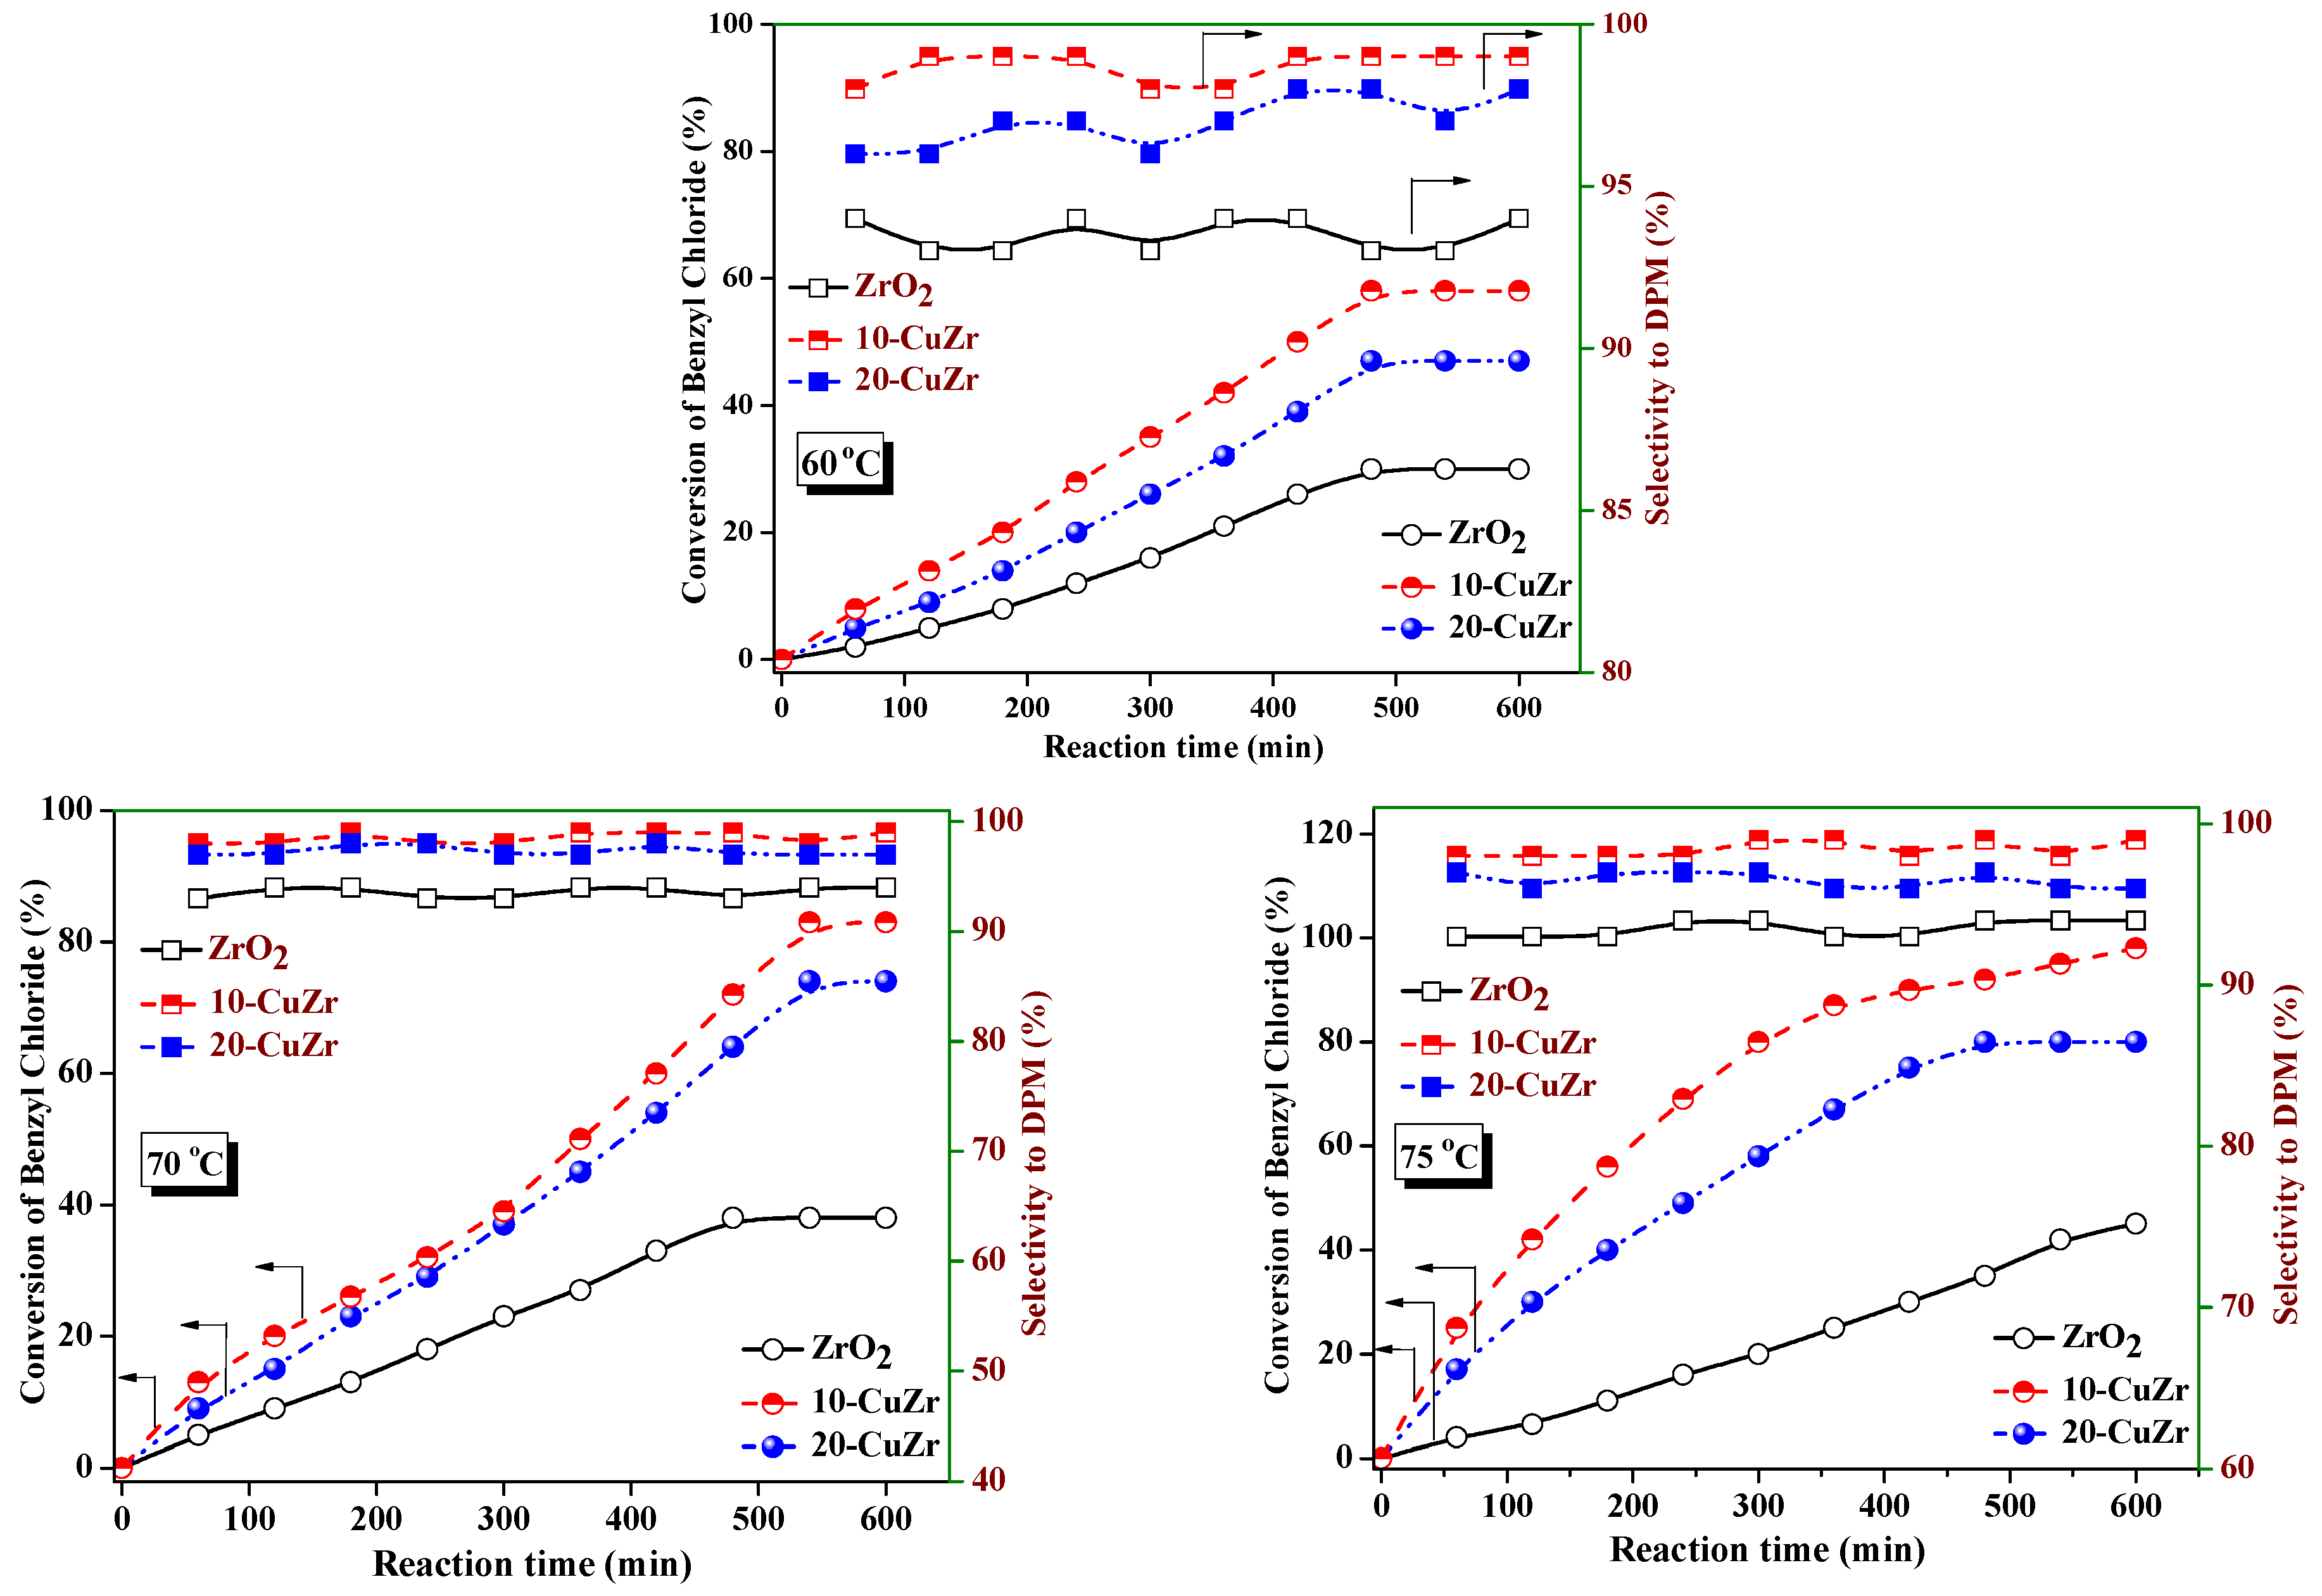
The conversion levels of benzyl chloride and selectivity to DPM values with reaction time over ZrO
2 and CuZr nanocomposite catalysts at different reaction temperatures are shown in
Figure 8. As shown in
Figure 8, bare ZrO
2 support showed only 45% of benzyl chloride conversion at 75 °C after 600 min. Benzylation activity improved significantly after 10 wt. % CuO loading on ZrO
2 support, 58% of benzyl chloride conversion was observed at 65 °C and it reached 98% at 75 °C after 600 min. Increase of CuO loading to 20 wt. % resulted in a decrease in conversion of benzyl chloride to 80% at 75 °C. With an increase of reaction temperature, the benzyl chloride conversion increased in the case of all of the catalysts.
The selectivity to DPM and rates of reaction per unit surface area of ZrO
2 support and CuZr nanocomposite at 65 °C, 70 °C and 75 °C are presented in
Table 4. The 10-CuZr catalyst offered the highest benzylation rate, followed by 20-CuZr and then ZrO
2 support. All three catalysts showed more or less the same reaction rates per unit surface area at 65 °C and 70 °C; however, the major difference was observed at 75 °C, where the 10-CuZr catalyst showed higher reaction rates per unit surface area.
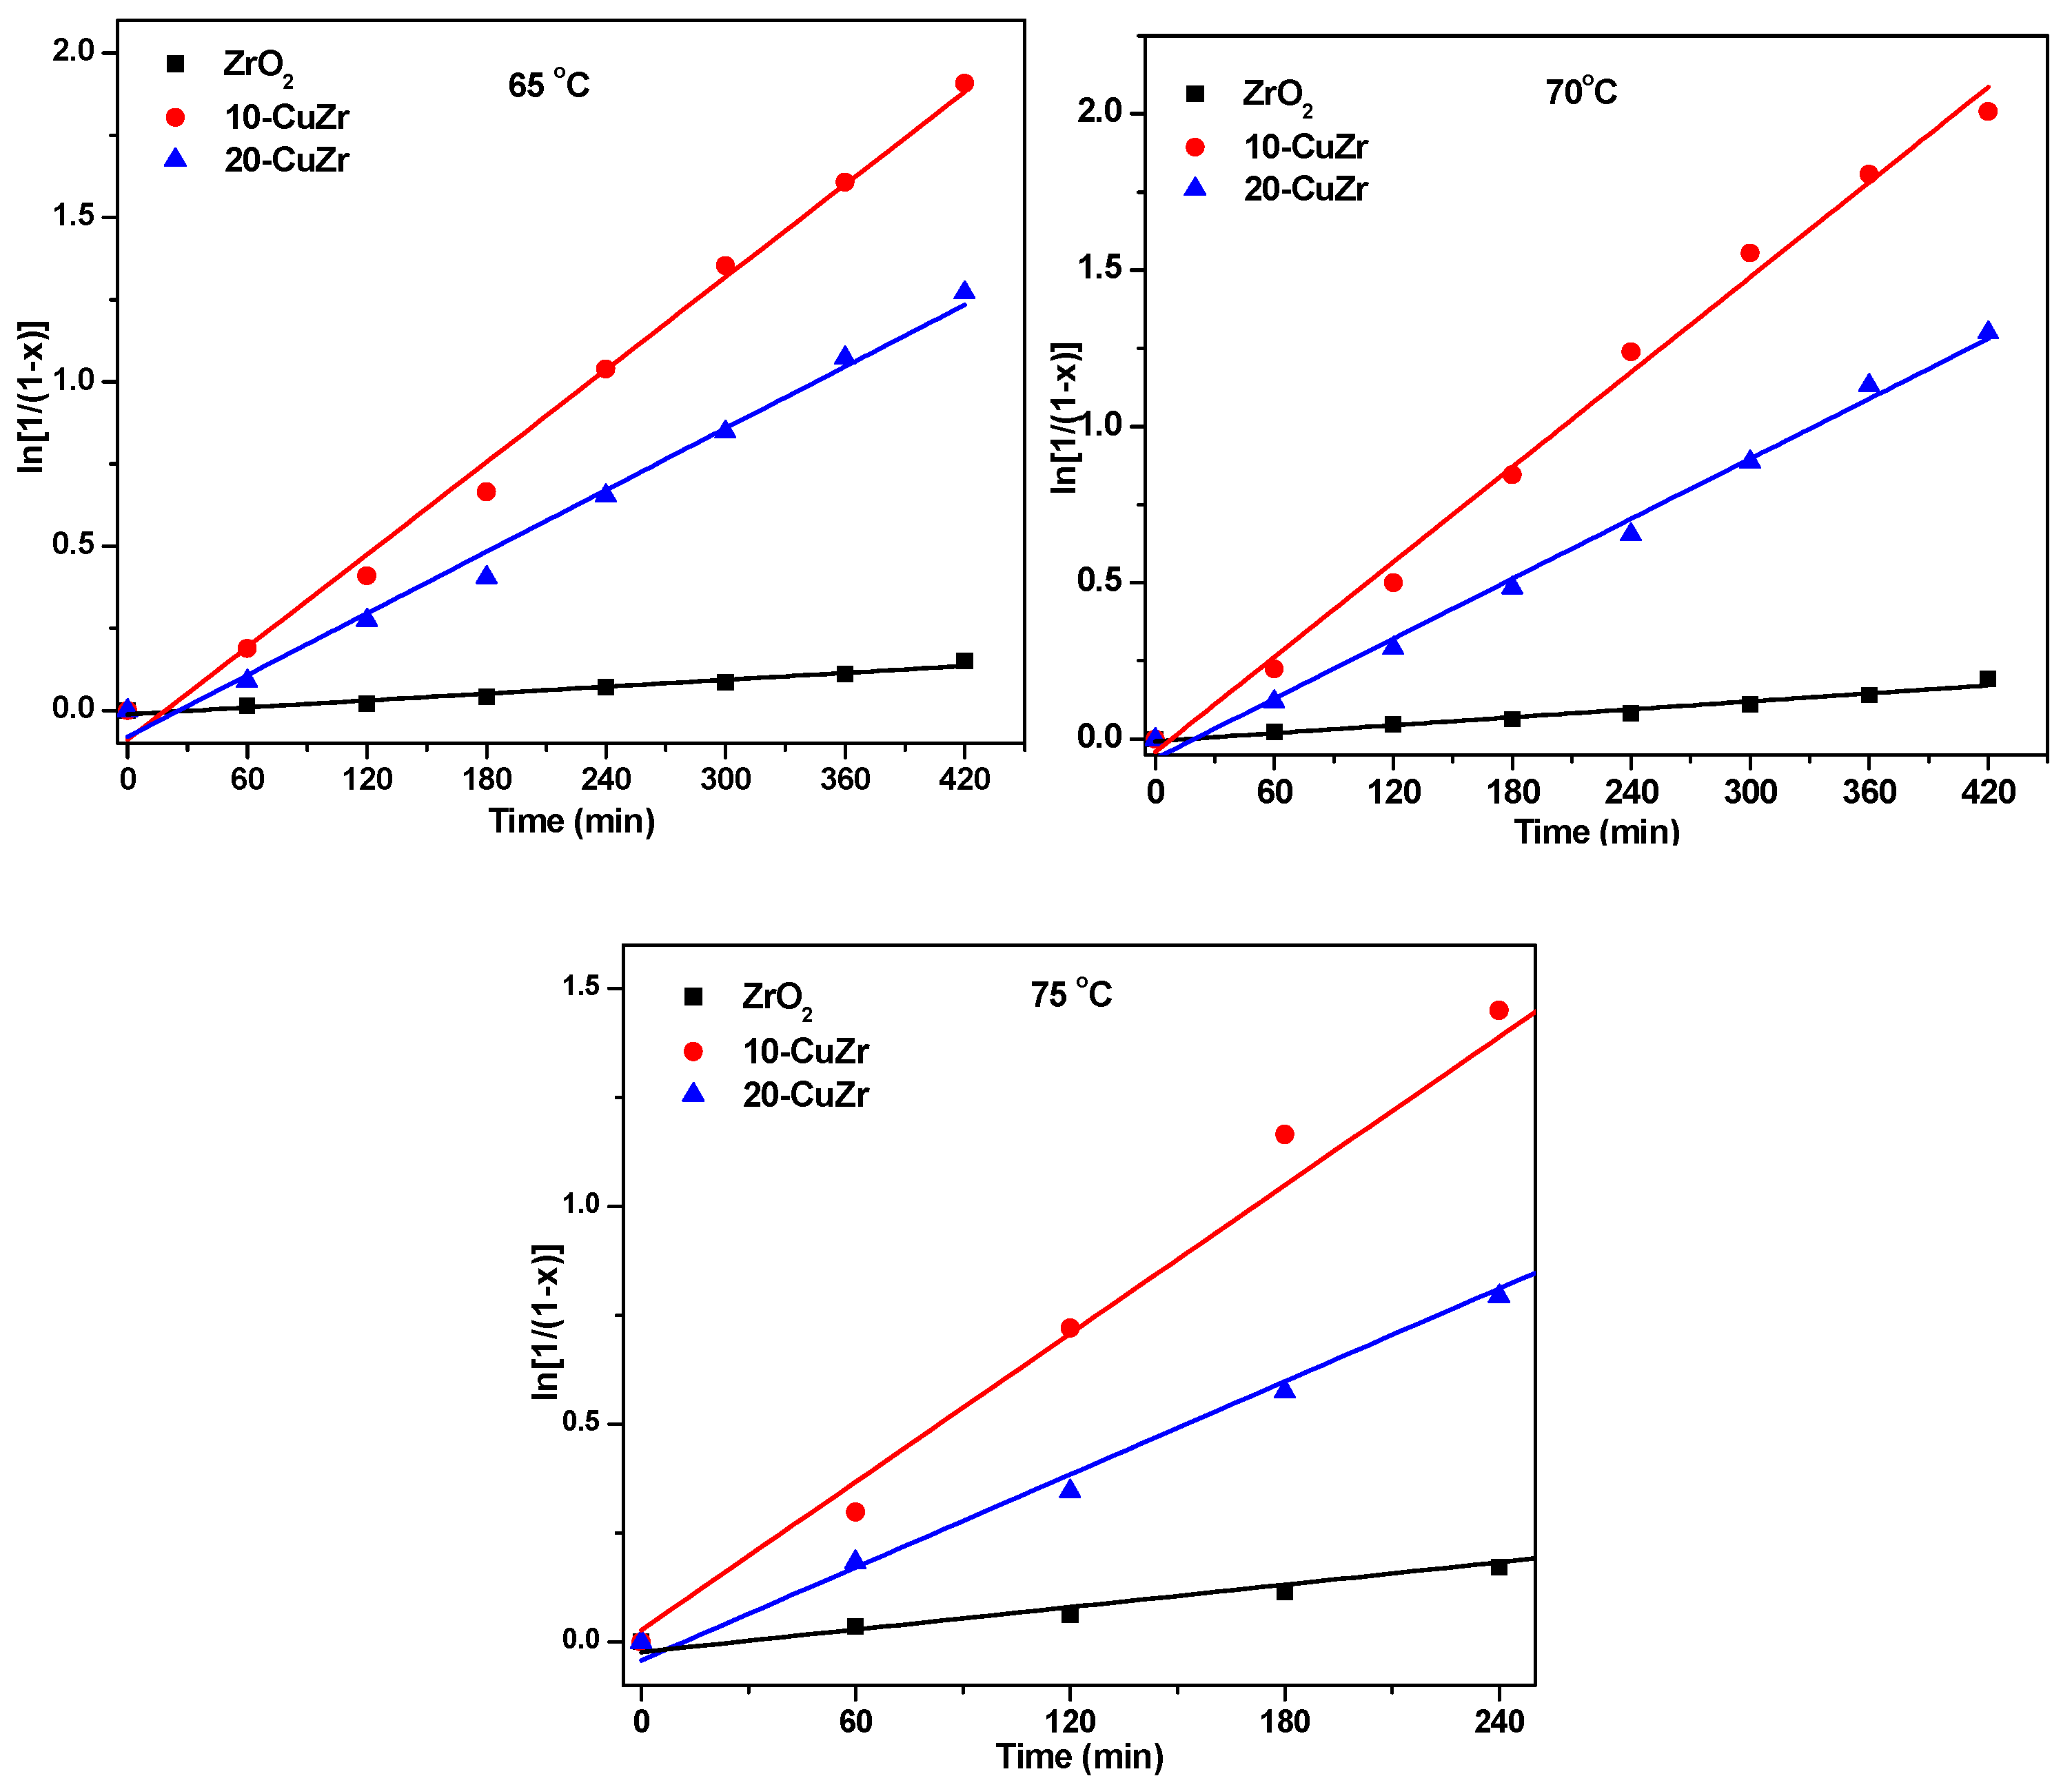
A clear difference was observed in benzylation activity of CuZr nanocomposites with different CuO composition; thus, it can be assumed that the catalytic activity of these catalysts in benzylation was affected by their composition and physico-chemical properties. The kinetic data for the benzylation reaction in excess of benzene (stoichiometric ratio of benzene/benzyl chloride = 15) over ZrO
2 support and CuZr nanocomposites could be fitted well to a pseudo-first-order rate law: ln[1/1 −
x] =
k[
t −
t0] where
k is the apparent first-order rate constant,
x is the fractional conversion of benzyl chloride,
t is the reaction time and
t0 is the induction period which corresponds to the time required for reaching equilibrium temperature. Plots of ln[1/1 −
x] as a function of time at 65 °C, 70 °C and 75 °C were shown in
Figure 9.
It is clear from the data tabulated in
Table 4 that the reaction rate constant
ka for 10-CuZr catalyst is much higher than that of bare ZrO
2 support. In addition, the turnover frequency (TOF) was calculated based on the number of moles of benzyl chloride converted per moles of metal oxide per second. The observed TOF is 97.8 h
−1 for ZrO
2, 1234.5 h
−1 for 10-CuZr and 983.1 h
−1 for 20-CuZr, respectively (
supporting information, Table S1). The TOF data again reveal that the enhancement of catalytic performance was influenced by the CuO loading. The influence of TOF on the CuO loading clearly suggests that the presence of a higher number of CuO-ZrO
2 interactive species plays a role in benzylation activity. The DPM selectivity is more or less the same in the case of ZrO
2 and CuZr nanocomposites. The product distribution mainly comprised of DPM (99%), with a minor quantity of DBE (6%).
It is widely reported that the crucial step in the Friedel-Crafts alkylation mechanism is the formation of the carbocation and the acidic centers presented in the catalyst facilitates the carbocation formation [
13]. The synthesized CuZr catalysts possessed mainly Lewis and Brönsted acid centers, which are primarily responsible for catalyzing the selective benzylation. A significant increase of activity after impregnation of 10 wt. % CuO over ZrO
2 was clearly observed and further increase of CuO loading to 20 wt. % resulted decrease catalytic activity. The decrease of activity is primarily related to the fact that 20-CuZr sample possessed crystalline CuO species and a lower number of CuO-ZrO
2 interactive species.
To obtain an insight into the role of CuO loading in the benzylation reaction, we determined the activation energy (
Ea) for benzylation of benzene over CuZr nanocomposites. The Arrhenius equation was used to calculate the benzylation reaction rate constant (
ka) for three catalysts at 65 °C, 70 °C and 75 °C. The Arrhenius plots of benzylation reaction for ZrO
2 support and CuZr nanocomposite samples are shown in
Figure S3 (supporting information). The calculated
Ea values are shown in
Table S1. The apparent activation energy for ZrO
2 support, 10-CuZr and 20-CuZr is 65.9 kJ·mol
−1, 59.2 kJ·mol
−1 and 62.3 kJ·mol
−1, respectively, and the observed values are in relatively good accordance with the benzylation activity shown by these samples.
The XRD, DR UV-vis, XPS and H
2-TPR characterization results reveal that CuZr samples are not simply a physical mixture. Instead, a strong interaction exists between CuO and ZrO
2, which led to the formaction of Cu
2+–O–Zr
4+ bonds in these samples. The XRD pattern of 10-CuZr sample did not show presence of Cu
2O or CuO crystalline phase, which means Cu
+ and Cu
2+ species should have presented as highly disperse phases on the surface of the ZrO
2, probably due to strong interaction of CuO with ZrO
2 at 10 wt. % CuO loading. It has been reported that Cu
2+ ions can be incorporated into the ZrO
2 lattice; however, incorporation of Cu did not occur, since no mixed oxide phase was observed in the CuZr samples. XPS spectra of CuZr samples clearly showed two different peaks corresponding to two different surface Cu species with different oxidation states (Cu
2+ and Cu
+). It is most probable that the Cu ions are bonded to the oxygen anions on the surface of ZrO
2 forming Zr–O–Cu groups. It was also reported that the formation of the Cu–O–Zr bonds in CuAlZr containing catalysts brings a synergistic interaction between Cu and Zr and this facilitates the reduction of Cu
2+ species [
55]. An enhanced reducibility of Cu
2+ in both of the. CuZr samples observed by H
2-TPR results provide strong evidence that Cu–O–Zr bonds presented in the synthesized samples. Dongare
et al. [
23] observed a decrease of lattice parameters of ZrO
2 with an increase of Cu content (maximum 20 mol%). The authors claimed that incorporation of Cu
2+ in the lattice position of Zr
4+ ions could be the main reason for this. Hu
et al. [
55] also observed that addition of CuO delayed the phase transformation of ZrO
2 from tetragonal to monoclinic at 700 °C. These authors observed a decrease in lattice parameter of ZrO
2 with an increase of CuO content to 30 mol%. We also calculated the lattice parameters of all the catalysts (
Table S2) and have not observed any considerable change after 10 wt. % or 20 wt. % of CuO impregnation. This is possibly due to the different method of preparation we adopted to synthesize the CuZr catalysts in this study. The characterization results also clearly indicated that the CuO particles were dispersed on bulk ZrO
2 structure. It is known that, upon thermal treatment, CuO particles could sinter and agglomerate readily. The sintering and agglomeration was more pronounced in the case of 20-CuZr sample. In contrast, highly dispersed CuO species were formed in the case of 10-CuZr catalyst. Formation of highly dispersed CuO species in the case of 10-CuZr sample is responsible for improved catalytic performance.
It is well known that Friedel-Crafts alkylation is an electrophilic substitution reaction in which complexation of alkyl or aryl halide with the catalyst lead to formation the carbocation [
56]. Then, the formed carbocation attacks the aromatic species to form mono-alkylation product and hence formation of carbocation is a crucial step in the reaction mechanism. Thus, a catalyst which contained strong Lewis acid sites could produce carbocation efficiently to offer an enhanced activity in benzylation of benzene with benzyl chloride. The NH
3-TPD and FTIR pyridine adsorption measurements revealed that 10-CuZr catalyst possessed mostly strong Brönsted and Lewis acid sites and showed the highest benzylation activity. The different spacing and symmetry of the Zr–O and –OH bonds at tetragonal ZrO
2 phase (20-CuZr) and monoclinic ZrO
2 (10-CuZr) could also play a key role in determining the dispersion of the active metal component and the catalytic properties of Cu-Zr catalysts [
57].
We are interested in comparing the activity of the CuZr nanocomposites with the reported Cu based catalysts. In comparison with the Cu-exchanged clay [
18] and Cu-HMS [
19] catalysts, 10-CuZr catalyst is more active and equally stable at very similar conditions. The previously reported mesoporous Cu catalysts (Cu-clay and Cu-HMS) showed 100% conversion with good selectivity to mono-alkyl product at 80 °C; however, 10-CuZr catalyst synthesized in this study offered the same activity at low reaction temperature (75 °C), indicating that 10-CuZr is more active than Cu-clay and Cu-HMS catalysts.


 ,
, 


