3.1. Characterization of Catalysts
Table 1 summarizes the basic characteristics of the Na-Mont and Al
13-Mont before and after calcination. The value of the basal plane reflection (
d001) at the lowest angle in the XRD pattern includes the thickness of a host layer and the gallery height of an interlayer region [
26,
33]. Because the interlayer cations support the montmorillonite layers, any alternations of interlayer cations certainly cause changes of the
d001 basal plane in the XRD pattern. The thickness of the host layer is about 9.3 Å for montmorillonite compounds [
26,
27]. As shown in
Table 1, the
d001 basal plane at 25 °C in the XRD pattern increased from 12.4 Å to 19.2 Å after Al
13 polyoxocation pillaring. After subtracting the thickness of the host layer (9.3 Å) from the
d001 spacing, Na-Mont had a gallery height of 3.1 Å and Al
13-Mont had a gallery height of 9.9 Å. The Al
13 polyoxocations were successfully introduced into the interlayer region in Al
13-Mont because the gallery height coincided with the size of Al
13 polyoxocation [
26,
27]. The
d001 value of Na-Mont decreased to 10.6 Å after calcination at 300 °C for 3 h and could not be observed after calcination at 500 °C for 3 h.
Table 1.
Basic characteristics of raw montmorillonite and its Al13-pillared derivative.
Table 1.
Basic characteristics of raw montmorillonite and its Al13-pillared derivative.
| Sample | Tcalcination (°C) | d001 (Å) | BET (m2/g) | Total Vp (cm3/g) | MicroVp (cm3/g) |
|---|
| Na-Mont | 25 | 12.4 | 82 | 0.079 | 0.004 |
| | 300 | 10.6 | 38 | 0.068 | 0.005 |
| | 400 | 10.5 | 29 | 0.065 | 0.004 |
| | 500 | – | 26 | 0.063 | 0.003 |
| Al13-Mont | 25 | 19.2 | 156 | 0.150 | 0.078 |
| | 300 | 18.5 | 237 | 0.170 | 0.111 |
| | 400 | 18.5 | 270 | 0.180 | 0.122 |
| | 500 | 17.9 | 189 | 0.152 | 0.103 |
As shown in
Table 1, the BET surface area of Al
13-Mont was significantly higher than that of its precursor Na-Mont at 25 °C. The height between two clay layers in Na-Mont was only 3.1 Å (from XRD results) and many water molecules existed in the interlayer region at 25 °C. Hence, the interior of the interlayer region in Na-Mont was difficult to utilize for adsorbing N
2 molecules in the BET measurement. On the other hand, the gallery height of Al
13-Mont increased to 9.9 Å (from XRD results) and thus N
2 molecules easily enter the interlayer region, which caused a significant increase of BET surface area of Al
13-Mont at 25 °C. Moreover, the BET surface area of Na-Mont decreased to 38 m
2/g after calcination at 300 °C for 3 h due to the collapse of the layered structure. On the other hand, the
d001 value of Al
13-Mont slightly decreased to 18.5 Å upon calcination at 300 °C due to the dehydration of Al
13 polyoxocation. The BET surface area of Al
13-Mont increased with increasing calcination temperature up to 400 °C, followed by a decrease of surface area upon calcination at 500 °C. Hence, Al
13-Mont retained the layered structures after calcination at 400 °C owing to the robust polyoxocation pillars but were partly destroyed upon calcination at 500 °C. As for the pore size of a montmorillonite compound, it is defined not only by the interlayer distance (between two clay layers) but also by the lateral distance (between two interlayer pillars). The micropore (pores diameter <20 Å) volume of Na-Mont was very low (about 0.004 cm
3/g). On the other hand, Al
13-Mont is a misroporous material because its micropore volume is relatively large. Both the total pore volume and the micropore volume of Al
13-Mont increased with increasing calcination temperature up to 400 °C and decreased upon calcination at 500 °C due to partial destruction of the layered structure. Therefore, the calcination temperature for Al
13-Mont-containing catalysts was set at 400 °C in this study.
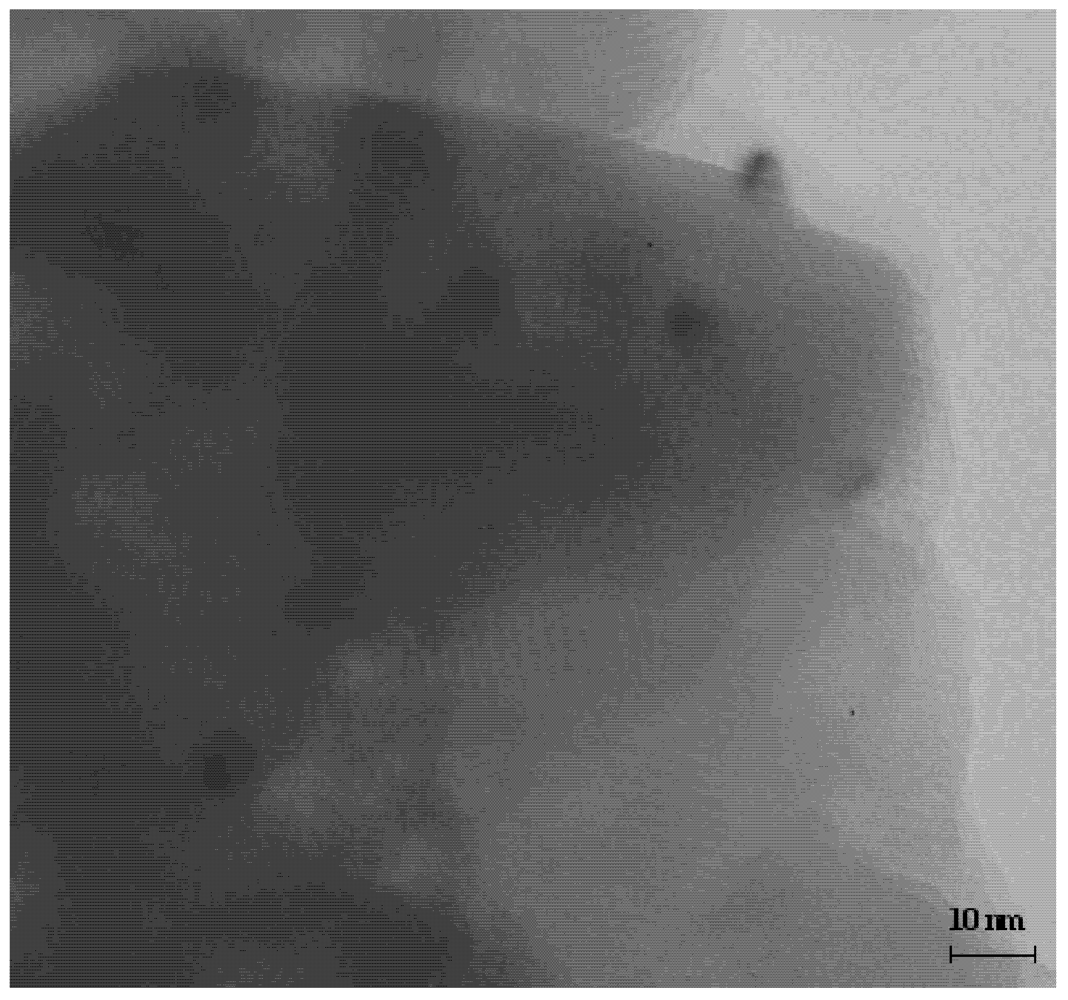
Figure 2 shows the TEM image of Ru/Al
13-Mont (Ru loading: 1 wt%) catalyst after reduction in a H
2 flow at 300 °C for 2 h. The layered structure of montmorillonite support could be observed from the TEM image. The gallery height was about 1 nm and this value coincided with the size of Al
13 polyoxocation. The black Ru particles could be observed on the surface of the montmorillonite support. The Ru particles did not enter into the interlayer region of montmorillonite in Ru/Al
13-Mont. The distribution of Ru particles was relatively uniform and the particle size of Ru was about 3–5 nm.
Figure 2.
TEM image of Ru/Al13-Mont (Ru loading: 1 wt%) catalyst after reduction.
Figure 2.
TEM image of Ru/Al13-Mont (Ru loading: 1 wt%) catalyst after reduction.
Figure 3.
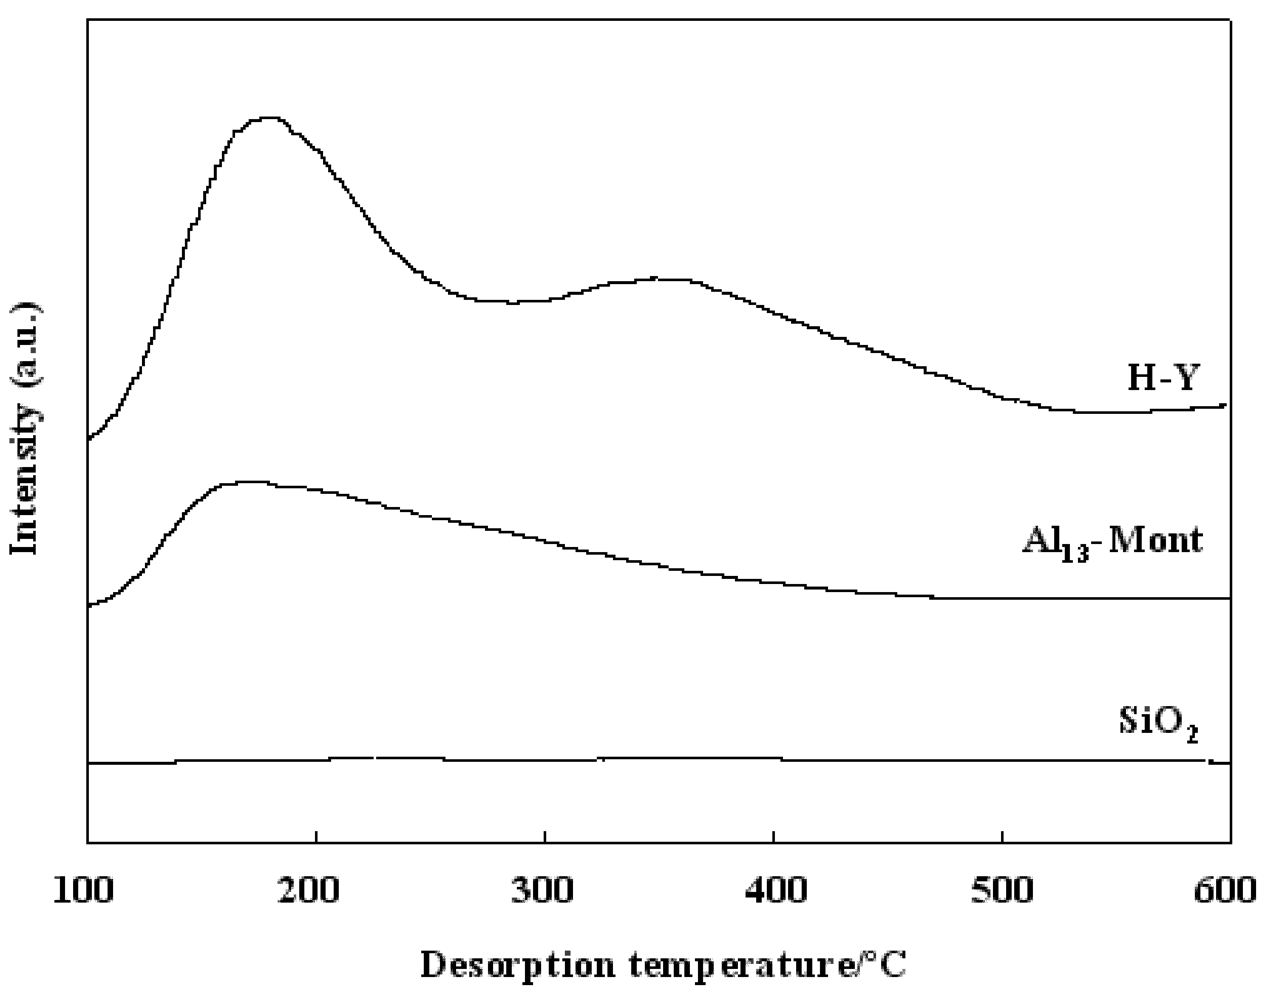
NH3-TPD profiles of various solid supports.
Figure 3.
NH3-TPD profiles of various solid supports.
Figure 3 shows the NH
3-TPD of various solid supports used in this study. NH
3-TPD is a powerful tool for estimating the acidic property of a solid surface. The adsorbed NH
3 molecules desorbed from weak acid sites at low temperatures and desorbed from strong acid sites at high temperatures. As shown in
Figure 3, SiO
2 did not show an obvious peak in the NH
3-TPD profile, indicating that SiO
2 did not have acid sites on the surface. Al
13-Mont had acid sites on the surface area because its NH
3-TPD showed a peak with a maximum value at 170 °C. Because H-Y showed two peaks at about 180 and 350 °C, H-Y had two types of acid sites (weak acid sites and strong acid sites) on the surfaces. The peak at the maximum temperature in the NH
3-TPD profile corresponds to the strongest acid sites on the solid surface. The nature of a solid acid catalyst is mainly determined by the strongest acid sites on the surface. According to the peak position at the maximum temperature in the NH
3-TPD profiles, the acidic strength of various supports was in an order of H-Y > Al
13-Mont > SiO
2 (no acidity).
3.2. Composition and Property of Waste Cooking Oil
Table 2 shows the composition and property of the waste cooking oil used in this study.
Table 2.
Composition and property of the waste cooking oil used in this study.
Table 2.
Composition and property of the waste cooking oil used in this study.
| Elemental composition | C | H | N | S | O |
| Weight percent (wt%) | 77.91 | 11.69 | 0.04 | 0 | 10.36 |
| Chemical composition | Triglyceride | Diglyceride | Monoglycerid | Free fatty acid |
| Content (g/100 g-oil) | 79.1 | 1.8 | 2.2 | 16.9 |
| Others | Acid value (mg-KOH/g-oil) | Iodine value (g-I2/100 g-oil) | Viscosity (mPa/s) | Density (g/mL) |
| 28.7 | 88.6 | 57.8 | 0.92 |
The elemental composition of the waste cooking oil was determined using an elemental analyzer (CE instrument EA1110). The difference from 100% was taken as the content of oxygen. As shown in
Table 2, the amount of N was very small (0.04 wt%) and S could not be observed in the waste cooking oil. In general, vegetable oils do not contain sulfur-containing compounds. Therefore, the bio-diesels produced from vegetable oils are regarded as environmentally benign green fuels. Concurrently, the development of catalysts for the hydrotreatment of vegetable oils (without S) is different from those for the hydrotreatment of fossil fuels with sulfur-containing compounds.
The chemical components in the waste cooking oil were confirmed by GC-MS results and standard reagents. The content of free fatty acids was very high (16.9 g/100 g-oil) in the waste cooking oil. It seems that the waste cooking oil can not be used as a straight vegetable oil (SVO) just after filtration because the free fatty acids are corrosive to diesel engines. For the FAME production, base catalysts lose their activity in the transesterfication of cooking vegetable oil because of soap formation from free fatty acids and basic catalysts. A complex two-step process has to be used for the FAME production (using acid catalyst to convert free fatty acids in the first step and using base catalyst to convert triglycerides in the second step) which must increase the cost of the FAME production. Therefore, the one-step hydrotreatment process is suitable for the commercial production of BHD from waste cooking oil.
As for the physical properties, the acid value of the waste cooking oil was very high (28.7 mg-KOH/g-oil) because it contained a large amount of free fatty acids. The iodine value of the waste cooking oil was 88.6 g-I2/100 g-oil, indicating that the waste cooking oil contained many C=C unsaturated bonds. The viscosity at 30 °C was 57.8 mPa/s and the density at 25 °C was 0.92 g/mL for the waste cooking oil. The viscosity was too high to use the waste cooking oil in current diesel engines.
Table 3 shows the species of free fatty acid (FFA) in the waste cooking oil used in this study. The formula of each fatty acid was confirmed by GC-MS (HP-624 capillary column) results with standard reagents. The content of each fatty acid shown in
Table 3 was expressed as its weight in 100 g free fatty acid, while 100 g waste cooking oil contained 16.9 g free fatty acid (
Table 2). The main free fatty acids in the waste cooking oil were palmitic acid (6.6%), stearic acid (7.8%), oleic acid (53.6%), linoleic acid (16.4%), and linolenic acid (14.3%). The unsaturated fatty acids (with C=C double bond) included palmitoleic, oleic, linoleic, linolenic, and eicosenoic acids, while the saturated fatty acids (without C=C double bond) included palmitic and stearic acids. By calculating using these data, the unsaturated fatty acids occupied 85.6% and the saturated fatty acids occupied 14.4% in total free fatty acids of the waste cooking oil. All free fatty acids in the waste cooking oil had even carbon numbers (16, 18, and 20) in the carbon chains. The fatty acids with sixteen carbons in the carbon chain (so-called C
16-acids, including palmitic and palmitoleic acids) occupied 6.8%, the fatty acids with eighteen carbons in the carbon chain (so-called C
18-acids, including stearic, oleic, linoleic and linolenic acids) occupied 92.1%, and the fatty acids with twenty carbons in the carbon chain (so-called C
20-acids, including eicosenoic acid) occupied 1.1% in total free fatty acids of the waste cooking oil.
Table 3.
Species of free fatty acid (FFA) in the waste cooking oil used in this study.
Table 3.
Species of free fatty acid (FFA) in the waste cooking oil used in this study.
| Formula | Name | Structure a | Content (g/100 g-FFA) |
|---|
| C16H32O2 | Palmitic | C16:0 | 6.6 |
| C16H30O2 | Palmitoleic | C16:1 | 0.2 |
| C18H36O2 | Stearic | C18:0 | 7.8 |
| C18H34O2 | Oleic | C18:1 | 53.6 |
| C18H32O2 | Linoleic | C18:2 | 16.4 |
| C18H30O2 | Linolenic | C18:3 | 14.3 |
| C20H38O2 | Eicosenoic | C20:1 | 1.1 |
3.3. Hydrotreatment of Waste Cooking Oil over Ru-Supported Catalysts
Table 4 shows the product yields over various catalysts in the hydrotreatment of waste cooking oil. The conversion was 100% and did not decrease after reaction for 10 h over each catalyst because triglycerides and fatty acid acids could not be detected in the products. The yield of fuel gas (C
1 + C
2) was very low (<1.0 wt%) over each catalyst. The yield of liquid fuel (C
5+ hydrocarbons) was in a narrow range of 82.1–84.0 wt% and the yield of LPG (C
3 + C
4) was in a narrow range of 4.8–5.6 wt% over each catalyst. Both liquid hydrocarbons (C
5+) and LPG (C
3 + C
4) can be used as fuels for automobiles. Water (yield: 7.7–8.0 wt%) and CO
x (including CO and CO
2, yield: 3.2–3.4 wt%) were also formed in the hydrotreatment process over each catalyst. Because propane is formed after all C=O bonds in triglycerides are broken during the hydrotreatment process, propane occupied more than 90 wt% in the formed LPG (C
3 + C
4) over each catalyst.
Table 4.
Product yields over various catalysts in the hydrotreatment of waste cooking oil a.
Table 4.
Product yields over various catalysts in the hydrotreatment of waste cooking oil a.
| Catalyst | C1 + C2 | C3 + C4 | C5+ | COx | H2O |
|---|
| Ru/SiO2 | 0.2 | 4.8 | 84.0 | 3.3 | 7.7 |
| Ru/Al13-Mont | 0.4 | 5.0 | 83.6 | 3.2 | 7.8 |
| Ru/H-Y | 0.9 | 5.6 | 82.1 | 3.4 | 8.0 |
The waste cooking oil contained triglycerides, diglycerides, monoglycerides, and free fatty acids (
Table 2). The hydrotreatment process on the Ru sites contained two steps: hydrogenation and deoxygenation. In the first step, all unsaturated C=C bonds in the triglycerides, diglycerides, monoglycerides, and free fatty acids were saturated on their carbon chains by the hydrogenation on the Ru sites. In the second step, the saturated triglycerides decomposed by scission of the C=O bonds, leading to the formation of diglycerides, monoglycerides, and carboxylic acids (fatty acids) in order, and the carboxylic acids then underwent deoxygenation on the Ru sites to form hydrocarbons. Therefore, the key step in the hydrotreatment of waste cooking oil is the deoxygenation of saturated fatty acids.
The deoxygenation of saturated fatty acids (such as stearic acid C
17H
35COOH) contains three parallel reactions: reduction, decarbonylation, and decarboxylation [
22].
| C17H35COOH + 3H2 = C18H38 + 2H2O | (Reduction) | (Reaction 1) |
| C17H35COOH + H2 = C17H36 + CO + H2O | (Decarbonylation) | (Reaction 2) |
| C17H35COOH = C17H36 + CO2 | (Decarboxylation) | (Reaction 3) |
As shown in Reactions 1–3, for a fatty acid with an even carbon number, the reduction produces a normal paraffin with an even carbon number plus water; the decarbonylation produces a normal paraffin with an odd carbon number plus water and CO; and the decarboxylation produces a normal paraffin with an odd carbon number plus CO2. Both the decarbonylation and the decarboxylation occurred during the reaction because both CO and CO2 were detected in the gas product over each catalyst.
As shown in
Table 4, the three catalysts had similar yields of C
5+ liquid hydrocarbons (ranging from 82.1 to 84.0 wt%) from the hydrotreatment of waste cooking oil. However, it is necessary to investigate whether these liquid hydrocarbons are suitable for use as a diesel fuel in current diesel engines.
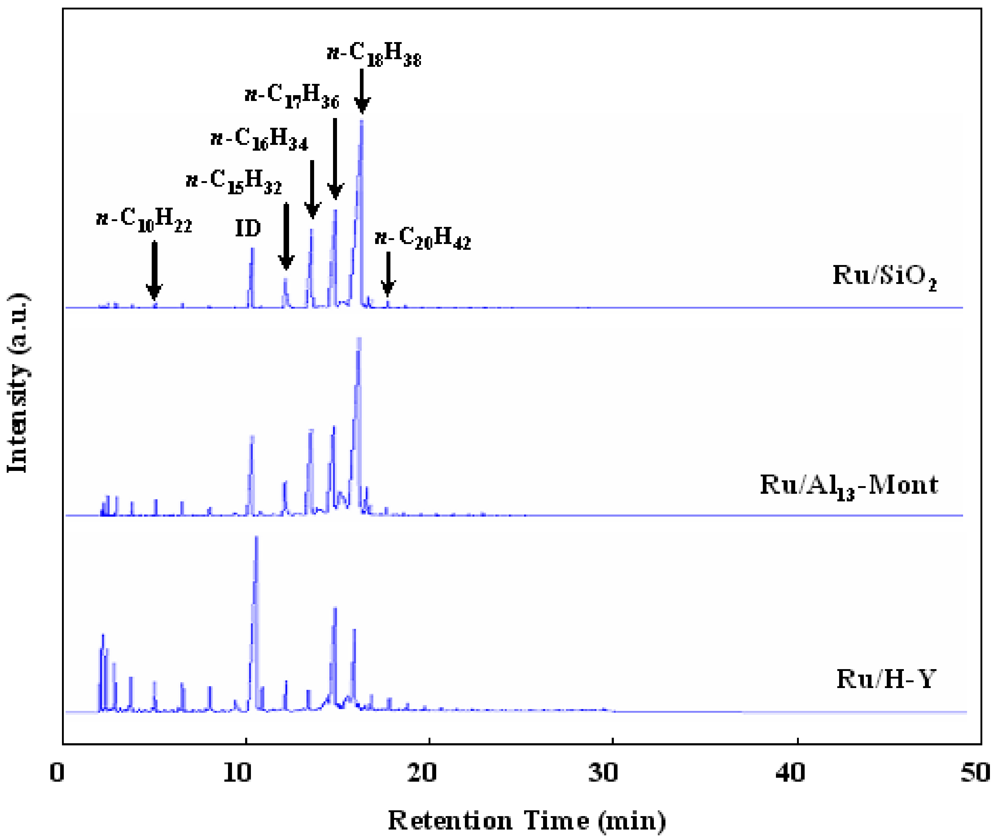
Figure 4 shows the FID-GC charts (UA-DX capillary column) of liquid hydrocarbons formed from the hydrotreatment of waste cooking oil over various catalysts. Ru/SiO
2 formed
n-C
18H
38,
n-C
17H
36,
n-C
16H
34, and
n-C
15H
32 as the main products and the amounts of
iso-paraffins and light paraffins (≤C
14) were very low. According to Reactions 1–3,
n-C
16H
34 and
n-C
18H
38 were formed by the reduction of palmitic acid and stearic acid, and
n-C
15H
32 and
n-C
17H
36 were formed by the decarbonylation and decarboxylation of palmitic acid and stearic acid, respectively. In order to adjust the chemical composition of the liquid hydrocarbon product, we supported Ru catalyst on solid acids (H-Y, Al
13-Mont) for the isomerization/cracking of C
15H
32–C
18H
38 n-paraffins as the third step after the hydrogenation and deoxygenation steps. The isomerization/cracking of
n-paraffins over bifunctional catalysts containing metal and solid acid is very important for improving the properties of liquid hydrocarbon fuels [
34,
35,
36,
37]. The reaction proceeds via carbenium ion intermediates formed on the solid acid sites. The acidic strength of the solid acid determines the activity of the bifunctional catalysts when the same metal is used in the isomerization/cracking of
n-paraffins. Because the acidic strength of various supports was in the order of H-Y > Al
13-Mont > SiO
2 (
Figure 3), Ru/H-Y formed a large amount of light hydrocarbons (≤C
14) and Ru/Al
13-Mont formed a significant amount of light hydrocarbons (≤C
14) (
Figure 4).
Figure 4.
FID-GC charts of liquid hydrocarbons formed from the hydrotreatment of waste cooking oil over various catalysts (reaction conditions: same as those in
Table 4).
Figure 4.
FID-GC charts of liquid hydrocarbons formed from the hydrotreatment of waste cooking oil over various catalysts (reaction conditions: same as those in
Table 4).
Table 5.
Composition and property of the liquid hydrocarbons (C5+) formed from the hydrotreatment of waste cooking oil over various catalysts a.
Table 5.
Composition and property of the liquid hydrocarbons (C5+) formed from the hydrotreatment of waste cooking oil over various catalysts a.
| Catalyst | Composition (wt%) | Property |
|---|
| C5–C10 | C11–C20 | C20+ | Iso/n ratio | Pour Point (°C) | Density at 25 °C (g/mL) | Viscosity at 30 °C (mPa/s) |
|---|
| Ru/SiO2 | 0.9 | 98.9 | 0.2 | 0.08 | 20 | 0.79 | 8.01 |
| Ru/Al13-Mont | 9.1 | 89.8 | 1.1 | 0.22 | −15 | 0.78 | 3.96 |
| Ru/H-Y | 42.8 | 56.5 | 0.7 | 0.43 | — b | 0.77 | 2.08 |
| Normal diesel c | 8.2 | 88.1 | 3.7 | 0.28 | −15 | 0.82 | 3.69 |
Table 5 shows the composition and property of the liquid hydrocarbons (C
5+) formed from the hydrotreatment of waste cooking oil over various catalysts. Although the liquid hydrocarbons formed over Ru/SiO
2 contained the largest amount of C
11–C
20 diesel-distillate (98.9 wt%) with the lowest
iso/n ratio (0.08) among various catalysts, the pour point of the product was too high (20 °C) to use as a diesel fuel. Ru/H-Y was also not suitable for producing BHD from the waste cooking oil because it formed a large amount of C
5–C
10 gasoline-distillate (42.8 wt%) on the strong acid sites. Ru/Al
13-Mont produced a liquid hydrocarbon product with a pour point of −15 °C with an
iso/n ratio of 0.22.
The melting points of
n-C
18H
38,
n-C
17H
36,
n-C
16H
34, and
n-C
15H
32 are 28, 22, 18, and 10 °C, respectively. A predominant amount of C
15–C
18 n-paraffins gave a high pour point (20 °C) for the liquid hydrocarbon product over Ru-Mo/SiO
2 (
Table 5). It is necessary to decrease the pour point of the product over Ru/SiO
2 in order to use it in the current diesel engines.
Iso-paraffins and light paraffins have relatively low melting points (for example, 2-methyl-heptadecane: 5 °C; 3-methyl-heptadecane: −6 °C; 2-methyl-hexadecane: 5 °C; 2-methyl-pentadecane: −11 °C; 3-methyl-pentadecane: −22 °C; 2-methyl-tetradecane: −8 °C; 3-methyl-tetradecane: −36 °C;
n-C
11H
24: −25 °C). Hence, we supported Ru on solid acids (Al
13-Mont and H-Y) to improve the fluidity of the liquid hydrocarbon product from the hydrotreatment of waste oil by the isomerization/cracking of C
15H
32–C
18H
38 n-paraffins.
The hydrocarbons ranging from C
11 to C
20 are called diesel-distillate and the hydrocarbons ranging from C
5 to C
10 are called gasoline-distillate. However, the commercial normal diesel bought from a petrol station actually contains 8.2 wt% of C
5–C
10 gasoline-distillate to improve the fluidity (
Table 5). The viscosity of the liquid hydrocarbon product over Ru/Al
13-Mont was 3.96 mPa/s, which was quite similar to that of the normal diesel (3.69 mPa/s). The density of the normal diesel was relatively large (0.82 g/mL), probably because the normal diesel contained some heavy additives. On the whole, both composition and pour point of the liquid hydrocarbon product over Ru/Al
13-Mont were quite similar to those of the normal diesel bought from a petrol station. Because the current diesel engines have been designed to use normal diesel as a fuel, we think that the product over Ru/Al
13-Mont (with similar composition and property to normal diesel) is better than the product over Ru/SiO
2 (with 98.9 wt% C
11–C
20 diesel-distillate and high pour point) as a diesel fuel for current diesel engines. As a result, because Al
13-Mont had a significant acidic strength, the liquid hydrocarbon product in the hydrotreatment of waste cooking oil over Ru/Al
13-Mont can be expected to give a green BHD fuel directly usable in the current diesel engines without any post-treatment processes (such as distillation, upgrading,
etc.).
3.4. Influence of Reaction Conditions in the Hydrotreatment of Waste Cooking Oil over Ru/Al13-Mont
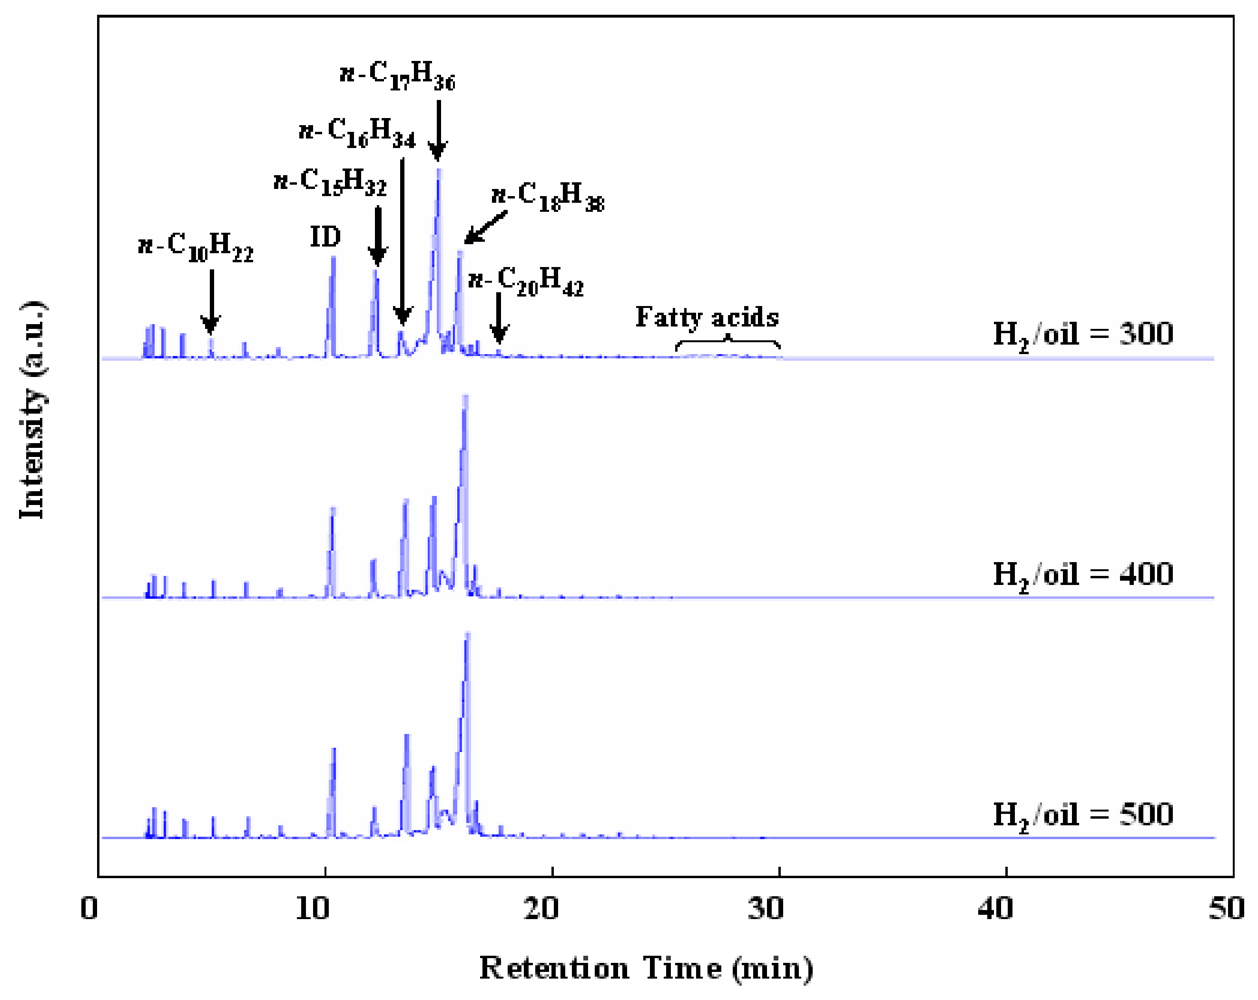
Because the molecules of triglycerides and free fatty acids in the waste cooking oil contained many unsaturated C=C bonds and C=O bonds, the H2 amount and H2 pressure are important reaction conditions for the hydrotreatment of waste cooking oil to produce saturated hydrocarbons.
Figure 5 shows the effect of H
2/oil ratio in the hydrotreatment of waste cooking oil over Ru/Al
13-Mont. The H
2/oil was a ratio of H
2 feed rate to liquid (waste cooking oil) feed rate during the reaction and the H
2 volume was described in conditions of standard temperature and pressure (STP). A low H
2/oil is desirable for producing BHD for commercialization as it is favorable to reduce the cost of production. However, the peaks of fatty acids could be detected in the GC chart at a H
2/oil ratio of 300 (
Figure 5). Thus a H
2/oil ratio of 400 was necessary for the hydrotreatment of waste cooking oil over Ru/Al
l3-Mont. As shown in Reactions 1–3, the deoxygenation of fatty acids contained three parallel reactions: reduction, decarbonylation and decarboxylation. The reduction does not produce CO
x, while both the decarbonylation and the decarboxylation produces CO
x and thus one C in the carbon chain is lost. Thus from the deoxygenation of C
16-acids and C
18-acids, the reduction produces
n-C
16H
34 and
n-C
18H
38, and the decarbonylation and decarboxylation produce
n-C
15H
32 and
n-C
17H
36. Moreover, the reduction is favorable under a large H
2/oil ratio because it consumes more H
2 molecules than the decarbonylation and decarboxylation (Reactions 1–3). Hence, the ratios of C
18/C
17 and C
16/C
15 in products over Ru/Al
13-Mont decreased with decreasing H
2/oil ratio from 500 to 300 (
Figure 5).
Figure 5.
FID-GC charts of liquid products in the hydrotreatment of waste cooking oil over Ru/Al13-Mont under various H2/oil ratios (T: 350 °C; H2 pressure: 2 MPa; liquid hourly space velocity (LHSV): 15.2 h–1).
Figure 5.
FID-GC charts of liquid products in the hydrotreatment of waste cooking oil over Ru/Al13-Mont under various H2/oil ratios (T: 350 °C; H2 pressure: 2 MPa; liquid hourly space velocity (LHSV): 15.2 h–1).
Figure 6.
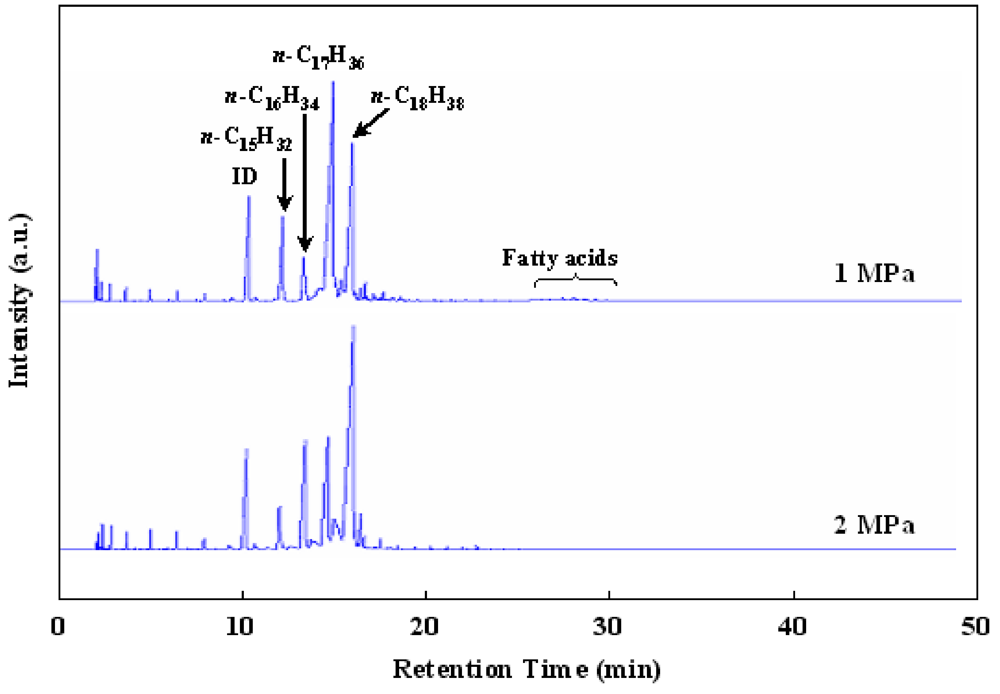
FID-GC charts of liquid products in the hydrotreatment of waste cooking oil over Ru/Al13-Mont under various H2 pressures (T: 350 °C; H2/oil: 400; LHSV: 15.2 h–1).
Figure 6.
FID-GC charts of liquid products in the hydrotreatment of waste cooking oil over Ru/Al13-Mont under various H2 pressures (T: 350 °C; H2/oil: 400; LHSV: 15.2 h–1).
Figure 6 shows the effect of H
2 pressure in the hydrotreatment of waste cooking oil over Ru/Al
13-Mont. A low H
2 pressure is desirable for producing BHD in commercialization because it is favorable to reduce the investment in plant and equipment. The peaks of fatty acids could not be observed in the GC chart under 2 MPa of H
2 pressure but could be detected in the GC chart under 1 MPa of H
2 pressure. Hence, a H
2 pressure of 2 MPa was necessary for the hydrotreatment of waste cooking oil over Ru/Al
l3-Mont. As shown in Reactions 1–3, the reduction (for producing
n-C
18H
38 and
n-C
16H
34) is favorable under a high H
2 pressure in comparison with the decarbonylation and decarboxylation (for producing
n-C
17H
36 and
n-C
15H
32). Thus the ratios of C
18/C
17 and C
16/C
15 in products over Ru/Al
13-Mont decreased with decreasing H
2 pressure.
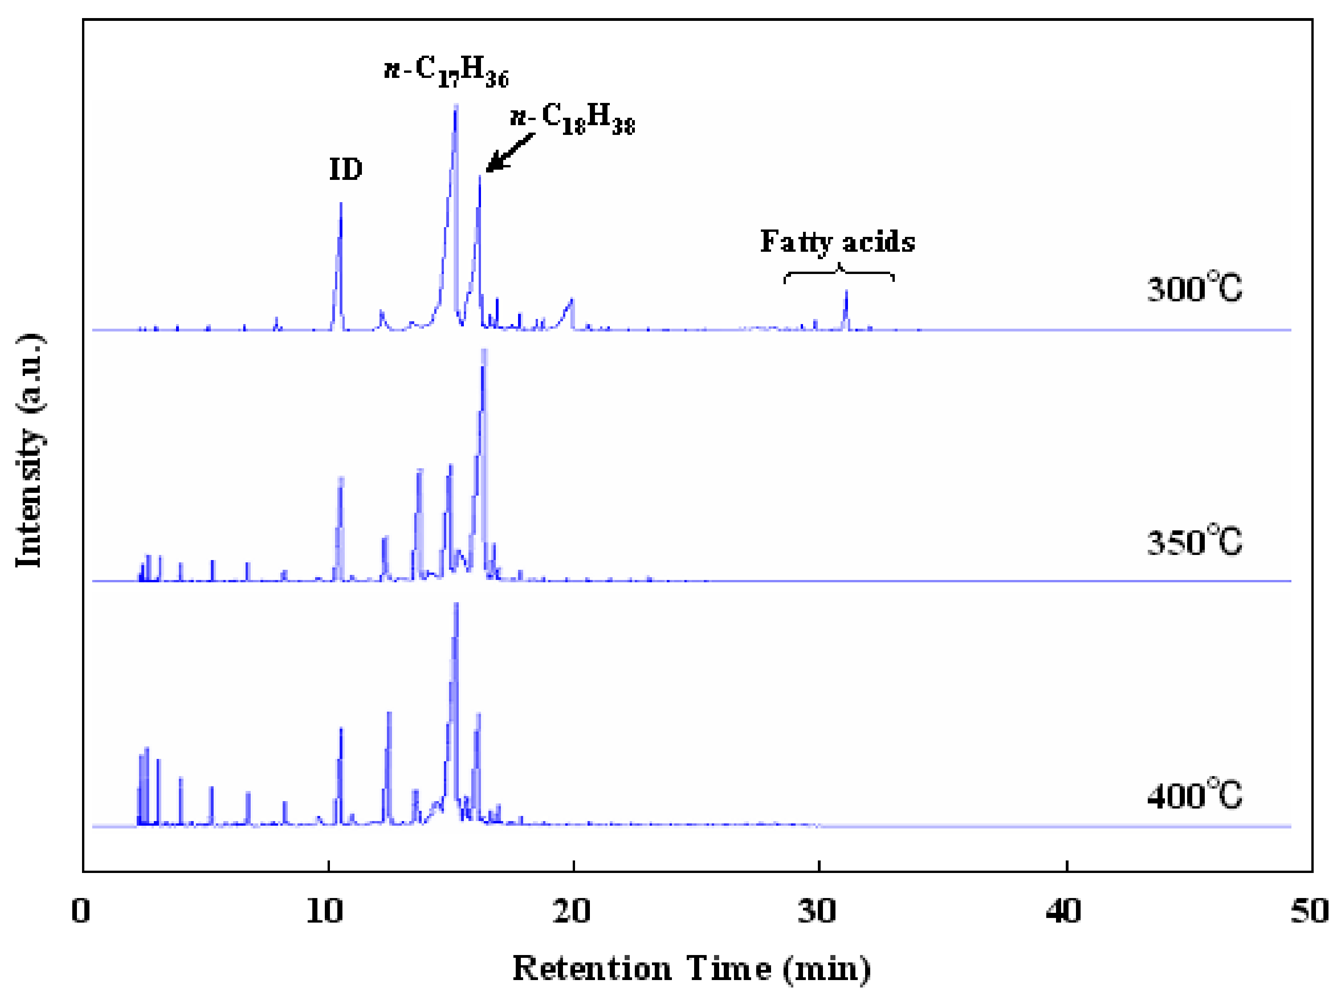
Figure 7 shows the effect of reaction temperature in the hydrotreatment of waste cooking oil over Ru/Al
13-Mont. When the reaction was carried out at a low reaction temperature of 300 °C, the peaks of fatty acids were observed in the GC chart. This means that the deoxygenation of waste cooking oil was not enough at 300 °C. The peaks of fatty acids could not be observed in GC charts at high reaction temperatures of 350 °C and 400 °C. Although
n-C
18H
38,
n-C
17H
36,
n-C
16H
34, and
n-C
15H
32 are the main products over all three catalysts, the amount of light hydrocarbons (≤C
14) formed remarkably increased when the reaction temperature increased from 300 to 400 °C. We think the cracking of C
15H
32–C
18H
38 nomal paraffins caused the increase of light hydrocarbons (≤C
14) at high reaction temperatures. Hence, the reaction temperature also can be used to adjust the composition and property of the BHD product. Because the amount of C
5–C
10 gasoline-distillate hydrocarbons was too much at 400 °C, the most suitable reaction temperature was found to be 350 °C in the hydrotreatment of waste cooking oil.
Figure 7.
FID-GC charts of liquid products in the hydrotreatment of waste cooking oil over Ru/Al13-Mont at various reaction temperatures (H2 pressure: 2 MPa; H2/oil: 400; LHSV: 15.2 h–1).
Figure 7.
FID-GC charts of liquid products in the hydrotreatment of waste cooking oil over Ru/Al13-Mont at various reaction temperatures (H2 pressure: 2 MPa; H2/oil: 400; LHSV: 15.2 h–1).
The goal of this study is to produce green BHD fuel for use in current diesel engines without any post-treatment. The liquid organic phase in the product should not contain any fatty acids because they are corrosive to engines. Moreover, a significant amount of C5–C10 gasoline-distillate (similar to the amount in commercial normal diesel) should be contained in order to adjust the physical properties of BHD fuel to fit current diesel engines. Hence, we chose a H2/oil ratio of 400 mL/mL, a H2 pressure of 2 MPa, and a reaction temperature of 350 °C as the standard reaction conditions in this study.
3.5. Deactivation of Ru/Al13-Mont and Sulfided Ni-Mo/Al13-Mont Catalysts
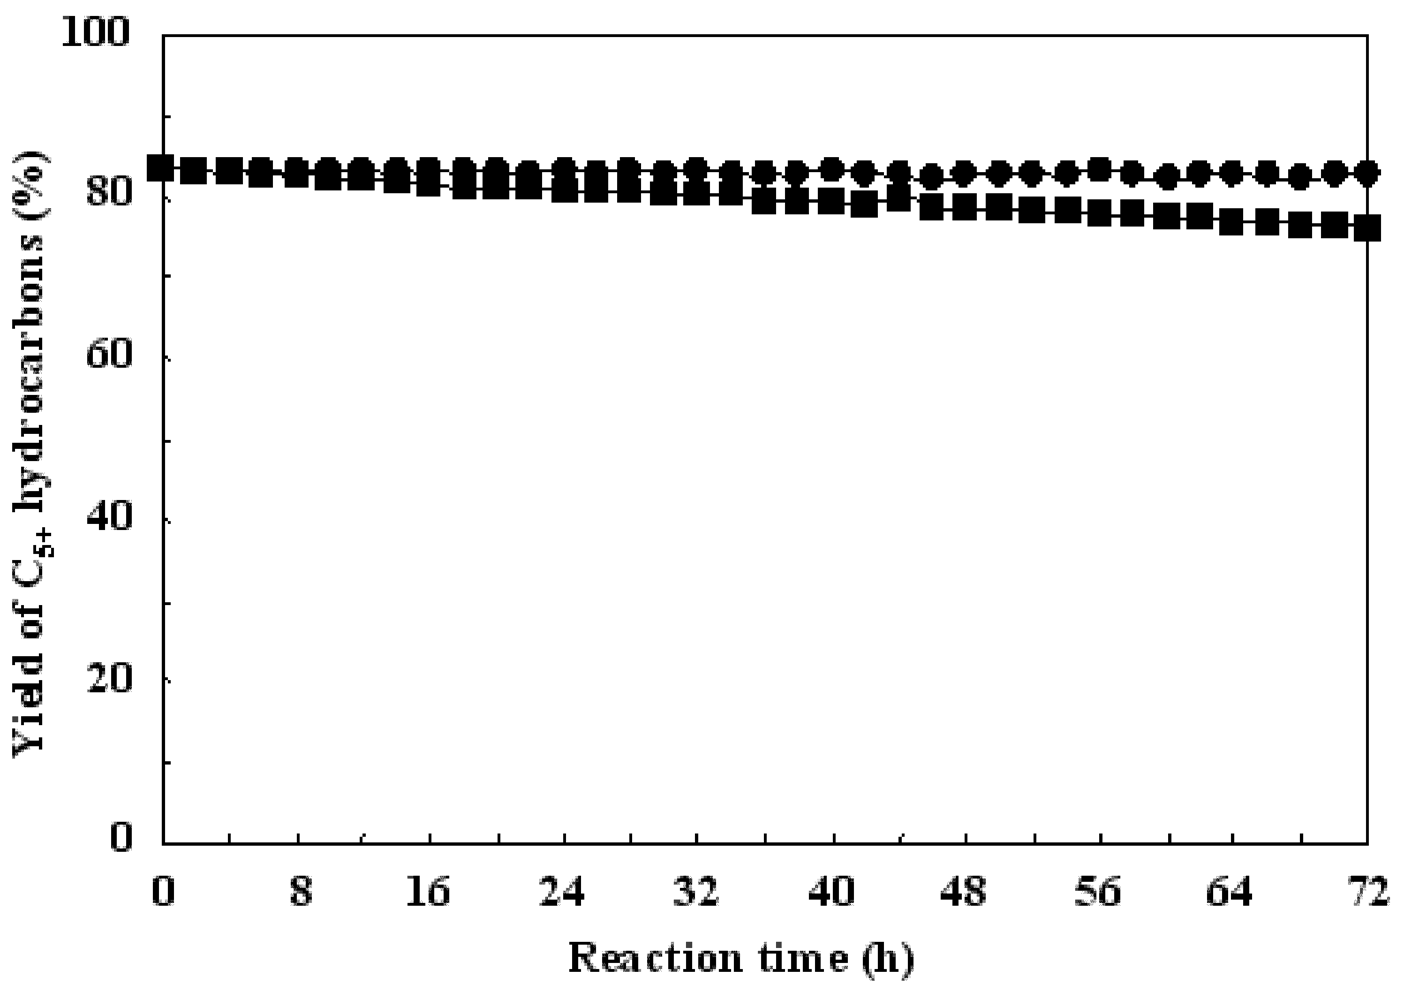
Figure 8 shows the time sequences in the hydrotreatment of waste cooking oil over Ru/Al
13-Mont and sulfided Ni-Mo/Al
13-Mont. Ru/Al
13-Mont showed an initial C
5+ hydrocarbons yield of 83.6% and it did not decrease after reaction for 72 h. This indicated that Ru/Al
13-Mont had a high catalytic stability for the hydrotreatment of waste cooking oil. In contrast, sulfided Ni-Mo/Al
13-Mont showed an initial C
5+ hydrocarbons yield of 83.5% but it slowly decreased to 76.8% after reaction for 72 h. Ni-Mo/Al
13-Mont was sulfided by 10% H
2S (in 90% H
2) at 400 °C prior to the reaction and a Ni-Mo-S phase was formed as the active phase for the hydrotreatment of waste cooking oil. The sulfur component in sulfided Ni-Mo/Al
13-Mont was lost slowly during the reaction [
24]. Because the waste cooking oil used in this study did not contain a sulfur component (
Table 2), the loss of sulfur could not be supplemented by the feedstock. As shown in
Figure 8, the speed of deactivation was slow in the first 10 h and became fast after reaction for 10 h over sulfided Ni-Mo/Al
13-Mont. The loss of sulfur caused the collapse of the Ni-Mo-S active phase in sulfided Ni-Mo/Al
13-Mont. As for Ru/Al
13-Mont, it could maintain activity during the reaction because the feedstock did not contain any sulfur poisons.
Figure 8.
Time courses in the hydrotreatment of waste cooking oil over Ru/Al
13-Mont (●) and sulfided Ni-Mo/Al
13-Mont (■) (reaction conditions: same as those in
Table 4).
Figure 8.
Time courses in the hydrotreatment of waste cooking oil over Ru/Al
13-Mont (●) and sulfided Ni-Mo/Al
13-Mont (■) (reaction conditions: same as those in
Table 4).
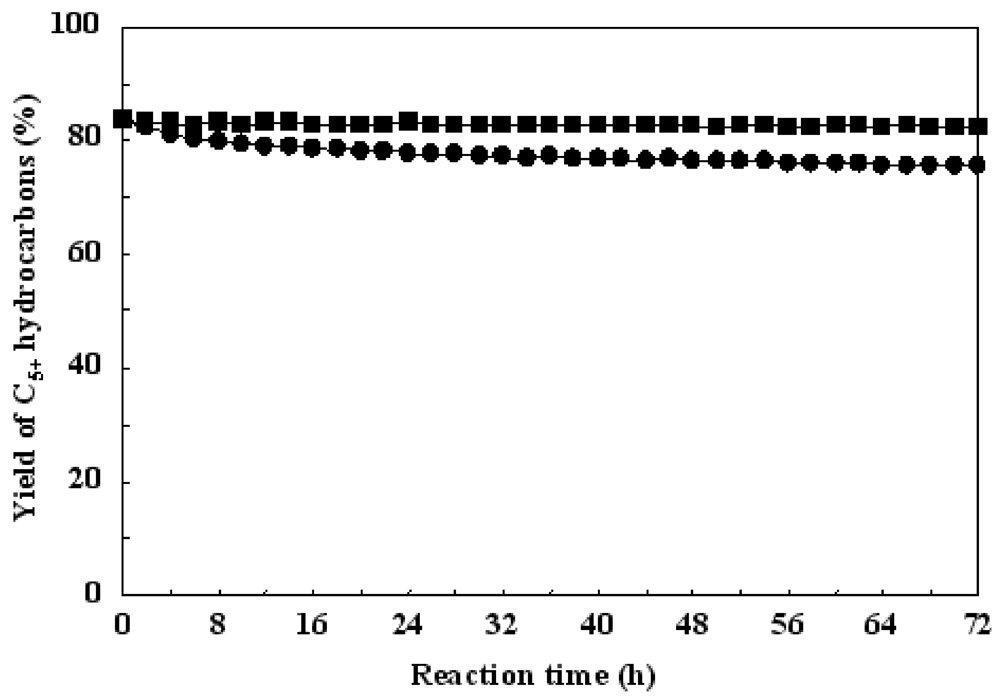
Figure 9 shows the time sequences in the hydrotreatment of waste cooking oil containing 10 ppm dimethyl disulfide (DMDS) over Ru/Al
13-Mont and sulfided Ni-Mo/Al
13-Mont. A large number of liquid fuels produced from crude oil, coal, and biomass contain sulfur compounds. We added 10 ppm DMDS as a standard sulfur compound in the waste cooking oil to check the influence of sulfur on Ru/Al
13-Mont and sulfided Ni-Mo/Al
13-Mont catalysts. As shown in
Figure 9, Ru/Al
13-Mont showed an initial C
5+ hydrocarbons yield of 83.6% and it decreased to 75.8% after reaction for 72 h for the hydrotreatment of waste cooking oil containing 10 ppm DMDS. Because S rapidly reacted with the Ru atoms to form an inactive RuS phase on the catalyst surface, the speed of deactivation over Ru/Al
13-Mont was fast in the first 10 h and then became slow. In contrast, sulfided Ni-Mo/Al
13-Mont showed an initial C
5+ hydrocarbons yield of 83.5% and it did not decrease after reaction for 72 h. The sulfur compound (DMDS) in the feed waste cooking oil supplemented the loss of sulfur from the surface of sulfided Ni-Mo/Al
13-Mont catalyst. The structure the Ni-Mo-S active phase remained during the reaction and maintained the catalytic activity of sulfided Ni-Mo/Al
13-Mont. Some researchers have carried out the hydrotreatment of vegetable oil (not containing S) mixed with heavy vacuum oil (containing S) over Ni-Mo catalysts in order to maintain the catalyst stability [
22]. Hence, in the hydrotreatment process, noble catalysts (Ru, Pt, Pd,
etc.) are suitable for the feedstock without a S component (such as vegetable oils, F-T waxes,
etc.), and desulfurizated catalysts (sulfided Ni-Mo, Co-Mo, Ni-W, Co-W,
etc.) are suitable for the feedstock containing S compounds (such as heavy oil, bio oil,
etc.).
Figure 9.
Time sequences in the hydrotreatment of waste cooking oil containing 10 ppm DMDS over Ru/Al
13-Mont (●) and sulfided Ni-Mo/Al
13-Mont (■) (reaction conditions: same as those in
Table 4).
Figure 9.
Time sequences in the hydrotreatment of waste cooking oil containing 10 ppm DMDS over Ru/Al
13-Mont (●) and sulfided Ni-Mo/Al
13-Mont (■) (reaction conditions: same as those in
Table 4).
