Article

Research and Validation of the Photogenerated Carrier Transfer Mechanism in CdS/TiO2 Systems Relative to the p–n Junction Theory

Key Laboratory of Green and Precise Synthetic Chemistry and Application, Ministry of Education, College of Chemistry and Chemical Engineering, Huaibei Normal University, Huaibei 235000, China
*
Authors to whom correspondence should be addressed.
Catalysts 2026, 16(7), 625; https://doi.org/10.3390/catal16070625
Submission received: 4 June 2026 / Revised: 5 July 2026 / Accepted: 6 July 2026 / Published: 9 July 2026
(This article belongs to the Special Issue Catalysis for Sustainable Environmental Solutions)

Abstract

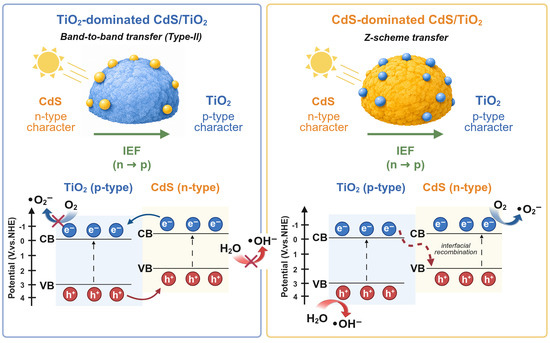
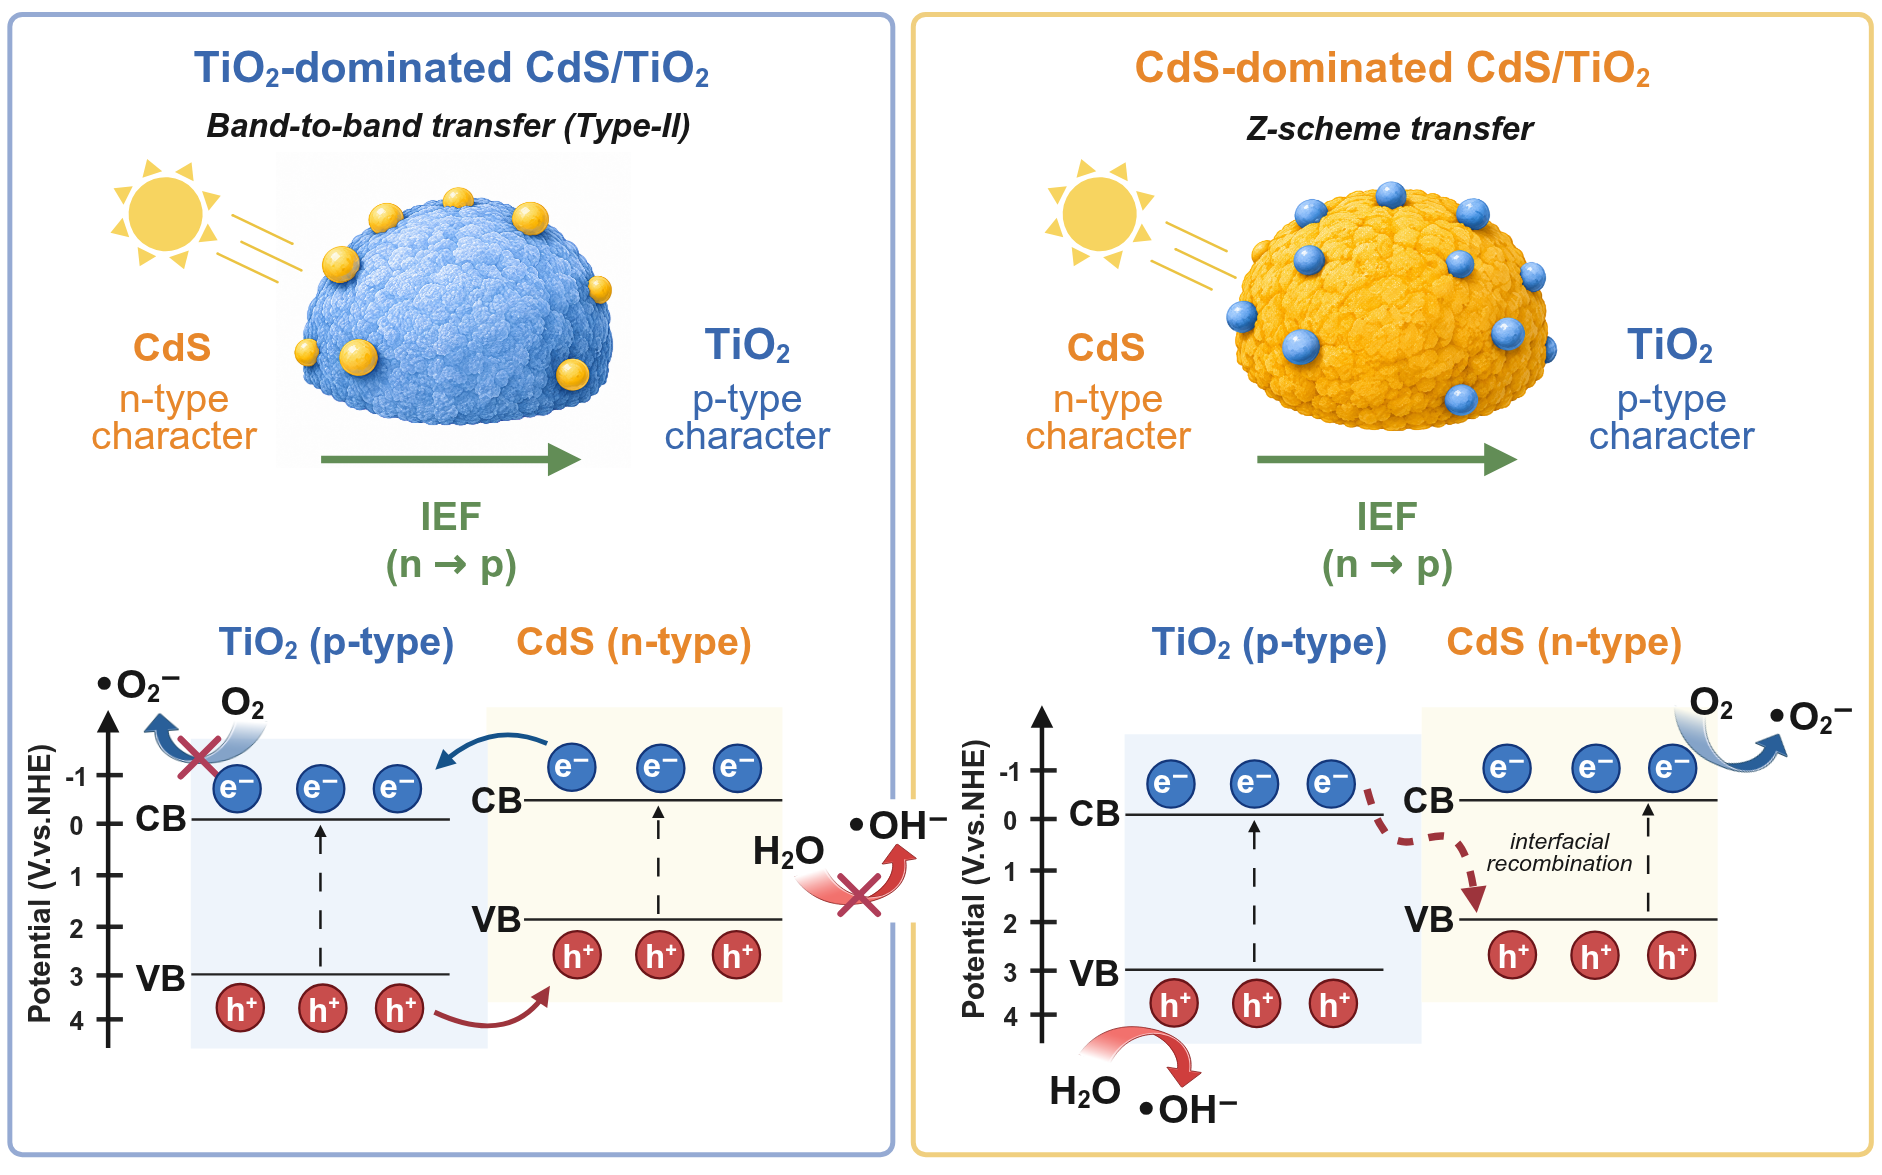
It is known that when an n-type semiconductor and a p-type semiconductor (i.e., a p–n junction) are connected, an intrinsic electric field is formed due to the diffusion motion of majority carriers. The direction of this intrinsic electric field in the p–n junction runs from the n-type to the p-type semiconductor (n→p). If the migration directions of photogenerated charge carriers in the conduction band (CB) and valence band (VB) of the two contacting semiconductors align with the direction of the intrinsic electric field in the heterojunction, band-to-band transfer occurs. In experiments using TiO2-based composite photocatalysts, the heterojunction catalyst forms a structure analogous to a p–n junction relative to CdS/TiO2; however, due to differing carrier concentrations, TiO2 exhibits a p-type character while CdS shows an n-type character. Under the influence of the intrinsic electric field, photogenerated electrons migrate to the p-type TiO2 surface, while holes migrate to the n-type CdS surface. The migration directions of photogenerated electrons and holes in the CB and VB of both CdS and TiO2 match those observed in a typical p–n junction, confirming that the photocarrier migration mechanism in TiO2-dominated CdS/TiO2 systems follows a band-to-band transfer mechanism. When CdS serves as the dominant component, rapid recombination occurs between electrons in TiO2’s CB and holes in CdS’s VB, resulting in significant electron accumulation in TiO2’s CB and substantial hole generation in CdS’s VB. Electrons in the CB of TiO2, which carries a higher negative potential, reduce O2 to •O2, while holes in the VB of CdS, possessing a higher positive potential, generate •OH, thereby enhancing photocatalytic activity; thus, the photoexcited carrier transfer mechanism follows Scheme Z.

Graphical Abstract

1. Introduction

At present, China is striving to build an environment-friendly society, and one of the common environmental problems we face is pollution. Semiconductor-based photocatalytic degradation technology offers advantages such as low cost and high efficiency [1,2,3,4,5,6]. Photocatalysts have attracted widespread attention due to their outstanding cleaning capability and great research potential in renewable energy [7,8,9,10]. Their non-toxic, highly efficient, and environmentally friendly nature are key advantages, making the selection of appropriate photocatalysts critically important. In the past few decades, research on improving catalyst performance has focused on various semiconductor photocatalysts under UV irradiation, such as metal oxides [11,12,13], nitrides [14,15,16], and sulfides [17,18]. However, these materials have not been widely applied because the rapid recombination of photogenerated electron–hole pairs limits the enhancement of their activity [19]. Consequently, extensive research has been conducted in this area, and it has been found that the activity of photocatalysts can be greatly improved by combining two or more photocatalysts into composites. It is well known that differences in conduction band (CB) and valence band (VB) positions can effectively separate photogenerated electron–hole pairs in semiconductors [20,21], thereby significantly enhancing photocatalytic activity. For photocatalysts, the combination of p-type and n-type semiconductors has been shown to improve photocatalytic activity [22,23,24,25,26]. Nevertheless, p-n junctions still have certain drawbacks. When such catalysts absorb light, photogenerated carriers transfer from higher energy bands to lower energy bands. Specifically, electrons in the higher CB will transfer to the lower CB, while holes from a higher VB will transfer to the lower VB of the catalyst [27,28,29,30,31]. Existing studies indicate that it is very one-sided to judge the transfer mechanism of photogenerated carriers solely on the basis of simple band theory and changes in electrical conductivity. Based on our group’s previous work, we have composited a series of photocatalysts with different weight ratios and employed various characterization techniques to provide a reasonable explanation from the perspective of physical and chemical properties, thereby achieving an accurate analysis and determination of the electron–hole transfer mechanism in the composite photocatalysts.
Among commonly used photocatalysts, TiO2 possesses the advantages of low cost, low pollution, and modified TiO2 exhibits even better catalytic performance [32,33]. CdS features a suitable bandgap, high charge transport performance, and high electron mobility [34]. Therefore, we selected these two photocatalysts to prepare a composite and investigate its transfer mechanism, aiming to verify the relative p–n junction theory.

2. Results

2.1. Characterization of CdS/TiO2 Composite Materials

2.1.1. XRD Analysis

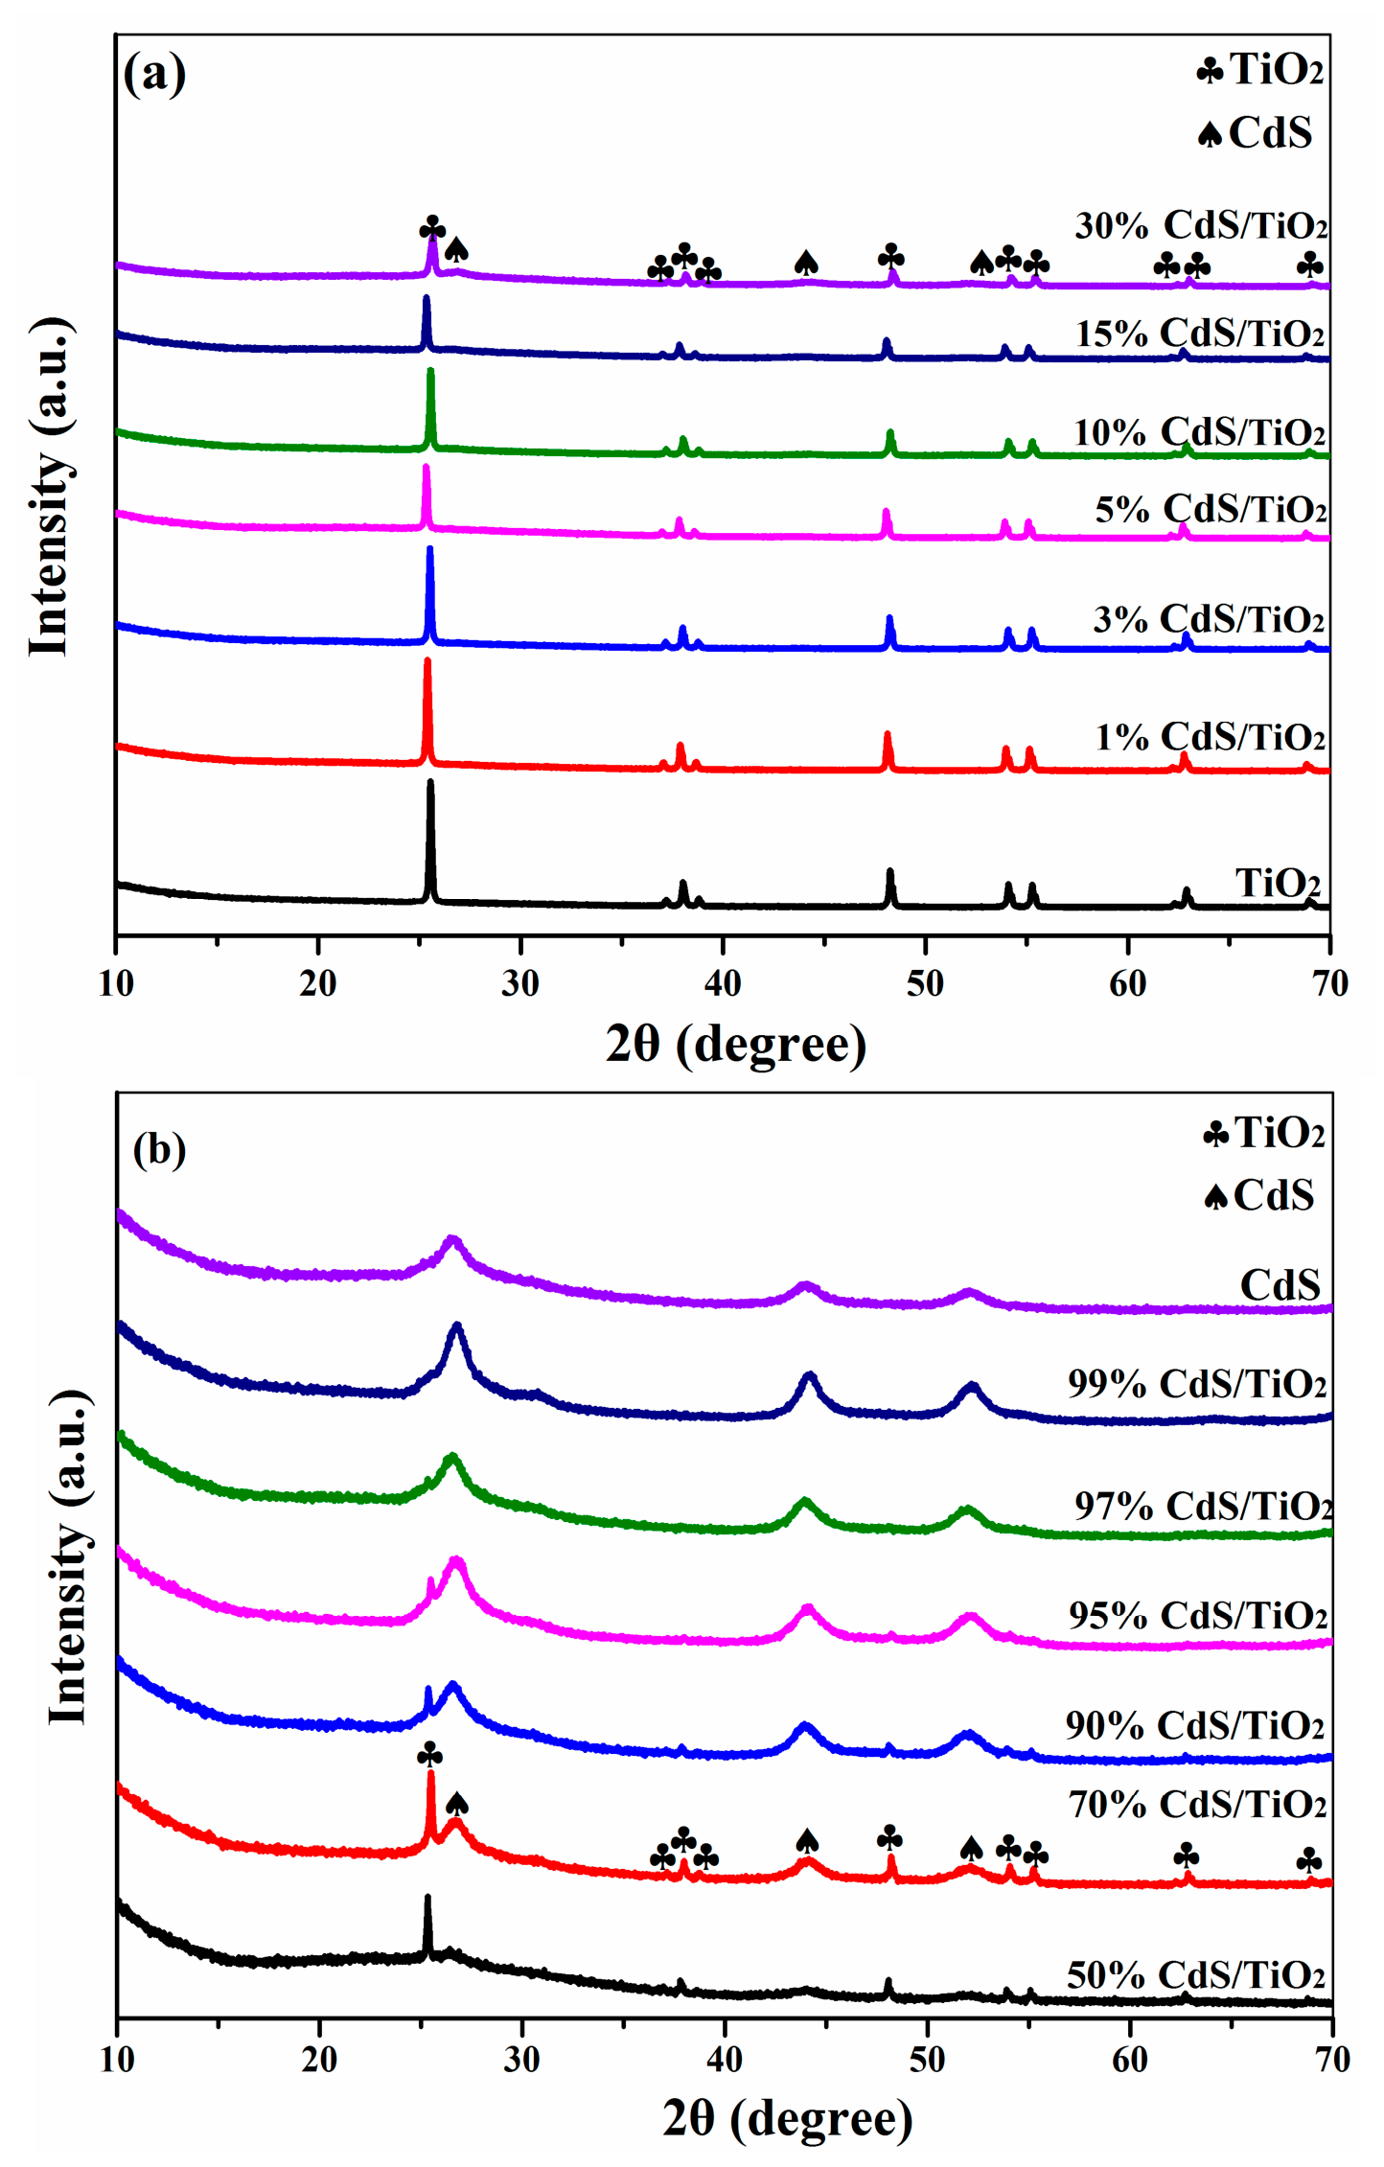
To investigate the crystal structure and composition of the prepared samples, X-ray diffraction (XRD) analysis was performed. The results showed that the diffraction peaks of TiO2 matched well with those of the standard tetragonal phase (JCPDS Card No. 65-5714) [11], while the peaks of CdS were consistent with JCPDS Card No. 10-0454 [35]. As the CdS content increased, a distinct CdS diffraction peak appeared at 2θ = 26.5° in the 30% CdS/TiO2 sample. Meanwhile, as shown in Figure 1b, the characteristic peak of TiO2 at 2θ = 25.3° gradually weakened with increasing CdS content. Notably, when the CdS content exceeded 97% (i.e., 97% CdS/TiO2), the characteristic peaks of TiO2 began to disappear due to the low proportion of TiO2 in the composite catalyst. No additional or new diffraction peaks were detected in the CdS/TiO2 composites, indicating that TiO2 and CdS retained their pure phases and that no impurities were formed during the preparation of the CdS/TiO2 heterojunction photocatalyst. These results demonstrate that CdS nanoparticles are well coupled with TiO2 nanoparticles in the CdS/TiO2 composites.

2.1.2. UV-DRS Test Analysis

UV-Vis diffuse reflectance spectroscopy (UV-DRS) was employed to characterize the optical properties of the pure CdS, pure TiO2, and a series of CdS/TiO2 composite samples. The band gap energy (Eg) of the prepared samples was calculated using the following Equation [36]:
αhν = A(hν − Eg)n/2
where α is the absorption coefficient, h is Planck’s constant, ν is the light frequency, A is a proportionality constant, Eg is the band gap energy [36], and n depends on the nature of the semiconductor transition (n = 1 for direct transition, n = 4 for indirect transition). According to the literature, both TiO2 and CdS are direct transition semiconductors, so n = 1 [7,37].
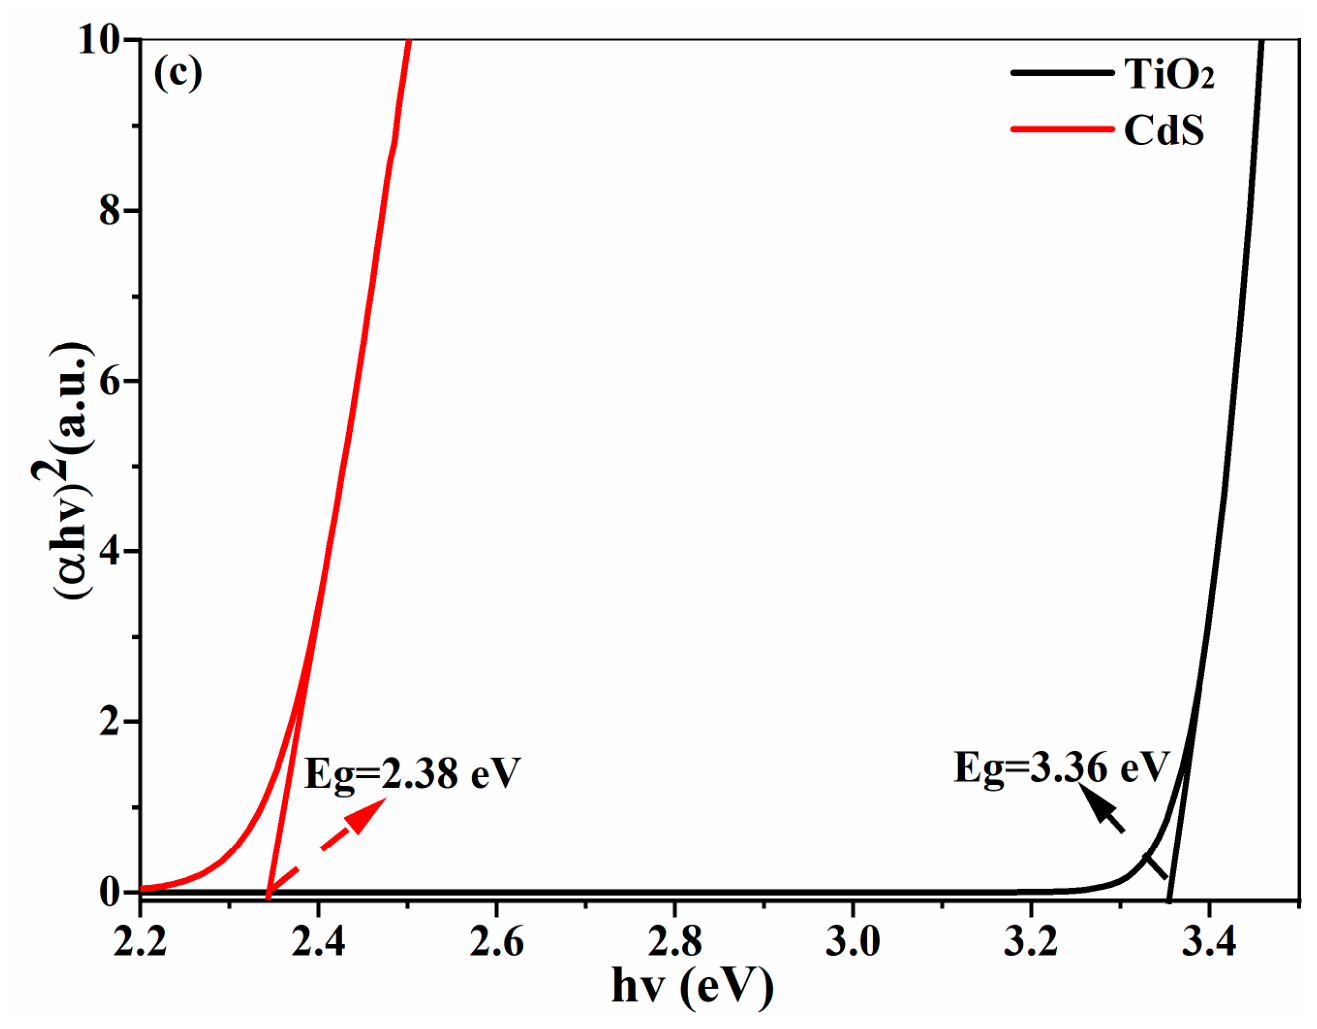
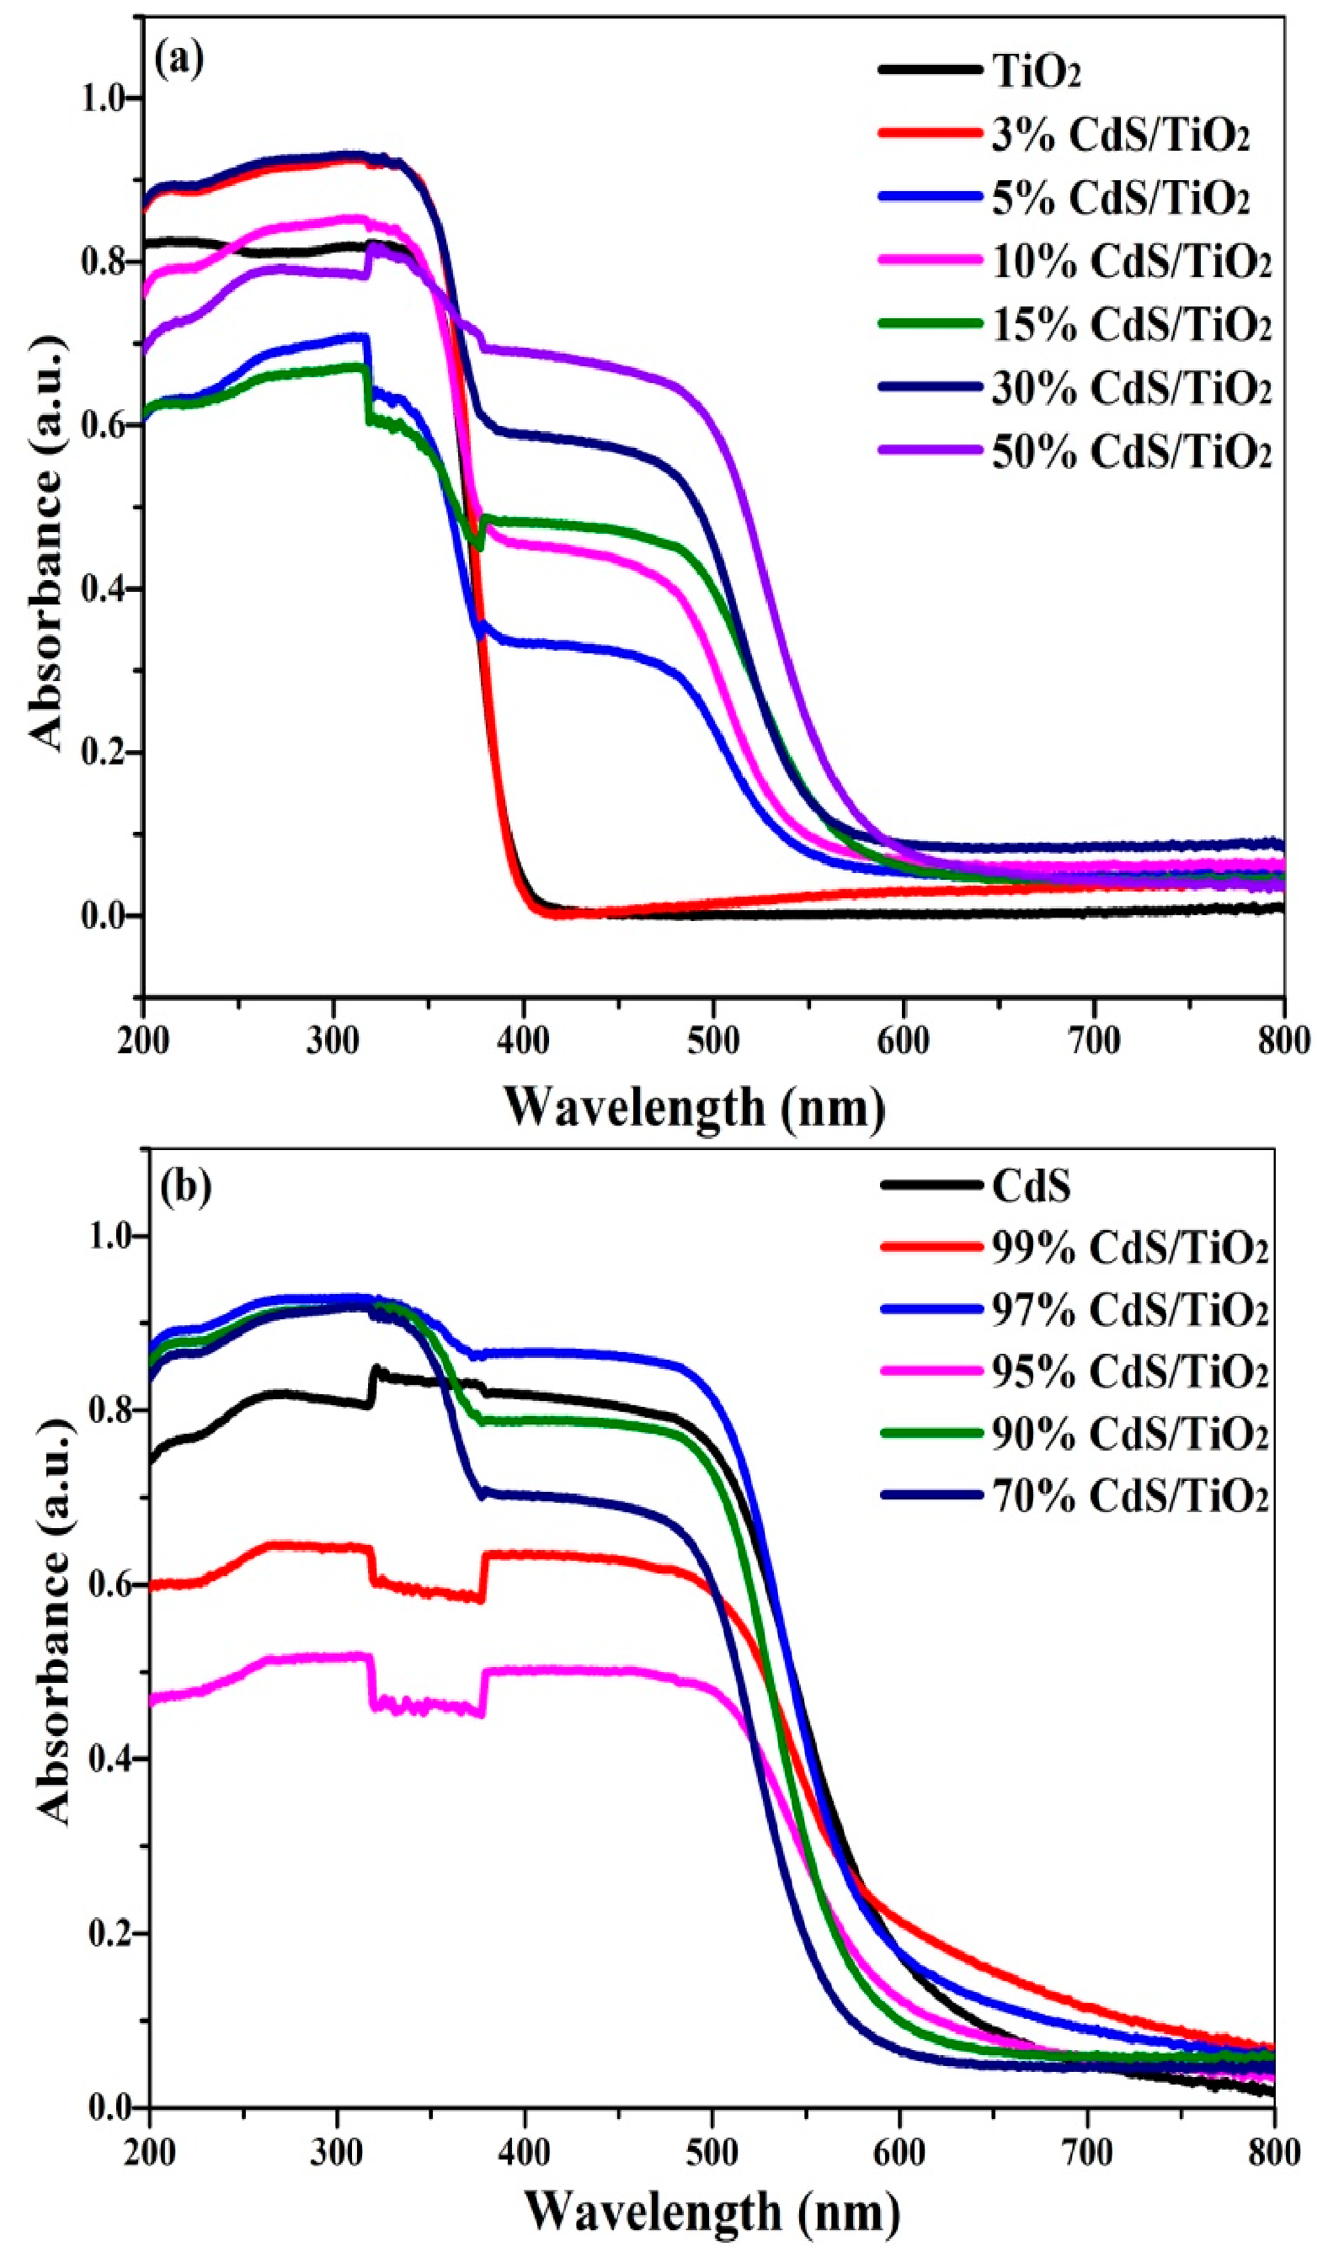
As shown in Figure 2a,b, the absorption edge of TiO2 is approximately 388 nm, while that of CdS is approximately 530 nm. For the CdS/TiO2 photocatalysts, regardless of whether TiO2 or CdS is the major component, the absorption curves lie between those of pure TiO2 and pure CdS. As the CdS content gradually increases, the UV-Vis absorption spectra shift correspondingly. When the CdS content reaches a sufficiently high level, the UV-Vis absorption spectrum of the composite approaches that of pure CdS. As presented in Figure 2c, the calculated band gap energy of TiO2 is about 3.36 eV, and that of CdS is about 2.38 eV, which are consistent with reported values.

2.1.3. SEM Analysis

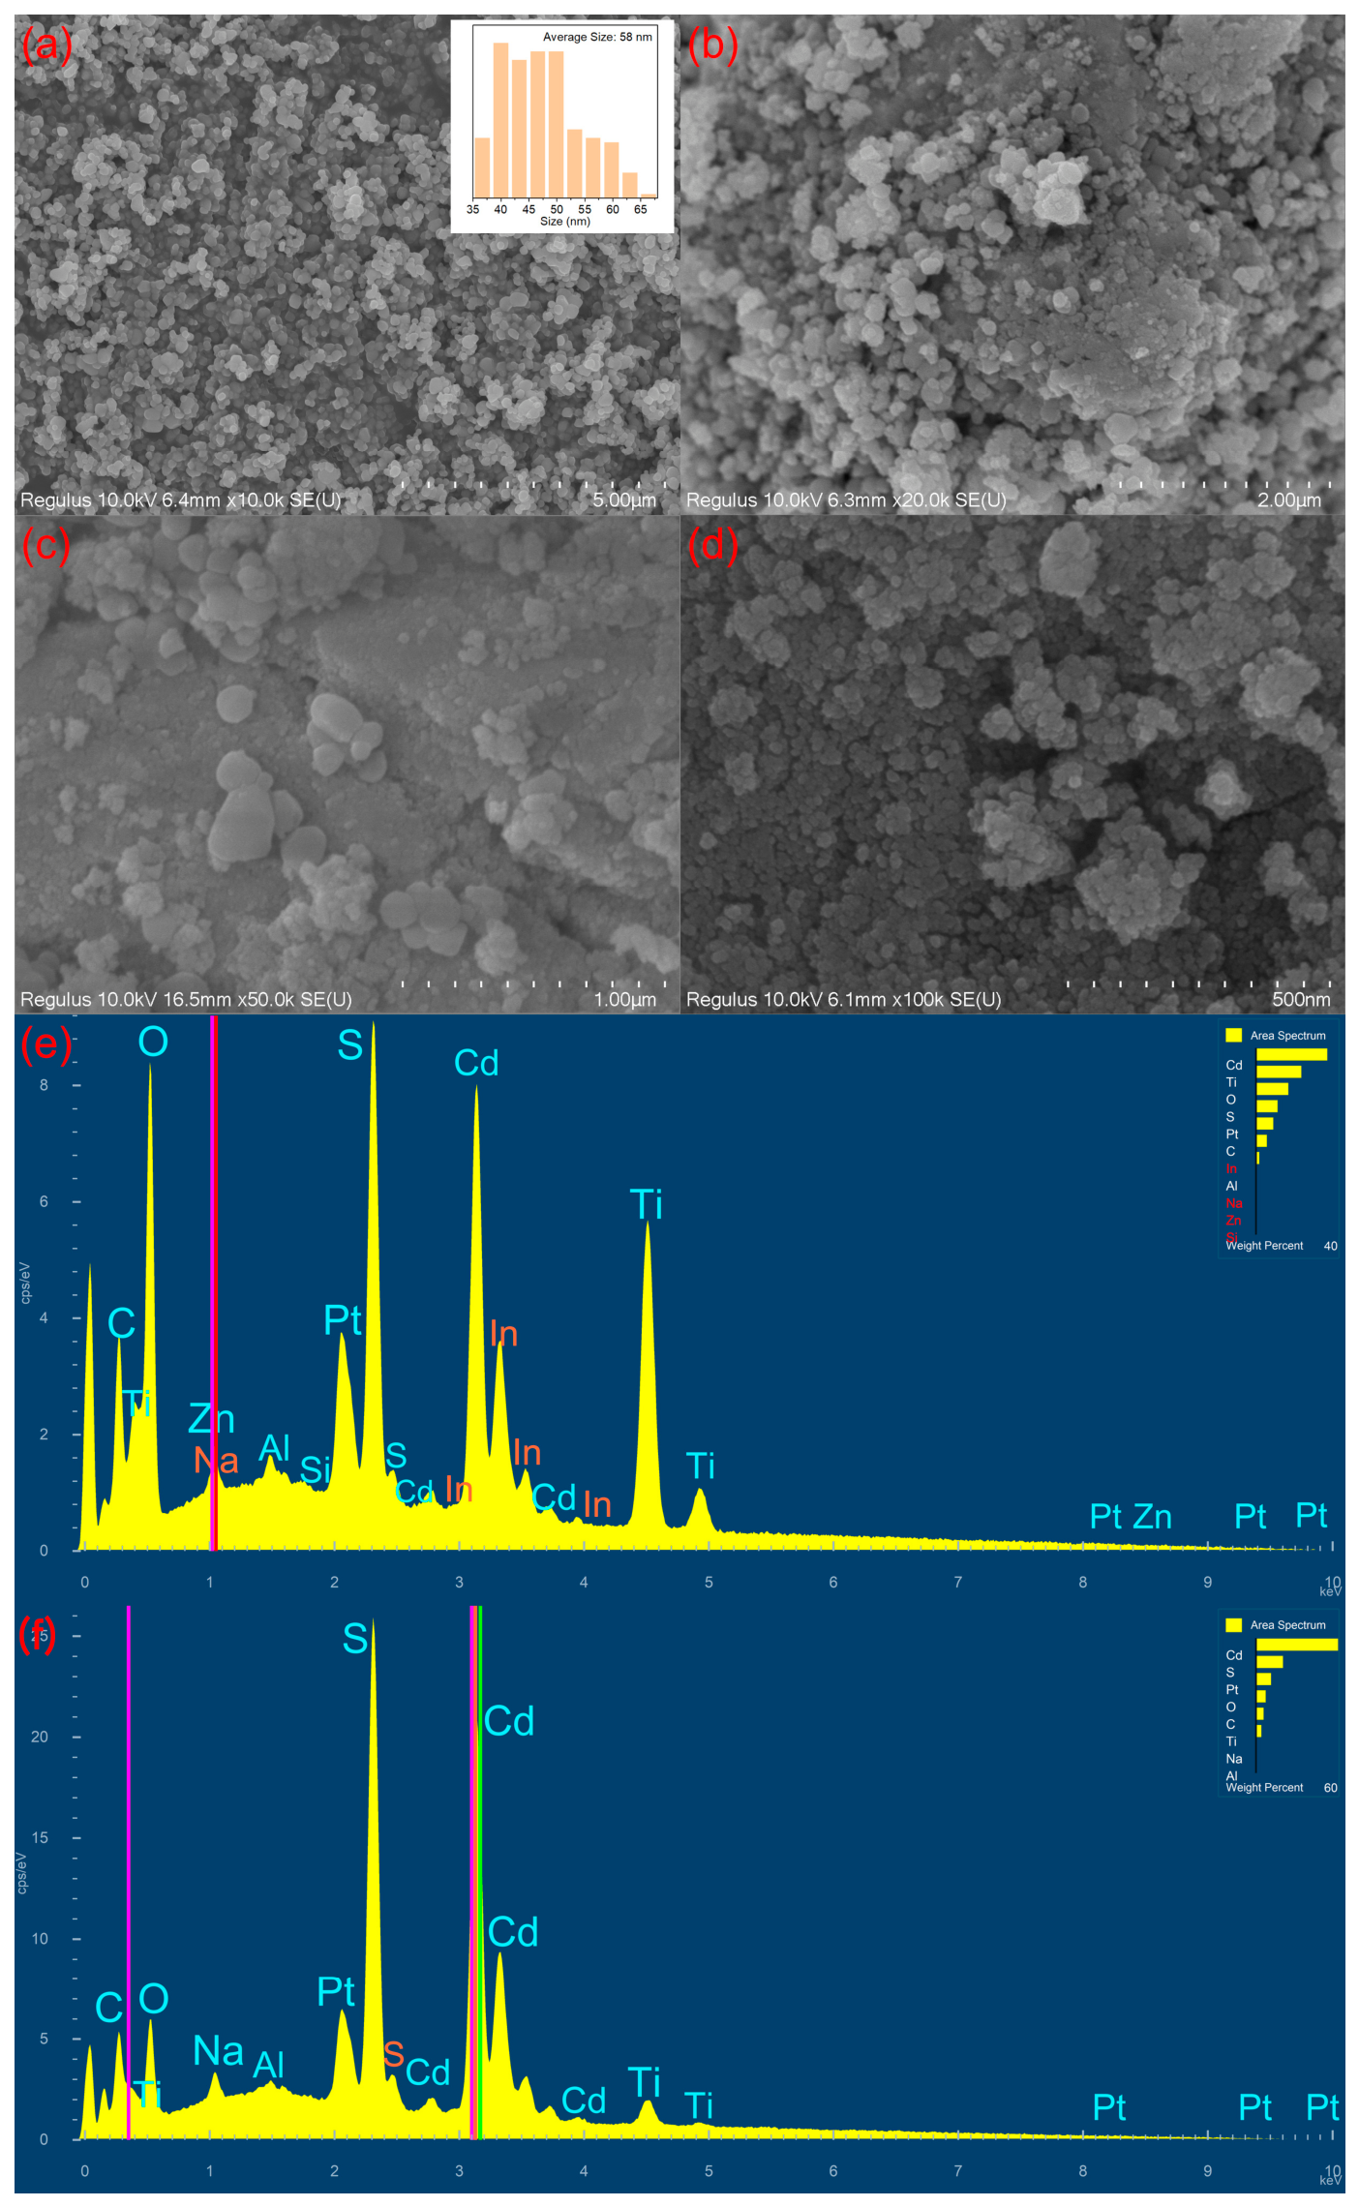
To investigate the morphology of samples prepared by solid-phase grinding, we conducted SEM analysis on samples of TiO2, CdS, 70% CdS/TiO2, and 90% CdS/TiO2. From the statistical analysis of multiple SEM images (Figure 3a), the average primary particle size of TiO2 is estimated to be approximately 58 ± 12 nm. Figure 3d demonstrates that CdS is composed of numerous aggregated nanoscale particles. Figure 3b,c show that the CdS nanoparticles are closely attached to the surface of the TiO2 particles, forming a well-defined heterojunction interface with homogeneous dispersion. This intimate contact is further confirmed by the EDX analysis in Figure 3e,f, which reveals the co-existence of Cd, S, O, and Ti elements in the composite samples. The energy-dispersive X-ray spectroscopy (EDX) analysis in Figure 3d further confirms the presence of Cd, S, O, and Ti elements in both the 30% CdS/TiO2 and 90% CdS/TiO2 samples, consistent with their chemical composition.
As shown in Figure 3e,f Na and Al originate from the glass substrate (soda-lime glass) on which the sample was mounted for SEM/EDX analysis, as the sample powder was dispersed onto a standard aluminium stub with a carbon tape, but some background from the glass slide used during preparation may also contribute. In fact, the Na and Al peaks are commonly observed in EDX when using glass substrates. Zn is a trace impurity that likely came from the commercial TiO2 precursor (which may contain zinc as a minor contaminant) or from the ball-milling equipment (zirconia balls can introduce trace metals, though typically not Zn; we suspect it is a residue from previous sample preparation in the same grinding jar).

2.1.4. XPS Test Analysis

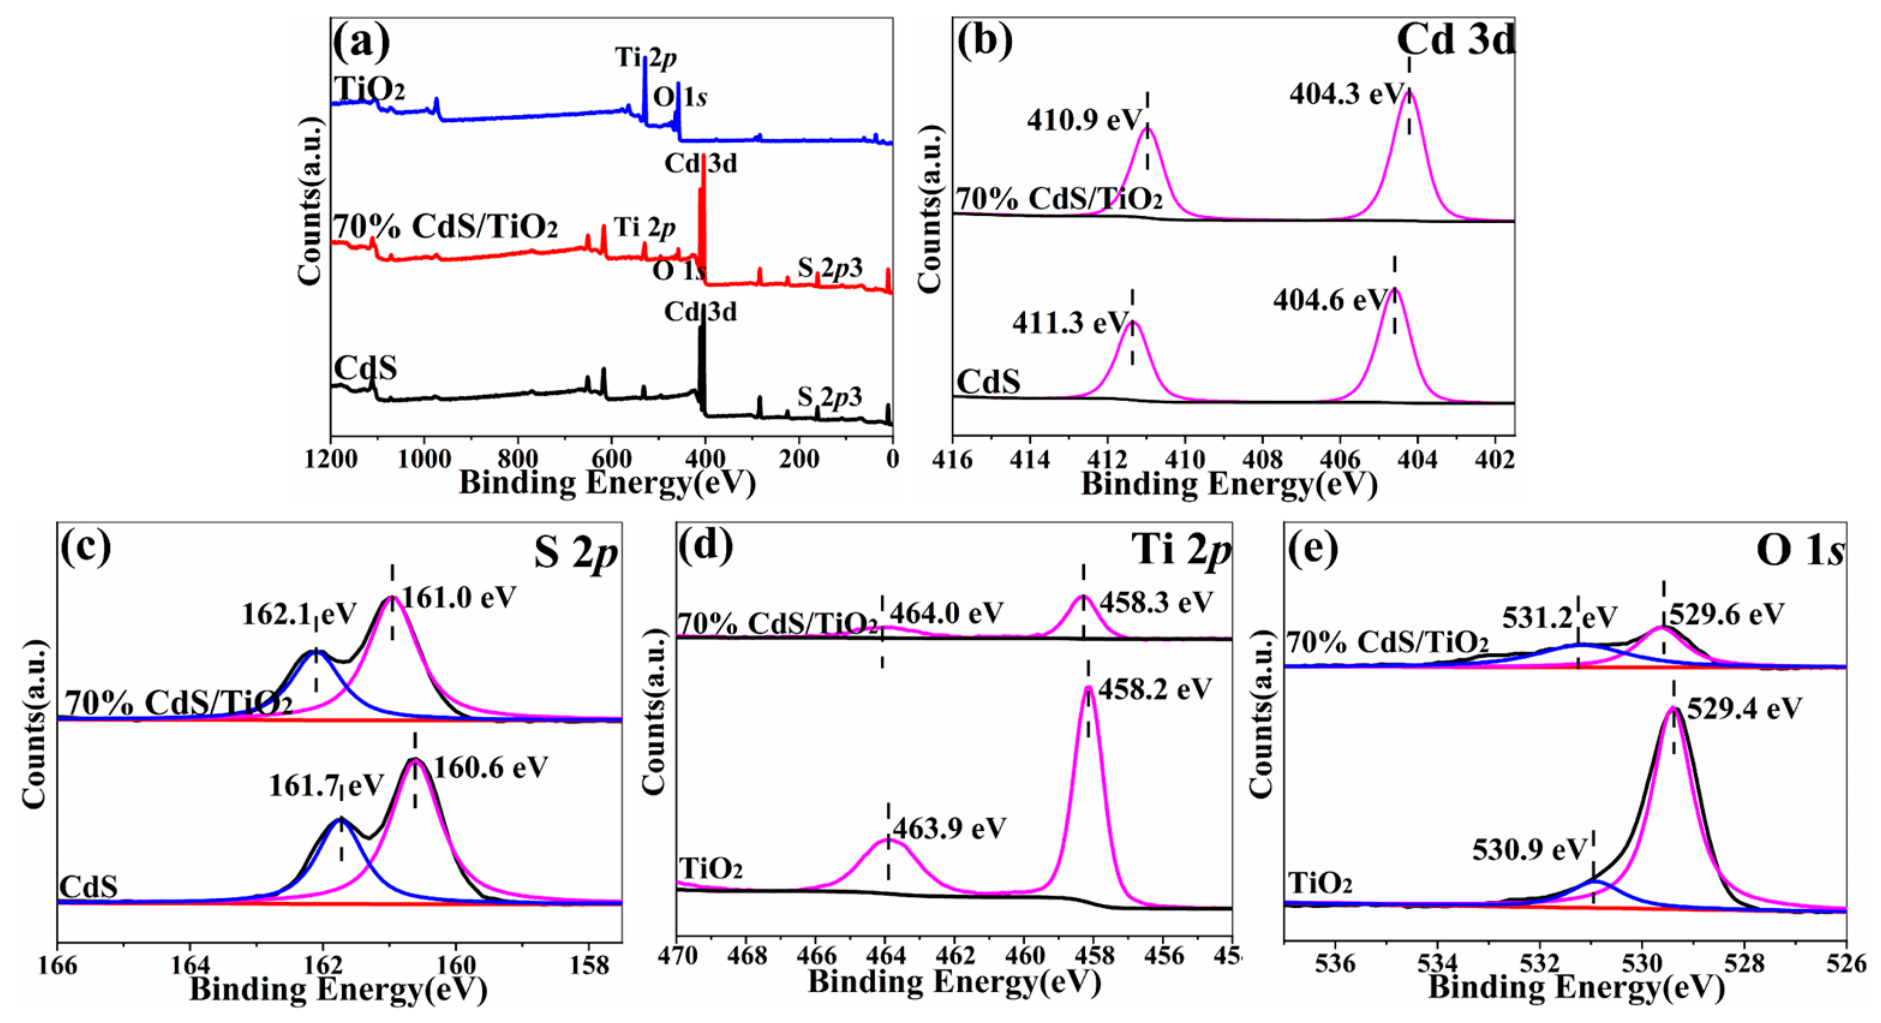
To further analyze the chemical composition of the material surfaces, we conducted XPS data analysis on samples containing TiO2, CdS, and a 70% CdS/TiO2 mixture. The Cd 3d spectrum (Figure 4b) was deconvoluted into two spin–orbit doublets corresponding to Cd 3d5/2 and Cd 3d3/2. For pure CdS, the binding energies are located at 404.3 eV and 410.9 eV, respectively, which are characteristic of Cd2+ in the CdS lattice. For the 70% CdS/TiO2 composite, a slight positive shift of approximately 0.2 eV is observed for both peaks. This shift indicates electron transfer from CdS to TiO2 at the heterojunction interface, which is consistent with the formation of an internal electric field. No additional peaks corresponding to Cd0 or CdO were detected, confirming the high purity of the CdS phase. The S 2p spectrum (Figure 4c) was fitted with two main peaks at 160.6 eV (S 2p3/2) and 161.8 eV (S 2p1/2), which are assigned to S2− species in the CdS lattice. For the 70% CdS/TiO2 composite, these peaks shift slightly to 160.7 eV and 161.9 eV. This minor shift further supports the electronic interaction at the CdS–TiO2 interface. No peaks corresponding to SO42− or elemental sulfur were observed, indicating that no surface oxidation or photocorrosion occurred during sample preparation.
The Ti 2p spectrum (Figure 4d) was deconvoluted into two peaks at 458.2 eV (Ti 2p3/2) and 463.9 eV (Ti 2p1/2), with a spin–orbit splitting of 5.7 eV. These values are characteristic of Ti4+ in the TiO2 lattice. For the 70% CdS/TiO2 composite, the Ti 2p peaks show no significant shift compared to pure TiO2, indicating that the Ti4+ oxidation state is well preserved. A small shoulder peak at approximately 456.5 eV (attributable to Ti3+) was observed in both pure TiO2 and the composite, which is likely associated with oxygen vacancies commonly present in TiO2. However, the relative intensity of this Ti3+ shoulder is very low, confirming that the TiO2 phase remains predominantly stoichiometric. The O 1s spectrum (Figure 4e) was deconvoluted into three distinct components (as is standard practice in the literature): Peak I (529.4 eV): Assigned to lattice oxygen (Ti–O) in the TiO2 crystal structure. Peak II (530.9 eV): Assigned to surface hydroxyl groups (–OH) and adsorbed water species. The presence of these hydroxyl groups is beneficial for photocatalytic reactions, as they can be oxidised by photogenerated holes to produce •OH radicals. Peak III (532.1 eV): A weaker shoulder that can be attributed to chemisorbed water or carbonate species on the surface. For the 70% CdS/TiO2 composite, the relative intensity of the hydroxyl peak (Peak II) is slightly higher than that of pure TiO2. This increase suggests that the introduction of CdS promotes surface hydroxylation, which may contribute to the enhanced generation of •OH radicals and consequently improve the photocatalytic activity.

2.2. Mechanism Discussion

2.2.1. Active Species in Photocatalytic Reactions

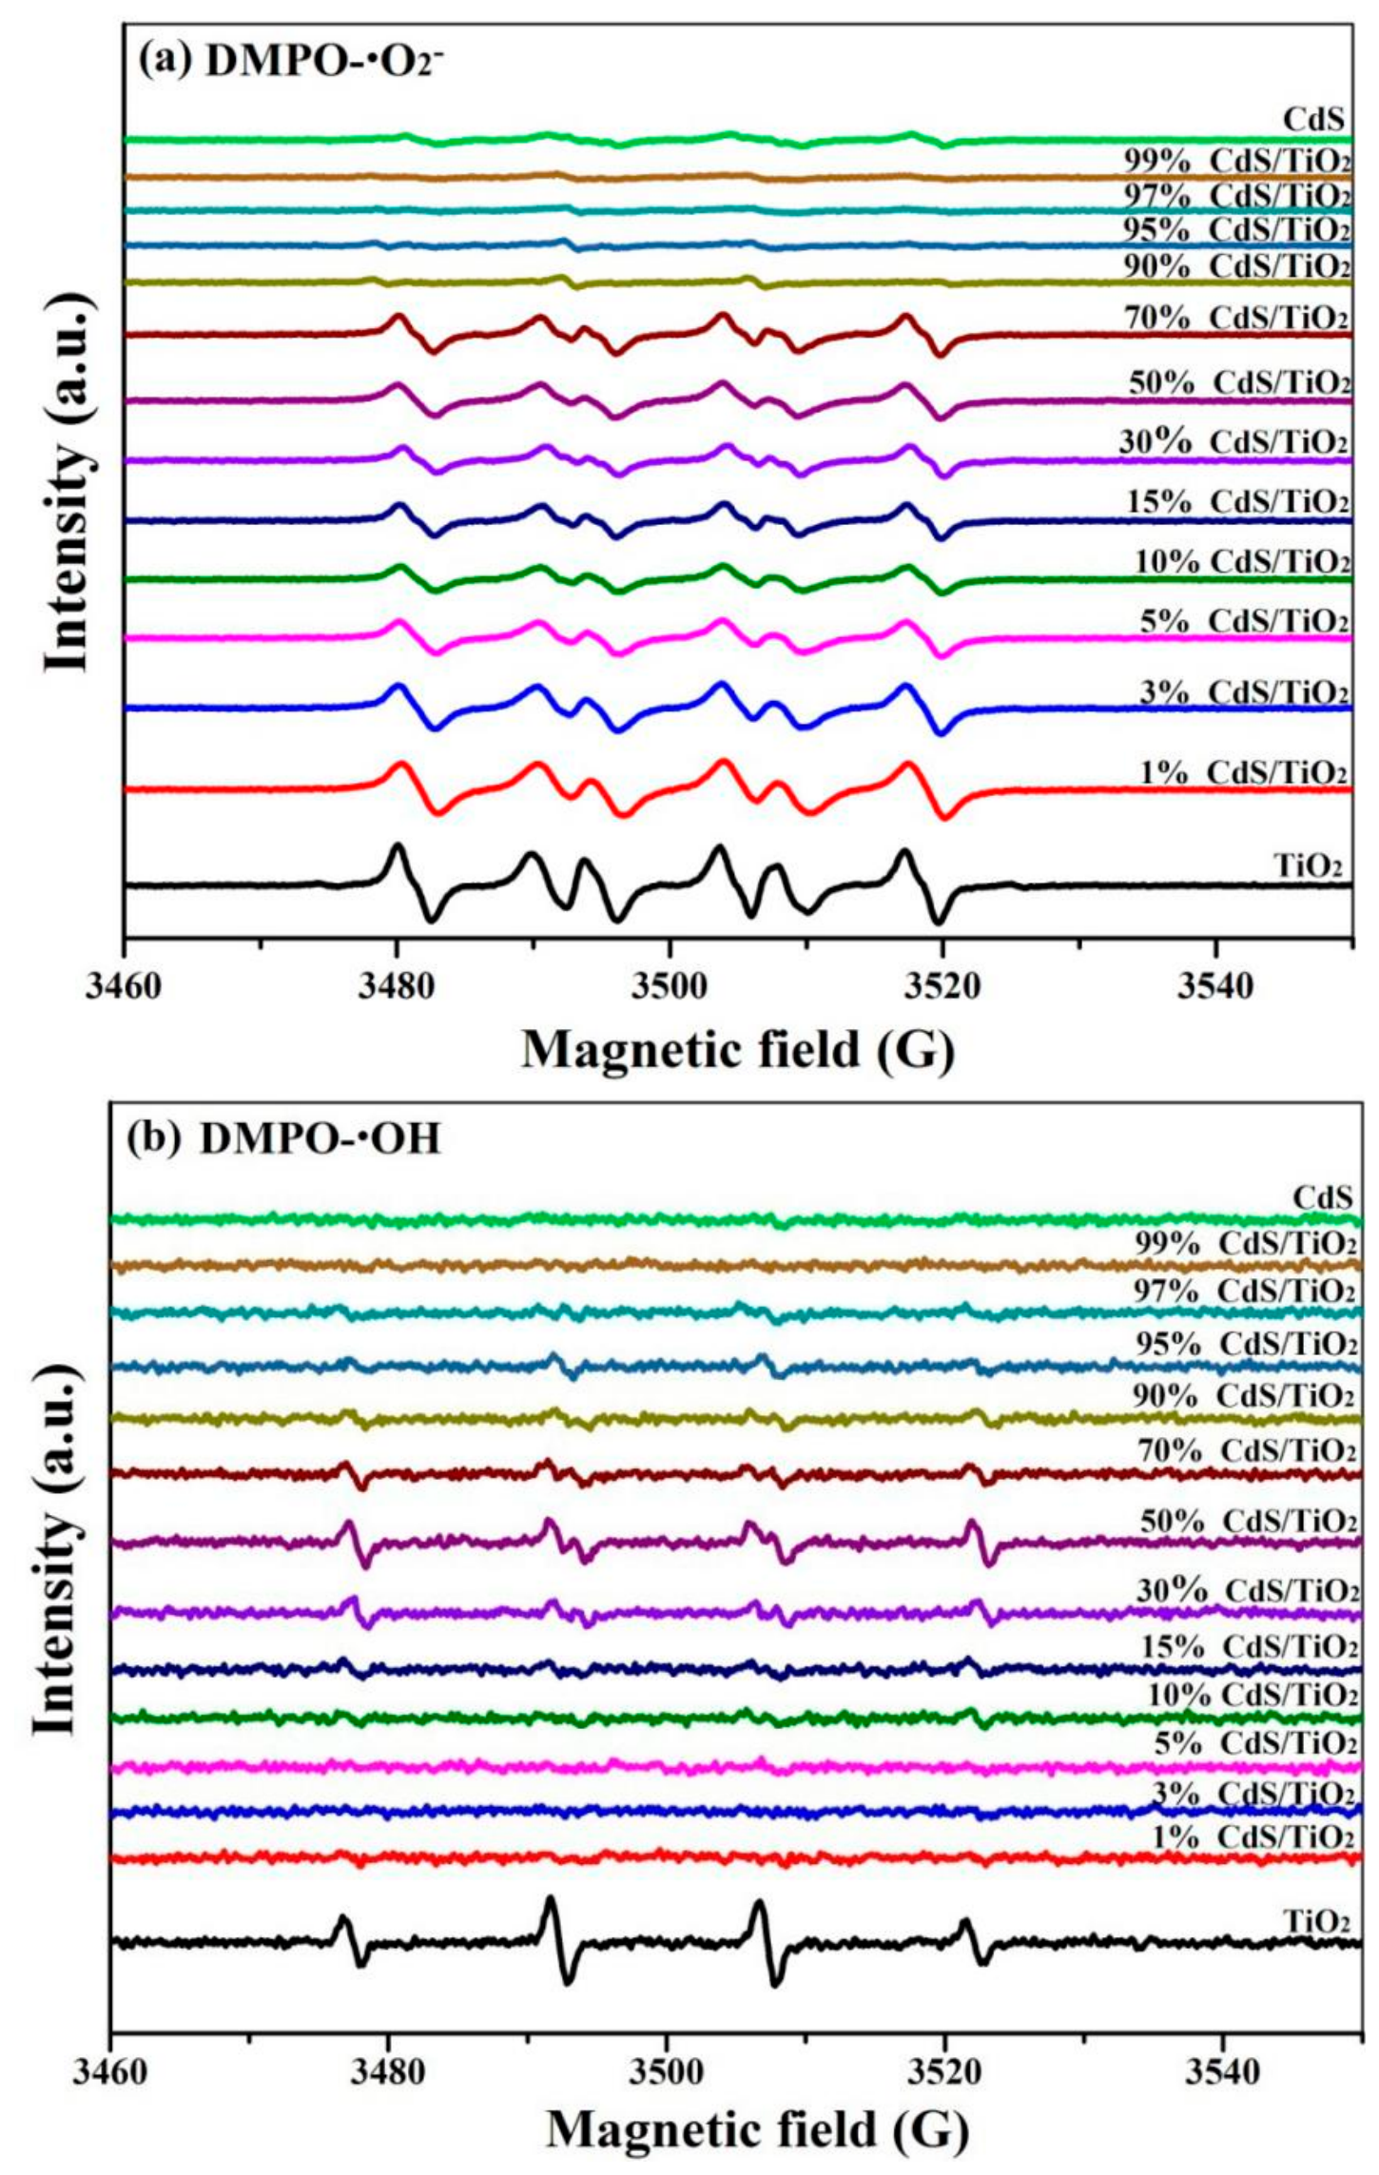
Figure 5a,b demonstrate the electronic paramagnetic resonance (EPR) experimental results for DMPO–•O2 and DMPO–•OH, with the measurements confirming the presence of active species •OH and •O2 in the material suspension [38]. As shown in Figure 5a, under ultraviolet irradiation, both TiO2 and the CdS/TiO2 heterojunction in the methanol suspension exhibit six characteristic peaks corresponding to DMPO–•O2. When TiO2 constitutes the main component of the CdS/TiO2 heterojunction photocatalyst, the peak intensity shows minimal variation upon CdS addition, increasing steadily up to 3% CdS/TiO2; thereafter, it begins to decrease with further CdS increase until reaching 30%, then rises again until 70%, after which no detectable signal of •O2 is observed at higher CdS concentrations.
Figure 5b shows the DMPO–•OH signals of TiO2, CdS, and the composite CdS/TiO2. A distinct DMPO–•OH signal is clearly observed for TiO2, whereas CdS exhibits no pronounced DMPO–•OH signal. As illustrated in Figure 5b, adding a small amount of CdS to the CdS/TiO2 heterojunction eliminates the detectable •OH signal. The peak intensity increases with increasing CdS content until reaching 50% CdS/TiO2, after which it gradually decreases with further additions.
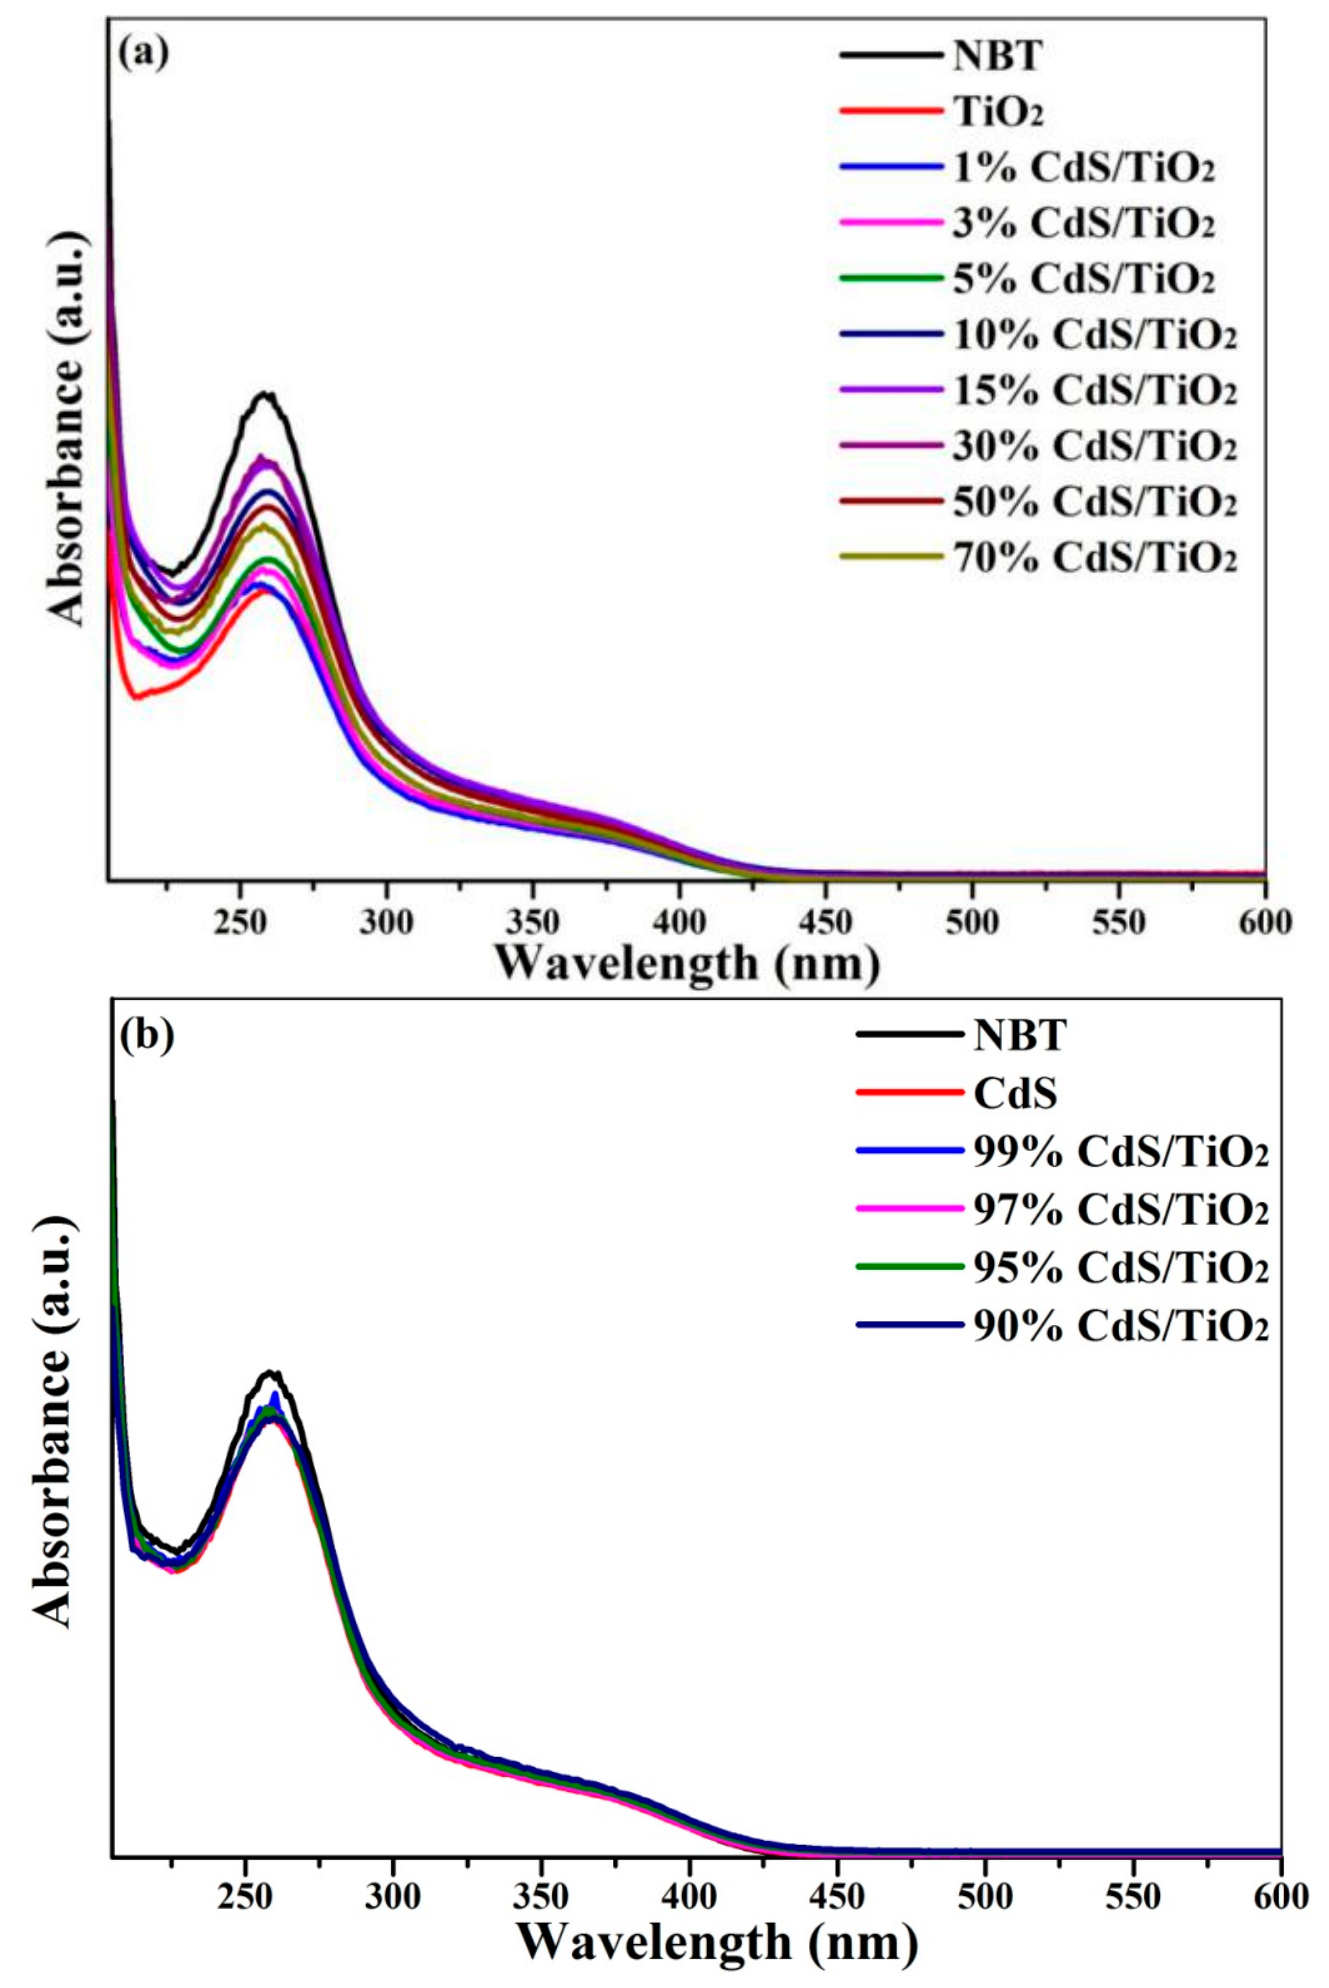
To further confirm the aforementioned results, we employed chemical methods using nitrobluetetrazolium [39,40] and terephthalic acid photoluminescence [41]. We prepared a nitrobluetetrazolium solution at 5.0 × 10⁻⁵ mol/L and verified the presence of •O2 in the CdS/TiO2 photocatalytic system by measuring its maximum absorption at 259 nm via UV absorption spectroscopy. As shown in Figure 6, after 3 min of UV irradiation, the UV-visible absorption spectrum of the sample fell below that of NBT, confirming that •O2 radicals were indeed generated at the TiO2 and CdS/TiO2 heterojunction—with higher concentrations observed on the TiO2 surface compared to the CdS/TiO2 composite. Addition of CdS inhibited •O2 generation at the heterojunction up to 30% CdS content; beyond this threshold, radical production increased progressively until 70% CdS. However, Figure 6b demonstrates that when CdS constitutes the main component of the heterojunction photocatalyst (TiO2/CdS), virtually no •O2 radicals are produced on its surface, indicating excellent consistency between these experimental findings and results from photocatalytic activity assays as well as ESR measurements.
To detect hydroxyl radicals (•OH) generated on different photocatalyst surfaces, we first prepared an alkaline solution of 5 × 10⁻⁴ mol/L terephthalic acid (TA), as TA can react with hydroxyl radicals to form highly fluorescent products; consequently, the intensity of the PL peak is proportional to the amount of •OH radicals formed in the solution. As shown in Figure 7a, when the sample matrix was TiO2, the addition of CdS inhibited the generation of •OH radicals at the CdS/TiO2 heterojunction. The PL peak intensity decreased with increasing CdS concentration until 10% CdS was added; beyond this threshold, the generation rate of •OH radicals gradually increased up to 70% CdS/TiO2. Figure 7b demonstrates that when CdS was the primary component and 1% TiO2 was added, the PL peak intensity slightly declined; further increases in TiO2 concentration led to enhanced PL intensity, indicating a progressive rise in •OH production, with the highest intensity observed at 70% CdS/TiO2. Clearly, both the NBT and TA experiments yielded results for •O2 and •OH consistent with ESR measurements, confirming the photocatalytic activity of the samples.

2.2.2. Study of Active Substances

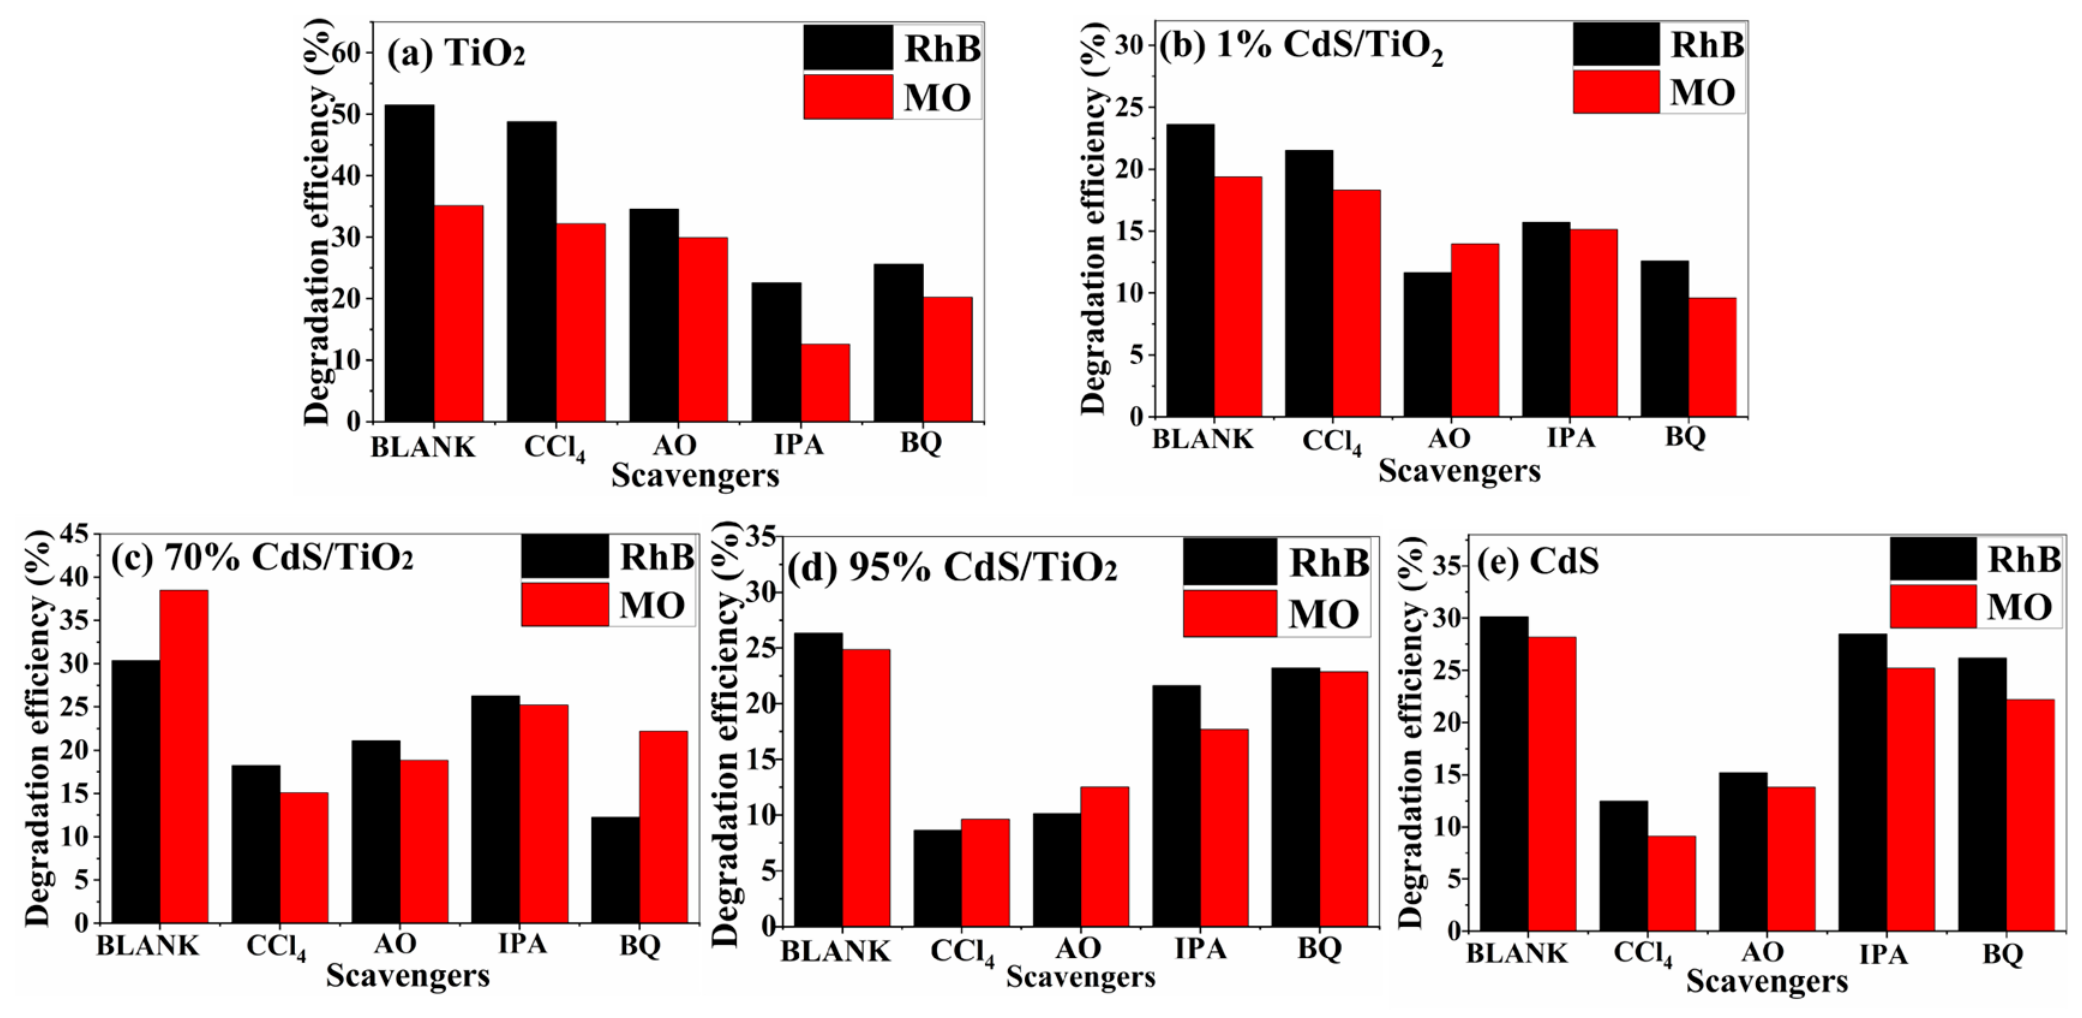
To further identify the active species involved in the photocatalytic process, a series of quenching experiments were conducted by adding different scavengers during the degradation of organic pollutants, aiming to explore the possible mechanism of the CdS/TiO2 composite [42,43,44]. It is well known that •O2, h+, and •OH are the main reactive species in photocatalytic reactions. To verify the active species present in the reaction system and to further investigate the charge transfer in the photocatalyst, carbon tetrachloride (CCl4), aniline (AO), isopropanol (IPA), and benzoquinone (BQ) were selected as scavengers for electrons (e), holes (h+), hydroxyl radicals (•OH), and superoxide radicals (•O2), respectively [37].
As shown in Figure 8a, for pure TiO2, the photocatalytic efficiency of the sample significantly decreases after adding ammonium oxalate along with isopropanol and p-phenyquinone; however, no significant change occurs upon addition of carbon tetrachloride. Therefore, we conclude that the active species involved are •O2, •OH, and H+.
As shown in Figure 8e, for pure CdS, the degradation activity significantly decreased upon addition of ammonium oxalate and carbon tetrachloride; however, the photodegradation efficiency of organic pollutants remained largely unchanged when isopropanol and p-benzoquinone were added. E and H+ are the predominant active species, whereas •O2 and •OH are not the primary active species.
Figure 8b shows that the active species in the 1% CdS/TiO2 sample are h+ and •O2; Figure 8c indicates that the active species in 70% CdS/TiO2 include h+, •O2, and •OH; while in 95% CdS/TiO2, the active species consist of e, h+, and •OH.

2.2.3. Photoelectric Performance Testing

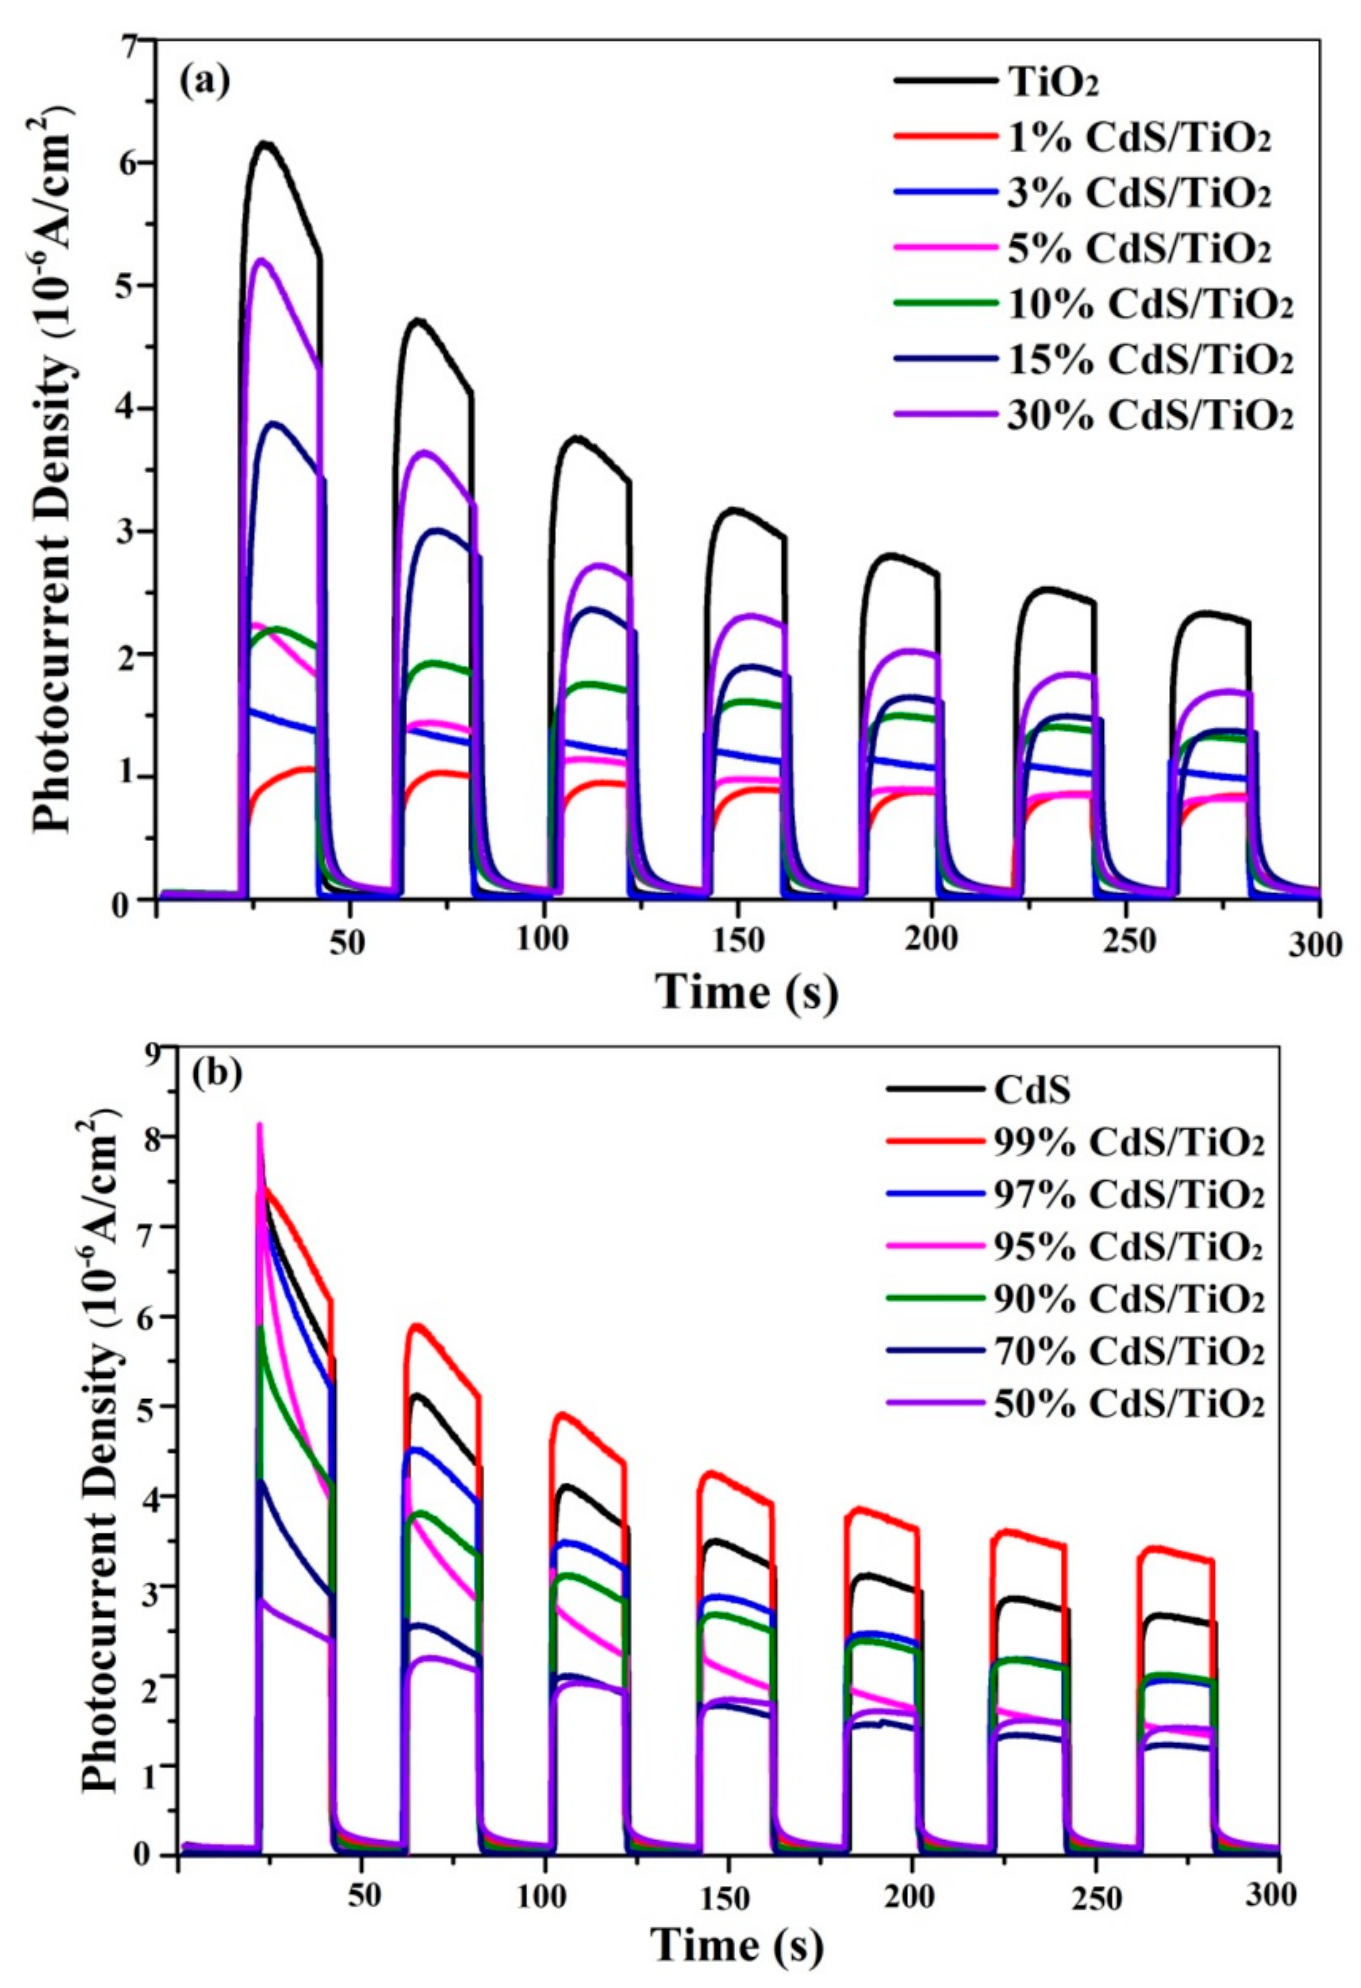
To further elucidate the electronic interactions between TiO2 and CdS, we employed transient photocurrent response measurements to investigate charge transfer properties. Transient photocurrent measurements were performed in a conventional three-electrode quartz cell using the prepared samples as working electrodes, a Pt wire as the counter electrode, and an Ag/AgCl (saturated KCl) reference electrode. The electrolyte was 0.2 M Na2SO4 aqueous solution (pH ≈ 6.8). A 300 W Xe lamp equipped with a UV-cutoff filter (λ < 400 nm) served as the light source, and the light was switched on and off at regular intervals (20 s light on/20 s off). All measurements were carried out at a constant applied potential of 0.0 V vs. Ag/AgCl, and the photocurrent was recorded with an electrochemical workstation (CHI660E).
As shown in Figure 9a, when TiO2 serves as the main component of the CdS/TiO2 heterojunction photocatalyst, its photocurrent response is lower than that of pure TiO2. Addition of 1% CdS causes a sudden decrease in the photocurrent response; further increasing CdS content results in a continuous rise in photocurrent intensity. However, Figure 9b reveals that when CdS constitutes the primary component, adding 1% TiO2 slightly enhances the photocurrent intensity before gradually declining with increasing TiO2 concentration. This behavior is attributed to the fact that small amounts of CdS in TiO2 abruptly slow down the recombination rate of photogenerated charges and hole pairs, which then gradually increases with higher CdS concentrations. Conversely, when CdS forms the main component, the photocurrent peak initially strengthens slightly before weakening as TiO2 content rises.
The transient photocurrent density is directly proportional to the separation efficiency of photogenerated electron–hole pairs. A higher photocurrent indicates that more carriers are successfully transferred to the electrode surface instead of recombining internally. In the TiO2-dominant region, the sudden drop upon adding 1% CdS suggests that the initial formation of heterojunction actually introduces additional recombination centres or unfavourable band bending, which hinders charge extraction. As the CdS content further increases, the interfacial electric field becomes stronger and the charge separation improves, leading to a gradual rise in photocurrent. In the CdS-dominant region, the opposite trend indicates that the charge-transfer mechanism changes when the relative component ratio crosses a certain threshold—consistent with a transition from a type-II band alignment to a Z-scheme pathway. We have elaborated these points in the revised text.
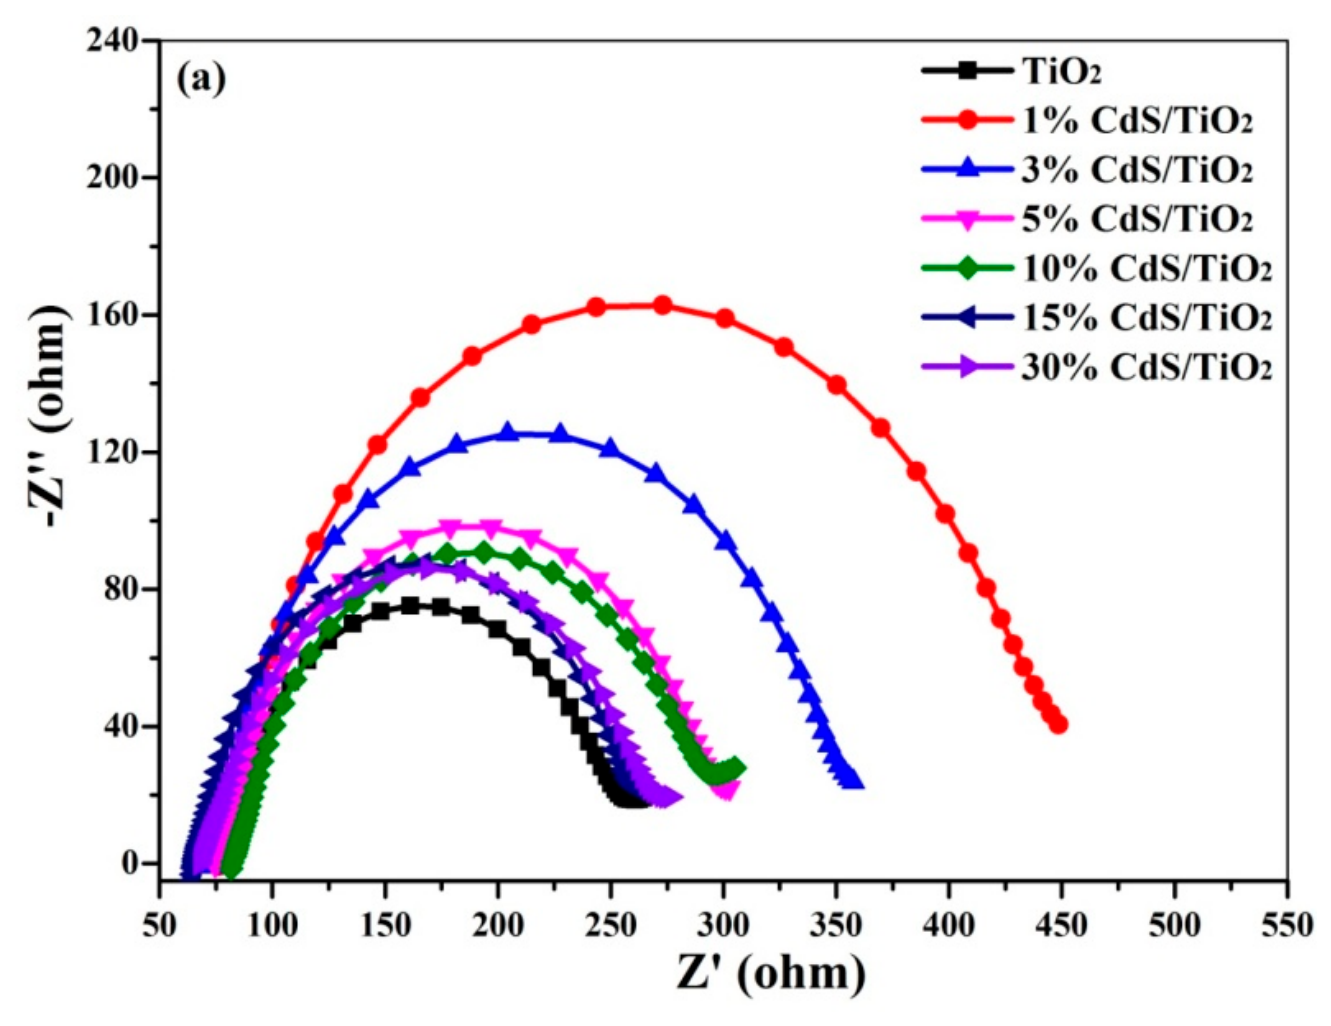
We employed electrochemical impedance spectroscopy (EIS) to investigate carrier migration at the electrode–electrolyte interface. Electrochemical impedance spectroscopy (EIS) was performed using the same three-electrode configuration and electrolyte as the photocurrent tests. The impedance spectra were recorded in the frequency range from 100 kHz to 0.01 Hz with an AC amplitude of 10 mV at the open-circuit potential under dark conditions (for baseline) and under UV illumination. All measurements were conducted at room temperature.
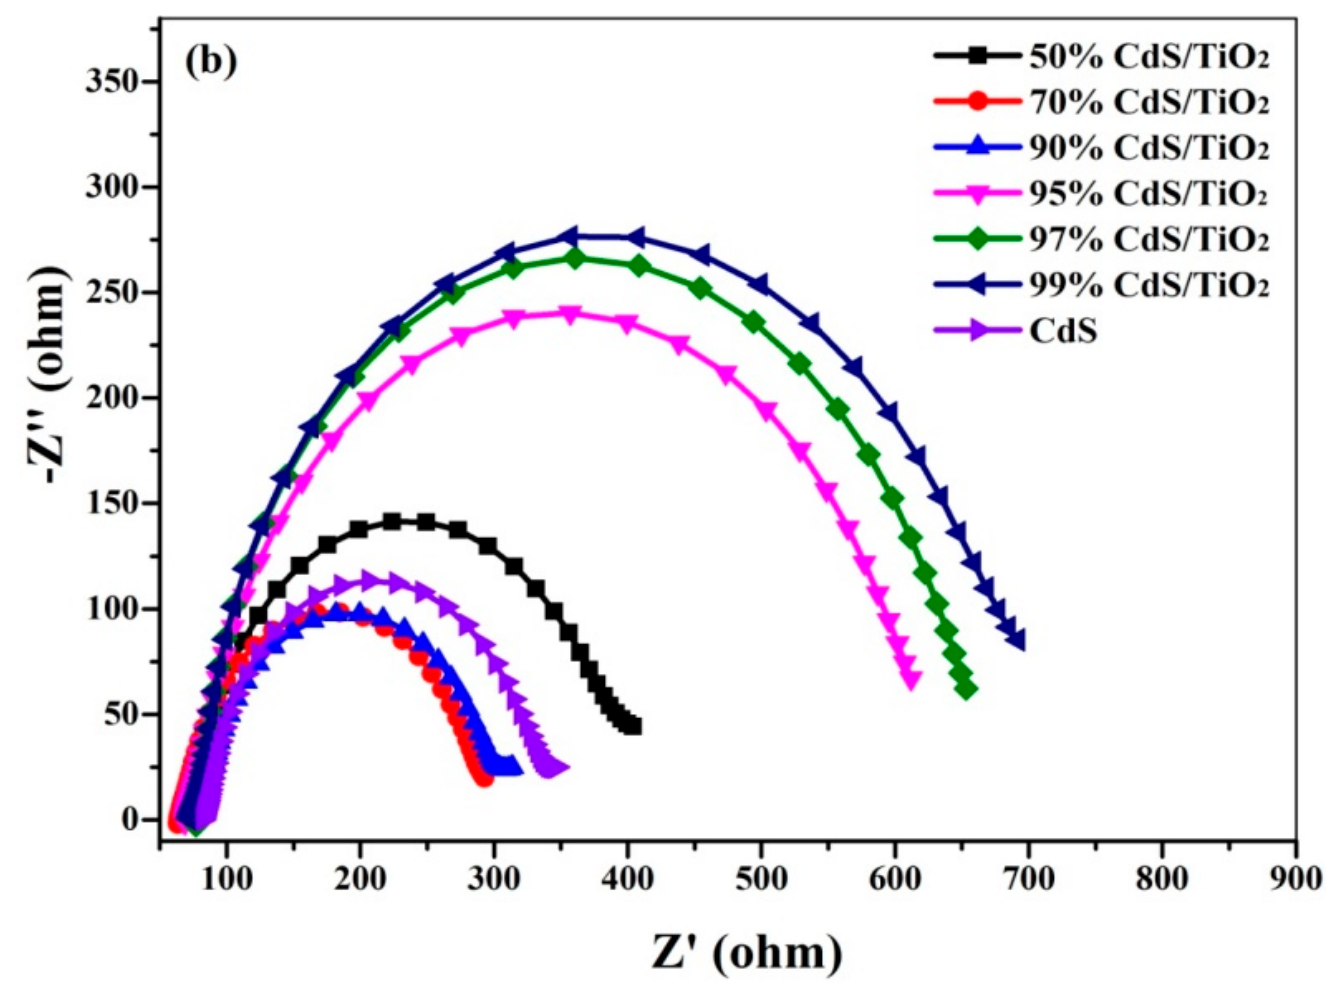
As shown in Figure 10a, compared to pure TiO2 and CdS, when TiO2 constitutes the bulk phase of the CdS/TiO2 heterojunction photocatalyst, the arc radius decreases with increasing CdS content until reaching 70% CdS/TiO2. Figure 10a reveals a sudden increase in arc radius upon adding 1% CdS. Figure 10b demonstrates that when CdS serves as the bulk phase, the arc radius of the composite sample decreases with rising TiO2 content, with the 1% CdS/TiO2 sample exhibiting the largest arc radius—indicating a abrupt increase in arc radius upon TiO2 addition, consistent with the photocatalytic activity measurements.
From Mott–Schottky (M-S) and band-gap measurements, we determined the conduction-band and valence-band edge positions of TiO2 and CdS. Under UV light, electrons are excited to the CB and holes to the VB. When TiO2 is the majority phase, the internal electric field drives electrons from CdS to TiO2 and holes from TiO2 to CdS—this is the conventional band-to-band transfer (type-II). When CdS becomes the majority phase, the direction of the built-in field reverses, and the charge carriers follow a Z-scheme path: photogenerated electrons in the CB of TiO2 recombine with photogenerated holes in the VB of CdS, leaving high-energy electrons in CdS’s CB and holes in TiO’s VB. This is confirmed by the increased production of •O2 and •OH radicals on the respective surfaces.

2.2.4. Solid Fluorescence Testing

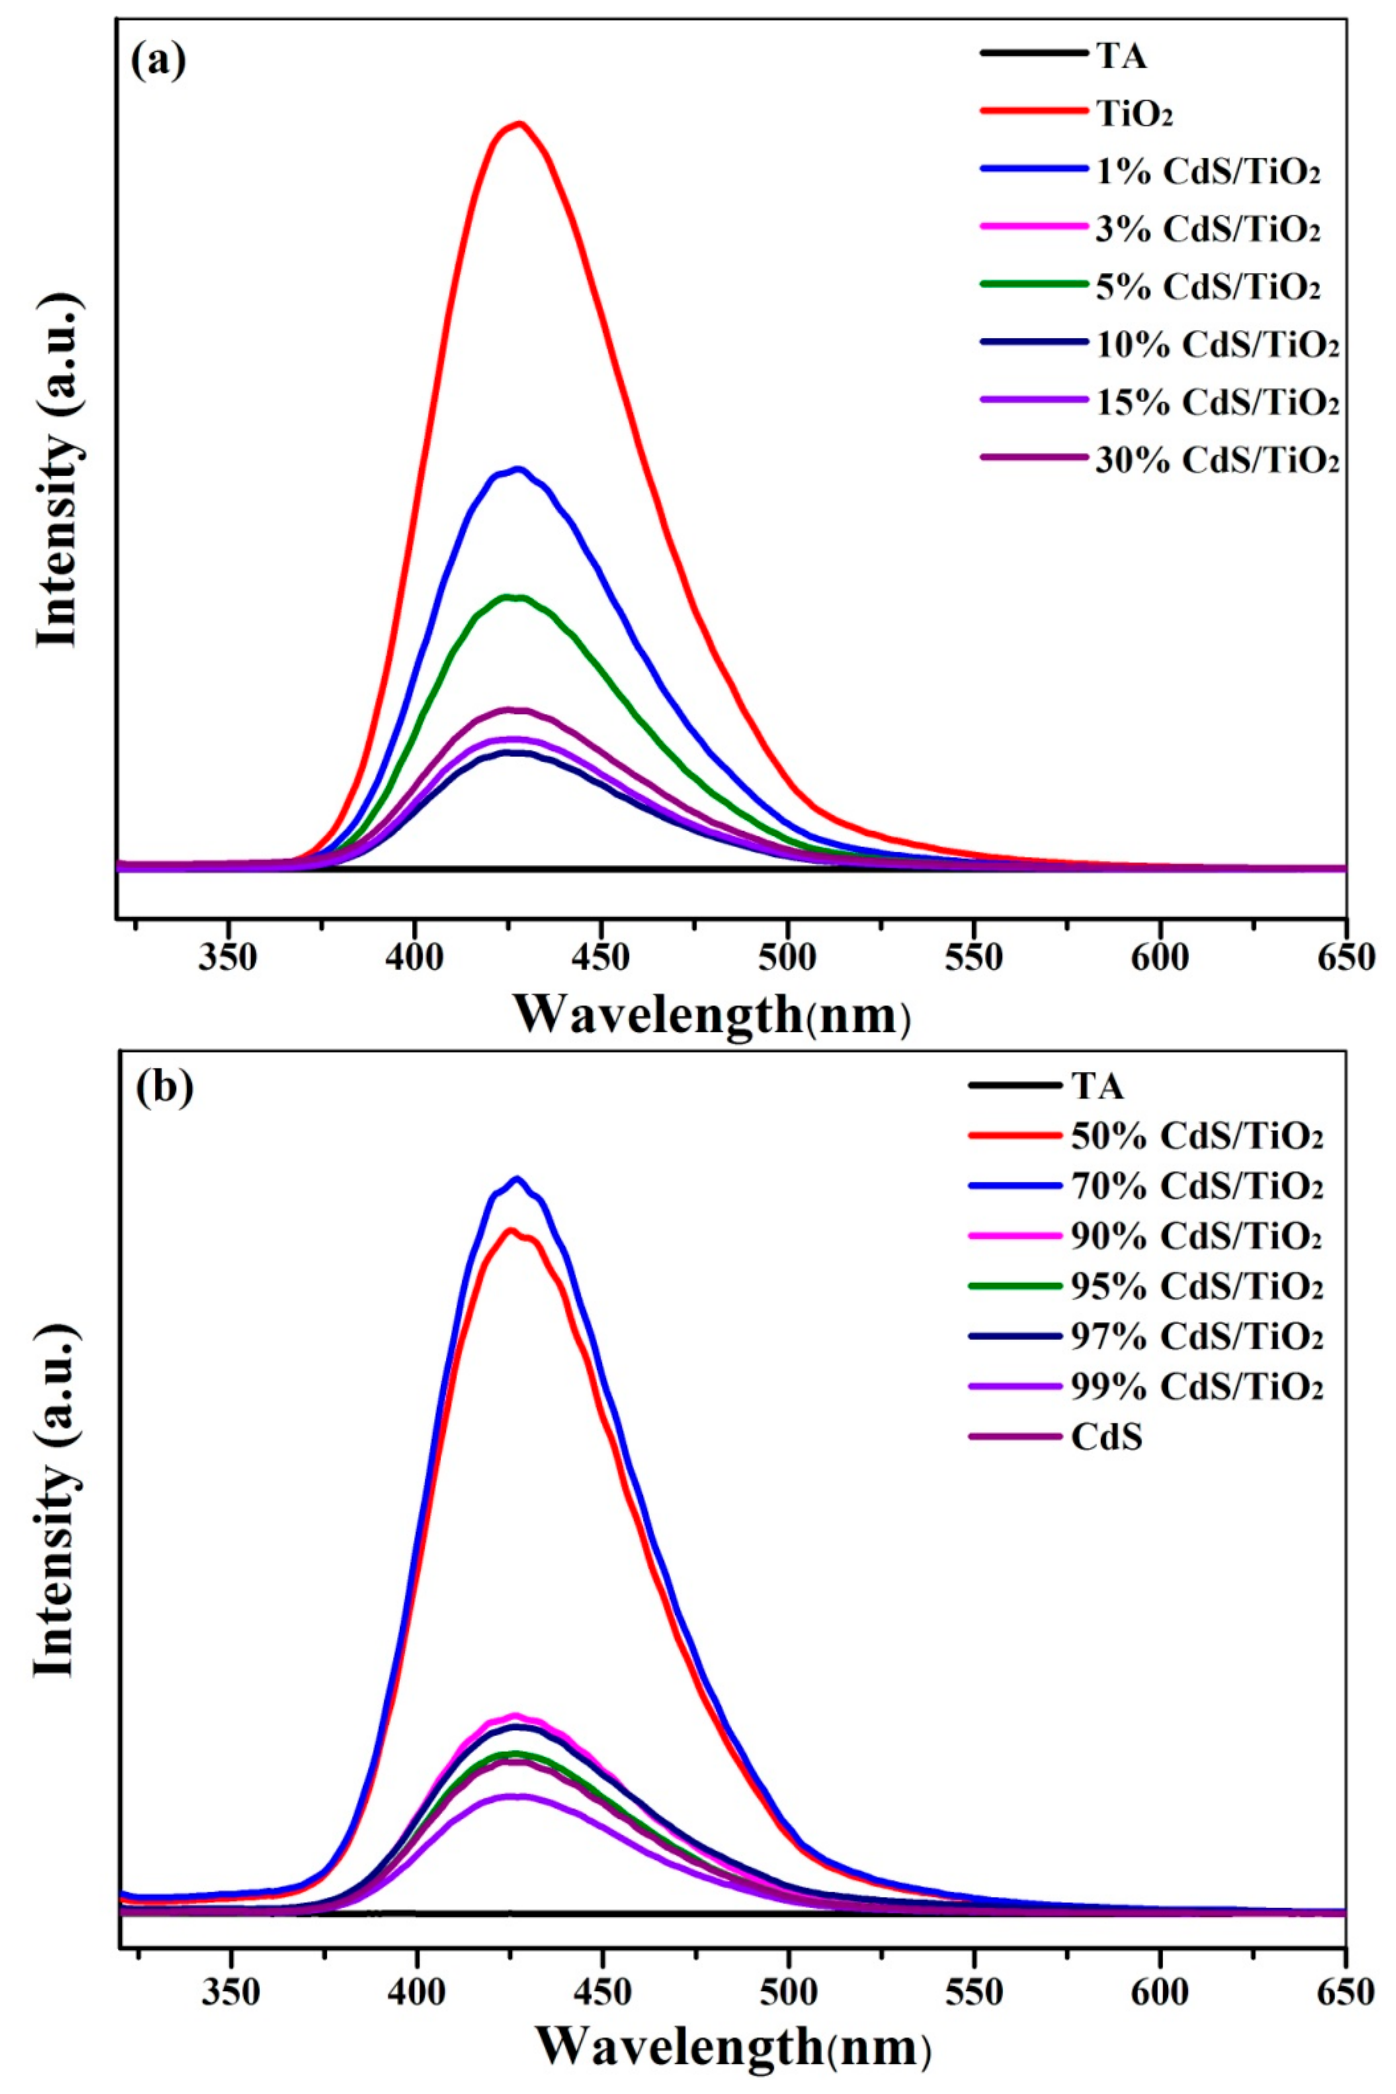
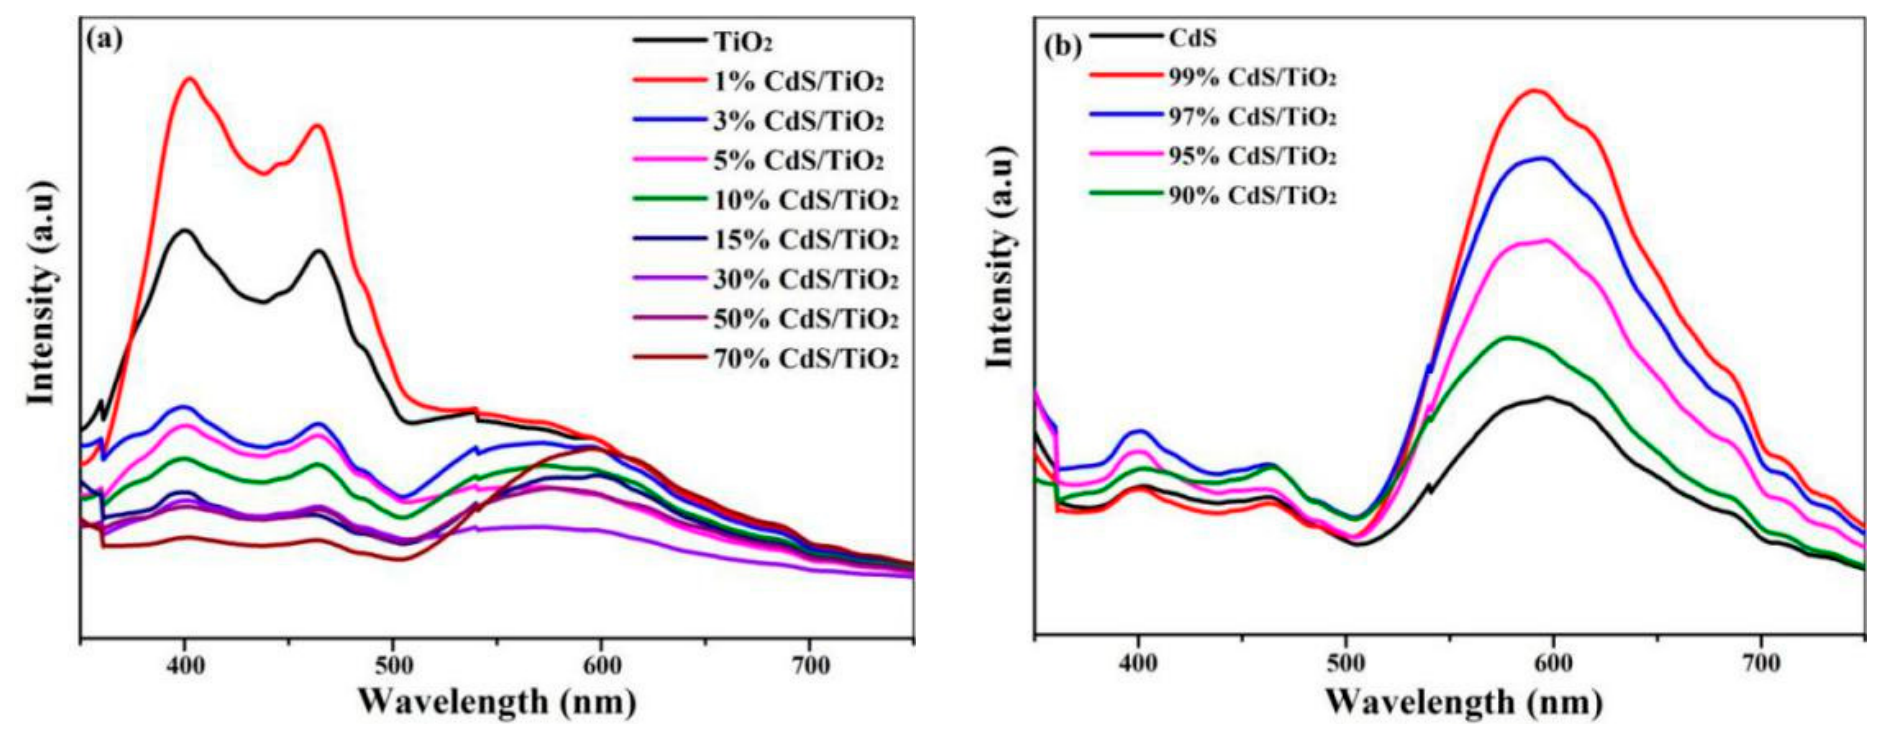
To further investigate the separation and recombination of charge carriers, we employed solid-state fluorescence and time-resolved photoluminescence decay techniques for detailed analysis. As shown in Figure 11a, the addition of CdS causes a sudden increase in PL intensity; however, as CdS content rises, the PL intensity of the CdS/TiO2 composite significantly decreases compared to that of pure TiO2, with a progressive decline until reaching 70% CdS content—a trend consistent with experimental observations, likely attributed to conventional electron–hole transfer mechanisms. Figure 11b demonstrates that when CdS constitutes the main component of the photocatalyst, the PL intensity initially increases upon adding 1% TiO2 but subsequently declines with increasing TiO2 concentration. This indicates inhibited binding of photogenerated electrons and holes, enhanced interfacial charge transfer leading to prolonged fluorescence lifetime, and consequently a significant improvement in photocatalytic activity [45,46,47], aligning with the Z-shaped transfer mechanism.
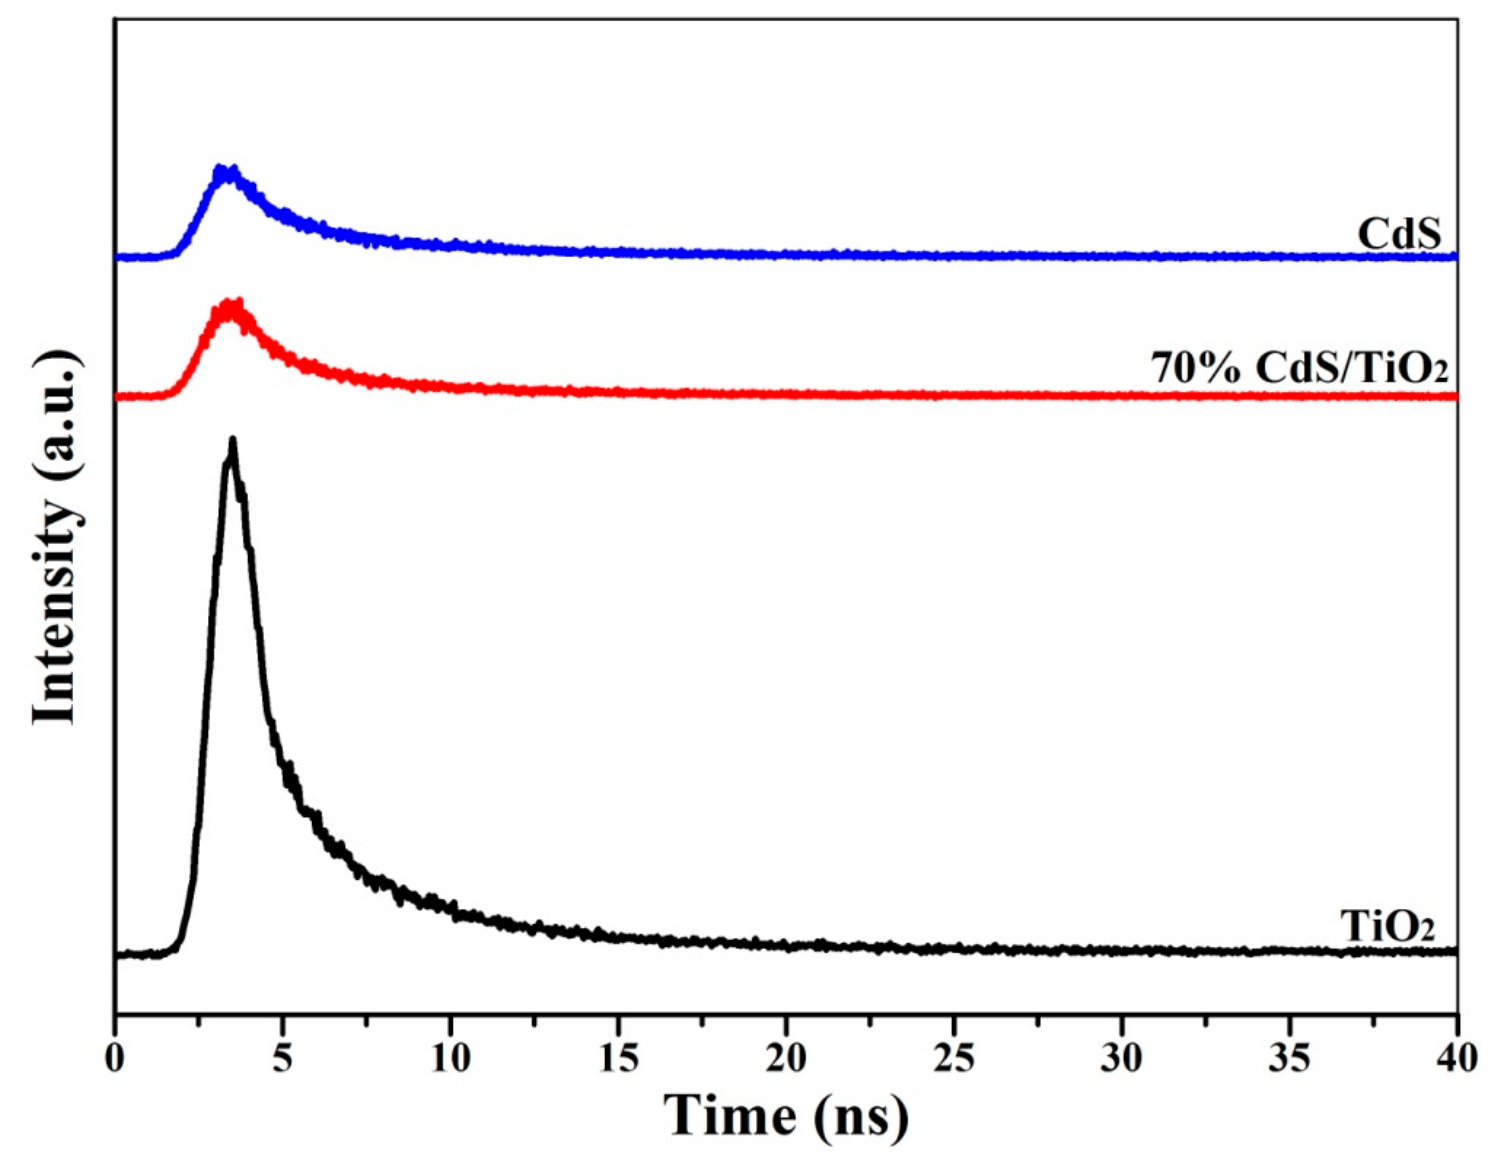
Time-resolved photoluminescence decay spectroscopy was employed to investigate the separation efficiency of photogenerated charge carriers [48]. Figure 12 shows the time-resolved photoluminescence decay spectra. The calculated transient photoluminescence lifetimes were 10.43 ns for pure TiO2, 6.85 ns for the 70% CdS/TiO2 heterojunction, and 6.68 ns for pure CdS. The fluorescence lifetime of the 70% CdS/TiO2 sample was lower than that of pure TiO2, indicating that the separation efficiency of photogenerated electrons and holes in the composite catalyst was poor. Meanwhile, the fluorescence lifetime of the 70% CdS/TiO2 sample was higher than that of pure CdS, suggesting a slower recombination rate of photogenerated electron–hole pairs, i.e., an extension of the fluorescence lifetime.

2.2.5. Conductivity of CdS/TiO2 Heterojunctions

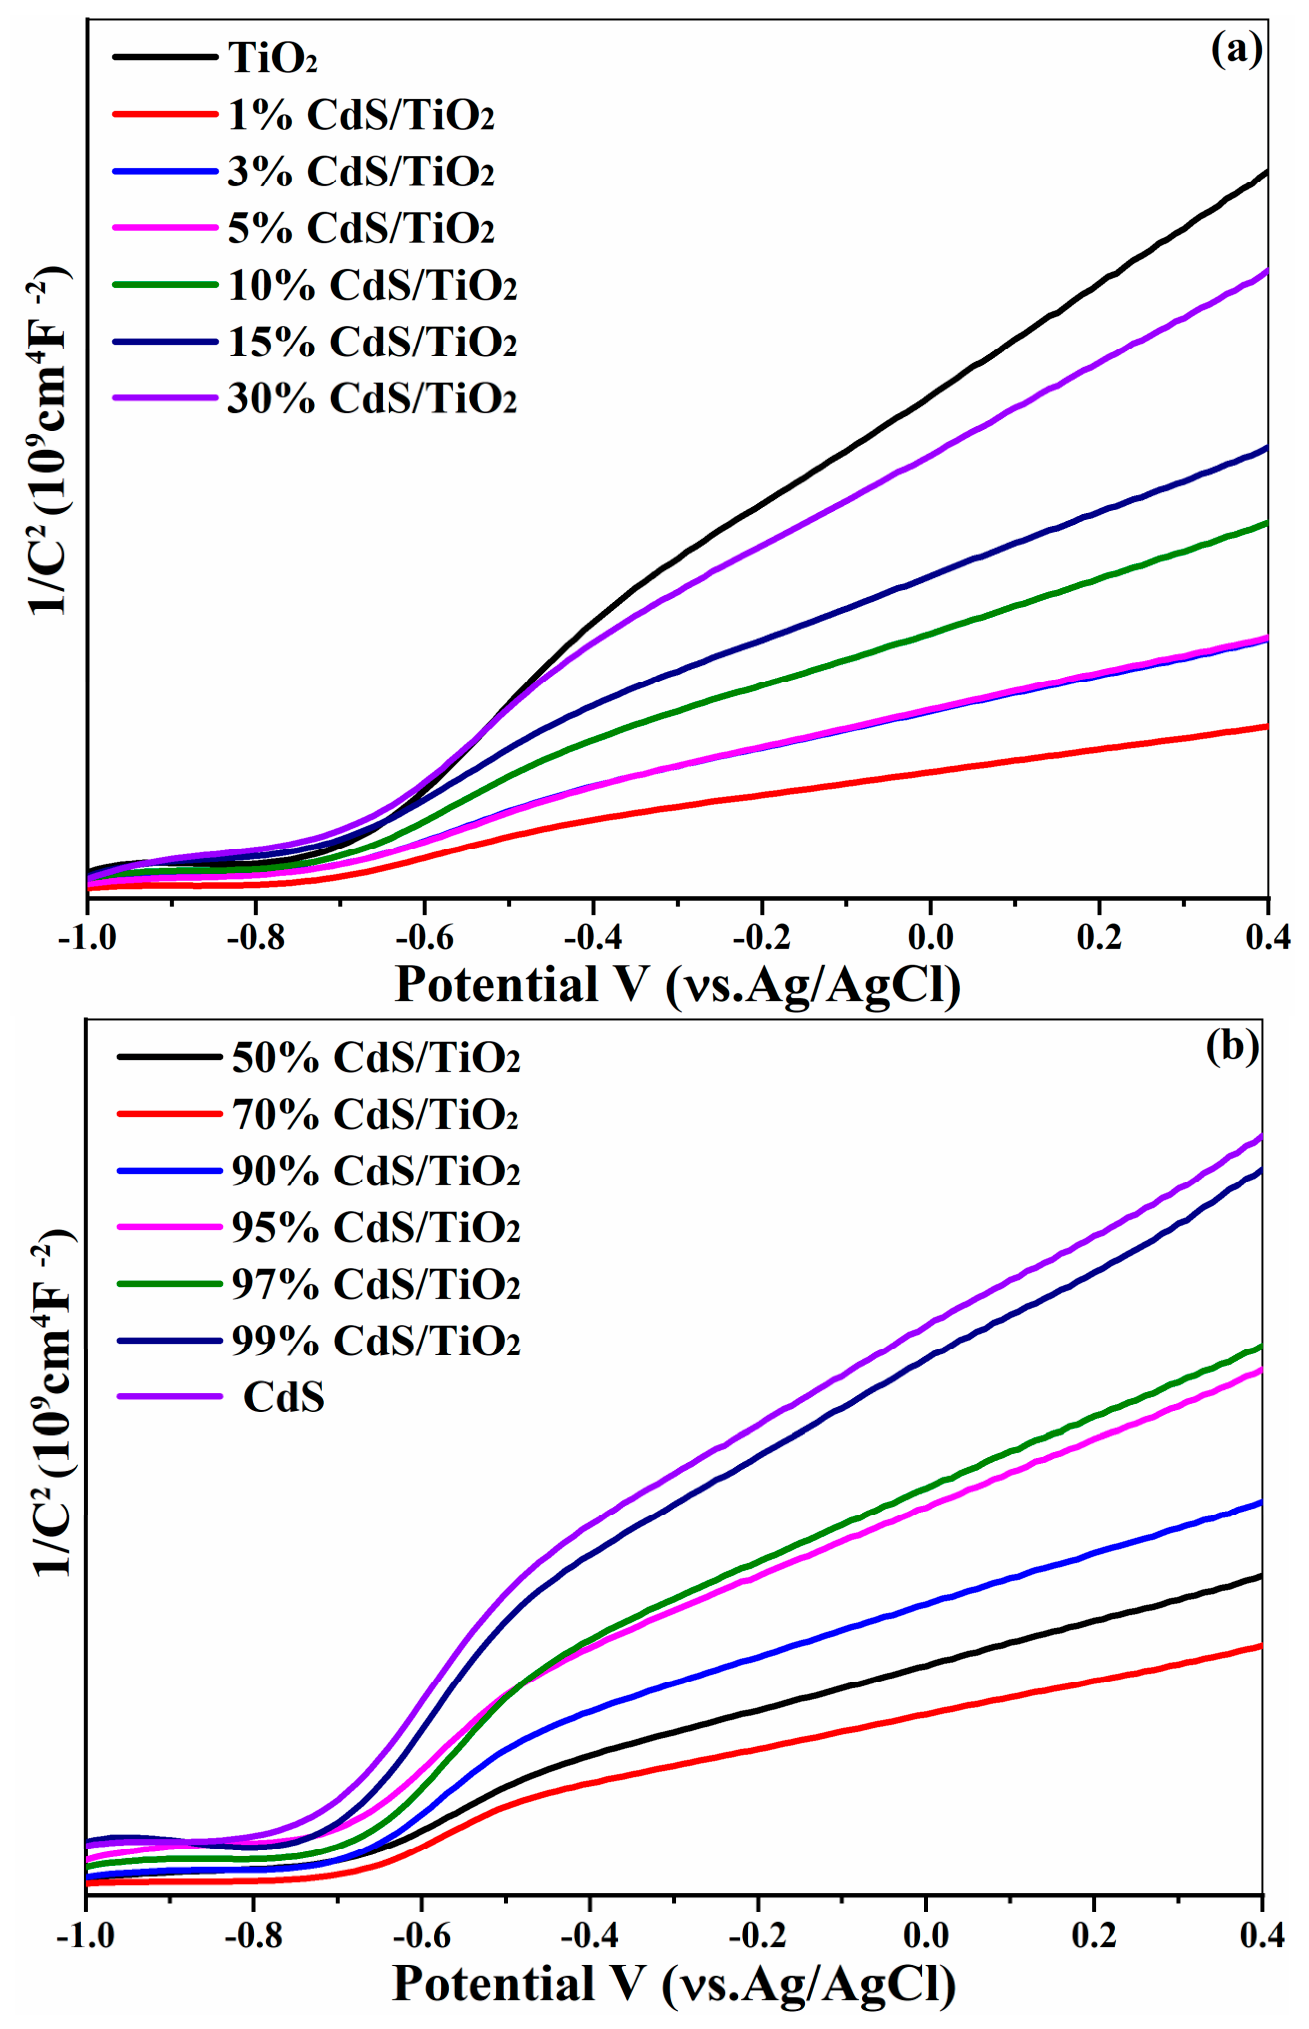
It is important to note that while TiO2 is intrinsically an n-type semiconductor, its carrier concentration can be significantly lower than that of CdS. When the two are brought into contact, the carrier concentration difference drives electron diffusion from CdS to TiO2, causing TiO2 to behave as the p-type counterpart in a relative p–n junction. Mott–Schottky measurements were performed using the same three-electrode configuration described in Section 2.2.3 (working electrode: sample-coated FTO glass; counter electrode: Pt wire; reference: Ag/AgCl; electrolyte: 0.2 M Na2SO4, pH ≈ 6.8). The AC frequency was 1 kHz, with an AC amplitude of 10 mV. The potential was scanned from –1.0 V to +1.0 V (vs. Ag/AgCl) at a scan rate of 50 mV·s−1, under dark conditions. We successfully prepared a CdS/TiO2 heterojunction photocatalyst via solid-phase grinding. As shown in Figure 13, the linear slopes of all samples on the M-S curves are positive, indicating that they all belong to n-type semiconductors [49]. Due to the differing carrier concentrations between the CdS and TiO2 semiconductors, carriers diffuse from the semiconductor with higher concentration to the one with lower concentration, thereby creating an internal electric field that forms a p–n junction. To illustrate this further, the carrier density (Nd) on the samples was determined from the MS curves using the following equation [38,45]:
N d = 2 e ɛ ɛ 0 d U FL d 1 / C 2
where UFL is the flat-band voltage (V), i.e., the electrode potential at which the space-charge layer in the semiconductor vanishes; the term dUFL/d (1/C2) denotes the slope of the Mott-Schottky plot, where, e = 1.6 × 10⁻¹⁹ C and ε0 = 8.86 × 10⁻¹² F·m−1; and ε denotes the dielectric constant and C represents capacitance [50,51].
Experimental results show that the dielectric constants of TiO2 and CdS are approximately 58.1 and 8.7, respectively. As shown in Table 1, the slopes for CdS are 3.20 × 10⁹ and for TiO2 are 2.11 × 10⁹. Calculations indicate that the mobility of TiO2 is lower than that of CdS. Consequently, upon combining TiO2 and CdS, a CdS→TiO2 relative p–n junction forms, where charge carriers diffuse from CdS (where carriers are abundant) to TiO2 (where carriers are scarce), with the internal electric field direction being n→p. In the CdS/TiO2 heterojunction, both TiO2 and CdS act as p-type and n-type semiconductors analogous to those in a conventional p–n junction, respectively. The slopes of both CdS and TiO2 samples fall between those of TiO2 and CdS (Table 1), indicating no change in their electrical conductivity within the heterojunction photocatalyst [52,53].

2.3. Confirmation of the Reaction Mechanism of the CdS/TiO2 Heterojunction

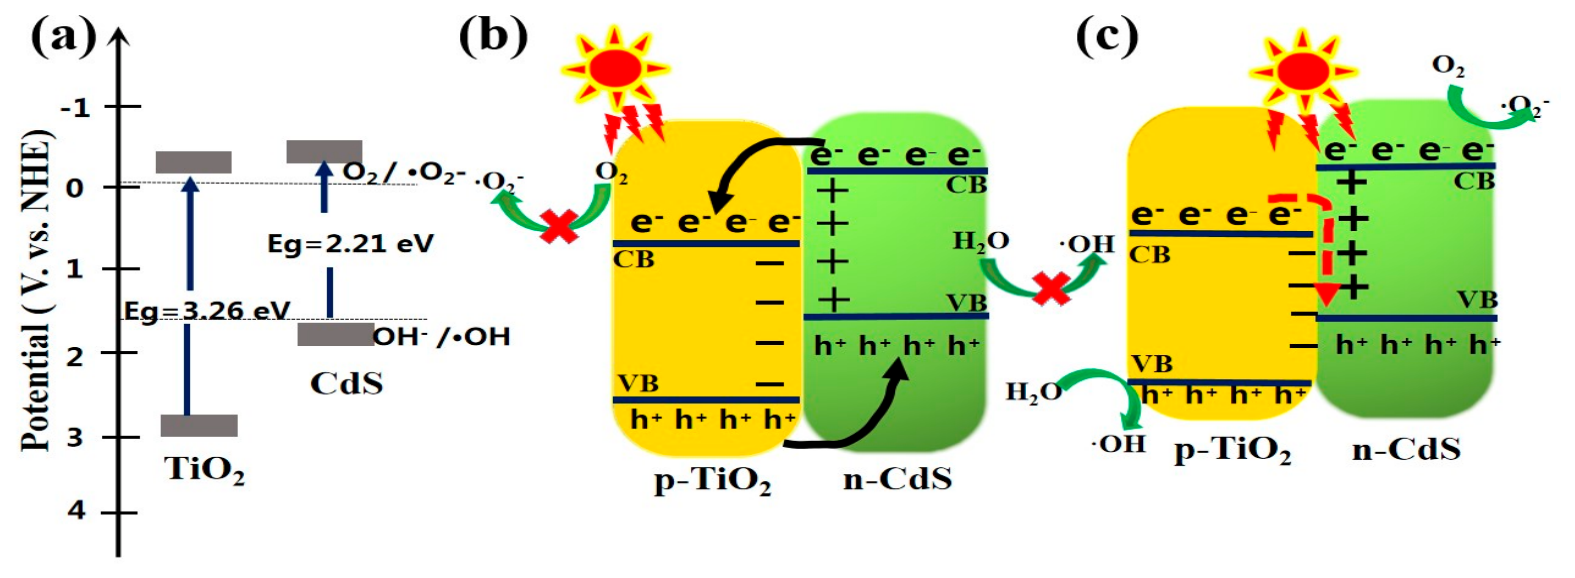
Figure 14 proposes a photocatalytic mechanism for CdS/TiO2 heterojunctions under UV-light irradiation: (a) photoexcitation process–generation of electron–hole pairs in both TiO2 and CdS upon UV illumination; (b) charge-carrier transfer pathways–showing the type-II band-to-band transfer (when TiO2 is the dominant component) or the Z-scheme transfer (when CdS is the dominant component), depending on the composition; (c) surface redox reactions–reduction of O2 to •O2 by CB electrons on the corresponding surface and oxidation of H2O/OH to •OH by VB holes, followed by pollutant degradation through these reactive oxygen species. It is known that when an n-type semiconductor and a p-type semiconductor (i.e., a p–n junction) are connected, an intrinsic electric field is formed due to the diffusion motion of majority carriers. The direction of this intrinsic electric field in the p–n junction runs from the n-type to the p-type semiconductor (n→p). If the migration direction of photogenerated charge carriers in the conduction band (CB) and valence band (VB) of the two contacting semiconductors aligns with the direction of the intrinsic electric field in the heterojunction, band-to-band transfer occurs. Therefore, in experiments using TiO2-based composite photocatalysts, the heterojunction catalyst forms a structure analogous to a p–n junction relative to CdS/TiO2: TiO2 exhibits a p-type character while CdS shows an n-type character due to differing carrier concentrations [54,55]. Under the influence of the intrinsic electric field, photogenerated electrons migrate to the p-type TiO2 surface, while holes migrate to the n-type CdS surface. The migration directions of photogenerated electrons and holes in the CB and VB of both CdS and TiO2 match those observed in a typical p–n junction; thus, the photocarrier migration mechanism in TiO2-dominated CdS/TiO2 systems follows a band-to-band transfer mechanism. When CdS serves as the dominant component, rapid recombination occurs between electrons in TiO2’s CB and holes in CdS’s VB, resulting in significant accumulation of electrons in TiO2’s CB and substantial hole generation in CdS’s VB. Electrons in the CB of TiO2, which carries a higher negative potential, reduce O2 to •O2, while holes in the VB of CdS, possessing a higher positive potential, generate •OH, thereby enhancing photocatalytic activity; thus, the photoexcited carrier transfer mechanism follows Scheme Z.

3. Experimental Section

3.1. Experimental Reagents

Titanium dioxide (TiO2), cadmium nitrate (Cd(NO3)2·4H2O), sodium sulfide (c),5,5-Dimethyl-1-pyrrolidine-N-oxide (DMPO) and ethanol were purchased from Aladdin Co., Ltd. Rhodamine B (RhB), methyl orange (MO), bisphenol A (BPA), and other chemicals used in the experiment were obtained from China Aladdin Co., Ltd., all of which are available in analytical grade for direct use; deionized water was employed in this experiment.

3.2. Preparation of Photocatalysts

The preparation method of CdS is as follows: 1.067 g of Cd(NO3)2·4H2O and 1.662 g of Na2S·9H2O were placed into an agate jar and ball-milled at room temperature for 60 min to obtain 0.4998 g of CdS. The product was then thoroughly washed several times with deionized water and dried to obtain pure CdS.
The preparation process for the CdS/TiO2 composite photocatalyst is as follows: TiO2, Cd(NO3)2·4H2O, and Na2S·9H2O were mixed in specific mass ratios and ball-milled for 1 h, with ethanol added as a dispersing agent during the process. The resulting samples were washed several times with deionized water and then dried in a vacuum oven at 60 °C for 8 h. Using this method, CdS/TiO2 samples with CdS weight percentages of 1%, 3%, 5%, 10%, 15%, 30%, 50%, 70%, 90%, 95%, 97%, and 99% were prepared. Pure TiO2 samples were also treated under the same experimental conditions.

3.3. Evaluation of Photocatalytic Activity of Photocatalysts

To determine the optimal CdS loading and to reveal how the relative proportion of TiO2 and CdS affects the photocatalytic behaviour, we evaluated the degradation efficiency of the as-prepared series of CdS/TiO2 composites towards RhB, MO, and BPA under UV-light irradiation. Experiment details are shown as follows: (1) Light source: 300 W xenon lamp with a UV-cutoff filter (λ < 400 nm for UV-light irradiation). (2) Catalyst dosage: 20 mg of photocatalyst dispersed in 50 mL of pollutant solution. (3) Pollutant concentration: 10 mg/L for RhB, MO, and BPA. (4) Dark adsorption: Prior to illumination, the suspension was stirred in the dark for 30 min to establish adsorption–desorption equilibrium. (5) Irradiation time: 60 min, with samples taken at 10 min intervals. (6) Analysis: The concentration of pollutants was monitored by UV-Vis spectrophotometry at their respective maximum absorption wavelengths.
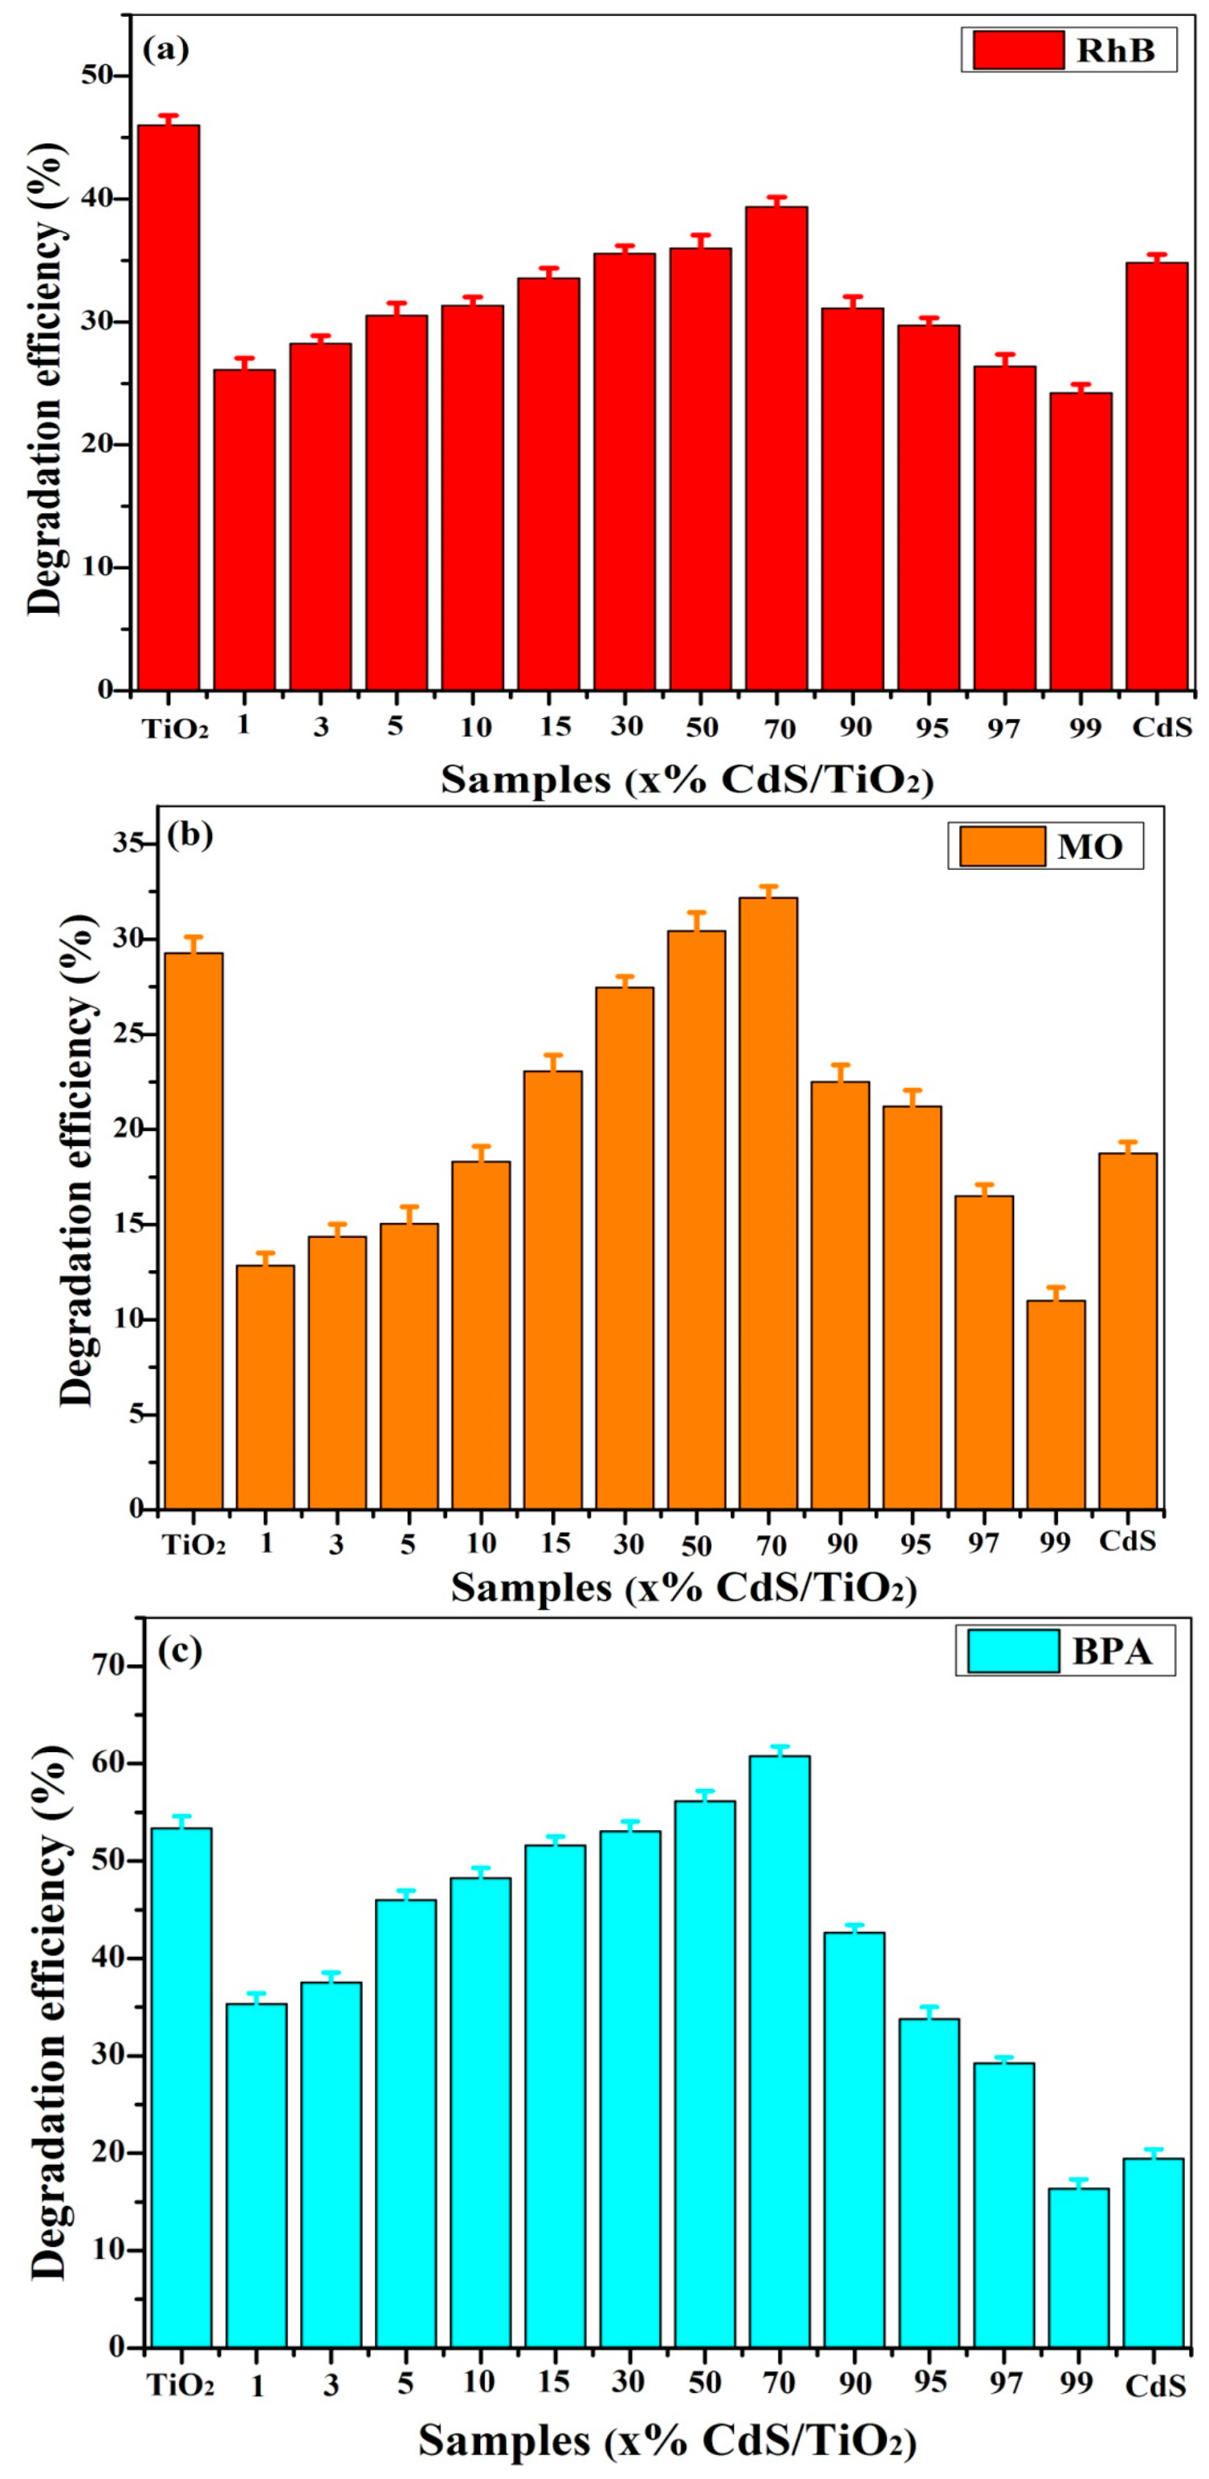
We evaluated the photocatalytic activity of the CdS/TiO2 heterojunction by degrading RhB, MO, and BPA. The blank control experiments demonstrated no significant photodegradation in the absence of a catalyst. As shown in Figure 15, TiO2 exhibited photocatalytic efficiencies of 46%, 29.1%, and 53.3% for RhB, MO, and BPA, respectively, while CdS showed efficiencies of 34.8%,18.6%, and 19.2%. Figure 15a–c reveal that 70% CdS/TiO2 has higher degradation efficiency for RhB than pure CdS, while lower than pure TiO2. As for MO and BPA, the degradation efficiency of 50% CdS/TiO2 and 70% CdS/TiO2 both higher than those of pure CdS and TiO2. The results indicate the photocatalytic performance is pollutant-dependent. More importantly, our key finding is not simply that composites are always superior, but rather that the activity trend is highly composition-dependent. Adding a very small amount of the second component (e.g., 1% CdS into TiO2, or 1% TiO2 into CdS) suppresses the activity. The activity gradually recovers and peaks at the intermediate ratio (70% CdS/TiO2). Beyond this optimal point, the activity declines again. This non-monotonic trend strongly suggests a switch in the charge-transfer mechanism as the dominant component changes. We performed five consecutive photocatalytic degradation cycles using the optimal 70% CdS/TiO2 sample under identical conditions. After each cycle, the catalyst was recovered by centrifugation, washed, and reused. The degradation efficiency remained above 90% of its initial value after five cycles, indicating excellent reusability and photostability.

4. Conclusions

The heterojunction photocatalyst CdS/TiO2 was prepared via solid-phase grinding. When TiO2 constitutes the main component of the CdS/TiO2 composite, adding 1% CdS reduces its activity; this may occur because, although electron transfer occurs between CdS and TiO2, the tendency for electron–hole binding within the composite catalyst remains stronger than that in TiO2 alone. Subsequently, as the CdS content increases progressively up to 70% of TiO2, the photocatalytic activity continues to improve. This is likely due to the alignment of electron–hole transport directions between TiO2 and CdS with those in the internal electric field generated by the p–n junction (p-TiO2/n-CdS), thereby enhancing the separation of photogenerated electron–hole pairs and consequently improving the overall performance of the composite photocatalyst.
When CdS serves as the main component in the CdS/TiO2 composite, the migration directions of electrons and holes in the relative p–n junction oppose those of photogenerated electrons and holes in both TiO2 and CdS. Consequently, the photo-carrier transport mechanism in the CdS/TiO2 heterojunction photocatalyst follows a Z-shaped pattern: holes in TiO2’s valence band rapidly combine with electrons in CdS’s conduction band, endowing CdS’s conduction band with strong reducing capacity to reduce O2 into •O2; simultaneously, TiO2’s valence band exhibits high oxidizing capability to oxidize H2O into •OH.

Author Contributions

Investigation, data curation, software, and formal analysis, N.Y.; Visualization, funding acquisition, writing—original draft, S.Z.; Resources, Supervision, Writing—review and editing, G.C. All authors have read and agreed to the published version of the manuscript.

Funding

This work was supported by the National Natural Science Foundation of China (52272297, 52372285, 51972134 and 52002142), the Natural Science Foundation of Anhui Province (2208085MB25), the University Natural Science Research Project of Anhui Province (2022AH050389, 2025AHGXZK31583, KJ2019A0602), the fund of the State Key Laboratory of Catalysis in DICP (N-23-06) and the Independent Research Project of Key Laboratory of Green and Precise Synthetic Chemistry and Applications (Huaibei Normal University), Ministry of Education. (KLGPSCA202304).

Institutional Review Board Statement

Not applicable.

Informed Consent Statement

Not applicable.

Data Availability Statement

All raw experimental records and original data supporting the findings of this work can be obtained from the corresponding authors upon reasonable request.

Conflicts of Interest

The authors declare no conflicts of interest.

References

  1. Li, Q.; Guo, B.; Yu, J.; Ran, J.; Zhang, B.; Yan, H.; Gong, J.R. Highly efficient visible-light-driven photocatalytic hydrogenproduction of CdS-cluster-decorated Graphene Nanosheets. J. Am. Chem. Soc. 2011, 133, 10878–10884. [Google Scholar] [CrossRef] [PubMed]
  2. Zhou, M.; Lou, X.W.; Xie, Y. Two-dimensional nanosheets for photoelectrochemical water splitting: Possibilities and opportunities. Nano Today 2013, 8, 598–618. [Google Scholar] [CrossRef]
  3. Liu, G.; Niu, P.; Sun, C.H.; Smith, S.C.; Chen, Z.G.; Lu, G.Q.; Cheng, H.M. Unique electronic structure induced high photoreactivity of sulfur-doped graphitic C3N4. J. Am. Chem. Soc. 2010, 132, 1642–11648. [Google Scholar] [CrossRef]
  4. Zhang, A.Y.; Long, L.L.; Liu, C.; Li, W.W.; Yu, H.Q. Chemical recycling of the waste anodic electrolyte from the TiO2 nanotube preparation process to synthesize facet-controlled TiO2 single crystals as an efficient photocatalyst. Green Chem. 2014, 16, 2745–2753. [Google Scholar] [CrossRef]
  5. Xiang, Q.; Yu, J.G.; Jaroniec, M. Synergetic effect of MoS2 and graphene as cocatalysts for enhanced photocatalytic H2 production activity of TiO2 nanoparticles. J. Am. Chem. Soc. 2012, 134, 6575–6578. [Google Scholar] [CrossRef] [PubMed]
  6. Hong, J.D.; Xia, X.Y.; Wang, Y.S.; Xu, R. Mesoporous carbon nitride with in situ sulfur doping for enhanced photocatalytic hydrogen evolution from water under visible light. J. Mater. Chem. 2012, 22, 15006–15012. [Google Scholar] [CrossRef]
  7. Zheng, X.; Li, D.; Li, X.; Chen, J.; Cao, C.; Fang, J.; Wang, J.; He, Y.; Zheng, Y. Construction of ZnO/TiO2 photonic crystal heterostructures for enhanced photocatalytic properties. Appl. Catal. B Environ. 2015, 168, 408–415. [Google Scholar] [CrossRef]
  8. Chen, S.F.; Yang, Y.G.; Liu, W. Facile synthesis of g-C3N4/ZnO composite with enhanced visible light photooxidation and photoreduction properties. J. Hazard. Mater. 2011, 186, 1560–1567. [Google Scholar]
  9. Chen, S.F.; Hu, Y.F.; Meng, S.G.; Fu, X.L. Study on the separation mechanisms of photogenerated electrons and holes for composite photocatalysts g-C3N4-WO3. Appl. Catal. B Environ. 2012, 134, 951–957. [Google Scholar]
  10. Zha, R.; Nadimicherla, R.; Guo, X. Ultraviolet photocatalytic degradation of methyl orange by nanostructured TiO2/ZnO heterojunctions. J. Mater. Chem. A 2015, 3, 6565–6574. [Google Scholar] [CrossRef]
  11. Chen, Z.M.; Wang, J.G.; Zhai, G.J.; An, W.; Men, Y. Hierarchical yolk-shell WO3 microspheres with highly enhanced photoactivity for selective alcohol oxidations. Appl. Catal. B-Environ. 2017, 218, 825–832. [Google Scholar] [CrossRef]
  12. Taing, J.; Cheng, M.H.; Hemminger, J.C. Photodeposition of Ag or Pt onto TiO2 nanoparticles decorated on step edges of hopg. ACS Nano 2011, 5, 6325–6333. [Google Scholar] [CrossRef] [PubMed]
  13. Zhang, X.; Ai, Z.; Jia, F.; Zhang, L. Generalized one-pot synthesis, characterization, and photocatalytic activity of hierarchical BiOX (X = Cl, Br, I) nanoplate microspheres. J. Phys. Chem. C 2008, 112, 747–753. [Google Scholar] [CrossRef]
  14. Zhang, J.; Chen, X.; Takanabe, K.; Maeda, K.; Domen, K.; Epping, J.D.; Fu, X.; Antonietti, M.; Wang, X. Synthesis of a carbon nitride structure for visible-light catalysis by copolymerization. Angew. Chem. Int. Ed. 2010, 49, 441–444. [Google Scholar]
  15. Xie, R.; Kolb, U.; Li, J.; Basch’e, T.; Mews, A. Synthesis and characterization of highly luminescent CdS −Core CdS/Zn0.5Cd0.5S/ZnS multishellnanocrystals. J. Am. Chem. Soc. 2005, 127, 7480–7488. [Google Scholar] [CrossRef] [PubMed]
  16. Zhang, J.S.; Sun, J.H.; Maeda, K.; Domen, K.; Liu, P.; Antonietti, M.; Fu, X.Z.; Wang, X.C. Sulfur-mediated synthesis of carbon nitride: Band-gap engineering and improved functions for photocatalysis. Energy Environ. Sci. 2011, 4, 675–678. [Google Scholar] [CrossRef]
  17. Wang, Y.; Yang, W.; Zhang, L.; Hu, Y.; Lou, X.W. Formation of MS–Ag and MS (M = Pb, Cd, Zn) nanotubes via microwave-assisted cation exchange and their enhanced photocatalytic activities. Nanoscale 2013, 5, 10864–10867. [Google Scholar] [CrossRef] [PubMed]
  18. Gao, X.; Wu, H.B.; Zheng, L.; Zhong, Y.; Hu, Y.; Lou, X.W. Formation of mesoporous heterostructured BiVO4/Bi2S3 hollow discoids with enhanced photoactivity. Angew. Chem. Int. Ed. 2014, 126, 6027–6031. [Google Scholar] [CrossRef]
  19. Liu, T.; Zhou, L.; Hu, Y.; Guo, C.; Qian, H.; Zhang, F.; Lou, X.W. Magnetic-field induced formation of 1D Fe3O4/C/CdS coaxial nanochains as highly efficient and reusable photocatalysts for water treatment. J. Mater. Chem. 2011, 21, 18359–18364. [Google Scholar] [CrossRef]
  20. Xiang, Q.; Meng, G.F.; Zhao, H.B.; Zhang, Y.; Li, H.; Ma, W.J.; Xu, J.Q. AuNanoparticle modified WO3 nanorods with their enhanced properties for photocatalysis and gas sensing. J. Phys. Chem. C 2010, 114, 2049–2055. [Google Scholar] [CrossRef]
  21. Liu, Z.; Zhao, Z.-G.; Miyauchi, M. Efficient visible light active CaFe2O4/WO3 based composite photocatalysts: Effect of interfacial modification. J. Phys. Chem. C 2009, 113, 17132–17137. [Google Scholar] [CrossRef]
  22. Arai, T.; Yanagida, M.; Konishi, Y.; Iwasaki, Y.; Sugihara, H.; Sayama, K. Efficient complete oxidation of acetaldehyde into CO2 over CuBi2O4/WO3 composite photocatalyst under visible and UV light irradiation. J. Phys. Chem. C 2007, 111, 7574–7577. [Google Scholar] [CrossRef]
  23. Arai, T.; Horiguchi, M.; Yanagida, M.; Gunji, T.; Sugihara, H.; Sayama, K. Reaction mechanism and activity of WO3-catalyzed photodegradation of organic substances promoted by a CuO cocatalyst. J. Phys. Chem. C 2009, 113, 6602–6609. [Google Scholar] [CrossRef]
  24. Tada, H.; Kokubu, A.; Iwasaki, M.; Ito, S. Deactivation of the TiO2 photocatalyst by coupling with WO3 and the electrochemically assisted high photocatalytic activity of WO3. Langmuir 2004, 20, 4665–4670. [Google Scholar] [CrossRef] [PubMed]
  25. Tatsuma, T.; Saitoh, S.; Ngaotrakanwiwat, P.; Ohko, Y.; Fujishima, A. Energy storage of TiO2−WO3 photocatalysis systems in the gas phase. Langmuir 2002, 18, 7777–7779. [Google Scholar] [CrossRef]
  26. Guo, J.; Li, Y.; Zhu, S.; Chen, Z.; Liu, Q.; Zhang, D.; Moon, W.-J.; Song, D.-M. Synthesis of WO3 @ Graphene composite for enhanced photocatalytic oxygen evolution from water. RSC Adv. 2012, 2, 1356–1363. [Google Scholar] [CrossRef]
  27. Cao, J.; Luo, B.; Lin, H.; Xu, B.; Chen, S. Thermodecomposition synthesis of WO3/H2WO4 heterostructures with enhanced visible light photocatalytic properties. Appl. Catal. B 2012, 111, 288–296. [Google Scholar] [CrossRef]
  28. Fu, N.; Jin, Z.; Wu, Y.; Lu, G.; Li, D. Z-scheme photocatalytic system utilizing separate reaction centers by directional movement of electrons. J. Phys. Chem. C 2011, 115, 8586–8593. [Google Scholar] [CrossRef]
  29. Iwase, A.; Ng, Y.H.; Ishiguro, Y.; Kudo, A.; Amal, R. Reduced graphene oxide as a solid-state electron mediator in Z-scheme photocatalytic water splitting under visible light. J. Am. Chem. Soc. 2011, 133, 11054–11057. [Google Scholar] [CrossRef] [PubMed]
  30. Maeda, K.; Abe, R.; Domen, K. Role and function of ruthenium species as promoters with TaON-based photocatalysts for oxygen evolution in two-step water splitting under visible light. J. Phys. Chem. C 2011, 115, 3057–3064. [Google Scholar] [CrossRef]
  31. Sato, S.; Arai, T.; Morikawa, T.; Uemura, K.; Suzuki, T.M.; Tanaka, H.; Kajino, T. Selective CO2 conversion to formate conjugated with H2O oxidation utilizing semiconductor/complex hybrid photocatalysts. J. Am. Chem. Soc. 2011, 133, 15240–15243. [Google Scholar] [CrossRef] [PubMed]
  32. Xiao, F.X.; Hung, S.F.; Miao, J.; Wang, H.Y.; Yang, H.; Liu, B. Metal-Cluster-Decorated TiO2 nanotube arrays: A composite heterostructure toward versatile photocatalytic and photoelectrochemical applications. Small 2015, 11, 554–567. [Google Scholar] [CrossRef] [PubMed]
  33. Boppella, R.; Kochuveedu, S.T.; Kim, H.; Jeong, M.J.; Mota, F.M.; Park, J.H.; Kim, D.H. Plasmon-sensitized graphene/TiO2 inverse opal nanostructures with enhanced charge collection efficiency for water splitting. ACS Appl. Mater. Inter. 2017, 9, 7075–7083. [Google Scholar] [CrossRef]
  34. Lian, Z.; Xu, P.; Wang, W.; Zhang, D.; Xiao, S.; Li, X.; Li, G. C60-Decorated CdS/TiO2 Mesoporous Architectures with Enhanced Photostability and Photocatalytic Activity for H2 Evolution. ACS Appl. Mater. Interfaces 2015, 7, 4533−4540. [Google Scholar] [CrossRef]
  35. Zhang, Y.; Zhang, N.; Tang, Z.-R.; Xu, Y.-J. Transforming CdS into an efficient visible light photocatalyst for selective oxidation of saturated primary C–H bonds under ambient conditions. Chem. Sci. 2012, 3, 2812–2822. [Google Scholar] [CrossRef]
  36. Sakthivel, S.; Kisch, H. Daylight photocatalysis by carbon-modified titanium dioxide. Angew. Chem. Int. Ed. 2003, 42, 4908–4911. [Google Scholar] [CrossRef]
  37. Xiao, X.; Jiang, J.; Zhang, L. Selective oxidation of benzyl alcohol into benzaldehyde over semiconductors under visible light: The case of Bi12O17Cl2 nanobelts. Appl. Catal. B Environ. 2013, 142, 487–493. [Google Scholar] [CrossRef]
  38. Chen, C.; Lei, P.; Ji, H.; Ma, W.; Zhao, J.; Hidaka, H.; Serpone, N. Photocatalysis by titanium dioxide and polyoxometalate/TiO2 cocatalysts. Intermediates and mechanistic study. Environ. Sci. Technol. 2004, 38, 329–337. [Google Scholar] [PubMed]
  39. Ye, L.; Liu, J.; Jiang, Z.; Peng, T.; Zan, L. Facets coupling of BiOBr-gC3N4 composite photocatalyst for enhanced visible-light-driven photocatalytic activity. Appl. Catal. B Environ. 2023, 142, 1–7. [Google Scholar]
  40. Bielski, B.H.J.; Richter, H.W. A study of the superoxide radical chemistry by stopped-flow radiolysis and radiation induced oxygen consumption. J. Am. Chem. Soc. 1977, 99, 3019–3023. [Google Scholar] [CrossRef]
  41. Ishibashi, K.; Fujishima, A.; Watanabe, T.; Hashimoto, K. Quantum yields of active oxidative species formed on TiO2 photocatalyst. J. Photochem. Photobiol. A Chem. 2000, 134, 139–142. [Google Scholar] [CrossRef]
  42. Chai, B.; Peng, T.; Mao, J.; Li, K.; Zan, L. Graphitic carbon nitride (g-C3N4)–Pt-TiO2 nanocomposite as an efficient photocatalyst for hydrogen production under visible light irradiation. Phys. Chem. Chem. Phys. 2012, 14, 16745–16752. [Google Scholar] [CrossRef] [PubMed]
  43. Fu, J.; Tian, Y.; Chang, B.; Xi, F.; Dong, X. BiOBr–carbon nitride heterojunctions: Synthesis enhanced activity and photocatalytic mechanism. J. Mater. Chem. 2012, 22, 21159–21166. [Google Scholar] [CrossRef]
  44. Cao, S.-W.; Yuan, Y.-P.; Fang, J.; Shahjamali, M.M.; Boey, F.Y.C.; Barber, J.; Loo, S.C.J.; Xue, C. In-situ growth of CdS quantum dots on g-C3N4 nanosheets for highly efficient photocatalytic hydrogen generation under visible light irradiation. Int. J. Hydrogen Energy 2013, 38, 1258–1266. [Google Scholar] [CrossRef]
  45. Pan, J.H.; Lee, W.I. Preparation of highly ordered cubic mesoporous WO3/TiO2 films and their photocatalytic properties. Chem. Mater. 2006, 18, 847–853. [Google Scholar] [CrossRef]
  46. Srinivasan, A.; Miyauchi, M. Chemically stable WO3 based thin-film for visible-light induced oxidation and superhydrophilicity. J. Phys. Chem. C 2012, 116, 15421–15426. [Google Scholar] [CrossRef]
  47. Su, J.; Guo, L.; Bao, N.; Grimes, C.A. Nanostructured WO3/BiVO4 heterojunction films for efficient photoelectrochemical water splitting. Nano Lett. 2011, 11, 1928–1933. [Google Scholar] [CrossRef] [PubMed]
  48. Guo, J.G.; Liu, Y.; Hao, Y.J.; Li, Y.L.; Wang, X.J.; Liu, R.H.; Li, F.T. Comparison of importance between separation efficiency and valence bandposition: The case of heterostructured Bi3O4Br/α-Bi2O3 photocatalysts. Appl. Catal. B Environ. 2018, 224, 841–853. [Google Scholar] [CrossRef]
  49. Kong, D.S. The influence of fluoride on the physicochemical properties of anodic oxidefilms formed on titanium surfaces. Langmuir 2008, 24, 5324–5331. [Google Scholar] [CrossRef] [PubMed]
  50. Sun, W.; Meng, S.; Zhang, S.; Zheng, X.; Ye, X.; Fu, X.; Chen, S. Insight into the transfer mechanisms of photogenerated carriers for heterojunction photocatalysts with the analogous positions of valence band and conduction band: A case study of ZnO/TiO2. J. Phys. Chem. C 2018, 122, 15409–15420. [Google Scholar] [CrossRef]
  51. Meng, S.; Sun, W.; Zhang, S.; Zheng, X.; Fu, X.; Chen, S. Insight into the transfer mechanism of photogenerated carriers for WO3/TiO2 heterojunction photocatalysts: Is it the transfer of band–band or Z-Scheme? Why? J. Phys. Chem. C 2018, 122, 26326–26336. [Google Scholar] [CrossRef]
  52. Qin, N.; Liu, Y.; Wu, W.; Shen, L.; Chen, X.; Li, Z.; Wu, L. One-Dimensional CdS/TiO2 nanofiber composites as efficient visible-light-driven photocatalysts for selective organic transformation: Synthesis, characterization, and performance. Langmuir 2015, 31, 1203–1209. [Google Scholar] [CrossRef] [PubMed]
  53. Liu, Z.; Bai, H.; Sun, D. Facile fabrication of hierarchical porous TiO2 hollow microspheres with high photocatalytic activity for water purification. Appl. Catal. B Environ. 2011, 104, 234−238. [Google Scholar] [CrossRef]
  54. Haider, Z.; Ju, H. Strategies to Boost Photocatalytic degradation of emerging contaminants using ZnO heterostructure photocatalyst. Science 2026, 16, 5279. [Google Scholar] [CrossRef]
  55. Haider, Z.; Archana, R.; Ju, H. Recent Advancements in photocatalytic synthesis of five membered nitrogen heterocycles and their derivatives. Molecules 2025, 30, 3490. [Google Scholar] [CrossRef] [PubMed]
Figure 1. (a) XRD patterns of TiO2 and CdS (wt.%)/TiO2 photocatalysts; (b) XRD patterns of CdS and CdS (wt.%)/TiO2 photocatalysts.
Catalysts 16 00625 g001
Figure 2. (a) TiO2, CdS (wt.%)/TiO2 and CdS solid ultraviolet absorption spectrum; (b) TiO2, CdS (wt.%)/TiO2 and CdS ultraviolet visible absorption spectrum; (c) TiO2 and CdS Graph of the forbidden band width.
Catalysts 16 00625 g002aCatalysts 16 00625 g002b
Figure 3. SEM images of (a) TiO2, (b) 70% CdS/TiO2, (c) 90% CdS/TiO2, (d) CdS; EDX spectra of (e) 70% CdS/TiO2 and (f) 90% CdS/TiO2.
Catalysts 16 00625 g003
Figure 4. XPS spectra of (a) TiO2, 90% CdS/TiO2, and CdS samples, (b) Cd 3d, (c) S 3p, (d) Ti 2p, (e) O 1s.
Catalysts 16 00625 g004
Figure 5. DMPO–•O2 (a) and DMPO–•OH (b) ESR signals.
Catalysts 16 00625 g005
Figure 6. UV–vis absorbance spectra of NBT solution upon UV light irradiation for different photocatalytic samples. (a) TiO2 and CdS/TiO2 composites with TiO2 as the main component; (b) CdS and CdS/TiO2 composites with CdS as the main component.
Catalysts 16 00625 g006
Figure 7. Photoluminescence (PL) emission spectra of TA-•OH adducts formed in TA solution upon UV light irradiation for different photocatalytic samples. (a) TiO2 and CdS/TiO2 composites with TiO2 as the main component; (b) CdS and CdS/TiO2 composites with CdS as the main component.
Catalysts 16 00625 g007
Figure 8. Radical-trapping experiments for the degradation of organic pollutants over (a) pure TiO2, (b) 1% CdS/TiO2, (c) 70% CdS/TiO2, (d) 95% CdS/TiO2 and (e) CdS under UV-light irradiation in the presence of various scavengers.
Catalysts 16 00625 g008
Figure 9. Transient photocurrent responses of the samples under UV-light irradiation: (a) TiO2 and CdS/TiO2 composites with TiO2 as the main component (0–30% CdS); (b) CdS and CdS/TiO2 composites with CdS as the main component (50–99% CdS).
Catalysts 16 00625 g009
Figure 10. Nyquist plots of the samples: (a) TiO2 and CdS/TiO2 composites with TiO2 as the main component; (b) CdS and CdS/TiO2 composites with CdS as the main component.
Catalysts 16 00625 g010aCatalysts 16 00625 g010b
Figure 11. Photoluminescence (PL) spectra (λex = 300 nm): (a) TiO2 and CdS/TiO2 composites with TiO2 as the main component; (b) CdS and CdS/TiO2 composites with CdS as the main component.
Catalysts 16 00625 g011
Figure 12. Time-resolved fluorescence decay spectra of TiO2, 70% CdS/TiO2, and CdS.
Catalysts 16 00625 g012
Figure 13. Mott−Schottky plots of the samples: (a) TiO2 and CdS/TiO2 composites with TiO2 as the main component; (b) CdS and CdS/TiO2 composites with CdS as the main component.
Catalysts 16 00625 g013
Figure 14. (a) Light absorption and generation of electron−hole pairs in both CdS and TiO2. (b) Charge-carrier transfer pathways–illustrating either the type-II band-to-band transfer (when TiO2 is dominant) or the Z-scheme transfer (when CdS is dominant), depending on the composition. (c) Surface redox reactions–showing the reduction of O2 to •O2 on the conduction band and the oxidation of H2O/OH to •OH on the valence band, along with the subsequent degradation of organic pollutants.
Catalysts 16 00625 g014
Figure 15. Evaluation of photocatalytic performance: (a) MO (b) RhB and (c) BPA.
Catalysts 16 00625 g015
Table 1. The linear of the M-S plots of the samples.
SampleSlopeNdUFL
TiO22.11 × 1091.15 × 1019−0.45
1% CdS/TiO26.54 × 1093.71 × 1018−0.42
3% CdS/TiO23.98 × 1096.10 × 1019−0.48
5% CdS/TiO27.38 × 1093.29 × 1019−0.50
10%CdS/TiO21.01 × 1092.40 × 1019−0.52
15% CdS/TiO21.18 × 1092.06 × 1019−0.53
30% CdS/TiO21.53 × 1091.59 × 1019−0.55
50% CdS/TiO21.25 × 1091.94 × 1019−0.56
70% CdS/TiO21.01 × 1092.40 × 1019−0.58
90% CdS/TiO21.35 × 1091.20 × 1020−0.62
95% CdS/TiO22.50 × 1096.49 × 1019−0.60
97%CdS/TiO23.06 × 1095.30 × 1019−0.58
99% CdS/TiO23.30 × 1094.92 × 1019−0.55
CdS3.20 × 1095.07 × 1019−0.50
Disclaimer/Publisher’s Note: The statements, opinions and data contained in all publications are solely those of the individual author(s) and contributor(s) and not of MDPI and/or the editor(s). MDPI and/or the editor(s) disclaim responsibility for any injury to people or property resulting from any ideas, methods, instructions or products referred to in the content.