


Abstract
Pure Bi2O3 is a favorable photocatalyst for visible-light-driven processes; however, the rapid recombination of photogenerated charge carriers limits its practical performance. In this work, Co-doped Bi2O3 nanoparticles, CoxBi2−xO3 (x = 0–0.1), were produced through a sol–gel combustion route to enhance their visible-light photocatalytic activity. As demonstrated by XRD analysis, Co was successfully incorporated into the Bi2O3 lattice, along with changes to the crystal structure, crystallite size (up to ~88 nm), and lattice strain. Optical measurements revealed that Co-doping induces a clear absorption edge’s red shift, resulting in a systematic reduction of the optical band gap from 3.9 eV for pure Bi2O3 to approximately 3.1 eV for the doped samples. This band gap narrowing enhances visible-light absorption and improves photocatalytic efficiency. Photocatalytic activity was assessed by measuring the degradation of MB under visible-light irradiation. Incorporation of Co consistently enhanced the performance across all doped samples compared to the pristine oxide counterpart. The Co0.1Bi1.9O3 composition demonstrated the best performance, achieving a removal efficiency of 94.5% within 120 min, compared with 73.0% for pure Bi2O3. Kinetic analysis indicated pseudo-first-order behavior, with the optimal sample showing a rate constant of 0.0240 min−1—more than twice that of the undoped material (0.0105 min−1). These results validate that Co-doping is an actual approach for engineering the electronic structure of Bi2O3, leading to enhanced visible-light absorption, improved charge-carrier separation, and significantly higher photocatalytic efficiency for environmental remediation applications.
1. Introduction
Photocatalysis has become one of the most essential methods of degrading persistent organic pollutants, for instance: dyes, pesticides, and antibiotics, through the use of semiconductor-based nanomaterials under exposure to light to form electron-hole pairs that react in redox reactions in aqueous solutions [1,2,3]. This methodology presents a highly sustainable framework for advanced wastewater purification and ecological safeguarding, owing to its capacity for non-specific mineralization, mild operating parameters, and minimal energy requirements [4,5]. Nevertheless, the conventional photocatalysts (such as TiO2) tend to be active only at UV light, and this aspect restricts the possibility of their use in solar-driven pollutant degradation [4,6]. Bismuth-based materials, especially bismuth oxide (Bi2O3), have been under great interest as visible-light-driven photocatalysts because they have appropriate band gaps (2.829 eV), high photoluminescence, refractive index, chemical stability, and non-toxicity [4,6,7]. These characteristics allow Bi2O3 to capture a broader range of sunlight than TiO2 and thus can be a promising application in the degradation of organic pollutants in the visible light [8,9]. Bismuth-based oxides have emerged as highly versatile materials with widespread utility across multiple technological domains, most notably in gas sensors, solid oxide fuel cells (SOFCs), optical coatings, and photocatalytic systems [10,11].
Although they possess benefits, pure bismuth oxide photocatalysts have some weaknesses that include low carrier mobility, low specific surface area, and recombination of electron-hole pairs, among others, limiting their photocatalytic efficiency [12,13,14]. The poor charge carrier separation and low conduction band also limit their usage in the context of environmental remediation [15,16]. Such constraints will require the creation of mechanisms to improve the response rate and charge separation in Bi2O3-based photocatalysts [17].
To alleviate these obstacles, different approaches of modification have been discussed, such as:
- -
- Metal and Nonmetal Element Doping: Metallization or Nonmetallization of Bi2O3 can be used to accurately tune its band gap and electronic structure, which enhances visible-light absorption and charge separation [18].
- -
- Co-doping Approaches: Co-doping was observed to be a promising route to additional improvement of the photocatalytic activity through synergistic alteration of the electronic properties and decrease in the recombination rates. Cobalt was selected as the dopant for several reasons: (i) the ionic radius of Co2+ (0.74 Å) is comparable to that of Bi3+ (1.03 Å), facilitating lattice incorporation; (ii) Co has multiple oxidation states (Co2+/Co3+), which can introduce intermediate energy levels within the Bi2O3 band gap; (iii) Co-doping has been shown to enhance visible-light absorption in other semiconductor oxides; and (iv) previous studies, such as the work by [19] have demonstrated the potential of Co-doped Bi2O3 for visible-light photocatalysis, though systematic optimization of doping concentration and detailed mechanistic studies remain limited.
- -
- Construction into Heterojunctions: Charge transfer to other semiconductors or metals can be enhanced with a heterojunction, preventing electron-hole recombination, and increasing the degradation of persistent pollutants [20].
- -
- Morphology and Surface Engineering: The morphology, crystal size, and surface defects are controllable to enhance the specific surface area and active sites to increase photocatalytic efficiency further.
Overall, the proposed approach of metal-nonmetal co-doping of bismuth oxide is viewed as a promising avenue to unlock and improve its visible-light photocatalytic activity to degrade the key pollutant, to address the main limitations of pure Bi2O3, and to develop the framework of sustainable environmental remediation.
2. Results and Discussion
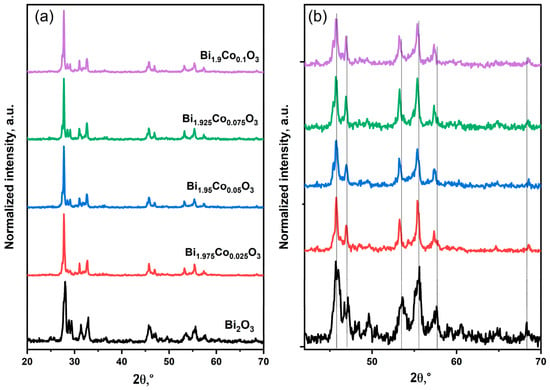
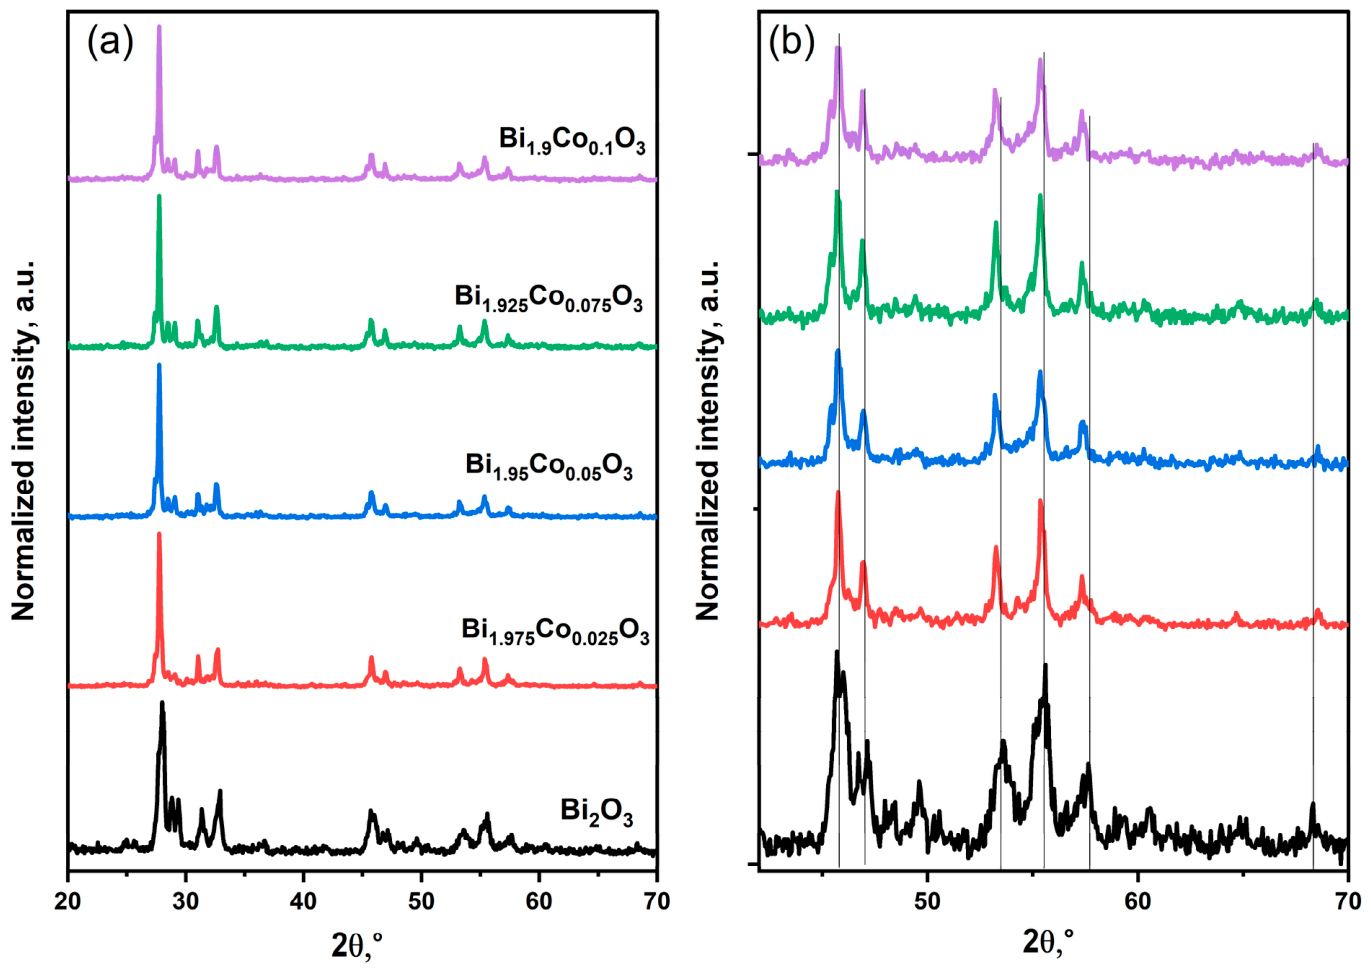
Figure 1a,b exhibits the XRD patterns of pure Bi2O3 and Co-doped Bi2O3 samples (CoxBi2−xO3) with different cobalt molar ratios (x = 0.025, 0.05, 0.075, and 0.1). The diffraction patterns exhibit characteristic peaks corresponding to the crystalline Bi2O3 phase. There are two noticeable diffraction peaks at around 2θ ≈ 27° and 31°, which are typical reflections of Bi2O3. With increasing Co concentration, slight variations in peak positions and intensities can be observed. These changes indicate that cobalt ions are successfully incorporated into the Bi2O3 lattice, resulting in alterations to the crystal structure and lattice parameters. To accurately assess the effect of Co incorporation on the Bi2O3 lattice, peak shifts were analyzed at higher diffraction angles (2θ ≈ 46°, 55°, and 68°), which provide more reliable information about lattice parameter changes. A slight shift toward higher 2θ values was observed with increasing Co concentration, indicating a reduction in lattice parameters consistent with the substitution of smaller Co2+/Co3+ ions (ionic radii 0.74–0.61 Å) for larger Bi3+ ions (1.03 Å). The samples with x = 0.025 and 0.1 exhibited sharper and more intense diffraction peaks compared to intermediate compositions (x = 0.05 and 0.075). This behavior can be attributed to: (i) at low doping levels (x = 0.025), Co ions preferentially occupy substitutional sites, relieving internal strain and promoting crystal growth; (ii) at x = 0.1, the dopant concentration reaches a threshold where Co ions facilitate nucleation and growth of more crystalline domains; (iii) intermediate concentrations (x = 0.05, 0.075) may induce local lattice distortions and defect formation that temporarily hinder crystallite growth. The crystallite size and lattice strain were estimated from the XRD peak broadening using the Williamson–Hall (W–H) method according to Figure S5, which separates the contributions of crystallite size and lattice strain to the peak broadening.
Figure 1.
(a) XRD patterns, and (b) the peaks shift of undoped and Co-doped Bi2O3 (Bi2−xCoxO3) samples with various molar ratios of Co (x = 0, →0.1).
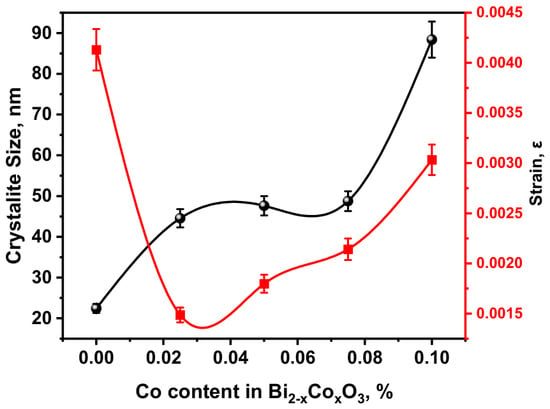
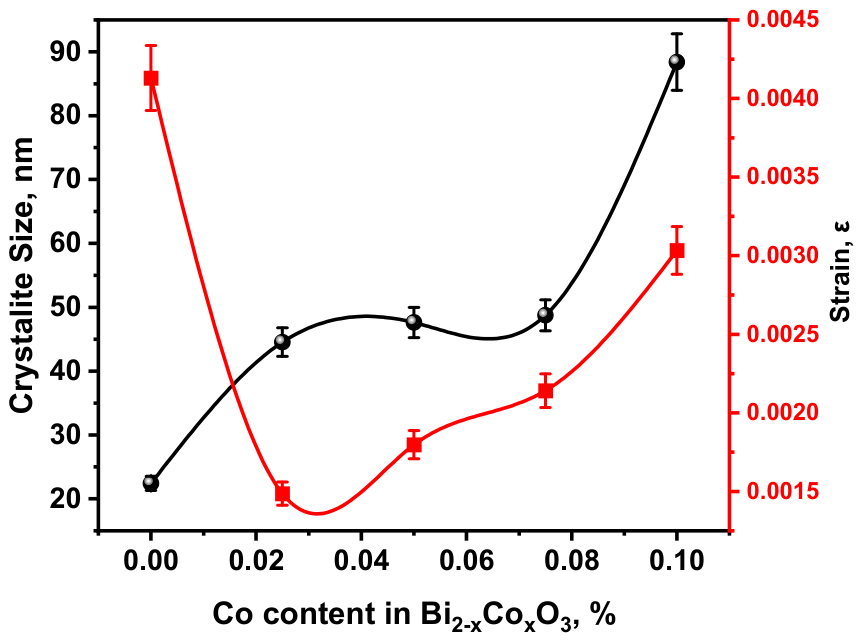
Figure 2 illustrates the relationship between crystallite size and lattice strain for the Co-doped Bi2O3 samples. At lower doping concentrations, a negative correlation is observed between crystallite size and lattice strain, where the strain decreases as the crystallite size increases. This behavior suggests that the incorporation of small amounts of cobalt into the Bi2O3 lattice helps relieve internal lattice distortions. The initial reduction in lattice strain indicates that Co substitution (or possible interstitial incorporation) partially relaxes internal stresses within the Bi2O3 lattice. As a result, crystal growth becomes more favorable, leading to an increase in crystallite size due to the reduction of structural defects that normally hinder grain growth. At higher cobalt concentrations, however, a positive correlation between crystallite size and lattice strain is observed. In this case, both parameters increase simultaneously, which may be attributed to lattice distortion induced by excessive Co incorporation. This behavior suggests that higher dopant levels introduce additional structural disorder, which contributes to increased microstrain within the crystal lattice.
Figure 2.
Crystallite size and lattice strain of Bi2−xCoxO3 (x = 0, 0.025, 0.05, 0.075, and 0.1) obtained from XRD analysis using the Williamson–Hall method.
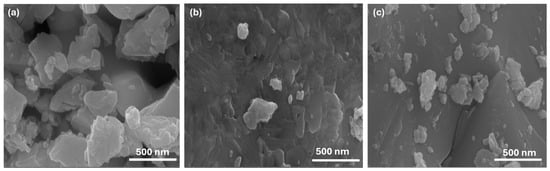
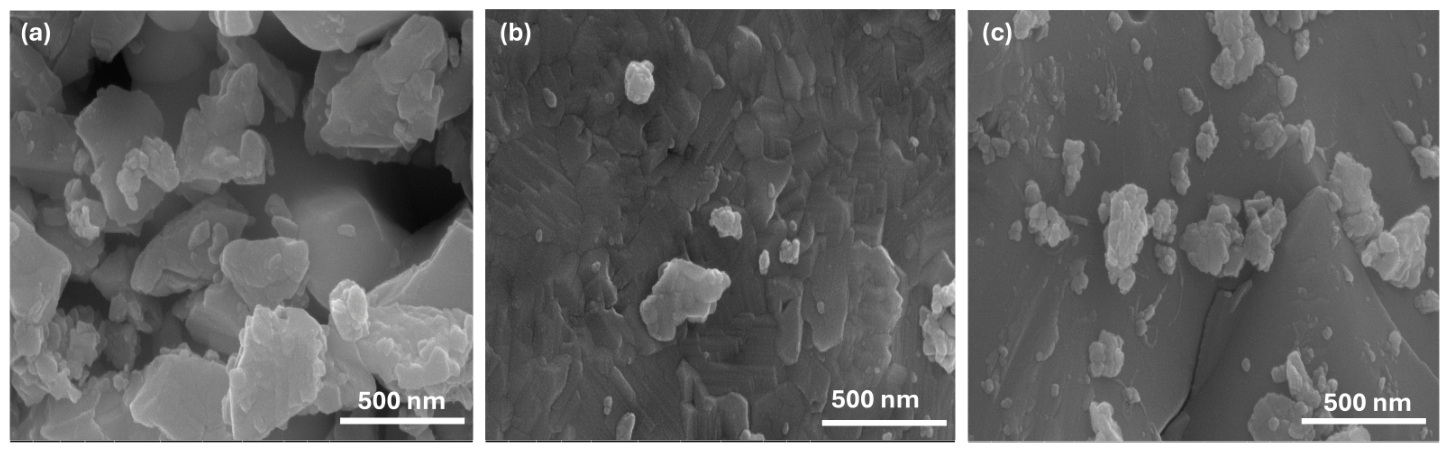
Figure 3 presents the SEM images of the synthesized samples. Figure 3a demonstrates the morphology of pure Bi2O3. The undoped sample consists of irregular, aggregated particles with non-uniform shapes and a wide particle size distribution. The surface appears relatively rough, and the particles are densely clustered, indicating significant agglomeration during the synthesis process. Figure 3b displays the morphology of the Co0.025Bi1.975O3 sample. With low-level cobalt doping, the particle morphology evolves toward more defined granular structures. The aggregates appear less dense, and the particles are relatively more separated compared with the undoped sample. This observation suggests that a small amount of Co influences the nucleation and growth processes during synthesis, resulting in improved particle dispersion. Figure 3c displays the SEM image of Co0.1Bi1.9O3 with a higher cobalt concentration. At this doping level, the particles exhibit further morphological evolution, forming a more consolidated and uniform granular structure. The aggregates become more compact, and individual particles are less distinguishable. This behavior may be attributed to increased crystallite growth or modified growth kinetics resulting from higher Co incorporation into the Bi2O3 lattice.
Figure 3.
SEM images displaying the surface characteristics of (a) undoped Bi2O3, (b) Co0.025Bi1.975O3, and (c) Co0.1Bi1.9O3 samples.
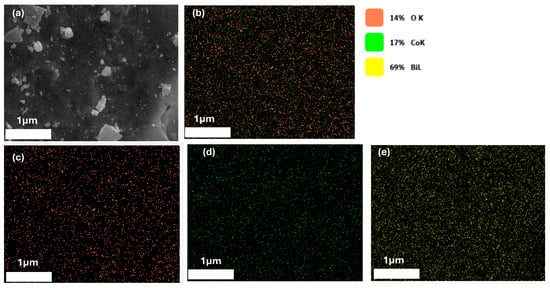
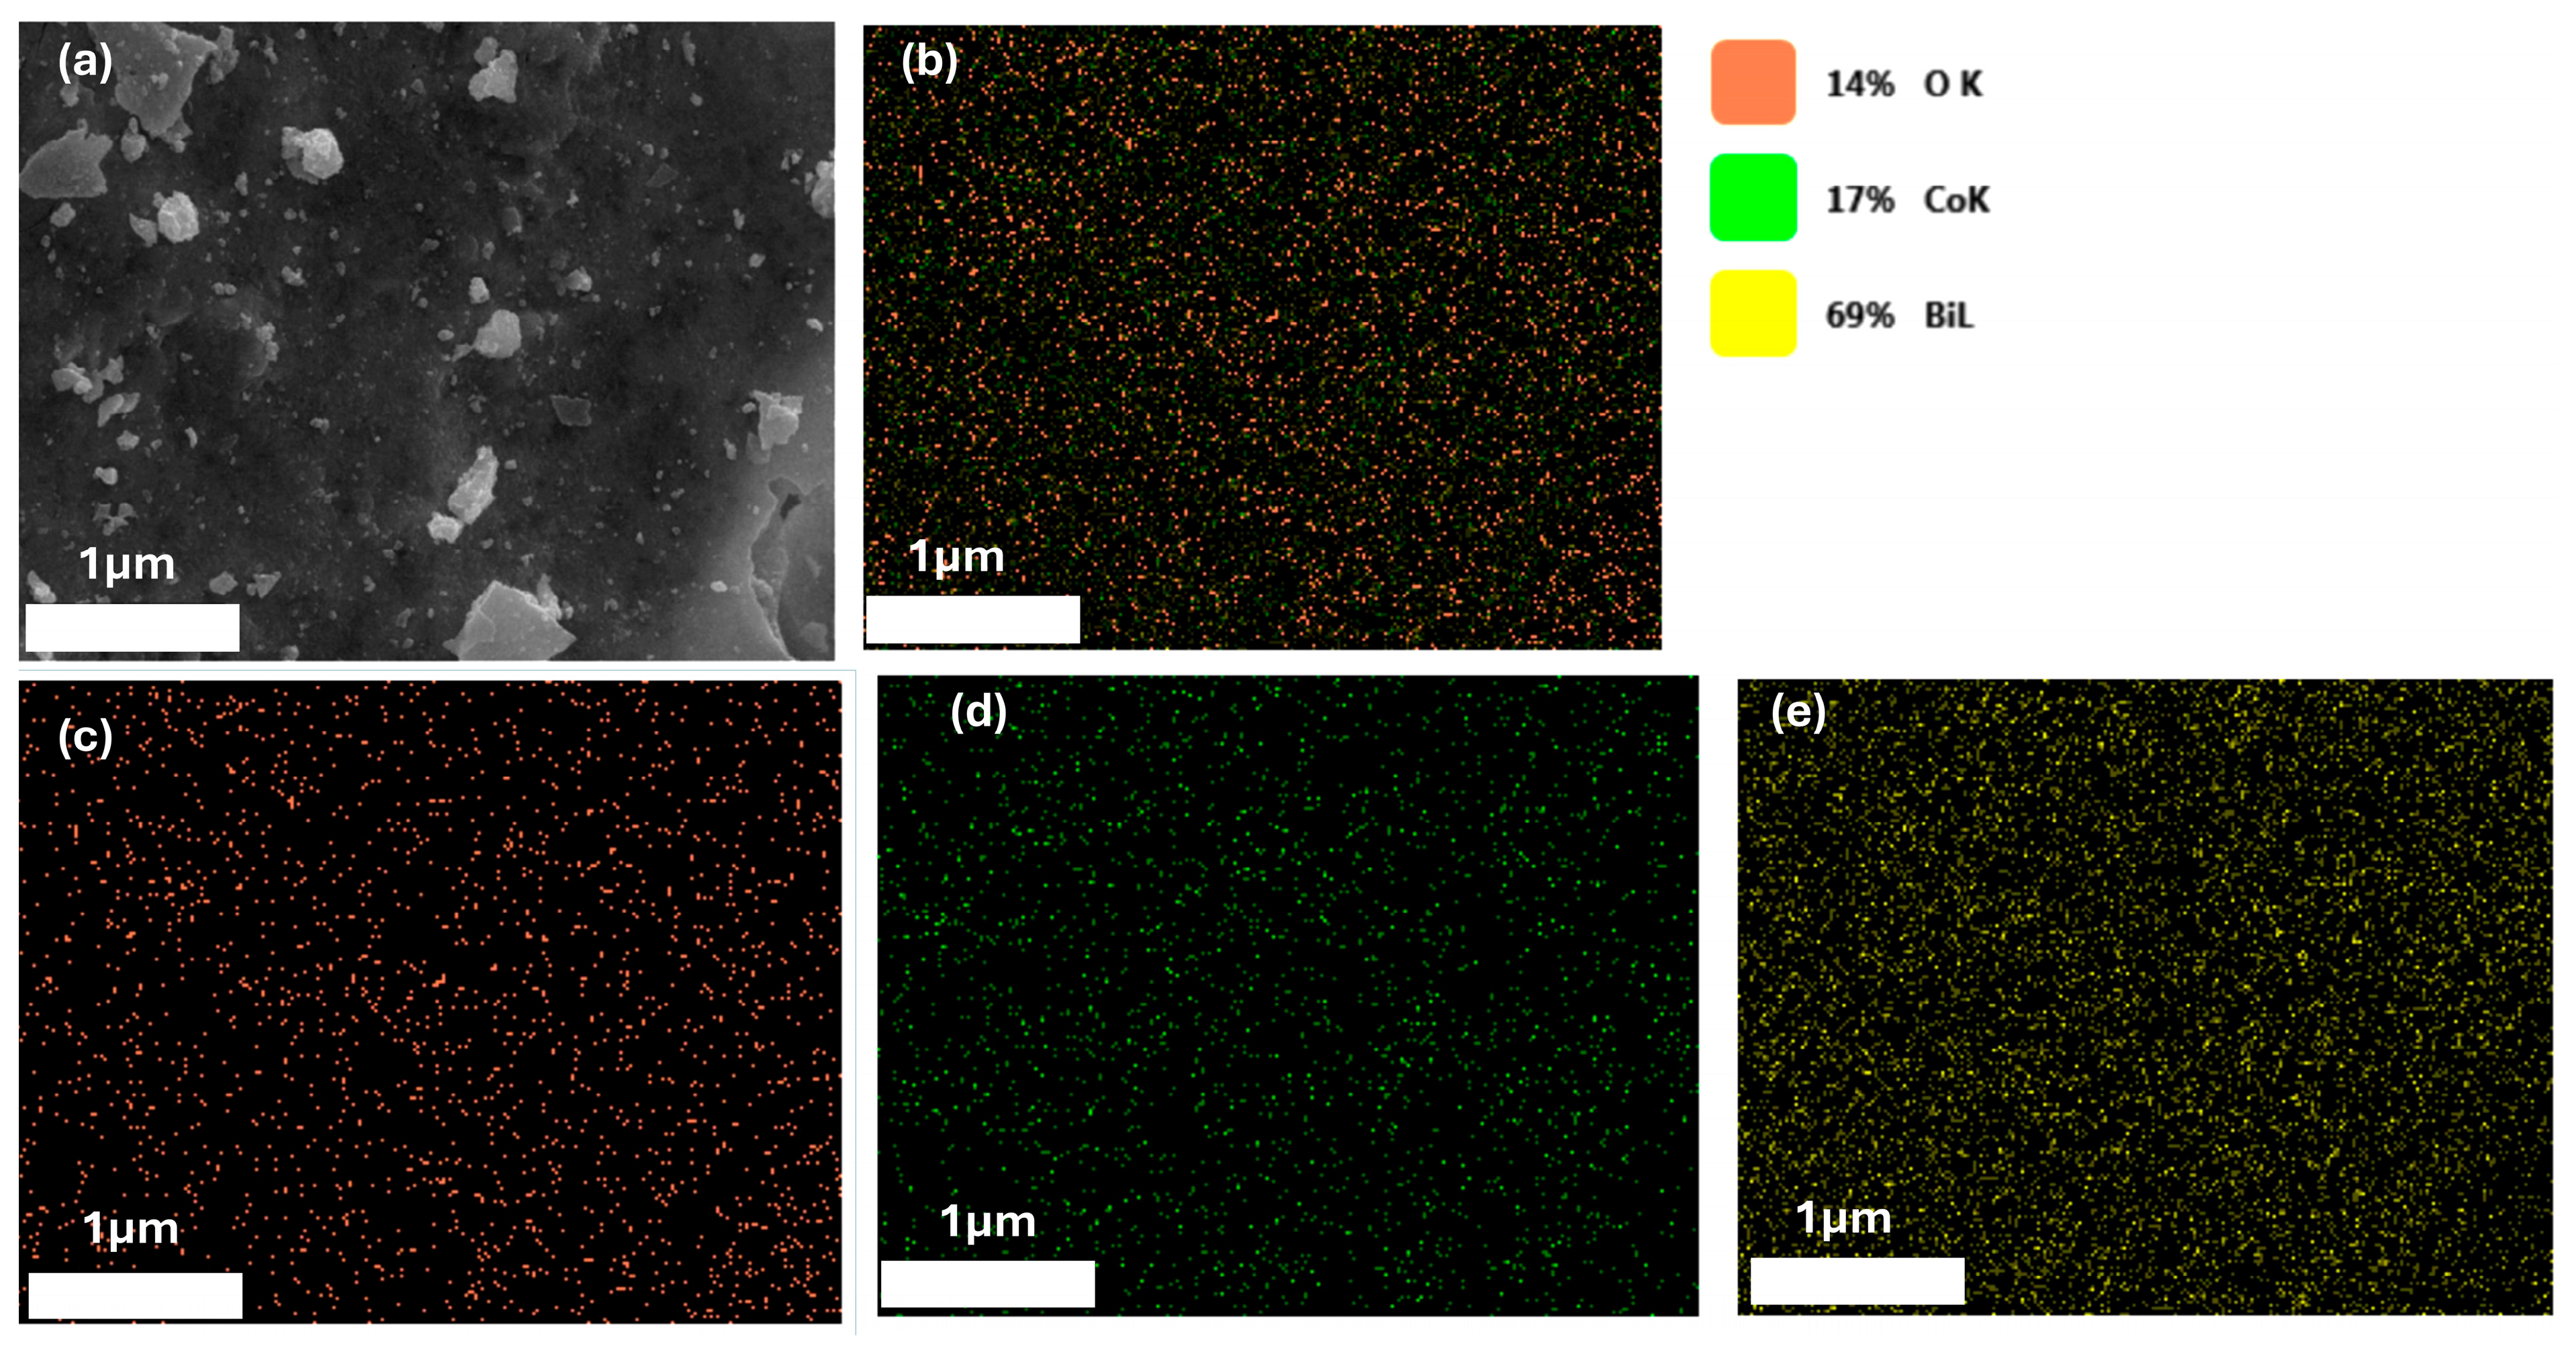
Figure 4 displays the elemental distribution maps for the analyzed samples. In the Bi1.9Co0.1O3 sample, Cobalt (Co), Bismuth (Bi), and the overall constituent elements showed a homogeneous distribution. However, the oxygen distribution was notably heterogeneous, with distinct oxygen-deficient regions appearing at the grain boundaries.
Figure 4.
(a) FE-SEM image of Bi1.9Co0.1O3, (b) EDS spectrum, and elemental mapping showing the spatial distribution of (c) oxygen (O), (d) cobalt (Co), and (e) bismuth (Bi) in the Bi1.9Co0.1O3 sample.
This figure presents EDX elemental maps for Figure 5a pure Bi2O3, Figure 5b Co0.025Bi1.975O3, and Figure 5c Co0.1Bi1.9O3. Each panel displays spatially resolved distribution maps of bismuth (Bi), oxygen (O), and—where applicable—cobalt (Co). The color intensity scale (0.00% to 6.4%) indicates the relative abundance of each element at each pixel location. Pure Bi2O3 proves an identical and homogeneous distribution of bismuth (Bi) and oxygen (O) across the scanned area. No cobalt signal is present, confirming the absence of Co in the undoped sample. The consistent color intensity suggests a well-mixed, single-phase material with no significant phase segregation. Co0.025Bi1.975O3 shows that Bismuth and oxygen remain uniformly distributed, similar to the pure sample. Cobalt (Co) appears as localized, low-intensity signals (bright spots), indicating that at this low doping level (x = 0.025), Co is incorporated but not fully homogeneous. Some clustering or surface segregation of Co may be present. Co0.1Bi1.9O3 exhibited a Bismuth distribution that remains homogeneous. The oxygen map shows slight heterogeneity, with some regions exhibiting lower oxygen intensity (darker areas), which may suggest the formation of oxygen-deficient regions or vacancies at higher Co-doping. Cobalt signals are stronger and more widespread than in (b), confirming increased Co content. However, the Co map still shows some clustering, indicating that complete atomic-level dispersion is not achieved even at x = 0.1.
Figure 5.
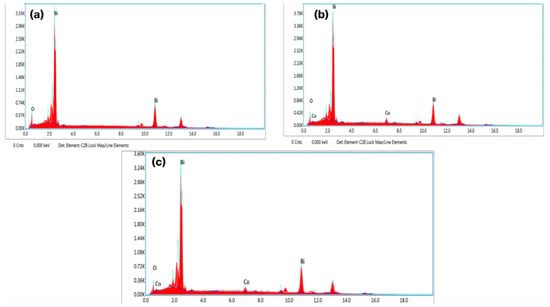
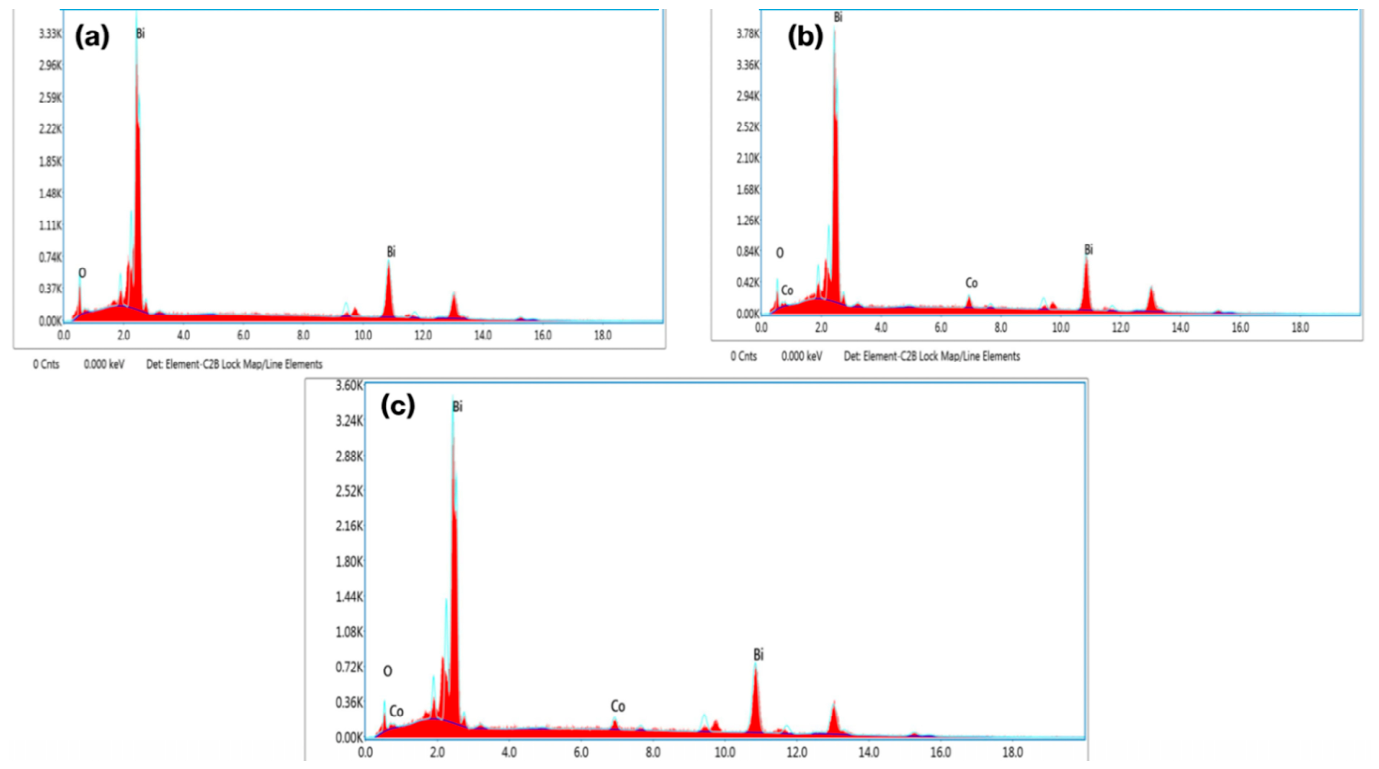
EDS spectra confirming the elemental composition of (a) Bi2O3, (b) Co0.025Bi1.975O3, and (c) Co0.1Bi1.9O3 samples.
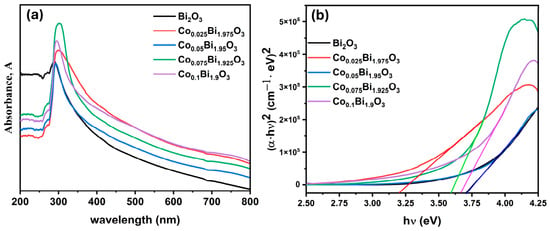
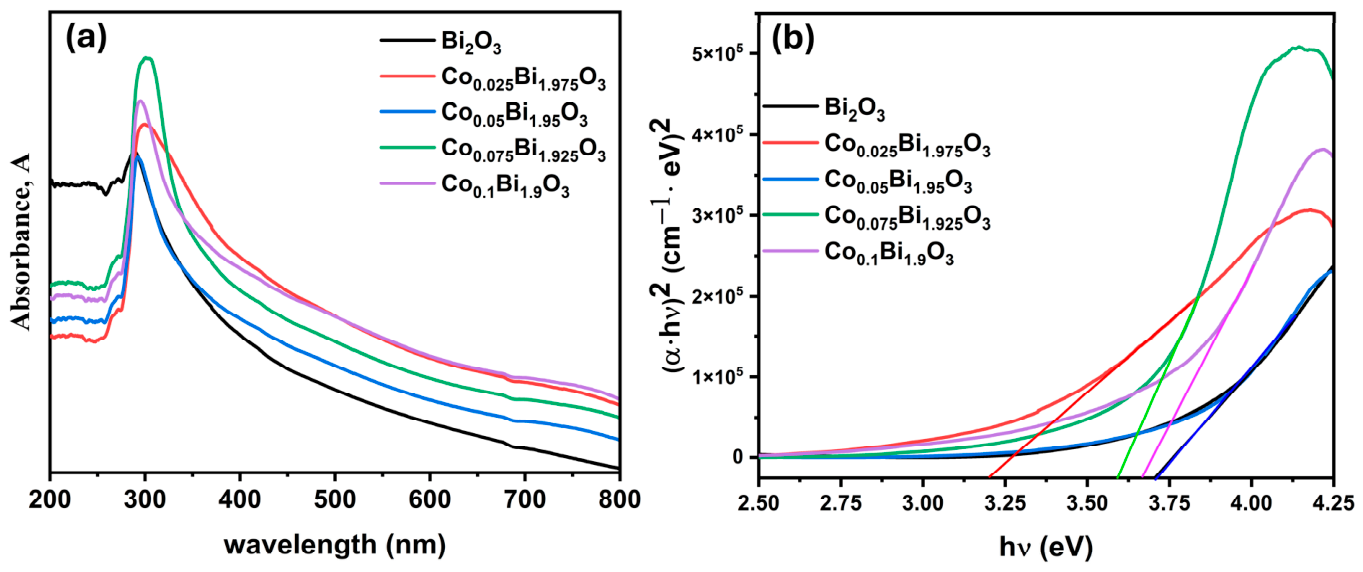
In Figure 6a, the UV-Vis absorption spectra of pure Bi2O3 and Co-doped Bi2O3 samples (CoxBi2−xO3, where x = 0.025, 0.05, 0.075, and 0.1) as a function of wavelength are shown. All samples exhibit a strong ultraviolet absorption edge, characteristic of semiconductor materials. The undoped Bi2O3 sample shows a relatively sharp absorption onset at approximately 350–400 nm. Upon cobalt doping, the absorption edge shifts toward longer wavelengths (red shift), indicating a reduction in the optical band gap (Eg). In addition, the overall absorbance in the visible region (400–800 nm) increases for the Co-doped samples compared with pure Bi2O3, suggesting enhanced visible-light absorption. This improvement is attributed to modifications in the electronic structure of Bi2O3 induced by the incorporation of Co ions. Among the prepared samples, the Co0.1Bi1.9O3 sample exhibits the highest value of absorption intensity in the visible region, consistent with the observed red shift of the absorption edge.
Figure 6.
(a) UV-Vis absorption spectra of Bi2−xCoxO3 samples, and (b) Tauc plots of pure Bi2O3 and Co-doped Bi2O3 with different cobalt concentrations.
Figure 6b presents the Tauc plots obtained from the UV-Vis absorption data, where (α·hυ)2 is plotted as a function of photon energy (hν). The optical band gap of direct band gap semiconductors is frequently found using this model. The optical band gap (Eg) was estimated by extrapolating the linear portion of the plot to the photon energy axis, where ((α·hυ)2 = 0). The results show that the intercept point shifts toward lower photon energies with increasing Co-doping concentration, indicating a systematic reduction in the band gap. The pure Bi2O3 sample exhibits the largest band gap of approximately 3.9 eV, while the Co-doped samples show smaller band gap values, reaching approximately 3.1 eV for the Co0.025Bi1.975O3 sample. This band gap narrowing can be attributed to the introduction of Co-related electronic states within the Bi2O3 band structure, which facilitates visible-light absorption and enhances the photocatalytic potential of the material.
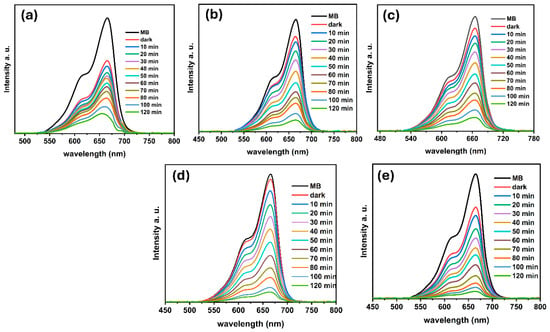
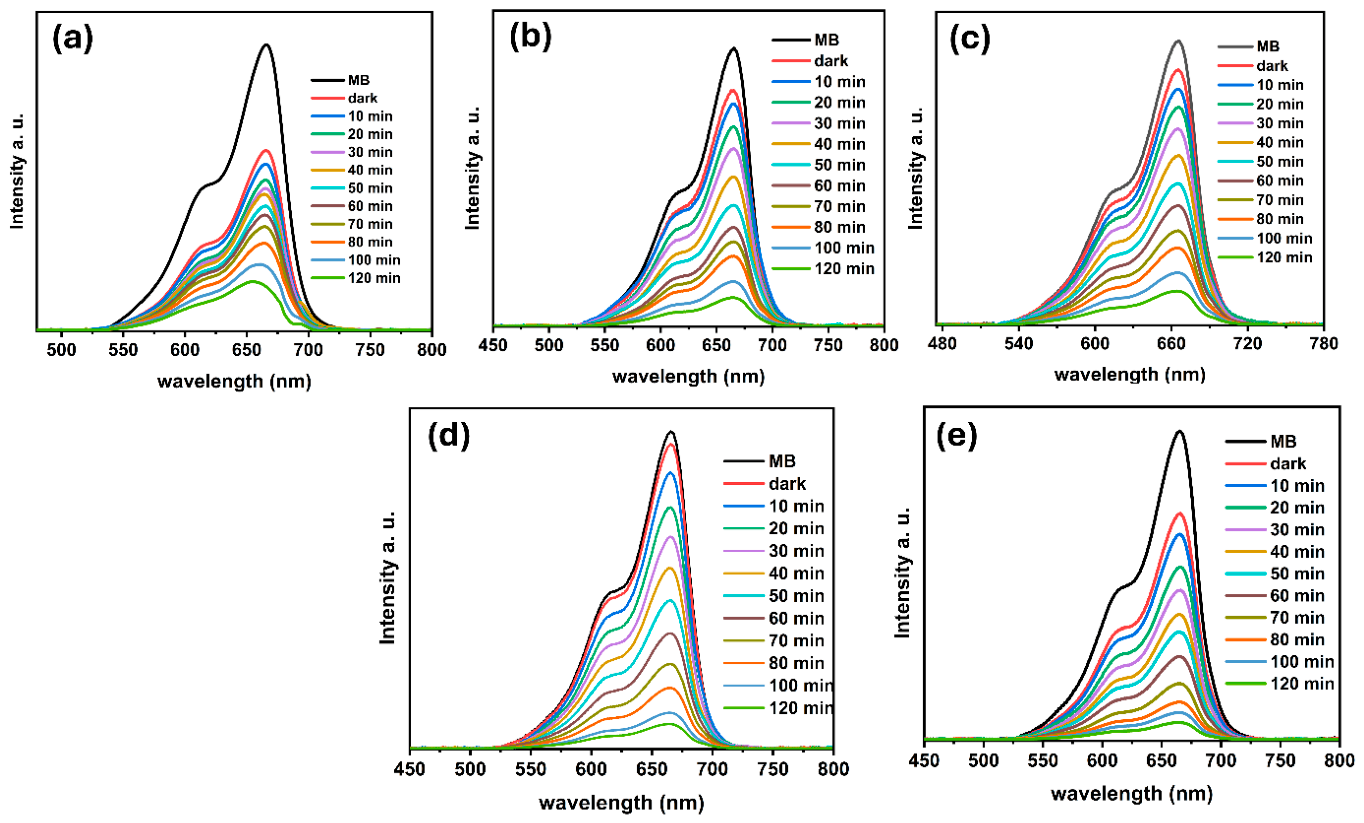
Figure 7 shows the time-dependent UV-Vis absorption spectra used to monitor the photocatalytic degradation of methylene blue (MB) dye under visible-light irradiation for (a) pure Bi2O3 and Co-doped Bi2−xCoxO3 samples with x = (b) 0.025, (c) 0.05, (d) 0.075, and (e) 0.1. The degradation process is confirmed by the gradual decrease in the characteristic MB absorption peak at approximately 665 nm over 120 min of irradiation. This continuous reduction in peak intensity indicates the progressive decomposition of MB molecules during the photocatalytic reaction. A visual comparison of the spectra clearly demonstrates that the Co-doped samples exhibit significantly higher photocatalytic degradation rates than the undoped Bi2O3. This enhancement can be ascribed to the synergistic effects of cobalt incorporation, including the reduction of the optical band gap (as shown in Figure 6b), which improves visible-light absorption, and the generation of defect states that facilitate the separation and transport of photogenerated electron–hole pairs.
Figure 7.
Time-dependent UV-V absorption spectra for the two-hour photocatalytic degradation of methylene blue dye using Bi2−xCoxO3 photocatalysts with (a) x = 0, (b) 0.025, (c) 0.05, (d) 0.075, and (e) 0.1.
The photocatalytic performance appears to reach an optimum at intermediate Co-doping levels. At higher dopant concentrations, the efficiency may slightly decrease due to the formation of additional recombination centers. Although the Co0.1Bi1.9O3 sample still exhibits considerable photocatalytic activity, its degradation rate may be slightly lower than that of the optimal composition. This behavior can be ascribed to excess cobalt ions acting as recombination centers for photogenerated charge carriers, a phenomenon commonly observed in heavily doped semiconductor photocatalysts.
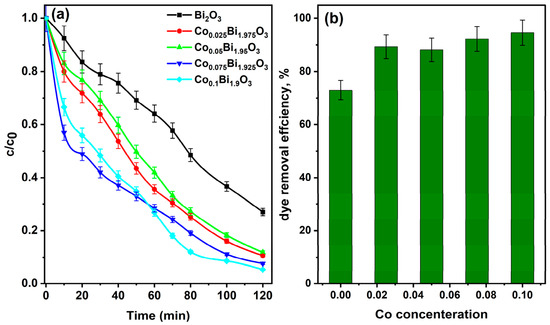
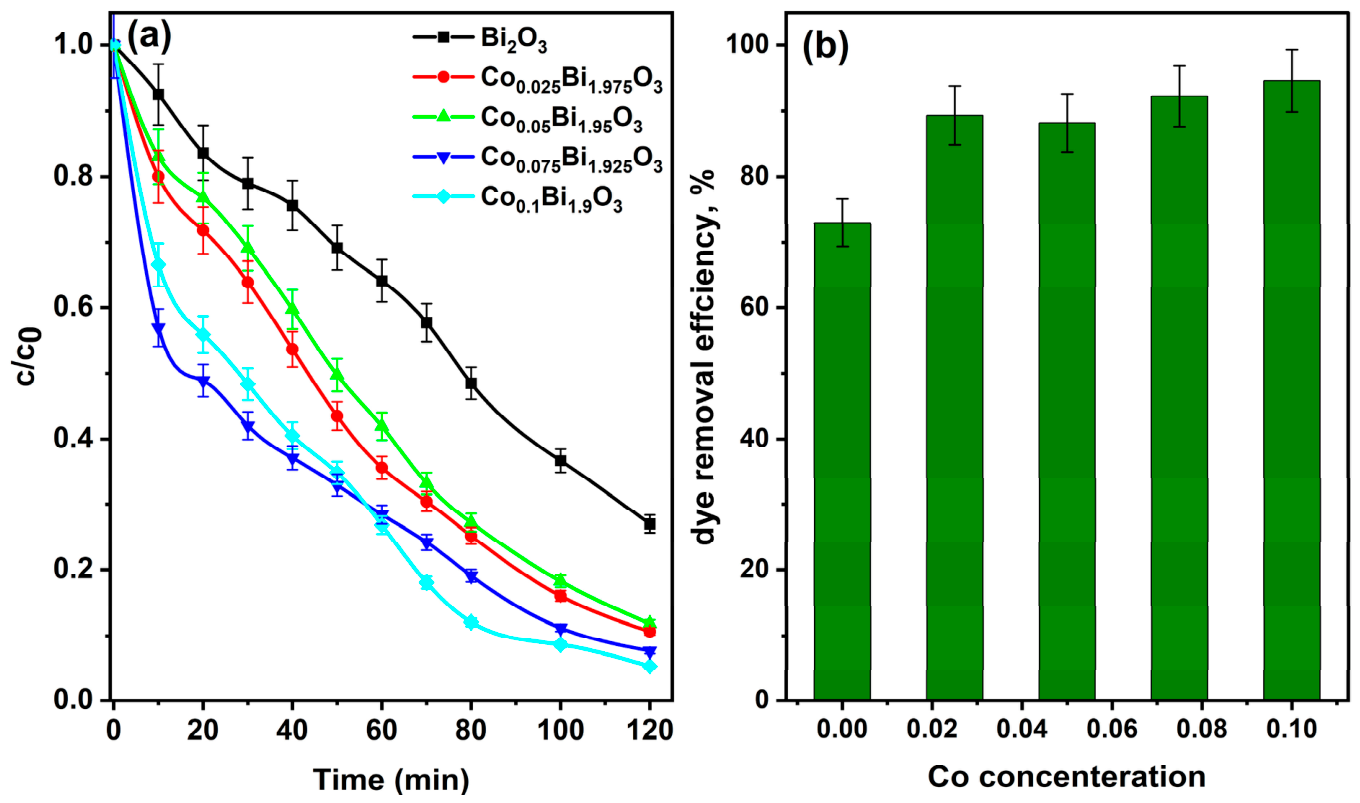
Figure 8a demonstrates the variation of the normalized concentration ratio (C/C0) of MB as a function of irradiation time (min). Here, C0 represents the initial dye concentration, while C represents the concentration at irradiation time t. A faster decrease in the C/C0 value indicates a higher photocatalytic degradation rate. As expected, the pure Bi2O3 sample exhibits the lowest degradation efficiency and therefore serves as a reference for comparison. In contrast, all Co-doped Bi2O3 samples demonstrate significantly enhanced photocatalytic activity compared with the undoped material. This improvement can be attributed to the synergistic effects of cobalt incorporation, which enhances visible-light absorption (as indicated by the optical analysis) and promotes more efficient separation of photogenerated electron–hole pairs. Consequently, the generation of reactive oxygen species involved in the photocatalytic degradation process is increased. Among the investigated samples, Co0.1Bi1.9O3 (cyan line) exhibits the highest degradation efficiency, showing the fastest decrease in the C/C0 ratio within the shortest irradiation time. This result indicates that this sample possesses the best photocatalytic performance among the prepared materials. Overall, the degradation rate tends to increase with increasing Co concentration, highlighting the positive role of cobalt doping in improving the photocatalytic activity of Bi2O3.
Figure 8.
(a) Variation of normalized MB concentration (C/C0) as a function of irradiation time using Bi2−xCoxO3 photocatalysts with different Co-doping concentrations under simulated sunlight. (b) Photocatalytic degradation efficiency of MB for the synthesized samples.
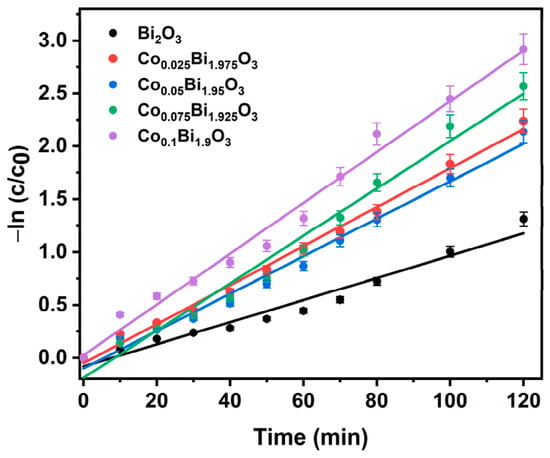
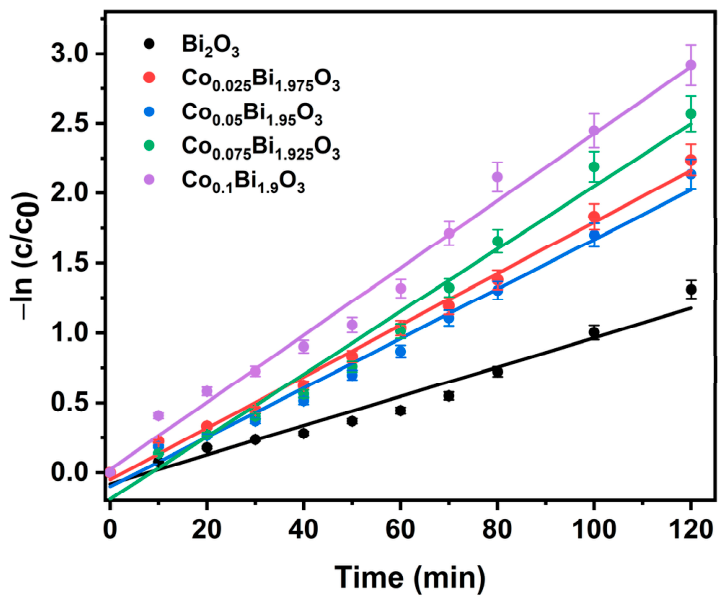
Figure 8b summarizes the overall removal efficiency of MB dye after 120 min of irradiation for each catalyst composition. The undoped Bi2O3 sample exhibits a removal efficiency of 73.01%. A significant enhancement in photocatalytic performance is observed for all Co-doped samples. The lowest doped sample, Co0.025Bi1.975O3, increases the removal efficiency to 89.33%. The degradation efficiency continues to improve with increasing cobalt concentration, reaching 94.59% for the Co0.1Bi1.9O3 sample. This represents an improvement of approximately 21.58% compared with the pure Bi2O3 catalyst. These results clearly demonstrate that Co-doping is highly effective in enhancing the visible-light photocatalytic activity of Bi2O3 for MB degradation. Figure 9 presents the pseudo-first-order kinetic plots for the photocatalytic degradation of MB dye using Bi2O3 and Co-doped Bi2−xCoxO3 catalysts. The plots show −ln(C/C0) versus irradiation time (t). The high linearity of the fitted curves indicates that the degradation process follows pseudo-first-order reaction kinetics, described by ln(C/C0) = kt, where k is the apparent reaction rate constant. The slope of each linear plot corresponds to the k value for the respective catalyst. Consistent with the degradation efficiency results, the slope increases gradually with increasing Co-doping concentration. The Co0.1Bi1.9O3 sample exhibits the steepest slope, indicating the highest reaction rate constant and the fastest photocatalytic degradation rate among the investigated samples. This kinetic enhancement confirms that Co-doping significantly improves the intrinsic photocatalytic activity of Bi2O3, likely due to enhanced visible-light absorption and more efficient separation of photogenerated charge carriers.
Figure 9.
Pseudo 1st order kinetic plots for the photocatalytic degradation of MB using Bi2−xCoxO3 catalysts with various Co-doping concentrations (x = 0 → 0.1).
The quantitative data in Table 1 strongly support the conclusion that Co-doping significantly increases the photocatalytic activity of Bi2O3. The high R2 value (R2 = 0.96) indicates that a pseudo-first-order model describes the degradation kinetics. The undoped Bi2O3 exhibits a rate constant (k) of 0.0105 min−1 and 73.0% MB removal. The rate constant and removal efficiency are also systematically increased by Co-doping. The Co0.1Bi1.9O3 catalyst is observed to be the best, with a removal efficiency of 94.5% and a rate constant of 0.0240 min−1. This is twice the reaction rate compared to the pure oxide, highlighting the effectiveness of Co incorporation in reducing the band gap and enhancing the separation efficiency of the charge carriers generated by photogeneration.
Table 1.
Pseudo 1st-order kinetic parameters calculated for the photocatalytic degradation of methylene blue utilizing Bi2−xCoxO3 catalysts at various cobalt doping levels (x = 0 → 0.1).
The comparison demonstrates that our Co-doped Bi2O3 achieves superior degradation efficiency (94.5%) and a higher reaction rate constant (0.0240 min−1) than most previously reported Bi2O3-based systems, as shown in Table 2.
Table 2.
Comparison of photocatalytic degradation performance of Bi2O3-based photocatalysts for MB degradation under visible light.
3. Materials and Methods
3.1. Synthesis of Cobalt-Modified Bismuth Oxide Nanostructures
Cobalt-doped Bi2O3 nanoparticles were produced utilizing a sol–gel combustion process to study the influence of a low Co-doping ratio. Stoichiometric amounts of Bi(NO3)3·5H2O and urea (CH4N2O) were mixed in a cylindrical crucible. At 400 rpm, the mix was stirred for 5 min until a homogeneous solution was obtained. After that, the mixture was calcined for two hours at 600 °C in a furnace. During calcination, a series of decomposition and combustion reactions occurred, leading to the formation of the final oxide product. After calcination, the product was allowed to cool naturally to ambient temperature and then collected. The obtained yellow powder was ground using a mortar and pestle and used for characterization without any further high-temperature treatment. For cobalt doping, predetermined amounts of cobalt nitrate (Co(NO3)2·2H2O) were introduced into the precursor solution. The molar fraction of Co relative to the total (Co + Bi) metal content was adjusted to 0, 0.25, 0.5, 0.75, and 1 mol%, respectively. With increasing Co2+ concentration, the product color gradually changed from yellow to darker shades, indicating successful incorporation of cobalt into the matrix of Bi2O3. The resulting powders were easily ground into fine particles for subsequent characterization and photocatalytic studies [20].
3.2. Characterization Techniques for Bi2−xCoxO3 Samples
The crystalline structure of Bi2−xCoxO3 (0 ≤ x ≤ 0.1) samples was investigated by XRD. Measurements of XRD were performed using a LANScientific diffractometer (Suzhou, China) with Cu Kα radiation (λ = 0.15418 nm). The samples’ surface morphology was observed by SEM using a JEOL JSM-5910 microscope (Tokyo, Japan) operated at 20 kV. The elemental components and distribution were considered by EDX attached to the same SEM instrument. Optical properties were evaluated using a Jasco V-670 UV-visible spectrophotometer (Tokyo, Japan) to determine the optical band gap energies of the samples. The photocatalytic activity was evaluated through the degradation of MB dye under light irradiation, and the degradation efficiency was monitored by recording the temporal evolution of the UV-visible absorption spectra.
3.3. The Photocatalytic Activity of Bi2−xCoxO3
For obtaining the photocatalytic activity of Bi2O3 nanoparticles, the degradation of MB in aqueous solution was monitored. The initial MB concentration was adjusted to 50 mg L−1. Visible light in the wavelength range of 400–800 nm was provided by a 500 W tungsten–halogen lamp positioned approximately 10 cm from the reaction system. A total of 20 mg of the nanoparticle catalyst was dispersed in 50 mL of MB solution contained in a 200 mL beaker, and the suspension was vigorously stirred to ensure uniform dispersion. Prior to irradiation, the mixture was kept in the dark for 30 min to create an equilibrium between the catalyst surface and the MB molecules by adsorption and desorption. Photodegradation was initiated by turning on the light source while maintaining continuous stirring to ensure homogeneous reaction conditions. The irradiation time was set to 120 min. During the experiment, 5 mL aliquots were withdrawn every 10 min, centrifuged to remove the catalyst particles, and then analyzed to monitor the degradation process.
A UV-visible spectrophotometer was used to test the samples’ absorbance. Methylene blue exhibits a characteristic absorption peak at 665 nm, and the decrease in absorbance at this wavelength was used to determine the extent of dye degradation. The photocatalytic efficiency was determined by comparing the absorbance before irradiation with that at a given time during the reaction. The dye removal efficiency was calculated using the standard relation [18,21]:
where C0 is the initial dye concentration and Ct is the concentration at time t. After completing the photocatalytic degradation experiment, the catalyst was separated by centrifugation and redispersed in a fresh dye solution to evaluate its performance in subsequent recycling tests.
3.4. Electrochemical Measurements
EIS and Mott–Schottky measurements were worked out utilizing a Corrtest CS305 electrochemical workstation with a standard 3-electrode configuration (Wuhan Corrtest Instruments Corp., Ltd., Wuhan, China). An SCE and a Pt wire were utilized as the reference and counter electrodes, respectively. The working electrodes were prepared as follows: 0.005 g of the photocatalyst powder was dissolved in 1 mL of ethanol containing 10 µL of Nafion solution (5 wt%) by sonication for 30 min. Then, 20 µL of the resulting suspension was drop-cast onto a pre-cleaned FTO glass substrate (1 cm × 1 cm active area) and dried at 60 °C for 2 h. All measurements were conducted in a 0.5 M Na2SO4 aqueous solution (pH = 6.8) as the electrolyte. EIS measurements were performed at open-circuit potential over a frequency range of 0.01 Hz to 100,000 Hz with an AC amplitude of 10 mV. Mott–Schottky plots were recorded at a fixed frequency of 1000 Hz with a DC potential range of −1.0 to +1.0 V vs. SCE. As shown in Figures S3 and S4.
4. Conclusions
In this study, a series of cobalt-doped bismuth oxide nanoparticles (Bi2−xCoxO3, x = 0.025–0.1) were successfully produced employing a simple sol–gel combustion route to enrich the visible-light photocatalytic activity of pure Bi2O3. XRD analysis confirmed the successful incorporation of Co ions into the Bi2O3 lattice, accompanied by systematic changes in microstructural parameters such as crystallite size and lattice strain. Optical characterization using UV-Vis spectroscopy and Tauc plot analysis revealed a pronounced red shift in the absorption edge upon Co-doping, leading to a gradual reduction in the optical band gap from 3.9 eV for pure Bi2O3 to approximately 3.1 eV for the doped samples. This band gap engineering significantly improves visible-light absorption. Photocatalytic experiments using MB as a model pollutant demonstrated a substantial enhancement in degradation efficiency for the Co-doped samples compared with pure Bi2O3. The degradation kinetics followed a pseudo-first-order model with good linearity (R2 > 0.96). Among the investigated compositions, the Bi1.9Co0.1O3 sample exhibited the highest photocatalytic performance, achieving a maximum MB removal efficiency of 94.5% within 120 min, which is significantly higher than that of pure Bi2O3 (73.0%). The corresponding reaction rate constant (k = 0.0240 min−1) was also considerably higher than that of the undoped material (0.0105 min−1). Overall, these results demonstrate that cobalt doping is an effective strategy for tuning the structural and electronic properties of Bi2O3. The enhanced photocatalytic performance can be attributed to the synergistic effects of band gap reduction, improved visible-light absorption, and more efficient separation of photogenerated charge carriers. Consequently, Co-doped Bi2O3 represents a promising, cost-effective visible light photocatalyst with potential applications in wastewater treatment and environmental remediation.
Supplementary Materials
The following supporting information can be downloaded at: https://www.mdpi.com/article/10.3390/catal16060496/s1. Figure S1: XRD pattern of the photocatalyst before and after the photocatalytic degradation of MB dye solution. Figure S2: Stability and reusability study of Co0.1Bi1.9O3 photocatalyst powders in the MB degradation process under irradiation for five runs. Figure S3: EIS of pure Bi2O3 and doped with different concentrations of cobalt. Figure S4: Mot–Schottky plots for (a) pure and the doped samples: (b–e). Figure S5: Williamson–Hall plot of Bi2O3 and doped samples.
Author Contributions
A.M.A., Y.A.M.I., H.A., I.M.S. and F.H.A.; Methodology, A.M.A., H.A., I.M.S. and A.B.G.T.; Validation, W.M.M. and H.A.; Formal analysis, A.M.A., W.M.M., M.S. and I.M.S.; Investigation, M.S. and I.M.S.; Resources, Y.A.M.I. and H.A.; Data curation, Y.A.M.I., M.S. and I.M.S.; Writing – original draft, A.M.A., Y.A.M.I. and I.M.S.; Writing – review & editing, A.M.A., W.M.M., M.S. and H.A.; Visualization, W.M.M. and H.A.; Supervision, A.M.A. and Y.A.M.I.; Project administration, A.M.A. and M.S. All authors have read and agreed to the published version of the manuscript.
Funding
The authors express their gratitude to Princess Nourah bint Abdulrahman University Researchers Supporting Project number (PNURSP2026R38), Princess Nourah bint Abdulrahman University, Riyadh, Saudi Arabia. The authors extend their appreciation to the Deanship of Scientific Research at King Khalid University for funding this work through a large group Research Project under grant number RGP2/244/46.
Data Availability Statement
The data will be available on reasonable request to the corresponding author. The original contributions presented in this study are included in the article/supplementary material.
Acknowledgments
The authors express their gratitude to Princess Nourah bint Abdulrahman University Researchers Supporting Project number (PNURSP2026R38), Princess Nourah bint Abdulrahman University, Riyadh, Saudi Arabia. The authors extend their appreciation to the Deanship of Scientific Research at King Khalid University for funding this work through a large group Research Project under grant number RGP2/244/46.
Conflicts of Interest
The authors declare no conflict of interest.
References
- Mohammad, A.; Baig, M.T.; Tauqeer, M.; Kim, H.-J.; Park, C.-H.; Choi, C.-H. Bismuth-based heterojunction photocatalysts for antibiotic remediation: A review of tetracycline degradation and mechanistic insights. J. Environ. Manag. 2025, 393, 127010. [Google Scholar] [CrossRef] [Scilit]
- Aldhafeeri, Z.M.; Aadil, M.; Mubeen, S.; Khalid, A.; El-Aassar, M.R.; Hasan, M.; Algarni, M.; Alrahili, M.R. Synthesis of assembled Ag-Bi2O3/rGO composites using hydrothermal and ultrasonication and its application in drug and dye annihilation. Ceram. Int. 2025, 51, 27912–27924. [Google Scholar] [CrossRef] [Scilit]
- Shi, Q.; Zhao, W.; Xie, L.; Chen, J.; Zhang, M.; Li, Y. Enhanced visible-light driven photocatalytic mineralization of indoor toluene via a BiVO4/reduced graphene oxide/Bi2O3 all-solid-state Z-scheme system. J. Alloys Compd. 2016, 662, 108–117. [Google Scholar] [CrossRef] [Scilit]
- Masula, K.; Bhongiri, Y.; Raghav Rao, G.; Vijay Kumar, P.; Pola, S.; Basude, M. Evolution of photocatalytic activity of CeO2–Bi2O3 composite material for wastewater degradation under visible-light irradiation. Opt. Mater. 2022, 126, 112201. [Google Scholar] [CrossRef] [Scilit]
- Sarkodie, B.; Tawiah, B.; Liu, H.; Feng, Q.; Hu, Y. Promoting the photocatalytic power of nanofibrous mat via coaxial electrospinning: Activity of core-sheath Cu-Bi2O3/Cellulose acetate@PAN mat in methylene blue degradation. J. Clean. Prod. 2025, 490, 144764. [Google Scholar] [CrossRef] [Scilit]
- Yaah, V.B.K.; Pastrana-Martínez, L.M.; Maldonado-Hódar, F.J.; Morales-Torres, S. Tungsten/bismuth–based catalysts for the degradation of 5-fluorouracil cytostatic drug in water by solar-LED photocatalysis. Environ. Technol. Innov. 2025, 38, 104148. [Google Scholar] [CrossRef] [Scilit]
- Ali, I.; Kim, S.-R.; Kim, S.-P.; Kim, J.-O. Anodization of bismuth doped TiO2 nanotubes composite for photocatalytic degradation of phenol in visible light. Catal. Today 2017, 282, 31–37. [Google Scholar] [CrossRef] [Scilit]
- Kaushik, R.; Gandhi, S.; Halder, A. Photoelectrochemical degradation of organic pollutants coupled with molecular hydrogen generation using Bi2O3/TiO2 nanoparticle arrays. ACS Appl. Nano Mater. 2023, 6, 4297–4308. [Google Scholar] [CrossRef] [Scilit]
- Shamaila, S.; Sajjad, A.K.L.; Chen, F.; Zhang, J. Study on highly visible light active Bi2O3 loaded ordered mesoporous titania. Appl. Catal. B Environ. 2010, 94, 272–280. [Google Scholar] [CrossRef] [Scilit]
- Mushtaq, Q.; Saddique, Z.; Javaid, A.; Latif, S.; Imran, M.; Mitu, L. Fabrication of Fuel Cell Involving Bismuth-based Components for Efficient and Cost-effective Strategies. Comments Inorg. Chem. 2025, 45, 480–500. [Google Scholar] [CrossRef] [Scilit]
- Fang, W.; Shangguan, W. A review on bismuth-based composite oxides for photocatalytic hydrogen generation. Int. J. Hydrogen Energy 2019, 44, 895–912. [Google Scholar] [CrossRef] [Scilit]
- Chen, L.; Guan, B.; Guo, J.; Chen, Y.; Ma, Z.; Chen, J.; Yao, S.; Zhu, C.; Dang, H.; Shu, K. Review on the preparation and performance improvement methods of bismuth photocatalyst materials. Catal. Sci. Technol. 2023, 13, 5478–5529. [Google Scholar] [CrossRef] [Scilit]
- Sun, S.; Wang, W. Advanced chemical compositions and nanoarchitectures of bismuth based complex oxides for solar photocatalytic application. RSC Adv. 2014, 4, 47136–47152. [Google Scholar] [CrossRef] [Scilit]
- Zahid, A.H.; Han, Q. A review on the preparation, microstructure, and photocatalytic performance of Bi2O3 in polymorphs. Nanoscale 2021, 13, 17687–17724. [Google Scholar] [CrossRef] [Scilit]
- Lu, N.; Zhang, M.; Jing, X.; Zhang, P.; Zhu, Y.; Zhang, Z. Electrospun semiconductor-based nano-heterostructures for photocatalytic energy conversion and environmental remediation: Opportunities and challenges. Energy Environ. Mater. 2023, 6, e12338. [Google Scholar] [CrossRef] [Scilit]
- Zhang, P.; Wang, T.; Chang, X.; Gong, J. Effective charge carrier utilization in photocatalytic conversions. Acc. Chem. Res. 2016, 49, 911–921. [Google Scholar]
- Guo, J.-g.; Liu, Y.; Hao, Y.-j.; Li, Y.-l.; Wang, X.-j.; Liu, R.-h.; Li, F.-t. Comparison of importance between separation efficiency and valence band position: The case of heterostructured Bi3O4Br/α-Bi2O3 photocatalysts. Appl. Catal. B Environ. 2018, 224, 841–853. [Google Scholar] [CrossRef] [Scilit]
- Shang, J.; Gao, Y.; Hao, W.-C.; Jing, X.; Xin, H.-J.; Wang, L.; Feng, H.-F.; Wang, T.-M. Enhancing visible-light photocatalytic activity of α-Bi2O3 via non-metal N and S doping. Chin. Phys. B 2014, 23, 038103. [Google Scholar] [CrossRef] [Scilit]
- Viruthagiri, G.; Kannan, P. Visible light mediated photocatalytic activity of cobalt doped Bi2O3 nanoparticles. J. Mater. Res. Technol. 2019, 8, 127–133. [Google Scholar] [CrossRef] [Scilit]
- Sarkodie, W.O.; Takyi, F.; Amankwah, E.; Takase, M. A review on the potential of oil from fish waste as a source for biodiesel production in Ghana. Next Res. 2025, 2, 100427. [Google Scholar] [CrossRef] [Scilit]
- Jin, X.; Gao, P.; Mao, L.; Miao, H.; Huang, J.; He, D.; Zhang, Z.; Feng, Q.; Chen, G.; Li, C. The solid-phase synthesis of high-stability SrY2O4 and comparative analysis with Y2O3 in melting Ti-46Al-8Nb alloy. Ceram. Int. 2025, 51, 29176–29186. [Google Scholar] [CrossRef] [Scilit]

Disclaimer/Publisher’s Note: The statements, opinions and data contained in all publications are solely those of the individual author(s) and contributor(s) and not of MDPI and/or the editor(s). MDPI and/or the editor(s) disclaim responsibility for any injury to people or property resulting from any ideas, methods, instructions or products referred to in the content. |
© 2026 by the authors. Licensee MDPI, Basel, Switzerland. This article is an open access article distributed under the terms and conditions of the Creative Commons Attribution (CC BY) license.