2. Results and Discussion
Table 1 shows the BET surface area and pore volume diameter for the prepared catalysts. Estimates of expected BET surface areas were made assuming that Na is present as Na
2CO
3 in the as-prepared catalysts, and assuming that the promoter contributes to the mass but not the surface area (i.e., A
BET,expected = A
BET,ZrO2 × m
ZrO2/(m
ZrO2 + m
RuO2 + m
Na2CO3). The surface area and pore volume progressively decreased with increasing Na loading; a comparison of measured values with the expected values suggests some pore blocking by Na above 0.5% Na, and pore blocking is exacerbated with increasing Na contents. The average pore diameter ranged from 90.3 to 109.4 Å, and the increasing trend above 1% Na loading may be attributed to the preferential blocking of narrower pores.
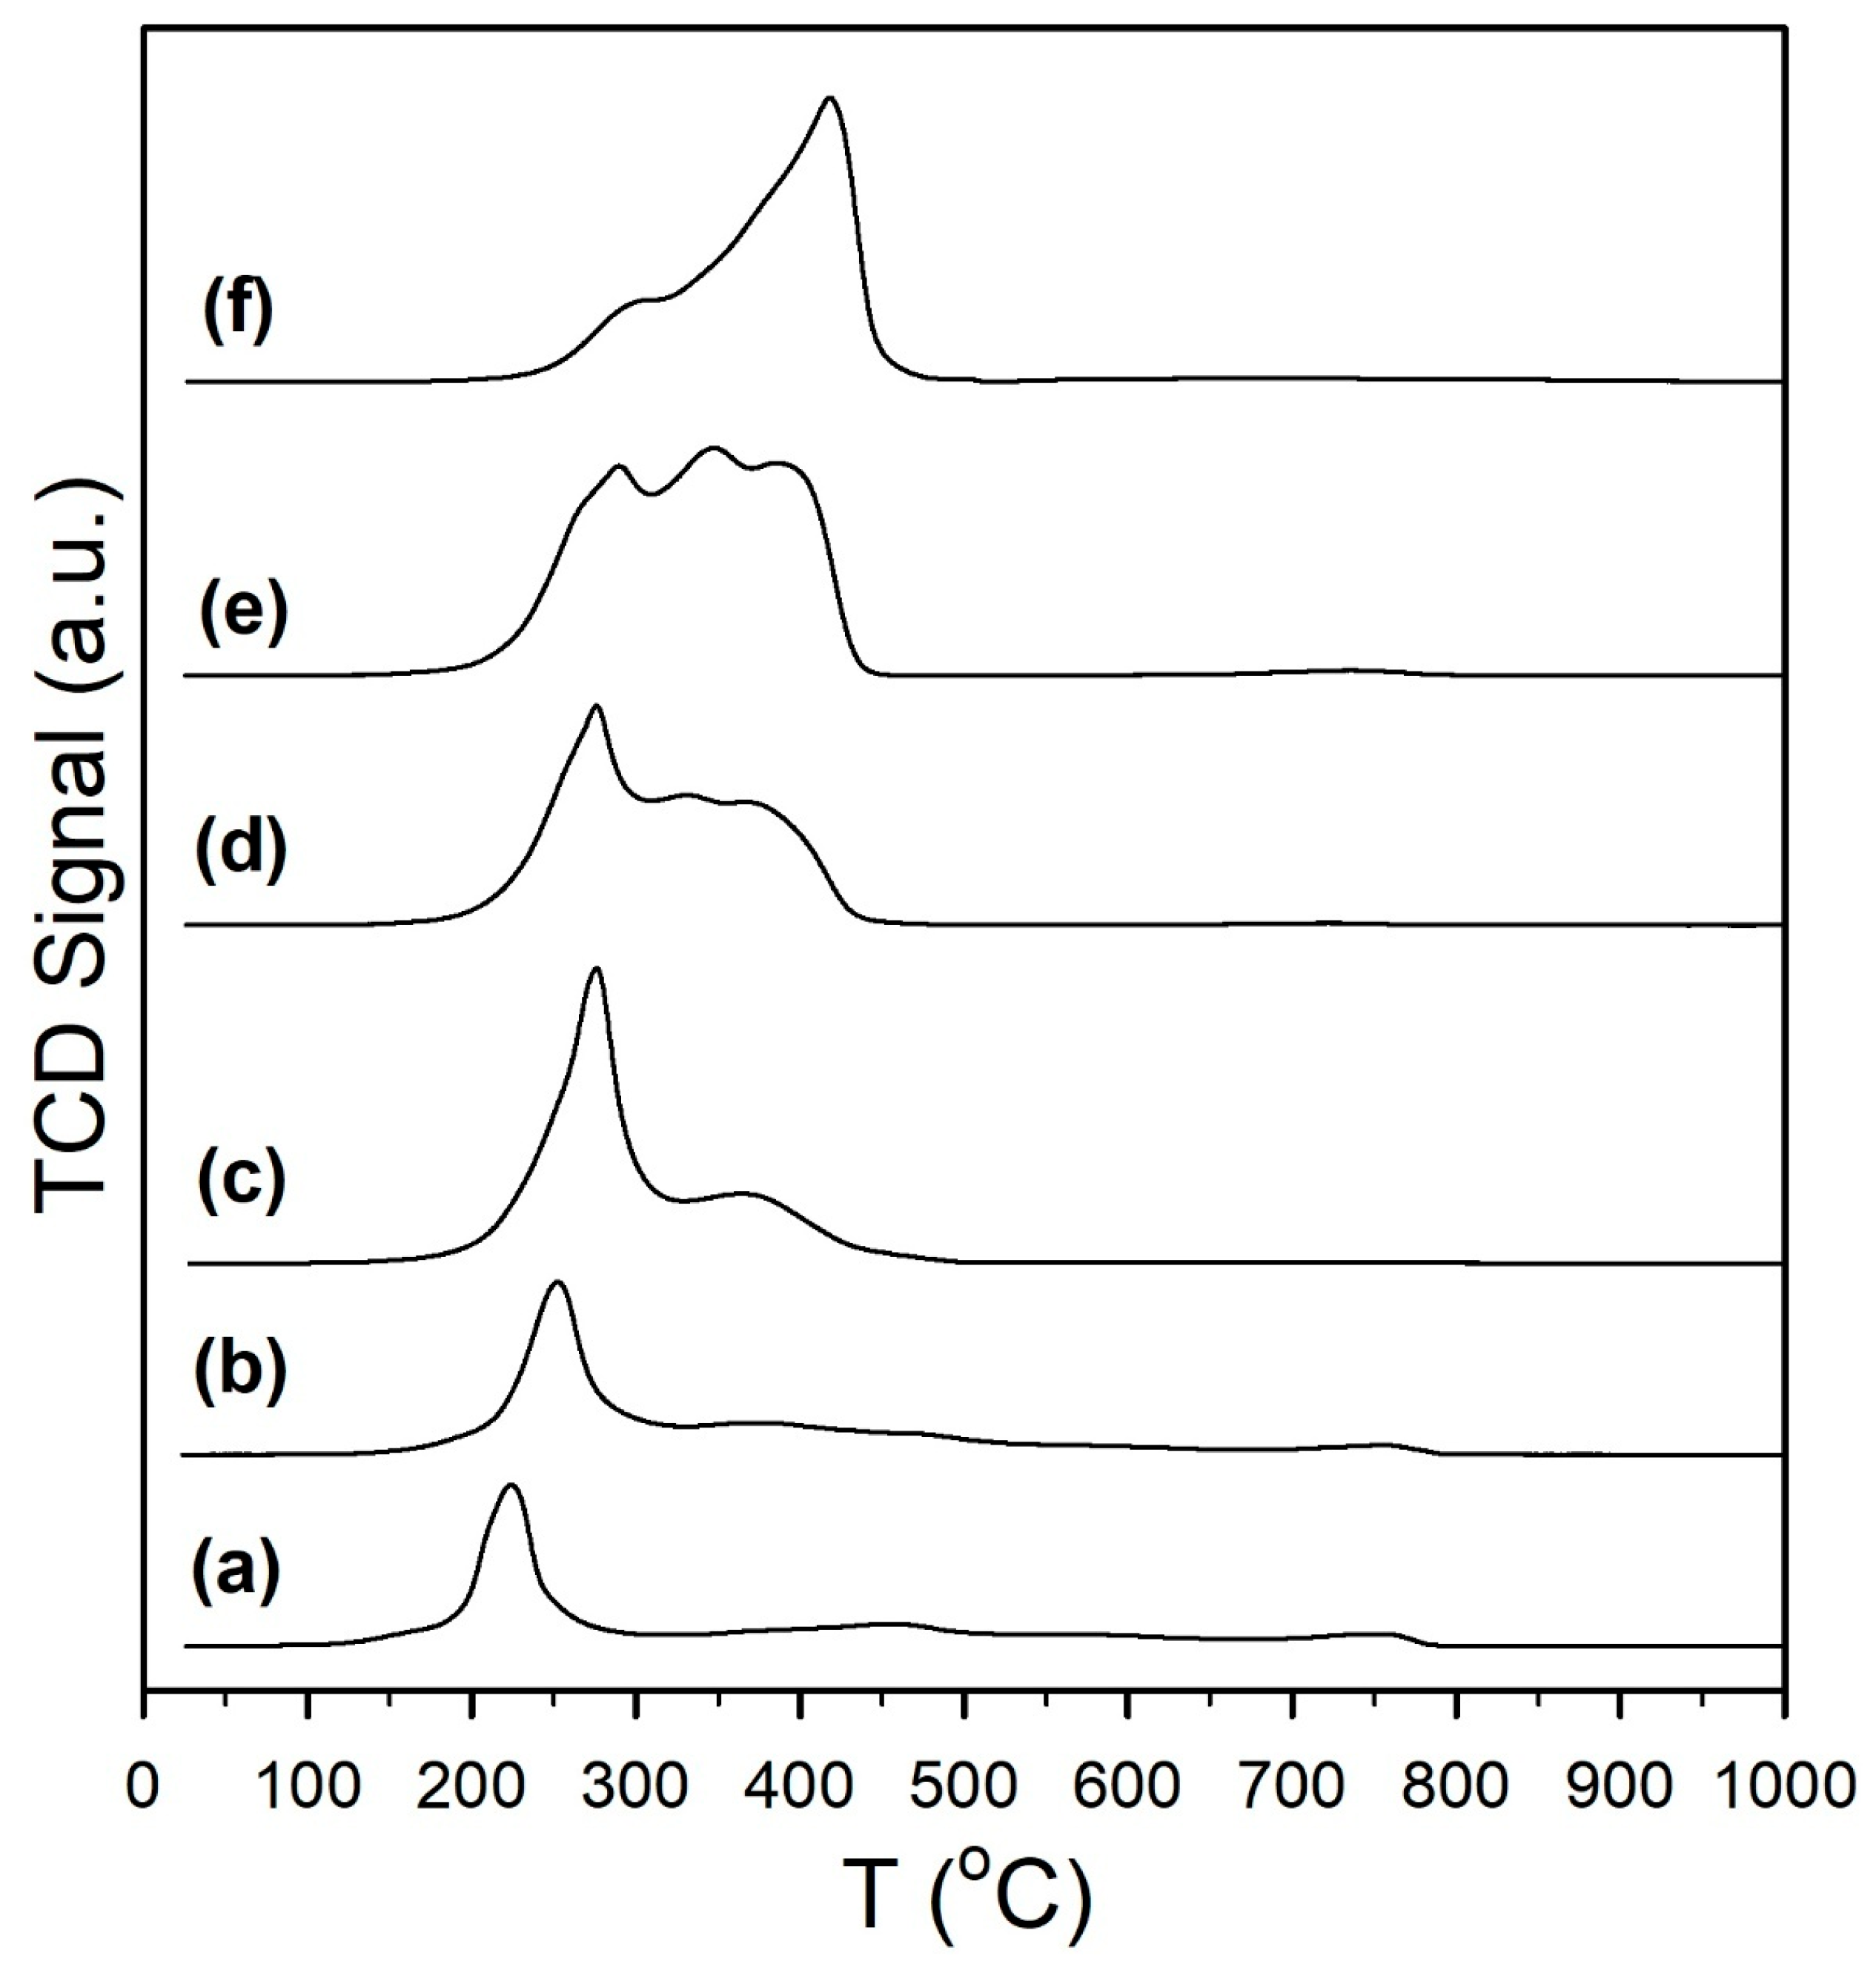
H
2-TPR (
Figure 1), TPR-MS (
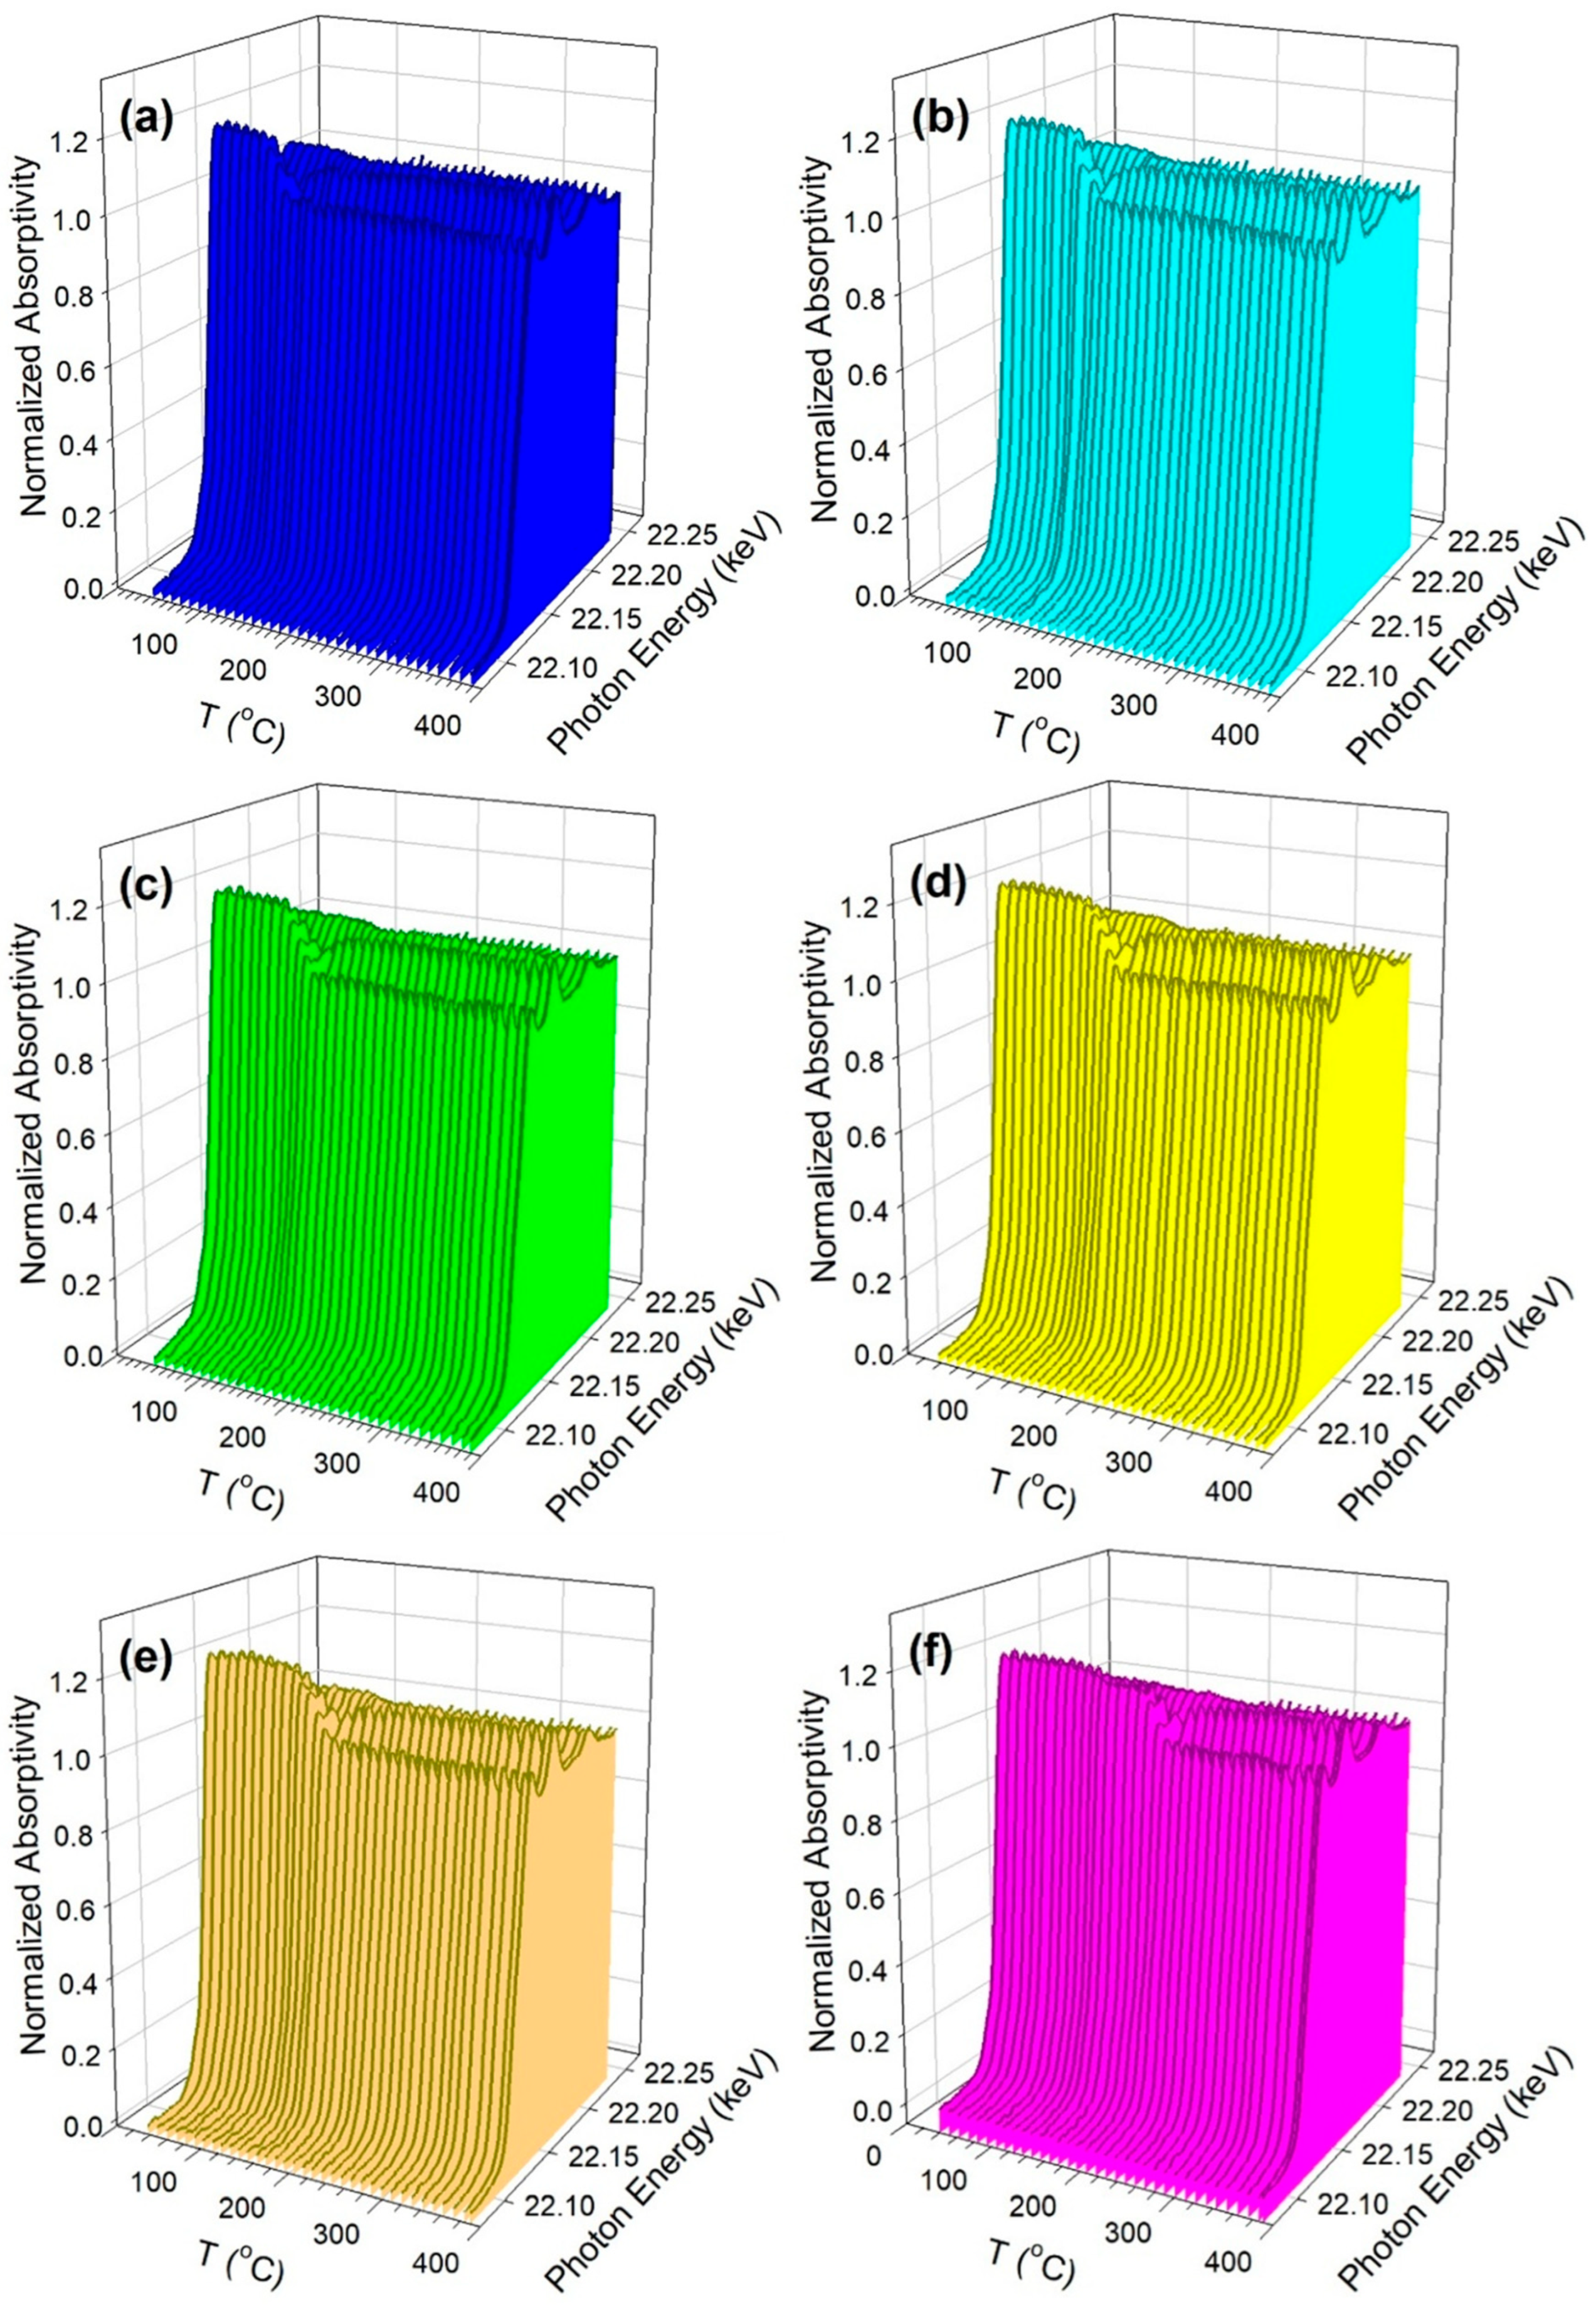
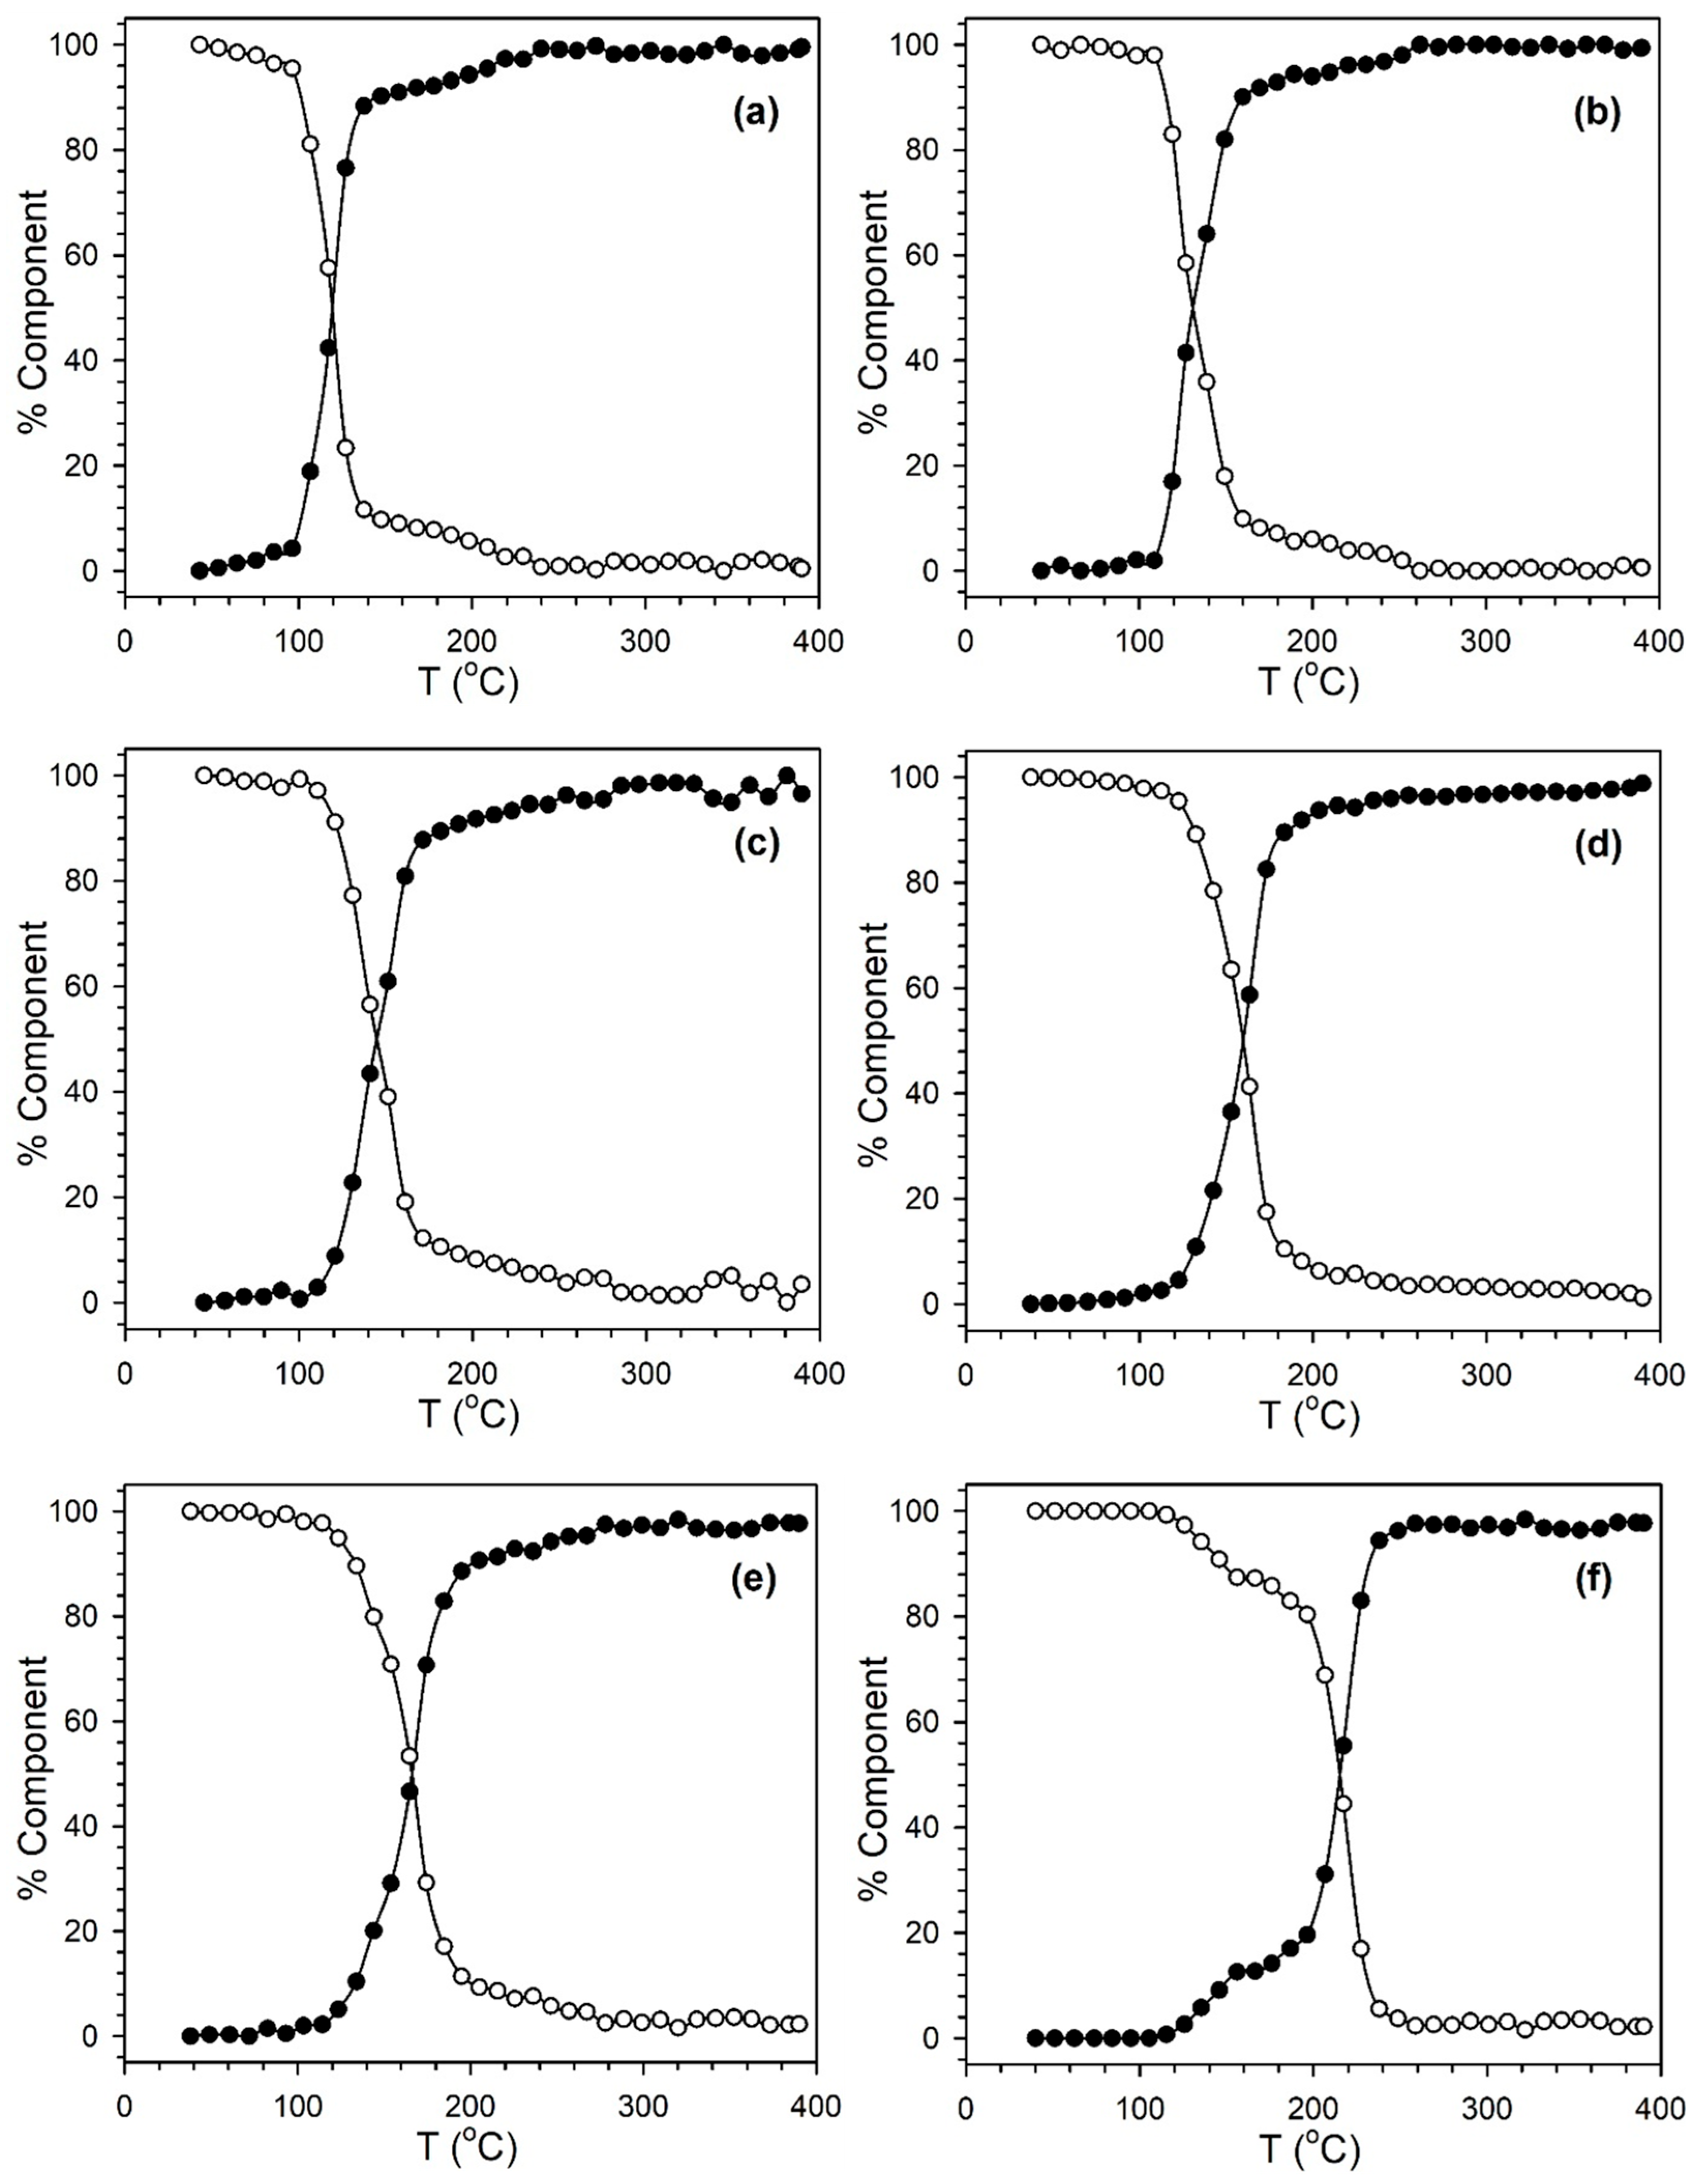
Figure S1), TPR-XANES (
Figure 2 and
Figure 3;
Table 2), TPR-EXAFS (
Figure S2), and DRIFTS (
Figure 4) together characterize the reduction behavior of Ru oxide, the onset of H
2 dissociation and spillover, the removal and formation of surface oxygenated species, and the influence of Na as a promoter. For the unpromoted 1% Ru/m-ZrO
2 catalyst, H
2 uptake begins at approximately 100 °C, appearing as a small shoulder before the main reduction peak with a range of 180–250 °C and a maximum of 225 °C. At higher temperatures, broad H
2 consumption features appear with maxima at 456 °C and 744 °C. The corresponding H
2-MS trace (
Figure S1a) mirrors these features, confirming that they arise from true H
2 uptake rather than thermal conductivity artifacts. TPR-XANES measurements (
Figure 2a) show that the Ru oxide is reduced readily: linear combination fitting (
Figure 3a) yields a 50% RuO
x/50% Ru
0 temperature of 119 °C (
Table 2), and more than 80% of the Ru is reduced by ~150 °C. TPR-EXAFS (
Figure S2a) confirms this finding, as the Ru–O scattering peak (1–2 Å, phase-uncorrected) diminishes strongly between 100–150 °C, while the Ru–Ru peak (2–3 Å) grows, indicating the formation of metallic Ru.
After RuO
x is reduced, Ru
0 enables H
2 dissociation and spillover onto m-ZrO
2, producing additional H
2 consumption above ~250 °C. This region is accompanied by CO evolution (
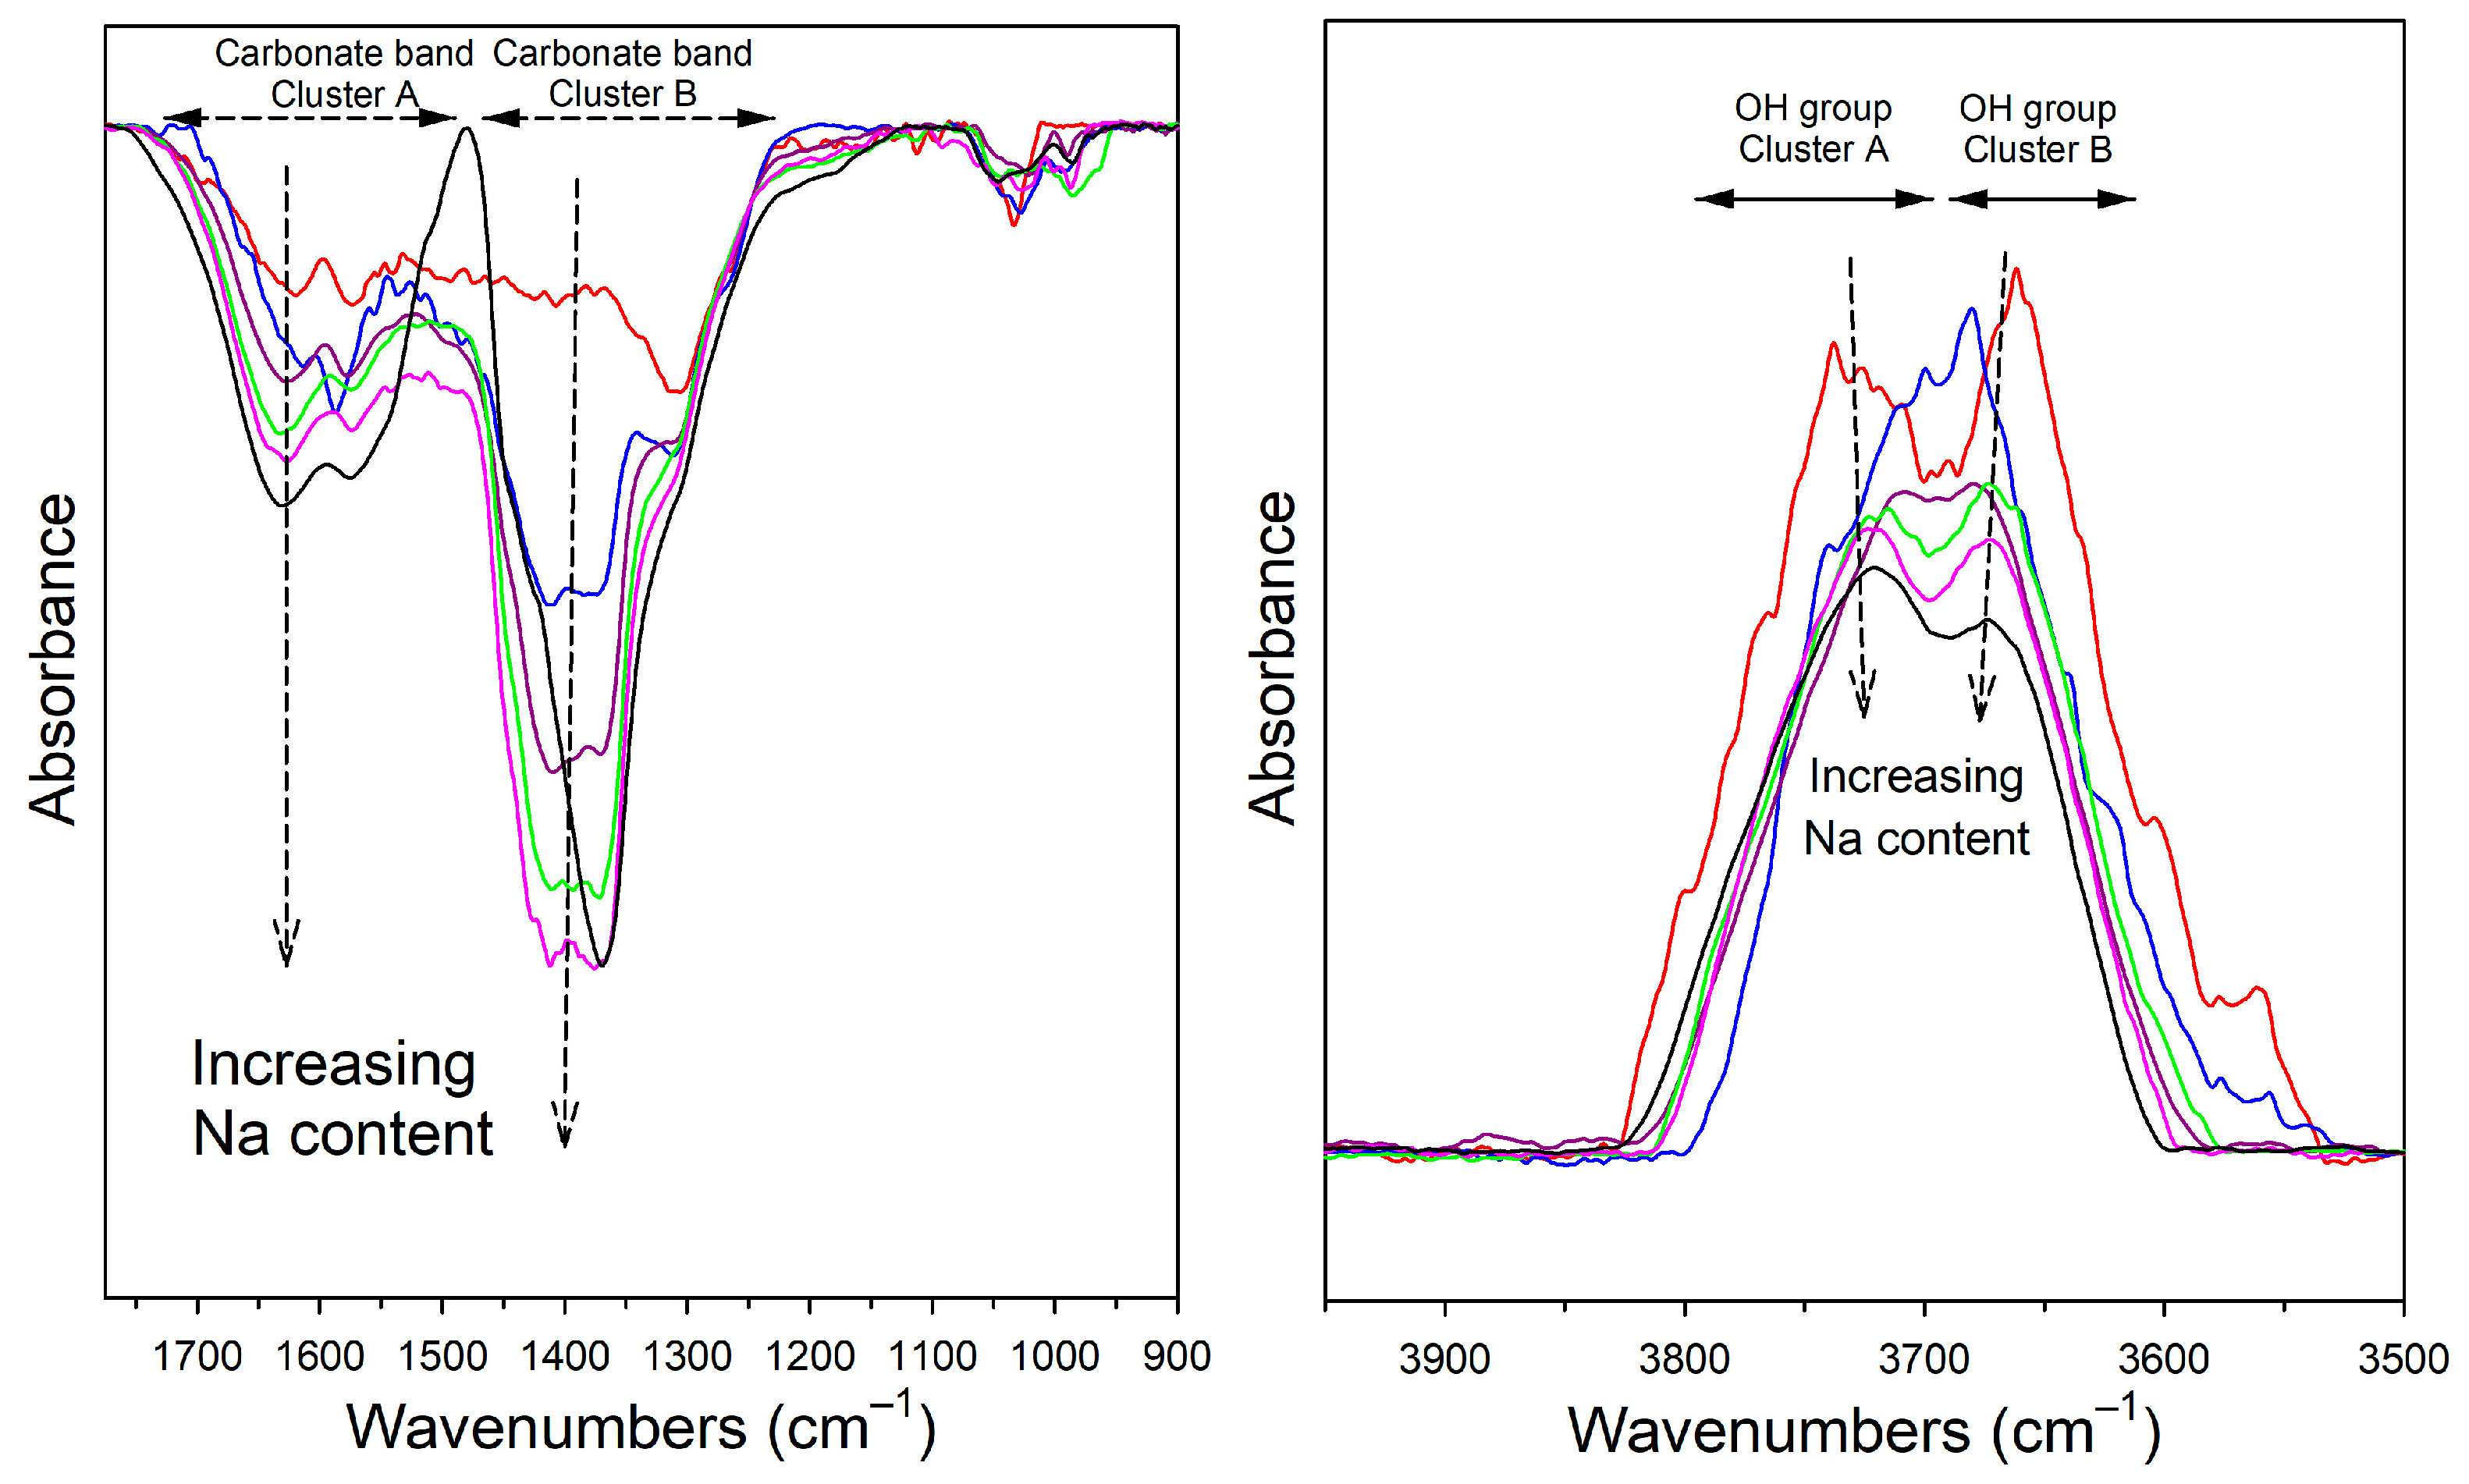
Figure S1a), consistent with hydrogen-induced carbonate decomposition on the support. This assignment is validated by DRIFTS (
Figure 4, left panel), which shows strong carbonate bands in the 1400–1600 cm
−1 range that are removed during H
2 treatment. Dashed horizontal lines delineate two dominant surface carbonate band clusters present on the calcined catalysts after air exposure; these are designated Cluster A and Cluster B. Using the assignments of Daturi et al. [
23], the 1650–1450 cm
−1 region is dominated by hydrogen carbonate/bicarbonate species formed by the interaction of CO
2 with surface hydroxyl groups, comprising mainly ν
as(OCO) (~1610–1630 cm
−1) and ν
s(OCO) (~1410–1440 cm
−1) modes. The 1450–1300 cm
−1 region is dominated by the ν
s(OCO) modes of bidentate carbonates (~1320–1360 cm
−1) with overlapping contributions from more strongly bound carbonate geometries. Introducing the alkaline promoter Na increases surface basicity. This in turn increases the population of surface carbonates with increasing Na content (vertical arrows).
The temperature at which carbonate bands disappear matches the spillover-related high-temperature H
2 consumption features in the TPR profiles. DRIFTS also reveals the formation of OH groups, as seen by the growth of the broad OH-stretching envelope near 3650–3700 cm
−1 (
Figure 4, right). The emergence of these OH bands demonstrates that H
2 spillover not only removes carbonates but also hydroxylates the ZrO
2 surface.
Dashed horizontal lines delineate the two dominant hydroxyl stretching bands on m-ZrO
2. Using the assignments of Daturi et al. [
23], the 3720–3690 cm
−1 region (designated Cluster A) corresponds to Type I isolated (terminal) Zr–OH groups, while the 3690–3620 cm
−1 region (designated Cluster B) corresponds to Type II bridging Zr–OH–Zr species. As indicated by the vertical arrows, an increasing Na content modifies both the intensity and position of these OH features, indicating that Na affects spillover-induced hydroxylation.
As Na is introduced and its loading increases, all reduction-related features shift systematically toward higher temperatures. For the 0.5% Na catalyst, the primary H2-TPR peak shifts to a range of 210–295 °C with a maximum at 253 °C, with higher temperature events having a maxima at 375 °C and 750 °C; the XANES midpoint rises to 131 °C, and EXAFS shows that Ru–O scattering persists at higher temperatures than in the unpromoted sample. At 1.0% Na, the main reduction feature appears over a range of 215–320 °C with a maximum at 275 °C, followed by a broader event (320–460 °C) having a maximum at 364 °C, and the XANES midpoint increases to 145 °C. For 1.8% Na, primary reduction in H2-TPR occurs at ~215–445 °C with maxima at 277 °C, 331 °C, and 360 °C, with a XANES midpoint of 159 °C. Increasing the Na content to 2.5% shifts the main event to the 220–450 °C range and maxima at 291 °C, 347 °C, and 385 °C, with spillover-related uptake extending toward ~500 °C; the XANES midpoint increases to 166 °C, and Ru–O coordination is retained across a wide temperature window. With 5.0% Na, inhibition is strongest: the primary reduction appears at 235–470 °C with maxima at 307 °C and 418 °C, with high-temperature features extending above 800 °C; the XANES midpoint rises to 215 °C, with Ru–O scattering persisting to the highest temperatures. The sharper rise in the XANES midpoint temperature between 2.5 wt.% and 5.0 wt.% Na (166 → 215 °C) suggests that high Na loadings produce a more extensively oxygenated Ru–support interface, further inhibiting RuOx reduction.
Across these techniques, Na consistently inhibits catalyst activation by delaying RuO
x → Ru
0 reduction, suppressing H
2 dissociation and spillover, and stabilizing Ru–O coordination at higher temperatures. Stronger CO and CO
2 MS signals with Na reflect larger populations of surface carbonates, consistent with the more intense carbonate bands observed in DRIFTS (
Figure 4). The simultaneous removal of carbonates and formation of OH groups upon H
2 exposure demonstrates that Na influences both surface basicity and hydrogen spillover pathways.
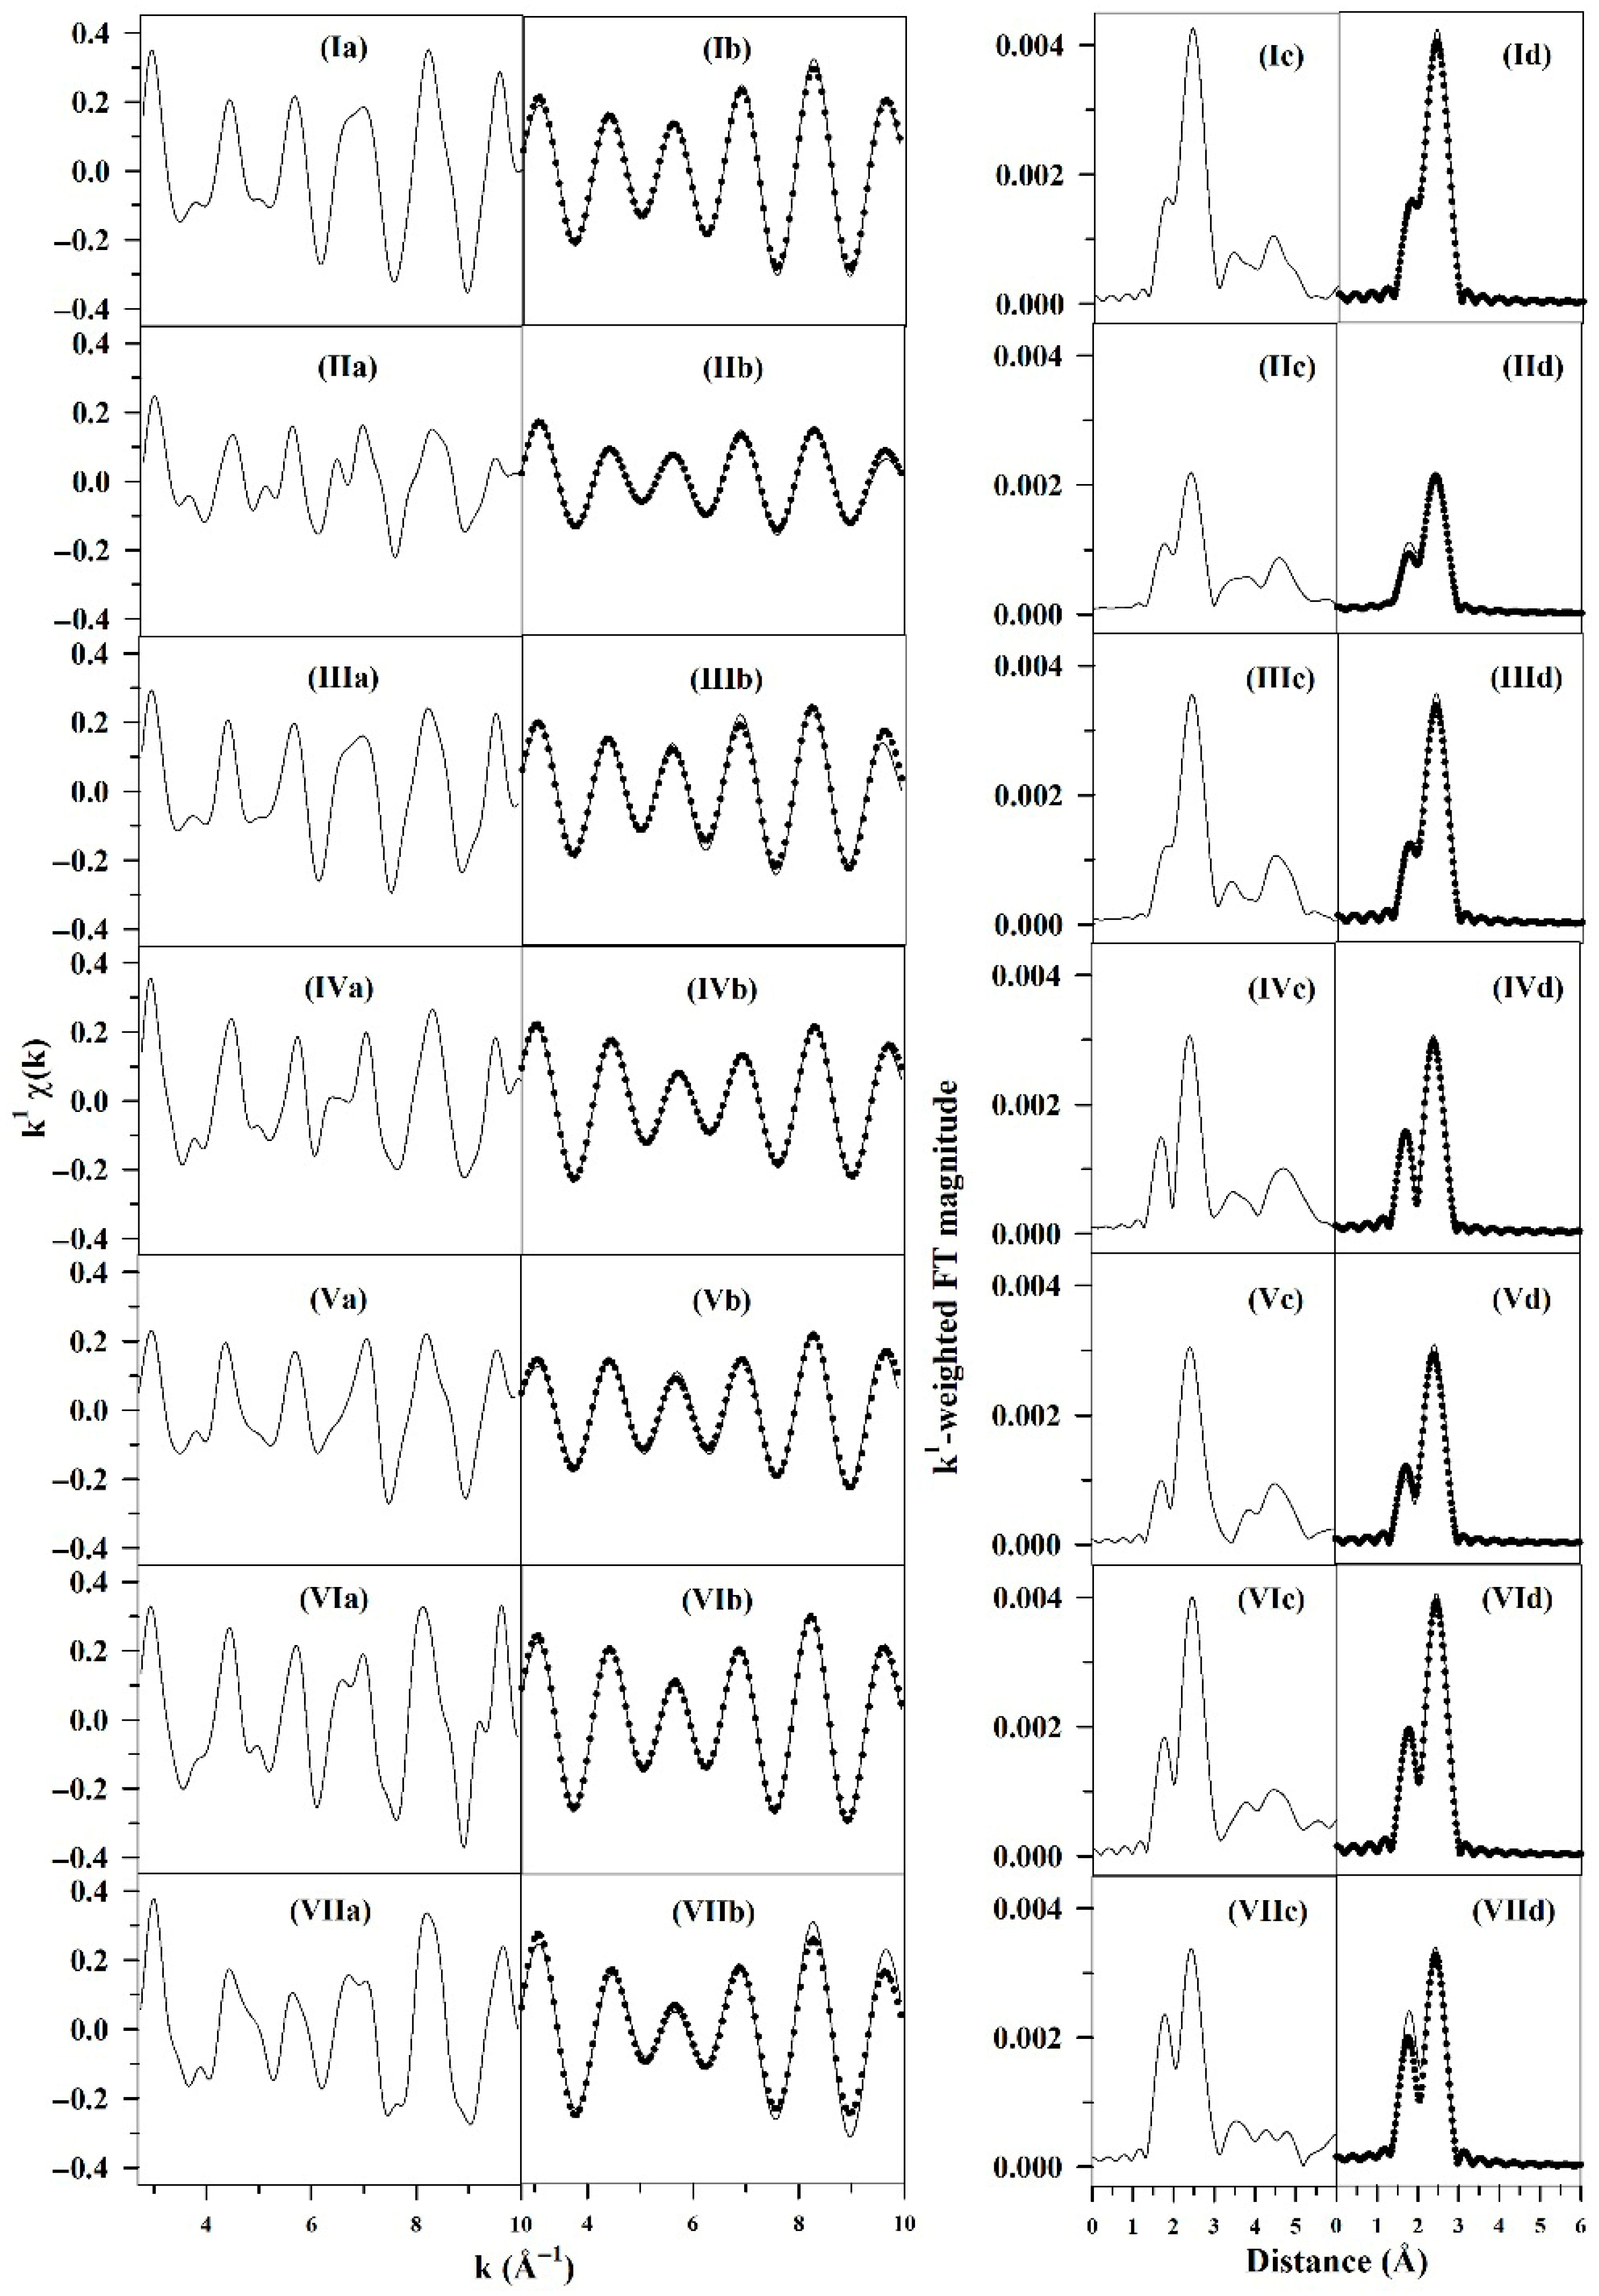
EXAFS fits for the Na-promoted catalysts are reported in
Figure 5 and
Figure S3 and
Table 3 and
Table S1.
Figure 5 and
Table 3 show that catalysts containing ≥1.0 wt.% Na exhibit a small but reproducible long Ru–O coordination at approximately 2.1–2.2 Å, with typical coordination numbers N ≈ 1.0–1.6. Although modest in magnitude, this contribution consistently improves the quality of the fits (specifically, as compared with
Figure S3 and Table S1, where Ru–O coordination was excluded from the fitting model), indicating that it represents a real structural feature rather than a fitting artifact. In contrast, the unpromoted catalyst shows only a contribution of shorter Ru–O interactions with a lower coordination number, and the 0.5 wt.% Na sample does not require a Ru–O path, suggesting that Na loadings of 1 wt.% and above are needed to stabilize this longer Ru–O interaction at the support interface. Because the Ru particle sizes obtained from the EXAFS analysis remain small (0.7–1.0 nm across the series), a significant fraction of Ru atoms reside at the metal–support interface, where changes in oxygen coordination are detectable. The appearance of the long Ru–O feature only at ≥1 wt.% Na is therefore consistent with the Na-induced modification of the interfacial oxygen environment and correlates with the delayed RuO
X → Ru
0 reduction observed in the TPR-XANES and TPR-EXAFS data. For clarity,
Table S1 reports only the first-shell Ru-Ru coordination as a foil-referenced comparison, whereas
Table 3 contains the full Ru-O and Ru-Ru model used for structural interpretation.
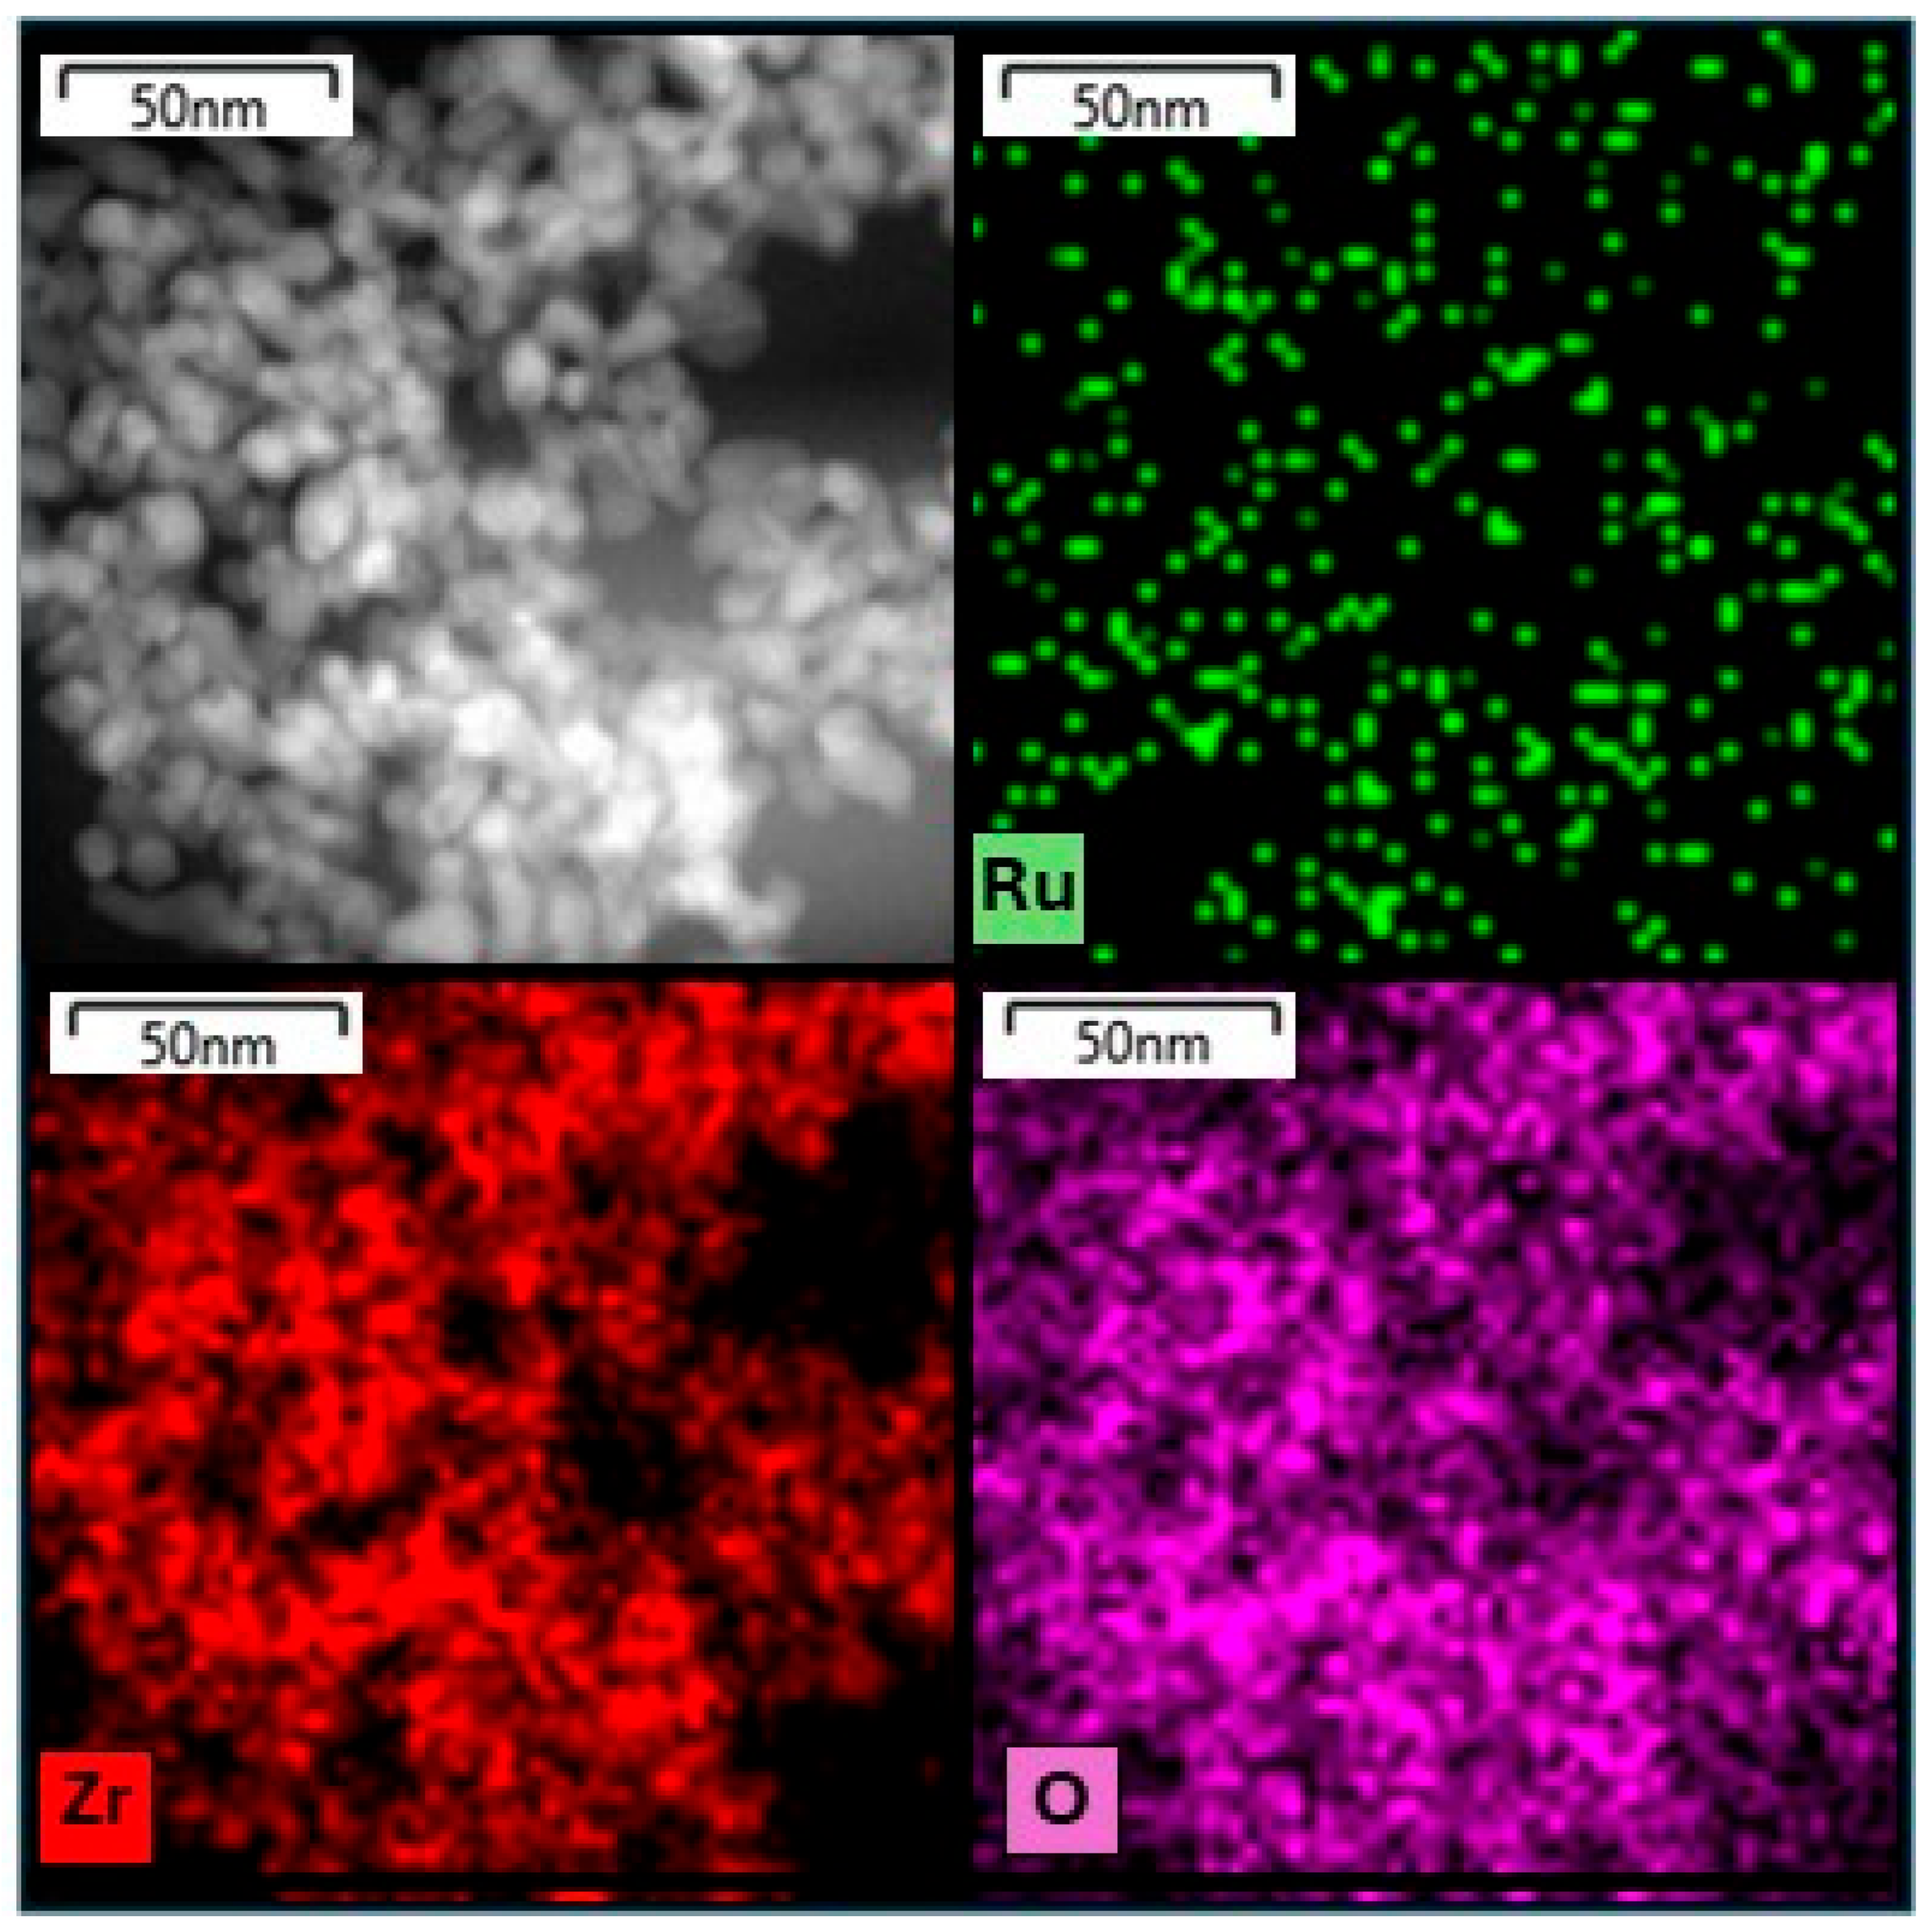
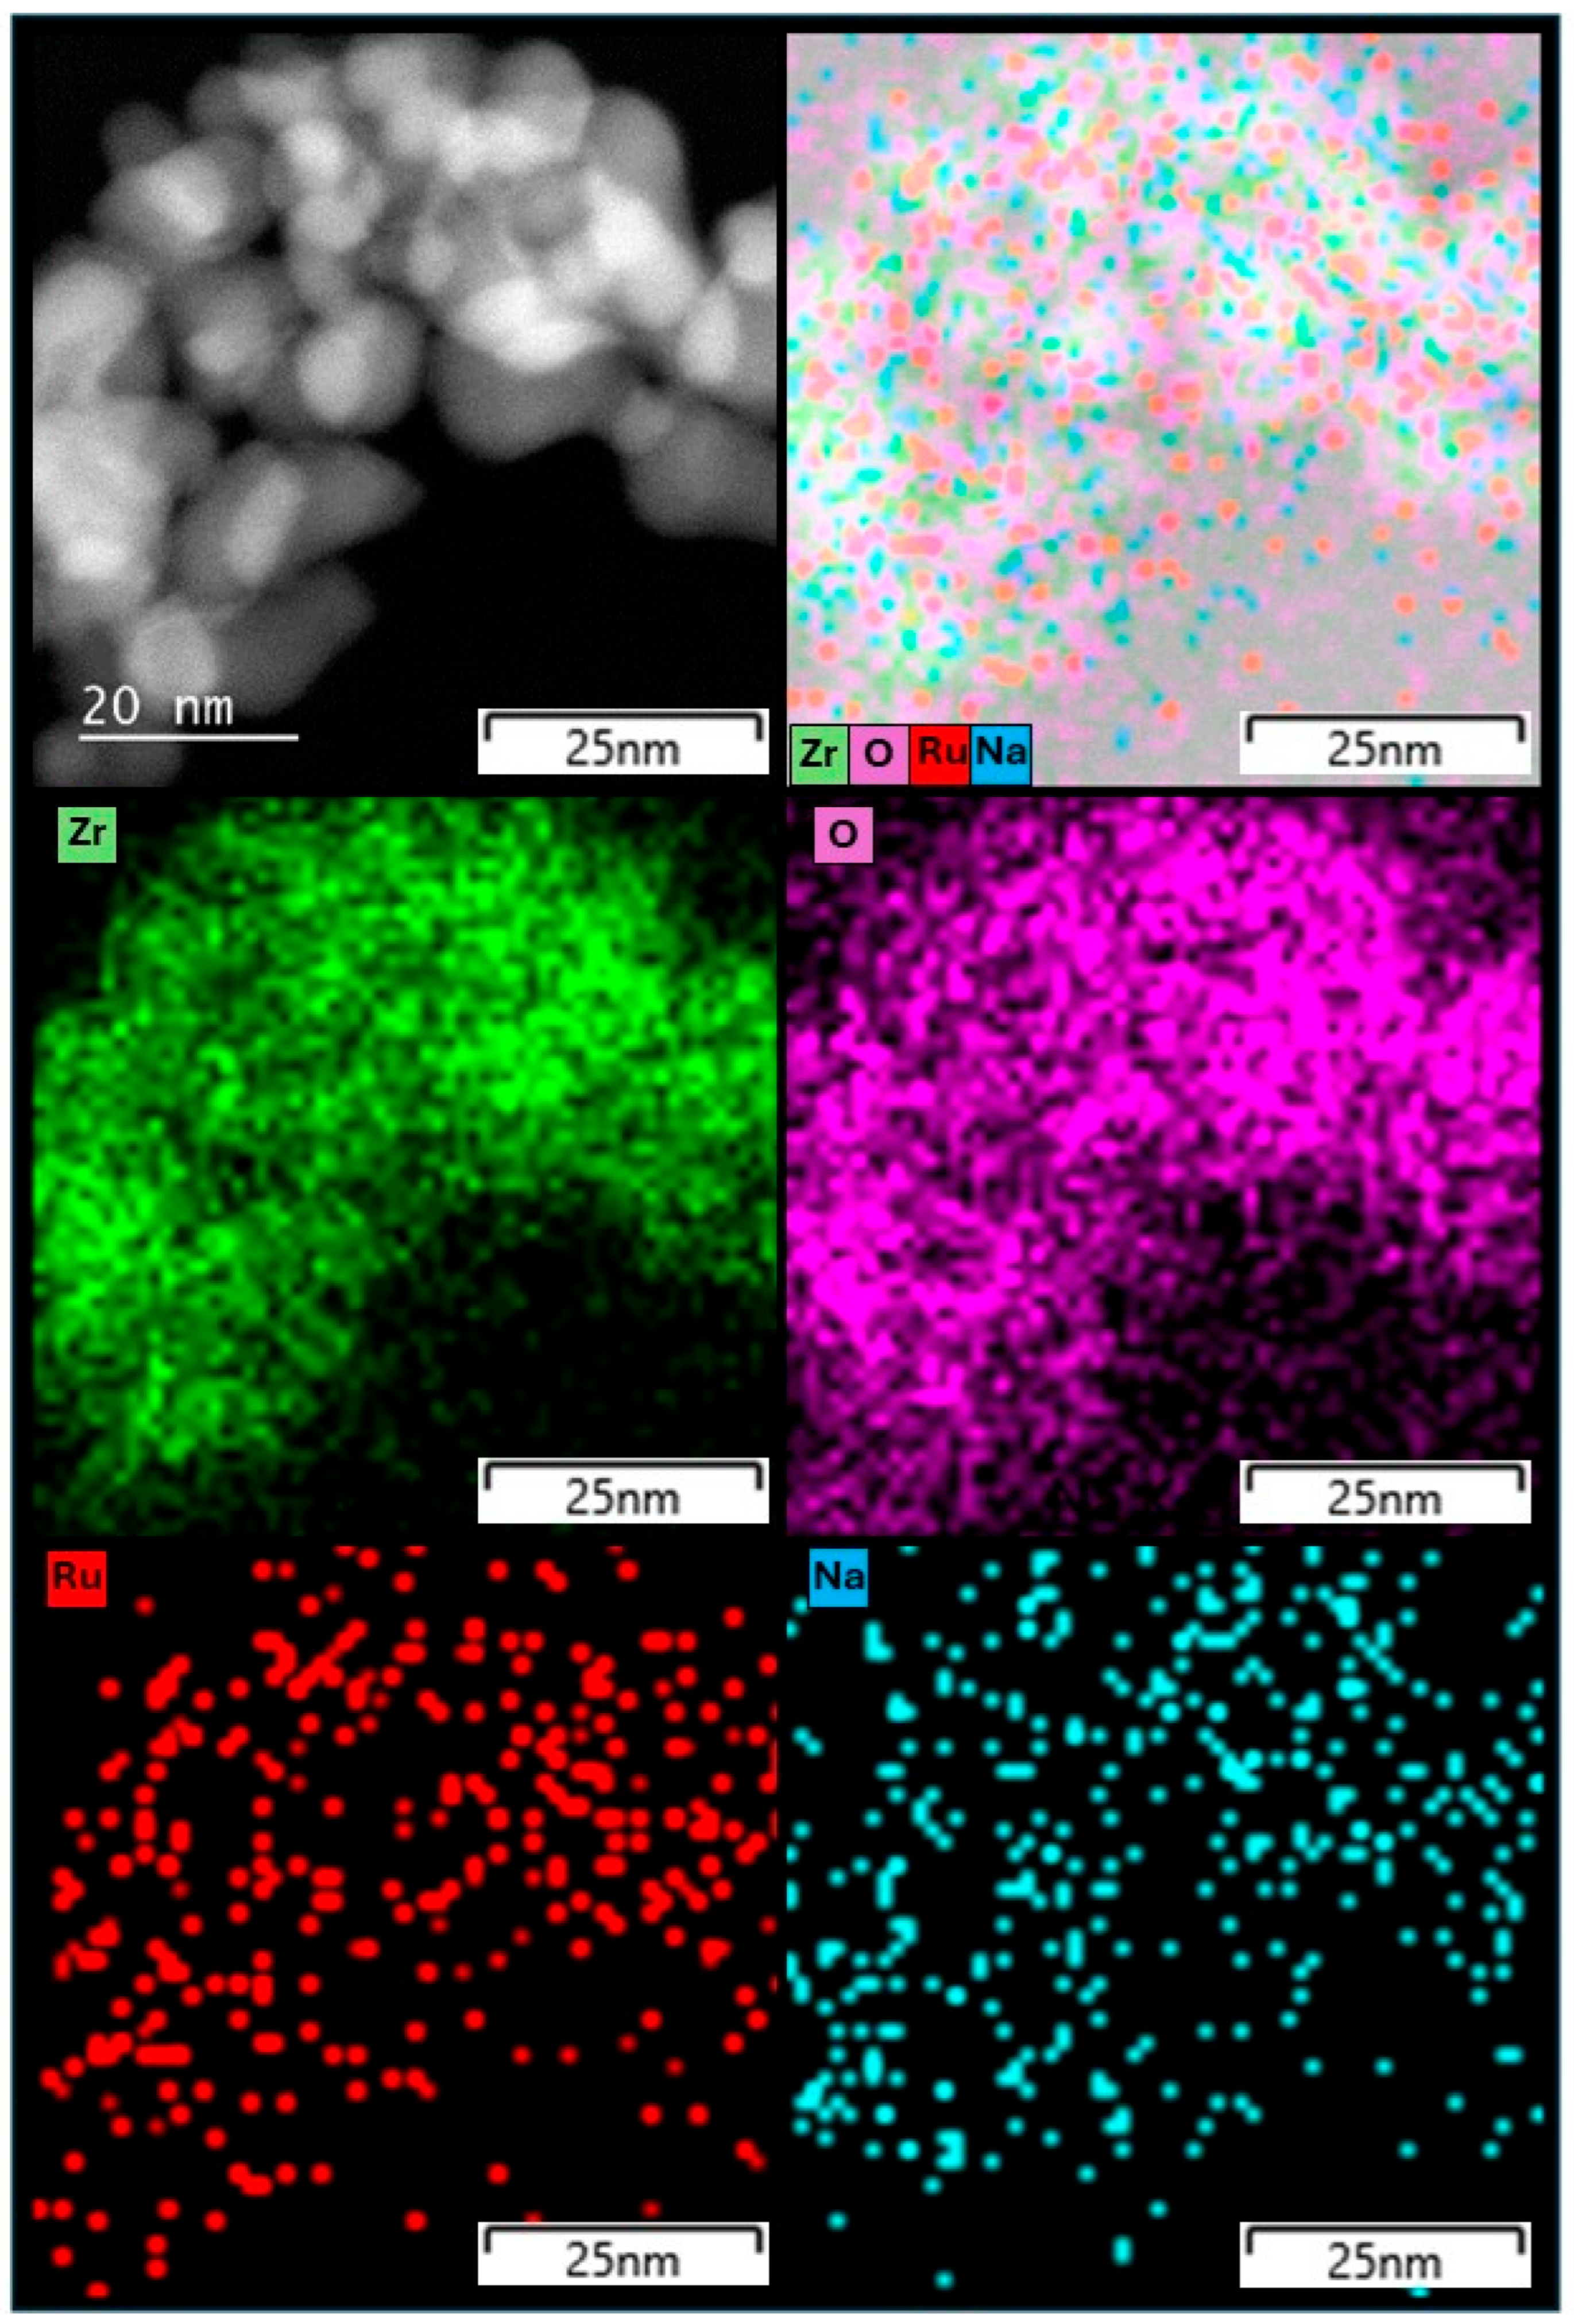
Figure 6 and
Figure 7 present HR-TEM images of the unpromoted 1% Ru/m-ZrO
2 catalyst and the 1.8% Na-promoted counterpart, respectively. Both catalysts exhibit a high dispersion of Ru nanoparticles. For the unpromoted catalyst, the EDX-based particle size analysis shows that approximately 70% of the Ru nanoparticles are ≤1 nm, ~27% fall in the 1–2 nm range, and only 2.7% are between 2 and 3 nm, with the remainder present as larger agglomerates. This high dispersion maximizes the fraction of accessible Ru surface atoms and is therefore expected to enhance catalytic activity on a per-mass basis.
Upon Na addition, the Ru nanoparticles undergo a modest increase in size. For the 1.8% Na-promoted catalyst, ~5% of Ru nanoparticles are ≤1 nm, ~70% lie between 1 and 2 nm, ~17% are between 2 and 3 nm, and ~5% are in the 3–4 nm range, with the remainder forming agglomerates larger than 4 nm. Despite this slight growth, Ru remains highly dispersed. The Na promoter itself is also well distributed, with ~1% of Na species ≤1 nm, ~81% between 1 and 2 nm, ~15% between 2 and 3 nm, and only a small fraction present as larger agglomerates.
Spatial correlation analysis indicates that approximately 40–60% of Na species are co-located with Ru nanoparticles, suggesting a direct interaction between Na and Ru. Such proximity is consistent with the Na-induced modification of the electronic and adsorption properties of Ru, which can influence reaction selectivity. Overall, the TEM/EDX observations are in good agreement with the EXAFS results, confirming highly dispersed Ru nanoparticles and only a minor increase in particle size upon Na promotion.
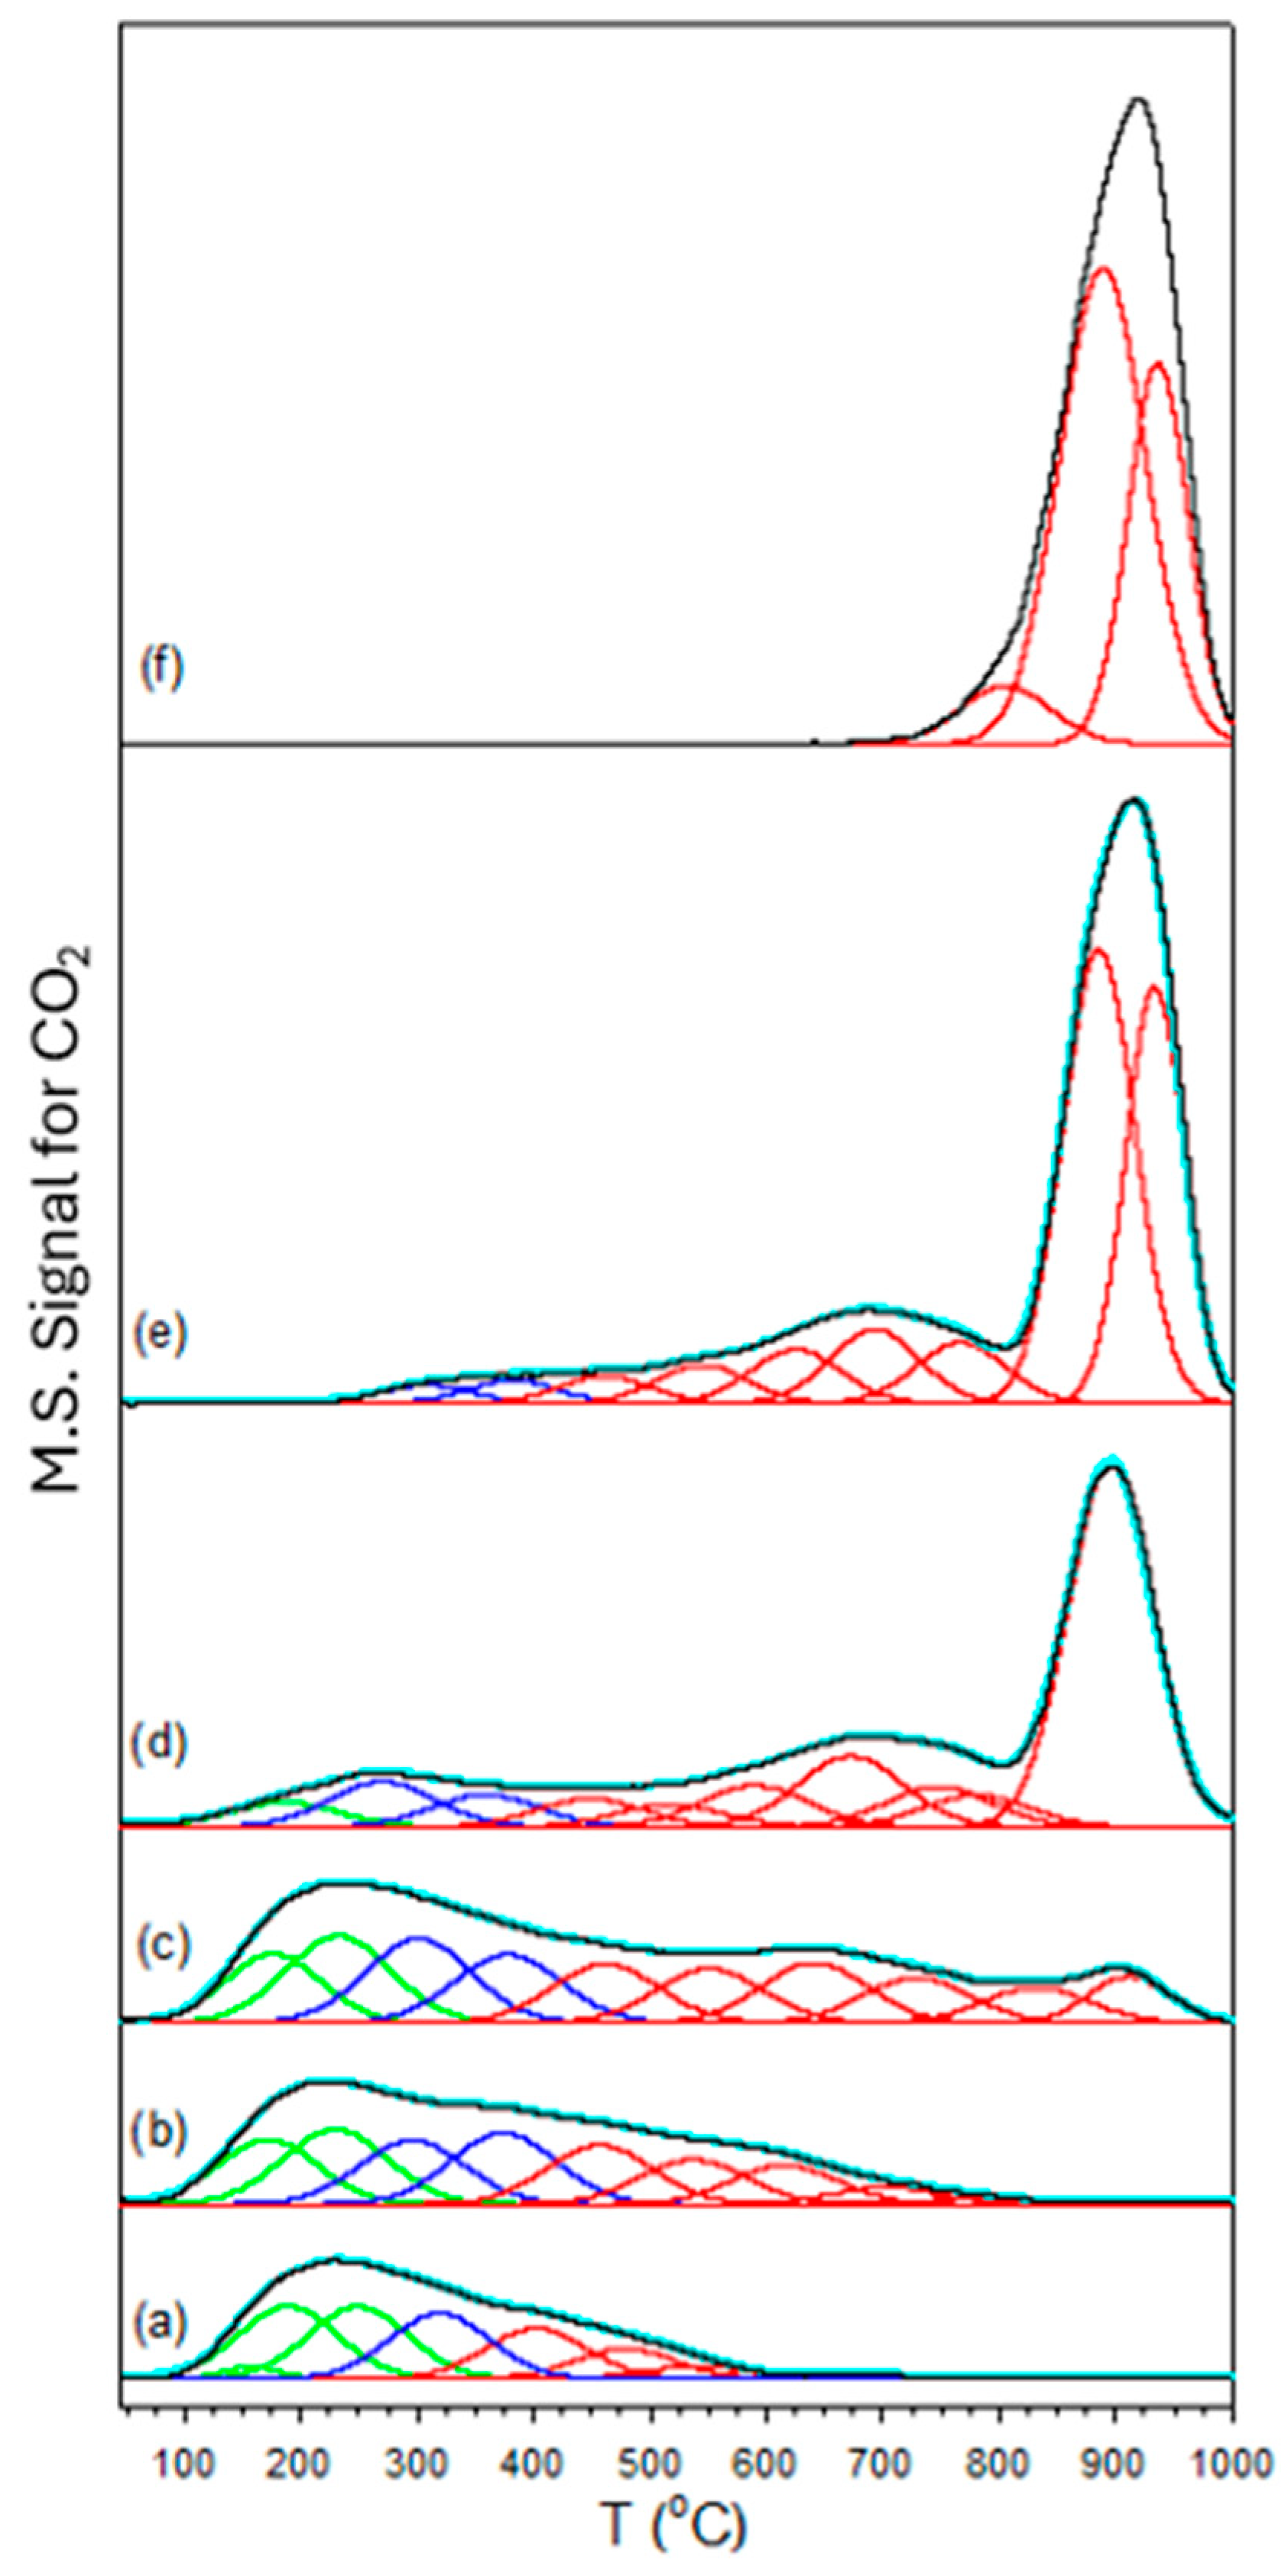
CO
2-TPD profiles (
Figure 8) were used to evaluate changes in surface basicity as Na was added to the Ru/m-ZrO
2 catalysts. Because CO
2 is an acidic probe molecule, stronger basic sites retain CO
2 more strongly, requiring higher temperatures for desorption. The unpromoted 1.0% Ru/m-ZrO
2 catalyst exhibits a broad distribution of basic sites, with nearly 48% of the CO
2 desorbing below 250 °C, 21% between 250 and 400 °C, and 31% above 400 °C (
Table 4). Upon adding Na, these proportions shift systematically toward higher temperatures. For example, at 0.5% Na, the low-temperature contribution drops to 31%, while high-temperature desorption increases to 38%, indicating that Na already strengthens a substantial fraction of basic sites. With 1.0% Na, the trend intensifies: only 25% of CO
2 desorbs below 250 °C, and nearly 49% desorbs above 400 °C. The shift becomes especially pronounced at 1.8% Na, where the low-temperature peak is almost completely eliminated (4%), and more than 83% of CO
2 desorbs above 400 °C. At even higher promoter levels (2.5% and 5.0% Na), the low- and mid-temperature features fall below the detection limits, and the desorption occurs exclusively at temperatures greater than 400 °C, with 96–100% of CO
2 released at the highest temperature range. This disappearance of low- and medium-strength basic sites indicates that at higher Na loadings, nearly all surface oxygen sites are converted into stronger carbonate-binding environments, consistent with the increased basicity inferred from DRIFTS and EXAFS. These changes are directly reflected in the shapes of the CO
2-TPD profiles in
Figure 8, where the emergence and growth of the high-temperature peak dominate the spectra as Na loading increases. Together, the disappearance of low-temperature desorption and the strong growth of the high-temperature component demonstrate a clear, monotonic increase in catalyst basicity with Na addition. This is consistent with Na introducing or strengthening basic oxygen sites on the surface, resulting in progressively stronger CO
2 binding as the promoter concentration increases.
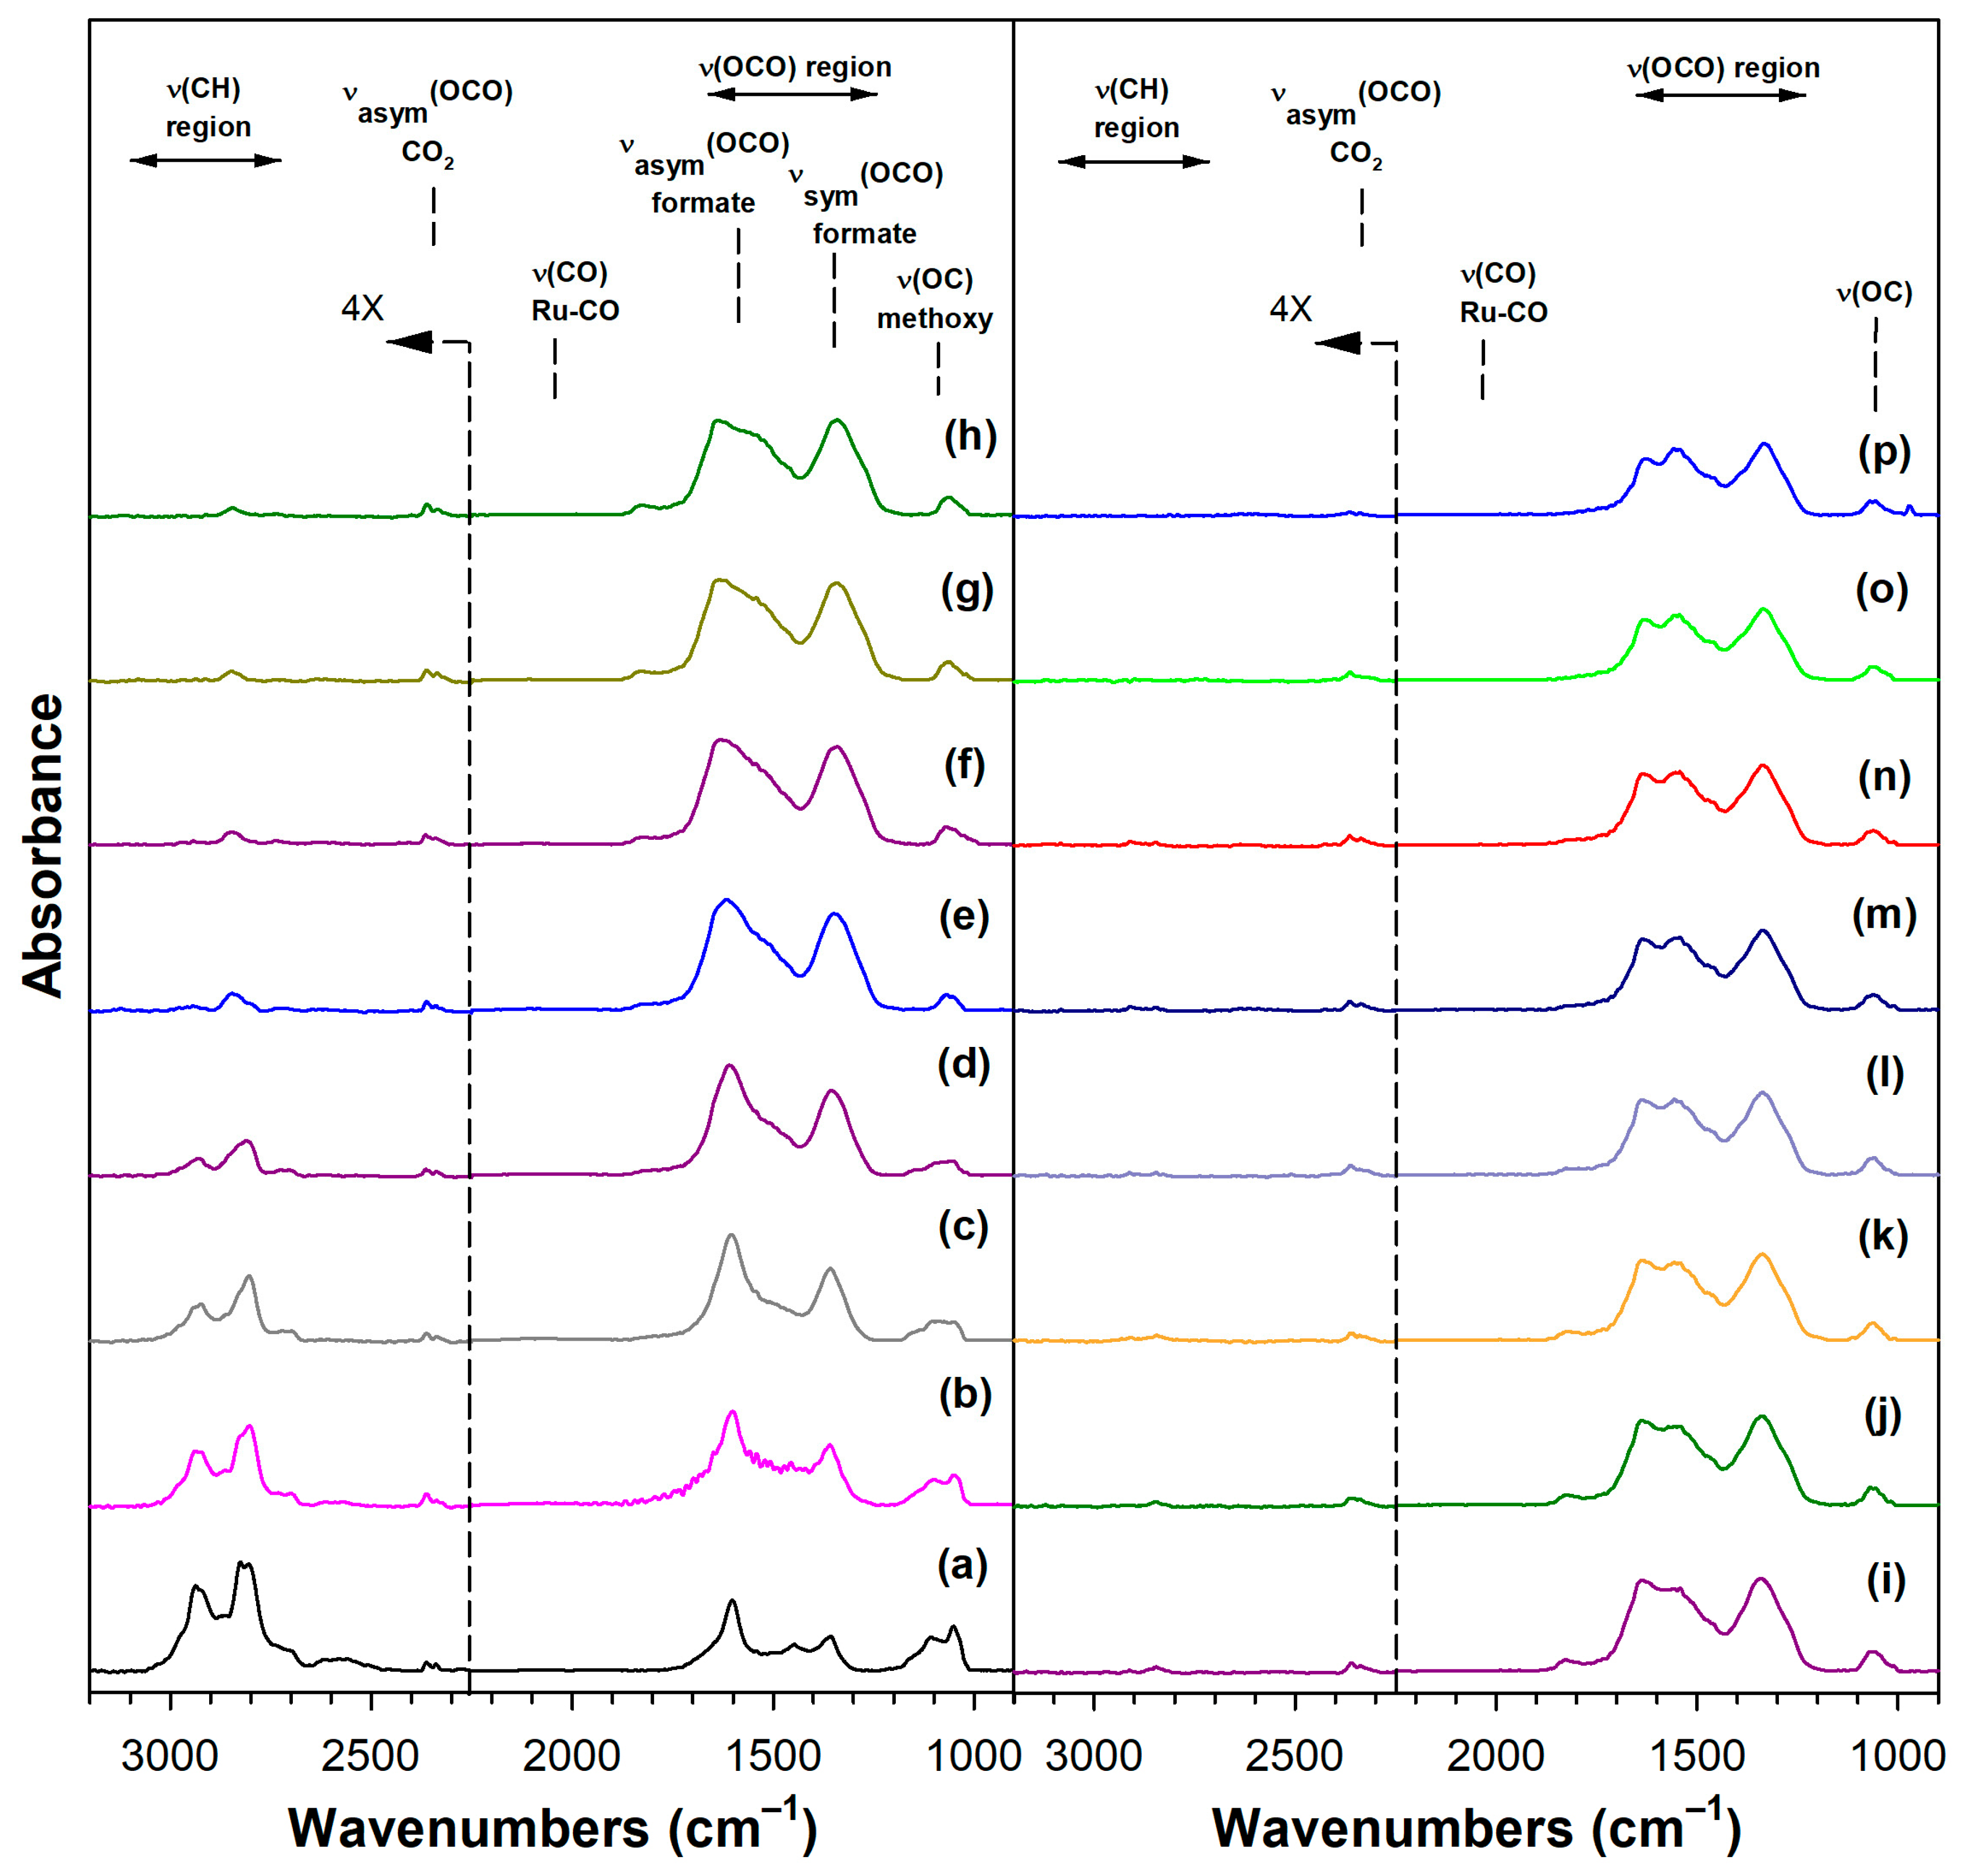
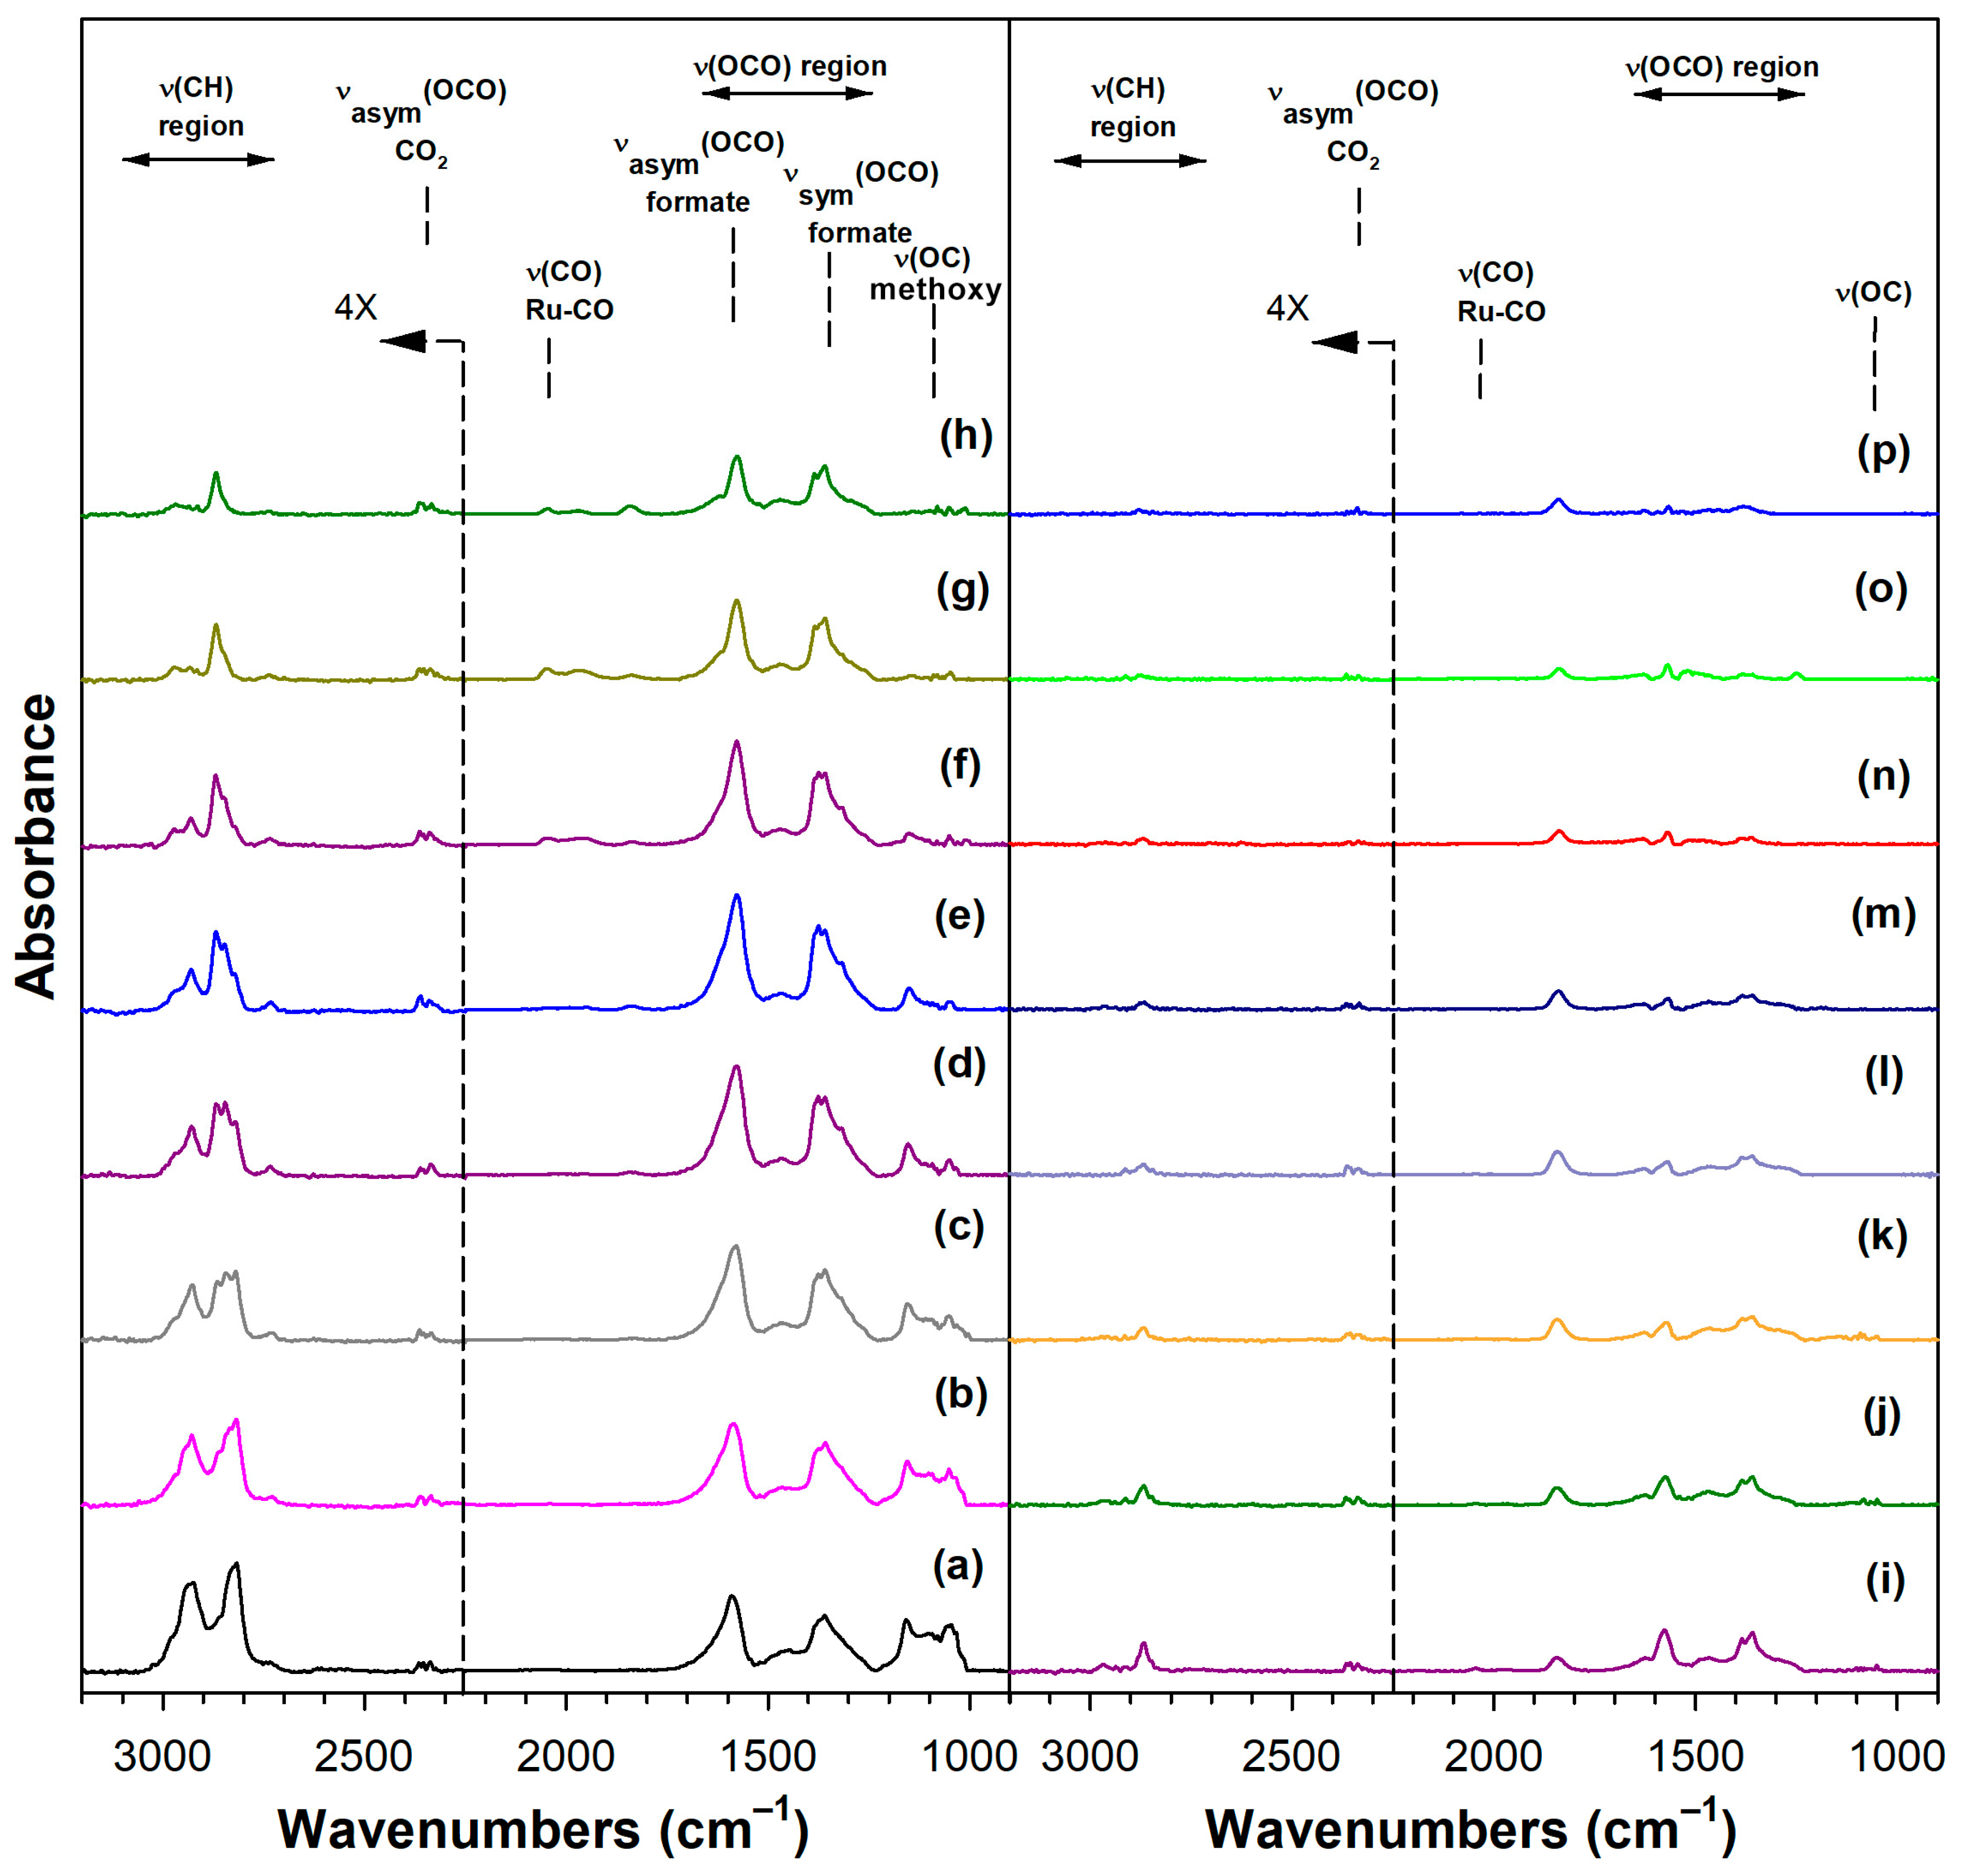
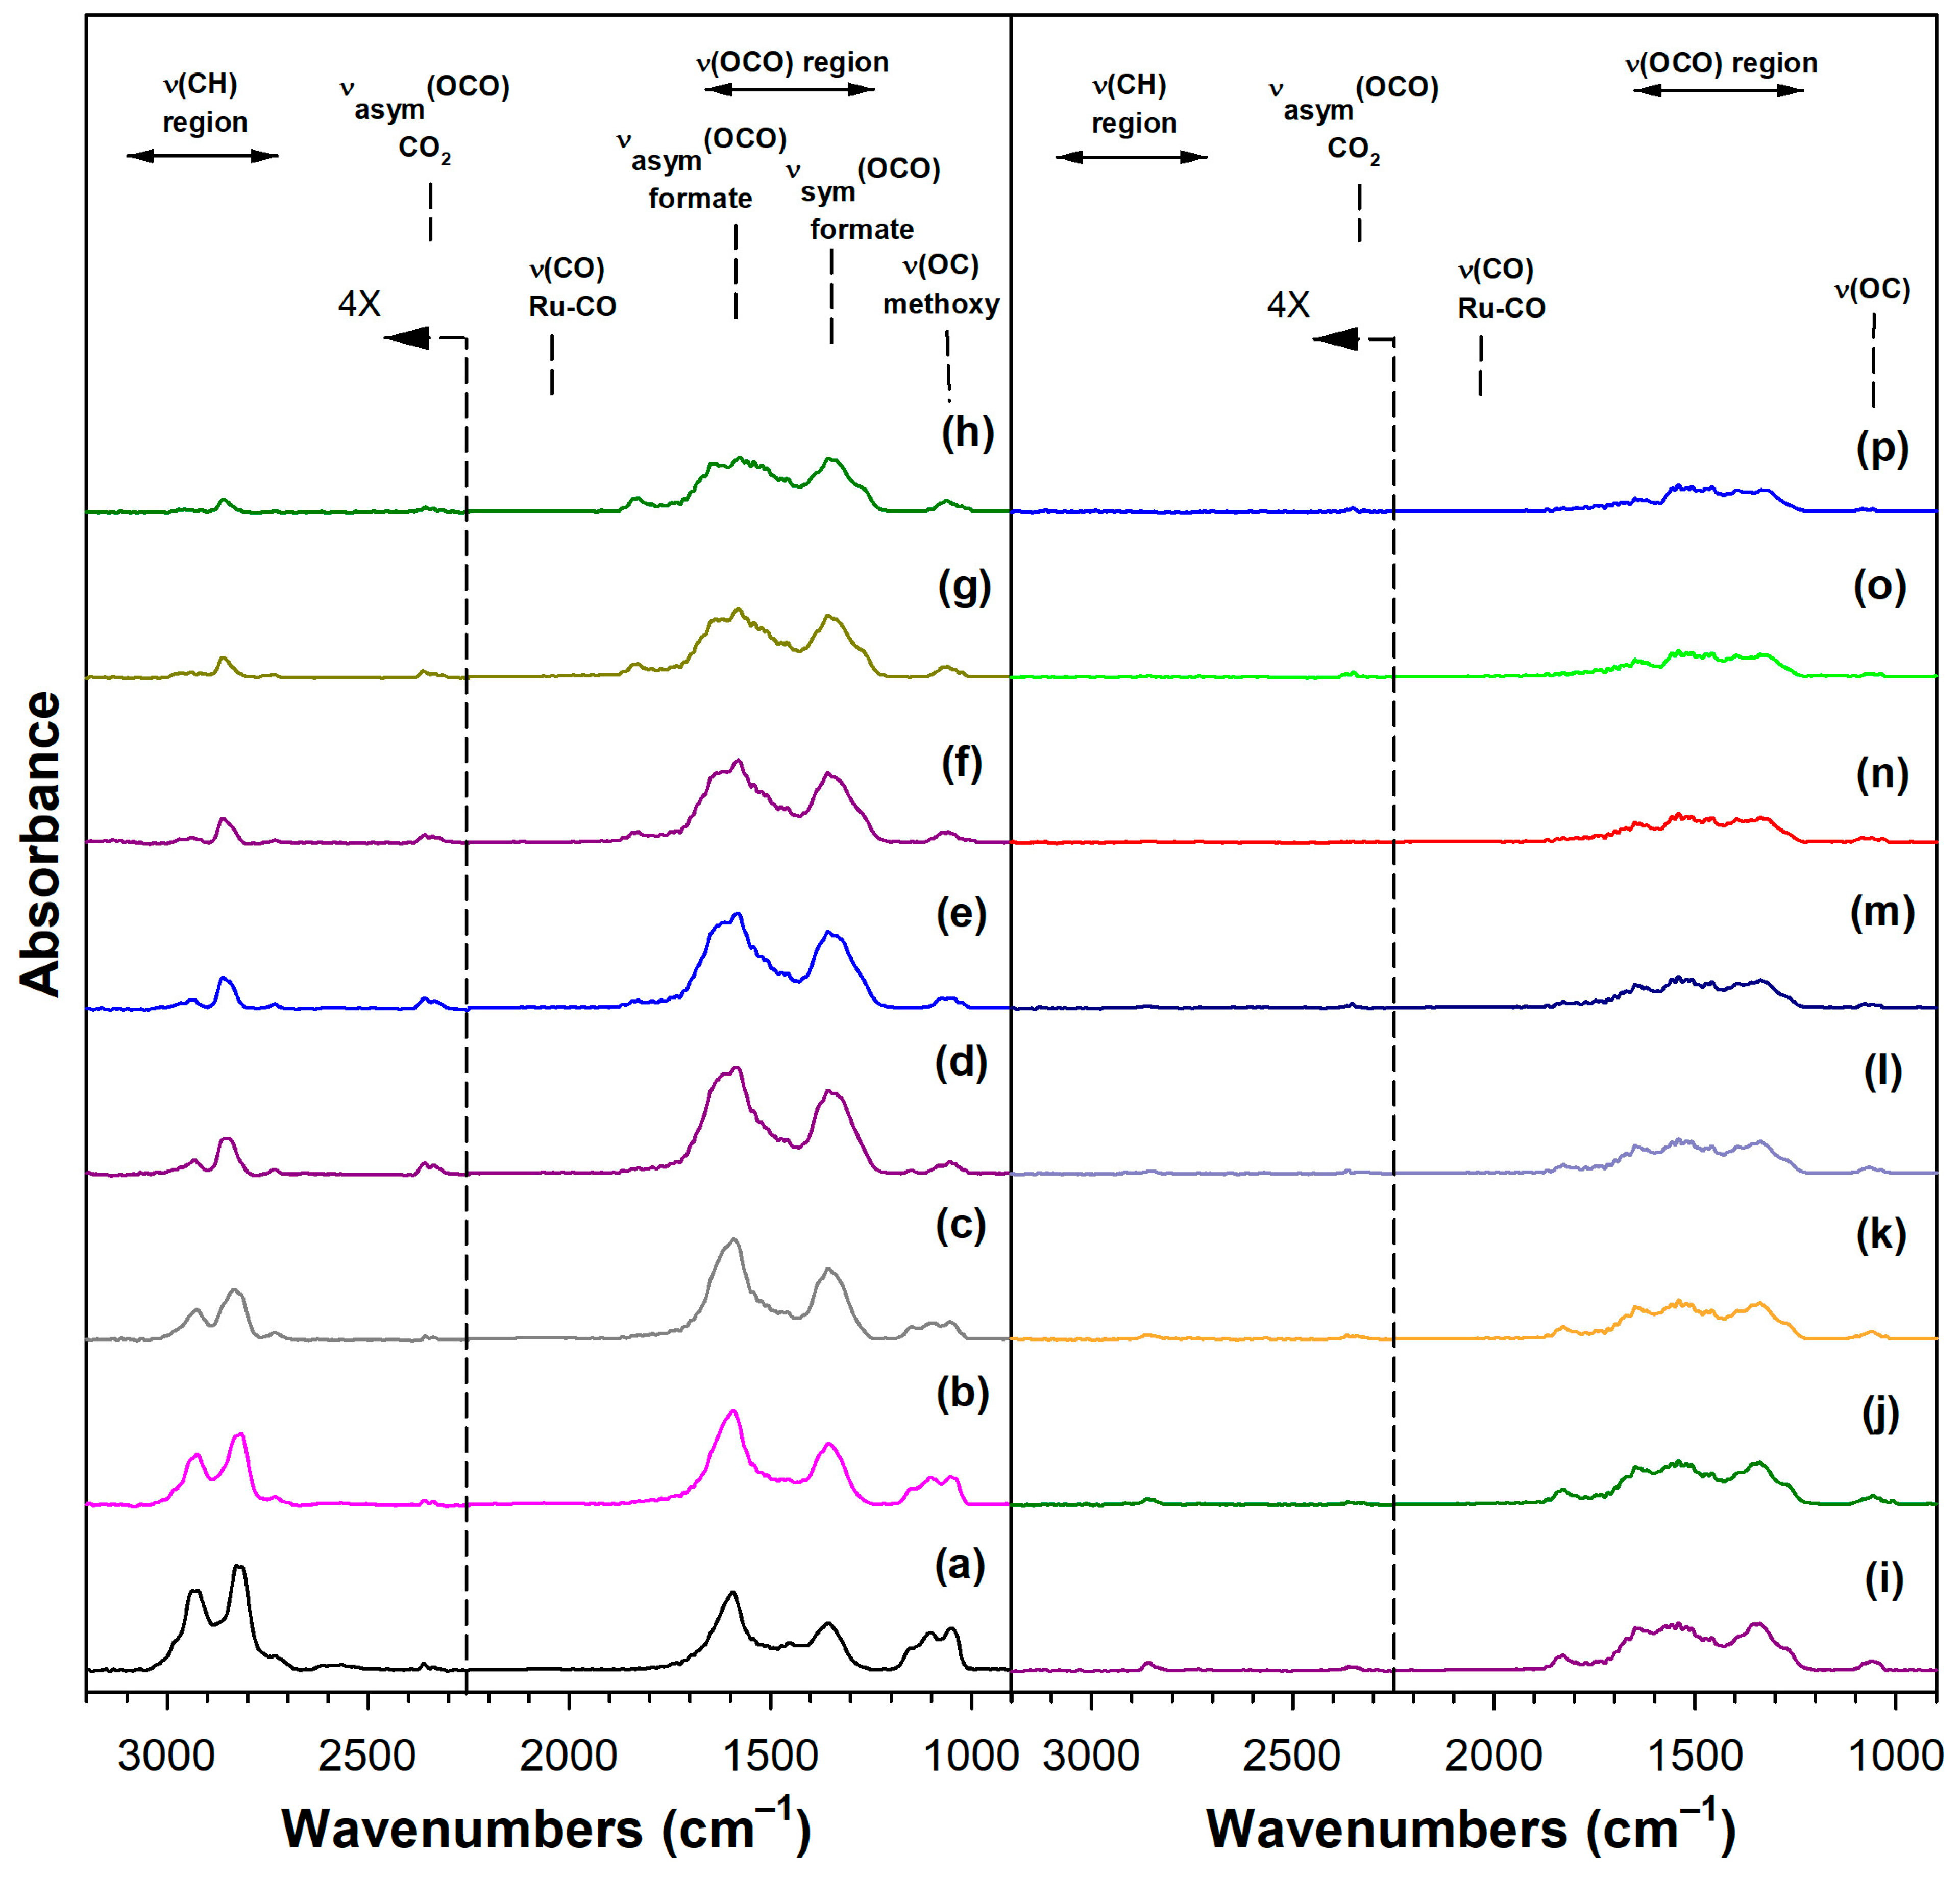
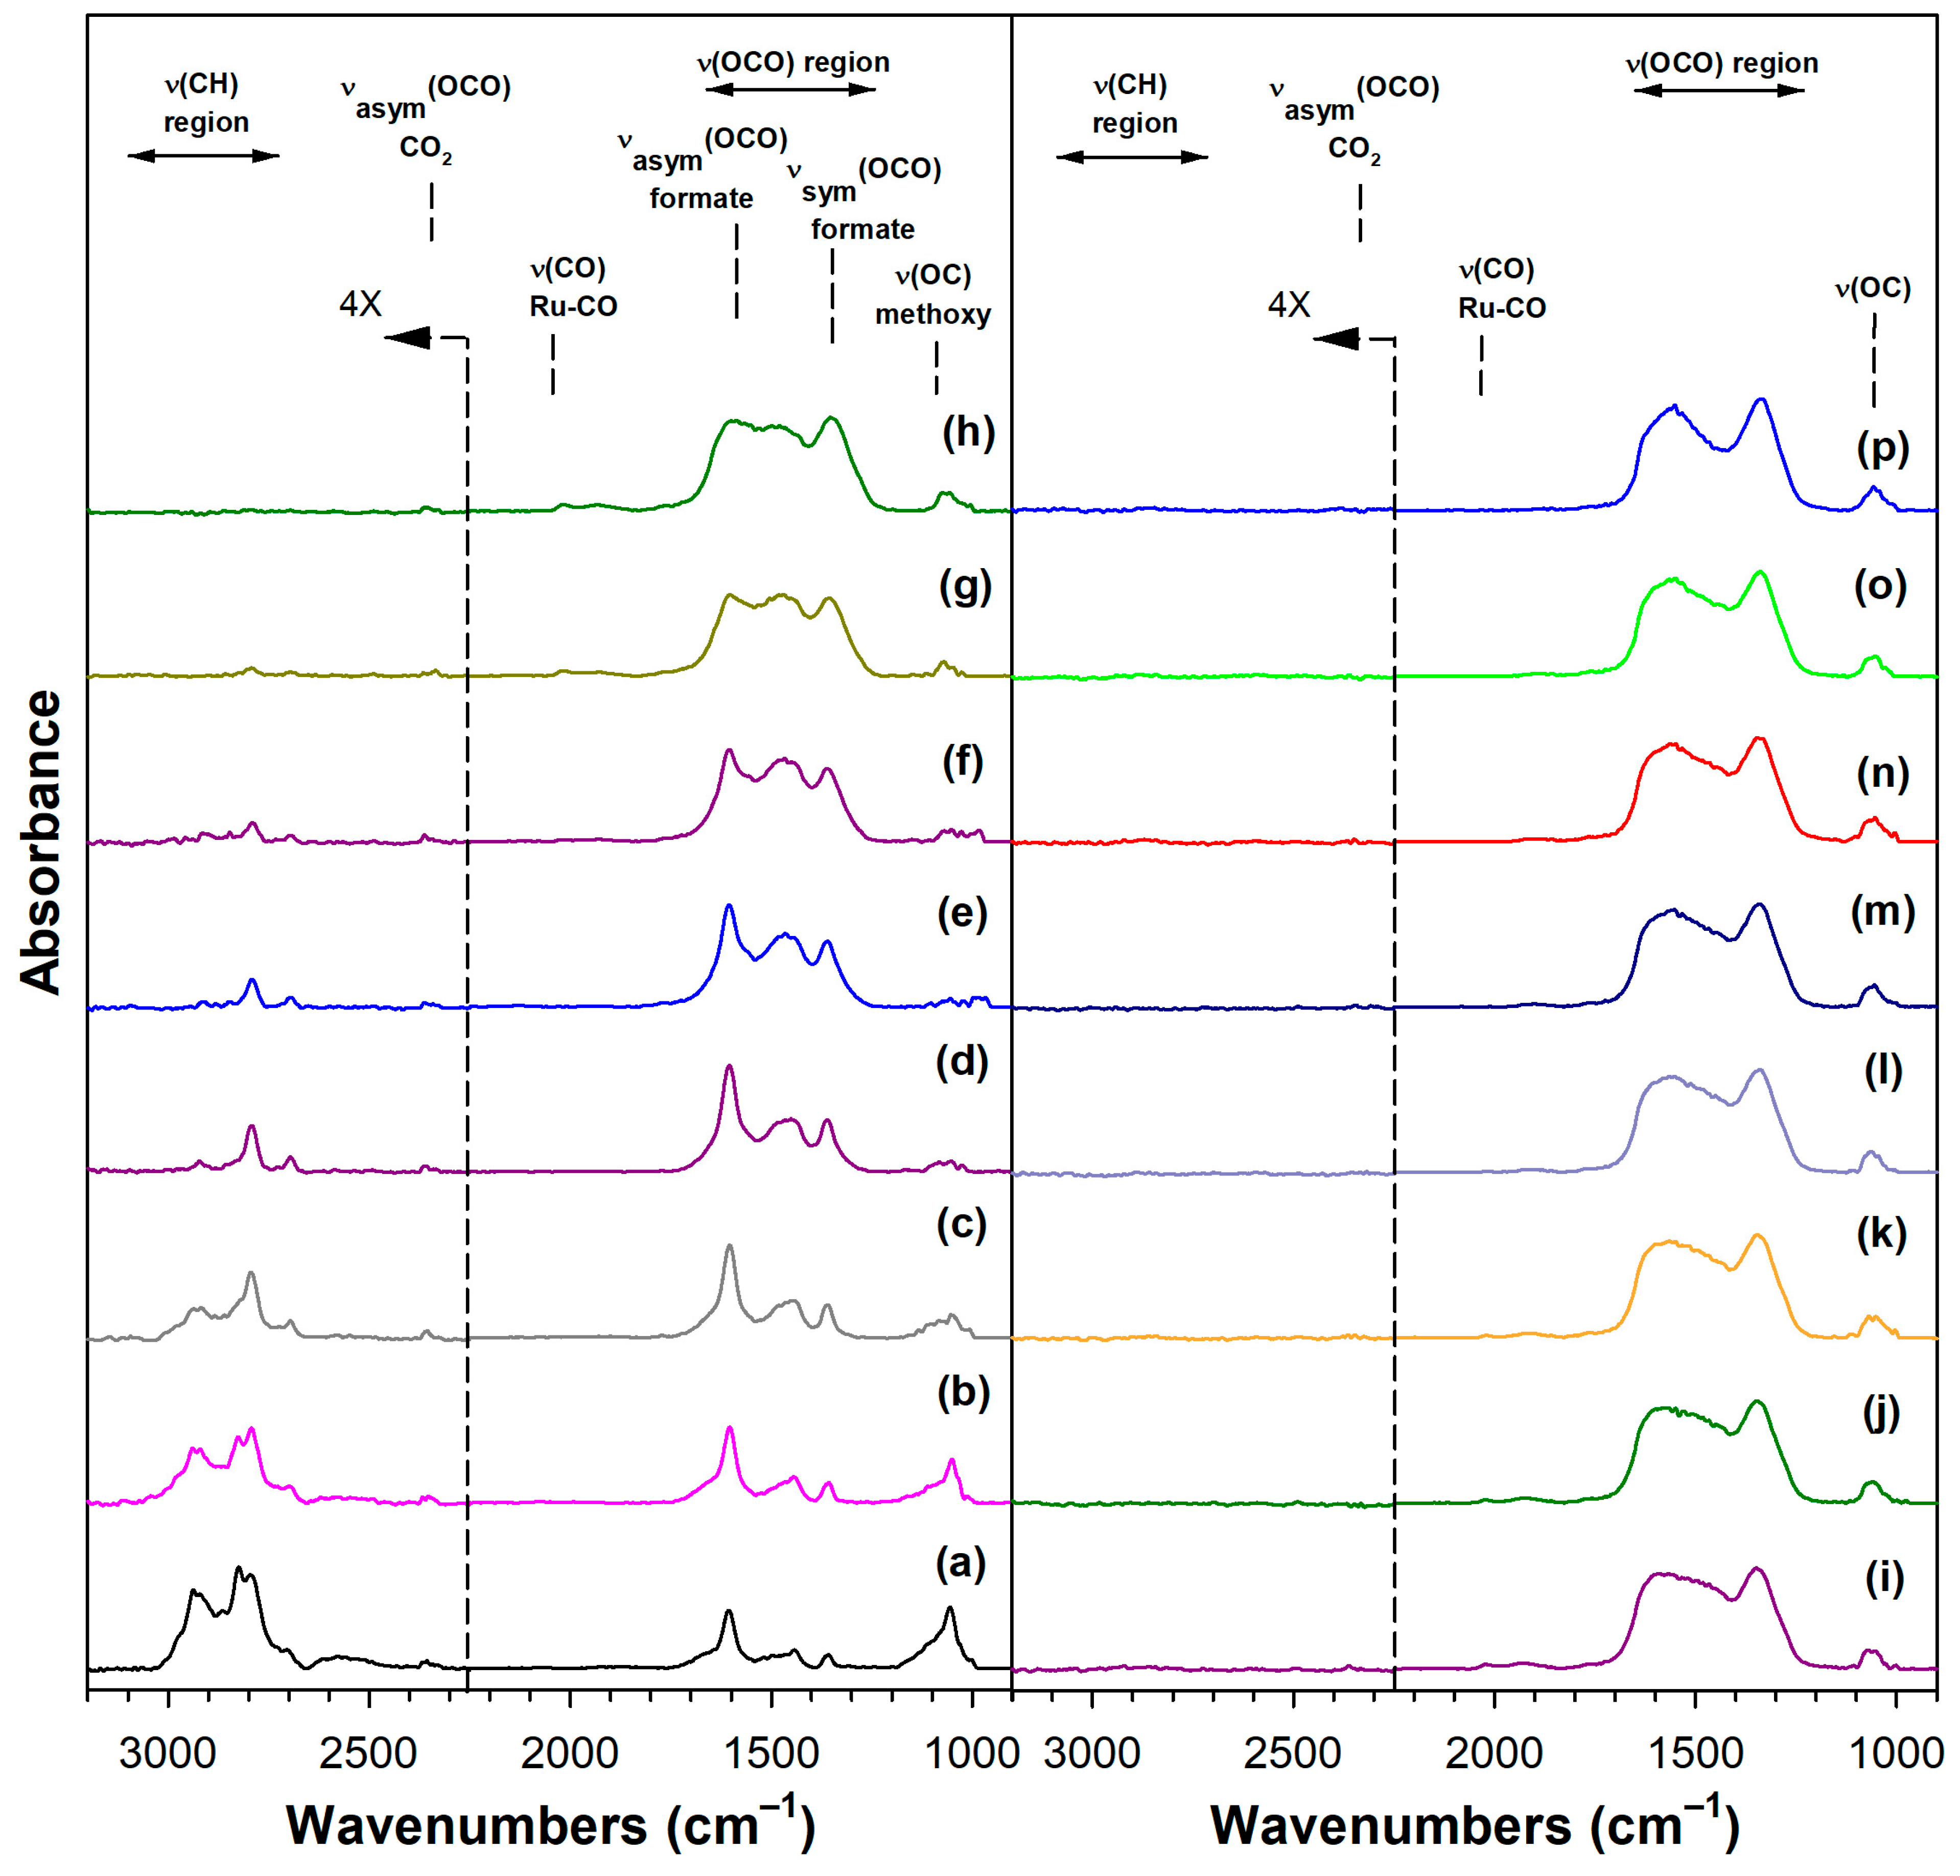
Diffuse reflectance infrared Fourier transform spectroscopy (DRIFTS) during temperature-stepped methanol steam reforming provides insights into the evolution of surface intermediates and how the Na modification alters catalyst behavior. At 50 °C, the spectra for all catalysts (
Figure 9,
Figure 10,
Figure 11 and
Figure 12) are dominated by methoxy species formed by the dissociative adsorption of methanol on reduced sites of m-ZrO
2. The methoxy ν(OC) vibrations appear in the 1000–1200 cm
−1 region, and the ν(CH) modes are observed between 2800 and 3000 cm
−1. Even at this initial temperature, however, significant formate species are already present on the surface, as indicated by ν
asym(OCO) bands in the 1500–1650 cm
−1 region and ν
sym(OCO) bands in the 1300–1400 cm
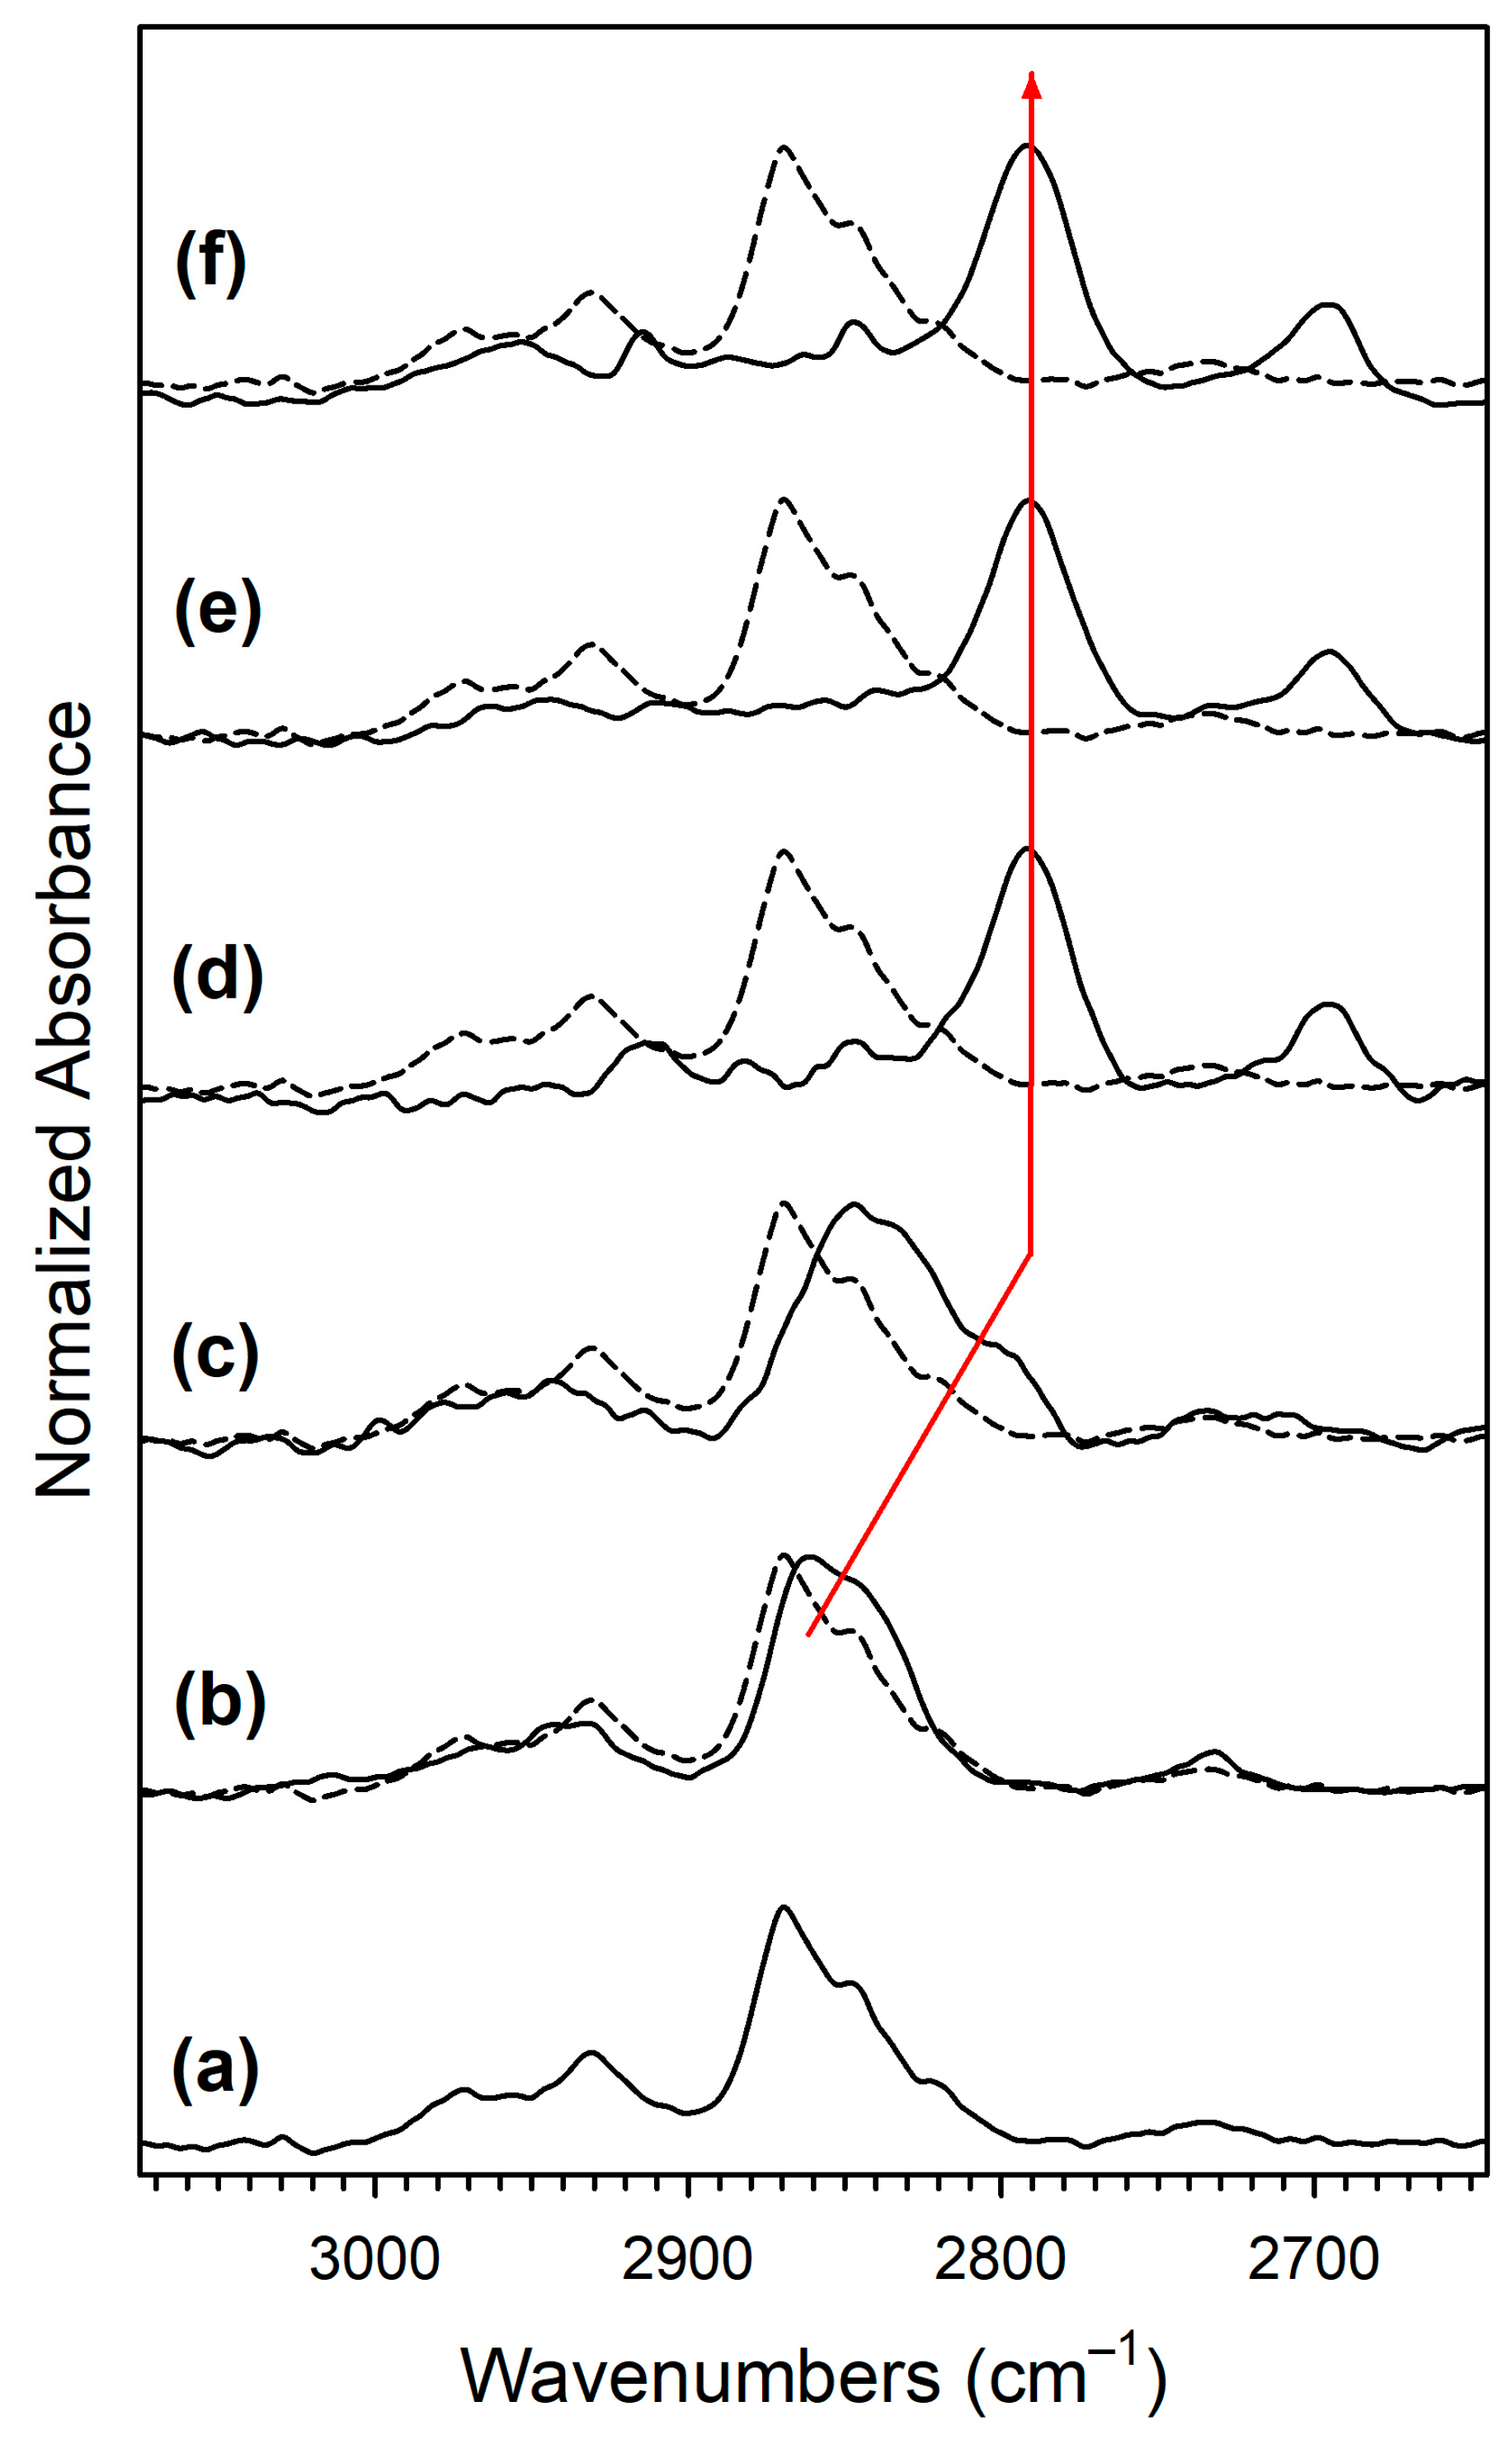
−1 region. As the temperature increases, the methoxy features decrease and the formate-related bands intensify, indicating the progressive conversion of methoxy to formate. The formate ν(CH) vibration appears in the ~2850–2900 cm
−1 region and is clearly resolved in
Figure 13.
Table 5 summarizes the band positions of the key formate vibrational modes for each catalyst. The unpromoted 1.0% Ru/m-ZrO
2 sample displays a main formate ν(CH) band at 2870 cm
−1, whereas the addition of Na causes this band to shift to lower wavenumbers. At 0.5% Na, the ν(CH) band moves to 2864 cm
−1, and at 1.0% Na, it shifts further to 2850 cm
−1. At higher promoter loadings (1.8–5.0% Na), the ν(CH) band appears near 2790–2792 cm
−1. The consistent red shift of this feature reflects the progressive destabilization of the formate C–H bond. This behavior is consistent with increased surface basicity, wherein Na strengthens the interaction between surface oxygen sites and the OCO moiety, leading to increased perturbation of the C–H bond and a corresponding decrease in vibrational frequency.
Further evidence of changing surface basicity is found in the splitting of the ν
asym(OCO) and ν
sym(OCO) formate bands. For the unpromoted catalyst, the split is 203 cm
−1. With Na addition, this increases, reaching 225 cm
−1 at 0.5% Na and a maximum of 268 cm
−1 at 1.0% Na, consistent with stronger perturbation of the OCO group due to increased basicity. At higher Na loadings (1.8–5.0%), however, splitting decreases slightly to Δ = 245–247 cm
−1. This subtle decrease correlates with the increasing intensity of carbonate-related bands at elevated temperatures in
Figure 9,
Figure 10,
Figure 11 and
Figure 12 and in the supplementary spectra (
Figures S4 and S5). Highly basic surfaces promote the formation of polydentate carbonate species, which exhibit more delocalized O–C–O bonding and correspondingly smaller ν
asym–ν
sym separations compared to bidentate formates. Accordingly, the reduced band splitting at higher Na contents suggests a relative increase in multidentate carbonate-like species at the expense of bidentate formate on increasingly basic Na-modified surfaces.
As temperature increases above roughly 100 °C, the formate intermediates begin to decompose into carbonate species, which are precursors to CO
2 evolution. Carbonate features grow in the 1400–1700 cm
−1 region, and their earlier appearance and increasing prominence with Na loading indicate that Na accelerates formate decomposition.
Figure 9,
Figure 10,
Figure 11 and
Figure 12 show that formate bands decrease more rapidly with temperature as the Na concentration increases, consistent with the weakened formate C–H bond inferred from the ν(CH) shifts. By 400 °C, He purging (panels “p” in each figure) reveals residual surface carbonates characteristic of m-ZrO
2, although their persistence and intensity vary with the Na content. Overall, the DRIFTS results show that Na promotion increases surface basicity, modifies the vibrational signatures of formate and carbonate intermediates, and accelerates formate decomposition during methanol steam reforming.
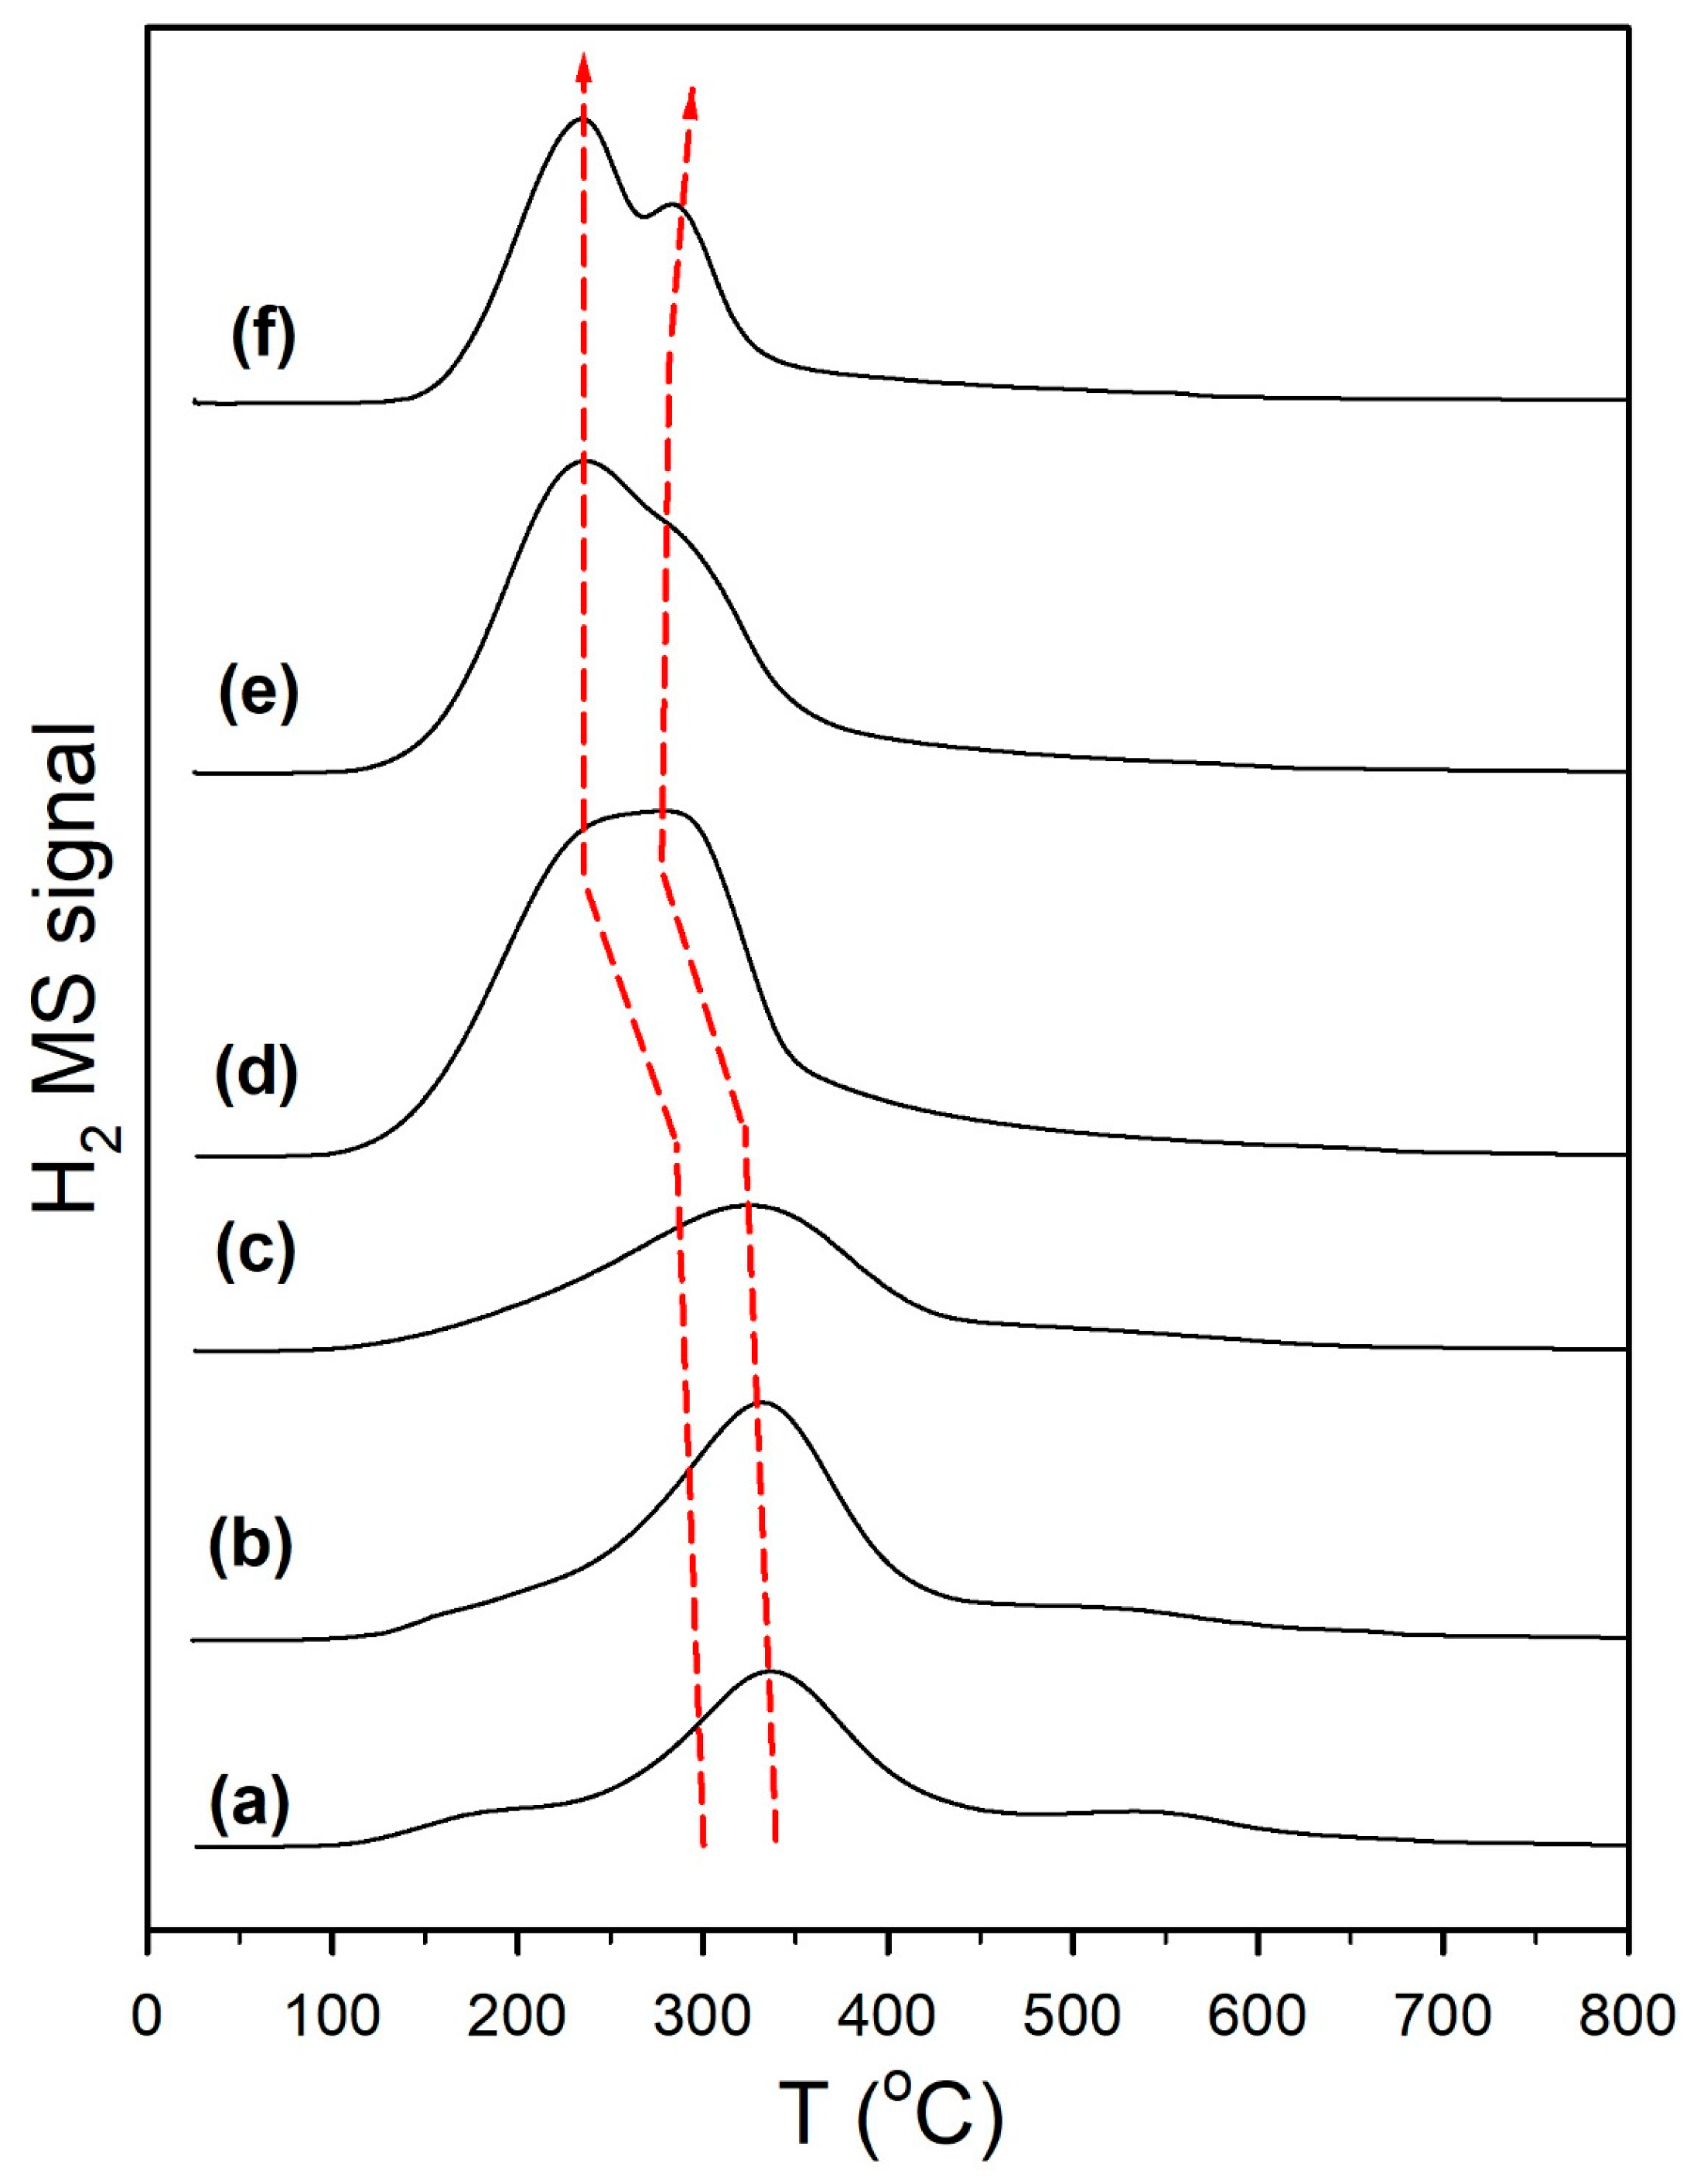
Figure 14 shows the temperature-programmed evolution of H
2 during methanol steam reforming from pre-adsorbed CH
3OH and H
2O. For the unpromoted 1.0% Ru/m-ZrO
2 catalyst, H
2 evolution begins at a moderate temperature and reaches its maximum at ~300–325 °C. With Na addition, however, the onset of H
2 release shifts to lower temperatures, and the total H
2 signal increases. As the Na loading increases, this shift becomes more pronounced, with the most heavily promoted catalysts exhibiting earlier and higher H
2 evolution peaks.
This behavior reflects Na-induced changes in the decomposition pathways of surface formate species. On the unpromoted catalyst, formate decomposition proceeds through a mixture of decarbonylation/dehydration pathways (–H + –OOCH → CO + H
2O), which do not release H
2, and decarboxylation/dehydrogenation pathways (–H + –OOCH → CO
2 + H
2), which do release H
2. Adding Na increases the basicity of the catalyst surface, strengthening the interaction of the formate OCO fragment with nearby oxygen sites. As supported by the DRIFTS data (
Figure 9,
Figure 10,
Figure 11,
Figure 12 and
Figure 13,
Figures S4 and S5, and
Table 5), increased basicity weakens the formate C–H bond and biases formate decomposition toward the dehydrogenation/decarboxylation pathway.
As a result, the Na-promoted catalysts produce more H
2 and do so at lower temperatures, consistent with the earlier loss of formate bands in DRIFTS spectra and the increased ν(CH) red-shifts associated with C–H bond weakening. At higher Na loadings, the effect is stronger, with the H
2 evolution peak shifting steadily to lower temperatures and increasing in intensity, matching the trend highlighted by the dashed red guides in
Figure 14. This earlier onset of H
2 evolution aligns with the DRIFTS-observed weakening of the formate C–H bond (
Figure 13), confirming that Na enhances the dehydrogenation/decarboxylation route. This shift in formate reaction selectivity is important for methanol utilization as a hydrogen-carrying liquid. By redirecting formate decomposition toward pathways that release H
2 and suppress pathways that yield CO, Na-promoted catalysts can increase the hydrogen yield from methanol and could be beneficial for applications such as feeding H
2 to proton exchange membrane (PEM) fuel cells.
Catalytic methanol steam reforming (MSR) performance was evaluated at 1 atm using a 1:1 CH
3OH:H
2O feed under identical space velocities (GHSV = 38,100 h
−1 for the Ru catalysts), with selectivities reported on a %C basis (
Table 6 and
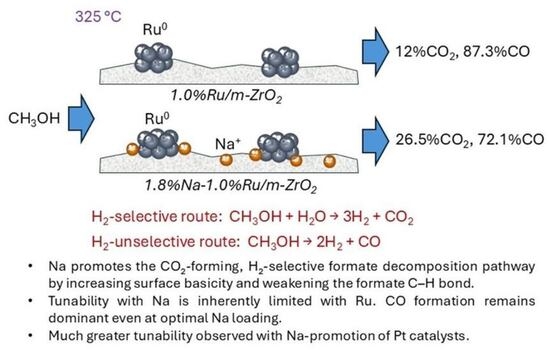
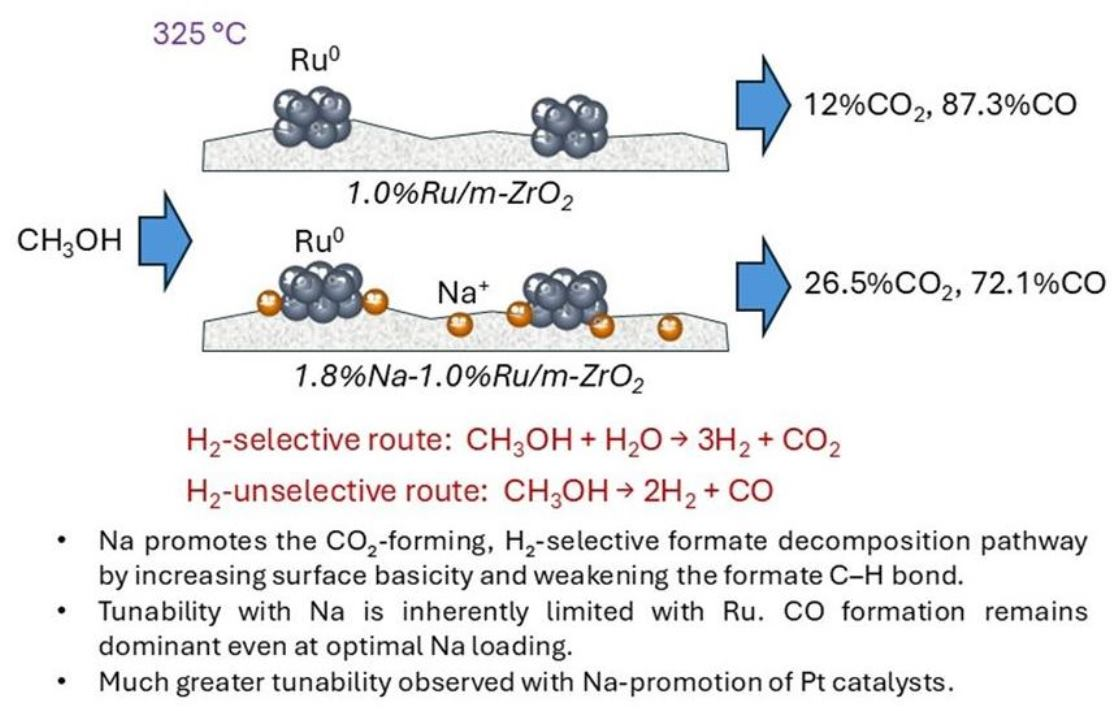
Table 7). At 325 °C, the unpromoted 1% Ru/m-ZrO
2 catalyst achieves 80.1% methanol conversion, producing primarily CO (87.3% selectivity) and a smaller fraction of CO
2 (12.0% selectivity). Adding Na modifies the product distribution. At low Na loadings (0.5–1.0% Na), methanol conversion remains similar (80.6% and 80.0%, respectively), but CO
2 selectivity increases to 16.2–21.0%, with a corresponding decrease in CO selectivity to 78–83%. At higher Na contents (1.8–2.5% Na), methanol conversion decreases moderately (≈71–78%), but CO
2 selectivity increases further to 26–26.5%, indicating a shift toward the dehydrogenation/decarboxylation route. The highest Na loading (5% Na) yields the lowest conversion (47.4%), but CO
2 selectivity remains elevated (20.5%) relative to the unpromoted catalyst.
At 300 °C, similar trends are observed. The unpromoted catalyst converts 65.5% of methanol with 91.1% CO selectivity. Low-Na catalysts show slightly higher conversion (≈69%) and increased CO2 selectivity (≈10–13%), while CO selectivity decreases proportionally. At intermediate Na loadings (1.8–2.5%), methanol conversion drops to ~52–55%, and CO2 selectivity increases to ~18–20%. The 5% Na catalyst again shows the lowest conversion (26.7%), but maintains the characteristic Na-induced increase in CO2 selectivity (20.4%).
At the lowest temperature examined, 275 °C, the behavior is consistent: Na-free Ru/m-ZrO2 achieves 42.1% conversion with 91.9% CO selectivity. Low Na loadings maintain similar conversion (~35–43%) but shift selectivity toward CO2 (up to 12.4%). At 1.8–2.5% Na, conversion decreases to ~26–28%, and CO2 selectivity increases to ~18–19%. The 5% Na catalyst again shows the lowest conversion (11.0%) but elevated CO2 formation (20.6%).
For this analysis, apparent turnover frequencies (TOFs) were estimated using low-conversion methanol steam reforming data obtained at 275 °C (
Table 6), where all catalysts were evaluated under identical gas hourly space velocity and feed composition. Surface Ru dispersion, which is proportional to accessible Ru atoms, was estimated from EXAFS-derived Ru particle sizes by assuming spherical nanoparticles and constant Ru site accessibility across the catalyst series, which serves as a simplifying assumption. Apparent TOFs are reported relative to the unpromoted Ru/m-ZrO
2 catalyst to emphasize comparative trends rather than absolute kinetic values. Surface Ru dispersions were estimated from the particle size analysis rather than from chemisorption measurements, as hydrogen uptake on Ru/ZrO
2 systems is dominated by spillover onto the support. Consequently, the apparent TOFs should be regarded as approximate, since possible Na-induced changes in Ru site accessibility, interfacial structure, and surface coverage are not explicitly accounted for, and are therefore used only for qualitative comparison.
The estimated apparent TOFs show no enhancement of intrinsic Ru activity with Na addition and instead decrease gradually with increasing Na loading. Importantly, the magnitude of this decrease is modest at low-to-moderate Na loadings and is small relative to the much larger changes observed in CO2 selectivity. This decoupling indicates that Na promotion primarily alters reaction pathways and surface coverage rather than increasing the intrinsic turnover capability of Ru sites. Partial Na decoration or masking of Ru and Ru–support interfacial sites may reduce the number of accessible Ru sites across the catalyst series such that the intrinsic TOFs per truly accessible site could be more similar than the apparent values suggest. Accordingly, the apparent TOF trends are interpreted as reflecting effective catalytic behavior under Na-modified surface conditions rather than definitive intrinsic site kinetics.
At a high Na loading (5 wt.% Na), the catalyst surface is already highly basic and strongly populated by stabilized oxygenated species at low temperature, as evidenced by CO2-TPD and DRIFTS. Under these conditions, the reaction pathway is biased toward CO2 formation already at low temperature, resulting in high CO2 selectivity with little further temperature dependence. The accompanying suppression of methanol conversion and lower apparent TOF may arise from a combination of effects, including Na decoration of Ru or Ru–support interfacial sites, strong stabilization of oxygenated surface species, and restricted accessibility or dynamic regeneration of active ensembles, all of which reduce effective catalytic turnover under these highly basic conditions.
To isolate the effect of Na on selectivity independent of activity,
Table 7 compares catalysts at similar conversion levels by adjusting the space velocity. At 325 °C, all catalysts were evaluated at ~78–80% conversion. Under these matched-conversion conditions, Na increases CO
2 selectivity from 12.0% (unpromoted) to 16.2% (0.5% Na), 21.0% (1.0% Na), and 26.5% (1.8% Na), with corresponding decreases in CO selectivity. A similar trend is observed at 300 °C, where at ~66–69% conversion, CO
2 selectivity rises from 8.6% (unpromoted) to 23.7% at 1.8% Na. These matched-conversion data confirm that the higher CO
2 selectivity obtained with Na loading is not simply due to lower conversion at higher Na levels, but reflects a real shift in the reaction pathway.
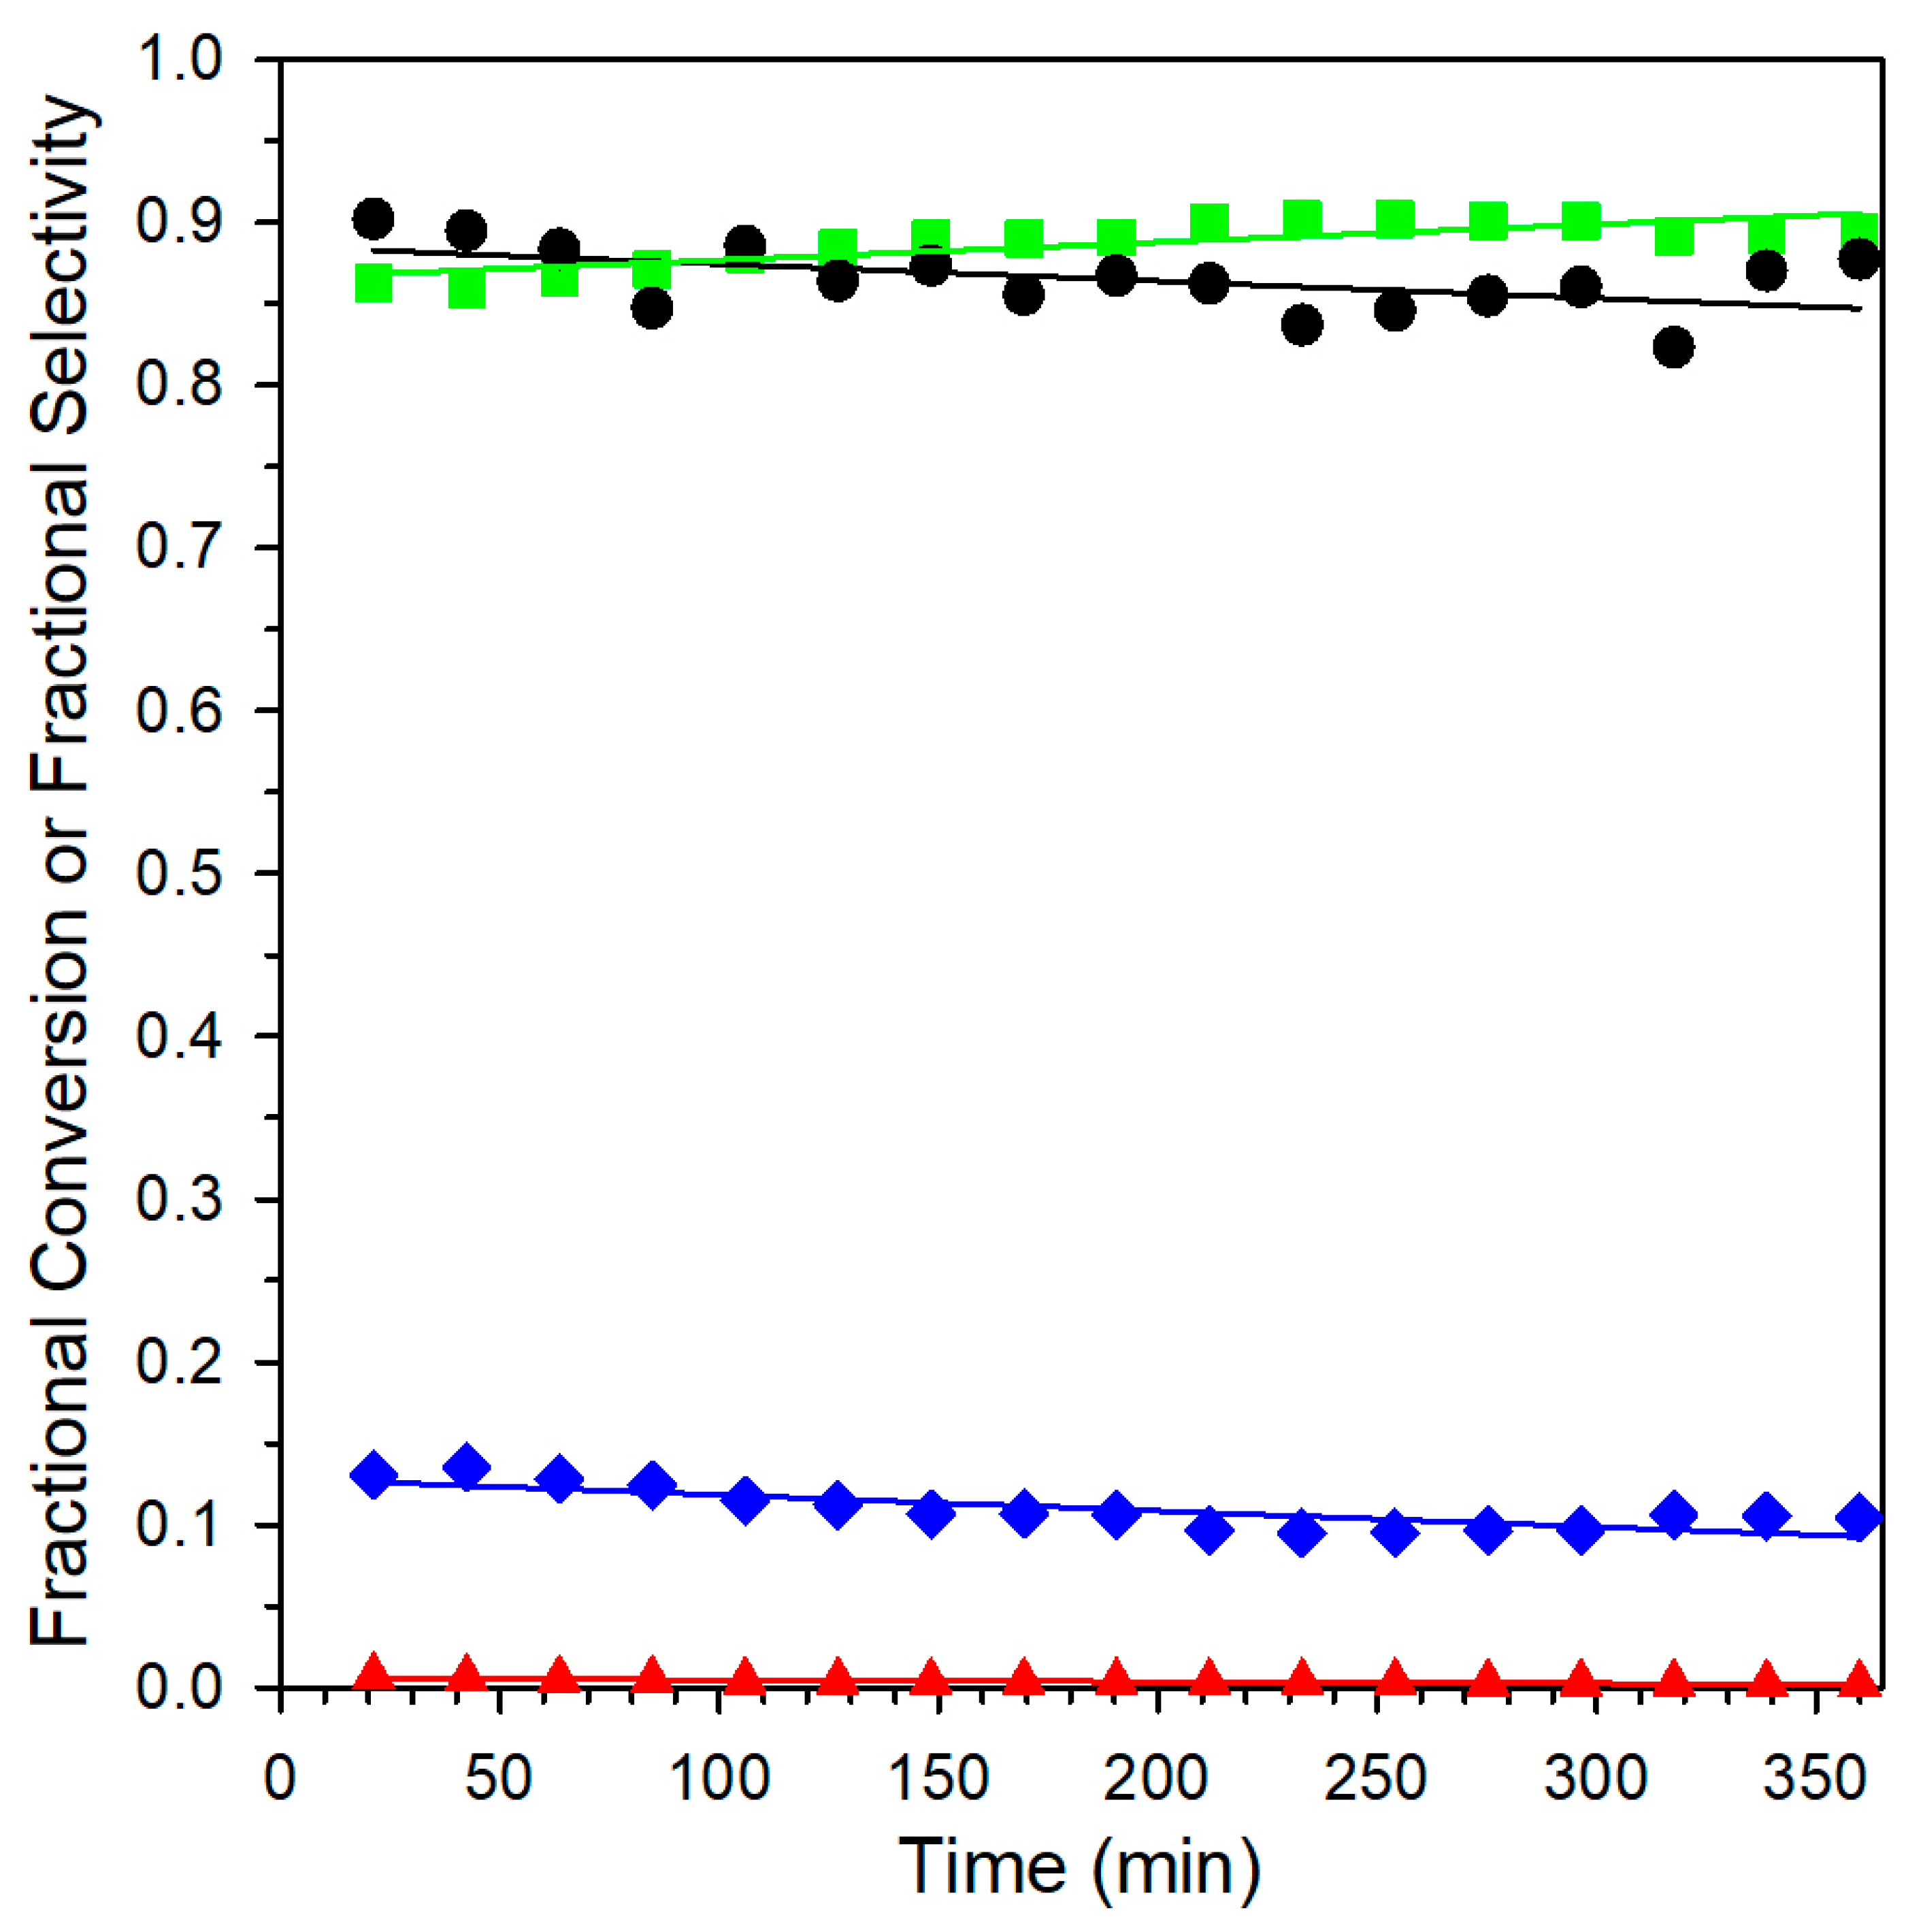
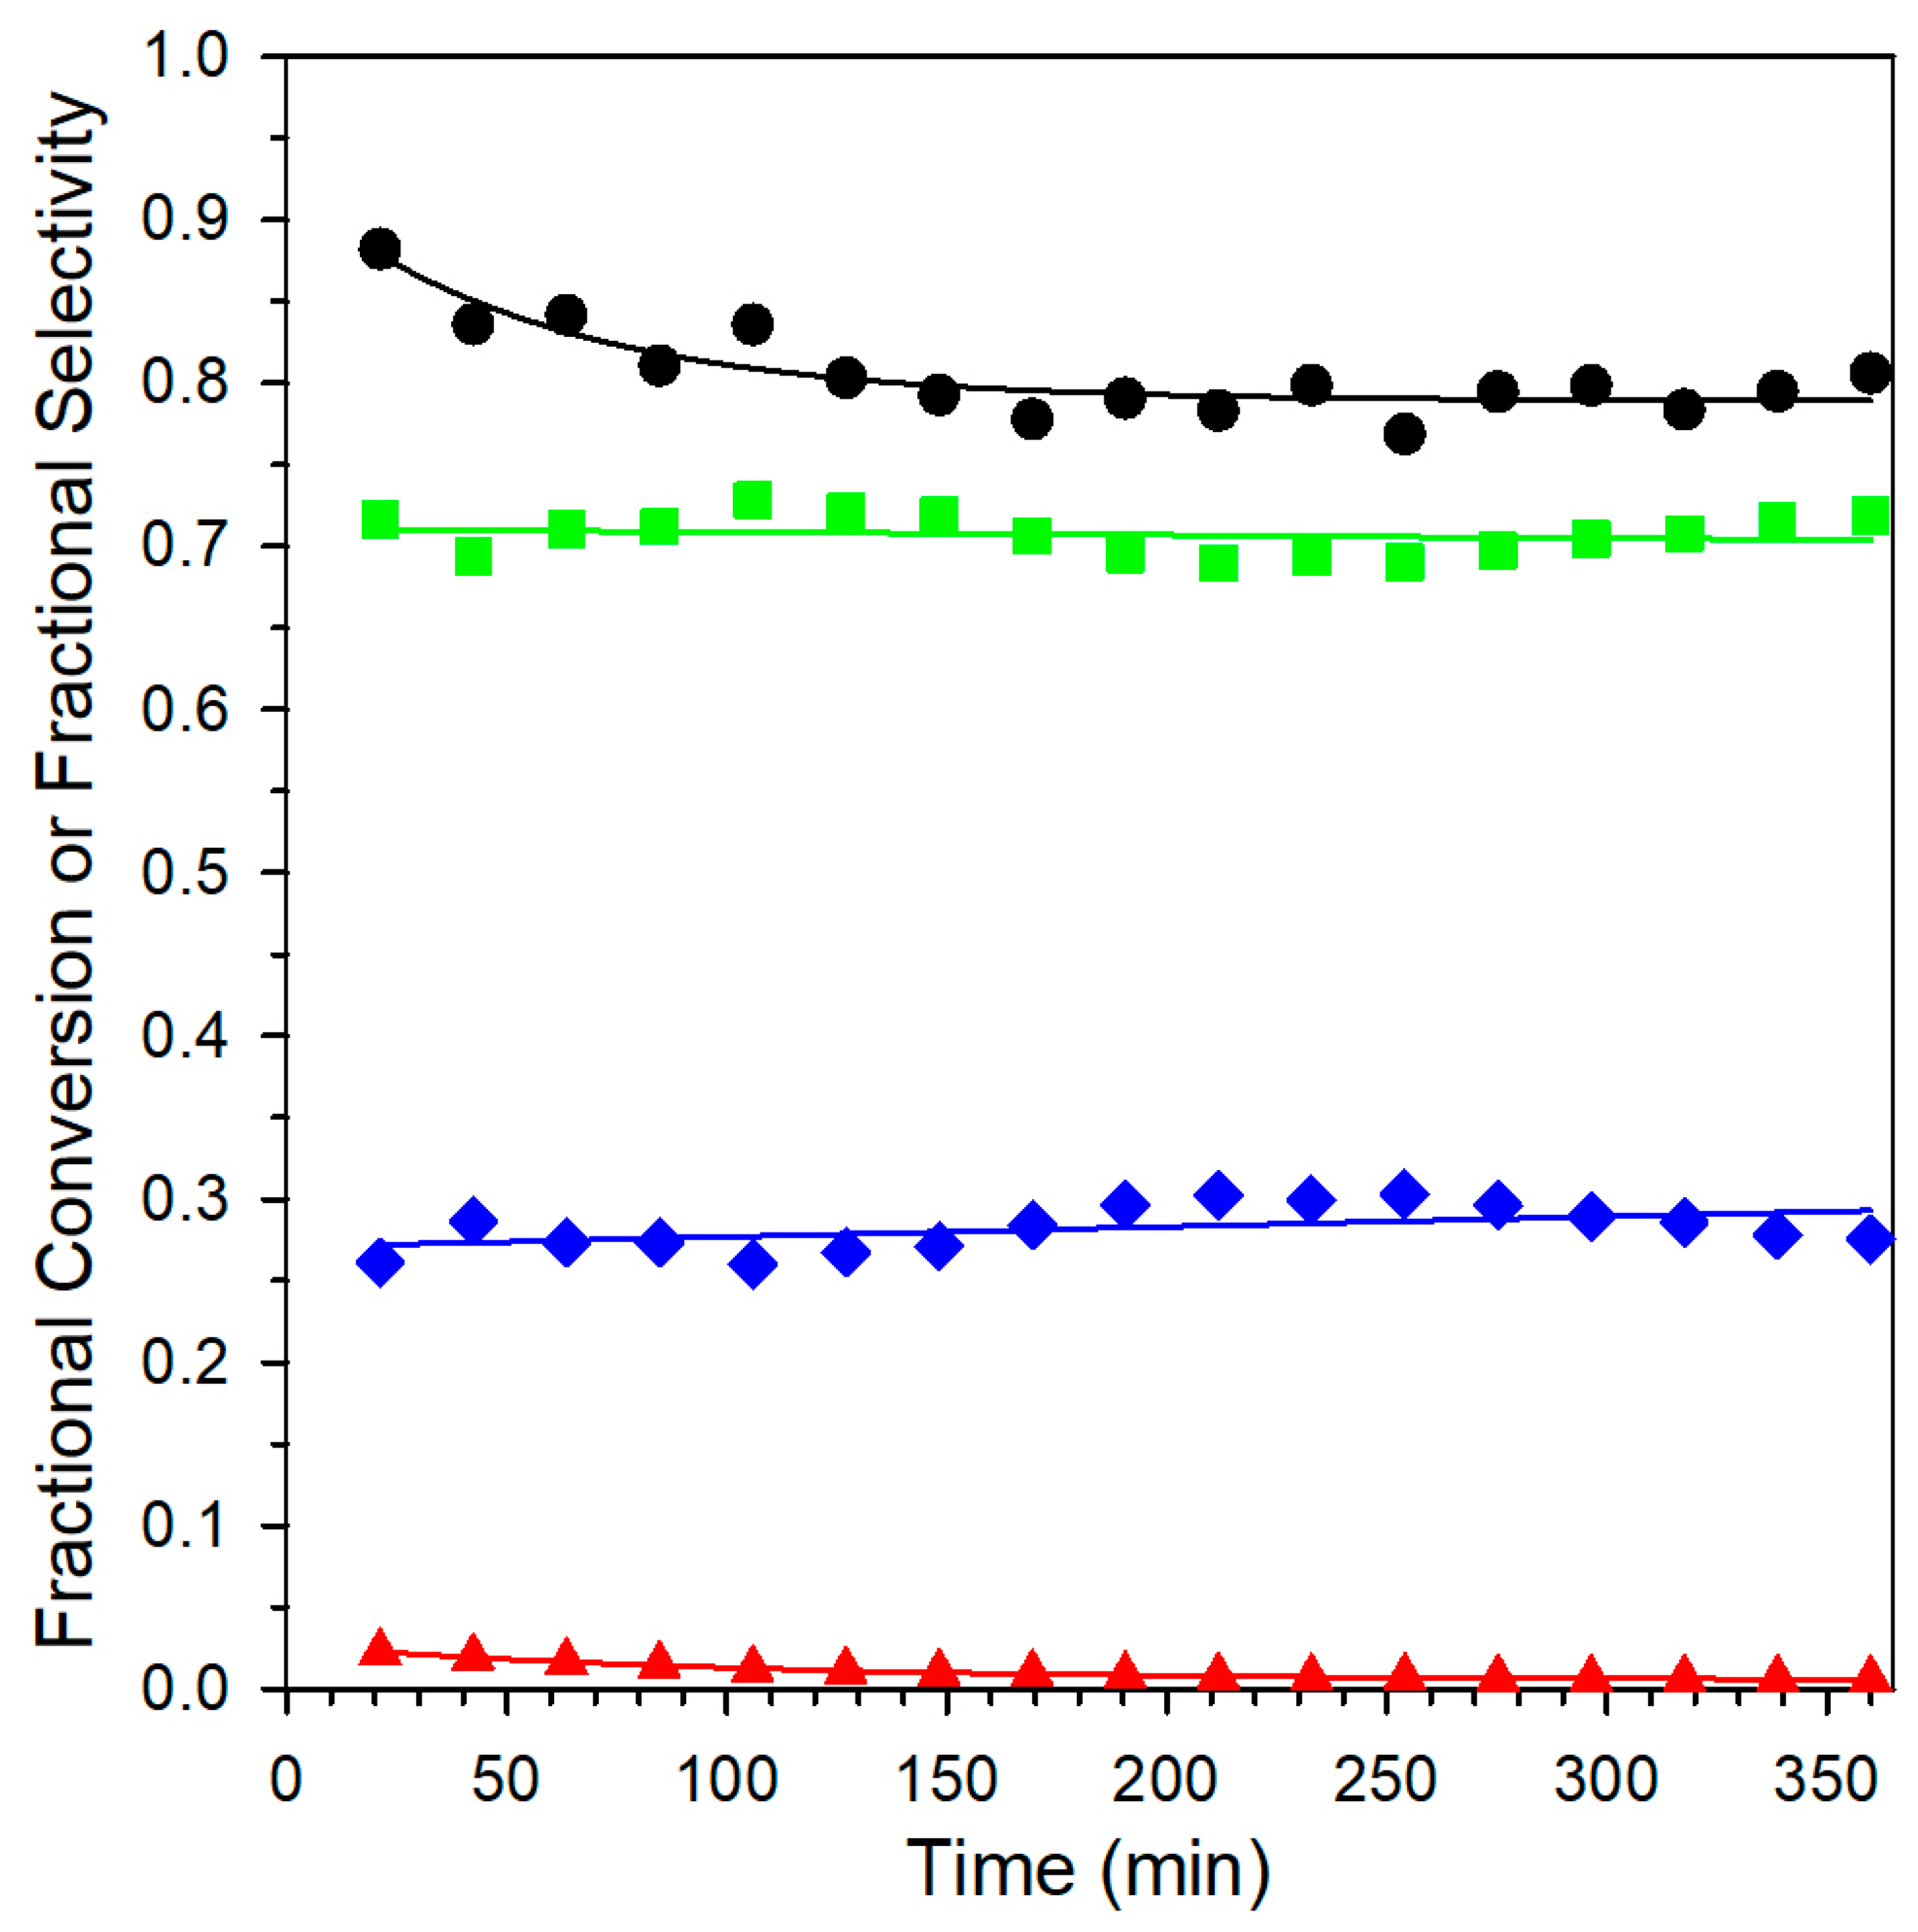
Catalyst stability was assessed at ~317–325 °C for extended time-on-stream (
Figure 15 and
Figure 16). The unpromoted 1% Ru/m-ZrO
2 catalyst (
Figure 15) maintains stable methanol conversion (~88%) and steady CO, CO
2, and CH
4 selectivities over 360 min. The 1.8% Na-promoted catalyst (
Figure 16) also shows stable CH
4 and CO
2 selectivities, though methanol conversion exhibits a gradual decline over the first ~100 min before stabilizing. Even under these mildly deactivating conditions, the Na-promoted catalyst maintains higher CO
2 selectivity than the unpromoted catalyst at comparable times.
Overall, the reaction testing data show that Na shifts MSR selectivity away from CO and toward CO2 across a wide temperature range. This effect persists even when conversions are matched, demonstrating that Na modifies the decomposition pathway of surface intermediates rather than simply lowering activity. Taken together with the DRIFTS evidence of formate C–H destabilization, the catalytic data show that Na favors H2-producing dehydrogenation/decarboxylation pathways (→CO2 + H2) while suppressing CO-forming decarbonylation processes (→CO + H2O).
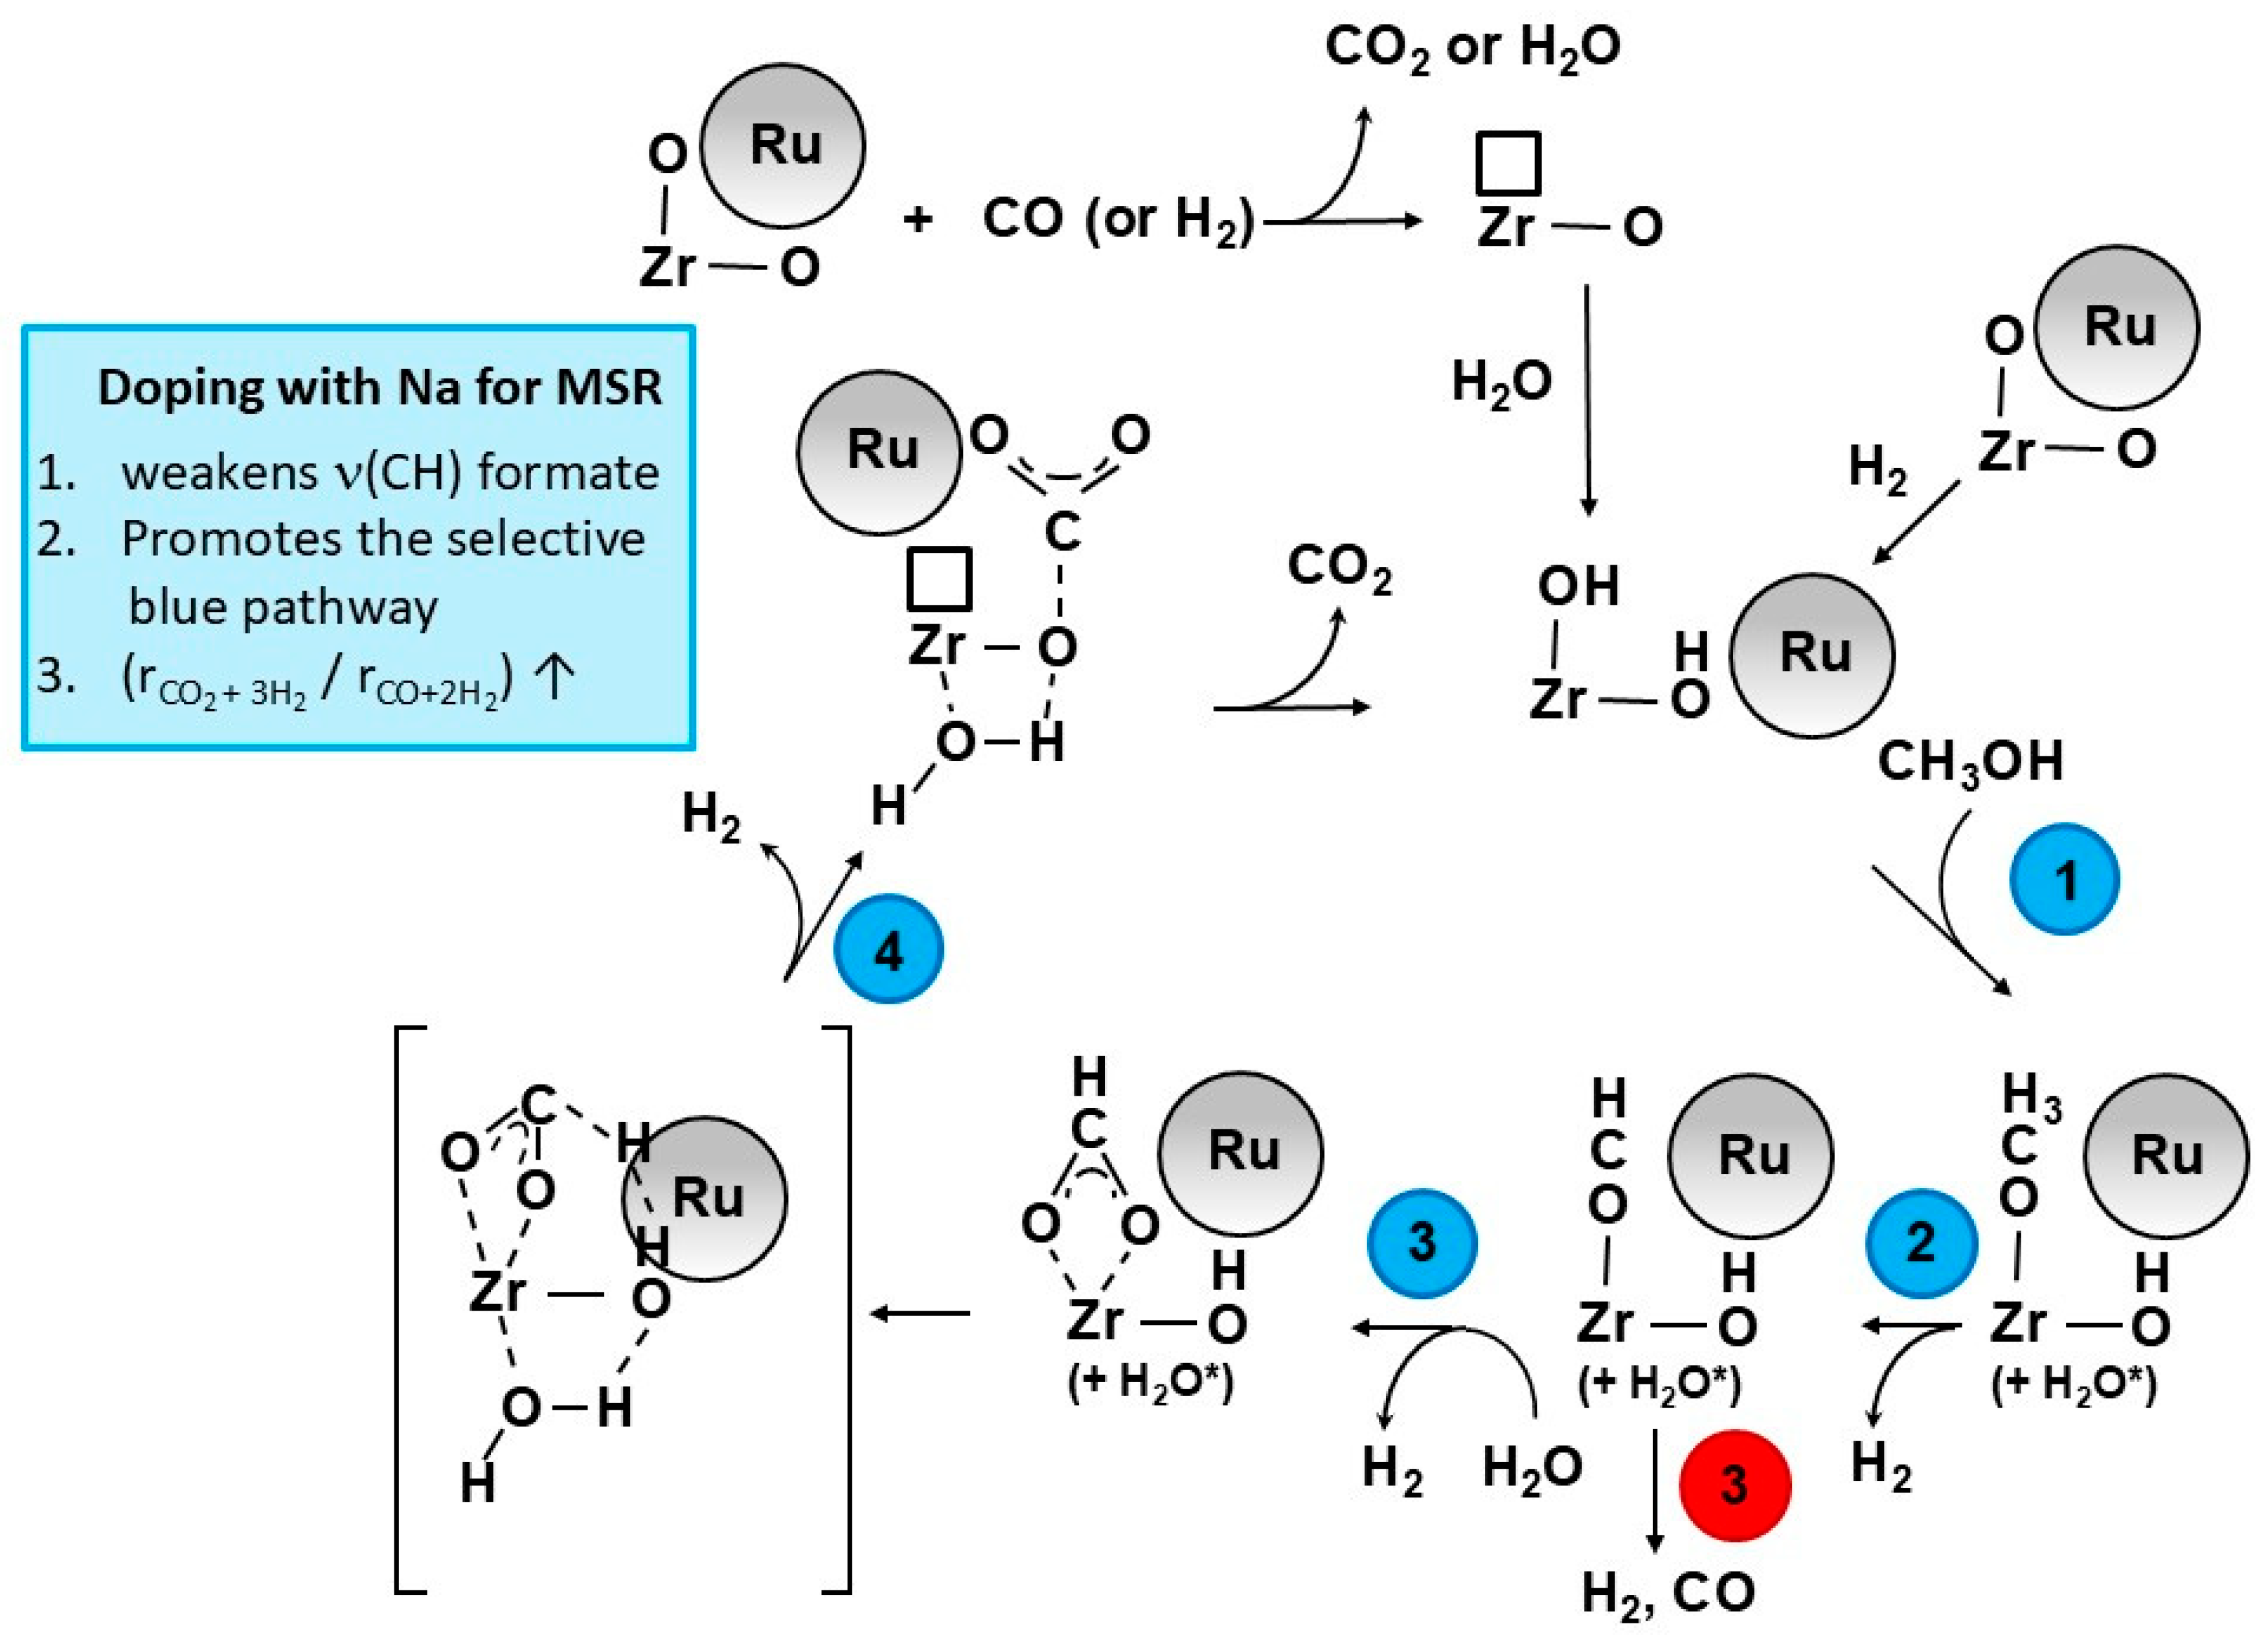
The combined TPR, EXAFS, CO2-TPD, DRIFTS, and catalytic testing results allow construction of a consistent mechanistic picture for how Na modifies methanol steam reforming (MSR) over Ru/m-ZrO2. The overall pathway involves sequential methoxy → formate → carbonate intermediates on the m-ZrO2 support, with Ru providing sites for H2 formation and spillover. Na affects multiple steps in this sequence.
During CH
3OH activation (Step 1 in
Figure 17), methanol dissociates at reduced ZrO
2 sites to form surface methoxy species, which rapidly convert into formate even at low temperature, as observed using DRIFTS. Without Na, the formate species can decompose through two competing reactions: dehydration/decarbonylation (producing CO + H
2O) or dehydrogenation/decarboxylation (producing CO
2 + H
2). The DRIFTS ν(CH) formate frequencies and ν
asym–ν
sym(OCO) splitting demonstrate that Na increases the basicity of the surface, which strengthens binding of the OCO fragment and weakens the formate C–H bond. This perturbation stabilizes formate in a geometry that favors dehydrogenation/decarboxylation (blue pathway in
Figure 17) and disfavors the CO-producing route (red pathway). The emergence of the long Ru-O coordination at ≥1 wt.% Na further supports the interfacial oxygen stabilization illustrated in
Figure 17, reinforcing Na’s role in modifying the Ru–support environment.
In Step 2, the weakened C–H bond of formate at Na-modified sites facilitates dehydrogenation to HCOO* and H*, which readily recombine on Ru to form H
2. This is consistent with transient MSR data (
Figure 15), which show that Na-promoted catalysts release H
2 at lower temperatures and in greater amounts, reflecting the stabilization of the H
2-forming pathway. CO
2-TPD also shows that Na increases the strength and population of basic surface sites, supporting this mechanistic shift.
In Step 3, Na also influences how the oxygenated intermediates bind to the support. The EXAFS analysis reveals a distinctive long Ru–O interaction (2.1–2.2 Å) that appears only in Na-containing catalysts. This suggests that Na modifies the Ru–support interface, introducing or stabilizing oxygen-containing species that interact with Ru. These modified interfacial sites may further favor formate orientations and O-binding motifs associated with the dehydrogenation/decarboxylation pathway. This structural change also correlates with the observed increase in CO
2 selectivity across temperatures and reaction conditions (
Table 6 and
Table 7).
As formate decomposes to CO
2, carbonate species form on the ZrO
2 support (Step 4). DRIFTS data show that these carbonates are more strongly bound when Na is present, shifting carbonate ν(OCO) bands and increasing their thermal stability. During H
2-TPR, hydrogen spillover decomposes these carbonates, and Na influences both the temperature and manner in which this occurs. Defect-associated hydroxyl groups observed in DRIFTS spectra after H
2 exposure (
Figure 4) confirm that hydrogen spillover and carbonate removal are linked, and that Na modifies these processes as well.
Overall, the mechanistic picture is that Na increases surface basicity, stabilizes oxygen-rich environments at the Ru–support interface, weakens the formate C–H bond, and shifts the reaction pathway toward H
2-forming dehydrogenation/decarboxylation rather than the CO-forming route. This selective promotion of the blue pathway in
Figure 17 leads to greater H
2 production from methanol and higher CO
2 selectivity, aligning with the steady-state, transient, DRIFTS, and structural characterization results.
The more modest effect of Na on Ru/m-ZrO2 compared to Na-doped Pt/YSZ arises from intrinsic differences in the electronic structures of Ru and Pt that govern their reactivity. Pt has a more filled and lower-energy d-band, which results in weaker M–O and M–CO interactions and makes Pt far more sensitive to electronic perturbation by alkali promoters. As shown in the Na–Pt/YSZ study, Na substantially weakens the formate C–H bond on Pt, enabling >90% CO2 selectivity at 2.5 wt.% Na. Ru, in contrast, has a higher-energy, less filled d-band that binds oxygenated intermediates and CO much more strongly. This makes C–O bond scission intrinsically easier on Ru and limits how much Na can shift the reaction pathway. Consistent with this, the Na-Ru/m-ZrO2 catalysts exhibit smaller ν(CH) red shifts, only modest interfacial Ru–O perturbation in EXAFS spectra, and maximum CO2 selectivities of ~20–27% at matched conversion. Thus, while Na pushes both metals toward decarboxylation, Ru’s electronic structure inherently restricts the extent to which Na can suppress the CO-forming pathway.
3. Materials and Methods
3.1. Catalyst Synthesis
The 1.0 wt.% Ru/m-ZrO2 catalyst was synthesized via incipient wetness impregnation using monoclinic zirconia as the support (Thermo Scientific, Waltham, MA, USA). Commercial ZrO2 pellets (1/8″) were crushed and sieved to obtain particles in the 63–106 µm size range prior to use. An aqueous solution of ruthenium nitrosyl nitrate (Alfa Aesar, Haverhill, MA, USA) was added dropwise to the support until incipient wetness was achieved. The impregnated material was dried and subsequently calcined in static air at 350 °C for 4 h in a muffle furnace (Thermolyne, Thermo Scientific).
The resulting Ru/m-ZrO2 material served as a parent catalyst and was subdivided to prepare a series of Na-promoted samples. Sodium was introduced at nominal loadings of 0.50, 1.0, 1.8, 2.5, and 5.0 wt.% using sodium nitrate (Alfa Aesar) as the precursor. Sodium addition was carried out using a second incipient wetness impregnation step from aqueous NaNO3 solutions, followed by drying and calcination in air at 350 °C for 4 h under identical conditions.
3.2. Textural Characterization by N2 Physisorption
Specific surface areas and porosity characteristics were determined by performing nitrogen adsorption–desorption measurements using a Micromeritics 3-Flex analyzer (Norcross, GA, USA). Prior to analysis, the samples were degassed under vacuum (<6.7 Pa) at 160 °C for 12 h to remove physisorbed species. Adsorption and desorption isotherms were subsequently recorded at liquid nitrogen temperature. Surface areas were calculated using the Brunauer–Emmett–Teller (BET) method, while pore volumes and pore size distributions were derived from the desorption branch employing the Barrett–Joyner–Halenda (BJH) model.
3.3. H2 Temperature-Programmed Reduction and TPR-MS
Temperature-programmed reduction (TPR) experiments were carried out using an Altamira AMI-300R system (Altamira Instruments, Twin Lakes, WI, USA) equipped with a thermal conductivity detector (TCD). Approximately 150 mg of catalyst was loaded into the reactor, with the thermocouple positioned directly within the catalyst bed. A reducing gas mixture consisting of 10 vol.% H2 in Ar (Airgas, San Antonio, TX, USA, UHP grade) was passed through the reactor at a flow rate of 30 cm3 min−1. The temperature was increased from 30 to 1000 °C at a linear ramp rate of 10 °C min−1.
For selected experiments, the reactor outlet was connected to a quadrupole mass spectrometer (Hiden Analytical, Warrington, UK) to monitor evolved gas species during reduction. All gases used in TPR and TPR-MS experiments were supplied by Airgas (San Antonio, TX, USA).
3.4. CO2 Temperature-Programmed Desorption with Mass Spectrometry
CO2-TPD measurements were performed using the same Altamira AMI-300R instrument coupled to a Hiden quadrupole mass spectrometer. Prior to CO2 adsorption, the catalyst was reduced at 400 °C for 1 h under a flow of 10 cm3 min−1 H2 diluted with 20 cm3 min−1 Ar. The sample was then purged in flowing Ar (30 cm3 min−1) for 20 min and cooled to 50 °C.
CO2 adsorption was carried out by exposing the sample to 25 cm3 min−1 of 4 vol.% CO2 in helium for 15 min. Following saturation, the system was purged briefly, and the temperature was ramped to 1000 °C at 10 °C min−1 under a helium flow of 30 cm3 min−1. CO2 desorption was monitored by tracking the m/z = 44 signal during the temperature ramp.
3.5. High-Resolution Transmission Electron Microscopy and EDX
High-resolution transmission electron microscopy (HR-TEM) and scanning transmission electron microscopy (STEM) analyses were conducted using a JEOL JEM-2010F field-emission transmission electron microscope (JEOL, Peabody, MA, USA). Imaging was performed at accelerating voltages of 120 or 200 kV, enabling lattice-resolved imaging with a point-to-point resolution of approximately 1.9 Å.
Before microscopy, catalyst samples were activated at 350 °C for 1 h under flowing 33 vol.% H2 in He (30 cm3 min−1), followed by purging and cooling in He. The samples were then passivated in 1 vol.% O2 in He for 10 h. Activated catalysts were finely ground, dispersed in ethanol via brief ultrasonication (~10 min), and deposited onto lacey carbon-coated copper grids.
Bright-field TEM, HR-TEM, and annular dark-field (ADF) STEM images were acquired using a TVIPS CMOS camera system (TVIPS GmbH, Gilching/Gauting, Germany). Elemental analysis and mapping were performed with an EDAX Genesis SiLi energy-dispersive X-ray detector (EDAX, Inc., Pleasonton, CA, USA). The data were processed using TVIPS EMMenu (v4.0) and EDAX Genesis (v5.2) software.
3.6. H2-TPR-XANES and EXAFS Measurements
In situ H
2-TPR-XANES and EXAFS experiments were conducted at the MR-CAT beamline of the Advanced Photon Source (Argonne National Laboratory). Incident X-ray energies were selected using a Si(111) monochromator (Kohzu Precision Co., Ltd., Kawasaki City, Japan) in combination with a rhodium-coated mirror to suppress higher-order harmonics. The overall experimental configuration was adapted from a previously described setup reported by Jacoby [
24].
Temperature-programmed reduction measurements were performed using a stainless-steel multi-sample holder designed to accommodate six samples simultaneously, with each channel having an inner diameter of 3 mm. Samples were prepared as self-supporting wafers using 21–23 mg of material pressed from a 60/40 wt.% mixture of the catalyst and SiO2. This composition and mass were selected to optimize data quality for Ru K-edge measurements on ZrO2-supported catalysts. The multi-sample holder was positioned inside a clamshell furnace mounted on a precision translation stage.
The samples were enclosed within a quartz reactor tube fitted with Kapton windows for X-ray transmission and equipped with gas inlet/outlet ports and a thermocouple for temperature monitoring. Alignment of the samples relative to the incident X-ray beam was achieved with an accuracy of approximately 20 µm. After alignment, the reactor was flushed with helium at a flow rate of 100 mL min−1 for a minimum of 5 min prior to introducing the reducing gas mixture. The gas feed was then switched to 25 vol.% H2 balanced with helium, maintaining the same total flow rate. The temperature was increased at a controlled rate of 1.0 °C min−1 to a final temperature of 400 °C.
X-ray absorption spectra at the Ru K-edge were collected in transmission mode, with a metallic Ru foil placed downstream of the samples for simultaneous energy calibration. EXAFS data processing was carried out using the WinXAS software package (version 2.0, Thorsten Ressler, Berlin, Germany) [
25]. Structural modeling and fitting were performed using the Atoms code (version 2.46b) [
26] together with the FEFF/FEFFIT suite (version 2.54) [
27,
28]. The quantitative analysis focused on spectra acquired after the completion of the temperature ramp and subsequent cooling under flowing hydrogen. Fits were conducted over k-space and R-space ranges of 2.75–10 Å
−1 and 1.5–3.0 Å, respectively.
3.7. DRIFTS Analysis of Methanol Steam Reforming
Diffuse reflectance infrared measurements were carried out using a Nicolet iS-10 Fourier transform infrared spectrometer (Thermo Scientific, Waltham, MA, USA) equipped with a Praying Mantis high-temperature reaction cell (Harrick Scientific, Mt. Kisco, NY, USA). The experiments were designed to monitor surface species during temperature-programmed methanol steam reforming under well-defined flow conditions.
Initial reference spectra (512 scans) were collected for the calcined catalyst under a helium flow of 100 cm3 min−1 at room temperature. The catalyst was then reduced at 400 °C for 1 h using a 1:1 mixture of H2 and He at a total flow rate of 200 cm3 min−1, after which a background spectrum consisting of 512 scans was recorded. Following reduction, the catalyst was purged with helium (100 cm3 min−1) at 400 °C, cooled to 50 °C under flowing helium, and an additional background spectrum (512 scans) was obtained.
Methanol adsorption was achieved by bubbling helium (75 cm3 min−1) through liquid methanol for approximately 15 min. Subsequently, gas-phase methanol and weakly adsorbed species were removed by purging with 100 cm3 min−1 of helium, after which a spectrum comprising 512 scans was collected. Water vapor was introduced by passing helium at 30 cm3 min−1 through a deionized water saturator maintained at 31 °C, corresponding to an H2O concentration of 4.4 vol.% at the same flow rate. The introduction of water vapor led to the reaction of adsorbed methoxy species with H2O to form surface formates, followed by their subsequent decarbonylation and/or decarboxylation.
The sodium content of the catalysts was varied between 0 and 5.0 wt.%, and spectra were collected as the temperature was increased stepwise from 50 to 400 °C in increments of 25 °C. All gases used in these experiments were supplied by Airgas (San Antonio, TX, USA).
3.8. Temperature-Programmed Surface Reaction of Methanol Steam Reforming
Temperature-programmed surface reaction experiments were conducted using an Altamira AMI-300R unit (Altamira Instruments, Twin Lakes, WI, USA) equipped with a quadrupole mass spectrometer (Hiden Analytical, Warrington, UK) for online gas analysis. Prior to the reaction, catalysts were activated by heating to 400 °C under a flow of 33 vol.% H2 in argon (30 cm3 min−1). After activation, the catalysts were purged in flowing argon for 20 min and subsequently cooled to 50 °C.
Surface saturation with methanol was achieved by injecting 100 µL of liquid methanol directly into the reactor, followed by purging with argon at 30 cm3 min−1 for 15 min to remove gas-phase and weakly adsorbed species. The water delivery system was purged with argon prior to use. Water vapor was then introduced by bubbling argon at 30 cm3 min−1 through the water saturator for 10 min, after which the catalysts were again purged in argon (30 cm3 min−1) for 15 min.
Following these surface preparation steps, the catalysts were heated from 50 °C to 1000 °C at a linear ramp rate of 10 °C min−1. Hydrogen evolution during the temperature ramp was monitored by mass spectrometry to evaluate the influence of sodium promoter loading on methanol dehydrogenation behavior.
3.9. Fixed-Bed Reactor Evaluation
Catalytic performance was evaluated in a continuous-flow stainless-steel tubular reactor operated under steady-state conditions. The reactor had an internal diameter of 0.42 in. and contained a fixed catalyst bed. For each experiment, 400 mg of catalyst particles (60–90 µm) were mechanically mixed with 800 mg of SiO2 beads of a comparable particle size to improve bed packing and heat transfer.
Prior to the reaction, the catalyst bed was activated under a reducing atmosphere consisting of 50 vol.% H2 in helium flowing at 150 cm3 min−1. The temperature was increased to 400 °C at a heating rate of 3 °C min−1 and maintained for 30 min. After activation, the feed was switched to a reactant mixture containing 2.9 vol.% methanol, 2.9 vol.% water vapor, 10.8 vol.% nitrogen, and helium comprising the remainder. Reactions were carried out at atmospheric pressure over a temperature range of 275–325 °C, corresponding to a gas hourly space velocity (GHSV) of 38,100 h−1.
The reactor effluent was passed through a cold trap maintained at 0 °C to remove condensable products prior to analysis. The remaining gas-phase components were analyzed online using an SRI 8610 gas chromatograph (SRI Instruments, Torrance, CA, USA). The GC was equipped with a 3.658 m silica gel-packed column and a 1.829 m molecular sieve-packed column, along with both thermal conductivity (TCD) and flame ionization (FID) detectors. A built-in methanizer was employed to increase the sensitivity of the FID toward carbon monoxide and carbon dioxide.
Apparent turnover frequencies (TOFs) were estimated for comparative purposes using the methanol steam reforming data obtained at 275 °C, where all catalysts were evaluated in a fixed-bed plug-flow reactor with an identical gas hourly space velocity, feed composition, and catalyst mass. Under these low-to-moderate conversion conditions, methanol conversion was used as a proxy for the bed-averaged reaction rate, enabling a qualitative comparison of apparent TOFs across the catalyst series.
Surface Ru site densities were estimated from EXAFS-derived Ru particle sizes, assuming spherical nanoparticles and a uniform particle size. Site densities were not determined by chemisorption, as hydrogen uptake on Ru/ZrO2 systems is dominated by spillover to the support. To minimize uncertainties associated with absolute site counting and plug-flow integration effects, TOFs were reported relative to the unpromoted Ru/m-ZrO2 catalyst. The resulting values represent apparent, PFR-averaged TOFs and are intended only for a qualitative, comparative interpretation, as possible Na-induced changes in Ru site accessibility and surface coverage are not explicitly accounted for.
Surface Ru dispersion was estimated from EXAFS-derived Ru particle sizes assuming spherical nanoparticles and a uniform particle size. Ru dispersion (
) was approximated using the following geometric model:
where
is the average Ru particle diameter obtained from the EXAFS analysis and
is the density of metallic Ru (12.37 g cm
−3). Because Ru loading was constant across the catalyst series, differences in dispersion reflect relative differences in the number of surface-accessible Ru atoms.
Hydrogen chemisorption was not used to estimate Ru dispersion or site density, as hydrogen uptake on Ru/ZrO2 systems may be dominated by spillover to the support. Dispersion estimates derived from the particle size analysis were therefore used to provide a relative basis for comparing apparent catalytic behavior under identical plug-flow reactor conditions.





 ,
,