
Article

Electrochemical Study of Rhenium Cathodes on Aqueous Methanol, Simulating Non-Purified Water
by
José Guadalupe Rivera
,
Juan Manuel Olivares-Ramírez
,
Raúl García-García
and
German Orozco
*
Department of Chemical Engineering and Sustainable Energy, San Juan del Río Technological University, Av. La Palma No. 125, Col. Vista Hermosa, San Juan del Rio 76826, Qro, Mexico
*
Author to whom correspondence should be addressed.
Catalysts 2026, 16(5), 394; https://doi.org/10.3390/catal16050394
Submission received: 18 March 2026 / Revised: 16 April 2026 / Accepted: 18 April 2026 / Published: 29 April 2026

Abstract

The electrochemical behavior of metallic rhenium was investigated using voltammetry and ex situ X-ray photoelectron spectroscopy (XPS) in aqueous acidic methanol solutions. Capacitance–potential analysis revealed that the double-layer current is governed by an adsorption–desorption surface process involving oxygen and sulfate species, as confirmed by XPS. The hydrogen evolution reaction (HER) proceeds via a Volmer–Heyrovsky mechanism, with hydrogen adatoms, physisorbed oxygen, and chemisorbed sulfate molecules as key intermediates. Methanol does not inhibit hydrogen gas production, and oxygenated species actively participate in the HER pathway. Voltammetric measurements demonstrated that rhenium cathodes are highly efficient for methanol electrolysis in membraneless systems, suggesting their potential application in electrolysis processes involving unpurified wastewater. These findings highlight rhenium as a promising electrode material for use in sustainable energy conversion technologies.

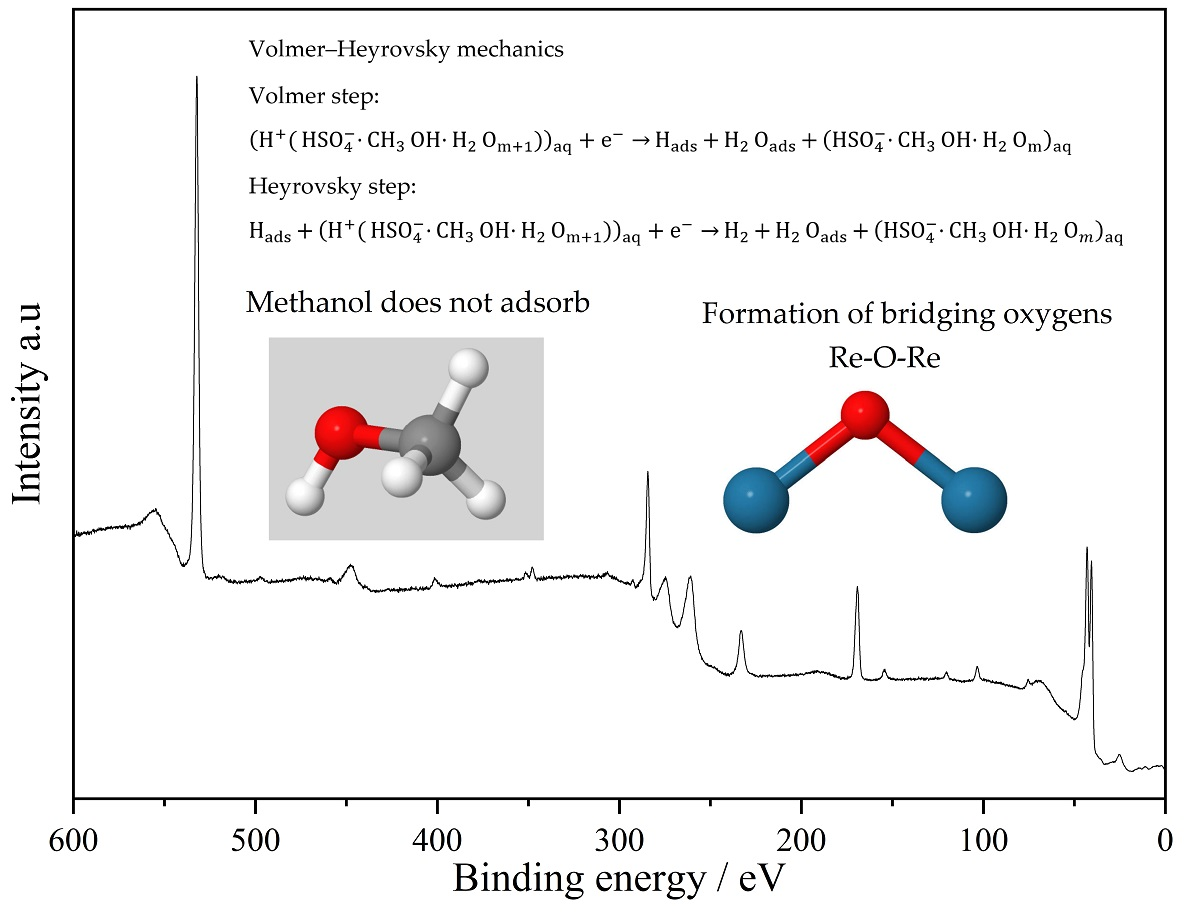
Graphical Abstract

1. Introduction

In this decade, an important topic to address in the field of catalysis is the development of materials that enable a new generation of water-splitting devices. At present, the water utilized for electrolysis must be of high purity, and the purification of feed water adds to the cost of the process. In this context, wastewater can potentially be used as a catholyte to produce hydrogen, and new electrodes are necessary for this raw material. Wastewater is acidified to suppress the inorganic precipitation that occurs at the surface of the cathode during the hydrogen evolution reaction (HER). Low-grade water electrolysis results in organic matter, and an alternative electrocatalyst that appears to be unaffected by these organic substances is rhenium [1,2]. On the other hand, electrochemical reforming is a process in which organic fuels undergo electrooxidation to generate hydrogen gas. Notably, the absence of rhenium poisoning in the presence of organic substrates provides a compelling rationale for its anticipated robust performance in these devices. Rhenium oxides have been extensively investigated in heterogeneous catalysis for two principal reasons [3,4]: First, rhenium exhibits remarkable catalytic selectivity, and second, in bimetallic systems, it remains the most widely employed catalyst in naphtha reforming. In 2025, Veerakumar et al. [4] conducted a comprehensive review of 324 publications on rhenium nanostructures, highlighting the frequent incorporation of rhenium nanoparticles into tailored solid supports for catalytic applications. In 2023, Ramírez et al. [5] provided a systematic overview of experimental studies on rhenium-based electrocatalysts, with particular emphasis on their role in advancing the hydrogen evolution reaction (HER). However, relatively few investigations have addressed aqueous systems containing inorganic matter. Notably, carbon monoxide stripping voltammetry indicates that oxygen species bind more strongly to the P t R e alloy surface, a feature that may facilitate water activation and the subsequent generation of hydroxide species at this interface [6]. In light of these considerations, it is important to investigate the interaction of a probe molecule with metallic rhenium electrodes, with methanol serving as a representative probe of dissolved organic matter in aqueous media. Such an approach enables the elucidation of the mechanistic pathways underlying hydrogen gas production in solutions containing organic species. The findings are expected to inform the prospective deployment of rhenium in two distinct technological contexts: (i) electrolysis of effluents with high organic content and (ii) electrolysis of methanol-containing solutions.

2. Results

2.1. Electrochemical Behavior of Rhenium in Solutions with Methanol

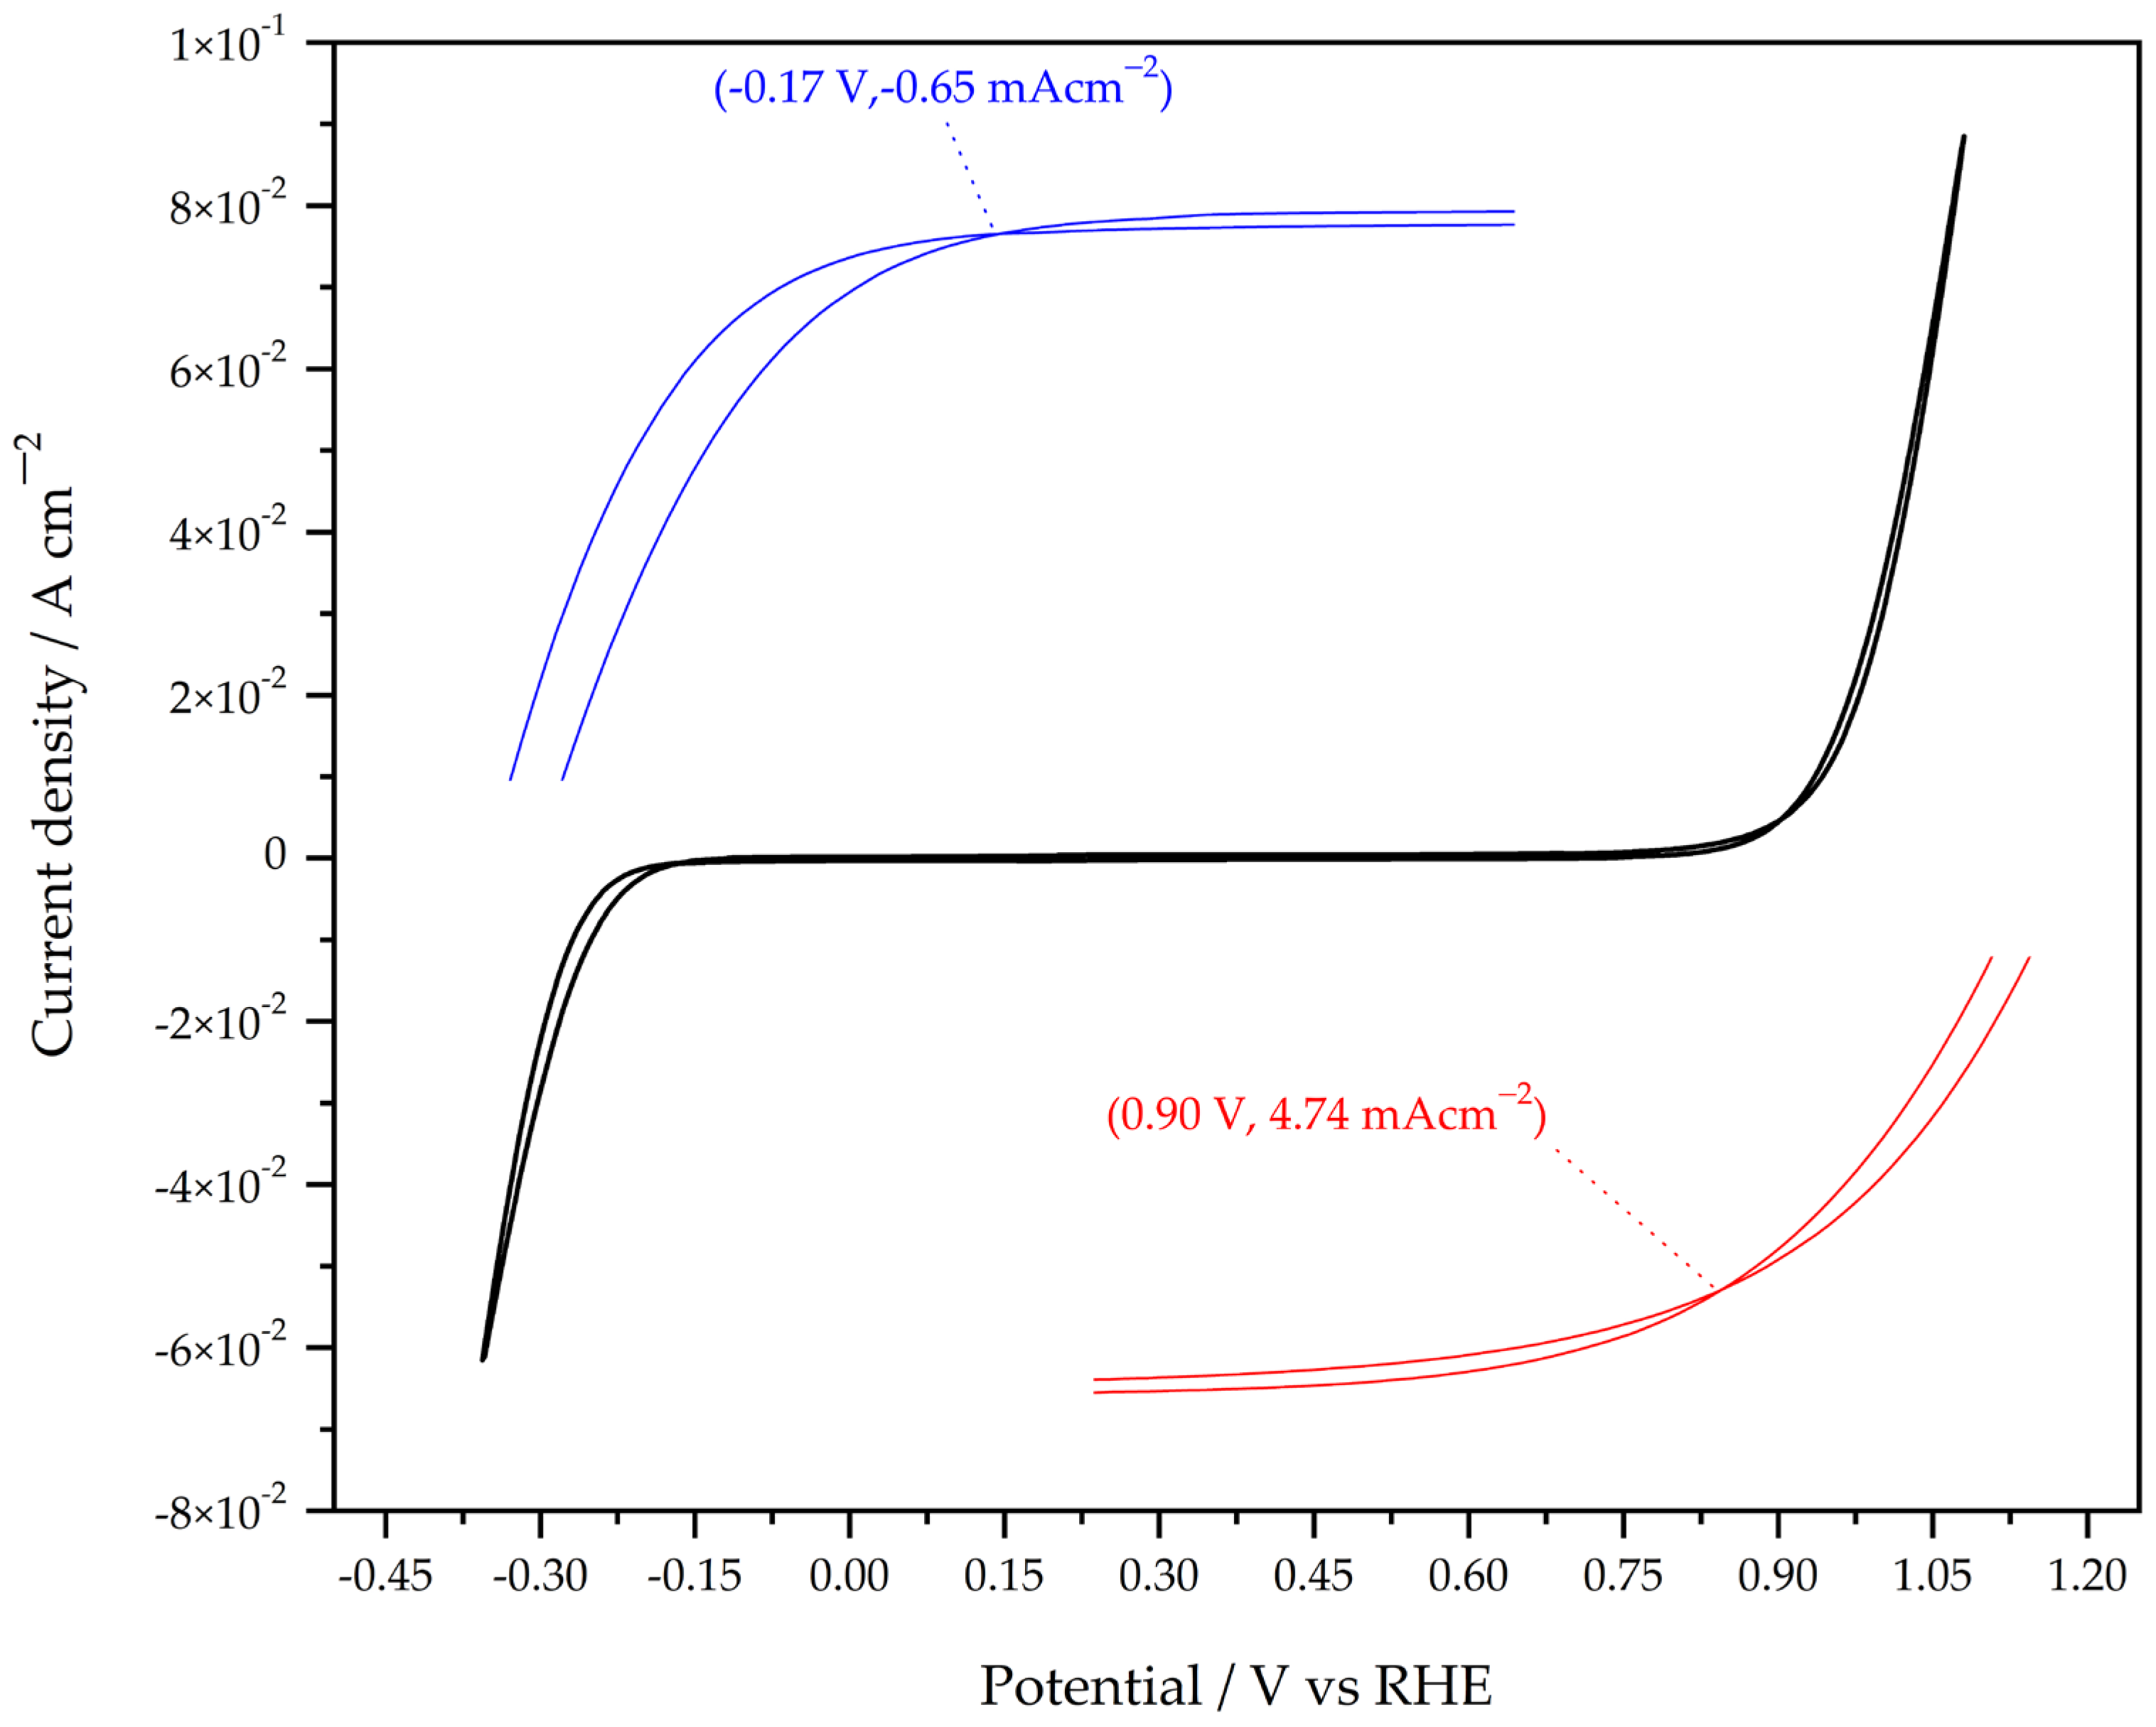
The voltammogram depicted in Figure 1 demonstrates that the electrochemical behavior of rhenium in acidic methanol solutions can be categorized into three distinct regions. The first region is observed at potentials below −0.11 V; the second, intermediate region spans from −0.11 V to 0.8 V; and the third region emerges at potentials above 0.8 V, where pronounced corrosion phenomena occur. Notably, when the potential remains below 0.6 V, the current response is predominantly governed by double-layer processes on the metallic rhenium surface. In contrast, once the potential exceeds 0.6 V, corrosion is initiated during the first scan, thereby altering the subsequent voltammetric cycles. The crossover potential at 0.90 V, illustrated in Figure 1, is attributed to subtle modifications in surface roughness resulting from rhenium dissolution, as described by reaction (1). Moreover, the crossover at −0.17 V (blue line in Figure 1) is associated with the electrodeposition of soluble corrosion products formed during the anodic sweep [7]. Furthermore, oxide ( R e O 4 ) formation occurs at a thermodynamic potential of 0.299 V, a value previously calculated in our earlier study [1].
Re + 4 H 2 O Re O 4 + 8 H + + 7 e
The anodic dissolution of rhenium through the formation of perrhenate species was comprehensively established in our previous work [2]. Given that technetium and rhenium are adjacent in the periodic table, their electrochemical behavior is similar. For both metals, an exponential increase in the anodic current is observed at potentials exceeding 0.6 V, which is attributed to the generation of perrhenate [2] or pertechnetate [8] anions. With the above in mind, Saleh et al. [9] misinterpreted the corrosion current of these metals as evidence of a hypothetical anodic electrooxidation of methanol on rhenium. Ferrin et al. [10] proposed a mechanism involving consecutive dehydrogenation steps of methanol on rhenium, leading to adsorbed carbon monoxide as a stable intermediate. However, the available experimental data do not corroborate this mechanistic pathway.

2.2. Electrochemical Study in the Potential Region of the Hydrogen Evolution Reaction (HER)

The hydrogen evolution reaction (HER) on metallic rhenium has been investigated through voltammetric studies [11,12] and impedance spectroscopy in acidic media [13,14], which have demonstrated a catalytic activity inferior to that of platinum. Table 1 summarizes the experimental Tafel slopes and exchange current densities (J0), which are consistent with values reported in earlier work on aqueous methanol systems [1]. J0 was approximately 1.08 × 10⁻⁶ A cm−2, with corresponding Tafel slopes in the range of 58–70 mV decade−1. In acidic media, the slope narrows to 59–60 mV decade−1 (Table 1).
The negligible differences observed between measurements in the presence and absence of methanol (Table 1) indicate that the hydrogen evolution reaction (HER) on rhenium proceeds via an identical mechanistic pathway under both conditions. Complementary impedance spectroscopy supports this conclusion, suggesting that the HER on rhenium follows the Volmer–Heyrovsky mechanism [14,15].
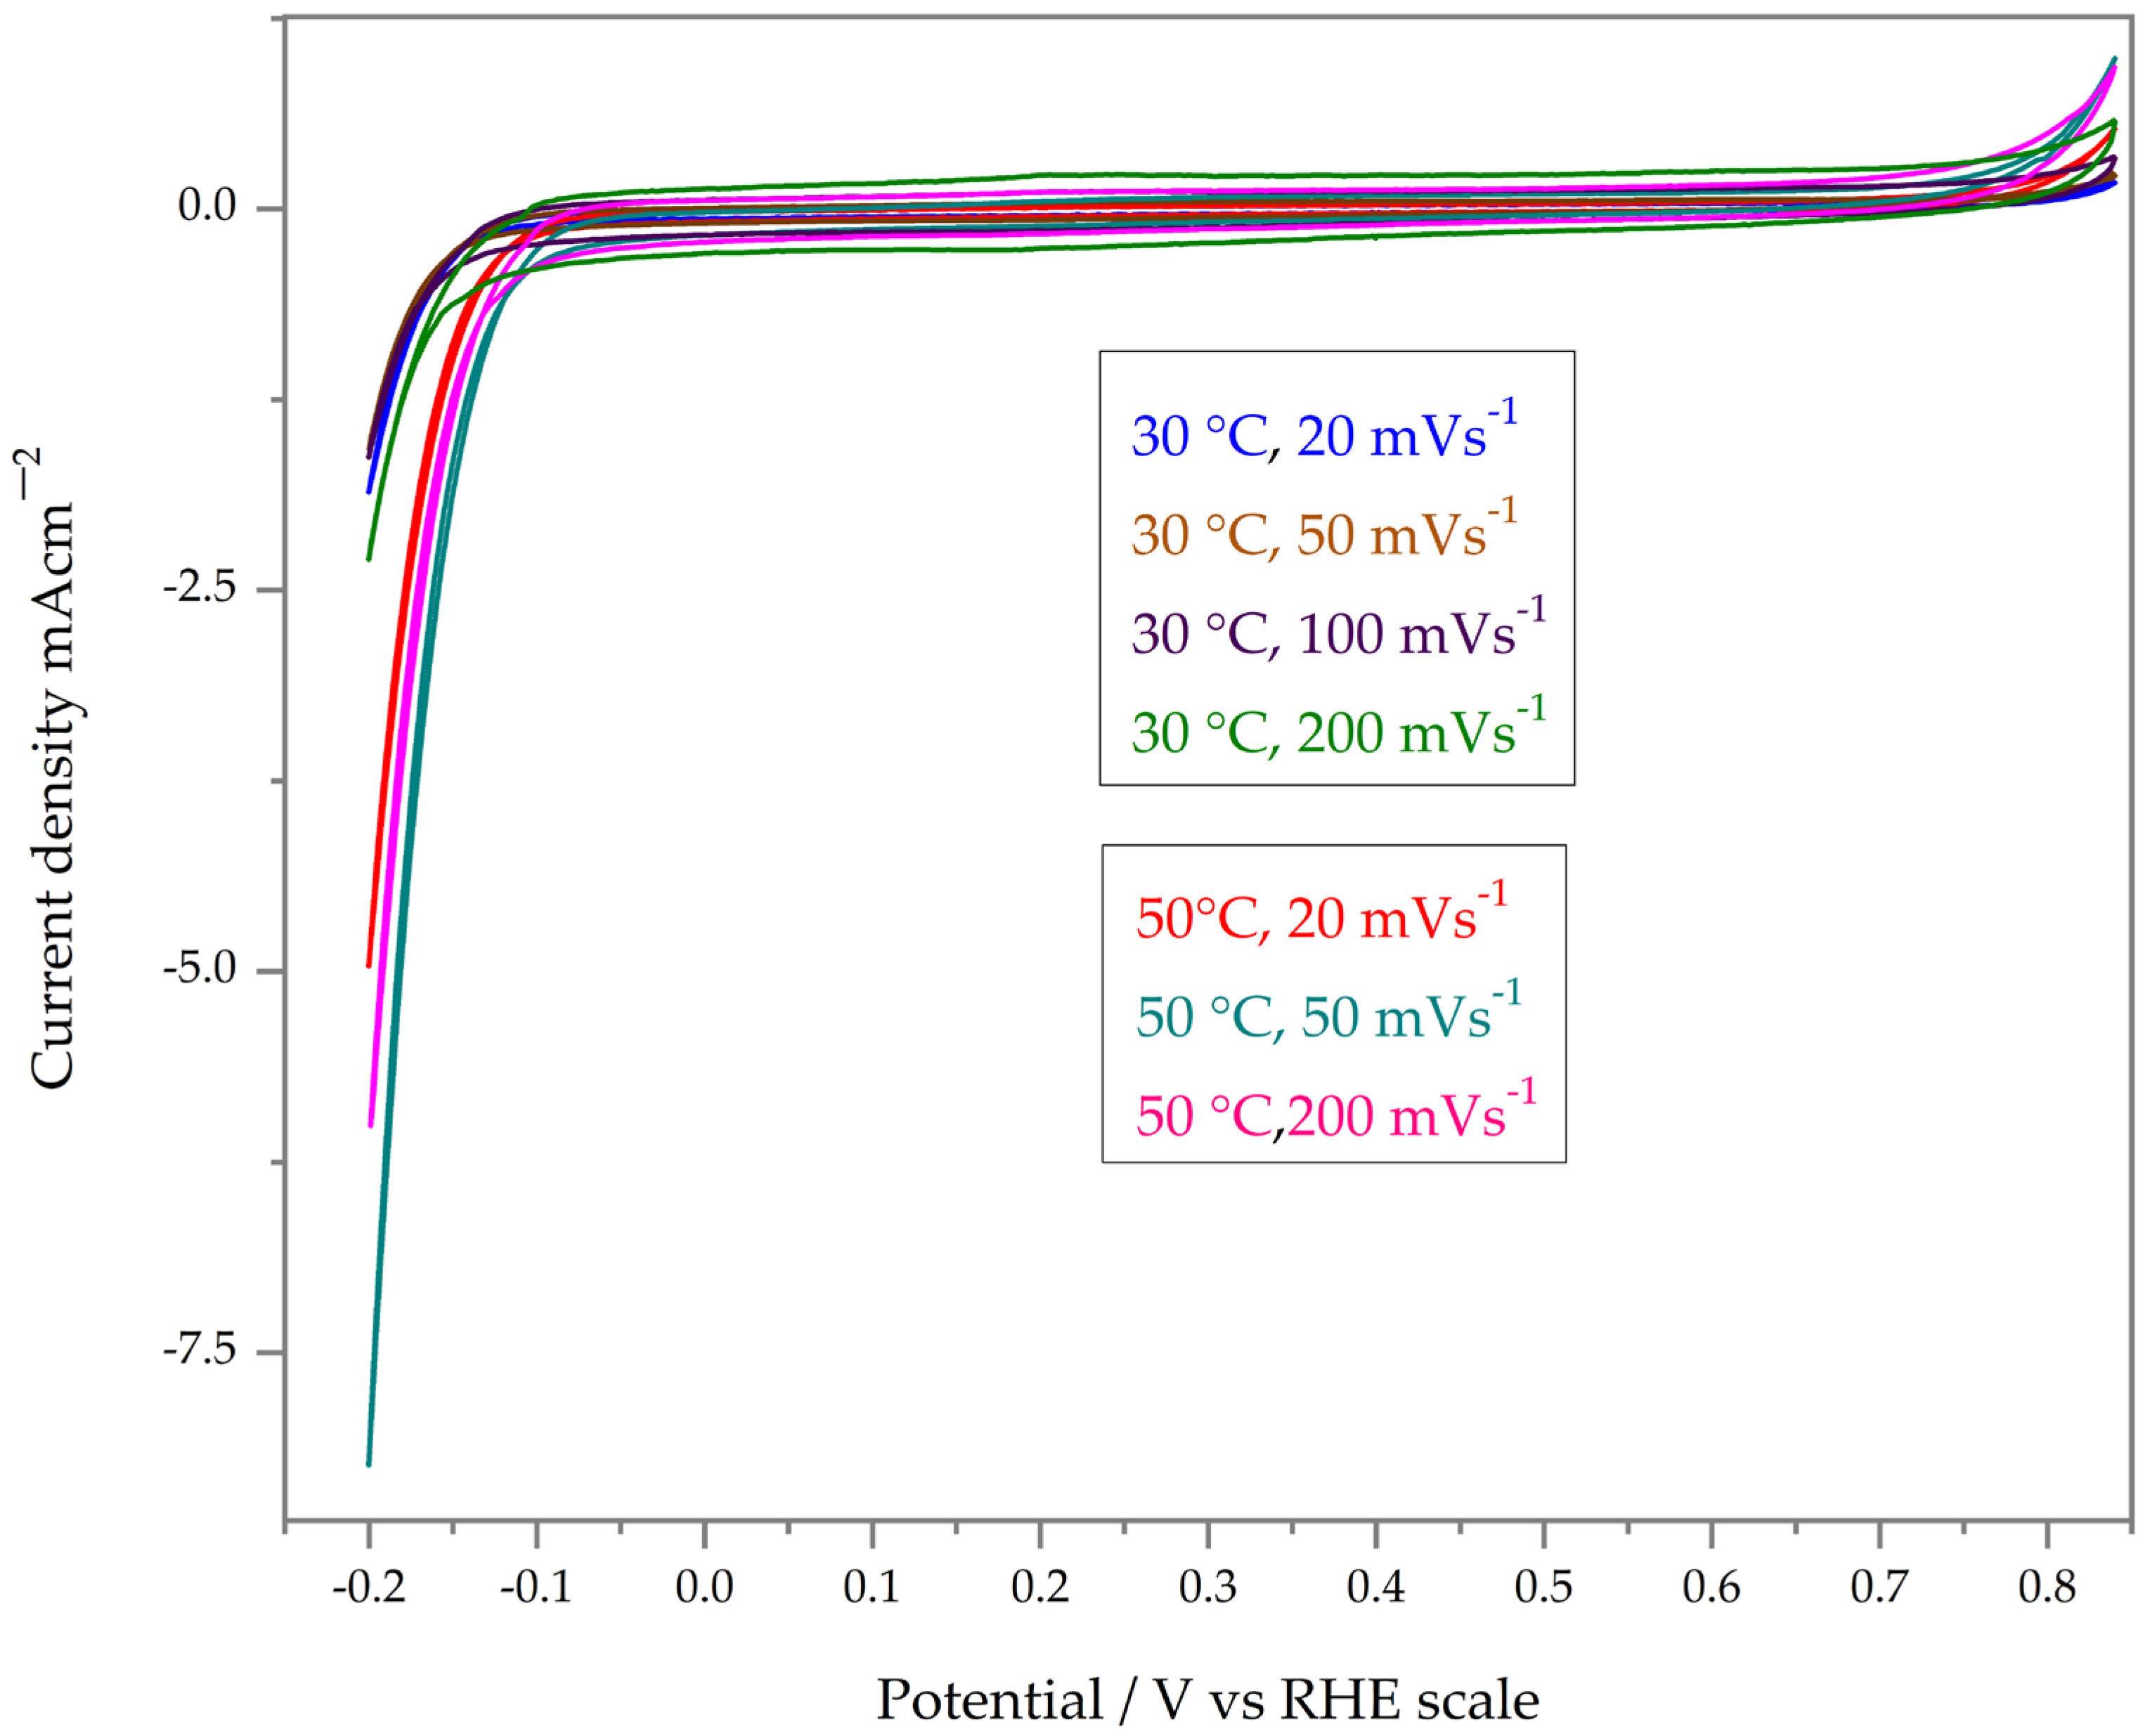
The voltammograms presented in Figure 2 were recorded at varying temperatures and revealed the same three characteristic regions previously observed at room temperature (Figure 1). These voltammograms, obtained in aqueous methanol solutions, closely resemble those reported in acidic media [12]. Importantly, no additional features emerged in the presence of methanol. The primary motivation for conducting cyclic voltammetry across different temperatures was to assess whether the hydrogen evolution reaction (HER) was inhibited. The data in Figure 2 demonstrate that metallic rhenium functions as a promising cathode material for hydrogen generation in non-purified water.
As shown in Figure 2, the rate of hydrogen production increased with temperature, which is consistent with the Arrhenius relationship predicting an increase in J0. Furthermore, the overpotential decreased with increasing temperature, a trend commonly observed in electrocatalytic systems. Notably, the current density at −0.2 V was reduced by approximately 30–50% compared with values reported in the absence of methanol in earlier studies [1]. While HER suppression is pronounced on several metals, the inhibitory effect of methanol on rhenium is relatively weak.

2.3. Voltammetry in the Double-Layer Region

Electrochemical studies conducted across varying scan rates and temperatures sought to identify signatures attributable to methanol electrooxidation or adsorption; however, no additional features were detected. The double-layer current in the voltammograms remained invariant under diverse operational conditions (Figure 2). Within the potential window of 0.0–0.6 V, the anodic current density ranged from 0.1 to 0.2 mAcm−2, whereas the cathodic current density varied between −0.2 and −0.4 mAcm−2. These observations indicate that metallic rhenium undergoes ion adsorption and desorption in the double layer through the same process across multiple temperatures and scan rates. Over 50 consecutive cycles, the voltammograms consistently exhibited the same current density as that shown in Figure 2.
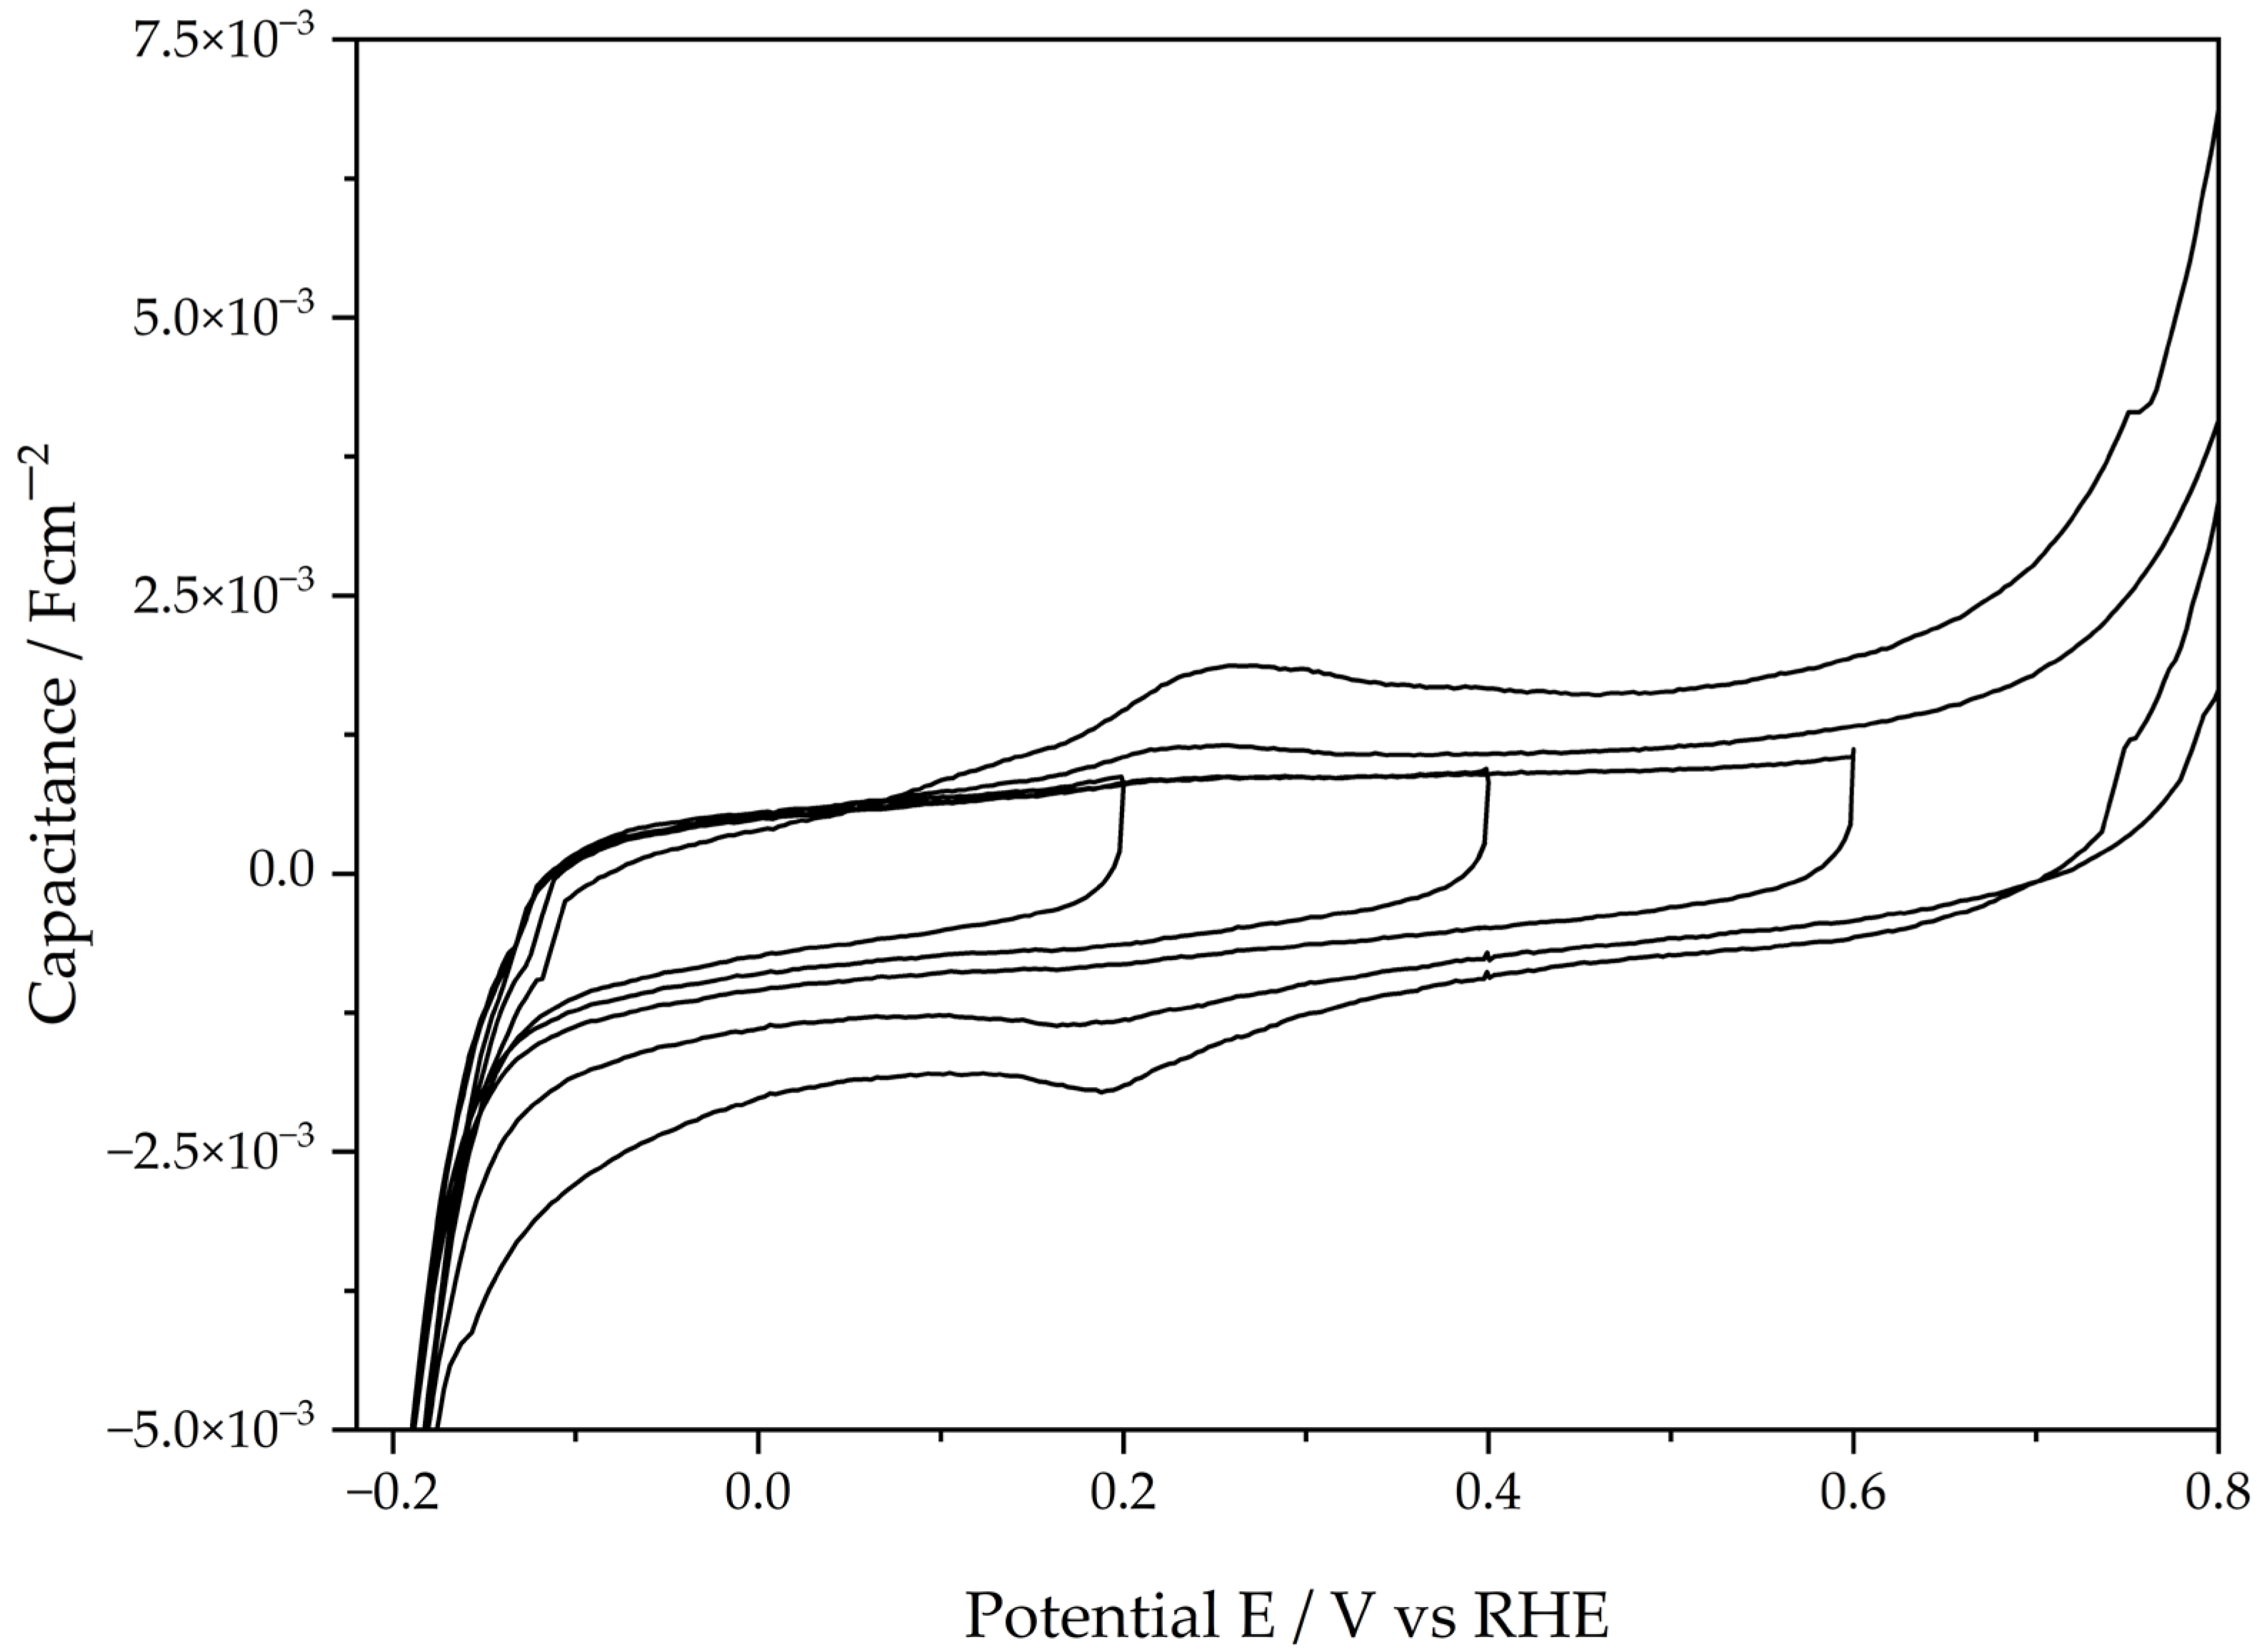
In the double-layer region, a modest 2% difference was observed between the anodic currents in acidic methanol solutions [1]. To clarify the features of the double layer, the upper potential limit of the voltammetric scans was systematically extended, as illustrated in Figure 3. In these voltammograms, the y-axis represents the capacitance, a distinction that will be elaborated upon later.
The voltammograms exhibit no discernible peaks when the switching potential is below 0.88 V; in contrast, a pair of peaks emerges at a switching potential of 0.88 V. At potentials exceeding 0.6 V, the anodic current is associated with the corrosion process, yielding anionic products R e O 4 . During the subsequent cathodic sweep, these anions undergo electrodeposition (reaction (1)). This phenomenon, which is consistent with the observations described in the preceding section, indicates that the electrode surface comprises a mixture of metallic rhenium and immobilized oxides [16,17]. Following electrodeposition, a distinct pair of peaks emerges within the potential range of 0.2 V to 0.4 V. These peaks are related to superficial oxides with possible oxidation states of Re(IV) and Re(VI) [16,17]. The half-wave potentials of these peaks in aqueous acidic methanol solutions were calculated via the following equation:
E 1 / 2 = E c E a 2 = 0.24 V
The experimental half-wave potential ( E 1 / 2 = 0.24   V ) is very close to the potential ( E 1 / 2 = 0.21 V) reported for acidic solutions [12]. The double-layer capacitance can be studied only if the potential does not exceed 0.6 V (Figure 3). To characterize the electrode, the electrical capacitance was calculated with the consideration that the faradaic current ( I f a ) is equal to zero in Equation (3), and then the total current (I) is related exclusively to the capacitance current ( I C ).
I = I f a + I C
At this point, several important parameters are recalled, such as the scan rate ( v = d E d t ). Note that t is the time at which the potential E was applied. It also recalls the definition of the specific capacitance ( C s c ) and finally recalls the definition of the electrical current ( I c ):
I c = d Q d t
where Q is the electrical charge. Consequently, the capacitance was calculated with the following equation:
I C = d Q d t = d Q d t d E d E = C s c d E d t = v C s c
and rearranging Equation (5) gives
C s c = I v
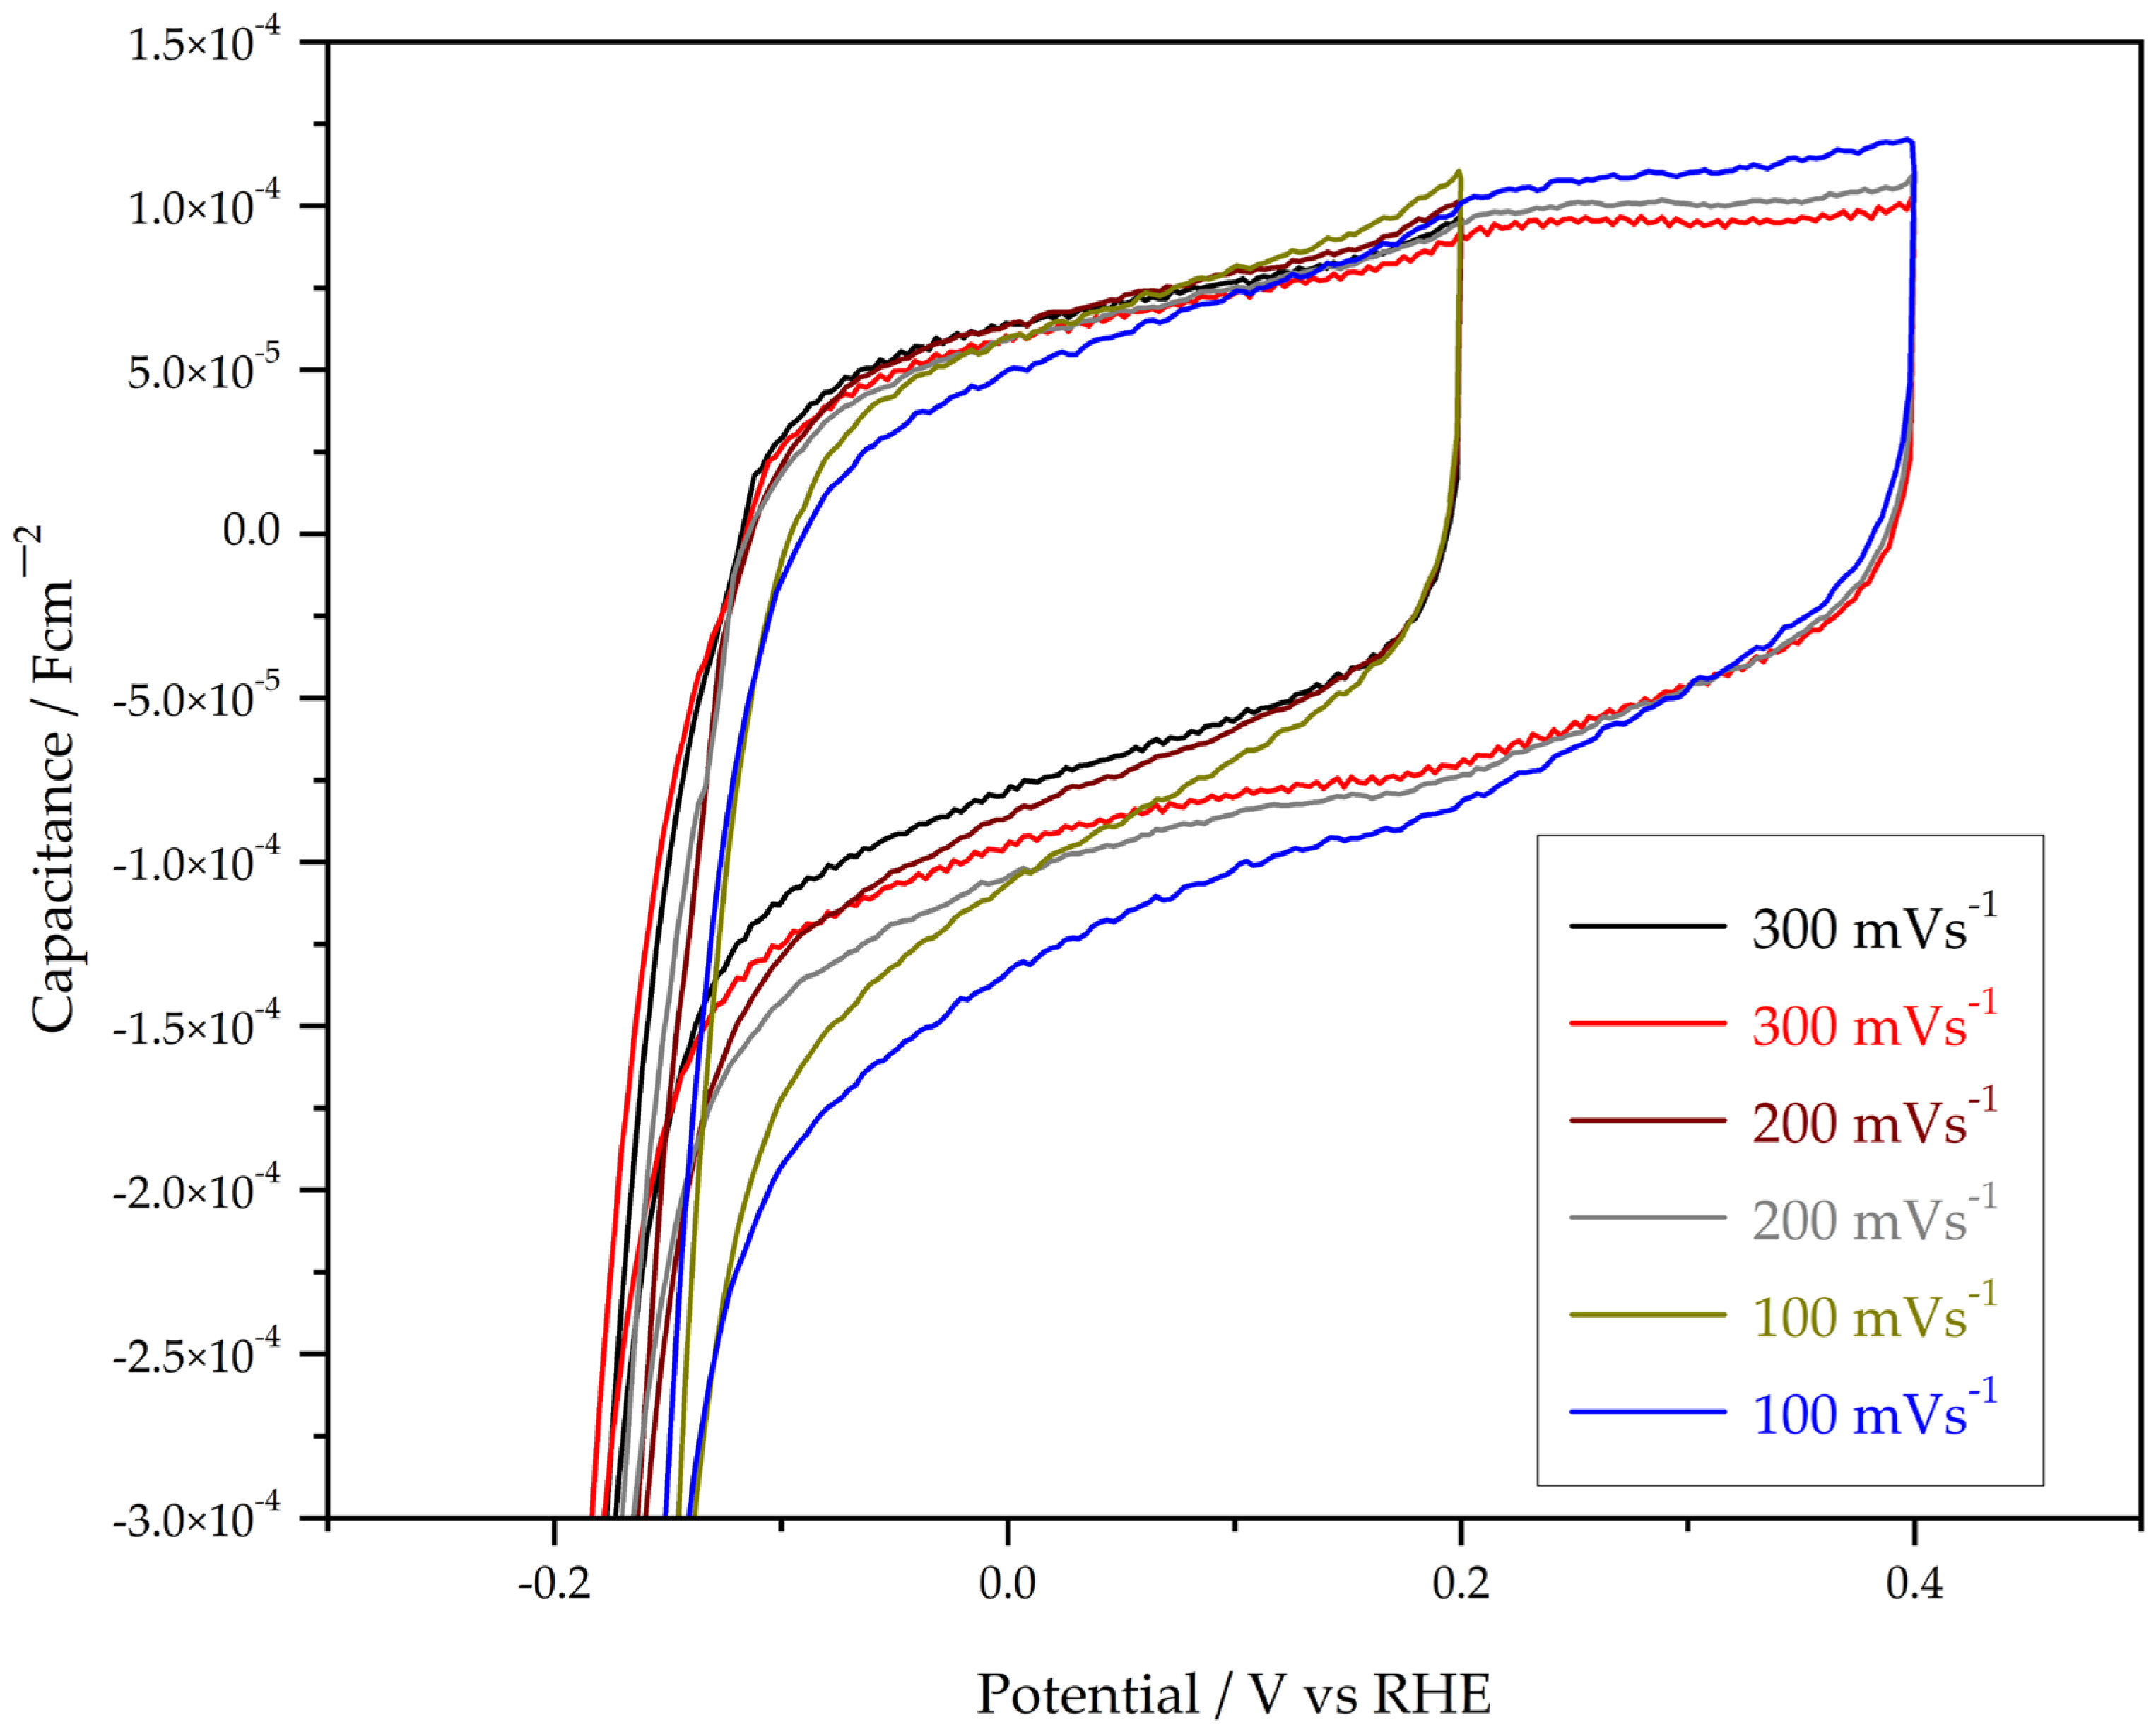
The capacitances calculated on the basis of Equation (6) are plotted in Figure 4 as the vertical axis [12]. Successive voltammograms demonstrate that the capacitance remains invariant with respect to the sweep rate. Consequently, the observed current arises from the adsorption and desorption of chemical species at active surface sites. In Figure 4, at a potential of 0.35 V, the specific capacitance varies from 99.6 μF in the anodic direction to 29.5 μF in the cathodic direction.
The electroactive surface area ( A e in cm2) is directly proportional to the double-layer capacitance as follows:
A e = C s c C r e f = C s c 20 μ F c m 2
The reference values ( C s c ) of the capacitance are between 15 μFcm−2 and 110 μFcm−2 in sulfuric acid for several metals. A C r e f = 60 μ F c m 2 is the capacitance for an ideally smooth electrode used in rhenium-based materials [18].
In Figure 4, the average value of the capacitance in the cathodic scan is 500 μFcm−2, which is greater than the values of the double-layer capacitance of metallic electrodes reported elsewhere [19]. At 0.35 V, no obvious faradaic reactions occur, and the double-layer charging region ( C s p ) can be used for a gross estimation of A e . If the anodic or cathodic current from Figure 4 is considered, then the electroactive area falls in the range from 1.7 cm2 (anodic) to 0.5 cm2 (cathodic). Notably, the value of 1.7 cm−2 is an overestimation, and the real surface is probably near 0.5 cm−2, which is the order of magnitude of the geometric area (0.161 cm2). The roughness of the surface could be linked to the high area of the electrode, but most of the capacitance is associated with several layers of species present in the interphase electrode solution. In addition, the values of A e imply that the exchange current in Table 1 could be lower; however, this current should be on the order of 10−7 A cm−2.
The capacitances are invariant with respect to the scan rate (Figure 4), indicating that the observed currents arise from charge accumulation at the electrode surface rather than diffusion-controlled processes or surface reactions. On the basis of capacitance analyses [1,12,19] and the cyclic voltammograms in Figure 4, the double-layer region is governed by a rapid adsorption–desorption process involving unidentified surface species. Detection of this process requires high scan rates, which is consistent with the fact that polycrystalline rhenium attains a stationary HER state within milliseconds [20]. Accordingly, the capacitance current in the double-layer region reflects the adsorption–desorption dynamics at the electrode surface. To further elucidate the nature of the adsorbed species, ex situ XPS spectra were acquired.

2.4. Ex Situ X-Ray Photoelectron Spectroscopy Measurements After Electrolysis

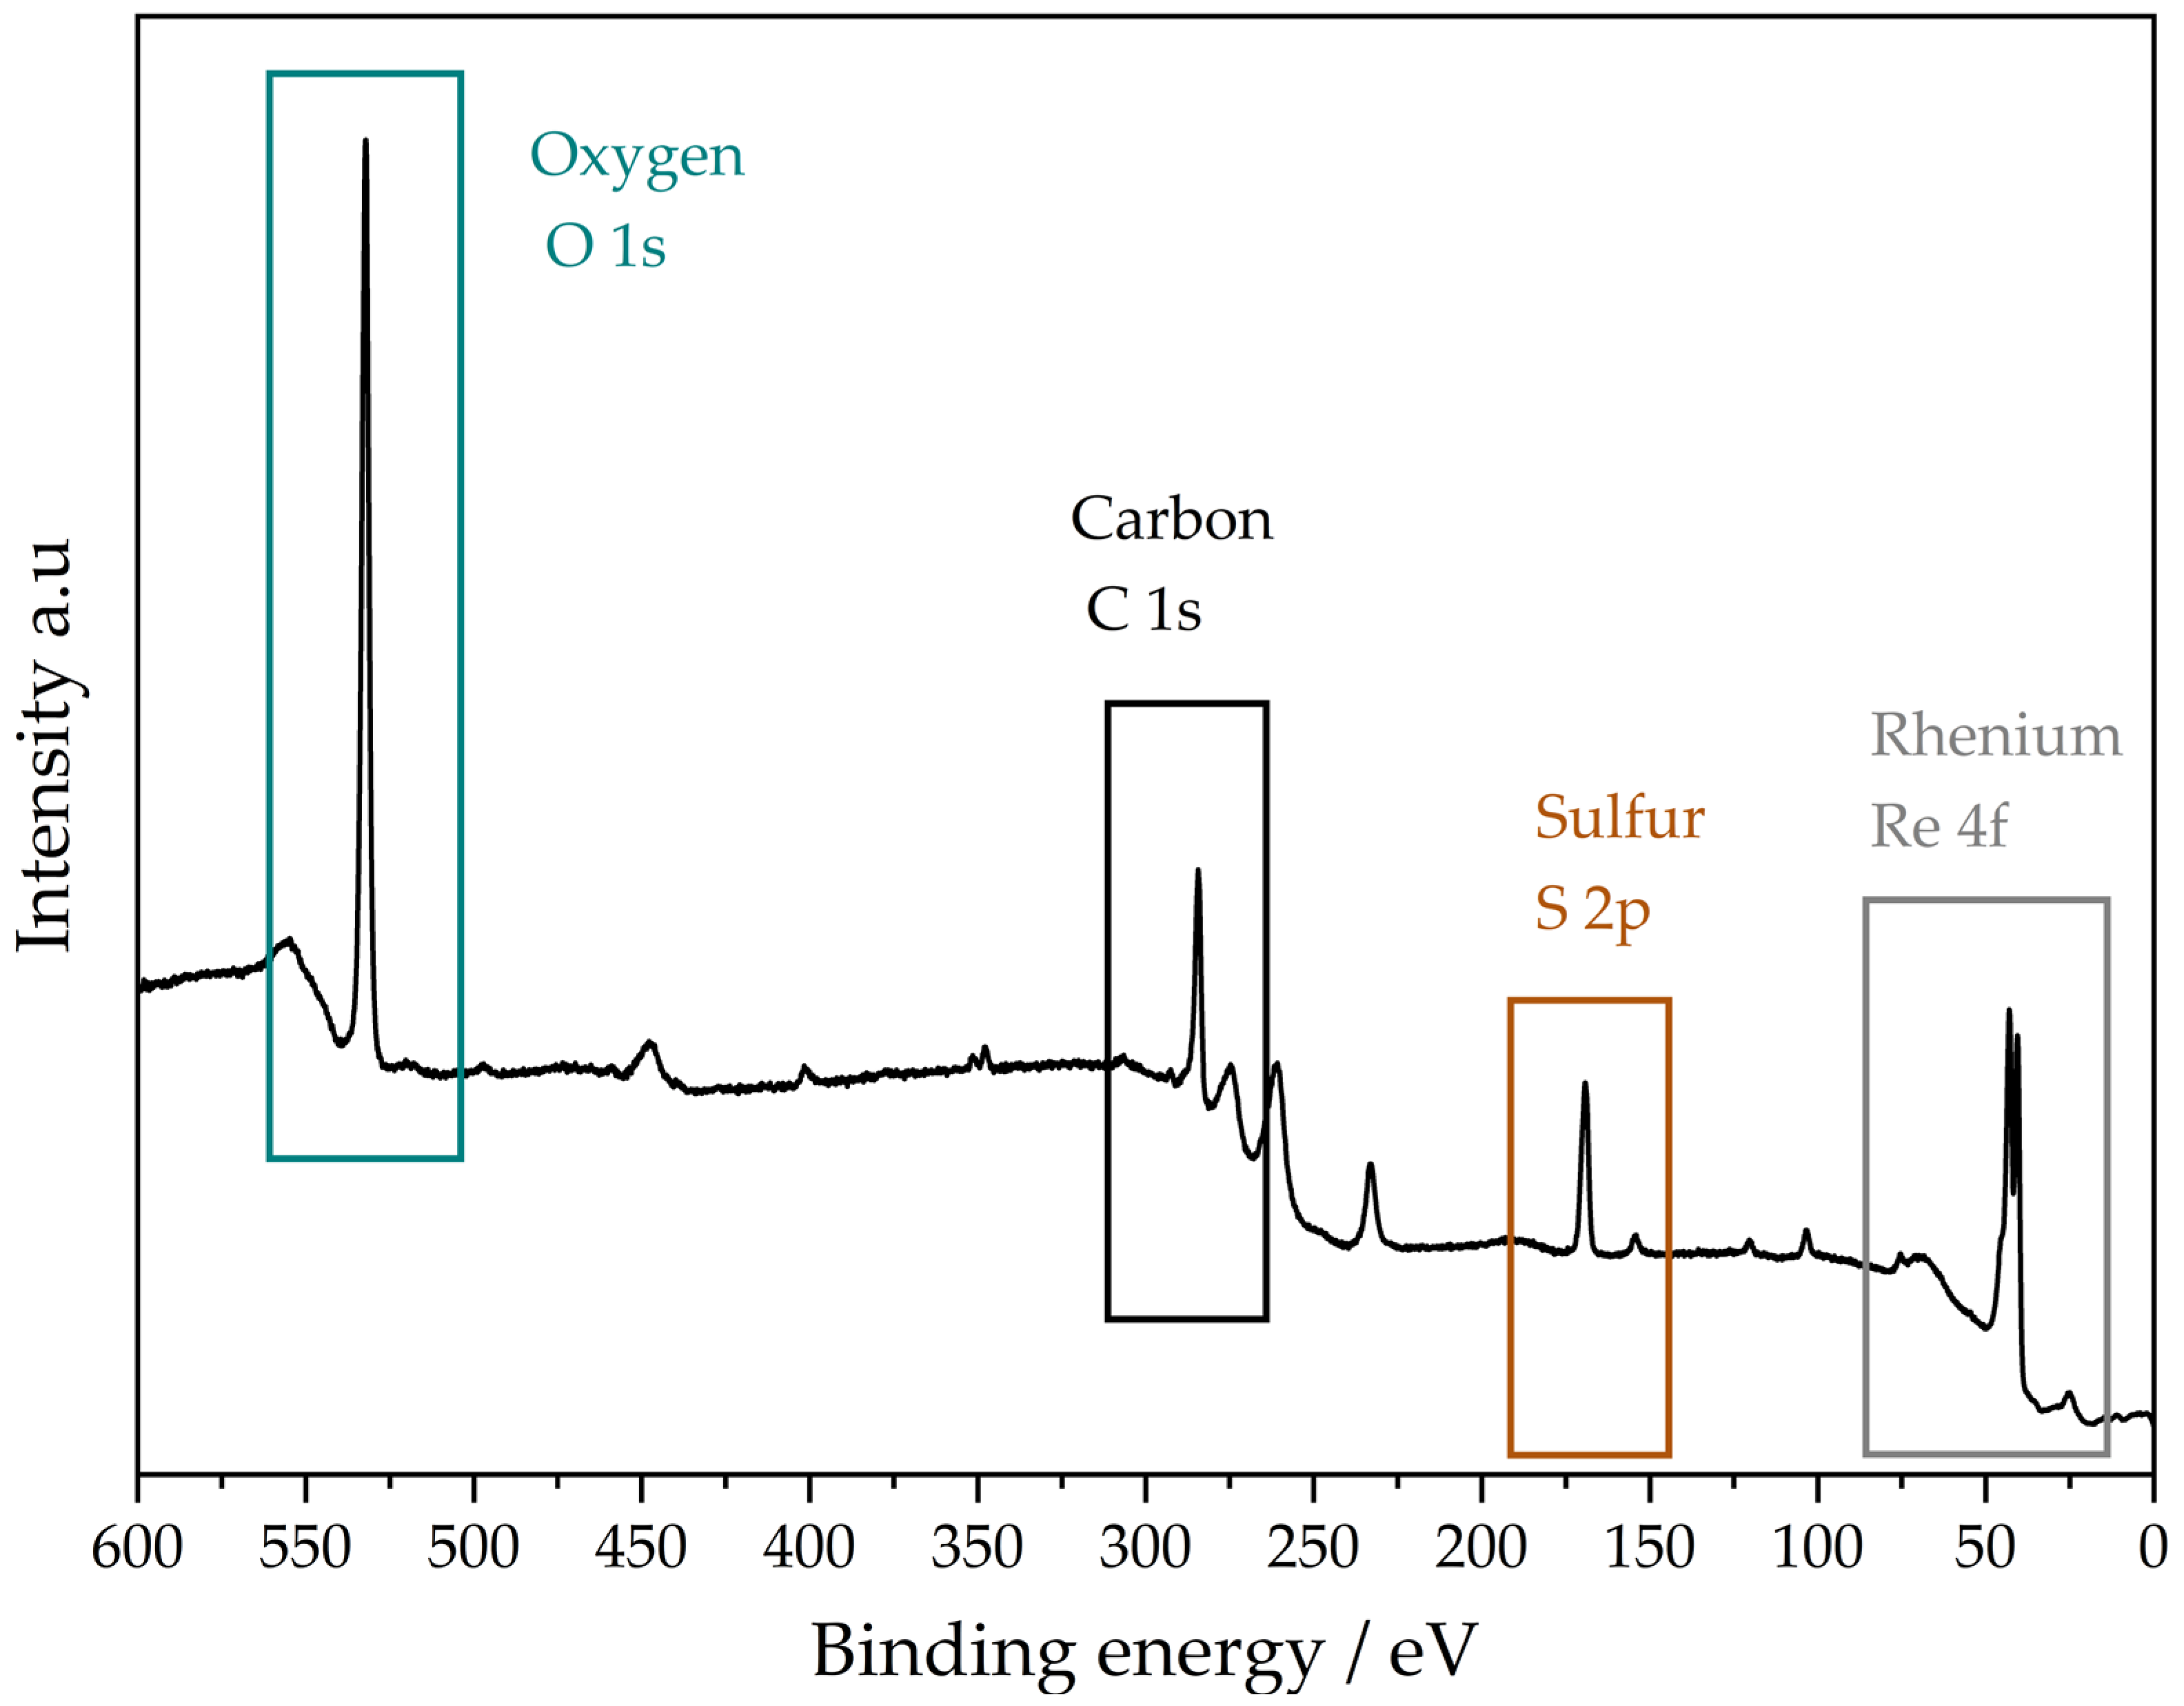
Ex situ X-ray photoelectron spectroscopy (XPS) is critical for understanding the surface composition of electrocatalysts and characterizing catalyst surfaces with thicknesses of up to 10 nm [21]. The electrode was polarized at −0.4 V to eliminate the native oxide and immediately polarized at other potentials to ensure the adsorption of chemical species on the clean surface; however, the potential of the electrodes was never greater than 0.4 V to prevent the influence of oxide formation (Figure 3). The XPS spectra provide evidence of the surface species in the potential interval from −0.4 V to 0.4 V (Figure 5). Table 2 lists the significant binding energies [22], and Table S1 provides more details of the deconvoluted bands. This simple picture in Table 2 is derived on the basis of the following claims:
  • Notably, on Pauling’s scale, rhenium has a low electronegativity (1.9), whereas oxygen has a substantially higher value (3.5) [23]. As a result, when rhenium forms a bond with oxygen, charge transfer occurs toward the more electronegative atom. The redistribution of the electron density imparts a partial positive character to the rhenium atom, thereby increasing the binding energy.
  • The core-level electrons of rhenium (Re 4f7/2 near 41 eV) and oxygen (O 1s, ~532 eV) are related to chemisorbed oxygen. In addition, these bands and the sulfur core-level electrons (S 2p3/2 ~169.0 eV) enabled the designation of sulfate as an adsorbed species on the surface. Moreover, the binding energy of rhenium increases approximately to the core-level electrons of Re(I).
  • Wahlqvist et al. [24] reported a binding energy S 2p3/2 of H 2 S O 4 at 169.0 eV; thus, discriminating between sulfate and bisulfate adsorption is not possible. Consequently, the two structures of sulfate adsorbed are equivalent ( R e 2 1 S O 4 2 or R e + H S O 4 ). These species are observed at all potentials in Table 2.
  • The data analysis in this section aligns with the interpretations of Dupin et al. [25], who reviewed the spectra of several transition metal oxides: (a) O 1s bands in the 529–530.5 eV range are characteristic of the O 2 ions of the crystalline network of the oxides; (b) in the case of the hydroxide compounds ( O H a d s ), the range of O1 s binding energies is from approximately 530.3 eV to 531.1 eV; (c) in the 531.1–532. eV range, these binding energies are related to the lower electron density of the oxygen atoms. These oxide ions are described as O δ ( δ < 1 ) species; and (d) the binding energies, in the range of 532–533 eV, are associated with weakly adsorbed species O a d s . These criteria were used to assign the species on the surface in Table 2.

Table 2. The proposed species of rhenium formed at several potentials in 0.5 M H 2 S O 4 and 1 M C H 3 O H solutions. Bands were not observed (NO). The detailed data of the deconvoluted bands are listed in Table S1 According to Dupin et al. [25], the lower binding energy value is assigned to strongly bonded oxygen (530.9 eV), the middle binding energy value to O 1 ions (531.8 eV–532.6 eV), and the higher binding energy value to weakly bonded oxygen on the surface (533.0 eV–533.1 eV).
Potential V
−0.40−0.100.35
R e 2 1 S O 4 2 R e 2 1 S O 4 2 R e 2 1 S O 4 2
Re 4f7/2, 41.0 eV
S 2p3/2, 169.3 eV,
O 1 s, 532.6 eV
Re 4f7/2, 40.8 eV,
S 2p3/2, 169.0 eV,
O 1 s, 531.8 Ev
Re 4f7/2, 41.4 eV,
S 2p3/2, 169.1 eV,
O 1 s, 531.9 eV
NO R e χ O R e σ * R e χ O R e σ *
Re 4f7/2, 40.2 eV
Re 4f7/2, 40.5 eV
O 1 s, 533.0 eV
Re 4f7/2, 40.3 eV
Re 4f7/2, 40.7 eV
O 1 s, 533.1 eV
NONO R e 2 ( O H ) 2
Re 4f7/2, 42.1 eV
O 1 s, 530.9 eV
R e 3 1 O 3 c h e m R e 3 .NONO
Re 4f7/2, 40.6 eV
Re 4f7/2, 43.2 eV
O 1 s 532.0 eV
* ( 0 < χ < 1 ), ( 0 < σ < 1 ).
The most effective strategy was to integrate information derived from the high-resolution XPS spectra of oxygen, sulfate, and rhenium. This methodology is relatively uncommon, as most studies do not examine the core-level electrons of oxygen and typically consider the oxidation states inferred solely from the rhenium core levels to be sufficient. For example, Cao et al. [26], who employed N a 2 S O 4 as a supporting electrolyte, restricted their analysis to rhenium core-level electrons and did not account for sulfate adsorption.
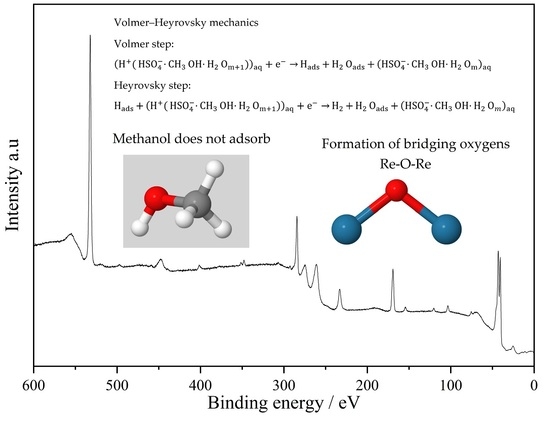
The XPS results in acidic methanol solutions are summarized in Figure 5, and the detailed spectra are displayed in Figures S1–S5. The core-level (Re 4f, O 1s, C 1s, and S 2p) spectra in Figure 5 noticeably reveal rhenium, oxygen, and sulfate species. The C 1s peak is used as a charge reference for the XPS spectra, and the adsorption of methanol is discarded (see Section S.1 in the Supplementary Materials). The number of convoluted bands of rhenium species does not match the number of convoluted bands of oxygen. This dilemma can be solved with the supposition that there are oxygen bridges between rhenium atoms. In this regard, Chen et al. [27] reported that rhenium atoms are connected to several oxygen atoms by a bridging oxygen (HO–Re–O–Re–OH). In Table 2, the core-level electrons of oxygen (O 1s from 531.8 eV to 532.6 eV), sulfur (S 2p3/2 ~169.0 eV), and rhenium (Re 4f7/2 from 40.8 eV to 41.4 eV) suggest the adsorption of sulfate ( R e 2 1 S O 4 2 ), and this adsorption is observed during electrolysis at all potentials. During electrolysis at −0.1 V or 0.35 V, oxygen formed an R e χ O R e σ ; that is, the surface is composed of rhenium atoms bearing a positive charge below unity ( χ < 1 , σ < 1 ), which assemble into interfacial oxo-bridged dimers. In addition, during electrolysis at 0.35 V (Table 2), the surface electrode begins to form an incipient oxide ( R e 2 ( O H ) 2 ).
The data presented in Table 2 indicate that the capacitance current observed in Figure 4, in the double-layer potential region, is an adsorption–desorption process involving oxygen and sulfate molecules. Spectroscopy is widely employed for the characterization of rhenium catalysts; however, only a limited number of studies have inferred oxide formation on the basis of oxygen and rhenium XPS spectra [28,29]. Greiner [29] highlights the inherent difficulty in distinguishing between surface and subsurface oxides, noting further that the surface comprises multiple interlayers with thicknesses ranging from 30 to 50 nm. ReO oxide has been observed by XPS measurements [28,29], and R e 2 ( O H ) 2 forms under aqueous conditions.
The detection of Re(III) at −0.4 V (Table 2) represents the most intriguing outcome. Remarkably, the emergence of a high oxidation state under a cathodic current is difficult to rationalize. The oxide reported in Table 2 arises from a direct interpretation of the rhenium and oxygen spectra, yet no reference in the literature provides guidance for such an assignment. Future investigations are expected to clarify this dilemma and others; however, it is important to emphasize the following unresolved issues concerning the hydrogen bubble formation reaction: (1) the generation of subsurface hydrogen at very high current densities [30], (2) the occlusion of hydrogen within rhenium electrodeposits [31], and (3) the formation of a rhenium anion with a negative oxidation state ( R e ) under extreme current densities [30].

2.5. Rhenium Cathodes as Materials for Electrolysis

Few materials have been systematically assessed as cathodes for hydrogen generation in methanol electrolysis ( P t , P t R u , and Pt–W) [32,33] or wastewater electrolysis (Al, graphite, stainless steel, CuZn, and T i ) [34]. None of these investigations has considered rhenium, despite its established role in heterogeneous catalysis owing to its resistance to poisoning by organic compounds. Collectively, these studies delineate a continuum of candidate materials spanning both extremes of the performance–cost axis: some exhibit exceptional catalytic activity yet remain prohibitively expensive, whereas others are economically viable but deliver modest efficiency. Rhenium occupies an intermediate position within this spectrum. It is less costly than platinum–ruthenium alloys, albeit with reduced performance; conversely, it surpasses steel in catalytic efficacy, although at a higher economic burden. This duality underscores rhenium’s nuanced role as a compromise between cost and performance in electrochemical hydrogen production.
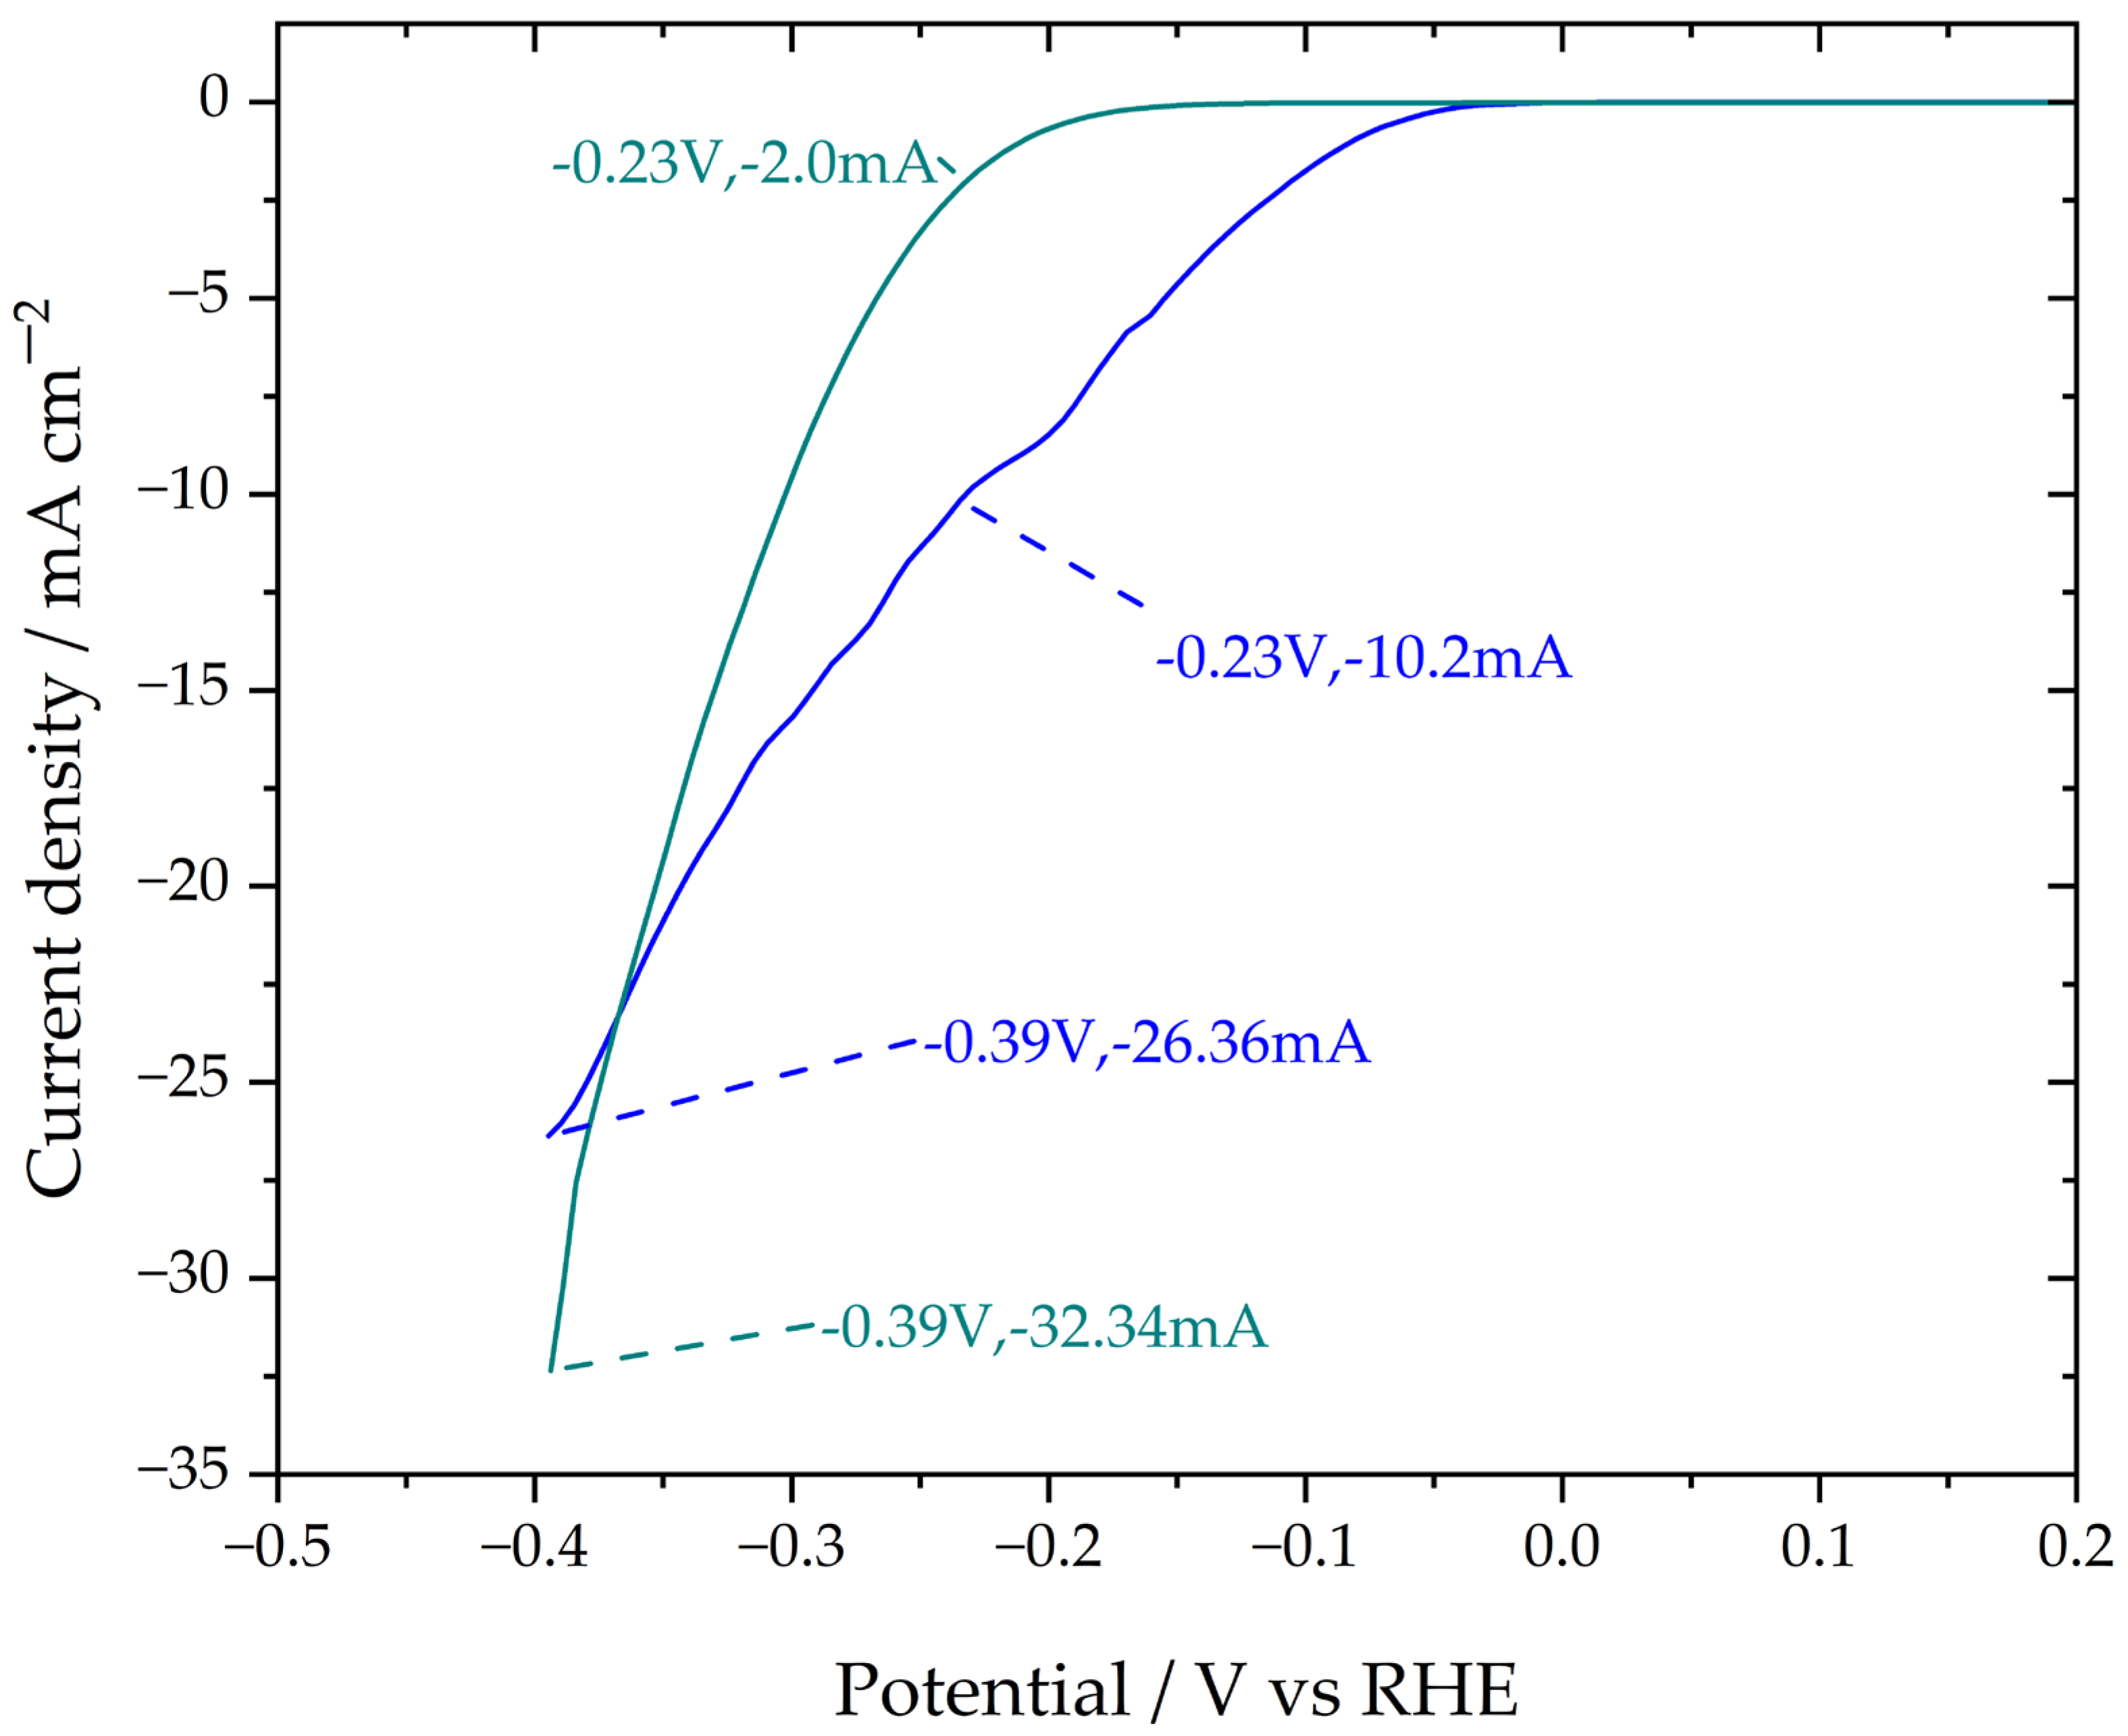
In methanol–water co-electrolysis for hydrogen generation [32,33], the methanol electrooxidation reaction (anode MOR) and hydrogen evolution reaction (cathode HER) proceed simultaneously within the electrolysis cell. In these systems, a membrane typically separates the anolyte and catholyte to prevent cathode passivation by methanol adsorption. As shown in Figure 6, hydrogen gas was produced in a membraneless cell employing platinum and rhenium cathodes. This approach has only previously been reported by Si et al. [35], who utilized N i C o 2 S 4 as the cathode. While methanol attenuated the hydrogen evolution reaction (HER) on both cathodes, the process nonetheless proceeded, and hydrogen bubble formation was not suppressed. At an applied potential of 0.2 V, platinum (blue trace) exhibits superior catalytic activity compared to rhenium (cyan trace). Conversely, at 0.4 V, rhenium outperforms platinum, indicating that operation at elevated overpotentials has a distinct advantage. Rhenium is approximately twenty times less costly than platinum, positioning it as a highly promising candidate for incorporation into methanol electrolysis systems.

3. Discussion

The Tafel slopes reported in Table 1 indicate that the hydrogen evolution reaction (HER) on metallic rhenium proceeds via the Volmer–Heyrovsky mechanism, which is consistent with the model successfully developed by Lasia [15] in acidic media. The identification of the surface species was conducted by analyzing the core-level electrons of rhenium, oxygen, and sulfate. The ex situ XPS spectra summarized in Table 2 indicate that hydrogen reactions yield hydrogen adatoms ( H a d s ), physisorbed oxygen ( O a d s ), and chemisorbed sulfate ( R e 2 1 S O 4 2 ). The adsorption of these ions on the rhenium surface is strongly influenced by sulfate solvation phenomena [1,14] and the structure of hydrated protons [36]. In this context, vibrational spectroscopy studies of sulfuric acid–methanol–water mixtures have shown that sulfate anions form strong hydrogen bonds with surrounding water molecules [37]. At high concentrations, methanol and sulfuric acid react to form methyl hydrogen sulfate, which is solvated by at least four water molecules, thereby establishing an extended hydrogen-bond network [37,38,39]. Furthermore, Rozenberg et al. [40] demonstrated that vapors containing sulfuric acid, methanol, and water exhibit a stable configuration of H 2 S O 4 · C H 3 O H · H 2 O sustained by hydrogen bonding. On the basis of references [36,37,38,39,40], we hypothesize that the hydrogen-bond network adopts the following structure: ( H 2 O ) z H O H H S O 3 O H O C H 3 ) a q + . With this framework in mind, a Volmer–Heyrovsky mechanism can be proposed:
( H H 2 O ) m + 1 aq + + e H ads + H 2 O a d s + ( H 2 O ) m a q
( ( H 2 O ) z H O H H S O 3 O H O C H 3 ) a q + + H 2 O a d s + H a d s + e H 2 + ( H S O 4 ) a d s + O a d s + ( ( H 2 O ) z + 1   ) a q + ( C H 3 O H 2 ) a q 0
Importantly, the Tafel slopes (Table 1) and ex situ XPS spectra (Table 2) suggest the formation of interfacial oxo-bridged dimers ( R e χ O R e σ ) and chemisorbed sulfates ( R e 2 1 S O 4 2 or R e 1 S O 4 ). In this context, reactions (8) and (9) generate adsorbed species within the HER region. Consequently, the capacitance of the double-layer current is governed by the adsorption–desorption dynamics of sulfate ions on the rhenium surface, as well as by the hydration of surface oxides. This adsorption–desorption process accounts for the capacitance behavior observed in Figure 4.
As shown in Figure 6, metallic rhenium is a promising candidate for hydrogen production via methanol electrolysis in membraneless cells. Notably, the low susceptibility of rhenium to catalytic poisoning indicates that this element may represent a promising candidate for wastewater electrolysis. Methanol, employed as a probe molecule, effectively simulates aqueous environments enriched with organic contaminants. The observed interactions between methanol and rhenium further support the potential application of this metal in electrochemical processes designed for wastewater treatment. Future investigations are expected to evaluate the performance of rhenium under prolonged operating conditions, thereby offering deeper insights into its potential for practical applications.
Chen et al. [41] have raised concerns regarding platinum dissolution from counter electrodes, particularly the extent to which Pt contamination may introduce artifacts into experimental data. In the XPS spectrum (Figure 5), the weak features at 71.6 eV and 74.9 eV tentatively indicate the presence of platinum on the cathode surface. Nevertheless, even if trace amounts of Pt contaminate the rhenium electrode, their influence is not evident in either the Tafel slope or the exchange current density.

4. Materials and Methods

4.1. Materials and Chemicals

All the reagents were of analytical grade; for example, methanol had a purity of 99.6% (Sigma-Aldrich, Burlington, VT, USA), and sulfuric acid was 97.97% pure (J.T. Baker). The methanol aqueous solutions were prepared with Millipore Milli-Q Plus treated water (conductance at 11 MΩ cm−2). These solutions were deaerated with ultrahigh purity nitrogen gas (Infra Praxair, CDMX, Mexico, 99.999%) before the experiments for 30 min, and in the electrochemical measurements, an inert gas atmosphere was maintained over the liquid.

4.2. Electrochemical Studies

The electrochemical measurements were carried out in a three-electrode electrochemical cell (Provitex, Celaya, Mexico). Rhenium wire (Sigma-Aldrich 99.9%) was used as the working electrode (geometric area of 0.161 cm2), and a platinum wire was used as the counter electrode. A mercury sulfate reference electrode was saturated with potassium sulfate; however, in the text, the potentials refer to the scale of the reversible hydrogen electrode (RHE).
Prior to the electrochemical measurements, the rhenium electrode was polished on a microcloth (Buehler Ltd., CDMX, Mexico) and rinsed with ultrapure water (11 MΩ cm−2), after which the electrode was immersed in an ultrasonic bath for 5 min. The electrochemical studies were performed in an Autolab potentiostat–galvanostat PGSTAT 302 (Utrecht, The Netherlands). First, a constant potential of −0.4 V was applied to the rhenium electrode for 30 min, after which the electrochemical measurement was performed. All the solutions were bubbled with nitrogen or hydrogen gas prior to the measurements, and the supernatant gas atmosphere was maintained constant during the experiments. The electrochemical measurements were carried out in a three-electrode cell.

4.3. X-Ray Photoelectron Spectroscopy Measurements

After the electrochemical test, the electrodes were transferred to an inert atmosphere inside a desiccator and carefully introduced into the XPS chamber, reducing their exposure to air. X-ray photoelectron spectroscopy (XPS) measurements were conducted on a Thermo Scientific™ K-Alpha™ X-ray photoelectron spectrometer system (Thermo Fisher Scientific, Waltham, MA, USA). The spot area was 200 × 400 μm. The AlKα source produces X-ray radiation at 1486.6 eV. After the electrochemical studies were performed, to avoid contact with air, the sample was carefully transferred to a desiccator in which a nitrogen atmosphere was maintained, and then, the samples were introduced into the analysis chamber (at 3 × 10⁻⁸ Torr) for further analysis.
The peaks were fitted via an asymmetric Gaussian/Lorentzian mixed function at a constant G/L equal to 0.35. Spectral analysis of the XPS peaks was accomplished via CasaXPS Version 2.3.19PR1.0 software. Because of spin–orbit splitting, the peak separation between Re 4f5/2 and Re 4f7/2 was fixed at 2.4 eV. The binding energy scale was internally referenced to the C 1s peak (C–C binding energy at 284.9 eV), and an uncertainty error of ±0.2 eV was expected for all measurements (see Section S.1 in the Supplementary Materials).

5. Conclusions

Our approach integrated voltammetric analysis with ex situ XPS. Spectra were collected following electrolysis at −0.4 V to remove the native oxide layer, after which additional potentials were applied to promote the adsorption of chemical species onto the freshly cleaned surface. Following electrolysis in acidic methanol solutions, ex situ XPS spectra revealed core-level signals corresponding to rhenium, carbon, oxygen, and sulfate species. These measurements revealed oxygen physisorption ( O a d s ) and sulfate chemisorption ( R e 2 1 S O 4 2 or R e 1 H S O 4 ). Mechanistically, the Volmer step generates physisorbed water molecules and hydrogen adatoms, whereas the Heyrovsky step involves hydrogen adatoms reacting within an extended hydrogen-bond network ( ( H 2 O ) z H O H H S O 3 O H O C H 3 ) a q + to produce molecular hydrogen, adsorbed oxygen, and chemisorbed sulfates. The presence of adsorbed oxygen further suggests the formation of interfacial oxo-bridged dimers ( R e χ O R e σ ).
Our contribution lies in elucidating the mechanism of hydrogen gas formation under conditions of elevated methanol concentration. In addition, the results have implications for two distinct electrolysis technologies. First, rhenium cathodes demonstrate efficient methanol electrolysis in membraneless cells. Second, rhenium cathodes have emerged as promising candidates for electrolysis systems operating with unpurified wastewater solutions. The latter application will be the focus of future investigations.

Supplementary Materials

The following supporting information can be downloaded at: https://www.mdpi.com/article/10.3390/catal16050394/s1, Figure S1: Low-resolution XPS survey spectra; Figure S2: Low-resolution XPS survey spectra in the binding energy C 1s region; Figure S3: Low-resolution XPS survey spectra in the S 2p binding energy region; Figure S4: Re 4f spectra of rhenium; Figure S5: XPS spectra of O 1s core levels; Figure S6: Experimental XPS spectra of the as-received rhenium electrode; Table S1: Binding energies (BE). Refs. [12,42,43] are cited in the Supplementary Materials.

Author Contributions

Conceptualization, G.O.; methodology and investigation, J.G.R.; resources and supervision, R.G.-G.; writing—original draft preparation, J.G.R.; writing—review and editing, G.O.; project administration and funding acquisition, J.M.O.-R. All authors have read and agreed to the published version of the manuscript.

Funding

The authors would like to express their gratitude to the Science and Technology Council of the State of Querétaro (CONCYTEQ). This research was funded by CONCYTEQ under grant number CACTI/102/24.

Data Availability Statement

Data are contained within the article and Supplementary Materials.

Conflicts of Interest

The authors declare that they have no conflicts of interest. The funders played no role in the design of the study; in the collection, analyses, or interpretation of the data; in the writing of the manuscript; or in the decision to publish the results.

Abbreviations

The following abbreviations are used in this manuscript:
HERHydrogen evolution reaction
DFTDensity functional theory
XPSX-ray photoelectron spectroscopy
RHEReversible hydrogen electrode
MORMethanol electrooxidation reaction

References

  1. Rivera, J.G.; Garcia-Garcia, R.; Coutino-Gonzalez, E.; Orozco, G. Hydrogen evolution reaction on metallic rhenium in acid media with or without methanol. Int. J. Hydrogen Energy 2019, 44, 27472–27482. [Google Scholar] [CrossRef]
  2. Rivera, J.G.; Orozco, G. Electrochemical Study of Metallic Rhenium in Methanol Acidic Aqueous Solutions. ECS Trans. 2022, 106, 181. [Google Scholar] [CrossRef]
  3. Ling, S.; Mei, D.; Gutowski, M. Reactivity of hydrogen and methanol on (001) surfaces of WO3; ReO3; WO3/ReO3 and ReO3/WO3. Catal. Today 2011, 165, 41–48. [Google Scholar] [CrossRef]
  4. Veerakumar, P.; Pandiyan, R.; Chen, S.-M.; Thanasekaran, P.; Saranya, K. Recent trends and perspectives in rhenium-based nanomaterials for sustainable applications. Coord. Chem. Rev. 2025, 527, 216382. [Google Scholar] [CrossRef]
  5. Ramírez, A.M.R.; Heidari, S.; Vergara, A.; Aguilera, M.V.; Preuss, P.; Camarada, M.B.; Fischer, A. Rhenium-Based Electrocatalysts for Water Splitting. ACS Mater. Au 2023, 3, 177–200. [Google Scholar] [CrossRef] [PubMed]
  6. Ciftci, A.; Ligthart, D.A.J.M.; Sen, A.O.; Van Hoof, A.J.F.; Friedrich, H.; Hensen, E.J.M. Pt-Re synergy in aqueous-phase reforming of glycerol and the water-gas shift reaction. J. Catal. 2014, 311, 88–101. [Google Scholar] [CrossRef]
  7. Gómez, J.; Gardiazábal, J.I.; Schrebler, R.; Gómez, H.; Córdova, R. Electrochemical behaviour of rhenium in aqueous solution. J. Electroanal. Chem. Interfacial Electrochem. 1989, 260, 113–126. [Google Scholar] [CrossRef]
  8. Chotkowski, M.; Czerwiński, A. Electrochemistry of Technetium, Monographs in Electrochemistry; Springer: Cham, Switzerland, 2021; pp. 109–141. [Google Scholar] [CrossRef]
  9. Saleh, M.G.A.; Wanees, S.A.E.; Mustafa, S.K. Catalytic Activity of Modified Electrodes in Fuel Cells. I. The Electrochemical Behavior of Rhenium under Natural Corrosion Conditions. Egypt. J. Chem. 2020, 63, 3607–3618. [Google Scholar] [CrossRef]
  10. Ferrin, P.; Nilekar, A.U.; Greeley, J.; Mavrikakis, M.; Rossmeisl, J. Reactivity descriptors for direct methanol fuel cell anode catalysts. Surf. Sci. 2008, 602, 3424–3431. [Google Scholar] [CrossRef]
  11. Garcia-Garcia, R.; Ortega-Zarzosa, G.; Rincón, M.E.; Orozco, G. The hydrogen evolution reaction on rhenium metallic electrodes: A selected review and new experimental evidence. Electrocatalysis 2015, 6, 263–273. [Google Scholar] [CrossRef]
  12. Rivera, J.G.; Garcia-Garcia, R.; Coutino-Gonzalez, E.; Orozco, G. Electrochemical study in acid aqueous solution and ex-situ X-ray photoelectron spectroscopy analysis of metallic rhenium surface. J. Electroanal. Chem. 2021, 893, 115297. [Google Scholar] [CrossRef]
  13. Chun, J.H.; Jeon, S.K.; Ra, K.H.; Chun, J.Y. The phase-shift method for determining Langmuir adsorption isotherms of over-potentially deposited hydrogen for the cathodic H2 evolution reaction at poly-Re/aqueous electrolyte interfaces. Int. J. Hydrogen Energy 2005, 30, 485–499. [Google Scholar] [CrossRef]
  14. Garcia-Garcia, R.; Rivera, J.G.; Antaño-Lopez, R.; Castañeda-Olivares, F.; Orozco, G. Impedance spectra of the cathodic hydrogen evolution reaction on polycrystalline rhenium. Int. J. Hydrogen Energy 2016, 41, 4660–4669. [Google Scholar] [CrossRef]
  15. Lasia, A. Comments on “the phase-shift method for determining Langmuir adsorption isotherms of over-potentially deposited hydrogen for the cathodic H2 evolution reaction at poly-Re; aqueous electrolyte interfaces” [Hydrogen Energy 30 (2005) 485–499]. Int. J. Hydrogen Energy 2005, 30, 913–917. [Google Scholar] [CrossRef]
  16. Kuznetsov, V.V.; Gamburg, Y.D.; Zhulikov, V.V.; Batalov, R.S.; Filatova, E.A. Re–Ni cathodes obtained by electrodeposition as a promising electrode material for hydrogen evolution reaction in alkaline solutions. Electrochim. Acta 2019, 317, 358–366. [Google Scholar] [CrossRef]
  17. Kanamura, S.; Mizuguchi, K.; Fujita, R.; Kondo, N. Electrodeposition of rhenium species at a stainless steel electrode from acidic, neutral, and alkaline solutions. J. Electrochem. Soc. 2014, 161, D92–D96. [Google Scholar] [CrossRef]
  18. Zhong, G.; Zhao, R.; Shi, Y.R.; Li, C.R.; He, L.; He, L.; Huang, Y. Thermal shock synthesis of carbon nanotubes supporting small-sized rhenium nanoparticles for efficient electrocatalytic hydrogen evolution. Rare Met. 2023, 42, 2166–2173. [Google Scholar] [CrossRef]
  19. Dhayal, S.S. Exploring electrocatalytic and optical properties of organic TDAPA/PMMA thin films for sustainable redox reactions. Int. J. Hydrogen Energy 2025, 112, 198–207. [Google Scholar] [CrossRef]
  20. Giner-Sanz, J.J.; Ortega, E.M.; García-Gabaldón, M.; Pérez-Herranz, V. Theoretical Determination of the Stabilization Time in Galvanostatic EIS Measurements: The Simplified Randles Cell. J. Electrochem. Soc. 2018, 165, E628–E636. [Google Scholar] [CrossRef]
  21. Arshad, U.; Tang, J.; Shao, Z. Replace Platinum for Hydrogen Evolution Reaction in the Cathode of Proton Exchange Membrane Water Electrolyzers. SusMat 2025, 5, e267. [Google Scholar] [CrossRef]
  22. Tysoe, W.T.; Zaera, F.; Somorjai, G.A. An XPS study of the oxidation and reduction of the rhenium-platinum system under atmospheric conditions. Surf. Sci. 1988, 200, 1–14. [Google Scholar] [CrossRef]
  23. Baer, D.R.; Gordon, R.L.; Hubbard, C.W. Work function and UPS study of Au and O on Re. Appl. Surf. Sci. 1990, 45, 71–83. [Google Scholar] [CrossRef]
  24. Wahlqvist, M.; Shchukarev, A. XPS spectra and electronic structure of Group IA sulfates. J. Electron Spectrosc. Relat. Phenom. 2007, 156–158, 310–314. [Google Scholar] [CrossRef]
  25. Dupin, J.C.; Gonbeau, D.; Vinatier, P.; Levasseur, A. Systematic XPS studies of metal oxides; hydroxides and peroxides. Phys. Chem. Chem. Phys. 2000, 2, 1319–1324. [Google Scholar] [CrossRef]
  26. Cao, H.; Hu, L.; Zhang, H.; Hou, G.; Tang, Y.; Zheng, G. The significant effect of supporting electrolytes on the galvanic deposition of metallic rhenium. Int. J. Electrochem. Sci. 2020, 15, 6769–6777. [Google Scholar] [CrossRef]
  27. Chen, J.; Kawai, J.; Ozawa, K.; Toyoshima, R.; Tomishige, K.; Kondoh, H. Substrate Effect of Ir and Rh on Surface ReOx Species under Hydrogen Atmosphere Studied by NAP-XPS. J. Phys. Chem. C 2022, 126, 11544−11552. [Google Scholar] [CrossRef]
  28. Greiner, M.T.; Rocha, T.C.R.R.; Johnson, B.; Klyushin, A.; Knop-Gericke, A.; Schlögl, R. The oxidation of rhenium and identification of rhenium oxides during catalytic partial oxidation of ethylene: An in-situ XPS study. Z. Phys. Chem. 2014, 228, 521–541. [Google Scholar] [CrossRef]
  29. Morant, C.; Galán, L.; Sanz, J.M. X-ray photoelectron spectroscopic study of the oxidation of polycrystalline rhenium by exposure to O2 and low energy O2+ ions. Anal. Chim. Acta 1994, 297, 179–186. [Google Scholar] [CrossRef]
  30. Krasikov, V.L. A new approach to the mechanics of hydrogen evolution reaction on rhenium: 3D recombination. Bull. St. Petersburg State Inst. Technol. 2016, 34, 24–32. [Google Scholar] [CrossRef]
  31. Zerbino, J.O.; Castro Luna, A.M.; Zinola, C.F.; Méndez, E.; Martins, M.E. Electrochemical and optical study of rhenium layers formed on gold electrodes. J. Electroanal. Chem. 2002, 521, 168–174. [Google Scholar] [CrossRef]
  32. Menia, S.; Lassouane, F.; Tebibel, H.; Khellaf, A. Hydrogen Production from Methanol Electrolysis. In Exergy for A Better Environment and Improved Sustainability 2: Applications; Aloui, F., Dincer, I., Eds.; Springer: Cham, Switzerland, 2018; pp. 455–460. [Google Scholar] [CrossRef]
  33. Halme, A.; Selkäinaho, J.; Noponen, T.; Kohonen, A. An alternative concept for DMFC–Combined electrolyzer and H2 PEMFC. Int. J. Hydrogen Energy 2016, 41, 2154–2164. [Google Scholar] [CrossRef]
  34. Rajesh, R.P.; Saravanakumar, M.P. A review on electrooxidation treatment of leachate: Strategies, new developments, and prospective growth. Nat. Environ. Pollut. Technol. 2025, 24, B4222. [Google Scholar] [CrossRef]
  35. Si, F.; Liu, J.; Zhang, Y.; Zhao, B.; Liang, Y.; Wu, X.; Kang, X.; Yang, X.; Zhang, J.; Fu, X.-Z.; et al. Surface Spin Enhanced High Stable NiCo2S4 for Energy-Saving Production of H2 from Water/Methanol Coelectrolysis at High Current Density. Small 2023, 19, 2205257. [Google Scholar] [CrossRef]
  36. Yang, B.; Cao, X.W.; Lang, H.Z.; Wang, S.H.; Sun, C.L. Study on hydrogen bonding network in aqueous methanol solution by Raman spectroscopy. Spectrochim. Acta Part A Mol. Biomol. Spectrosc. 2020, 225, 117488. [Google Scholar] [CrossRef]
  37. Van Loon, L.L.; Allen, H.C.; Wyslouzil, B.E. Effective Diffusion Coefficients for Methanol in Sulfuric Acid Solutions Measured by Raman Spectroscopy. J. Phys. Chem. A 2008, 112, 10758–10763. [Google Scholar] [CrossRef]
  38. Van Loon, L.L.; Allen, H.C. Uptake and surface reaction of methanol by sulfuric acid solutions investigated by vibrational sum frequency generation and Raman spectroscopies. J. Phys. Chem. A 2008, 112, 7873–7880. [Google Scholar] [CrossRef] [PubMed]
  39. Van Loon, L.L.; Allen, H.C. Methanol Reaction with Sulfuric Acid: A Vibrational Spectroscopic Study. J. Phys. Chem. B 2004, 108, 17666–17674. [Google Scholar] [CrossRef]
  40. Rozenberg, M.; Loewenschuss, A.; Nielsen, C.J. Hydrogen bonding in the sulfuric acid- methanol-water system: A matrix isolation and computational study. J. Phys. Chem. A 2015, 119, 2271–2280. [Google Scholar] [CrossRef] [PubMed]
  41. Chen, R.; Yang, C.; Cai, W.; Wang, H.-Y.; Miao, J.; Zhang, L. Use of platinum as the counter electrode to study the activity of nonprecious metal catalysts for the hydrogen evolution reaction. ACS Energy Lett. 2017, 2, 1070–1075. [Google Scholar] [CrossRef]
  42. Biesinger, M.C. Accessing the robustness of adventitious carbon for charge referencing (correction) purposes in XPS analysis: Insights from a multi-user facility data review. Appl. Surf. Sci. 2022, 597, 153681. [Google Scholar] [CrossRef]
  43. Fan, W.; Hu, J.; Li, J.; Tao, P.; Liu, Y.; Zhou, Y.; He, Y. An electrodeposited ReS2/Ni3S2 heterostructure on the nickel foam as a bifunctional electrocatalyst for overall water splitting. Electrochem. Acta 2025, 536, 146827. [Google Scholar] [CrossRef]
Figure 1. Electrochemical characterization of the rhenium wire at room temperature in H 2 S O 4 0.5 M containing C H 3 O H 0.5 M. Prior to measurement, hydrogen gas was bubbled through the solution for 30 min while the potential was held at −0.4 V. The scan rate was 200 mVs−1, 10th cycle. Curve crossovers where the blue solid and red curves intersect are magnified for clarity.
Catalysts 16 00394 g001
Figure 2. Voltammograms obtained under varying temperatures and scan rates, illustrating cycle 5 of each experiment. The working electrode was a metallic rhenium wire immersed in 0.5 M H 2 S O 4 + 2 M C H 3 O H . The temperatures studied were 30 °C and 50 °C, with scan rates of 20 mV·s−1, 50 mV·s−1, 100 mV·s−1, and 200 mV·s−1. Prior to cyclic voltammetry, the electrode was held at a controlled potential of −0.4 V for 30 min.
Catalysts 16 00394 g002
Figure 3. Cyclic voltammetry of metallic rhenium wire in 0.5 M H 2 S O 4 + 2 M C H 3 O H . The initial cathodic potential was fixed at −0.2 V, while the upper potential limit was systematically increased as indicated in the inset. The scan rate was 200 mV s−1, and the vertical axis shows the capacitance (see Equation (6)).
Catalysts 16 00394 g003
Figure 4. Voltammetric cycles of metallic rhenium wire in 0.5 M H 2 S O 4 + 2 M C H 3 O H . The capacitance (y-axis) was calculated according to Equation (6). The initial cathodic potential was fixed at –0.2 V, while the upper potential limit was set to either 0.2 V or 0.4 V. The corresponding scan rates are indicated within the inset box.
Catalysts 16 00394 g004
Figure 5. Low-resolution XPS spectra survey the black line. Frames highlight the binding energy regions O 1s, C 1s, S 2p, and Re 4f. Ex situ spectra of the rhenium electrode were acquired after potential-controlled electrolysis at −0.4 V for 2 h. The solution was 0.5 M H 2 S O 4 + 1 M C H 3 O H . The detailed spectra are presented in Figures S1–S5, and the fitting data are listed in Table S1.
Catalysts 16 00394 g005
Figure 6. Potential-controlled curves recorded at a scan rate of 5 mV·s−1. The electrolyte solution consisted of 0.5 M H 2 S O 4 + 2 M C H 3 O H at room temperature, which was previously deoxygenated by purging with pure nitrogen. The curve shown in cyan corresponds to the rhenium electrode, whereas the curve shown in blue corresponds to the platinum electrode.
Catalysts 16 00394 g006
Table 1. Experimental exchange current densities for the HER on metallic rhenium at 25 °C in different acidic solutions (saturated with hydrogen gas or nitrogen gas). The atmospheric pressure was 0.8 Atm. Details of how the kinetic parameters were obtained are shown in our previous study [11].
SolutionScan Rate
mV s−1
J 0
A cm−2
Tafel Slope
mV Decade−1
Reference
0.5 M H 2 S O 4 0.1168.10 × 10−760[11]
0.5 M H 2 S O 4 11.16 × 10−659[12]
0.5 M H 2 S O 4 0.5 M C H 3 O H 0.1162.51 × 10−763[1]
0.5 M H 2 S O 4 0.5 M C H 3 O H 11.15 × 10−658[1]
0.5 M H 2 S O 4 2 M C H 3 O H 11.16 × 10−670[1]
0.5 M H 2 S O 4 0.5 M C H 3 O H 0.1166.53 × 10−768This work
0.5 M H 2 S O 4 0.5 M C H 3 O H 16.98 × 10−762This work
0.5 M H 2 S O 4 2 M C H 3 O H 101.90 × 10−668This work
Disclaimer/Publisher’s Note: The statements, opinions and data contained in all publications are solely those of the individual author(s) and contributor(s) and not of MDPI and/or the editor(s). MDPI and/or the editor(s) disclaim responsibility for any injury to people or property resulting from any ideas, methods, instructions or products referred to in the content.