Article

Sonocatalytic Degradation of Malachite Green Using a Sustainable ZnO/Biochar Composite Derived from Phytoremediated Plant Residue: Process Optimisation via Response Surface Methodology


1
Department of Chemical Engineering, Lee Kong Chian Faculty of Engineering and Science, Universiti Tunku Abdul Rahman, Kajang 43000, Malaysia
2
Centre of Advanced and Sustainable Materials Research (CASMR), Universiti Tunku Abdul Rahman, Kajang 43000, Malaysia
3
Department of Aeronautics and Astronautics, National Cheng Kung University, Tainan 701, Taiwan
4
Department of Chemical and Materials Engineering, Tunghai University, Taichung 407, Taiwan
5
Department of Mechanical Engineering, National Chin-Yi University of Technology, Taichung 411, Taiwan
6
Department of Chemical and Materials Engineering, National University of Kaohsiung, Kaohsiung 811, Taiwan
*
Authors to whom correspondence should be addressed.
Catalysts 2026, 16(4), 363; https://doi.org/10.3390/catal16040363
Submission received: 15 March 2026 / Revised: 5 April 2026 / Accepted: 10 April 2026 / Published: 17 April 2026

Abstract

A highly efficient ZnO/biochar (ZnO/BC) composite was synthesised from phytoremediation residue and evaluated for the advanced sonocatalytic degradation of malachite green in aqueous solutions. The structural, chemical, and morphological properties of the composite were characterised using physicochemical techniques, confirming the successful impregnation of zinc oxide (ZnO) onto the biochar matrix. The catalytic performance of the synthesised composite in treating malachite green was systematically evaluated and optimised using response surface methodology (RSM), specifically a central composite design (CCD), to analyse the interactive effects of initial dye concentration, catalyst loading, and ultrasonic irradiation time. The developed model exhibited a high coefficient of determination (R2) of 0.996 and an adequate precision of 62.67, confirming the model’s significance. Optimal degradation was observed at an initial malachite green concentration of 73.71 mg/L, a catalyst loading of 0.527 g/L, and a sonocatalytic treatment duration of 18.7 min. Furthermore, the ZnO/biochar composite demonstrated excellent mineralisation capabilities, with chemical oxygen demand (COD) and total organic carbon (TOC) removal efficiencies reaching 89.79% and 68.43%, respectively, after 60 min of treatment. These findings establish ZnO/BC as a highly active sonocatalyst, offering a promising approach for the remediation of organic dyes in industrial wastewater treatment.

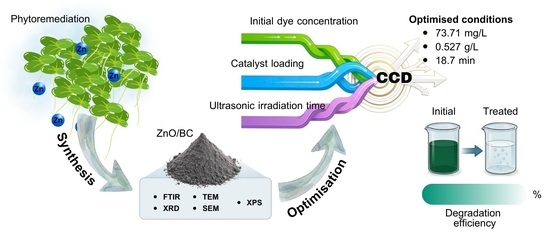
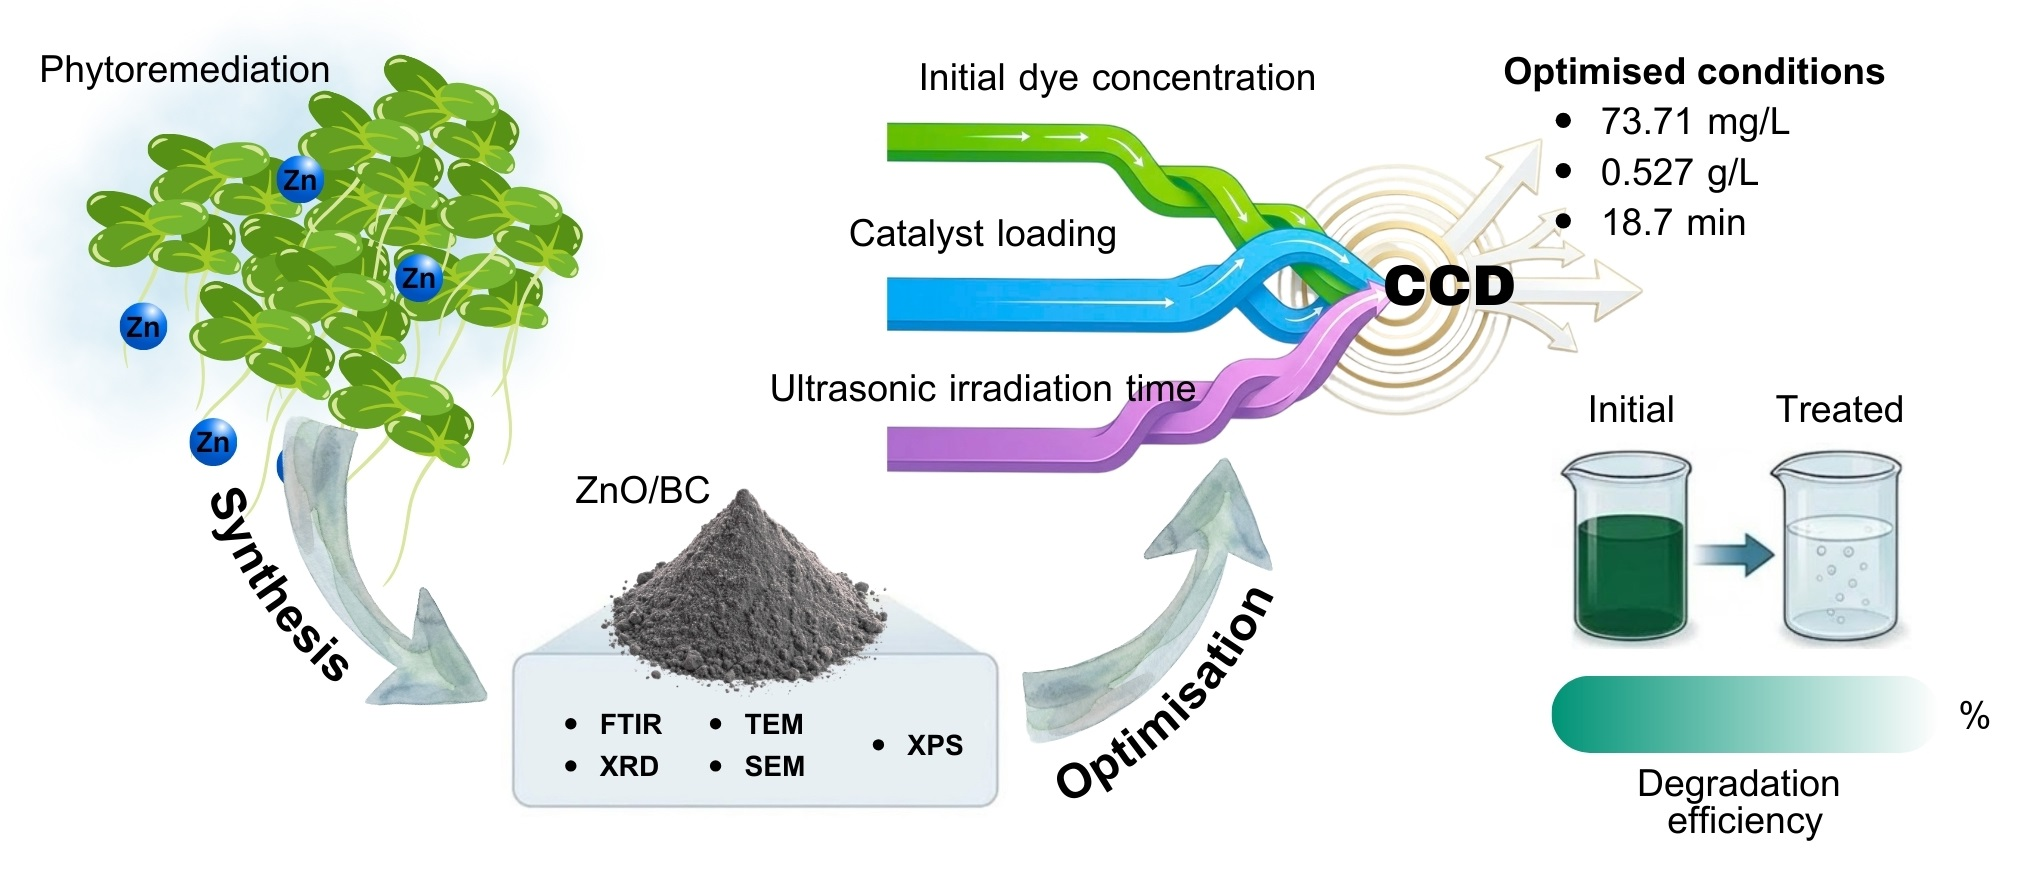
Graphical Abstract

1. Introduction

The rapid expansion of the textile, aquaculture, and paper industries has led to widespread discharge of synthetic organic dyes into aquatic environments, threatening global water security. Among these pollutants, malachite green is a toxic triphenylmethane dye commonly used as a colourant and a highly effective fungicide. Due to its complex aromatic structure, malachite green is highly resistant to natural degradation and exhibits severe mutagenic, carcinogenic, and teratogenic effects [1]. Consequently, the release of wastewater contaminated with malachite green significantly impairs photosynthesis in aquatic plants and poses serious toxicological risks throughout the food chain [2].
Conventional wastewater treatment methods, including physical adsorption, chemical coagulation, and biological digestion, often prove inadequate for the complete remediation of malachite green [2,3]. These traditional approaches frequently suffer from slow reaction rates, phase-transfer challenges, and the production of large amounts of toxic secondary sludge that require hazardous disposal. To address these issues, advanced oxidation processes (AOPs) have become highly promising. Among various AOPs, ultrasound-assisted degradation has attracted significant interest. Sonocatalysis relies on acoustic cavitation, which involves the continuous formation, growth, and violent collapse of microbubbles in an aqueous medium [4]. This phenomenon generates extreme transient microenvironments with temperatures exceeding 5000 K and pressures above 1000 atm, actively breaking water molecules to yield highly reactive oxygen species (ROS), mainly hydroxyl (•OH) and superoxide (• O 2 ) radicals, that effectively attack and break down organic pollutants [5].
Although acoustic cavitation alone can degrade organic dyes, the energy barrier for bubble nucleation is high, rendering homogeneous sonolysis energetically inefficient [5]. The introduction of a heterogeneous solid catalyst drastically lowers the cavitation threshold by providing numerous surface nucleation sites. ZnO functions as an n-type semiconductor and is widely recognised as a benchmark catalytic material due to its exceptional sonocatalytic performance, high electron mobility, and non-toxic nature [2,6]. However, the practical application of pristine nanoscale ZnO is significantly limited by its high surface energy, which leads to severe particle agglomeration, reducing the active surface area and accelerating electron-hole pair recombination [7].
To address these inherent limitations, anchoring ZnO nanoparticles onto a structurally robust, high-surface-area support matrix is an effective strategy [8]. Biochar, a carbon-rich, highly porous material derived from the sustainable pyrolysis of biomass, presents an ideal support [9]. The synergistic integration of ZnO with biochar not only prevents the agglomeration of the metal oxide nanoparticles but also enriches the composite with abundant oxygen-containing surface functional groups [10,11]. These functional groups enhance the initial targeted adsorption of organic pollutants, bringing the pollutant into direct contact with the generated ROS and significantly accelerating the degradation kinetics [7]. Departing from conventional synthesis routes that depend on external chemical reagents, the present work introduces a novel approach using zinc-enriched duckweed phytoremediation residue as the primary precursor. The zinc accumulated in the plant tissue is extracted via acid digestion, thermally transformed into active ZnO, and subsequently anchored onto a porous biochar matrix. This approach not only presents a sustainable method for synthesising composite catalysts but also addresses the critical issue of secondary pollution associated with the disposal of phytoremediation waste.
Furthermore, optimising the operational parameters of this complex multi-phase sonocatalytic system is essential for maximising degradation efficiency. Traditional one-factor-at-a-time optimisation is resource-intensive and fundamentally fails to account for the interactive effects among varying process parameters [12]. Therefore, RSM is highly preferred for rigorously modelling and optimising the interactive variables in the sonocatalytic process. Accordingly, this study aims to synthesise a highly active, structurally stable ZnO/BC for the advanced sonocatalytic degradation of malachite green. The synthesised materials were comprehensively investigated using various physicochemical techniques. The sonocatalytic process was systematically optimised using RSM to assess the interactive effects of initial dye concentration, catalyst loading, and ultrasonic irradiation time. Finally, the extent of malachite green mineralisation under the optimised conditions was measured by COD and TOC analyses, providing conclusive evidence of the synthesised catalyst’s potential for advanced industrial wastewater remediation.

2. Results and Discussion

2.1. Characterisation of Catalyst

The morphology and microstructural features of ZnO and ZnO/BC were examined using TEM and SEM at a magnification of 40,000, as shown in Figure 1. The TEM image of synthesised ZnO displays the formation of quasi-spherical nanoparticles with moderate agglomeration. The particle size distribution, estimated from multiple particles, ranges from 30 to 60 nm, which is aligned with the literature [10,13]. The observed aggregation is typically attributed to the high surface energy of ZnO nanoparticles produced during thermal treatment [2]. The TEM image of ZnO/BC shows a uniform distribution and firm anchoring of ZnO on the biochar matrix. The presence of biochar effectively suppresses severe nanoparticle agglomeration and promotes better dispersion of ZnO, resulting in a more interconnected and porous composite structure [2]. The SEM image of ZnO shows agglomerated particles with quasi-spherical grains, while the SEM image for ZnO/BC displays a uniform coating of ZnO on the biochar matrix, indicating successful integration of ZnO into the biochar matrix [6,9].
The high-resolution TEM (HRTEM) image of pristine ZnO at a magnification of 500,000 displayed clear lattice fringes, verifying its crystalline nature, with an interplanar spacing of 0.245 nm that aligns with the (101) plane of hexagonal wurtzite ZnO and matches reported literature values [14]. In contrast, the HRTEM image of ZnO/BC displays distinct lattice fringes with interplanar spacings of 0.258 nm and 0.274 nm, as highlighted in Figure 1e, which differ slightly from those of pristine ZnO and can be indexed to the (002) and (100) planes, respectively. The expanded lattice spacing suggests possible electronic interactions and defect formation at the ZnO/BC interface, potentially enhancing charge separation and facilitating the generation of reactive oxygen species. These values are in good agreement with standard JCPDS data (card no. 36-1451), confirming the successful formation of crystalline ZnO nanoparticles [15].
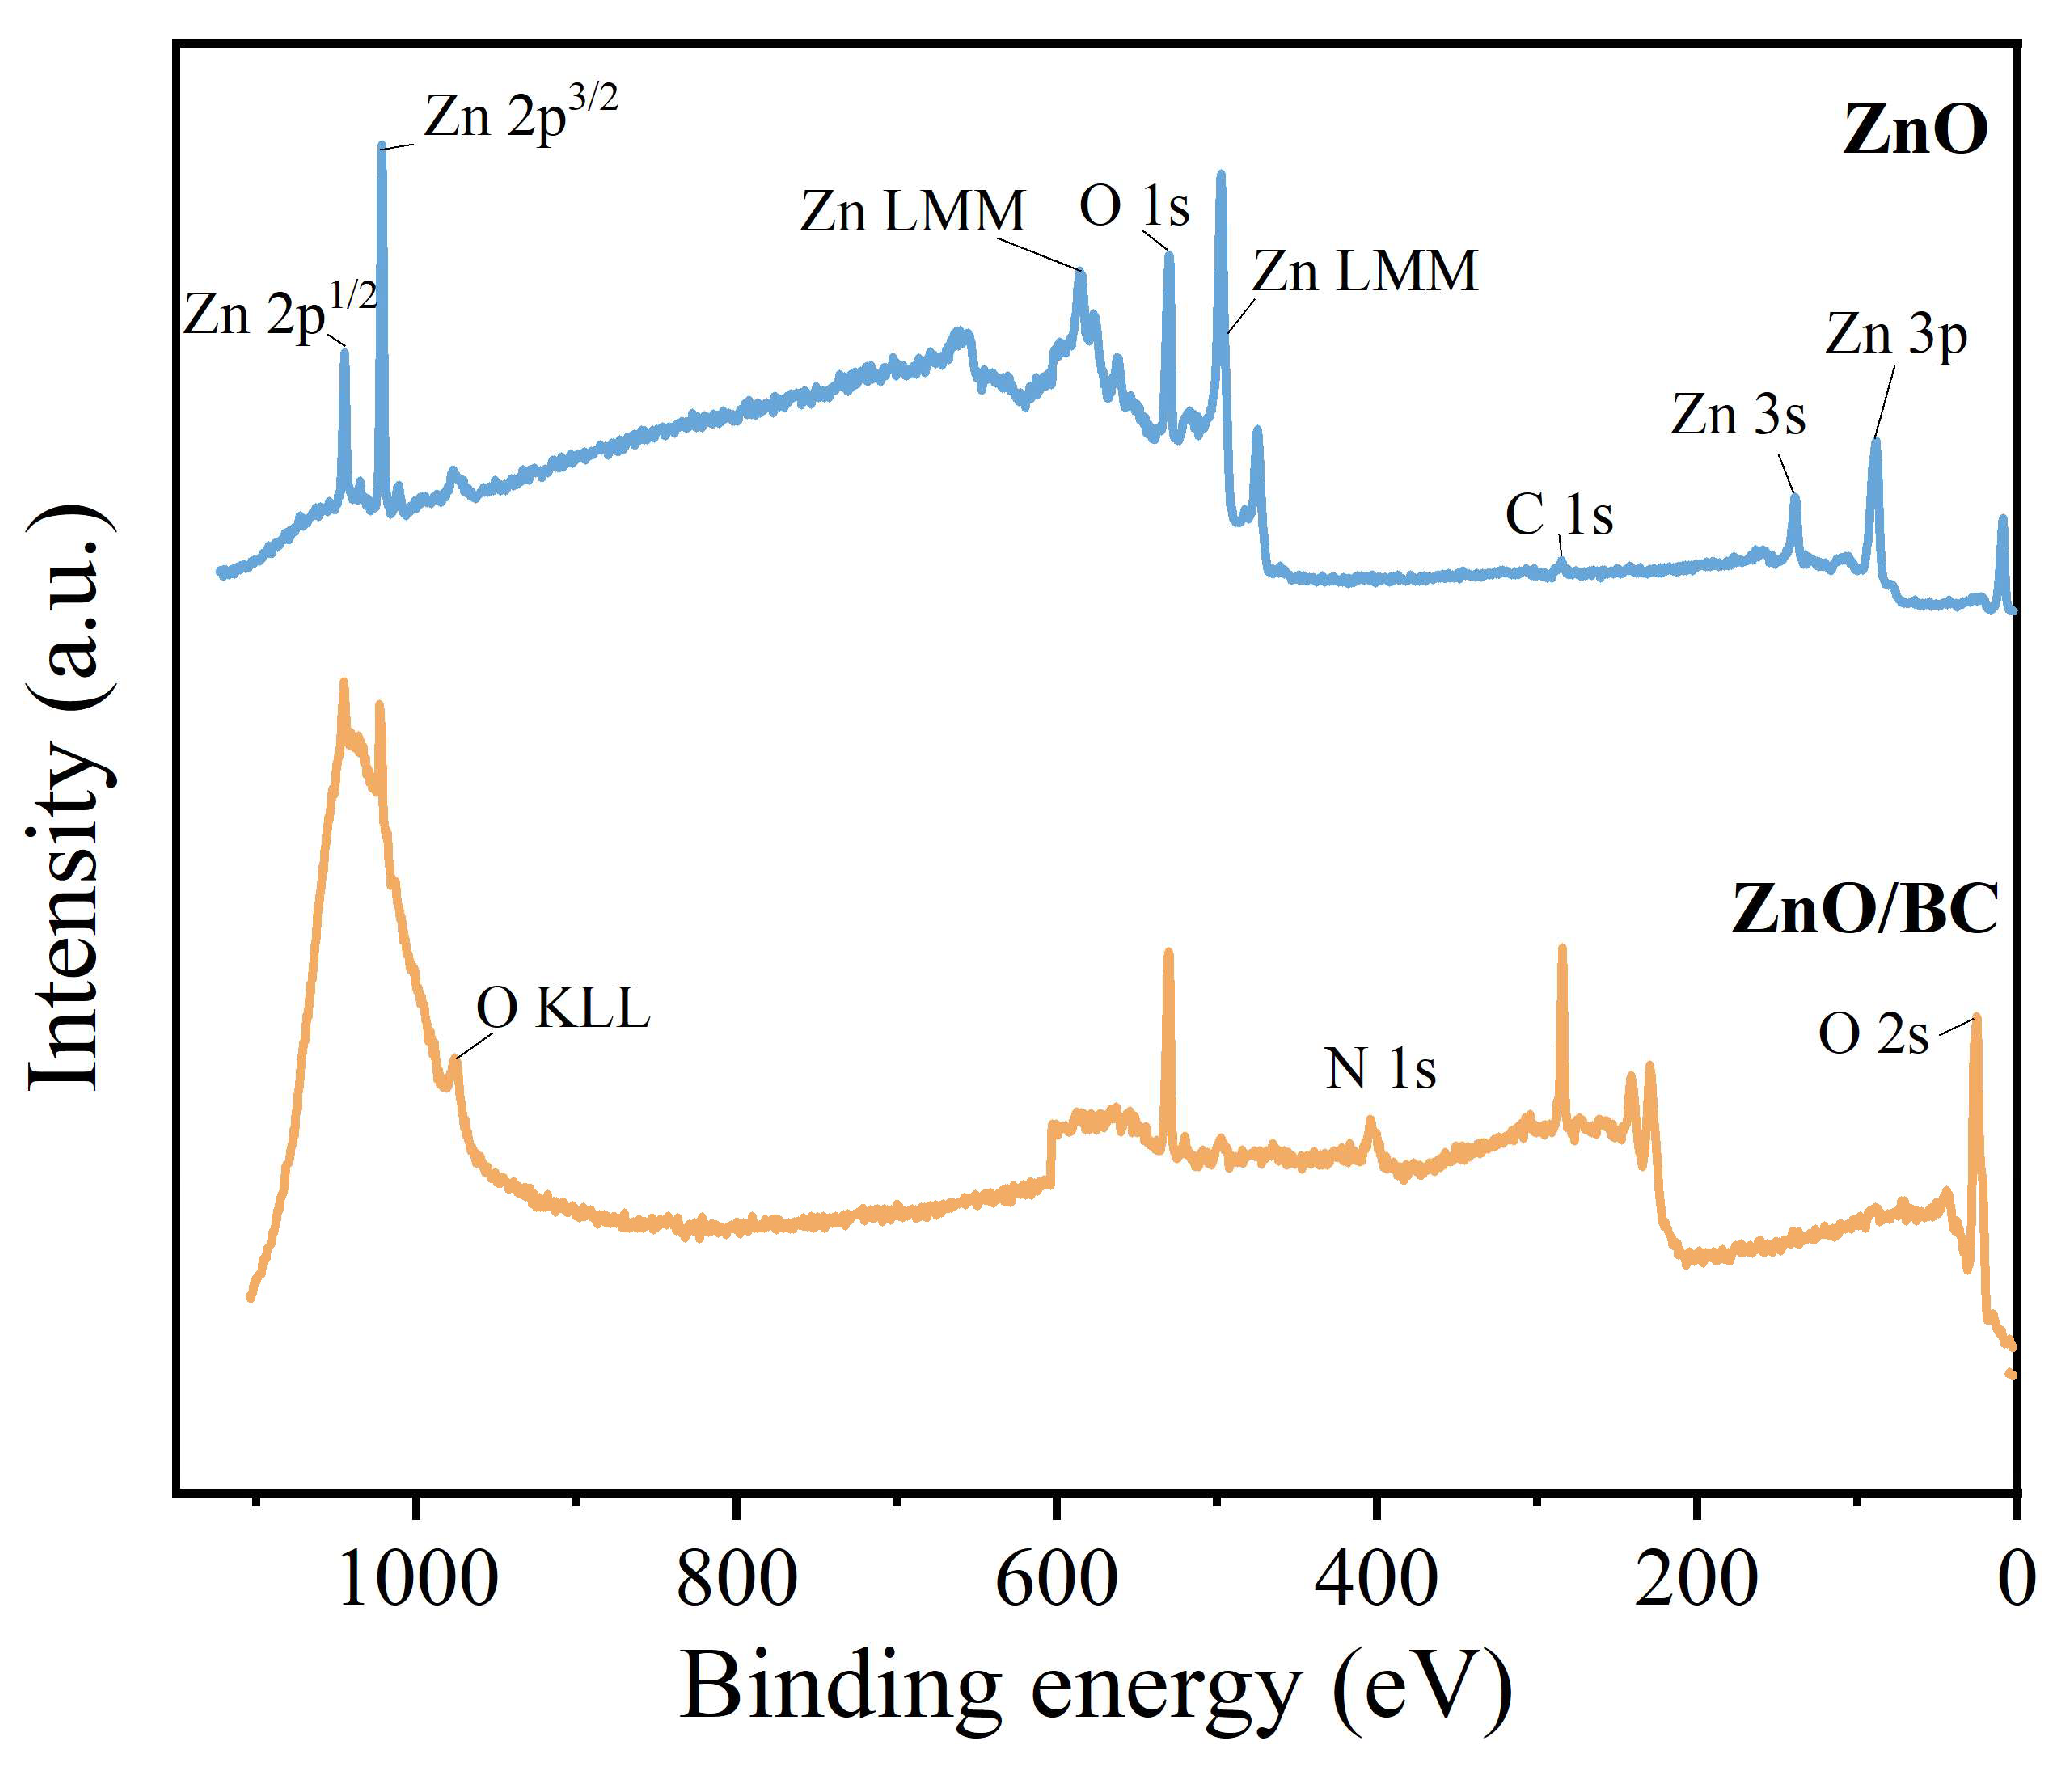
The elemental composition of the synthesised ZnO and ZnO/BC was verified by XPS, as shown in the survey scan spectra in Figure 2. Both spectra exhibit the characteristic sharp Zn 2p doublet and a distinct O 1s peak, confirming that zinc predominantly exists in the Zn2+ oxidation state within a wurtzite crystal lattice [16]. The preservation of these peaks in the ZnO/BC composite spectrum indicates that the crystal structure of ZnO remains stable after incorporation onto the biochar. Additionally, the ZnO spectrum displays the corresponding Zn LMM Auger electron transition series around 494 eV, with a secondary transition step visible around 580 eV. Conversely, the broad O KLL Auger emission is visible at 977 eV.
A clear difference between the two spectra is observed in the C 1s region (~284.38 eV). A relatively weak C 1s peak is observed in ZnO, attributed to adventitious atmospheric carbon and residual organic matter from the phytochemicals in the plant extract. Conversely, the ZnO/BC composite exhibits a dramatically enhanced C 1s peak, providing conclusive evidence of the successful hybridisation of ZnO with the carbon-rich biochar matrix [17].
In the ZnO/BC spectrum, the small peak around 404 eV is assigned to N 1s, a distinctive fingerprint of biochar derived from nitrogen-accumulating biomass. The retention of nitrogenous functional groups, such as pyridinic-N, acts as a natural heteroatom dopant within the carbon matrix [18]. In addition to the primary core-level emissions, the survey spectra reveal distinct shallow core-level peaks in the lower-binding-energy region (<200 eV). For the ZnO spectrum, the observable peaks located at 138 eV and 88 eV are attributed to the Zn 3s and Zn 3p photoelectrons, respectively. Furthermore, a minor peak near 22 eV corresponds to the O 2s shallow core level [16]. The presence of these low-energy peaks in both ZnO and the ZnO/BC composite further corroborates the elemental integrity of the zinc oxide phase within the synthesised materials.
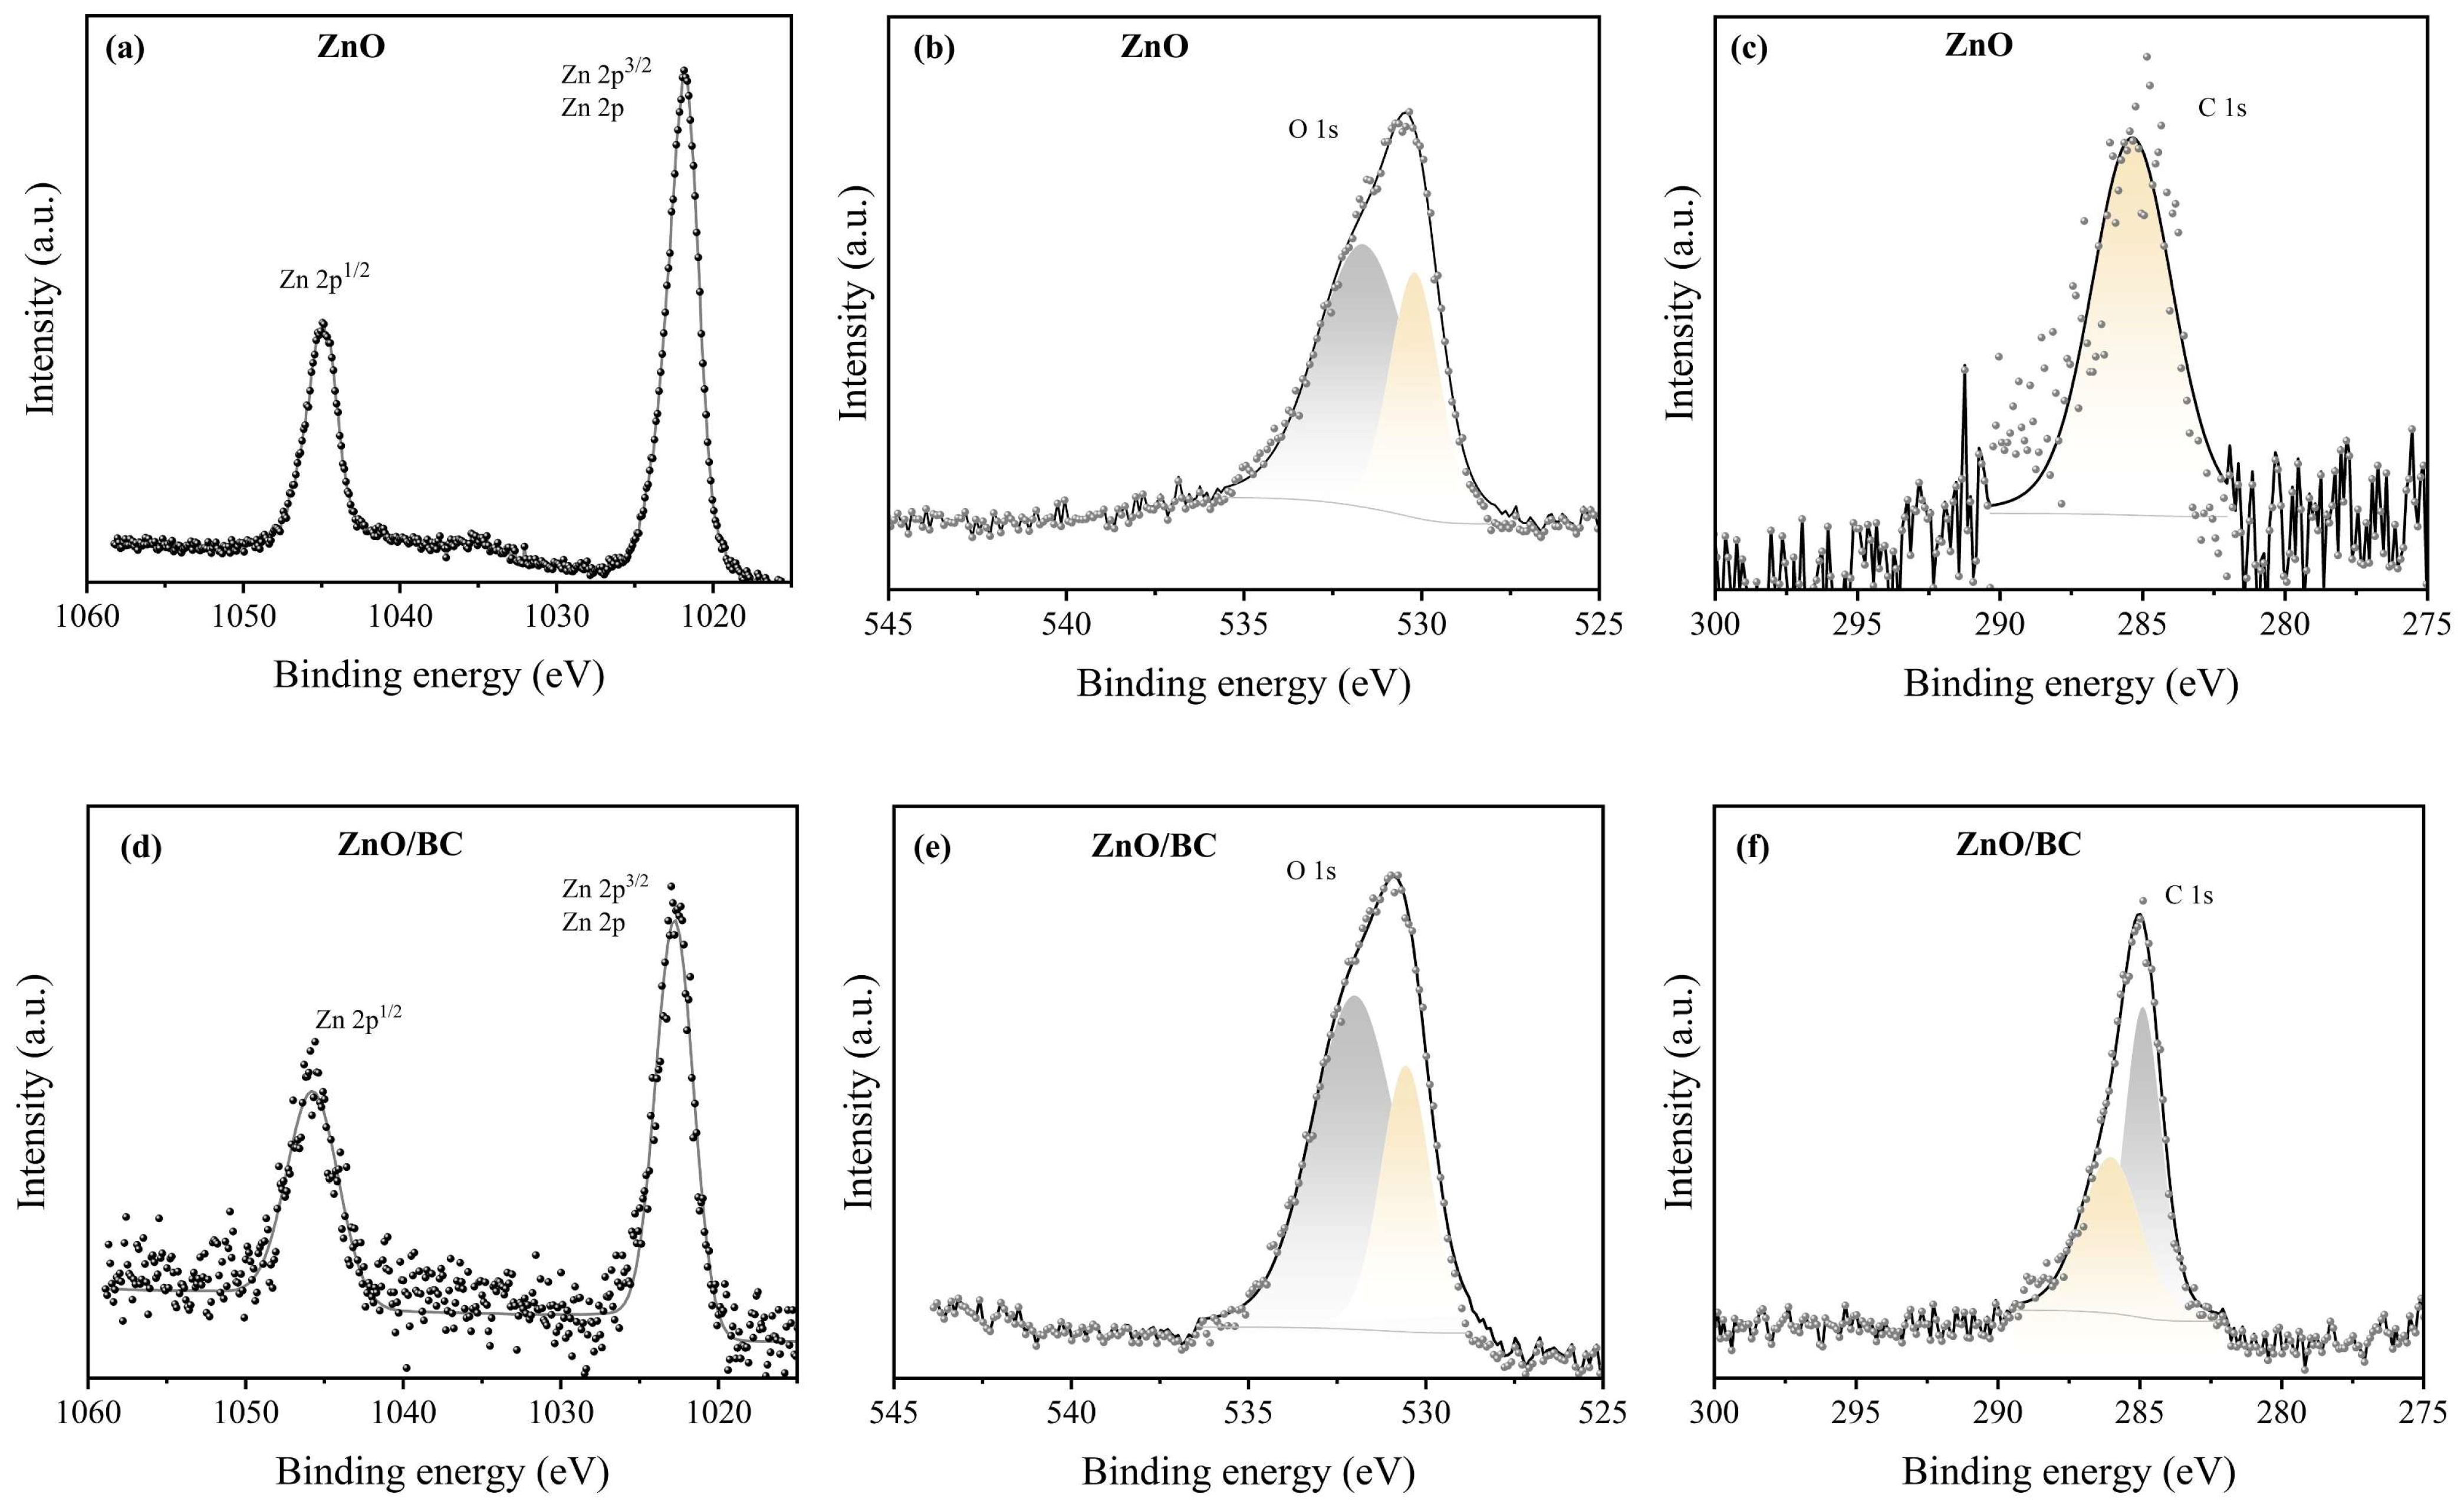
The high-resolution XPS spectra of Zn 2p, O 1s, and C 1s are illustrated in Figure 3. For Zn 2p, the ZnO spectrum exhibits two distinct peaks at 1021.84 eV and 1044.94 eV. The first peak corresponds to Zn 2p3/2, while the second peak corresponds to Zn 2p1/2 [10]. The clear spin–orbit splitting without additional Zn-related peaks confirms the presence of Zn2+ in the ZnO lattice, which is characteristic of hexagonal wurtzite ZnO. Similarly, the Zn 2p spectrum of the ZnO/BC shows the same characteristic Zn 2p3/2 and Zn 2p1/2 doublet, confirming that the oxidation state of zinc remains unchanged after the incorporation of zinc into the biochar matrix. However, the Zn 2p spectra of ZnO/BC display broader peaks and a slightly lower fitting quality. This broadening arises from surface heterogeneity caused by interfacial interactions between ZnO and oxygen-rich functional groups on the biochar, leading to a distinct electronic environment [17,19].
The O 1s spectra of ZnO and ZnO/BC can be deconvoluted into two main components at 530.14 eV for ZnO and 530.58 eV for ZnO/BC. These deconvoluted peaks are assigned to lattice oxygen (O2−) in the Zn–O bond, while the deconvoluted peak at higher binding energy of 531.54 eV for ZnO and 531.98 eV for ZnO/BC is attributed to surface hydroxyl groups, adsorbed oxygen species, or oxygen vacancies [9,20].
The C 1s spectrum of ZnO displays a single, relatively weak and broad peak at 285 eV, attributed to adventitious carbon resulting from atmospheric exposure during XPS analysis rather than from intrinsic carbon species within the ZnO lattice. In contrast, the C 1s spectrum of the ZnO/BC reveals a well-defined peak at 285 eV, which can be deconvoluted into two peaks at 284.98 eV and 286.08 eV, assigned to graphitic or aliphatic carbon (C–C/C=C) at the lower binding energy and functional group C–O at the higher binding energy [9]. The presence of these oxygen-containing functional groups aligns with the phytogenic origin and thermal treatment of the biochar, supporting and facilitating ZnO anchoring via interfacial bonding and improving its dispersion and stability within the biochar matrix [21].
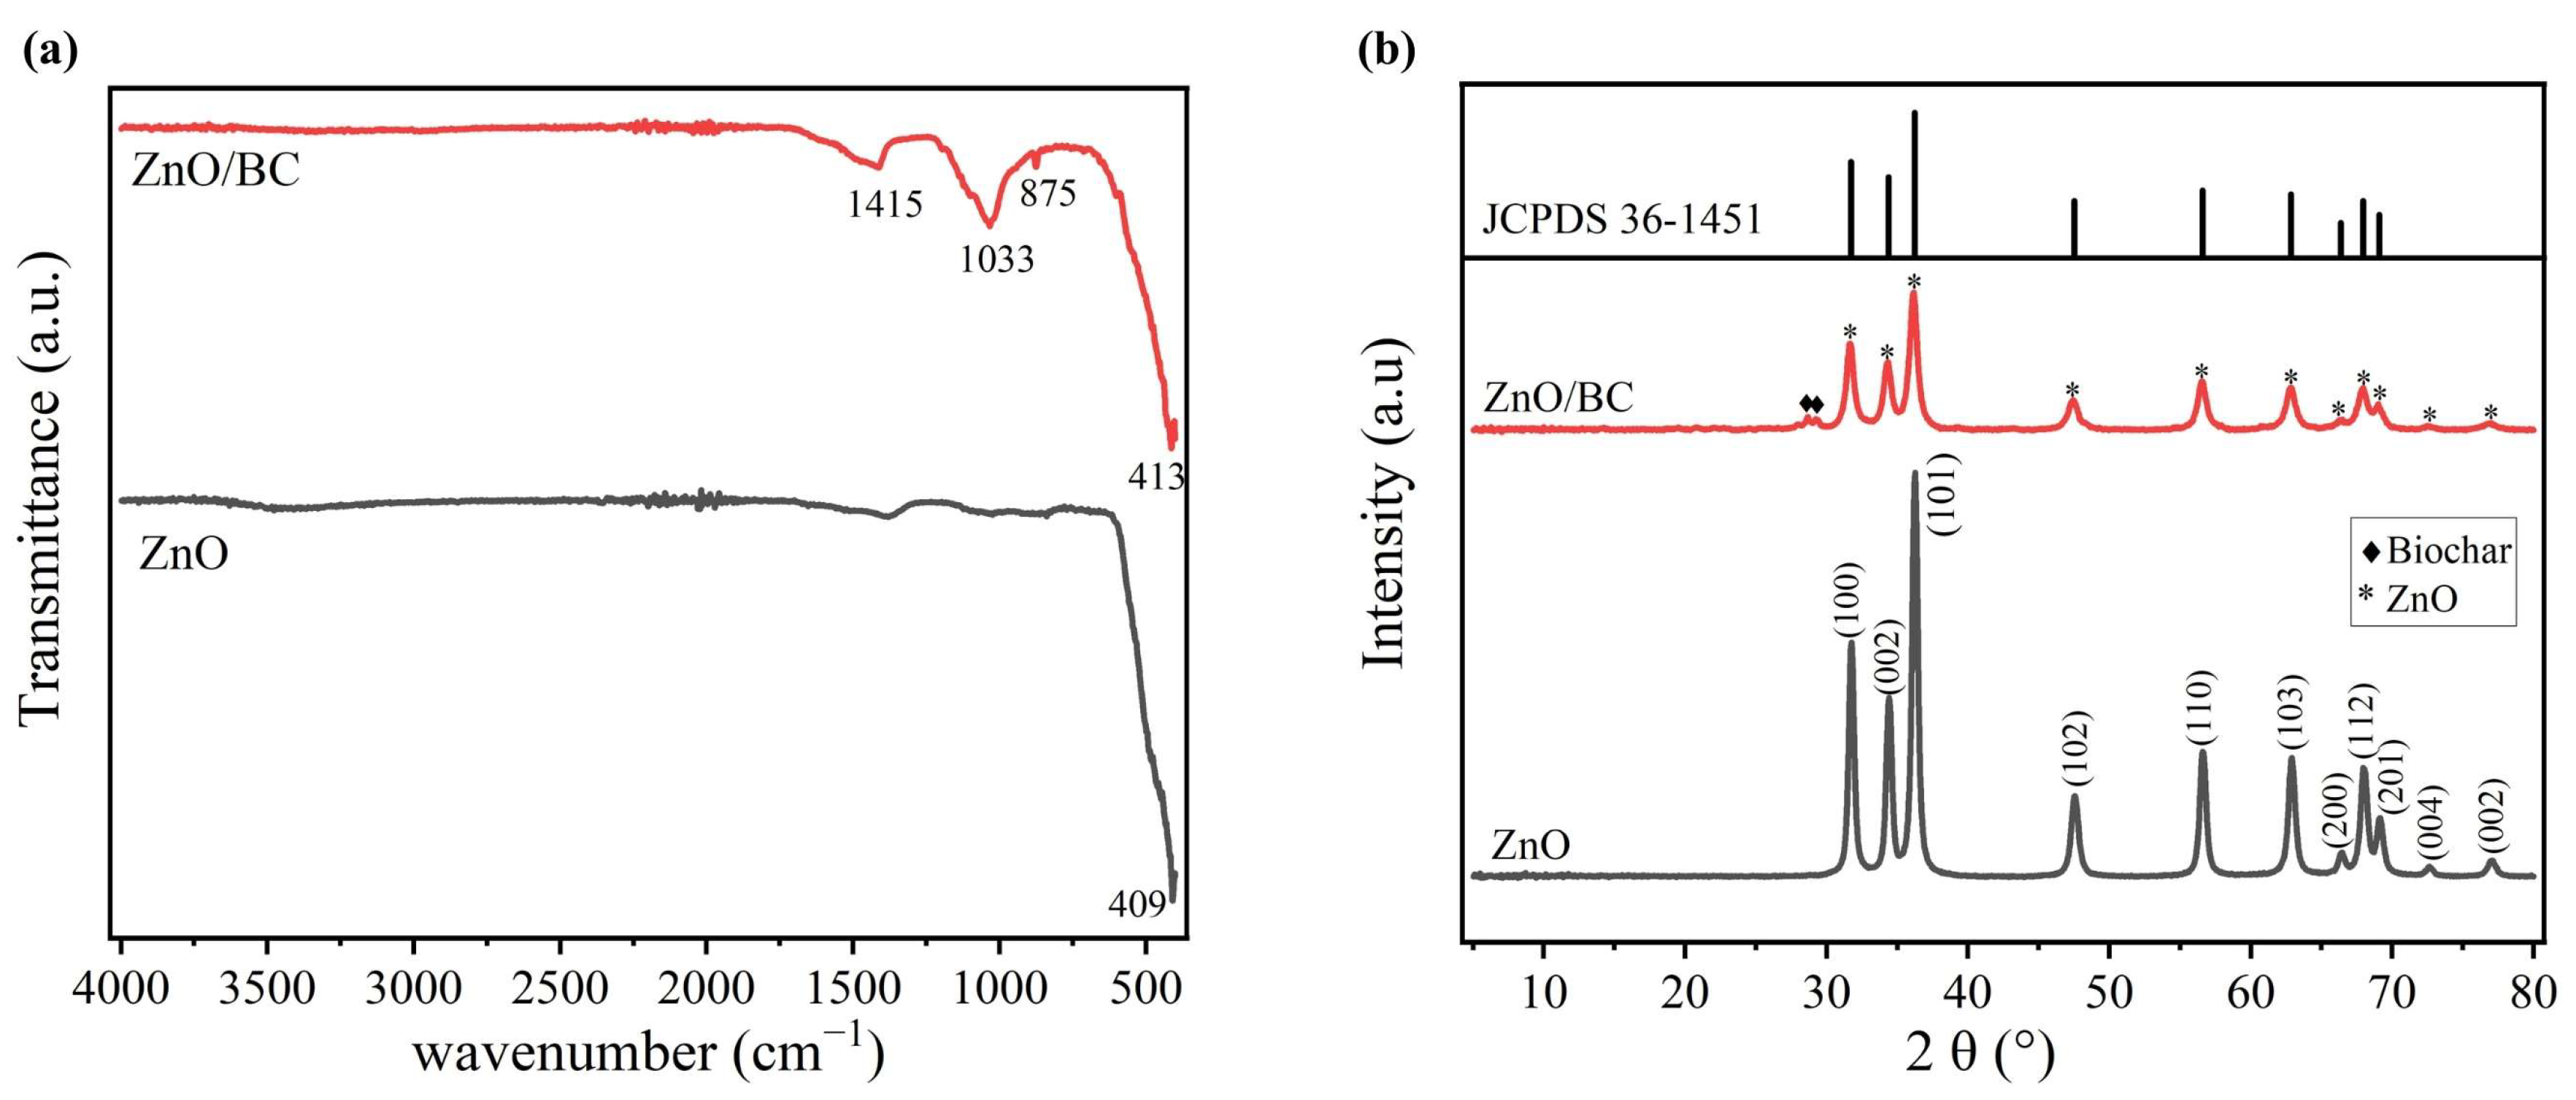
Figure 4a presents the FTIR spectra of the synthesised ZnO and ZnO/BC. A prominent absorption band is observed at approximately 409 cm−1, corresponding to the Zn–O stretching vibration, which confirms the formation of metal-oxygen bonds characteristic of ZnO. A similar band is also observed in the ZnO/BC at around 413 cm−1, indicating that the ZnO crystalline structure remains preserved after incorporation into the biochar matrix [7,11,22,23]. The shift of the Zn–O peak to a higher wavenumber indicates the successful integration of ZnO onto the biochar matrix, with an increased vibration frequency of the Zn–O bond [2]. For ZnO/BC, the distinct peak near 875 cm−1 may be assigned to aromatic C–H bending vibrations, which are characteristic of aromatic structures commonly found in biochar derived from lignocellulosic biomass [10]. The peak appearing at 1033 cm−1 corresponds to C–O stretching [24]. Another prominent band appearing at 1415 cm−1 corresponds to the asymmetric stretching vibration of carboxylate ( COO ) groups, indicating the presence of carboxylic functionalities on the biochar surface [6].
Figure 4b shows the XRD patterns for the synthesised ZnO and ZnO/BC. The ZnO diffraction pattern features sharp, clearly defined peaks at 2θ angles of 31.8°, 34.4°, 36.2°, 47.5°, 56.6°, 62.9°, 66.4°, 68.0°, 69.1°, 72.6°, and 77.1°, which correspond to the (100), (002), (101), (102), (110), (103), (200), (112), (201), (004), and (202) planes, respectively. These peaks align well with the standard crystallographic data for hexagonal wurtzite ZnO, as listed in JCPDS card No. 36-1451 [15]. The peaks show high intensity and narrow shape, which reflect the high crystallinity and phase purity of the synthesised ZnO [2].
The XRD pattern of ZnO/BC shows the characteristic ZnO diffraction peaks, indicating that the addition of biochar does not alter the crystal structure of ZnO. The continued presence of these peaks confirms that ZnO was successfully impregnated onto the biochar matrix without causing significant phase changes or structural damage [8,10]. Additionally, a broad, faint diffraction feature in the low-angle region, associated with amorphous carbon in biochar, is often observed in carbon-rich materials derived from biomass [9].

2.2. Regression and Diagnostic Analysis

The experimental design of the CCD model for the sonocatalytic degradation of malachite green by ZnO/BC is shown in Table 1, while the statistical significance of the developed model was evaluated using ANOVA, as summarised in Table 2. The malachite green degradation efficiency with ZnO/BC under ultrasonic irradiation ranged from 35.92% to 98.8% across the experimental conditions. The second-order polynomial equation in terms of coded variables is expressed as Equation (1), where x 1 is the initial dye concentration, x 2 is the catalyst loading, and x 3 is the sonocatalysis time. The positive signs before the terms indicate a synergistic effect on the sonocatalytic degradation of malachite green, whereas the negative signs indicate an antagonistic effect [21].
y p r e d = 72.90 17.42 x 1 + 3.77 x 2 + 7.22 x 3 + 1.27 x 1 x 2 2.24 x 1 x 3 + 1.34 x 2 x 3 2.43 x 1 2 0.8615 x 2 2 1.10 x 3 2
The model shows a significant F-value of 301.09, indicating a 0.01% chance that this result is due to noise. The developed model is statistically significant at the 95% confidence level with a p-value less than 0.05. The lack-of-fit F-value of 0.1564 and its p-value of 0.9686 demonstrate that the lack of fit is statistically insignificant relative to the pure error.
The R2 of 0.9963 confirms that 99.63% of the variability in dye degradation efficiency could be explained by the developed model, leaving only 0.37% of the total variance unexplained. The adjusted R2 value of 0.9930 was in good agreement with the R2 value, confirming the reliability of the model without overfitting. In addition, the predicted R2 of 0.9916 showed reasonable agreement with the adjusted R2, further supporting the predictive capability of the developed model. The model demonstrates an adequate precision of 63.67, exceeding the desirable ratio of 4, and indicating good predictability in navigating the design space and predicting the response.
The p-values for all linear terms are highly significant, confirming that all the studied parameters play a vital role in the sonocatalytic performance of the ZnO/BC. Moreover, the interaction terms between the variables ( x 1 x 2 , x 1 x 3 , x 2 x 3 ) all exhibit p-values below 0.05. This confirms that there are significant interactive effects between the studied parameters and that the individual parameters do not operate independently. In addition, all quadratic terms ( x 1 2 , x 2 2 , x 3 2 ) are also statistically significant, which validates the use of a second-order polynomial model to capture the complex curvature of the response surface.
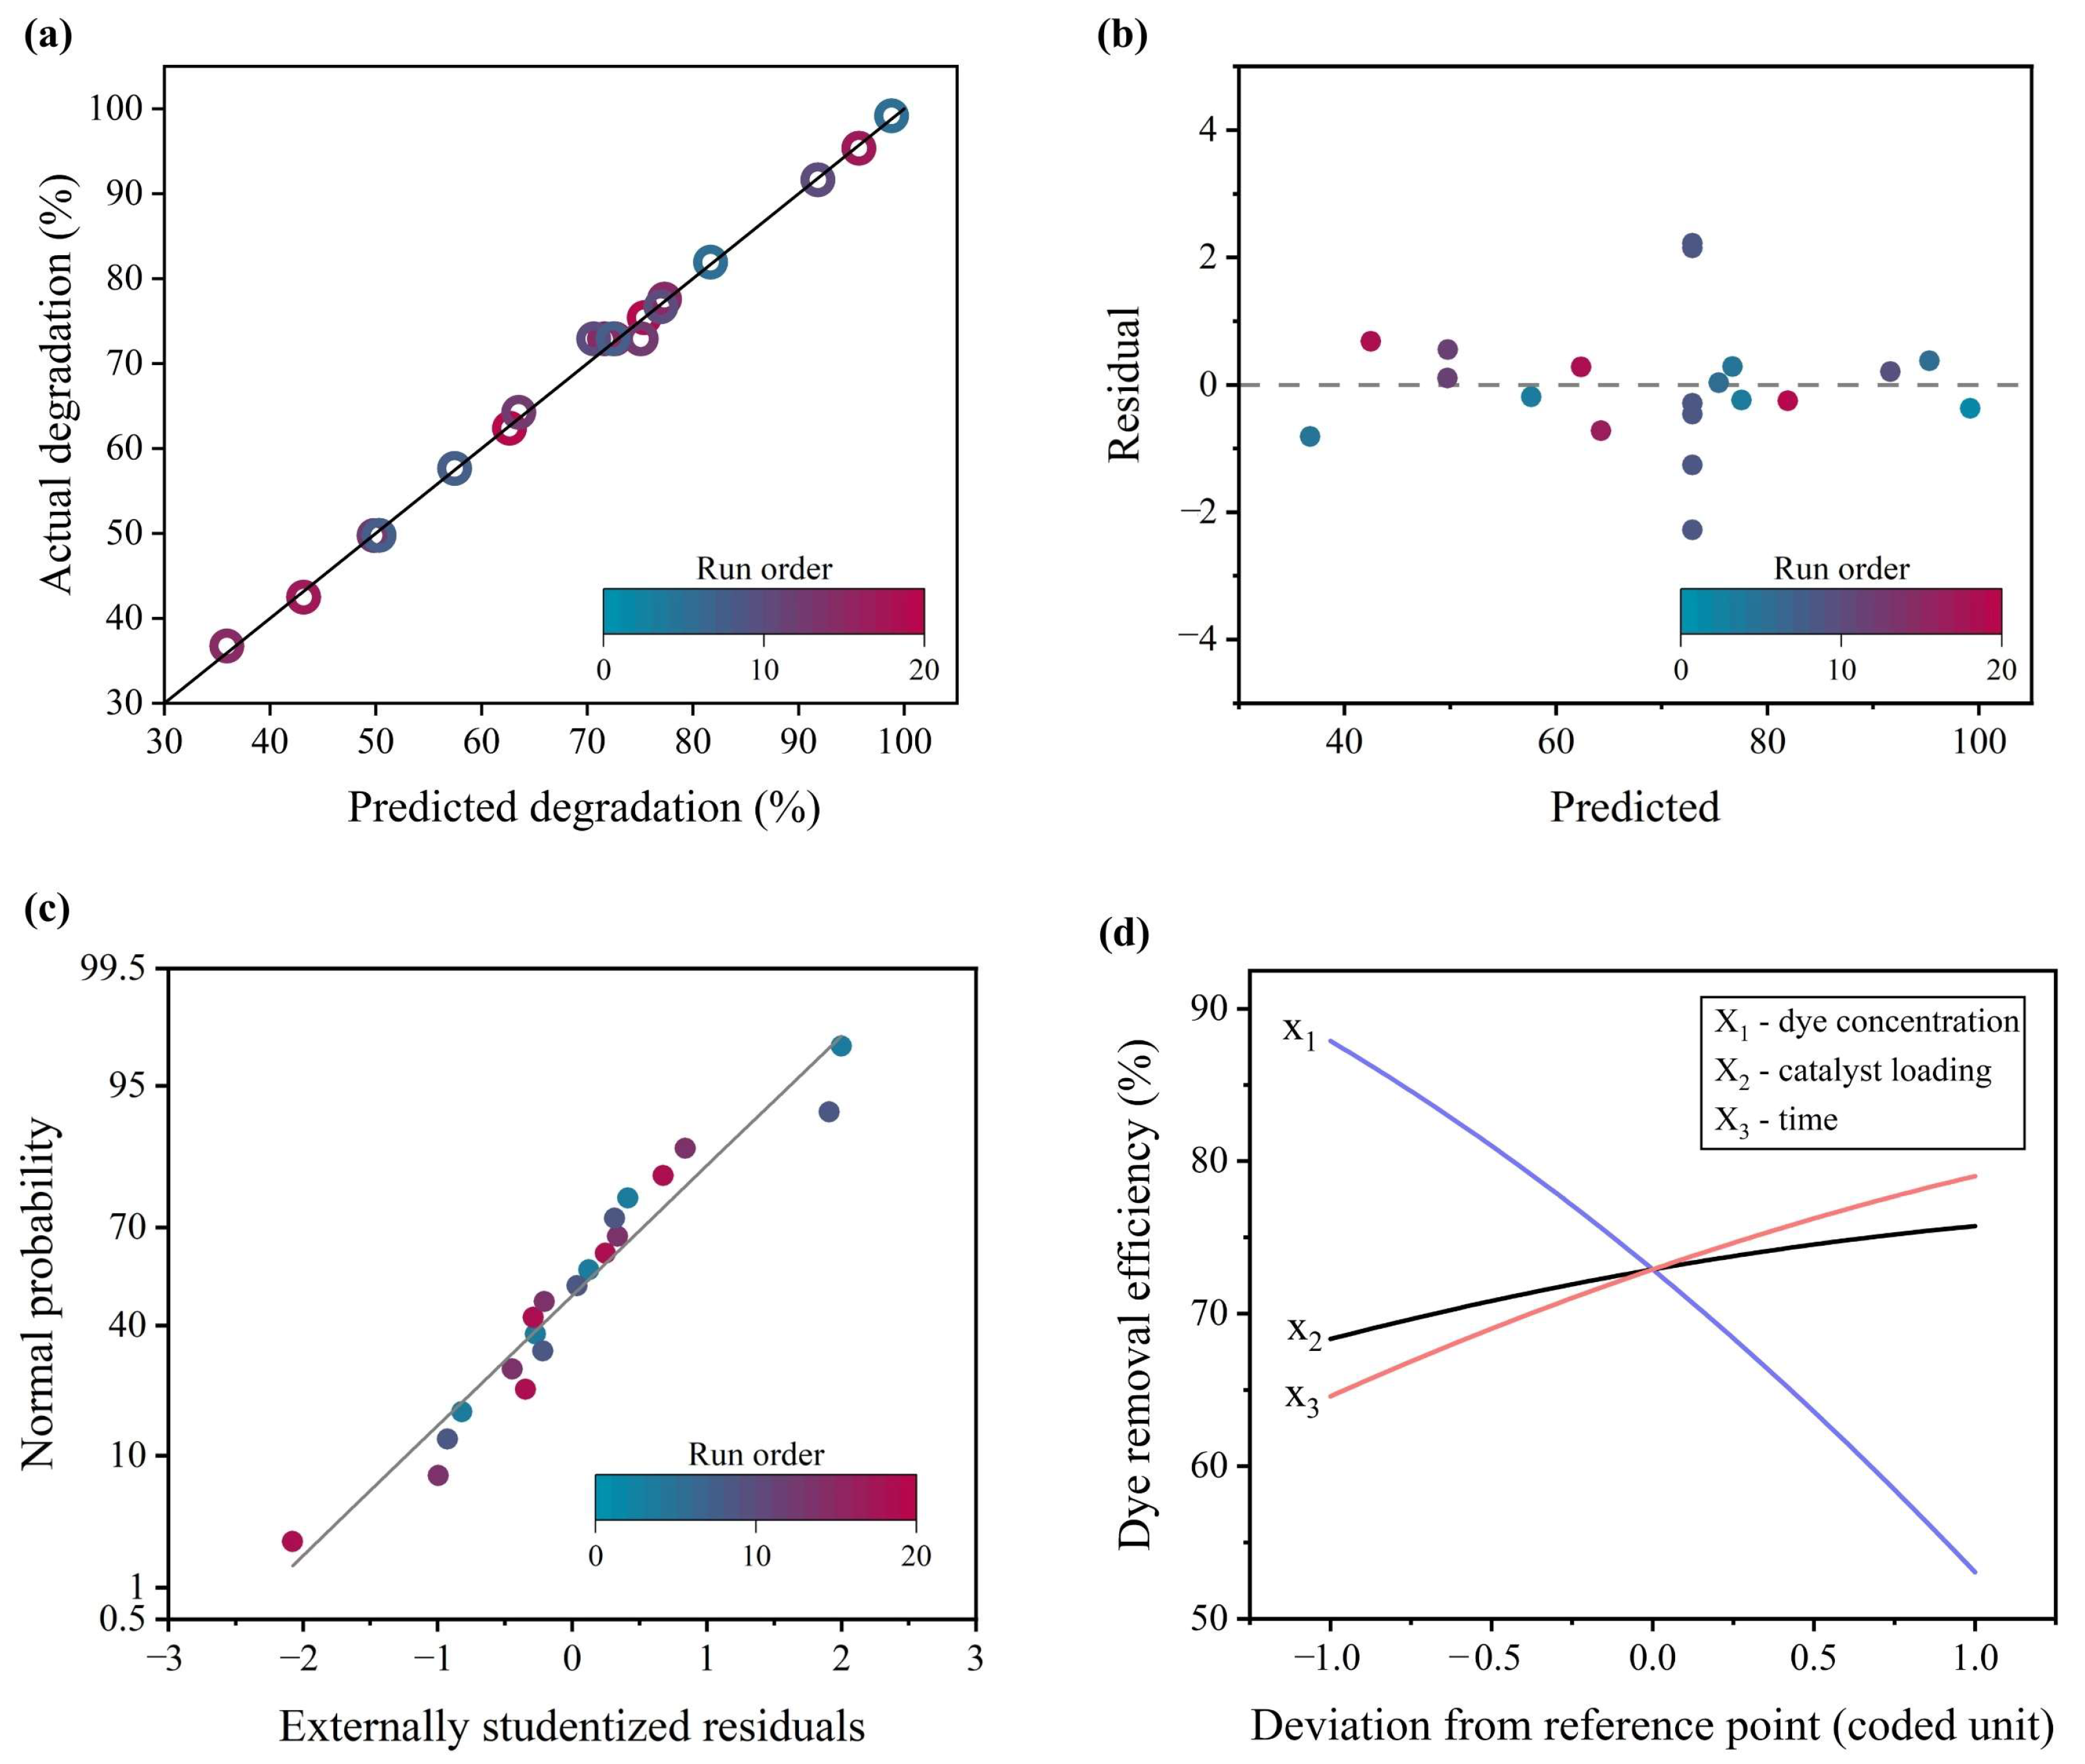
Figure 5 shows the diagnostic plots of the developed model. For the plot of actual experimental degradation efficiency against the predicted values from the quadratic model, the data points cluster closely along the diagonal, indicating a strong correlation between observed and predicted values. This confirms that the proposed model effectively describes the relationship between operational parameters and the degradation efficiency of the ZnO/BC. Furthermore, the plot of internally studentised residuals versus predicted values shows a random scattering of points without any distinct pattern or funnelling effect. This random scatter suggests that the variance of the original observations remains constant across all response values, confirming the absence of systematic error in the model. Additionally, the normal probability plot of externally studentised residuals exhibits a straight-line distribution. This linear trend verifies that the error terms are normally distributed, thus supporting the statistical validity of the developed model.
A perturbation plot was employed to compare the sensitivity of the malachite green removal efficiency to process variables at a specific reference point within the design space. As shown in Figure 5d, the degradation efficiency of malachite green is highly affected by changes in the initial dye concentration, which shows a steep negative slope. This reveals a strong antagonistic effect, where increasing the initial malachite green concentration decreases the dye removal efficiency. On the other hand, catalyst loading and ultrasonic irradiation time show synergistic effects, as indicated by their positive slopes. The ultrasonic irradiation time has a steeper positive slope than catalyst loading, suggesting that, within the studied design space, the degradation efficiency of malachite green is more responsive to longer reaction times.

2.3. Optimisation and Response Surface Analysis

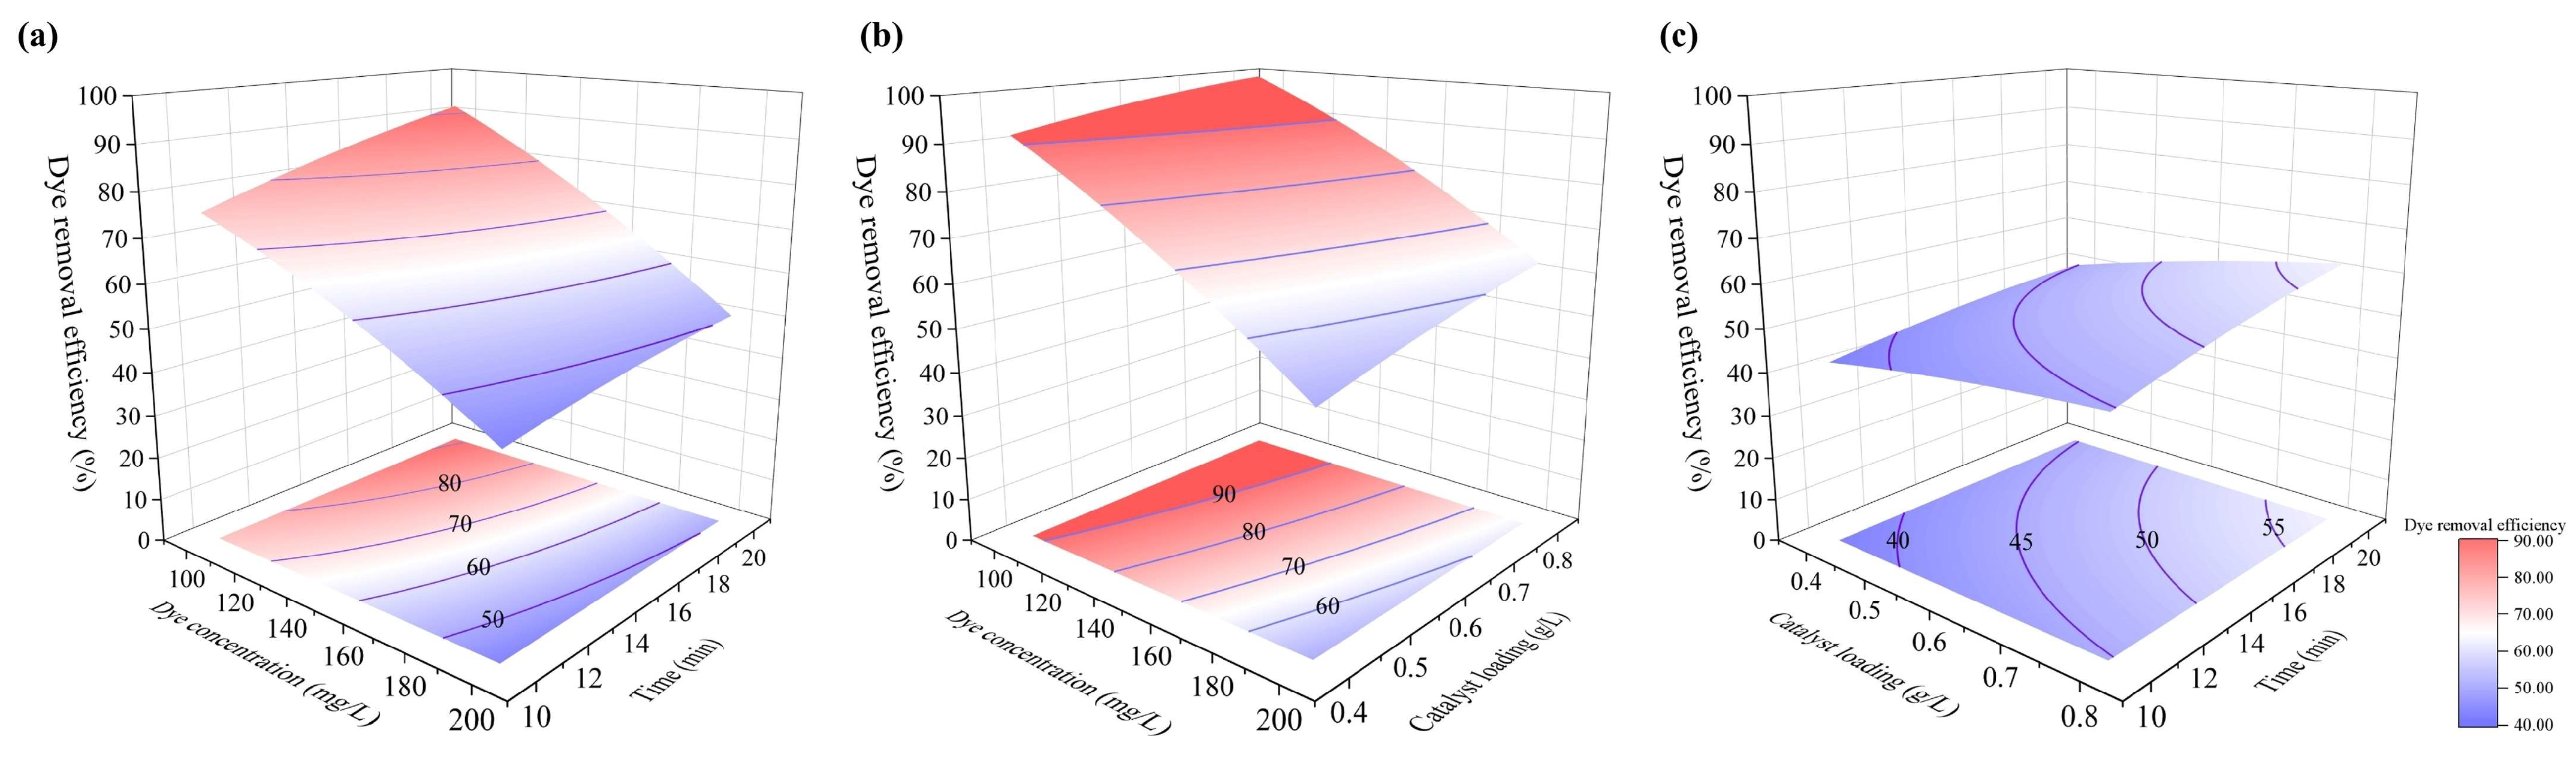
The combined effects of the independent variables on malachite green degradation efficiency were further visualised using three-dimensional response surface plots and their associated contour plots, as shown in Figure 6. The response surface indicates that the highest dye removal efficiency occurs at a lower initial dye concentration and a longer ultrasonic irradiation time. At low dye concentration, a rapid increase in degradation rate is observed over time due to the competition among the limited dye molecules for the abundant ROS generated by the acoustic cavitation of the ZnO/biochar composite. Conversely, at higher dye concentrations, the degradation efficiency drops substantially, even with increased irradiation time. This effect can be attributed to the screening mechanism, where a high concentration of dye molecules absorbs or scatters ultrasonic waves, reducing cavitation intensity and limiting the formation of •OH radicals [2].
The second surface plot clearly shows that increasing the catalyst loading from 0.4 g/L to 0.8 g/L enhances the removal efficiency, but this positive effect is much more pronounced at lower dye concentrations. At lower concentrations, a higher dosage of the ZnO/biochar composite provides an excess of active sites relative to the number of target molecules, facilitating rapid adsorption and sonocatalytic degradation [2,12]. However, at a high initial concentration of 200 mg/L, the degradation efficiency drops sharply, and increasing the catalyst loading provides only a marginal improvement. This indicates that at highly elevated concentrations, the active sites on the composite surface become rapidly saturated, making the initial dye concentration the primary rate-limiting factor [7].
The third surface plot shows a clear synergistic relationship: the dye removal efficiency increases steadily as both catalyst dosage and irradiation time rise, reaching its maximum at the upper limits of both parameters (0.8 g/L and 20 min). A higher catalyst loading provides more nucleation sites for cavitation bubble formation, while a longer reaction time ensures sustained bubble collapse to provide a continuous supply of ROS [2,22]. The relatively linear upward slope in this 3D plot indicates that, within the studied design space, optimising both the active surface area and contact time simultaneously is very effective for maximising the cleavage of the malachite green molecular structure.
Numerical optimisation was conducted using the developed quadratic model to define the criteria for the independent variables. The optimal conditions predicted were an initial dye concentration of 73.71 mg/L, a ZnO/biochar catalyst loading of 0.527 g/L, and an ultrasonic irradiation time of 18.71 min, resulting in complete malachite green removal. Experimental validation achieved an average actual degradation efficiency of 99.23%. The close correlation between the experimentally observed result and the model’s predicted value, indicated by a relative error of 0.77%, confirms the high validity of the developed empirical model. This consistency validates that the quadratic model is highly adequate for predicting and optimising the sonocatalytic performance of the ZnO/BC.
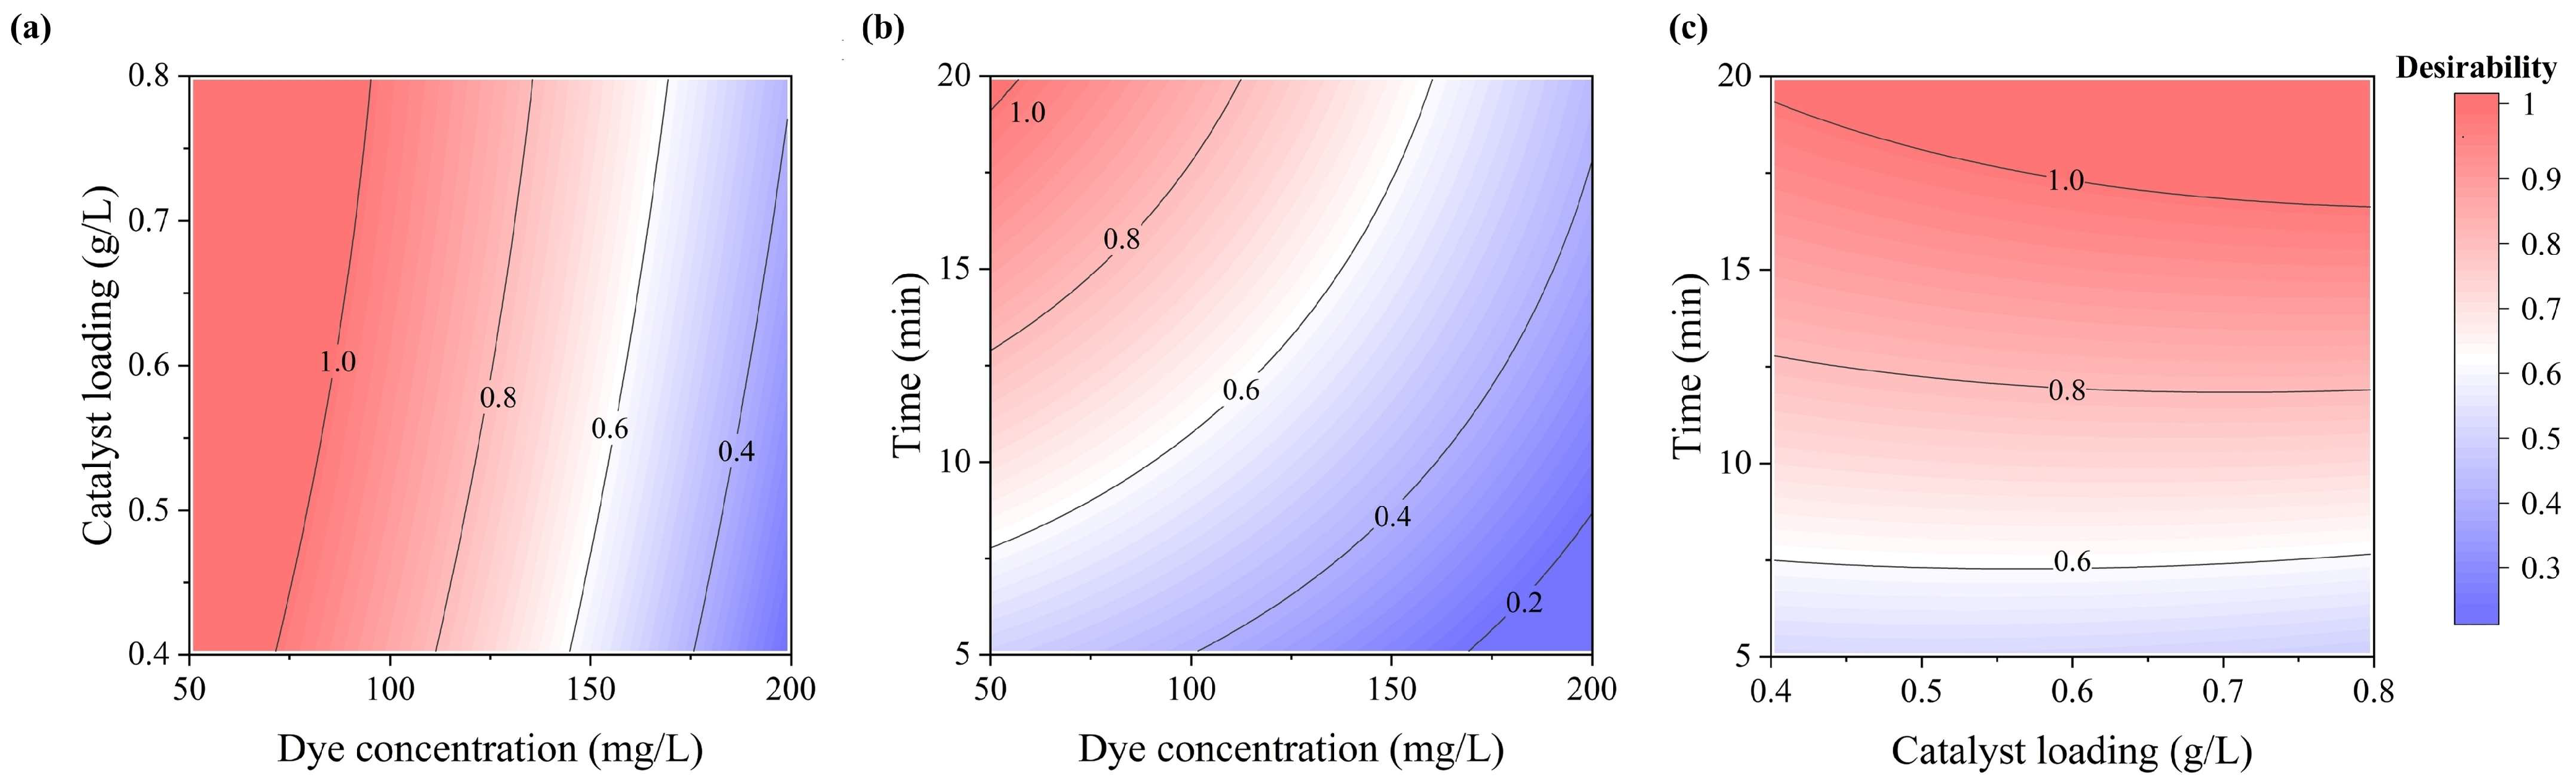
Figure 7 displays the 2D contour plots of the overall desirability function under the optimised conditions, offering a visual depiction of the optimal working coordinates. The dark red areas represent desirability values close to 1.0, indicating the ideal parameter space where the maximum response is reached. As shown in Figure 7a,b, desirability strongly favours the lower end of the initial dye concentration when approaching 50 mg/L. Furthermore, Figure 7b,c reveal that maximum desirability is maintained over a broad plateau at higher catalyst loadings (0.6–0.8 g/L) and longer ultrasonic irradiation times (15–20 min).
To investigate the synergistic effect of the ZnO/biochar composite, control experiments were conducted using pristine ZnO and biochar under identical conditions. ZnO achieved a degradation of 62.77%, whereas biochar removed malachite green with an efficiency of 52.01% after 60 min of ultrasonic irradiation at an initial dye concentration of 100 mg/L and a catalyst loading of 0.1 g/L. The ZnO/biochar composite exhibited a significantly higher degradation efficiency of 84.7% under the same operating conditions. This confirms that the combination of ZnO and biochar in a composite significantly improves catalytic performance.
Previous studies have demonstrated that incorporating ZnO into a biochar matrix significantly enhances organic dye removal performance by improving the biochar’s physicochemical properties. Adsorption-based systems using biochar derived from maize stalks and wild tamarind achieved up to 88.08% removal of azo dyes at an initial concentration of 100 mg/L. However, an extended retention time of up to 60 days was required [25]. In contrast, photocatalytic systems typically exhibit faster degradation rates but are mostly limited to lower dye concentrations. The ZnO/BC composite derived from sugarcane achieved 90.8% removal of methyl orange at 25 mg/L within 120 min [6], while hemp stem-derived ZnO/BC showed 98.71% degradation of methylene blue at 18 mg/L in 100 min [20]. Similarly, the ZnO/BC composites demonstrated removal efficiencies ranging from 94% to 90% for methylene blue and rhodamine B, respectively, at a concentration of 10 mg/L within 150 min under adsorption-photocatalysis conditions [26]. The synthesised ZnO/biochar composite in this study shows excellent malachite green degradation performance, emphasising the effectiveness of the synthesised catalyst in degrading malachite green at a higher initial dye concentration within a short timeframe.

2.4. COD and TOC Analysis

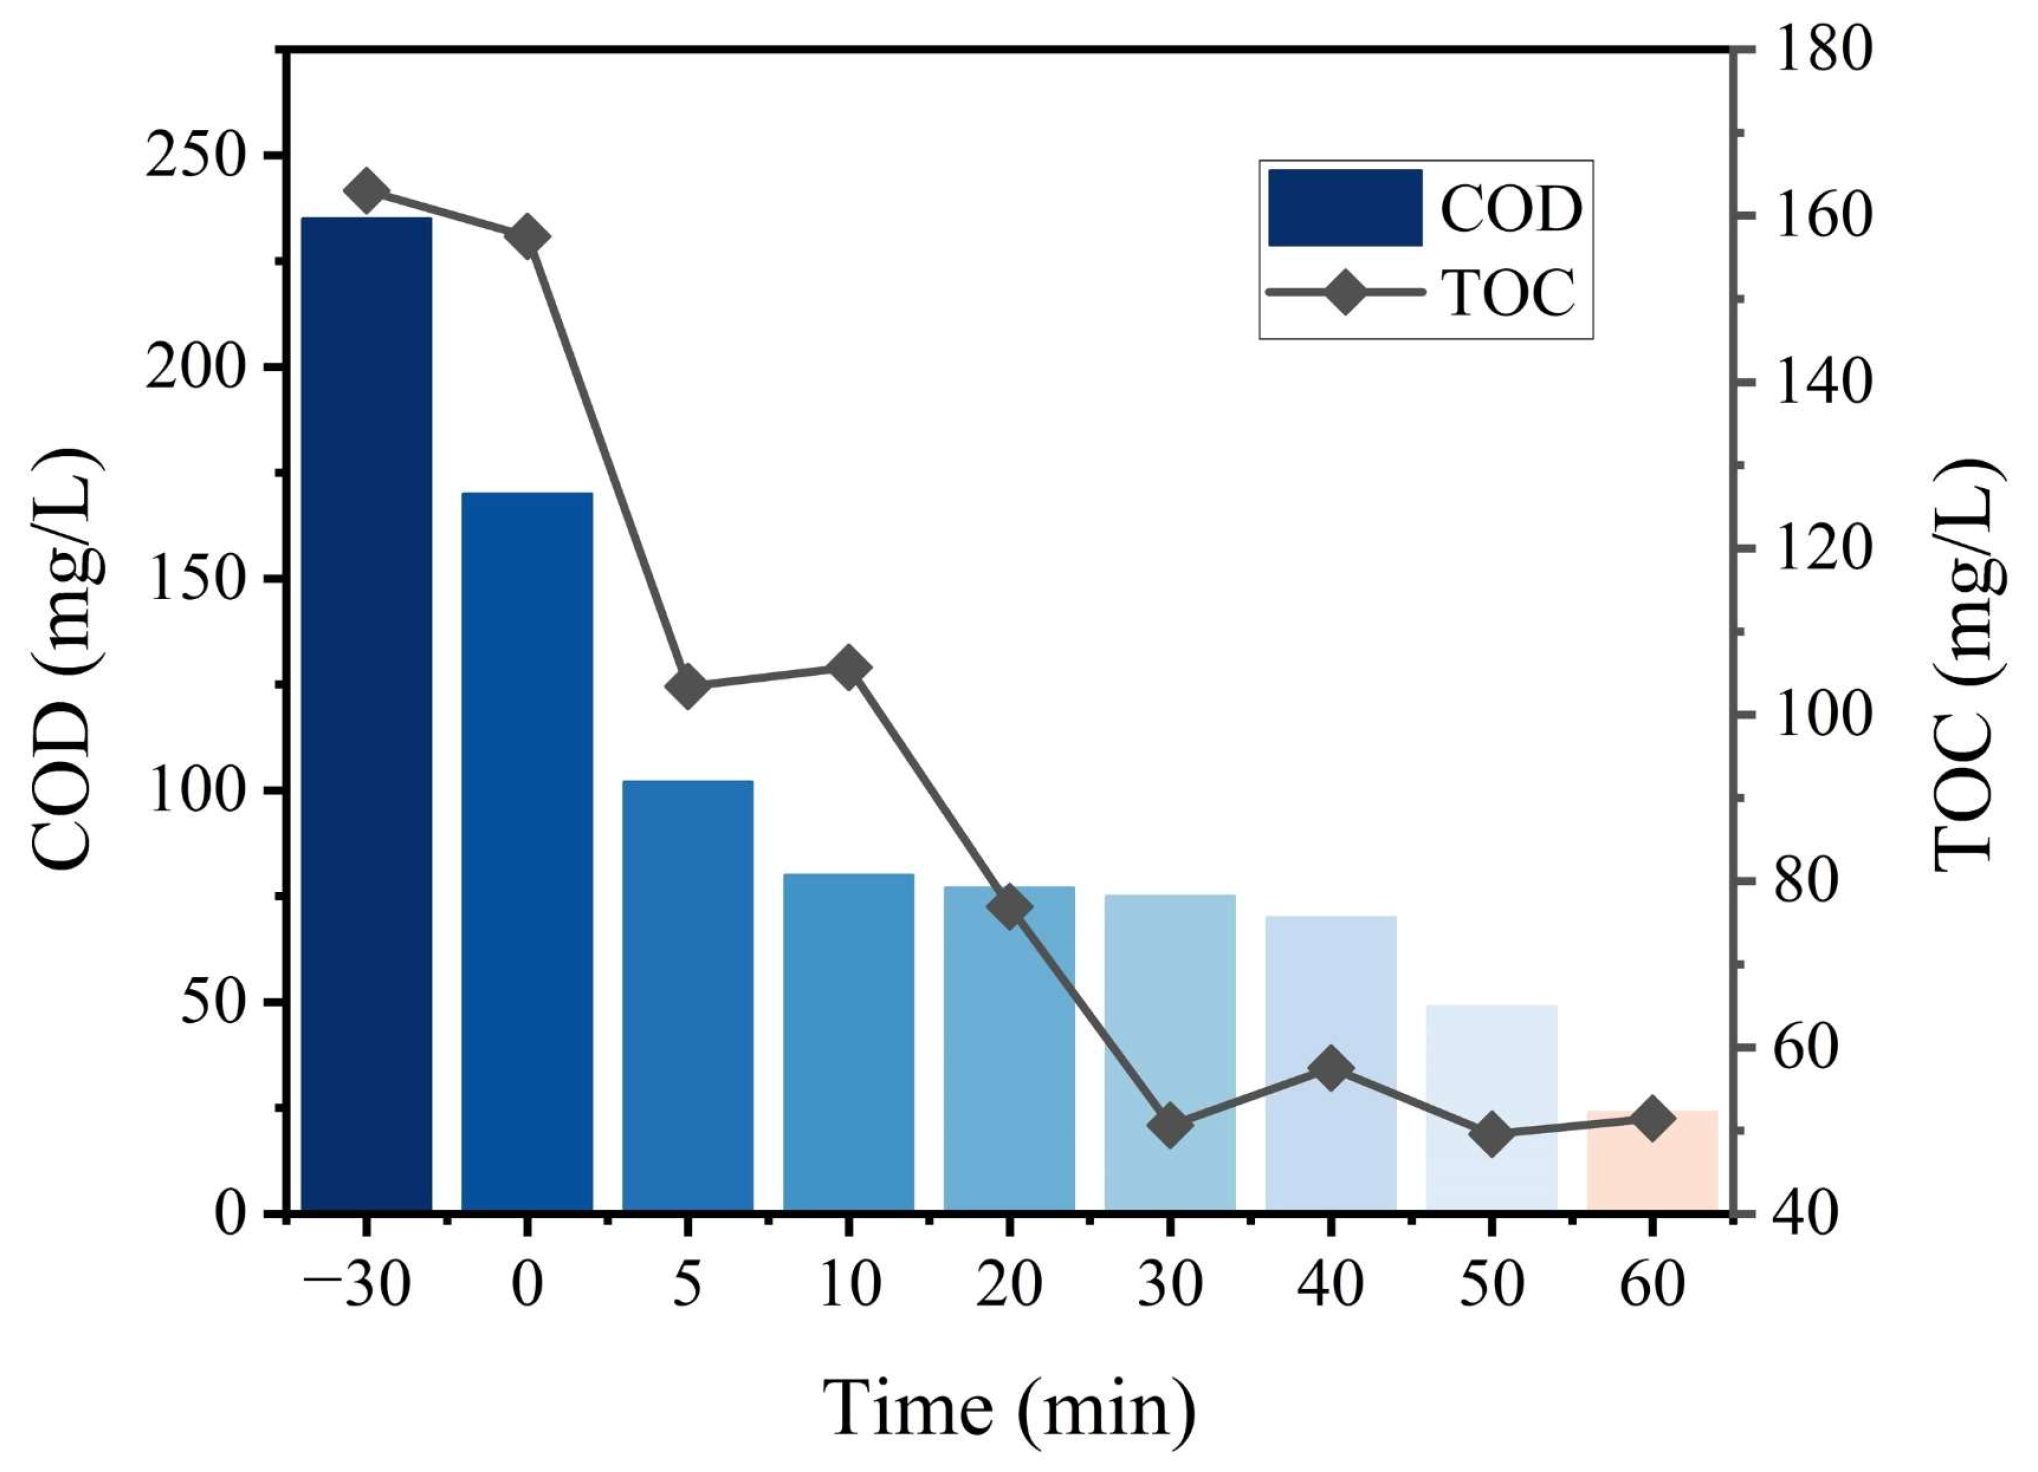
While visual decolourisation indicates the breakdown of the malachite green chromophore, it does not confirm the complete degradation of the organic structure. Therefore, the extent of mineralisation was assessed by monitoring COD and TOC, as presented in Figure 8. The process consisted of a 30 min adsorption phase, from −30 to 0 min, followed by 60 min of ultrasonic irradiation. During the adsorption phase, both parameters decreased noticeably. COD dropped from approximately 235 mg/L to 170 mg/L, while TOC declined slightly from 163 mg/L to 157.5 mg/L. This initial reduction is primarily due to the physical adsorption of malachite green molecules onto the highly porous, active-site-rich biochar support prior to the sonocatalytic reaction. Once ultrasonic irradiation began, both COD and TOC concentrations continued to decrease significantly. Acoustic cavitation produced a persistent supply of ROS, which progressively oxidised the complex aromatic rings of malachite green into smaller, simpler intermediate compounds. By the end of the 60 min sonocatalytic process, COD was reduced to approximately 24 mg/L, indicating an overall removal efficiency of 89.79%. Similarly, TOC was successfully reduced to around 51.46 mg/L, achieving a removal efficiency of 68.43%. The concurrent decline in both COD and TOC demonstrates that ZnO/BC not only decolourises wastewater but also exhibits excellent sonocatalytic activity for the extensive mineralisation of malachite green into harmless inorganic products, such as carbon dioxide and water [12,20].

3. Materials and Methods

3.1. Chemicals

Malachite green (purity ≥ 99%) was obtained from Friedemann Schmidt (Selangor, Malaysia). Nitric acid (65%), sodium hydroxide (purity ≥ 95%), and sodium chloride (purity ≥ 99.5%) were purchased from Merck (Darmstadt, Germany). The COD digestion vial (low range) was sourced from Hach (Petaling Jaya, Malaysia). Distilled water was used throughout the study. All chemicals used in this study were analytical grade and were used as received without further purification.

3.2. Synthesis of Catalyst

Fresh duckweed was used as the plant source to prepare plant extracts and biochar. The fresh duckweed was cleaned and dried at 80 °C for 24 h. The dried duckweed was then ground into powder, and 5 g of the dried duckweed powder was then transferred into a round-bottom flask to be thoroughly mixed with 250 mL of distilled water. The mixture was refluxed at 80 °C for 3 h. The plant extract was filtered after cooling and stored at 4 °C before use in experiments. Meanwhile, the dried duckweed powder from the previous section was calcined in a muffle furnace at 500 °C for 2 h with a heating rate of 10 °C/min in air [27].
The leachate was prepared from the harvested duckweed after phytoremediation of zinc ions from synthetic wastewater. The harvested duckweed after phytoremediation was obtained from a previous study [28]. The recovery of zinc ions from the harvested plant residues was modified in accordance with the method proposed by [29,30]. The duckweed was dried at 80 °C for 24 h and was then ground using a grinder. Zinc was leached from phytoremediated biomass using acid digestion to obtain a zinc-rich leachate as a zinc precursor for the synthesis of ZnO and its composites. The dried duckweed powder was digested with 1 M nitric acid for 6 h, followed by heating at 80 °C for 30 min. Then, the filtrate was kept at room temperature prior to use as a zinc precursor in the synthesis of ZnO and its composites.
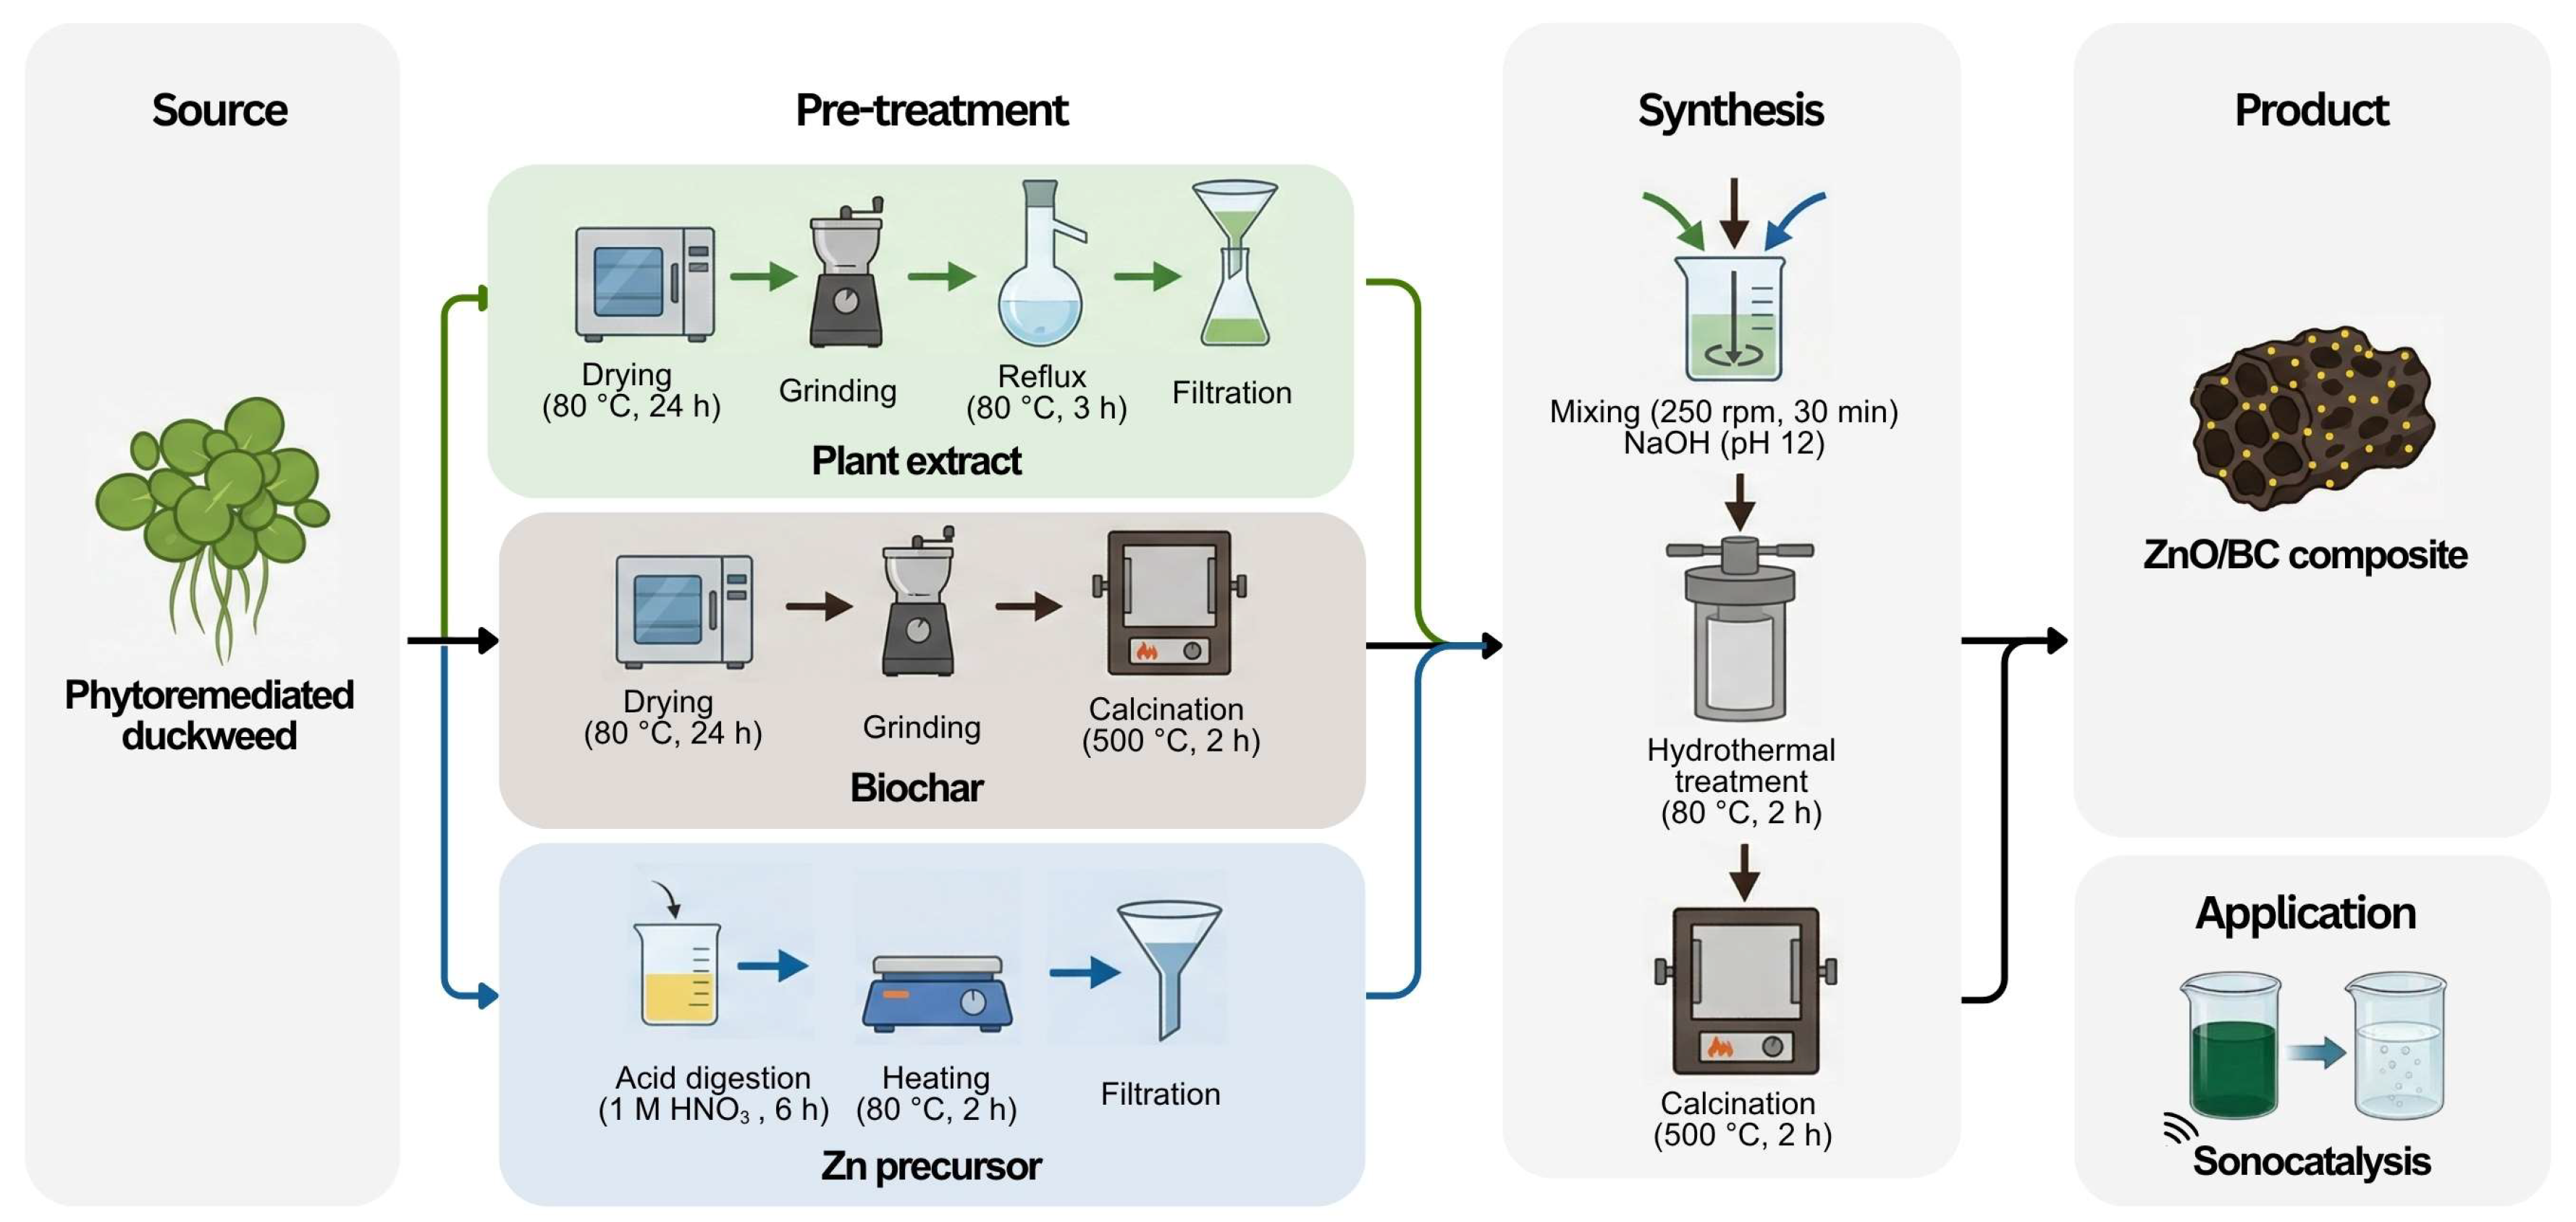
The plant extract was added to the zinc precursor under continuous stirring at 250 rpm for 30 min. Meanwhile, 2 M NaOH was added dropwise to maintain the solution pH at 12. The mixture was then transferred to the Teflon vessel for autoclaving at 80 °C for 4 h. The resulting mixture was then filtered and calcined in a muffle furnace at 500 °C for 2 h with a heating rate of 10 °C/min in air [27]. The schematic illustration outlining the synthesis process of the ZnO/biochar composite is shown in Figure 9.

3.3. Characterisation of Catalyst

The morphology and microstructural features of the synthesised catalyst were examined using transmission electron microscopy (TEM, Hitachi, H7100, Tokyo, Japan) and scanning electron microscopy (SEM, Hitachi, S-3400N, Tokyo, Japan). The surface chemical composition and elemental oxidation states of the synthesised catalysts were analysed using X-ray photoelectron spectroscopy (XPS, Omicron multiprobe, Taunusstein, Germany). Measurements were performed with the Omicron Multiprobe spectrometer equipped with a monochromatic Al–Kα radiation source. The surface functional groups of the synthesised catalyst were identified using Fourier transform infrared spectroscopy (FTIR, Thermo Scientific, Nicolet iS10, Waltham, MA, USA). The crystallographic structures of the catalysts were determined by X-ray diffraction analysis (XRD; Shimadzu, XRD-6000, Tokyo, Japan) using Cu–Kα radiation (λ = 1.5406 Å). The signal was recorded over a 2θ angular range of 5° to 80° at a scanning rate of 2°/min and an accelerating voltage of 40 kV.

3.4. Evaluation of Sonocatalytic Performance

The sonocatalytic performance of the synthesised catalysts was evaluated by analysing the degradation of malachite green under ultrasonic irradiation generated by a Kudos SK5200GT (Kudos, Shanghai, China) ultrasonic bath operating at 40 kHz and 180 W. In a typical experiment, the synthesised catalyst was added to the malachite green solution and stirred at 250 rpm for 30 min to reach adsorption–desorption equilibrium before being exposed to ultrasonic irradiation. The sample was then collected at the designated time, and the liquid was centrifuged at 10,000 rpm for 10 min to sediment the suspended catalyst. The concentration of malachite green in the liquid was measured using a double-beam UV-Vis spectrophotometer (Hitachi, UH5300, Tokyo, Japan) at an absorbance wavelength of 655 nm. The dye degradation efficiency was calculated using Equation (2).
Dye   removal   efficiency = C 0 C t C 0   ×   100 %
where
C 0 = initial dye concentration, mg/L
C t = dye concentration at time t, mg/L

3.5. Optimisation Studies

The experimental design and optimisation of the sonocatalytic dye degradation process using the synthesised ZnO/BC were carried out with RSM to systematically assess the interactions between operating parameters and dye removal efficiency. The response surface methodology was performed using Design-Expert (version 11.0.4, Stat-Ease, Minneapolis, MN, USA). A CCD was chosen for its effectiveness in modelling nonlinear behaviour and optimising multivariable processes related to heterogeneous sonocatalytic systems.
Three independent variables were selected based on their influence on the sonocatalytic performance of ZnO/BC in a preliminary study: initial dye concentration ( x 1 ), catalyst loading ( x 2 ), and sonocatalytic reaction time ( x 3 ). The dye degradation efficiency was defined as the response variable. Each parameter was investigated at five coded levels (−α, −1, 0, +1, +α), with the axial distance fixed at 1.68 to maintain the rotatability of the design, as shown in Table 3. The CCD included factorial points, axial points, and six replicates at the centre point to accurately estimate pure experimental error and evaluate the reproducibility of the ZnO/BC-assisted sonocatalytic process. All experimental runs were performed in a randomised order to minimise systematic errors.
The experimental results were fitted to a second-order polynomial model to describe the relationship between the independent variables and dye degradation efficiency. The quadratic model is expressed as Equation (3), where y p r e d is the predicted response, x i and x j correspond to the coded independent variables, βo is the intercept term, βi, βii, and βij are interaction coefficients of linear, quadratic and second-order terms, and ε is the error.
y p r e d = β o + i = 1 k β i x i + i = 1 k β i i x i 2 + i = 1 k 1 j = 1 k β i j x i x j + ε

3.6. Statistical Analysis

The adequacy and statistical significance of the developed model were assessed using analysis of variance (ANOVA). The model fit was evaluated using the R2 and adjusted R2, with values close to unity indicating a strong correlation between the predicted and experimental responses. The significance of individual model terms was determined using the p-value at a 95% confidence level (p < 0.05). A non-significant lack-of-fit (p > 0.05) confirmed that the quadratic model adequately described the experimental data for the ZnO/BC sonocatalytic system within the investigated range.
Model validation was further conducted through diagnostic analyses. The normal distribution of residuals and the absence of systematic deviation confirmed the reliability of the proposed model. Process optimisation was conducted using the desirability function approach to identify the optimal operating conditions that maximised dye degradation efficiency. The interactive effects of the independent variables were visualised with three-dimensional response surfaces and contour plots. The optimal conditions predicted by the RSM model were subsequently validated through confirmatory experiments to evaluate the accuracy of the model and the practical applicability of ZnO/BC as an effective sonocatalyst for dye degradation.

3.7. COD and TOC Analysis

The COD measurement was conducted using a spectrophotometer (Hach, DR3900, Loveland, CO, USA) following standard dichromate digestion procedures. The collected liquid samples at predetermined time intervals were centrifuged to remove catalyst particles, in accordance with the USEPA reactor digestion method, before wavelength analysis. The TOC analysis was performed using a TOC analyser (Shimadzu, TOL-L, Kyoto, Japan) with the collected samples.

4. Conclusions

Comprehensive structural and morphological characterisations confirmed the successful anchoring of wurtzite ZnO nanoparticles onto the porous biochar matrix. The impregnation of ZnO into the biochar matrix not only provided abundant oxygen-containing functional groups for catalyst binding but also effectively prevented the agglomeration of ZnO. The developed second-order polynomial model demonstrated exceptional statistical reliability and predictive accuracy, evidenced by a highly significant F-value and an R2 of 0.9963. The perturbation and 3D response surface analyses revealed that, while the initial dye concentration exerted a strong antagonistic effect on degradation efficiency, both catalyst loading and ultrasonic irradiation time synergistically contributed to the generation of reactive oxygen species. Under the optimised operational conditions predicted by the model, the experimental validation yielded a maximum malachite green degradation efficiency of 99.23%, in close agreement with the theoretical predictions. Furthermore, reductions in both COD and TOC confirmed that ZnO/BC facilitated not only the decolourisation of the dye but also its enhanced mineralisation into harmless inorganic byproducts. This research demonstrates that integrating ZnO with biochar yields a highly active sonocatalyst, offering a promising technology for the advanced oxidation and remediation of malachite green.

Author Contributions

Conceptualization, Y.L.P.; writing—original draft preparation and methodology, J.W.T.; supervision, visualization and checking, W.-H.C.; funding acquisition and visualization, Y.-K.C.; writing—review and editing, S.L.; resources, W.C.C. All authors have read and agreed to the published version of the manuscript.

Funding

The research was supported by the Ministry of Higher Education (MoHE), through the Fundamental Research Grant Scheme (FRGS/1/2022/TK05/UTAR/02/34). The authors also gratefully acknowledge the financial support from the National Science and Technology Council, Taiwan, R.O.C., under the contracts NSTC 113-2218-E-006-012 and NSTC 113-2218-E-002-029 for this study. This research is also supported in part by the Higher Education Sprout Project, Ministry of Education to the Headquarters of University Advancement at National Cheng Kung University (NCKU).

Institutional Review Board Statement

Not applicable.

Informed Consent Statement

Not applicable.

Data Availability Statement

The data presented in this study are available upon reasonable request from the authors.

Acknowledgments

The authors would like to thank the Ministry of Higher Education (MoHE) Malaysia that provided the Fundamental Research Grant Scheme (FRGS/1/2022/TK05/UTAR/02/34) and the Universiti Tunku Abdul Rahman (UTAR) Research Fund (IPSR/RMC/UTARRF/2020-C2/P01). The authors also gratefully acknowledge the financial support from the National Science and Technology Council, Taiwan, R.O.C, under the contracts NSTC 113-2218-E-006-012 and NSTC 113-2218-E-002-029 for this study. This research is also supported in part by Higher Education Sprout Project, Ministry of Education to the Headquarters of University Advancement at National Cheng Kung University (NCKU).

Conflicts of Interest

The authors declare no conflicts of interest.

References

  1. Sharma, G.; Bhogal, S.; Gupta, V.K.; Agarwal, S.; Kumar, A.; Pathania, D.; Mola, G.T.; Stadler, F.J. Algal Biochar Reinforced Trimetallic Nanocomposite as Adsorptional/Photocatalyst for Remediation of Malachite Green from Aqueous Medium. J. Mol. Liq. 2019, 275, 499–509. [Google Scholar] [CrossRef]
  2. Albo Hay Allah, M.A.; Ibrahim, H.K.; Alshamsi, H.A.; Radhi Saud, H. Eco-Friendly Synthesis of Biochar Supported with Zinc Oxide as a Heterogeneous Catalyst for Photocatalytic Decontamination of Rhodamine B under Sunlight Illumination. J. Photochem. Photobiol. A Chem. 2024, 449, 115413. [Google Scholar] [CrossRef]
  3. Rubangakene, N.O.; Elwardany, A.; Fujii, M.; Sekiguchi, H.; Elkady, M.; Shokry, H. Biosorption of Congo Red Dye from Aqueous Solutions Using Pristine Biochar and ZnO Biochar from Green Pea Peels. Chem. Eng. Res. Des. 2023, 189, 636–651. [Google Scholar] [CrossRef]
  4. Jajko-Liberka, G.; Anagha, M.G.; Chytrosz-Wróbel, P.; Kubisiak, P.; Kulig, W.; Cwiklik, L.; Kotarba, A. Sonochemical Synthesis of Nanoparticles from Bioactive Compounds: Advances, Challenges, and Future Perspectives. Ultrason. Sonochemistry 2025, 121, 107559. [Google Scholar] [CrossRef]
  5. Trinh, Q.T.; Golio, N.; Cheng, Y.; Cha, H.; Tai, K.U.; Ouyang, L.; Zhao, J.; Tran, T.S.; Nguyen, T.-K.; Zhang, J.; et al. Sonochemistry and Sonocatalysis: Current Progress, Existing Limitations, and Future Opportunities in Green and Sustainable Chemistry. Green Chem. 2025, 27, 4926–4958. [Google Scholar] [CrossRef]
  6. Gonçalves, M.G.; da Silva Veiga, P.A.; Fornari, M.R.; Peralta-Zamora, P.; Mangrich, A.S.; Silvestri, S. Relationship of the Physicochemical Properties of Novel ZnO/Biochar Composites to Their Efficiencies in the Degradation of Sulfamethoxazole and Methyl Orange. Sci. Total Environ. 2020, 748, 141381. [Google Scholar] [CrossRef]
  7. Ma, B.; Zhu, J.; Xu, Y.; Zhang, L.; Liu, D.; Chen, C.; Sun, B. Photocatalytic Degradation of Methylene Blue Using ZnO Modified with Nano-Biochar Derived from Bacterial Cellulose. Ceram. Int. 2025, 51, 14948–14956. [Google Scholar] [CrossRef]
  8. Dumbrava, A.; Matei, C.; Diacon, A.; Moscalu, F.; Berger, D. Novel ZnO-Biochar Nanocomposites Obtained by Hydrothermal Method in Extracts of Ulva Lactuca Collected from Black Sea. Ceram. Int. 2023, 49, 10003–10013. [Google Scholar] [CrossRef]
  9. Chi, W.; Yu, F.; Dong, G.; Zhang, W.; Chai, D.F.; Han, P.; Zhao, M.; Li, J.; Zhang, X. A Novel Peony-Shaped ZnO/Biochar Nanocomposites with Dominant {100} Facets for Efficient Adsorption and Photocatalytic Removal of Refractory Contaminants. Colloids Surf. A Physicochem. Eng. Asp. 2024, 695, 134291. [Google Scholar] [CrossRef]
  10. Velumani, M.; Rajamohan, S.; Pandey, A.; Pham, N.D.K.; Nguyen, V.G.; Hoang, A.T. Nanocomposite from Tannery Sludge-Derived Biochar and Zinc Oxide Nanoparticles for Photocatalytic Degradation of Bisphenol A toward Dual Environmental Benefits. Sci. Total Environ. 2024, 907, 167896. [Google Scholar] [CrossRef] [PubMed]
  11. Bhakta, A.K.; Tang, M.; Snoussi, Y.; Khalil, A.M.; Mascarenhas, R.J.; Mekhalif, Z.; Abderrabba, M.; Ammar, S.; Chehimi, M.M. Sweety, Salty, Sour, and Romantic Biochar-Supported ZnO: Highly Active Composite Catalysts for Environmental Remediation. Emergent Mater. 2025, 8, 2647–2661. [Google Scholar] [CrossRef]
  12. Tiwari, N.; Chakrabortty, S.; Samal, K.; Moulick, S.; Mohapatra, B.G.; Samanta, S.; Mohapatra, P.K.; Sanjay, K.; Nayak, J.; Banerjee, S.; et al. Photocatalytic Degradation of Malachite Green Using TiO2 and ZnO Impregnated on Fecal Sludge Derived Biochar. J. Taiwan Inst. Chem. Eng. 2023, 145, 104800. [Google Scholar] [CrossRef]
  13. Ahlawat, W.; Dilbaghi, N.; Kumar, R.; Singhal, N.K.; Kaushik, A.; Kumar, S. Adsorption of Harmful Dyes and Antimicrobial Studies Utilizing Recyclable ZnO, Its Composites with Conventionally Used Activated Carbon, and Waste Orange Peel as a Greener Approach. J. Environ. Chem. Eng. 2023, 11, 110268. [Google Scholar] [CrossRef]
  14. Joesna, G.; Alodhayb, A.; Sasikumar, P.; Sree, T.L.; Ferin, R.Z.; Sankar, D.; Prabakaran, A.; Prasath, M.; Muthuramamoorthy, M.; Mohamed, M.G.; et al. Bio- Synthesis Zinc Oxide Nanoparticle: Azadirachta Indica and Phyllanthus Acidus Mediated Green Approach for Enhanced Biological Efficacy. Chem. Phys. Impact 2025, 10, 100821. [Google Scholar] [CrossRef]
  15. Kabekkodu, S.N.; Dosen, A.; Blanton, T.N. PDF-5+: A Comprehensive Powder Diffraction FileTM for Materials Characterization. Powder Diffr. 2024, 39, 47–59. [Google Scholar] [CrossRef]
  16. Al-Gaashani, R.; Radiman, S.; Daud, A.R.; Tabet, N.; Al-Douri, Y. XPS and Optical Studies of Different Morphologies of ZnO Nanostructures Prepared by Microwave Methods. Ceram. Int. 2013, 39, 2283–2292. [Google Scholar] [CrossRef]
  17. Hu, H.; Sun, L.; Gao, Y.; Wang, T.; Huang, Y.; Lv, C.; Zhang, Y.F.; Huang, Q.; Chen, X.; Wu, H. Synthesis of ZnO Nanoparticle-Anchored Biochar Composites for the Selective Removal of Perrhenate, a Surrogate for Pertechnetate, from Radioactive Effluents. J. Hazard. Mater. 2020, 387, 121670. [Google Scholar] [CrossRef] [PubMed]
  18. Lourenco, M.A.O.; Zeng, J.; Jagdale, P.; Castellino, M.; Sacco, A.; Farkhondehfal, M.A.; Pirri, C.F. Biochar/Zinc Oxide Composites as Effective Catalysts for Electrochemical CO2 Reduction. ACS Sustain. Chem. Eng. 2021, 9, 5445–5453. [Google Scholar] [CrossRef]
  19. Gonçalves, N.P.F.; Lourenço, M.A.O.; Baleuri, S.R.; Bianco, S.; Jagdale, P.; Calza, P. Biochar Waste-Based ZnO Materials as Highly Efficient Photocatalysts for Water Treatment. J. Environ. Chem. Eng. 2022, 10, 107256. [Google Scholar] [CrossRef]
  20. He, Y.; Wang, Y.; Hu, J.; Wang, K.; Zhai, Y.; Chen, Y.; Duan, Y.; Wang, Y.; Zhang, W. Photocatalytic Property Correlated with Microstructural Evolution of the Biochar/ZnO Composites. J. Mater. Res. Technol. 2021, 11, 1308–1321. [Google Scholar] [CrossRef]
  21. Tharayil, J.M.; Chinnaiyan, P.; Ramasamy, B.; Sathasivan, A. Biogenic Synthesis of Cu/ZnO Functionalized Biochar Composite: A Sustainable Approach for Visible Light-Photocatalytic Degradation. Environ. Technol. Innov. 2025, 39, 104337. [Google Scholar] [CrossRef]
  22. Gaber, M.M.; Shokry, H.; Samy, M.; El-Bestawy, E.A. Green Approach for Fabricating Hybrids of Food Waste-Derived Biochar/Zinc Oxide for Effective Degradation of Bromothymol Blue Dye in a Photocatalysis/Persulfate Activation System. Chemosphere 2024, 364, 143245. [Google Scholar] [CrossRef]
  23. Xu, R.; Li, M.; Zhang, Q. Collaborative Optimization for the Performance of ZnO/Biochar Composites on Persulfate Activation through Plant Enrichment-Pyrolysis Method. Chem. Eng. J. 2022, 429, 132294. [Google Scholar] [CrossRef]
  24. Ghandali, M.V.; Safarzadeh, S.; Ghasemi-Fasaei, R.; Zeinali, S. Heavy Metals Immobilization and Bioavailability in Multi-Metal Contaminated Soil under Ryegrass Cultivation as Affected by ZnO and MnO2 Nanoparticle-Modified Biochar. Sci. Rep. 2024, 14, 10684. [Google Scholar] [CrossRef] [PubMed]
  25. Munir, R.; Ali, K.; Naqvi, S.A.Z.; Muneer, A.; Bashir, M.Z.; Maqsood, M.A.; Noreen, S. Green Metal Oxides Coated Biochar Nanocomposites Preparation and Its Utilization in Vertical Flow Constructed Wetlands for Reactive Dye Removal: Performance and Kinetics Studies. J. Contam. Hydrol. 2023, 256, 104167. [Google Scholar] [CrossRef] [PubMed]
  26. Kaur, M.; Kaur, H. Synergistic Effect of Biochar Impregnated with ZnO Nano-Flowers for Effective Removal of Organic Pollutants from Wastewater. Appl. Surf. Sci. Adv. 2022, 12, 100339. [Google Scholar] [CrossRef]
  27. Redjili, S.; Ghodbane, H.; Tahraoui, H.; Abdelouahed, L.; Chebli, D.; Ola, M.S.; Assadi, A.A.; Kebir, M.; Zhang, J.; Amrane, A.; et al. Green Innovation: Multifunctional Zinc Oxide Nanoparticles Synthesized Using Quercus Robur for Photocatalytic Performance, Environmental, and Antimicrobial Applications. Catalysts 2025, 15, 256. [Google Scholar] [CrossRef]
  28. Tai, J.W.; Pang, Y.L.; Steven, L.; Chong, W.C. Phytoremediation of Zinc Ions from Aquatic Macrophytes. Key Eng. Mater. 2024, 1002, 133–137. [Google Scholar] [CrossRef]
  29. Huang, Y.; Geng, Y.; Han, G.; Cao, Y.; Peng, W.; Zhu, X.; Zhang, T.A.; Dou, Z. A Perspective of Stepwise Utilization of Hazardous Zinc Plant Purification Residue Based on Selective Alkaline Leaching of Zinc. J. Hazard. Mater. 2020, 389, 122090. [Google Scholar] [CrossRef] [PubMed]
  30. Wang, D.; Liu, H.; Ma, Y.; Qu, J.; Guan, J.; Lu, N.; Lu, Y.; Yuan, X. Recycling of Hyper-Accumulator: Synthesis of ZnO Nanoparticles and Photocatalytic Degradation for Dichlorophenol. J. Alloys Compd. 2016, 680, 500–505. [Google Scholar] [CrossRef]
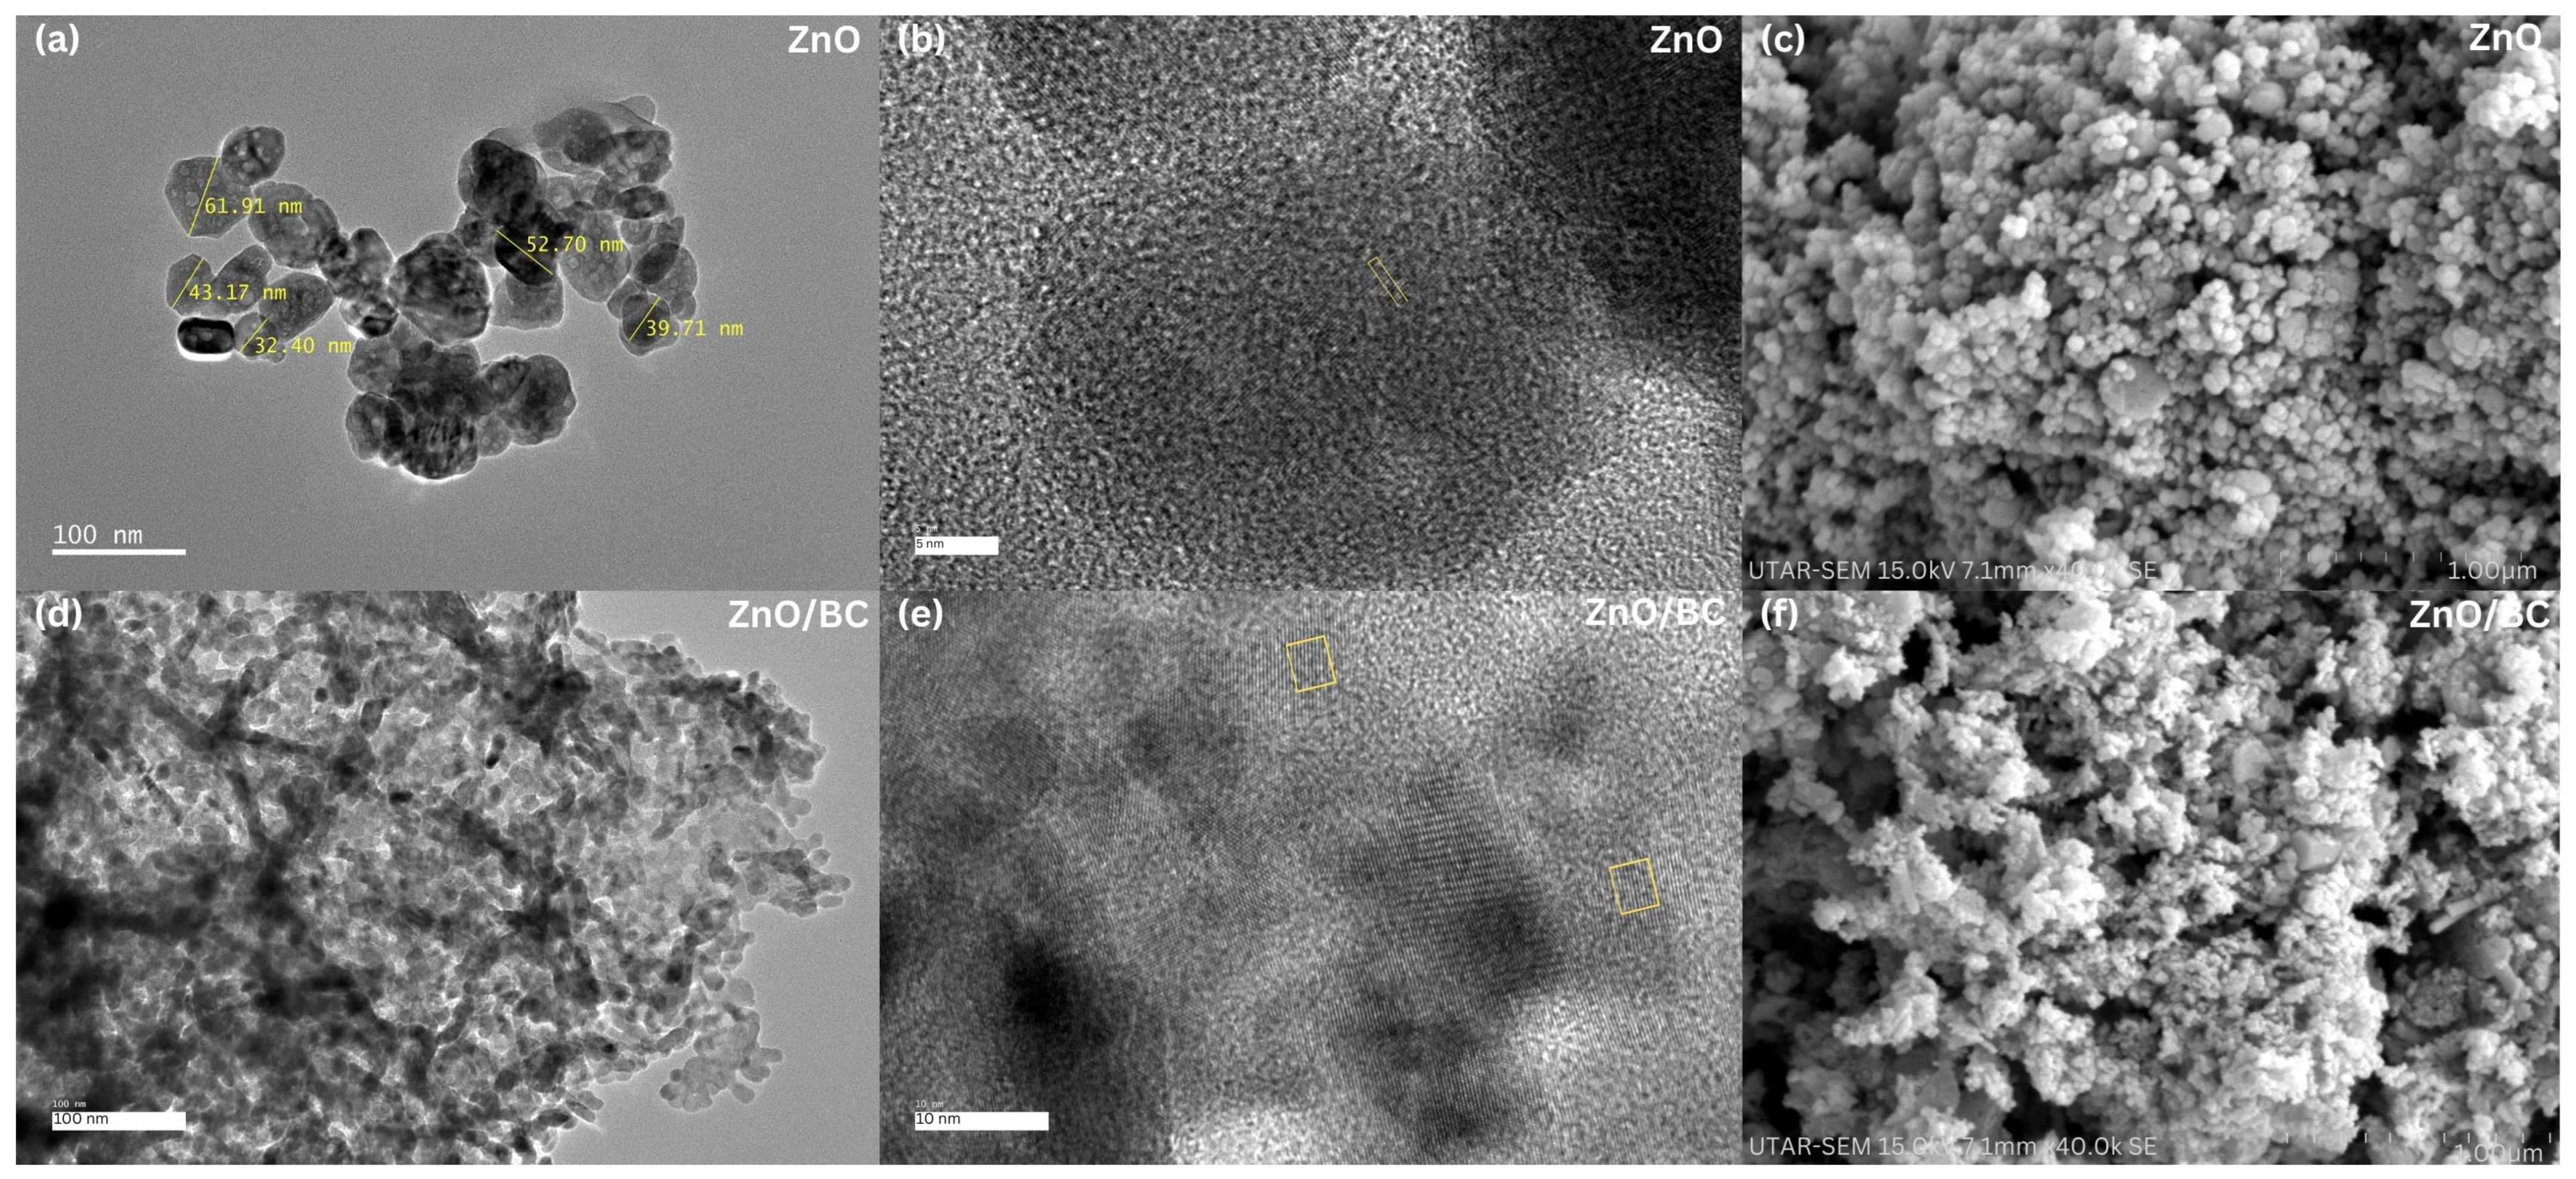
Figure 1. (a) TEM image, (b) HRTEM image, and (c) SEM image of ZnO; (d) TEM image and (e) HRTEM image, and (f) SEM image of ZnO/BC. The yellow boxes highlight the selected lattice regions used for lattice spacing (d-spacing) analysis.
Catalysts 16 00363 g001
Figure 2. Survey scan XPS spectra of ZnO and ZnO/BC.
Catalysts 16 00363 g002
Figure 3. High-resolution scan XPS spectra of (a) Zn 2p, (b) O 1s, and (c) C 1s for ZnO; (d) Zn 2p, (e) O 1s, and (f) C 1s for ZnO/BC.
Catalysts 16 00363 g003
Figure 4. (a) FTIR spectra and (b) XRD spectra for ZnO and ZnO/BC.
Catalysts 16 00363 g004
Figure 5. (a) Actual and predicted values by the RSM model, (b) residuals versus predicted plot, (c) normal probability plot of residuals, and (d) perturbation plot.
Catalysts 16 00363 g005
Figure 6. Three-dimensional response surface plot of malachite green degradation efficiency: (a) effect of initial malachite green concentration and catalyst loading at 15 min, (b) effect of initial malachite green concentration and ultrasonic irradiation time at a catalyst loading of 0.6 g/L, and (c) effect of catalyst loading and ultrasonic irradiation time at an initial malachite green concentration of 150 mg/L.
Catalysts 16 00363 g006
Figure 7. Contour plots of desirability under optimised conditions: (a) effect of initial malachite green concentration and catalyst loading, (b) effect of initial malachite green concentration and ultrasonic irradiation time, and (c) effect of catalyst loading and ultrasonic irradiation time.
Catalysts 16 00363 g007
Figure 8. COD and TOC analysis of the malachite green degradation by ZnO/BC (initial dye concentration: 200 mg/L, catalyst loading: 0.4 g/L).
Catalysts 16 00363 g008
Figure 9. Schematic illustration of the synthesis of ZnO/biochar composite derived from phytoremediated duckweed.
Catalysts 16 00363 g009
Table 1. Experimental design of the CCD model.
Standard OrderPoint TypeCoded Independent Variable LevelsDye Removal Efficiency (%)
Dye Concentration, x 1 (mg/L) Catalyst Loading,
x 2 (g/L)
Time,
x 3 (min)
Experimental ValuePredicted Value
1Fact100 (−1)0.4 (−1)10 (−1)75.4175.38
2Fact200 (+1)0.4 (−1)10 (−1)43.1742.49
3Fact100 (−1)0.8 (+1)10 (−1)77.3277.56
4Fact200 (+1)0.8 (+1)10 (−1)49.8449.74
5Fact100 (−1)0.4 (−1)20 (+1)91.8391.62
6Fact200 (+1)0.4 (−1)20 (+1)50.3149.76
7Fact100 (−1)0.8 (+1)20 (+1)98.899.17
8Fact200 (+1)0.8 (+1)20 (+1)62.6562.37
9Axial65.91 (−α)0.6 (0)15 (0)95.7195.34
10Axial234.09 (+α)0.6 (0)15 (0)35.9236.73
11Axial150 (0)0.26 (−α)15 (0)63.5264.24
12Axial150 (0)0.94 (+α)15 (0)76.9776.68
13Axial150 (0)0.6 (0)6.59 (−α)57.4657.65
14Axial150 (0)0.6 (0)23.41 (+α)81.6881.93
15Center150 (0)0.6 (0)15 (0)72.6172.90
16Center150 (0)0.6 (0)15 (0)75.0572.90
17Center150 (0)0.6 (0)15 (0)71.6472.90
18Center150 (0)0.6 (0)15 (0)75.1272.90
19Center150 (0)0.6 (0)15 (0)70.6272.90
20Center150 (0)0.6 (0)15 (0)72.4472.90
Table 2. ANOVA for the quadratic model of malachite green sonocatalytic degradation using ZnO/BC.
FactorsSum of SquareDegree of FreedomSquare AverageF-ValueProbability, p
Quadratic model5211.679.00579.07301.09<0.0001Significant
x 1 4145.721.004145.722155.55<0.0001
x 2 186.811.00186.8197.13<0.0001
x 3 711.631.00711.63370.01<0.0001
x 1 x 2 12.831.0012.836.670.0273
x 1 x 3 40.281.0040.2820.940.0010
x 2 x 3 14.391.0014.397.480.0210
x 1 2 84.941.0084.9444.16<0.0001
x 2 2 10.701.0010.705.560.0401
x 3 2 17.441.0017.449.070.0131
Residual19.2310.001.92
Lack of Fit2.605.000.520.160.9686Insignificant
Pure Error16.635.003.33
Corrected total5230.9019.00
R2 = 0.9963; adequate precision = 62.68
Table 3. Actual values of the dependent variables and their respective coded levels.
VariablesFactorsUnitActual Values for the Coded Levels
−α−10+1
Numerical
Dye concentration x 1 mg/L65.91100150200234.09
Catalyst loading x 2 g/L0.260.40.60.80.94
Time x 3 min6.5910152023.41
Disclaimer/Publisher’s Note: The statements, opinions and data contained in all publications are solely those of the individual author(s) and contributor(s) and not of MDPI and/or the editor(s). MDPI and/or the editor(s) disclaim responsibility for any injury to people or property resulting from any ideas, methods, instructions or products referred to in the content.