Abstract
Plant enzymes, such as those from castor bean (Ricinus communis L.), have been studied as biocatalysts for various industrial applications. In this study, a powdered enzyme extract was used to analyze the potential of lipases present in three castor bean varieties (LV1–LV3). Their hydrolytic activity was evaluated against olive and castor oil substrates (refined and non-refined) at pH 4.5 and 7.0. The results showed that LV2 had higher catalytic activity, managing to hydrolyze more than 98% of the oils in only 4.5 h of reaction. Additionally, diverse computational tools were employed to assess the behavior of OBL1 lipase. By molecular docking analysis, it was found that the binding of ricinoleic acid triacylglycerols to the catalytic site was favored at an acidic pH of 4.5 due to enhanced hydrogen bond formation. In contrast, at pH 7.0, hydrophobic interactions predominated. Molecular dynamics analyses of OBL1 showed that the enzyme–substrate complex is stable over time, providing a robust molecular explanation for the high catalytic efficiency observed in the experimental assays. This research stands out as one of the first to combine lab experiments with computational modeling to study castor bean lipases. Our integrated approach provides fresh insights into the enzyme’s versatile catalytic capabilities, underscoring its potential as a powerful and reliable tool for industrial biotechnology.
1. Introduction
Growing concern about mitigating the effects of global warming and the overexploitation of arable land and fossil resources has encouraged the search for a more sustainable global model and the development of renewable energy sources capable of reducing greenhouse gas emissions [1]. Biofuels represent a valuable alternative for generating cleaner and more sustainable energy, particularly when considering non-edible crops with bioenergy potential. For example, Ricinus communis L. is a non-edible oilseed plant that is highly productive and adaptable to marginal soils and does not compete with food production. In this context, the process of producing biodiesel from renewable raw materials, such as the castor bean plant, can minimize the use of agricultural land intended for food production. Additionally, cultivating the castor bean plant can promote rural development and more environmentally friendly agriculture [2].
Castor seeds are valued for their high ricin oil content, but in recent years, they have also become notable for their enzyme mass, which is highly relevant to industry [3]. Lipases (acylglycerol hydrolases, EC 3.1.1.3) are enzymes that primarily function to mobilize lipid reserves during germination [4]. Lipases are enzymes that can be obtained from various biological sources, including bacteria, fungi, plants, and animal tissues. However, plant lipases stand out for their low cost, robustness, and high operational capacity [5]. Another notable feature of castor lipases is their ability to remain catalytically active even in dormant seeds, allowing them to be used directly from dry, ground seeds without prior activation [6]. For this reason, castor lipases are a potential biocatalytic tool for obtaining free fatty acids (FFAs) and for producing biodiesel through hydroesterification in a more straightforward, economical, and eco-friendly manner. Lipases extracted from dormant Ricinus communis L. seeds have demonstrated high catalytic performance in hydrolytic processes in various vegetable oils. For example, it has been reported that castor seed lipases achieved a hydrolytic conversion of more than 80% within 3 h of incubation at pH 4.5 and 37 °C, using different vegetable oils [7]. In another study, the hydrolysis of unrefined castor oil, mediated by castor lipases, achieved yields of over 97% under mild reaction conditions of 4 h at 25 °C and pH 4.5 [8]. Although bacterial lipases, such as those from Candida antarctica or Thermomyces lanuginosus, also exhibit high hydrolytic activity and some stability, their extraction, purification, and immobilization processes are costly, exhaustive, and complex. For example, the hydroesterification of Jatropha oil, carried out by T. lanuginosus lipase, achieved yields between 81% and 86% in significantly longer times compared to vegetable lipases, which required 48 h of reaction [9].
At least two lipases related to lipid storage have been identified in R. communis L., an acidic lipase and an alkaline lipase. The acidic lipase is found in dry seeds and exhibits high activity during the first few days after germination. This enzyme is associated with the oil bodies of the endosperm, shows optimal activity at around pH 4.5, and hydrolyzes triacylglycerols (TAGs). It has been named OBL1 (Oil Body Lipase 1, UniProt Q5VKJ7). It contains key functional domains such as the catalytic GXSXG motif and the Ser–His–Asp catalytic triad, characteristic of the α/β-hydrolase family [10,11]. In contrast, the alkaline lipase increases in activity between days 3 and 5 of germination. It is mainly localized in glyoxysomes, where it participates in fatty acid oxidation and the conversion of stored lipids, suggesting a coordinated role in lipid mobilization and β-oxidation [10]. More recently, Li et al. [12], identified a new lipase from germinated castor seeds, termed RcLipase, which was heterologously expressed in Pichia pastoris. This enzyme showed activity at alkaline pH (~8.0) and 40 °C, with tolerance to organic solvents such as chloroform and toluene, and was classified within the class III lipase superfamily. In addition, R. communis L. possesses a set of genes related to TAG biosynthesis, including glycerol-3-phosphate acyltransferases, lysophosphatidic acid diacylglycerol acyltransferases (DGATs), which, although not degradative lipases, form part of its lipid metabolic network [13]. Similar storage lipases have also been reported in Arabidopsis thaliana and Elaeis guineensis, highlighting conserved functions across plant species in lipid mobilization during seed germination [4,14].
Despite the vast literature on experimental enzyme activity, most studies lack a structural and functional approach to lipases at the molecular level. This situation has limited their optimization in aspects such as stability, catalytic activity, or even semi-rational or rational enzyme design. With the advancement of “in silico” tools, it becomes imperative to explore the 3D architecture of castor lipases, their functional domains, and their interactions with oily substrates, to develop viable alternatives that compete with microbial lipases currently on the market.
Few studies have used advanced computational tools to study plant lipases. In one of them, they modeled the 3D structure of seven lipases: Hordeum vulgare var. distichum, Oryza sativa subsp. indica, O. sativa subsp. Japonica, Sorghum bicolor, Triticum aestivum, and Brassica napus. They found that most lipases have a palpebral domain and that its movement precedes the interfacial activation of these enzymes. Additionally, they reported that the ability to present different conformations within the catalytic cavity favors the formation of products [15].
In another analysis, the three-dimensional structure of Rhizopus oryzae ZAC3 (RoZAC3) lipase was predicted and validated. Its interactions with substrates such as tributyrin, tripalmitin, and triolein were evaluated, as well as the feasibility of biodiesel production through lipase immobilization. Lipases from Rhizomucor miehei and R. oryzae were compared by docking and molecular dynamics simulations to identify critical regions of the active site. Finally, they verified the viability of the RoZAC3 lipase in producing 80% fatty acid methyl esters (FAMEs) using olive oil as a substrate under an enzyme immobilization dose of 50 mg g−1 for 18 h at 40 °C [16].
Another example is the structural and functional analysis of the LIP1 lipase from Elaeis guineensis. In this work, the authors modeled the three-dimensional structure of the enzyme using AlphaFold 2. They identified novel and unique insertions of EgLIP1 in several helices and sheets, including a PF residue insertion that was observed to influence the orientation of the eyelid domain present in the lipase’s active site. Molecular dynamics and docking analysis revealed that residues S308 and T223 form key bonds with 1-palmitoylglycerol, facilitating the hydrolysis process [17].
Unlike previous studies, this work combined the experimental evaluation of castor seed powder extracts obtained from three wild varieties of R. communis L. with structural analysis (AlphaFold modeling, molecular dynamics simulations, and docking), and functional exploration (PPI, co-expression) to identify the conditions that will enable the superior catalytic performance of lipases and the understanding of the molecular basis of their efficiency oriented towards biocatalysis for obtaining products of high industrial value, including biodiesel.
2. Results
2.1. Morphological Characterization of Castor Bean Varieties
From the seeds collected, three distinct wild accessions of Ricinus communis L. were identified based on morphological characteristics, including stem height, leaf coloration, and cluster arrangement. These phenotypic variations enabled a functional classification of the plant seed varieties (V1, V2, and V3) (Supplementary Figures S1–S3), which were subsequently used to evaluate differences in the hydrolytic activity of endosperm lipases.
2.2. Comparative Evaluation of Lipase Activity in Three Varieties
The enzymatic activity of three varieties of Ricinus communis L. was evaluated using three oil substrates: commercial olive oil (CO), refined castor oil (RC), and non-refined castor oil (NRC). The results showed that the lipase from the seeds of castor plant variety 2 (LV2) had significantly higher activity in all substrates, reaching 992.2 ± 17 U g−1 with RC, 827.1 ± 13 U g−1 with CO, and 811.3 ± 13 U g−1 with NRC (Figure 1).
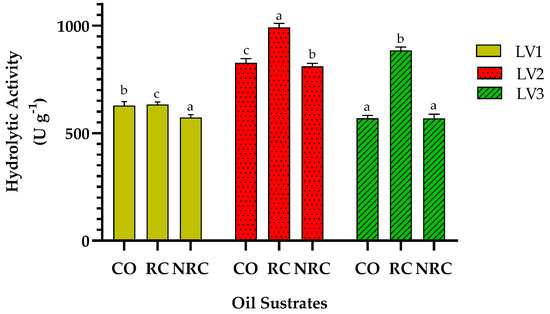
Figure 1.
Enzyme activity units per gram of lipase extract (U g−1) under standard conditions of temperature (37 °C) and pH (7.0). LV1–LV3: castor bean lipase variety 1–3. Oil substrates: commercial olive (CO); refined castor (RC); non-refined castor (NRC). Error bars represent the standard deviations of the three replicates. Different letters above the bars indicate statistically significant differences among variants within the same substrate according to Tukey’s multiple comparisons test (p < 0.05). Identical letters denote no significant difference.
A general trend was observed, in which hydrolysis was most efficient with refined castor oil, followed by olive oil, and was slightly lower with non-refined castor oil. This difference suggests that the type of oil or degree of purification influences the catalytic performance of plant lipases. The comparison between the lipases obtained from the three castor varieties revealed differential behavior: LV2 showed greater affinity and hydrolytic efficiency in all the oils evaluated, indicating that it could have more active lipase isoforms or a higher concentration of functional enzymes. In Figure 1, lipases from the seeds of castor plant varieties 1 and 3 (LV1 and LV3) showed activities in the range of 811–875 U g−1, with no significant differences between them. However, they were slightly lower than those of LV2. This highlights the importance of considering intraspecific genetic variability in selecting plant biocatalysts for industrial applications.
Additionally, the coefficient of variation between replicates indicates low data dispersion and high experimental reproducibility. This behavior suggests that the castor enzymatic extract (CEE) can be used directly as solid powder formulations in biotechnological processes without the need for prior purification or immobilization, which represents a substantial economic advantage. LV2 demonstrates itself to be a promising candidate for converting vegetable oils into free fatty acids or biodiesel precursors, due to its high specific activity and performance with the different vegetable oils evaluated.
Kinetic Behavior in a Stirred Tank
The kinetic assays of LV1–LV3 were analyzed in a stirred tank reactor under controlled conditions (25 °C and pH 4.5), simulating an enzymatic hydrolysis process without the use of an emulsifier. The conversion of triacylglycerides to FFAs was measured by titration over time, with samples taken every 30 min.
In Figure 2, LV1–LV3 exhibited high hydrolytic efficiency toward CO, reaching over 98% hydrolysis within 4 h. In the first 2 h, conversion rates for CO ranged from 81 to 91%, indicating a high catalytic affinity of CEE for this oleaginous substrate. In RC, the initial hydrolysis rate was slower during the first 3 h, but the final conversion exceeded 90%, with LV3 showing slightly higher activity. NRC exhibited the slowest lipase hydrolysis kinetics, particularly within the first 2 h; however, LV2 achieved a faster conversion compared to LV1 and LV3, reaching over 95% conversion at 4.5 h. The above indicates that substrate processing mainly influences the hydrolysis rate rather than the overall yield. These findings demonstrate the potential of Ricinus communis L. lipases for application in sustainable processes for obtaining FFAs, a preliminary step in biodiesel production by hydroesterification, particularly under mild conditions and short reaction times.
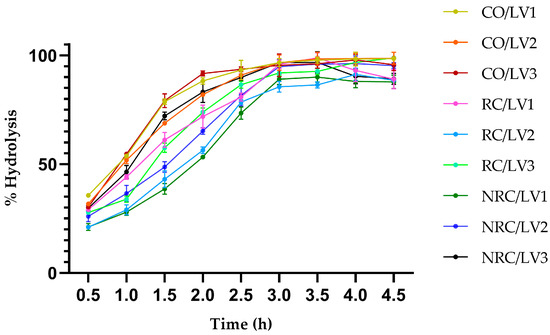
Figure 2.
Hydrolysis percentage on three vegetable oils. CO: commercial olive; RC: refined castor; NRC: non-refined castor. LV1–LV3: castor bean lipase variety 1–3. Error bars represent the standard deviations of three replicates. Statistical analysis of variance (ANOVA) revealed no significant differences between RC and NRC at the end of the assay.
2.3. Structural Characterization and Model Validation
Accurate structural information is essential for understanding the catalytic properties and potential biotechnological applications of OBL1. To establish a reliable basis for subsequent analyses, a model was generated and validated. Given the lack of an experimentally determined structure for OBL1 (or at least a publicly available X-ray crystallographic structure in the Protein Data Bank, PDB), comparative models based on homologous proteins, 3TGL (a) and 4TGL (b), are presented (Figure 3).

Figure 3.
Active site: (a) structure 3TGL (PDB: HYDROLASE CARBOXYLIC ESTERASE): closed conformation for lid covering active site. (b) Structure 4TGL (PDB: HYDROLASE CARBOXYLIC ESTERASE): open conformation with bound inhibitor, diethyl p-nitrophenyl phosphate.
2.4. Functional Analysis Through Protein–Protein Interaction and Gene Co-Expression
Protein–protein interaction (PPI) analysis via the Search Tool for the Retrieval of Interacting Genes/Proteins (STRING) reveals that OBL1 is connected to multiple nodes, suggesting that it is part of a subgroup of proteins in R. communis L. with which it shares functional relationships (Figure 4). However, there may not necessarily be direct physical interactions among them. The nodes OLE1 (fatty acid desaturase) and PDAT1-1 (diacylglycerol acyltransferase) are also proteins related to the lipid metabolism, TAG assembly, and lipid storage. Figure 4 also shows the OBL1 medium-priority associations with all Ricinus communis Orthologous/Model sequences (RCOMs), which are likely regulatory or enzymatic proteins that remain uncharacterized and could help explore new lipid metabolic pathways in this species. They are co-expressed with OBL1, while others only display notable homology among themselves, which could be informative regarding genome organization and evolution in R. communis L.
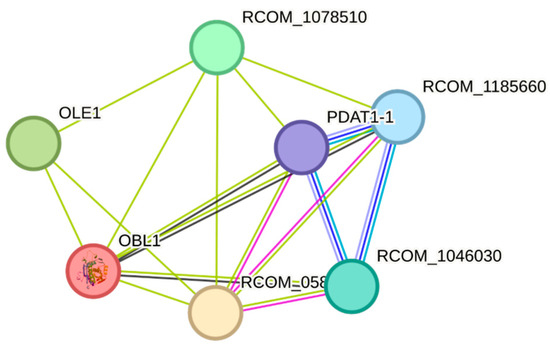
Figure 4.
Ricinus communis L. OBL1 map of protein–protein interactions.
According to the protein interaction analysis in Figure 4, OBL1 does not behave as an outlier but is integrated into a dense and cohesive functional module. The obtained values, an average node degree of 4.86 and an average local clustering coefficient of 0.867, indicate that the associated proteins are not isolated, but instead form a highly interconnected system, characteristic of a protein complex, a metabolic pathway, or a standard cellular process. In this context, OBL1 appears as a central component within the network, rather than a peripheral or independent node.
The predicted physicochemical properties included a molecular weight of 59.86 kDa, a theoretical isoelectric point (pI) of 6.70, an instability index of 32.31 (stable protein), an aliphatic index of 83.23 (high thermostability), and a negative Grand Average of Hydropathy (GRAVY) value (−0.112), indicating a predominantly hydrophilic nature.
2.5. Refinement of the Structural Model of Lipase OBL1
The structural validation scores in Saves6.1 were 94.3% for ERRAT and 64.2% for Verify 3D. In the first case, the result satisfactorily meets the suggested minimum score of 80%. In contrast, in the second case, it does not, suggesting that the intramolecular non-bonding interactions were modeled adequately. However, the correspondence between the secondary structure assigned to each residue and that expected given its physicochemical properties is not optimal.
The AlphaFold model showed good reliability except for two regions: one in the last six residues of the terminal carboxyl, where there is a disordered and extended structure that does not fit with the overall folding of the protein, and a second region in the N-terminal consisting mainly of helices joined by loops. Regarding the Ramachandran plot, 99.8% of the residues were in favored zones, and only one was found in unfavorable regions (0.2%). Therefore, the modeled structure has adequate stereochemistry. Based on these results, it was decided to use this structural prediction, which was refined using the REMD method.
The first 5 ns of simulation were removed from the trajectories resulting from the 10 parallel Replica Exchange Molecular Dynamics (REMD) simulations before they were concatenated (Figure 5d). A Principal component analysis (PCA) was performed on the resulting trajectory. The graph of eigenvalues against eigenvectors (components) shows that linearity is lost in component 3, thus defining the “weak point” zone, which delimits the number of components to which a set of random data can be reduced. These three components are sufficient to describe the conformational dynamics of the protein during the simulation with the least possible loss of information. The trajectories corresponding to these principal components were extracted using the Groningen Machine for Chemical Simulations (GROMACS) trjconv module and used for a clustering process with the ttclust software. In this process, all trajectories were compared and organized into groups based on their structural similarity. The objective was to reduce the selected trajectories to a few representative structures. Additionally, three groups were generated, with Group 1 being the most populated in terms of frames. Comparison with the original model shows that the region of 6 residues at the carboxyl terminus remained extended during the simulation but compacted together with the rest of the protein, suggesting that the structure improves its folding (Figure 5b,c).
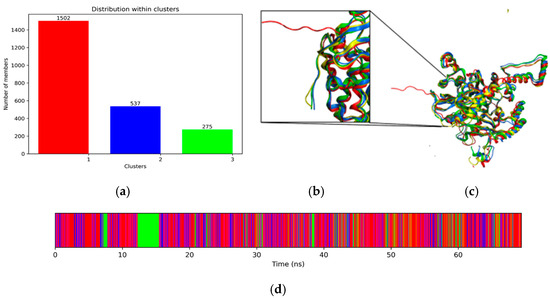
Figure 5.
Clustering of molecular dynamics trajectories. (a) Population in frames for each group, (b) close-up of the carboxyl terminal region, (c) structural superposition of the three representative structures for each cluster (corresponding to the colors in (a) and the original model in yellow), and (d) distribution of clusters over the simulation time.
For the rest of the computational analysis, the representative structure of the most populated cluster was used, based on Boltzmann’s criterion, which states that highly populated conformational regions correspond to conformational energy minima (cluster 1) (Figure 5a).
2.6. Protein-Solution Molecular Dynamics
Figure 5 shows the normalized PCA results for the simulations with the protonation states adjusted to the two pH values. Similar behavior is observed in both dynamics; in the graphs, the linearity of the eigenvector vs. eigenvalue response is lost in principal component number 3. These three components account for 53.36% of the total variance in the PCA of the simulation at pH 4.5 and 63.87% at pH 7. Figure 6a,b show the projection (eigenvalue vs. time) of the two simulations, where there is a high similarity in behavior (convergence between the two simulations). In both simulations, the temporal projection of the principal component (PC1) does not reach a stationary state within the analyzed timeframe. This indicates that the protein continues to undergo structural changes, suggesting that the simulation time was not sufficient to achieve a global stationary state. Nevertheless, this timescale is adequate to capture relevant structural differences, particularly in the global conformation of the protein.
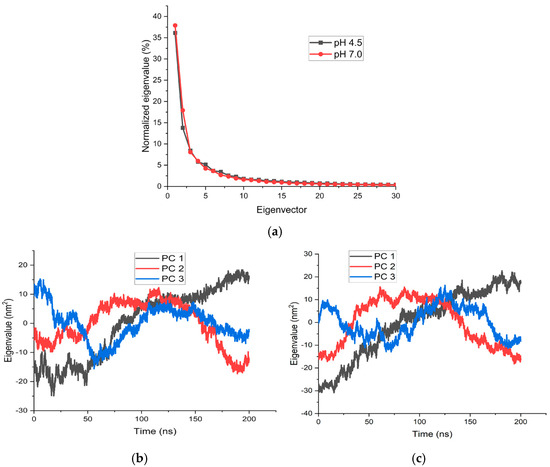
Figure 6.
Normalized eigenvalue distribution from PCA of REMD trajectories at pH 4.5 (black) and pH 7.0 (red). The first three principal components capture most of the conformational variance, with similar profiles under both pH conditions. (a) Analysis of the first 3 components, (b) first-dimension projection of the 3 main components simulated at pH 4.5, and (c) first-dimension projection of the 3 main components simulated at pH 7.0.
Figure 7a shows the behavior and comparison of the radius of gyration in both simulations, with results indicating slightly more compact structures at pH 4.5. Figure 7b,c illustrate the behavior of the secondary structure, showing a progressive decrease in helices during the simulation. At pH 4.5, the dynamics indicate that this decrease occurs more rapidly; however, 15% more helical structures are retained at the end of the dynamics.
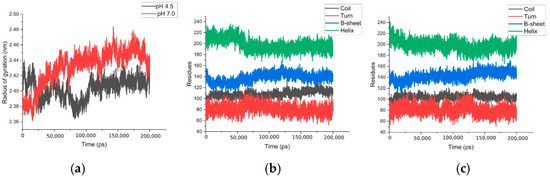
Figure 7.
Calculation of properties: (a) radius of gyration of both simulations, (b) secondary structures, simulation at pH 4.5, and (c) calculation of secondary structure, simulation at pH 7.
The projection of the conformational free energy onto the first two components of the PCA is shown in Figure 8. In the simulations, the protein explores a vast conformational space, but with a well-defined energy minimum. Figure 8b shows the structural superposition of the minimum-energy trajectories obtained from the free energy landscape analysis (Figure 8e,f), considering the first two principal components. Both structures correspond to the most statistically representative conformations in their respective simulations (energy minima). The RMSD value of 5.38 Å was obtained by aligning the backbone atoms of both conformations using GROMACS. This result reflects the global structural difference between the representative conformations at acidic and neutral pH, indicating marked structural differences, especially in the catalytic triad region (Ser340-Asp404-His497), which is more exposed to the solvent at pH 4.5. The 465–497 region was identified as having the most significant structural variation between the two simulations (Figure 8c,d). At neutral pH, residues 465–470 form flexible loops, while at pH 4.5, they retain α-helix structures. On the other hand, residues 492–497 retain α-helices at pH 7.0 but transform into loops at acidic pH. This transition appears to correlate with the greater exposure of the catalytic triad under acidic conditions. The isosurface of the minimum energy structure was calculated with Visual Molecular Dynamics (VMD), and structural properties were analyzed with Molecular Operating Environment (MOE) v2014. In both cases, a more compact folding is observed at pH 4.5, characterized by a smaller radius of gyration and solvent-exposed areas (Table 1). In the cavity that provides access to the catalytic triad, notable differences are observed in the distribution of hydrophobic and charged residues (Supplementary Figure S4). At acidic pH, positively charged and polar residues predominate, whereas at neutral pH, more negatively charged residues are exposed.
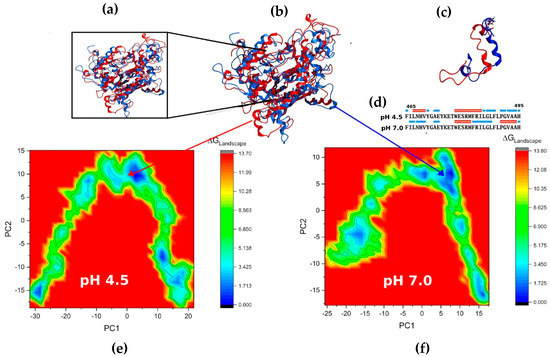
Figure 8.
Superposition of energy minima. (a) Close-up of the active site showing the catalytic triad atoms highlighted as blue and red spheres, following our color scheme. (b) Overall view: blue corresponds to the simulation at pH 4.5, while red corresponds to the simulation at pH 7.0. (c) Close-up of the region with the highest structural variability near the catalytic triad (residues 465–497). (d) Secondary structures correspond to this region. (e,f) Free energy landscape analysis with projections along PC1 and PC2 for simulations.

Table 1.
Properties calculated with minimum energy trajectories using MOE V2014 software. Surface descriptors correspond to representative minimum-energy conformations; values are shown as direct outputs of the software and are intended for relative comparison.
2.7. Molecular Docking on the Active Site
Table 2 presents the scores obtained from the molecular docking of six triglycerides with refined structures at both pH values. The results show higher affinities for the structures at pH 4.5, which is consistent with reports indicating optimal activity in this range. Although the scores at neutral pH were lower, they are still adequate.
Table 2.
Results and comparison of scores from Genetic Optimization for Ligand Docking (GOLD) assembly docking with the six triacylglycerols of the most abundant fatty acids in castor oil.
Figure 9a,b illustrates the poses resulting from docking with tri-ricinoleic acid at pH 4.5 and 7.0, respectively. In both simulations, the triglyceride is positioned with the ester bond oriented toward His497. At pH 4.5, more residue–ligand interactions were identified, including hydrogen bonds with His80 and C12-OH, as well as electrostatic contacts. At pH 7.0, the triglyceride has a more restricted arrangement toward the catalytic cavity. Fewer residues are observed interacting, and there is less H-bond formation, suggesting a reduction in the stability of the complex. A pH of 4.5 allows for greater structural flexibility, as a high net charge favors a broader network of electrostatic interactions. A pH of 7.0 decreases the charge and Z potential, limiting coupling diversity, although the orientation toward the catalytic histidine is still preserved.

Figure 9.
FragMaps calculated with the VMD volmap tool for the interaction of triacylglycerols with OBL1 in the final trajectories of free-ligand simulations: (a) ricinoleic acid triacylglycerol (tri-ricinolein) at pH 4.5, (b) tri-ricinolein at pH 7.0, (c) stearic acid triacylglycerol (tri-stearin) at pH 4.5, and (d) tri-stearin at pH 7.0.
Additional FragMaps calculations were performed using tri-stearin (Figure 9c,d) to compare its behavior with that of the tri-ricinolein substrate. In this case, the docking poses revealed a predominantly hydrophobic packing within the active site. The acyl chains were oriented toward His497. Unlike tri-ricinolein, no additional polar interactions were detected, and the interaction pattern remained essentially unchanged between both pHs. These results indicate that the pH conditions do not determine tri-stearin binding. Still, it is primarily stabilized by van der Waals and hydrophobic forces, resulting in a uniform and stable accommodation of the stearin triglyceride within the catalytic cavity.
2.8. Dynamics with Free Ligand
The results of simulations with free triglycerides in solvent are shown in Supplementary Figures S5 and S6. There are significant differences in the behavior of lipase OBL1 depending on the type of triglyceride and the pH of the simulation. These simulations were fundamental for evaluating the spontaneous recognition of the active site by the most abundant substrates in castor oil, specifically tri-stearin and tri-ricinolein. At pH 7.0, an oligomer consisting of four tri-stearin molecules (stearic acid triglyceride) spontaneously positions itself within the catalytic cavity. The interaction is predominantly driven by hydrophobic contacts, which stabilize the insertion of the oligomer. The extended, linear shape of the saturated acyl facilitates packing within the catalytic channel without inducing significant structural perturbations in the protein (Supplementary Figure S5).
Under acidic conditions (pH 4.5), a different behavior was observed; for example, three tri-stearin molecules coupled stably in a region adjacent to the catalytic cavity, which in this simulation showed greater exposure to the solvent. The location of these interactions in a more accessible region suggests that acidification of the medium promotes the opening or partial flexibility of this area, favoring the approach of the triglyceride (Supplementary Figure S6).
In simulations with tri-ricinolein, direct binding to the catalytic site was observed at both pH 4.5 and 7.0. In both cases, the triglyceride behaved as a monomer, differing from the oligomeric behavior observed with tri-stearin. At neutral pH, the tri-ricinolein molecule was positioned in the upper right frontal region of the active site. Hydrophobic contacts and an H-bond between the hydroxyl group of ricinoleic acid and residues near the cavity entrance stabilized this interaction. On the other hand, at pH 4.5, two coupled monomeric tri-ricinoleins were identified: one located in the left corner of the cavity and the other right in the center, in direct contact with the catalytic triad Ser340–Asp404–His497. The latter interaction showed greater spatial proximity to the functional residues, accompanied by two additional hydrogen bonds: one with histidine 80 and another with tryptophan 245, indicating a stronger and more specific affinity at acidic pH. This finding is consistent with the targeted coupling results, which also showed greater affinity under acidic conditions.
3. Discussion
Enzymes play a crucial role in virtually all biological processes, in several orders of magnitude and on biologically acceptable time scales. It is, therefore, essential to understand this catalytic power, which, in many cases, needs to be discovered or better understood. The in-depth study of an enzyme enables us to uncover some of its mysteries, given the overwhelming complexity of enzymatic reactions. Conformational changes are essential for enzymes to carry out all their catalytic activity, and for these changes to occur, the appropriate environment must exist [18]. Knowing the physicochemical properties of an enzyme, its conformational structures, and interactions with other proteins allows not only the elucidation of metabolic pathways but also the possibility of modifying or influencing the environment in which they develop according to the needs of the problem to be solved [19].
This study explored both the hydrolytic activity of lipase extracts from Ricinus communis L. and the detailed computational characterization of a putative acid lipase (OBL1), integrating experimental and “in silico” evidence for a comprehensive interpretation.
3.1. Experimental Hydrolysis Conditions
It is well known that the catalytic activity of any enzyme, and particularly lipases, can be significantly modified depending on reaction conditions such as pH, temperature, incubation time, solvent, and substrate type, as well as the purity and concentration of the enzyme extract [20,21]. Castor bean seeds contain two types of lipases: acid and alkaline. The former is active in a latent state during the first two days of germination. The latter (alkaline lipase) is active during more advanced germination (ninth day). The acid lipase of R. communis L. has an optimal pH for activity between 4.3 and 5.0, while the alkaline lipase has an optimal pH between 9.0 and 9.5 [22,23]. The higher enzymatic activity at an acidic pH makes castor bean lipase essential for the hydrolysis of unrefined vegetable oils [24,25]. For this reason, the tests were carried out at a pH of 4.5. Additionally, to minimize energy consumption during the process, the analyses were conducted at room temperature (25 ± 1 °C). The use of room temperature is an excellent advantage for the enzymatic procedure, as the traditional triglyceride hydrolysis process requires temperatures of ≥250 °C and pressures of ~4.82 MPa to achieve high conversion rates (98%), which makes the process consume large amounts of energy. To reduce these energy requirements, enzymatic reactions can be carried out under milder temperature conditions and even without the use of solvents [26]. It has been reported that the ideal activity temperature of acid lipase is between 37 °C and 50 °C [7]. However, the hydrolysis percentages in this study were above 95% for all RO and RC substrates, as well as for NRC, even under non-optimal temperature conditions (25 °C). This result is particularly relevant because it allows, first, the elimination of energy consumption for heating and, second, and no less important, the omission of previous oil refining stages, both of which are critical for industrial applications. The hydrolysis results obtained in this work under standard conditions were superior to those previously reported by several authors. For example, in the hydrolysis of soybean oil catalyzed by lipase from castor beans, it was reported to have a maximum hydrolytic activity of 600.2 ± 25.5 U g−1 at 37 °C and 300 rpm [23]. Another study utilized a solid preparation of castor bean lipase for the hydrolysis of high-acidity oils from macaw pulp and kernel, as well as microalgae oils from Dunaliella salina, Nannochloropsis gaditana, and Chlorella minutissima. They obtained maximum values of 181.82 Ug−1 at pH 4.5 at 35 °C and determined that the rate of hydrolysis was influenced by substrate type, fatty acid profile, and oil concentration [27]. These results coincide with our experimental observation regarding CO, RC, and NRC. Finally, the three castor seed lipase variants, LV1–LV3, showed high hydrolytic capacity on the three types of oils (CO, RC, and NRC), positioning castor seed lipases as promising, robust, and sustainable tools for industrial biocatalysis.
3.2. In Silico Analysis: Structural Stability and Conformational Dynamics
The protein sequence of R. communis L. lipase (OBL1 UniProt ID: Q5VKJ7) contains a region corresponding to α/β-hydrolases. This protein belongs to the class 3 lipase family and contains a highly conserved catalytic triad composed of residues Ser340, Asp404, and His497, along with a GXSXG consensus motif. Unlike most serine proteases, the active site is buried inside the structure. A “lid” or “flap” covers the active site, making it inaccessible to solvent and substrates. The lid opens during the process of interfacial activation, allowing the lipid substrate access to the active site [28]. This protein architecture has been identified in other plant lipases, such as Arabidopsis thaliana (AtLIP1), O. sativa L. japonica, Brassica rapa, and Zea mays, among others, which also contain an α/β-hydrolase domain with a conformationally flexible lid to regulate substrate entry into the active site [29]. However, our results highlight a particular advantage of the OBL1 model, where the castor lipase lid covers the active site stably under neutral conditions (pH 7). However, at pH 4.5, its conformation allows for a higher exposure of the catalytic triad, suggesting an activation mechanism influenced by the acidic pH. In other plant models, such as A. thaliana, it has been described that the catalytically active site, serine S166, is not involved in the binding site; this result indicates that the cap domain covering the active site is not accessible to the solvent, which favors basal activity but reduces specificity [30]. In contrast, the more compact architecture found for R. communis L. OBL1 at pH 4.5 suggests finer regulation by interfacial activation, which may confer higher specificity towards triacylglycerols, such as tri-ricinolein.
According to the physicochemical properties determined in this study for R. communis L. lipase, its theoretical isoelectric point indicates that at pH 6.7, the protein could precipitate. The instability index predicts the protein’s stability, and the GRAVY score suggests it is fundamentally hydrophilic. The aliphatic index is acceptable and can be a positive factor for increasing protein thermostability. PPI networks were used to identify the complex mechanisms and gain basic knowledge of molecular pathways involved in the lipase activity in R. communis L. One of the most closely annotated interacting proteins was a serine/threonine-protein kinase, which also participates in triglyceride catabolism. It also showed a closely annotated interaction with the alpha-1,4 glucan phosphorylase, a crucial allosteric enzyme in carbohydrate metabolism [31,32]. Although these interactions have not been experimentally confirmed in R. communis L. lipases, they are likely also involved in broader metabolic signaling networks, as well as in triglyceride mobilization processes. Among the proteins proposed in the interaction map generated with STRING, OLE1 stands out as a key enzyme in fatty acid biosynthesis, while PDAT1-1 is involved in acyl transfer reactions in triacylglycerols. In addition, several proteins annotated in the R. communis genome (RCOM_1078510, RCOM_1185660, RCOM_1046030, and RCOM_058) were identified, suggesting a functional interaction network related to lipid metabolism and triacylglycerol remodeling in seeds (Figure 4).
Although PCA showed similar trajectories between pH 4.5 and 7.0 for OBL1 lipase in solution, our study revealed critical differences in its structural dynamics. The elevated RMSD value, together with changes in radius of gyration and secondary structure, evidenced a more stable and compact configuration at acidic pH. Under these conditions, the protein retained a higher content of β-sheets and α-helices, and more intramolecular hydrogen bonds were formed; consequently, the active site was less exposed to solvent.
These observations align with previous studies on plant and microbial lipases, which have demonstrated that structural rigidity, stabilized by internal bonds, is crucial for catalytic activity under specific conditions [15]. However, the magnitude of the differences between pH conditions in our analysis highlights a functional sensitivity of OBL1 that has not been widely reported for other plant lipases.
In particular, the double protonation of His468 at pH 4.5 stabilized an α-helix in the 465–470 region, whereas at pH 7.0 this region adopted a more flexible loop structure. This change generated a structural mobility that partially concealed the catalytic triad (Ser340-Asp404-His497), decreasing its exposure and, probably, its accessibility to the substrate. These findings align with experimental results of higher enzymatic activity observed at acidic pH. Castor lipase has been shown to exhibit higher catalytic activity at pH 4.5, with a maximum activity of 600.2 ± 25.5 Ug−1 at 37 °C, using soybean oil as substrate [23]. This study refines this evidence by confirming that OBL1 retains its activity at room temperature (~25 °C), which represents a considerable technical and economic advantage in industrial applications.
Molecular surface analysis revealed increased exposure of hydrophobic and positively charged residues at pH 4.5, which favored interaction with hydroxylated triglycerides such as tri-ricinolein. Docking simulations confirmed this behavior, with higher PLP GOLD scores under acidic conditions and a greater variety of residue–ligand interactions. This pattern was also reported previously [27], where a high specificity of castor lipase towards polyunsaturated and functionalized fatty acid-containing oils was observed.
In contrast, tri-stearin, a saturated TAG, showed low solubility and a strong tendency to form aggregates (oligomers), which restricts its entry into the catalytic site due to steric hindrance. In contrast, tri-ricinolein, being chemically more polar and soluble (because of C12-OH), remained in its monomeric form, generated more specific and favorable interactions at the active site, which confer a higher affinity and catalytic efficiency to the lipase active site. This difference is relevant, since other studies have suggested that substrate availability in the aqueous phase directly influences the efficiency of enzymatic hydrolysis [9]. Our work provides strong evidence in favor of the precept that, beyond the structural stability of the enzyme, the chemical nature of the substrate decisively influences the efficiency of the catalytic process.
Finally, unlike many commercial lipases that require specific formulations or additives to act on triglycerides [33,34], R. communis L. seed lipases (OBL1) exhibit high affinity and efficiency in a simple medium at pH 4.5 and room temperature, on both refined and non-refined vegetable oils, without the need for cofactors or activators, and immobilization. This positions CEE as an attractive tool for biotechnological applications such as the production of biodiesel and biolubricants from raw or FFA-rich oils.
Furthermore, the structural evidence presented in this work, linking the protonation of specific residues to functional conformational changes, offers a potential avenue for rational engineering, particularly of R. communis L. lipases. The observed stability at acidic pH and the high specificity towards different oils position OBL1 as an excellent candidate for future enzyme optimizations by directed evolution or site-directed modification.
4. Materials and Methods
4.1. Collection of Plant Material and Extraction of Castor Oil
Mature seeds were collected from Ricinus communis L. plants in Zacatecas, Mexico. Seeds from three different wild castor bean accessions were selected following the SAGARPA Technical Guide for Varietal Description. The seeds were separated and labeled according to their plant characteristics as variety 1 (V1), variety 2 (V2), and variety 3 (V3). Subsequently, all seeds underwent a solar drying process until they were completely open. Crude castor oil was extracted according to [35] and used for hydrolysis tests.
4.2. Preparation of Powdered Enzyme Extract from Ricinus communis L. Seeds
The CEE was obtained using cold acetone to delipidate the ground endosperms (<250 µm), followed by constant stirring at 4 °C for 16 h. The mixture was vacuum-filtered, and the dry residue was stored at 4 °C until use [6].
4.3. Determination of the Hydrolytic Activity of the Enzyme Extract
The hydrolytic activity was determined using an emulsion (5 mL) composed of 0.1 g of CEE, vegetable oil (25 g): commercial olive (CO), refined castor (RC), and unrefined castor (NRC), gum arabic (30 g/L), 100 mmol phosphate buffer (5 mL), pH 7.0 at 37 °C under 5 min incubation. The reaction was stopped with ethanol (96%), and the release of free fatty acids (FFA) was quantified by titration with 20 mmol L−1 NaOH using phenolphthalein as an indicator [7]. One enzyme unit (U) was defined as the amount of enzyme that releases 1 µmol of FFA per minute under the test conditions.
4.4. Kinetic Evaluation of Hydrolysis in a Stirred Reactor
For the kinetic assays, 5 g of vegetable oil (CO, RC, and NRC), 45 mL of acetate buffer (pH 4.5, 100 mmol/L), and 1 g of CEE were used. The mixture was placed in Erlenmeyer flasks and stirred at 800 rpm at 25 °C for 4.5 h. Samples of the mixture were taken every 30 min, and hydrolysis was quantified as the percentage of FFA released relative to the total theoretical content (Equation (1)).
where VNaOH is the volume of sodium hydroxide consumed in titration; MNaOH is the alkali molar concentration (20 mmol L−1); MM is the average molecular mass of fatty acids for CO, RC, and NRC; Wt is the weight of the aliquot, and OF is the oil fraction at the beginning of the reaction [36].
4.5. In Silico Analysis
From an exhaustive search of R. communis lipases in the National Center for Biotechnology Information (NCBI) database, different types of sequences corresponding to and/or related to triacylglycerol lipase enzymes were identified. The sequences were analyzed using various bioinformatics algorithms, including the BRaunschweig ENzyme Database (BRENDA) (https://www.brenda-enzymes.org/, accessed on 18 July 2025), SWISS-MODEL (https://swissmodel.expasy.org/, accessed on 18 July 2025), UniProt (https://www.uniprot.org/, accessed on 18 July 2025), and Expasy (https://www.expasy.org/, accessed on 18 July 2025), to examine their function, family, sequence length, and homology, among other properties.
Two representative sequences were selected: AY360220.1 (OBL1) and ABD90510.1 (LipRC1p) (predicted sequences derived from automated computational analyses using genetic prediction were not considered), and their three-dimensional structures and conserved domains were determined in AlphaFold Model, Conserved Domains Database (CDD) [37], and CD-Search as NCBI’s interface to searching the Conserved Domain Database. Physicochemical properties were determined by ProtParam of Expasy (https://web.expasy.org/protparam/, accessed on 23 July 2025) and protein interaction networks with STRING (https://string-db.org/, accessed on 23 July 2025).
4.6. Three-Dimensional Modeling and Structural Validation of Lipase OBL1
The model used was obtained from the AlphaFold Protein Structure database (https://alphafold.ebi.ac.uk/entry/Q5VKJ7, accessed on 18 July 2025) ID: AF-Q5VKJ7-F1, UniProt access code for the sequence: Q5VKJ7, corresponding to the triacylglycerol lipase OBL1 from Ricinus communis L. The structure was validated with the online server saves6.1 (https://saves.mbi.ucla.edu/, accessed on 18 July 2025), using ERRAT algorithms to analyze the quality of the modeling of intramolecular non-bonding interactions [38], Verify3D to determine the congruence of the secondary structure assigned according to the physicochemical properties of each residue [39], and Ramachandran plots calculated with the PROtein CHECK(PROCHECK) tool to analyze the stereochemistry [40].
4.7. Conformational Refinement by Replica Exchange Molecular Dynamics (REMD)
The REMD assembly algorithm was used to refine the 3D structure model of OBL1 [41,42,43,44]. GROMACS version 2023.2 ran the simulations, for which a simulation system was constructed using the Assisted Model Building with Energy Refinement (AMBER) 99SB-ILDN force field of the protein solvated by 33,502 H2O molecules (tip4p-ewald model) in a volume of 937.3 nm3. With two sodium (Na) ions, the protein was neutralized, and an ionic strength of 0.15 M was simulated by adding 130 ions (a balance of Na+ and Cl− ions).
The constructed system was geometrically optimized with energy minimization. With this result, a temperature (T) equilibrium was performed at 310.15 K in an NVT ensemble using the V-rescale thermostat, with an integration step of 0.002 Fs and a total simulation time of 1 ns. In the proposed refinement methodology, parallel simulations were conducted at different T, which were then exchanged with those at adjacent temperatures [41]. Consequently, T scaling was also performed for the second isothermal–isobaric ensemble (NPT) equilibrium. First, 10 simulations were established at different Ts ranging from 310.15 to 318.15 K, using the online tool (https://virtualchemistry.org/remd-temperature-generator/, accessed on 22 July 2025). An exchange probability of 0.25 was set, within the range suggested in the literature [44]. The 10 NPT equilibria were run at different temperatures with the C-rescale barostat, a step of 0.002 Fs, and 1 ns for each of the 10 equilibria.
The dynamics were run in parallel with the mdrun module, using an integration step of 0.002 fs, exchanging every 1000 steps, and simulating for 12 ns per replicate, which corresponds to a total of 120 ns considering the 10 replicates. The results were analyzed using the internal GROMACS modules and the Pearl demux.pl script.
The centered and concatenated trajectory of the 10 simulations underwent a structural clustering process using the ttclust v4.6 software [45], employing the Ward-linkage hierarchical partitioning method. The software was allowed to choose the optimal number of groups (clusters) using the elbow method (with K-means) and select the most representative trajectory for each cluster.
4.8. Evaluation of Structural Dynamics in Mixed Solvent Under Physiological and Acidic pH Conditions
Classic all-atom simulations were performed with the refined OBL1 model in mixed ethanol/water solvent (10% v/v), using the same software and force field reported for REMD. Two systems were simulated by adjusting the protonation states of the protein to pH 4.5 and 7.0 using the PropKa tool from the PDB2PQR server (https://server.poissonboltzmann.org/pdb2pqr, accessed on 22 July 2025) to determine the residues to be modified at each pH level. The pdb2gmx module of GROMACS was then used to edit these residues before assembling the simulation system.
Both proteins were solvated with different protonation states, using the tip4p-Ewald water model, and an ionic strength of 0.15 M (with added ions to maintain neutrality). The equilibria and productive simulations were performed with the thermostat and barostat, using the V-scale and C-scale, respectively. The simulation had an integration step of 0.002 Fs, 1 ns for equilibration, and 200 ns for productive dynamics.
The resulting trajectories were centered with GROMACS trjconv and subjected to PCA (covar module) [46,47,48,49,50], which defined the two main components for each simulation. The 1D projection of the first three components and the 2D projection with the first two components were performed using the GROMACS ANAEIG module. The projection of the first two components of the conformational free energy (free energy landscape) was calculated using the Stochastic Hopping Algorithm for conformational Mapping (SHAM) module, which also enables the determination of minimum energy trajectories. These trajectories were then used for property calculations in the MOE v2014 software.
4.9. Molecular Docking of OBL1 with Castor Oil Triglycerides
Flexible molecular docking simulations were run with GOLD software version 2022.3 [51]. For this purpose, the minimum energy structures of OBL1, obtained from protein molecular dynamics in solvent with protonation states adjusted to pH 4.5 and 7.0, were used. Six triglycerides (TGA) of the five fatty acids present in castor oil, the natural substrate of this enzyme, were used as ligands. The GOLD software was configured to use the ChemPLP scoring function [52], with 100 GA runs per TAG. It centered the simulation volume on the catalytic triad Ser340-Asp404-His497, considering all atoms within a 10 Å distance. Both protein and TAGs were prepared using MOE v2014 software, with charges added using the Amber99 force field for OBL1 and Gasteiger structures for ligands.
4.10. Simulation of Free Protein–Ligand Interactions Under the Influence of pH
Finally, the pH effect on the interaction capacity between the protein surface and two triacylglycerols, stearic acid and ricinoleic acid, was evaluated computationally using free ligand simulations. The same parameters described for protein dynamics in solution were used, but 30 molecules of the two aforementioned TAGs were added to the system. The protonation states were set to pH 4.5 and 7.0, and the simulation time was 200 ns.
The resulting trajectories were centered and used to calculate the FragMaps of the TAGs on the protein surface, determining the occupancy density of TAG atoms at 4 Å from protein atoms using the VMD volmap tool.
Supplementary Materials
The following supporting information can be downloaded at https://www.mdpi.com/article/10.3390/catal15090912/s1, Figure S1 ab; Castor bean plant Variety 1; Figure S2 ab; Castor bean plant Variety 2; Figure S3; Castor bean plant Variety 3; Figure S4; Isosurface calculation with VMD; Figure S5; Results of molecular docking with ricinoleic acid triacylglycerol pH 7; Figure S6; Results of molecular docking with ricinoleic acid triacylglycerol pH 4.5.
Author Contributions
Conceptualization, H.C.C.-A. and G.V.C.-R.; methodology, C.S.-J., O.G.-G. and A.G.-R.; software, C.S.-J. and O.G.-G.; validation, G.V.C.-R. and T.I.-P.; formal analysis, G.V.C.-R. and C.S.-J.; investigation, A.G.-R., C.S.-J. and O.G.-G.; resources, H.C.C.-A.; data curation, H.C.C.-A. and G.V.C.-R.; writing—original draft preparation, H.C.C.-A. and G.V.C.-R.; writing—review and editing, T.I.-P. and H.C.C.-A.; visualization, G.V.C.-R. and T.I.-P.; supervision, H.C.C.-A. and G.V.C.-R.; project administration, H.C.C.-A. All authors have read and agreed to the published version of the manuscript.
Funding
This research received no external funding.
Data Availability Statement
The data presented in this study are available on request from the corresponding authors.
Acknowledgments
The authors gratefully acknowledge the support provided by the Instituto Politécnico Nacional (IPN, Mexico), especially at the Unidad Profesional Interdisciplinaria de Ingeniería, campus Zacatecas (UPIIZ-IPN), for access to laboratory facilities, and the Universidad Autónoma Metropolitana (UAM) for providing access to computational equipment.
Conflicts of Interest
The authors declare no conflicts of interest.
Abbreviations
The following abbreviations are used in this manuscript:
| AMBER99SB-ILDN | Assisted Model Building with Energy Refinement force field |
| BRENDA | BRaunschweig ENzyme DAtabase |
| CDD | Conserved Domains Database |
| CEE | Crude Enzyme Extract |
| CO | Commercial Olive oil |
| FAME | Fatty Acid Methyl Esters |
| FFA | Free Fatty Acids |
| GRAVY | Grand Average of Hydropathy |
| GROMACS | Groningen Machine for Chemical Simulations |
| GOLD | Genetic Optimization for Ligand Docking |
| LV1–LV3 | Castor bean lipase varieties 1–3 |
| MOE | Molecular Operating Environment |
| NCBI | National Center for Biotechnology Information |
| NPT | Isothermal–isobaric ensemble (constant Number, Pressure, Temperature) |
| NRC | Non-refined Castor oil |
| NVT | Canonical ensemble (constant Number, Volume, Temperature) |
| OBL1 | Oil Body Lipase 1 |
| PCA | Principal component analysis |
| PDB | Protein Data Bank |
| PLP/ChemPLP | Piecewise Linear Potential scoring functions |
| PPI | Protein–Protein Interaction |
| PROCHECK | PROtein CHECK |
| RC | Refined Castor oil |
| RCOMs | Ricinus communis Orthologous/Model sequences |
| REMD | Replica Exchange Molecular Dynamics |
| RMSD | Root Mean Square Deviation |
| SHAM | Stochastic Hopping Algorithm for free energy Map |
| STRING | Search Tool for the Retrieval of Interacting Genes/Proteins |
| TAG | Triacylglycerol |
| TIP4P-Ewald | Transferable Intermolecular Potential water model |
| U (enzyme unit) | Amount of enzyme releasing 1 µmol FFA per minute |
| VMD | Visual Molecular Dynamics |
References
- He, X.; Khan, S.; Ozturk, I.; Murshed, M. The role of renewable energy investment in tackling climate change concerns: Environmental policies for achieving SDG-13. Sustain. Dev. 2023, 31, 1888–1901. [Google Scholar] [CrossRef]
- Coaviche-Yoval, A.; Guerrero, T.; De la Cruz Pino, M.C.; Sánchez-Hernández, E.; Luna, H.; Tovar-Miranda, R. Lipases in Ricinus communis Seeds: Biocatalytic Potential for the Esterification and Transesterification of Fatty Acids to Produce Biodiesel. SSRN Electron. J. 2022. [Google Scholar] [CrossRef]
- Jain, R.; Naik, S.N. Adding value to the oil cake as a waste from oil processing industry: Production of lipase in solid state fermentation. Biocatal. Agric. Biotechnol. 2018, 15, 181–184. [Google Scholar] [CrossRef]
- Choi, Y.J.; Zaikova, K.; Yeom, S.-J.; Kim, Y.-S.; Lee, D.W. Biogenesis and lipase-mediated mobilization of lipid droplets in plants. Plants 2022, 11, 1243. [Google Scholar] [CrossRef]
- Patel, N.; Rai, D.; Shivam, S.; Shahane, S.; Mishra, U. Lipases: Sources, production, purification, and applications. Recent Patents Biotechnol. 2019, 13, 45–56. [Google Scholar] [CrossRef]
- Cavalcanti, E.D.; Maciel, F.M.; Villeneuve, P.; Lago, R.C.; Machado, O.L.; Freire, D.M.J.A.B. Acetone powder from dormant seeds of Ricinus communis L.: Lipase activity and presence of toxic and allergenic compounds. Biotechnology 2007, 137, 57–65. [Google Scholar]
- Avelar, M.H.M.; Cassimiro, D.M.J.; Santos, K.C.; Domingues, R.C.C.; De Castro, H.F.; Mendes, A.A. Hydrolysis of vegetable oils catalyzed by lipase extract powder from dormant castor bean seeds. Ind. Crop. Prod. 2012, 44, 452–458. [Google Scholar] [CrossRef]
- Rivas, A.G.; Vázquez, V.V.; Flores, M.M.A.; Cerrillo-Rojas, G.V.; Correa-Aguado, H.C. Sustainable castor bean biodiesel through Ricinus communis L. lipase extract catalysis. Appl. Biochem. Biotechnol. 2022, 195, 1297–1318. [Google Scholar] [CrossRef] [PubMed]
- Cavalcanti, E.D.C.; Maciel, F.M.; Villeneuve, P.; Lago, R.C.A.; Machado, O.L.T.; Freire, D.M.G. Acetone powder from dormant seeds of Ricinus communis L. Appl. Biochem. Biotechnol. 2007, 137, 57–65. [Google Scholar] [CrossRef]
- Muto, S.; Beevers, H. Lipase activities in castor bean endosperm during germination. Plant Physiol. 1974, 54, 23–28. [Google Scholar] [CrossRef] [PubMed][Green Version]
- Eastmond, P.J. Cloning and characterization of the acid lipase from castor beans. J. Biol. Chem. 2004, 279, 45540–45545. [Google Scholar] [CrossRef]
- Li, Y.; Li, G.; Sun, H.; Chen, Y. Characterization of a novel sn1, 3 lipase from Ricinus communis L. suitable for production of oleic acid-palmitic acid-glycerol oleate. Sci. Rep. 2021, 11, 6913. [Google Scholar] [CrossRef]
- Cagliari, A.; Margis-Pinheiro, M.; Loss, G.; Mastroberti, A.A.; Mariath, J.E.d.A.; Margis, R. Identification and expression analysis of castor bean (Ricinus communis) genes encoding enzymes from the triacylglycerol biosynthesis pathway. Plant Sci. 2010, 179, 499–509. [Google Scholar] [CrossRef] [PubMed]
- Din, M.H.M.; Nair, A.; Masomian, M.; Ali, M.S.M.; Abd Rahman, R.N.Z.R. Heterologous expression and characterization of plant lipase lip2 from Elaeis guineensis jacq. Oil palm mesocarp in Escherichia coli. Catalysts 2021, 11, 244. [Google Scholar] [CrossRef]
- Sankar, S.; Ponnuraj, K. Less explored plant lipases: Modeling and molecular dynamics simulations of plant lipases in different solvents and temperatures to understand structure-function relationship. Int. J. Biol. Macromol. 2020, 164, 3546–3558. [Google Scholar] [CrossRef]
- Ayinla, Z.A.; Ademakinwa, A.N.; Agboola, F.K. Comparative modelling, molecular docking and immobilization studies on Rhizopus oryzae lipase: Evaluation of potentials for fatty acid methyl esters synthesis. J. Biomol. Struct. Dyn. 2022, 41, 7235–7247. [Google Scholar] [CrossRef]
- Tey, J.R.; Fatimah, S.; Hassan, M.; Nair, A.; Ng, C.L. Structural and Functional Analysis of Plant Oil-Body Lipase EgLIP1 from Elaeis guineensis. Proteins Struct. Funct. Bioinform. 2025. [Google Scholar] [CrossRef]
- Leveson-Gower, R.B.; Mayer, C.; Roelfes, G. The importance of catalytic promiscuity for enzyme design and evolution. Nat. Rev. Chem. 2019, 3, 687–705. [Google Scholar] [CrossRef]
- Kaur, J.; Kumar, R.; Kumar, A. Protein engineering strategies for tailoring the physical and catalytic properties of enzymes for defined industrial applications. Curr. Protein Pept. Sci. 2023, 24, 113–129. [Google Scholar] [CrossRef]
- Patti, A.; Sanfilippo, C. Stereoselective promiscuous reactions catalyzed by lipases. Int. J. Mol. Sci. 2022, 23, 2675. [Google Scholar] [CrossRef] [PubMed]
- Rocha, S.; Rufino, A.T.; Freitas, M.; Silva, A.M.S.; Carvalho, F.; Fernandes, E. Methodologies for assessing pancreatic lipase catalytic activity: A review. Crit. Rev. Anal. Chem. 2023, 54, 3038–3065. [Google Scholar] [CrossRef]
- Altaf, A.; Ankers, T.V.; Kaderbhai, N.; Mercer, E.I.; Kaderbhai, M.A. Acid lipase of castor bean lipid bodies: Isolation and characterisation. J. Plant Biochem. Biotechnol. 1997, 6, 13–18. [Google Scholar] [CrossRef]
- Corradini, F.A.S.; Alves, E.S.; Kopp, W.; Ribeiro, M.P.A.; Mendes, A.A.; Tardioli, P.W.; Giordano, R.L.C. Kinetic study of soybean oil hydrolysis catalyzed by lipase from solid castor bean seeds. Chem. Eng. Res. Des. 2019, 144, 115–122. [Google Scholar] [CrossRef]
- Aguieiras, E.C.G.; Cavalcanti-Oliveira, E.D.; De Castro, A.M.; Langone, M.A.P.; Freire, D.M.G. Biodiesel production from Acrocomia aculeata acid oil by (enzyme/enzyme) hydroesterification process: Use of vegetable lipase and fermented solid as low-cost biocatalysts. Fuel 2014, 135, 315–321. [Google Scholar] [CrossRef]
- De Sousa, J.S.; Cavalcanti-Oliveira, E.D.; Aranda, D.A.G.; Freire, D.M.G. Application of lipase from the physic nut (Jatropha curcas L.) to a new hybrid (enzyme/chemical) hydroesterification process for biodiesel production. J. Mol. Catal. B Enzym. 2010, 65, 133–137. [Google Scholar] [CrossRef]
- Pourzolfaghar, H.; Abnisa, F.; Daud, W.M.A.W.; Aroua, M.K. A review of the enzymatic hydroesterification process for biodiesel production. Renew. Sustain. Energ. Rev. 2016, 61, 245–257. [Google Scholar] [CrossRef]
- Machado, S.A.; Da Rós, P.C.M.; De Castro, H.F.; Giordani, D.S. Hydrolysis of vegetable and microbial oils catalyzed by a solid preparation of castor bean lipase. Biocatal. Agric. Biotechnol. 2021, 37, 102188. [Google Scholar] [CrossRef]
- Wong, H.; Schotz, M.C. The lipase gene family. J. Lipid Res. 2002, 43, 993–999. [Google Scholar] [CrossRef]
- Ding, L.-N.; Li, M.; Wang, W.-J.; Cao, J.; Wang, Z.; Zhu, K.-M.; Yang, Y.-H.; Li, Y.-L.; Tan, X.-L. Advances in plant GDSL lipases: From sequences to functional mechanisms. Acta Physiol. Plant 2019, 41, 151. [Google Scholar] [CrossRef]
- Messaoudi, A.; Belguith, H.; Hamida, J.B. Three-dimensional structure of Arabidopsis thaliana lipase predicted by homology modeling method. Evol. Bioinform. 2011, 7, 99–105. [Google Scholar] [CrossRef]
- Huang, Z.; Cao, H.; Wang, H.; Huang, P.; Wang, J.; Cai, Y.; Wang, Q.; Li, Y.; Wang, J.; Liu, X.; et al. The triglyceride catabolism regulated by a serine/threonine protein phosphatase, Smek1, is required for development and plant infection in Magnaporthe oryzae. Mol. Plant Pathol. 2023, 24, 1256–1272. [Google Scholar] [CrossRef] [PubMed]
- Ubiparip, Z.; De Doncker, M.; Beerens, K.; Franceus, J.; Desmet, T. β-Glucan phosphorylases in carbohydrate synthesis. Appl. Microbiol. Biotechnol. 2021, 105, 4073–4087. [Google Scholar] [CrossRef]
- Enespa; Chandra, P.; Singh, D.P. Sources, purification, immobilization and industrial applications of microbial lipases: An overview. Crit. Rev. Food Sci. Nutr. 2022, 63, 6653–6686. [Google Scholar] [CrossRef] [PubMed]
- Kim, B.H.; Hwang, J.; Akoh, C.C. Liquid microbial lipase recent applications and expanded use through immobilization. Curr. Opin. Food Sci. 2023, 50, 100987. [Google Scholar] [CrossRef]
- Osorio-González, C.S.; Gómez-Falcon, N.; Sandoval-Salas, F.; Saini, R.; Brar, S.K.; Ramírez, A.A. Production of Biodiesel from Castor Oil: A Review. Energies 2020, 13, 2467. [Google Scholar] [CrossRef]
- Zhang, Q.; Zhu, H.; Wang, R.; He, J.; Ritzoulis, C.; Liu, W.; Tang, W.; Liu, J. Fish oil emulsions stabilized by enzymatic hydrolysis, glycation, and fibrillation of-Lg: Stability and EPA/DHA bioaccessibility. Food Chem. 2025, 469, 142550. [Google Scholar] [CrossRef]
- Wang, J.; Chitsaz, F.; Derbyshire, M.K.; Gonzales, N.R.; Gwadz, M.; Lu, S.; Marchler, G.H.; Song, J.S.; Thanki, N.; Yamashita, R.A.; et al. The conserved domain database in 2023. Nucleic Acids Res. 2022, 51, D384–D388. [Google Scholar] [CrossRef] [PubMed]
- Pontius, J.; Richelle, J.; Wodak, S.J. Deviations from standard atomic volumes as a quality measure for protein crystal structures. J. Mol. Biol. 1996, 264, 121–136. [Google Scholar] [CrossRef]
- Bowie, J.U.; Lüthy, R.; Eisenberg, D. A method to identify protein sequences that fold into a known three-dimensional structure. Science 1991, 253, 164–170. [Google Scholar] [CrossRef]
- Laskowski, R.; MacArthur, M.; Thornton, J. PROCHECK: Validation of protein-structure coordinates. Int. Tables Crystallogr. 2006, F, 722–725. [Google Scholar] [CrossRef]
- Sugita, Y.; Okamoto, Y. Replica-exchange molecular dynamics method for protein folding. Chem. Phys. Lett. 1999, 314, 141–151. [Google Scholar] [CrossRef]
- Zhang, W.; Wu, C.; Duan, Y. Convergence of replica exchange molecular dynamics. J. Chem. Phys. Lett. 2005, 123, 154105. [Google Scholar] [CrossRef] [PubMed]
- Abraham, M.J.; Gready, J.E. Ensuring mixing efficiency of replica-exchange molecular dynamics simulations. J. Chem. Theory Comput. 2008, 4, 1119–1128. [Google Scholar] [CrossRef]
- Sindhikara, D.; Meng, Y.; Roitberg, A.E. Exchange frequency in replica exchange molecular dynamics. J. Chem. Phys. 2008, 128, 024103. [Google Scholar] [CrossRef]
- Tubiana, T.; Carvaillo, J.-C.; Boulard, Y.; Bressanelli, S. TTClust: A versatile molecular simulation trajectory clustering program with graphical summaries. J. Chem. Inf. Model. 2018, 58, 2178–2182. [Google Scholar] [CrossRef] [PubMed]
- Altis, A.; Nguyen, P.H.; Hegger, R.; Stock, G. Dihedral angle principal component analysis of molecular dynamics simulations. J. Chem. Phys. 2007, 126, 244111. [Google Scholar] [CrossRef] [PubMed]
- Papaleo, E.; Mereghetti, P.; Fantucci, P.; Grandori, R.; De Gioia, L. Free-energy landscape, principal component analysis, and structural clustering to identify representative conformations from molecular dynamics simulations: The myoglobin case. J. Mol. Graph. Model. 2009, 27, 889–899. [Google Scholar] [CrossRef]
- Lou, H.; Cukier, R.I. Molecular dynamics of apo-adenylate kinase: A principal component analysis. J. Phys. Chem. B 2006, 110, 12796–12808. [Google Scholar] [CrossRef]
- Buslaev, P.; Gordeliy, V.; Grudinin, S.; Gushchin, I. Principal component analysis of lipid molecule conformational changes in molecular dynamics simulations. J. Chem. Theory Comput. 2016, 12, 1019–1028. [Google Scholar] [CrossRef]
- Stein, S.A.M.; Loccisano, A.E.; Firestine, S.M.; Evanseck, J.D. Principal components analysis: A review of its application on molecular dynamics data. Annu. Rep. Comput. Chem. 2006, 2, 233–261. [Google Scholar] [CrossRef]
- Nurisso, A.; Bravo, J.; Carrupt, P.-A.; Daina, A. Molecular docking using the molecular lipophilicity potential as hydrophobic descriptor: Impact on GOLD docking performance. J. Chem. Inf. Model. 2012, 52, 1319–1327. [Google Scholar] [CrossRef] [PubMed]
- Istyastono, E.P.; Anita, Y.; Sundowo, A. Computer-aided Structure-based Design of 3, 3′-Diallyl-[1, 1′-biphenyl]-4, 4′-diol Analogs of Eugenol as Potential Ligands for Estrogen Receptor Alpha. In Proceedings of Advances in Computer Science Research; Atlantis Press: Dordrecht, The Netherlands, 2015; pp. 89–91. [Google Scholar] [CrossRef]
Disclaimer/Publisher’s Note: The statements, opinions and data contained in all publications are solely those of the individual author(s) and contributor(s) and not of MDPI and/or the editor(s). MDPI and/or the editor(s) disclaim responsibility for any injury to people or property resulting from any ideas, methods, instructions or products referred to in the content. |
© 2025 by the authors. Licensee MDPI, Basel, Switzerland. This article is an open access article distributed under the terms and conditions of the Creative Commons Attribution (CC BY) license (https://creativecommons.org/licenses/by/4.0/).