Article

Response Surface Modeling and Photocatalytic Assessment of CoV2O6 for the Treatment of Organic Dyes

1
Université de Toulon, Aix Marseille Univ, CNRS, IM2NP, 83130 Toulon, La Garde, France
2
Laboratoire de Chimie Appliquée des Matériaux, Faculté des Sciences, Mohammed V University, Rabat 10000, Morocco
3
HUN-REN-SZTE Reaction Kinetics and Surface Chemistry Research Group, Rerrich Bélatér 1, H-6720 Szeged, Hungary
4
Department of Applied and Environmental Chemistry, University of Szeged, Rerrich Bélatér 1, H-6720 Szeged, Hungary
5
Department of Chemistry, College of Science, Princess Nourah bint Abdulrahman University, P.O. Box 84428, Riyadh 11671, Saudi Arabia
*
Author to whom correspondence should be addressed.
Catalysts 2025, 15(9), 908; https://doi.org/10.3390/catal15090908
Submission received: 20 August 2025 / Revised: 3 September 2025 / Accepted: 13 September 2025 / Published: 18 September 2025
(This article belongs to the Section Photocatalysis)

Abstract

A cobalt vanadate (CoV2O6) photocatalyst was successfully synthesized and characterized for the degradation of organic dyes under visible light. Structural analysis revealed a monoclinic crystalline phase with a band gap energy of 2.13 eV, indicating strong visible light absorption. X-ray photoelectron spectroscopy (XPS) confirmed the presence of cobalt (Co), vanadium (V), and oxygen (O) in the material composition. Morphological investigations using SEM and TEM showed highly irregular particles with no defined geometric shape. Photocatalytic activity was evaluated using Rhodamine B (RhB) and Methyl Orange (MO) as model pollutants. Degradation efficiencies of 80% and 50% were achieved for RhB and MO, respectively, highlighting a selective performance towards the cationic dye. Radical scavenging experiments indicated that hydroxyl radicals and photogenerated holes were the dominant reactive species in RhB decomposition. The photocatalytic process was further optimized using response surface methodology (RSM), and the ANOVA analysis confirmed the significance of the quadratic model (p < 0.05). These findings demonstrate the potential of CoV2O6 as an efficient and selective photocatalyst for treating dye-contaminated wastewater.

1. Introduction

Due to the ongoing expansion of industrial and economic activities, an increasing array of pollutants is being discharged into the environment, primarily through industrial effluents and domestic wastewater. Many of these contaminants are characterized by high environmental persistence and strong bioaccumulation potential, thereby causing severe ecological imbalances and posing significant threats to human health [1,2,3]. Among these pollutants, synthetic dyes represent a particularly critical class due to their widespread use across various industries, including textiles, paper, cosmetics, pharmaceuticals, and food processing. Their complex molecular structures confer high chemical stability and resistance to biodegradation, making them toxic even at low concentrations [4,5]. In aquatic environments, their presence can degrade water quality, reduce light penetration, and severely affect aquatic life by disrupting photosynthesis and oxygen balance. These concerns highlight the urgent need for effective and environmentally friendly treatment technologies for dye-contaminated wastewater. Among the emerging strategies, photocatalytic degradation has gained considerable attention owing to its high efficiency, simplicity, low energy requirements, and ability to mineralize organic pollutants into harmless end products such as CO2 and H2O [6,7]. Although conventional treatment processes have been used to mitigate water pollution, they often fail to completely remove non-biodegradable contaminants and are typically energy intensive. In contrast, photocatalysis offers a promising alternative, relying on the activation of a semiconductor material by light irradiation to generate electron–hole pairs that initiate the formation of highly reactive oxygen species such as superoxide and hydroxyl radicals, which can effectively oxidize a wide range of organic pollutants [8,9].
Among the various photocatalysts investigated to date, vanadate-based materials have shown promise due to their favorable electronic properties and ability to degrade common dyes such as Methylene Blue (MB) or Rhodamine B (RhB) [10,11,12].
In recent years, a wide array of photocatalysts—including organometallic compounds [13,14], metal oxides [15,16], molybdates [17], and tungstates [18]—have been explored for their potential in wastewater treatment applications. In particular, meta-vanadates (CuV2O6, ZnV2O6, MnV2O6, NiV2O6, etc.) have attracted significant interest owing to the unique redox properties and electronic structure of the vanadium element, which enhance their photocatalytic performance [10,19,20,21].
In this context, the present study focuses on the synthesis and application of cobalt vanadate CoV2O6 (CoVO) as a novel photocatalyst for the degradation of two representative organic dyes: RhB and Methyl Orange (MO). The CoVO material was synthesized via a solvothermal method followed by thermal treatment, and thoroughly characterized using a combination of techniques, including X-ray diffraction (XRD), Raman spectroscopy, X-ray photoelectron spectroscopy (XPS), diffuse reflectance spectroscopy (DRS), scanning and transmission electron microscopies (SEM/TEM), photoluminescence (PL), and time-resolved fluorescence (TRF).
A key challenge in optimizing photocatalytic systems for wastewater treatment lies in identifying the most effective operating conditions, given the multitude of parameters influencing the degradation process. Performing exhaustive experimental trials is often impractical; hence statistical approaches such as response surface methodology (RSM) are employed to reduce the number of required experiments while providing robust predictive models. RSM enables the systematic evaluation of multiple process variables and their interactions, thereby facilitating the identification of optimal operating conditions [22,23]. Among the various RSM designs, central composite design (CCD) is widely adopted for its efficiency and reliability in modeling non-linear responses [24,25,26]. In this study, it was employed to investigate the combined effects of four independent variables: catalyst dosage, initial dye concentration, contact time, and solution pH, across a total of 30 experimental runs.
To the best of our knowledge, this is the first report on the use of cobalt vanadate (CoVO) as a photocatalyst for the simultaneous degradation of RhB and MO, coupled with RSM-based process optimization. The findings presented herein provide valuable insights into the design of efficient photocatalytic systems for wastewater treatment applications.

2. Results and Discussion

2.1. Structural Analysis

Figure 1a shows the X-ray diffraction (XRD) pattern of the synthesized CoV2O6 photocatalyst. The diffraction peaks are consistent with the monoclinic crystal structure of CoV2O6 (JCPDS No. 96-200-2323) with the C121 space group. The calculated lattice parameters are a = 9.2560 Å, b = 3.5080 Å, and c = 6.6260 Å. The identified diffraction peaks detected at 2θ = 20.47°, 27.56°, 28.83°, 29.42°, 39.06°, 41.46°, 44.18°, 47.42°, 48.87°, 52.37°, and 62.18° correspond to the 2 ¯ 01 , (110), 2 ¯ 02 , (201), (111), (201), 4 ¯ 02 , (003), 4 ¯ 03 , (020), and 5 ¯ 13 planes of monoclinic CoV2O6, respectively. The absence of any additional peaks confirms the high phase purity of the synthesized material.
The Raman spectrum of CoVO is presented in Figure 1b and exhibits the presence of several characteristic bands associated with the vibrational modes of metal vanadates. The weak band located at 994 cm−1 is assigned to the stretching vibration of terminal V = O bonds [27]. The peak at 941 cm−1 corresponds to the symmetric stretching mode of V-O, νs(V-O), while the band at 886 cm−1 is attributed to the vibrations of the V-O-Co or O-V-O bonds within the CoV2O6 lattice [27,28]. The peak at 844 cm−1 can be assigned to V-O antisymmetric V-O stretching vibrations, νas(V-O), and the band at 790 cm−1 is associated with the symmetric stretching of the V-O-V bridge, νs(V-O-V). Additionally, the peak at 720 cm−1 corresponds to the stretching mode of doubly coordinated oxygen (V2-O) [29,30]. Lower wavenumber features include a band at 430 cm−1 related to the symmetric deformation modes of VO4 tetrahedra and a band at 340 cm−1 due to asymmetric bending vibrations of VO4 units [27,31]. Weak peaks at 287 and 303 cm−1 are attributed to V-O bond vibrations and triply coordinated oxygen atoms (V3-O), respectively [27,29,32]. The lowest-wavenumber bands arise from external modes originating from translational and vibrational movements of the lattice. They can also be attributed to the various vibrations of polyhedra containing V-O bonds [29,33].
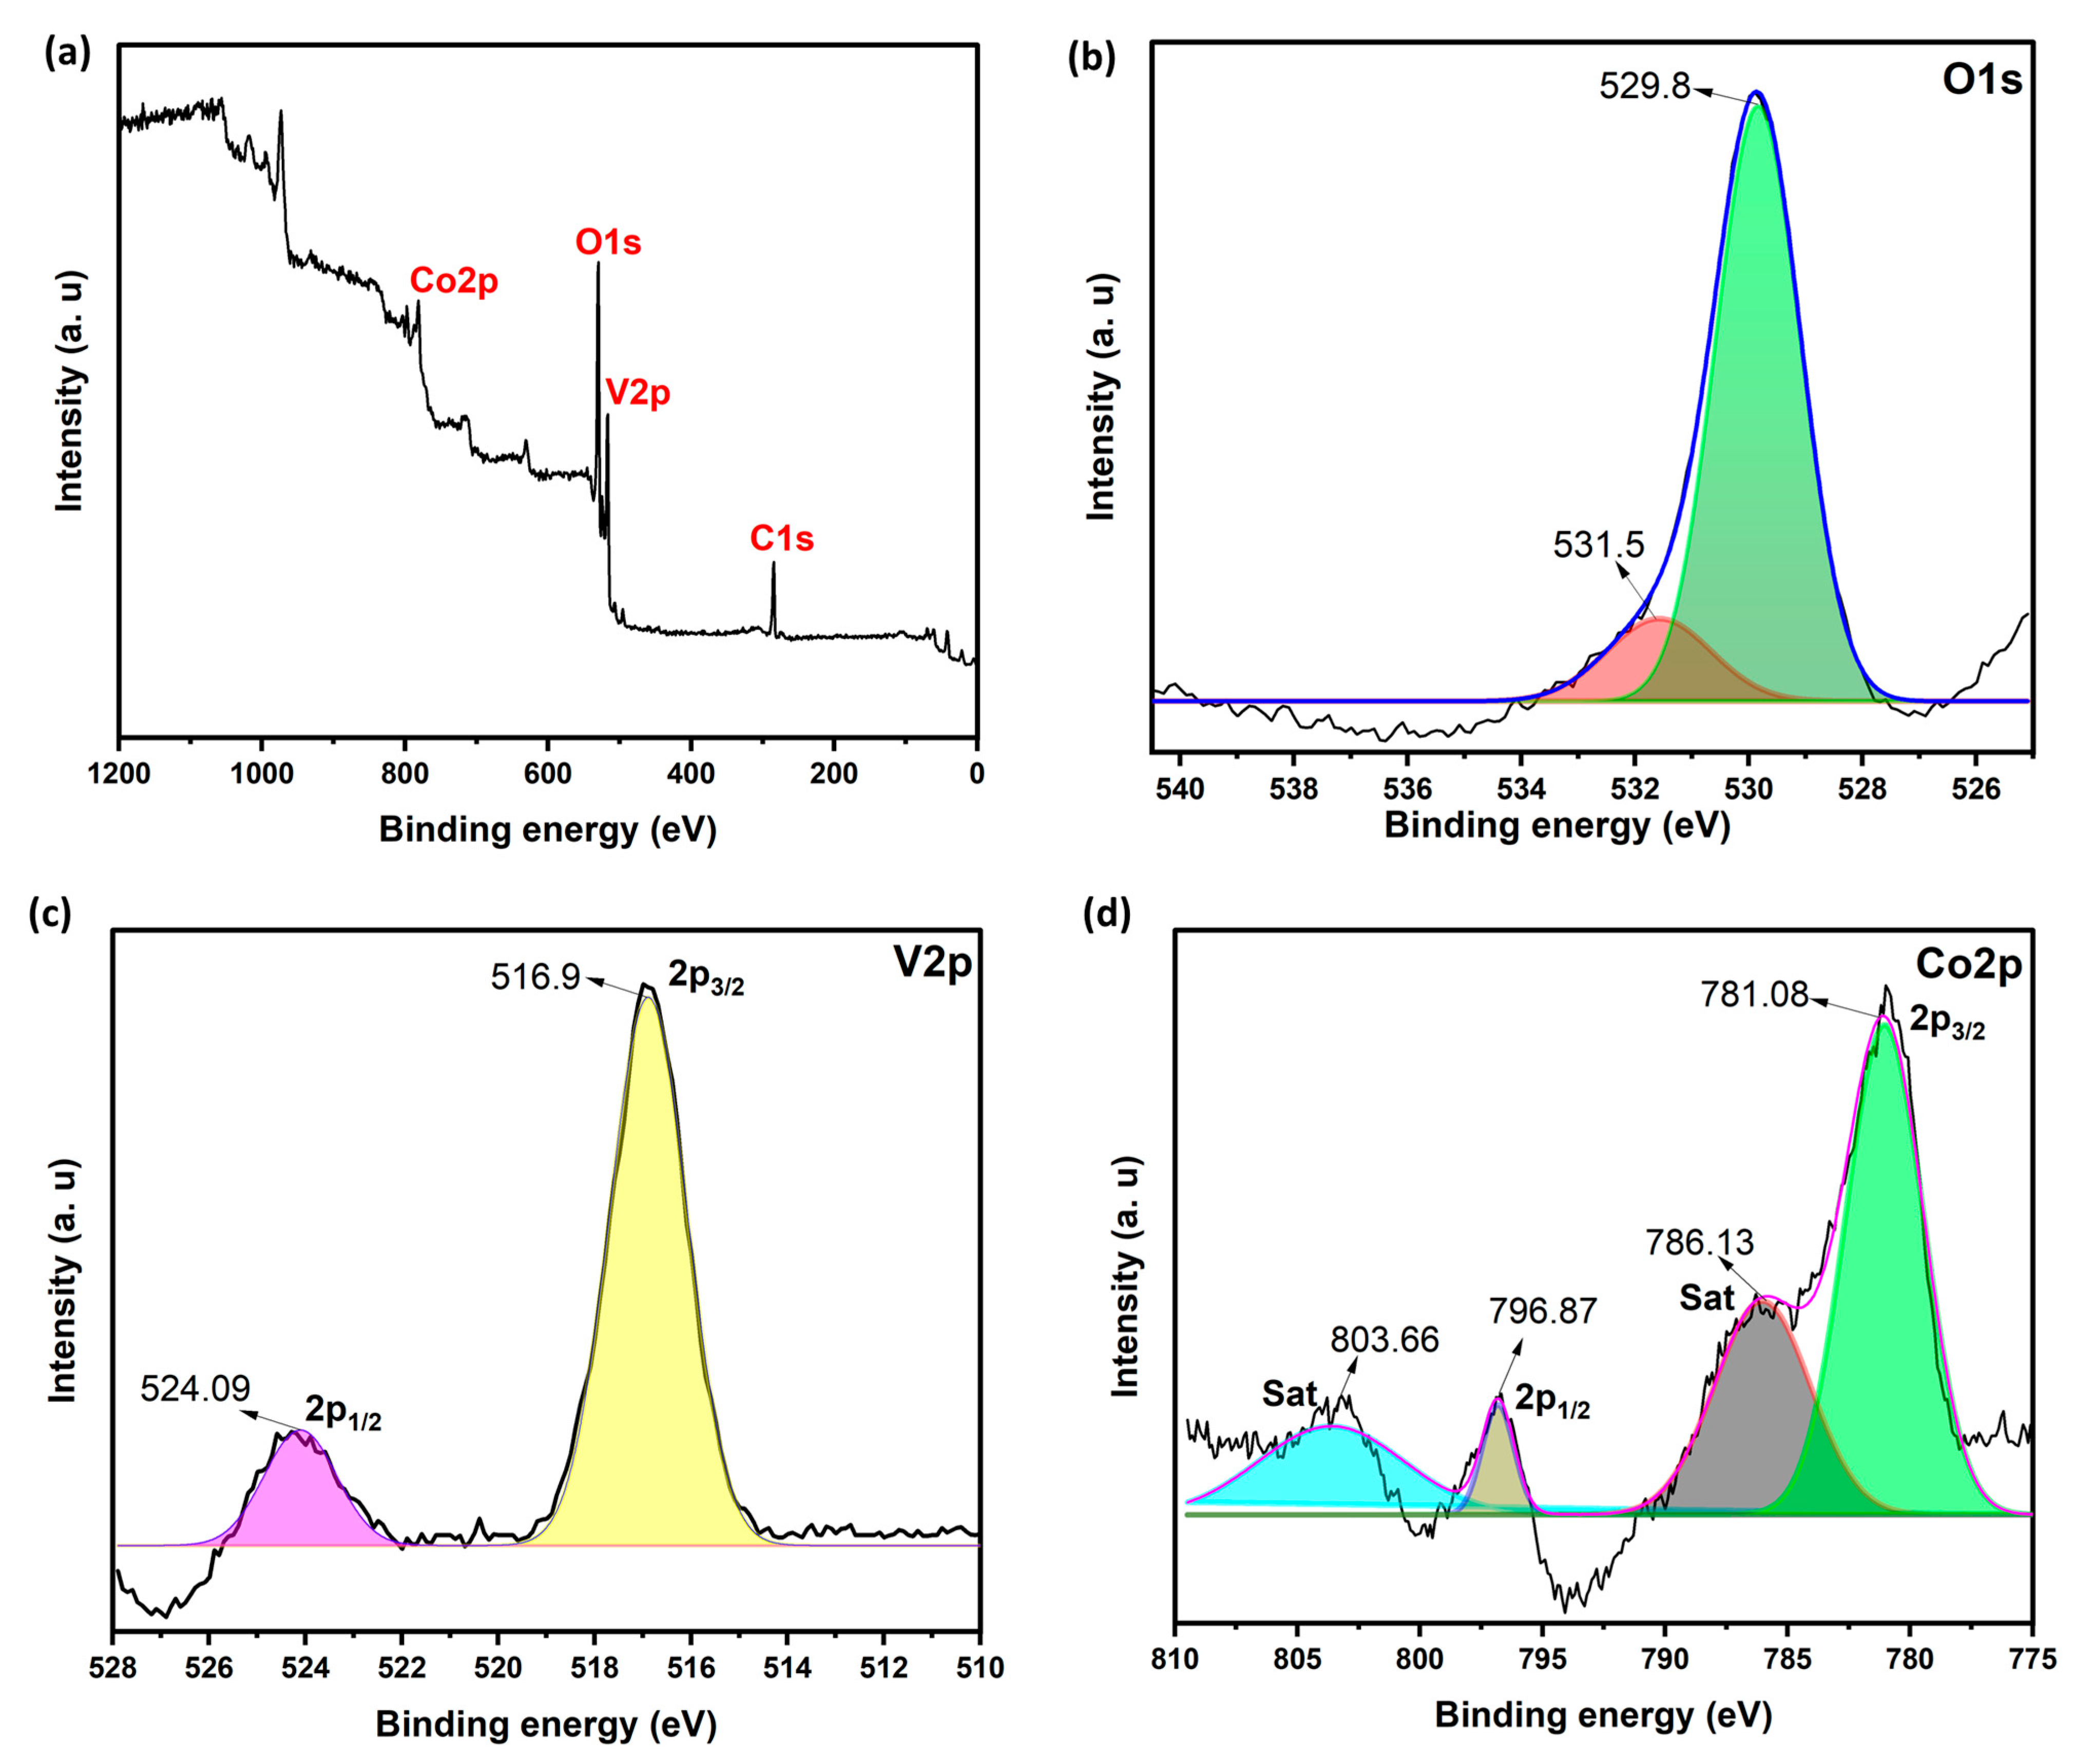
X-ray photoelectron spectroscopy (XPS) was carried out to analyze the elemental composition and the oxidation states present in the CoVO photocatalyst (Figure 2). The survey spectrum (Figure 2a) reveals four major peaks corresponding to C 1s (used as a reference), O 1s, V 2p, and Co 2p core levels. The high-resolution O 1s spectrum (Figure 2b) displays two distinct components: the first, centered at 529.8 eV (O1), is attributed to V–O bonds within the CoVO lattice, while the second peak at 531.5 eV (O2) corresponds to surface-adsorbed oxygen species [34,35,36]. The V 2p spectrum (Figure 2c) shows two characteristic peaks located at 516.9 eV (V 2p3/2) and 524.09 eV (V 2p1/2), confirming the presence of vanadium in the +5-oxidation state [34,37,38]. Figure 2d displays the detailed Co 2p spectrum, with two main peaks at 781.08 eV (Co 2p3/2) and 796.87 eV (Co 2p1/2), along with characteristic satellite peaks at 786.13 eV and 803.66 eV, indicative of the Co2+ oxidation state [34,39]. These XPS results are in good agreement with the XRD and Raman data and confirm the chemical purity and oxidation state of the synthesized CoVO material.

2.2. Morphological Analysis

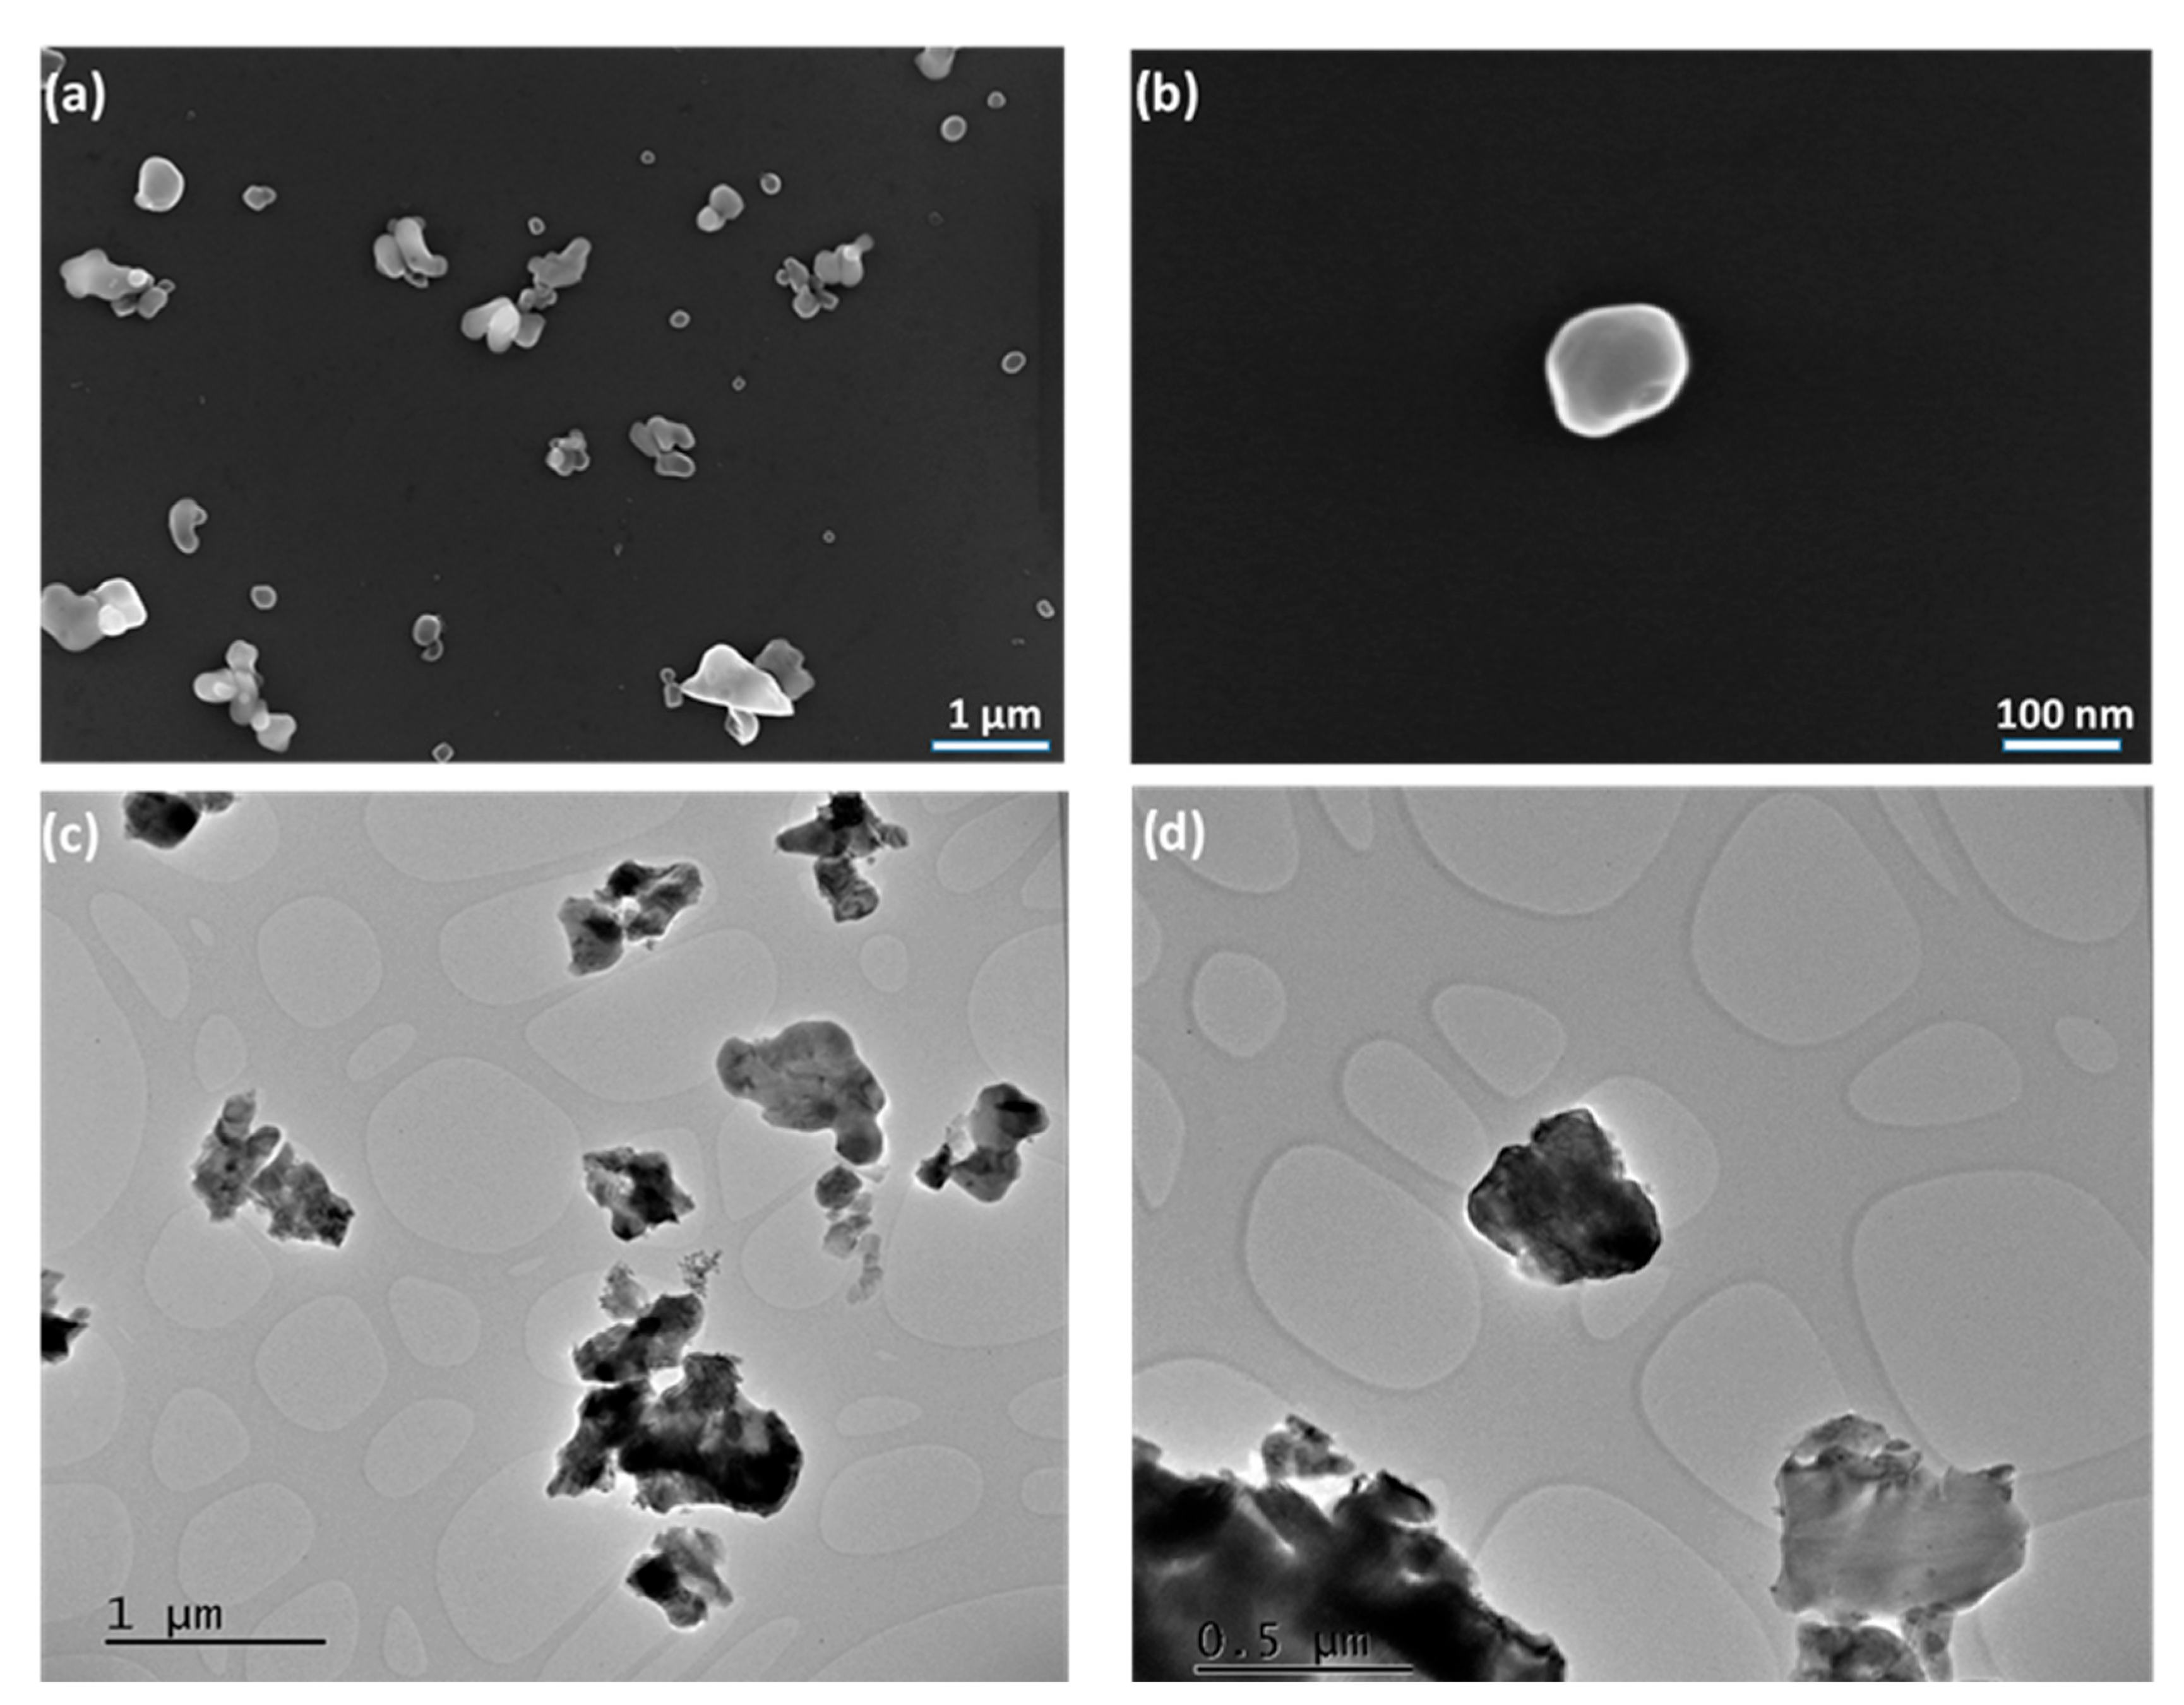
The morphology of the CoVO photocatalyst was examined using SEM and TEM; representative micrographs are shown in Figure 3. SEM images at different magnifications (Figure 3a,b) reveal numerous particles with irregular shapes and a wide range of surface textures—some appearing smooth, others rough. No well-defined or consistent morphology is observed; as seen in Figure 3a, small, nearly spherical particles coexist with larger, irregularly shaped ones, some of which appear to result from aggregation or coalescence. However, upon closer examination of an isolated, seemingly spherical particle (Figure 3b), it becomes evident that its shape is less regular than expected one. TEM analysis supports the SEM findings, further illustrating the morphological heterogeneity, and provides additional insight into the structure and size distribution of the particles. As shown in Figure 3c, the field of view displays a random dispersion of particles exhibiting noticeable size variability. No shape even approximately resembling a sphere can be observed in the TEM images, confirming and reinforcing the morphological irregularity suggested by SEM analysis (Figure 3d).

2.3. Optical Characteristics

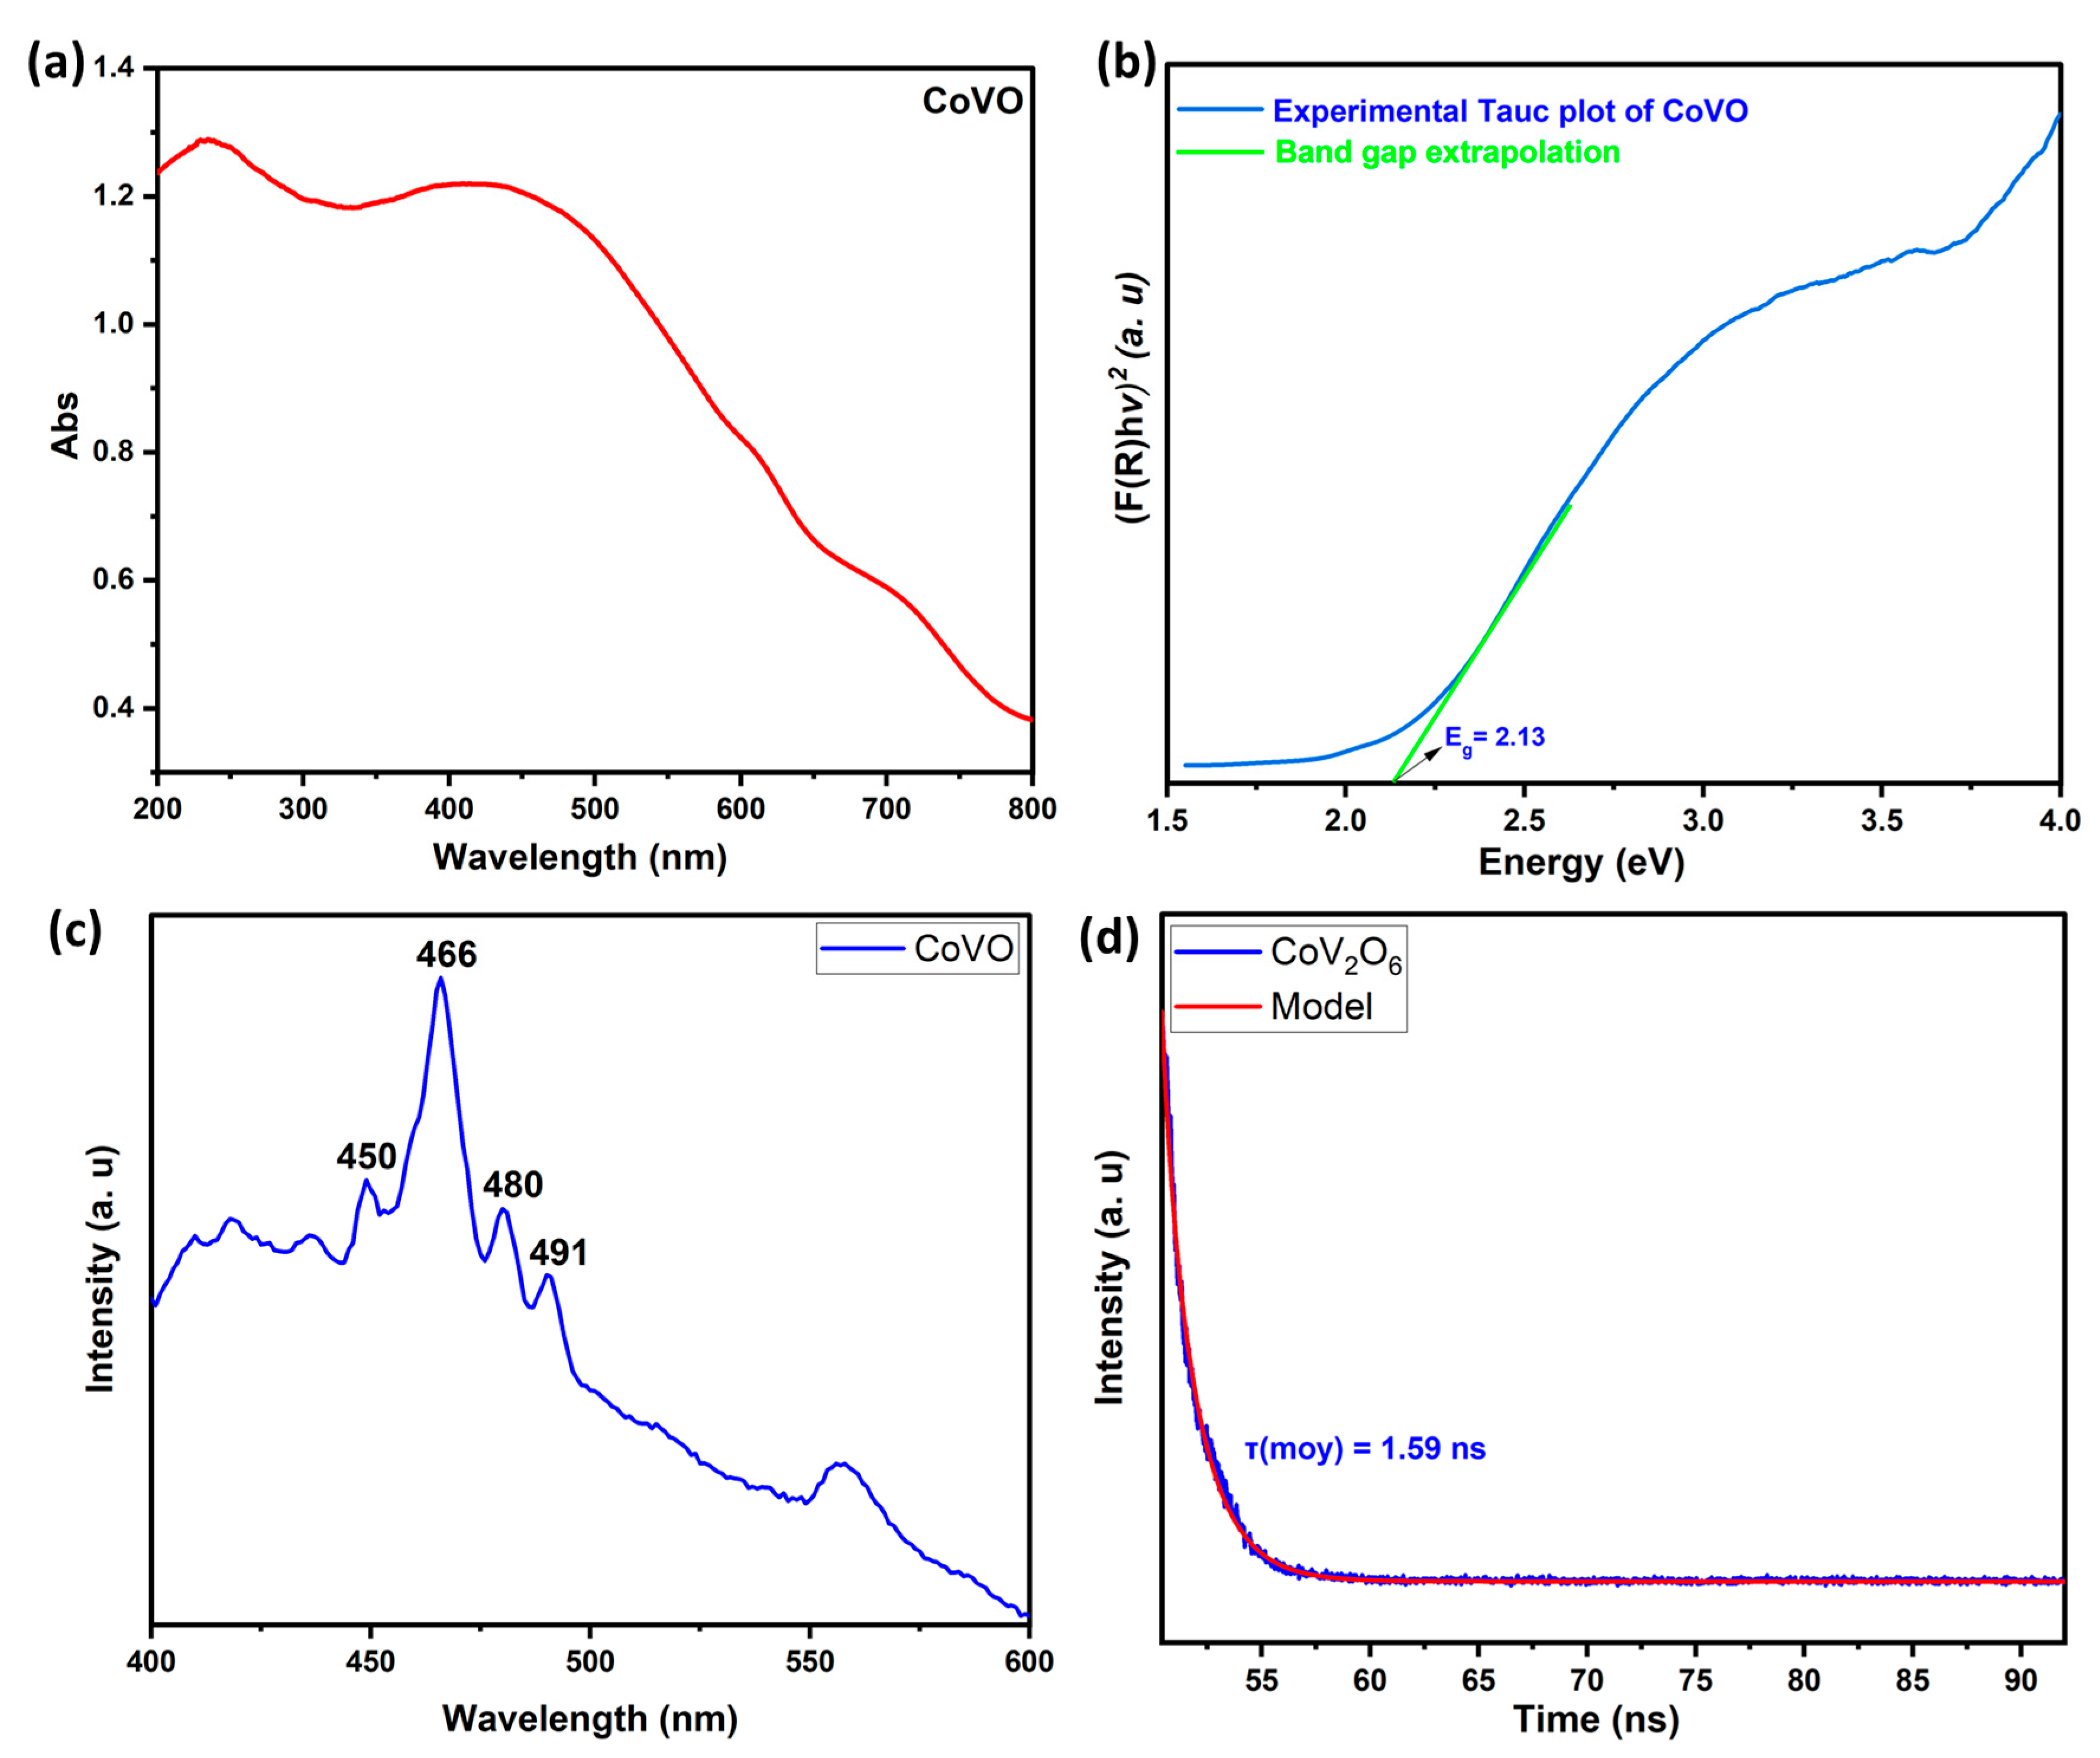
Photocatalytic activity is closely linked to the band structure of the catalyst. As a result, the band gap energy is a key parameter in assessing the photosensitivity range of materials. The light absorption behavior of CoV2O6 was investigated using UV-Vis DRS spectroscopy. As illustrated in Figure 4a, the spectrum reveals a broad absorption band extending from the ultraviolet to the visible region, indicating strong light-harvesting capability. The optical band gap energy (Eg) was determined using the Kubelka–Munk (KM) method [40]. This approach makes it possible to visualize the variation of the KM function F(R) according to the photon energy and to deduce Eg using the equation below [41], which relates the transformed reflectance data F(R) to the photon energy (hν):
(F(R)hν)1/γ = B (hν − Eg)
where B is a constant, h is Planck’s constant, and γ depends on the nature of the electronic transition (γ = 1/2 for direct band gaps and γ = 2 for indirect ones). In this study, a value of γ = ½ was used, consistent with a direct bandgap nature [20,42,43,44]. According to the KM function, F(R) is defined by:
F R = ( 1 R ) 2 2 R
The bandgap energy (Eg) was estimated by extrapolating the linear portion of the plot of (F(R)hν)2 versus hν, giving an Eg value of 2.13 eV (Figure 4b), in agreement with literature values [45]. Photoluminescence (PL) spectroscopy was used to assess the charge carrier’s dynamics, i.e., their capture/transfer/separation, as PL emission primarily arises from the radiative recombination of photo-induced electron–hole pairs. The emission spectrum (Figure 4c) reveals four distinct bands attributed to optical transitions occurring near the band gap [46]. These emissions are mainly due to charge transfer from O to V atomic orbitals within VO43− tetrahedral groups and may also involve defect states associated with reduced vanadium ions V4+. The luminescence decay profile (Figure 4d) was fitted using both mono- and bi-exponential models. The bi-exponential model provided a better fit, as indicated by lower chi-squared (χ2) values, suggesting two distinct recombination processes. The average PL lifetime was calculated from the fitting parameters and found to be 1.59 ns, reflecting moderately efficient charge separation.

2.4. Photocatalytic Parameter Optimization via Response Surface Methodology

The effect of experimental parameters on the photo-decomposition efficiency of RhB and MO dyes was studied using four independent variables: initial dye concentration (A), pH (B), photocatalyst weight (C), and irradiation time (D). The experimental design was based on a central composite design (CCD) with variable values ranging from −α to +α, centered around a reference level 0, corresponding to the midpoint of the tested ranges. Table 1 summarizes the variable levels used for each dye tested. The ranges for parameters A, C, and D were identical for both dyes, while pH values differed to reflect their ionic nature, RhB being cationic and MO anionic.
To evaluate the linear, quadratic, and interaction effects of these four selected parameters on dye degradation efficiency, CDD was employed within the response surface methodology framework. The aim was to identify optimal conditions of the process that maximize photocatalytic performance under visible light.
A total of 30 and 27 experimental runs were performed for RhB and MO, respectively. The observed results and the predicted values obtained using Design Expert software (NemrodW 2007) and the RSM-CCD model are summarized in Table 2.
As a reminder, the experimental data were modeled by a quadratic polynomial equation as follows:
Ŷ = b 0 + i = 1 n b i X i + i = 1 n b i i X i 2 + i = 1 n 1 j = i + 1 n b i j X i X j + ε
Using the Nemrodw software (2007), the optimal degradation conditions within the studied ranges were determined. The resulting regression equations for the photodegradation efficiencies of RhB and MO are:
YRhB (%) = 37.93 − 12.95 A + 9.15 B + 3.33 C + 7.09 D + 1.89 A2 − 4.362 B2 + 1.29 C2 + 0.204 D2 − 6.64 AB − 0.39 AC + 0.576 BC − 2.26 AD + 2.47 BD + 0.771 CD
YMO (%) = 13.7 − 8.5 A − 5.7 B + 1.4 C + 3.5 D + 3.5 A2 + 0.3 B2 + 0.8 C2 + 1.2 D2 + 5.7 AB − 0.5 AC − 0.2 BC − 1 AD − 1.7 BD + 0.6 CD
Analysis of variance (ANOVA) confirmed that the models are statistically significant and adequately reflect the relationship between the response and the independent variables. The adjusted and predicted regression coefficients show good agreement, with adjusted R2 = 0.862, R2 = 0.937 for RhB and adjusted R2 = 0.77, R2 = 0.89 for MO. In addition, the relevance of the linear (bA, bB, bC, and bD), quadratic (bA-A, bB-B, bC-C, and bD-D), and interaction terms (bA-B, bA-C, bA-D, bB-C, bB-D, and bC-D) was assessed based on the p-values derived from the ANOVA results (Table 3). A significant threshold of p < 0.05 was used to take into account the influence of each factor.
According to the p-value analysis for both RhB and MO: (i) the most statistically significant terms (p < 0.05) include the linear terms for pollutant concentration (A), pH (B)and irradiation time (D), the quadratic term of the pollutant concentration (A-A), and the interaction term A-B (concentration—pH); (ii) the linear terms catalyst mass (C) was also significant for RhB; (iii) in contrast, for MO, catalyst mass (C) did not show a significant individual impact, confirming the lesser influence of catalyst loading in the MO degradation mechanism; and (iv) interaction terms such as A-C, B-C and C-D, as well as the quadratic terms C-C, and D-D, were found to be statistically non-significant for both dyes. This statistical interpretation confirms that pH plays a central role in the photodegradation of both dyes, particularly through its interactions with concentration and time. The different significance patterns also support the observed contrast between MO and RhB behavior under varying experimental conditions.
The individual impact of each factor can be deduced from the sign of its linear coefficient. For RhB, degradation efficiency increases with lower initial pollutant concentration, higher pH, greater catalyst mass, and longer irradiation, as intuitively expected. In contrast, for MO, higher pollutant concentration and pH negatively impact degradation. Regarding interaction terms, significant synergies (whether positive or negative) highlight the complexity of the photocatalytic process. For RhB, antagonistic interactions are observed between concentration and pH (AB) and between concentration and time (AD), indicating that simultaneous increases or decreases in these variables tend to reduce the photocatalytic efficiency. Conversely, a positive synergy between pH and time is suggested by the positive coefficient of the BD interaction, combined with positive linear effects for both parameters. For MO, only one interaction is significant: A-B, which shows an antagonistic effect between pollutant concentration and time opposite to that observed for RhB.
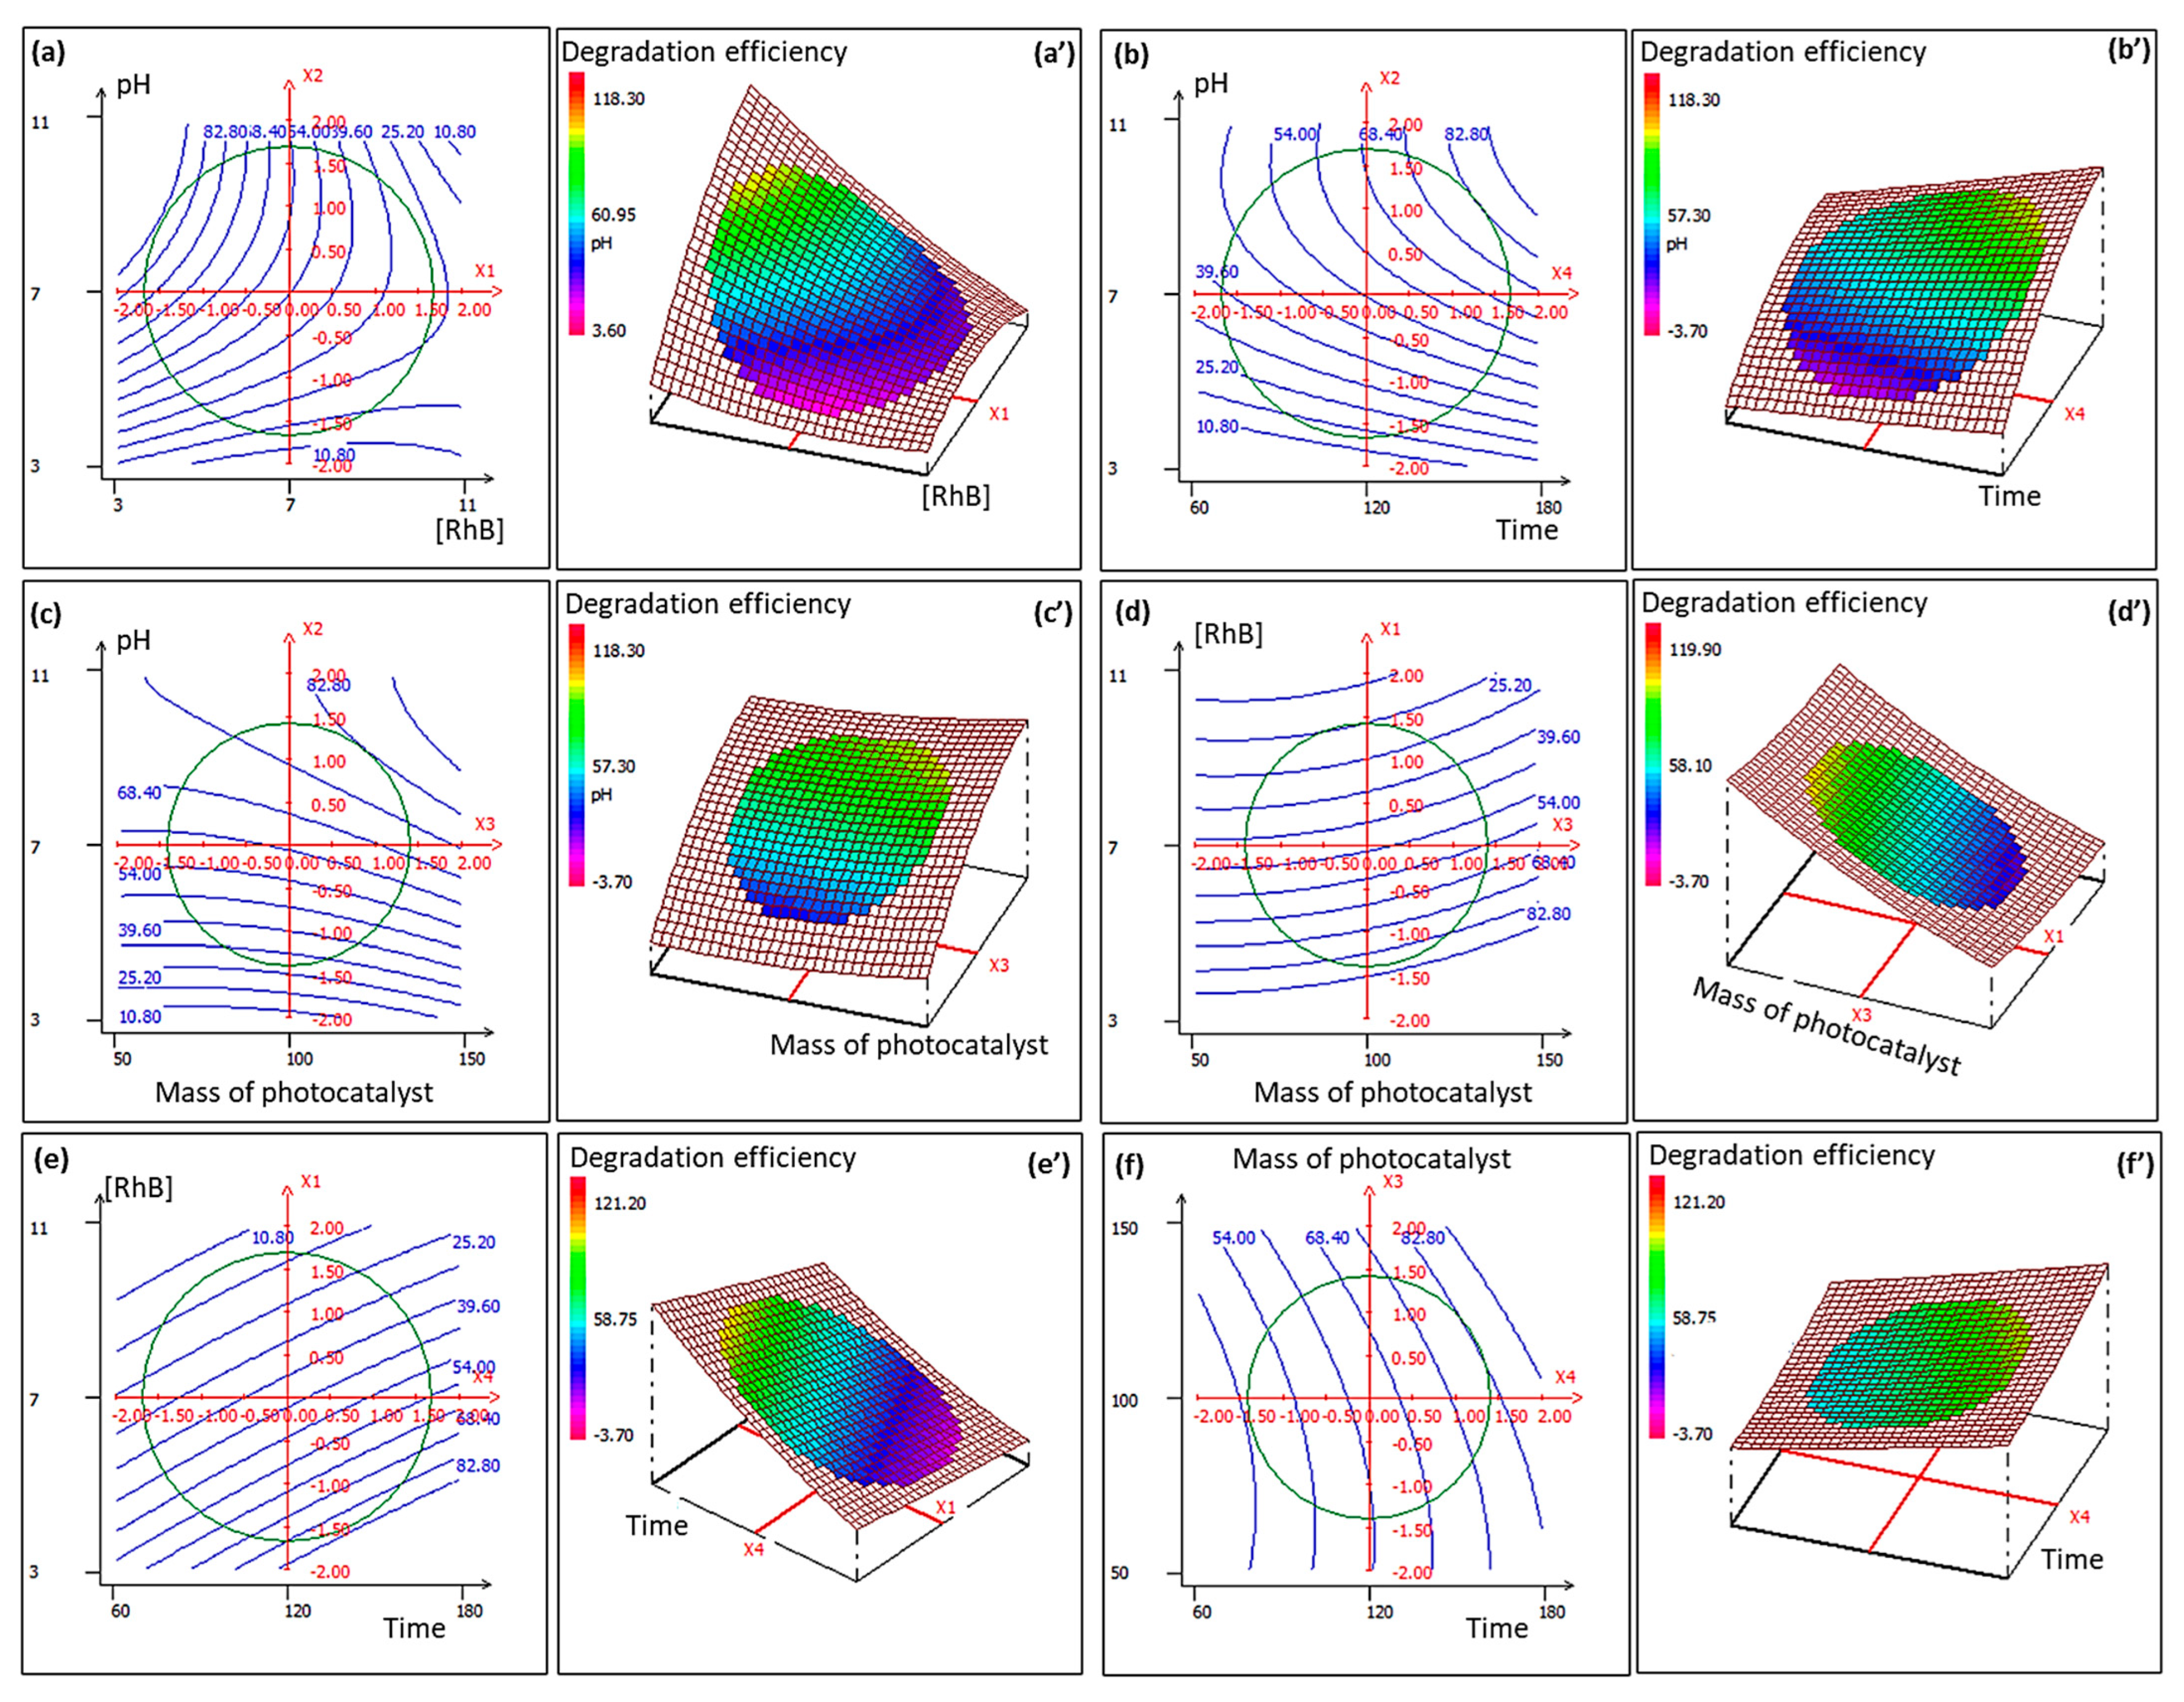
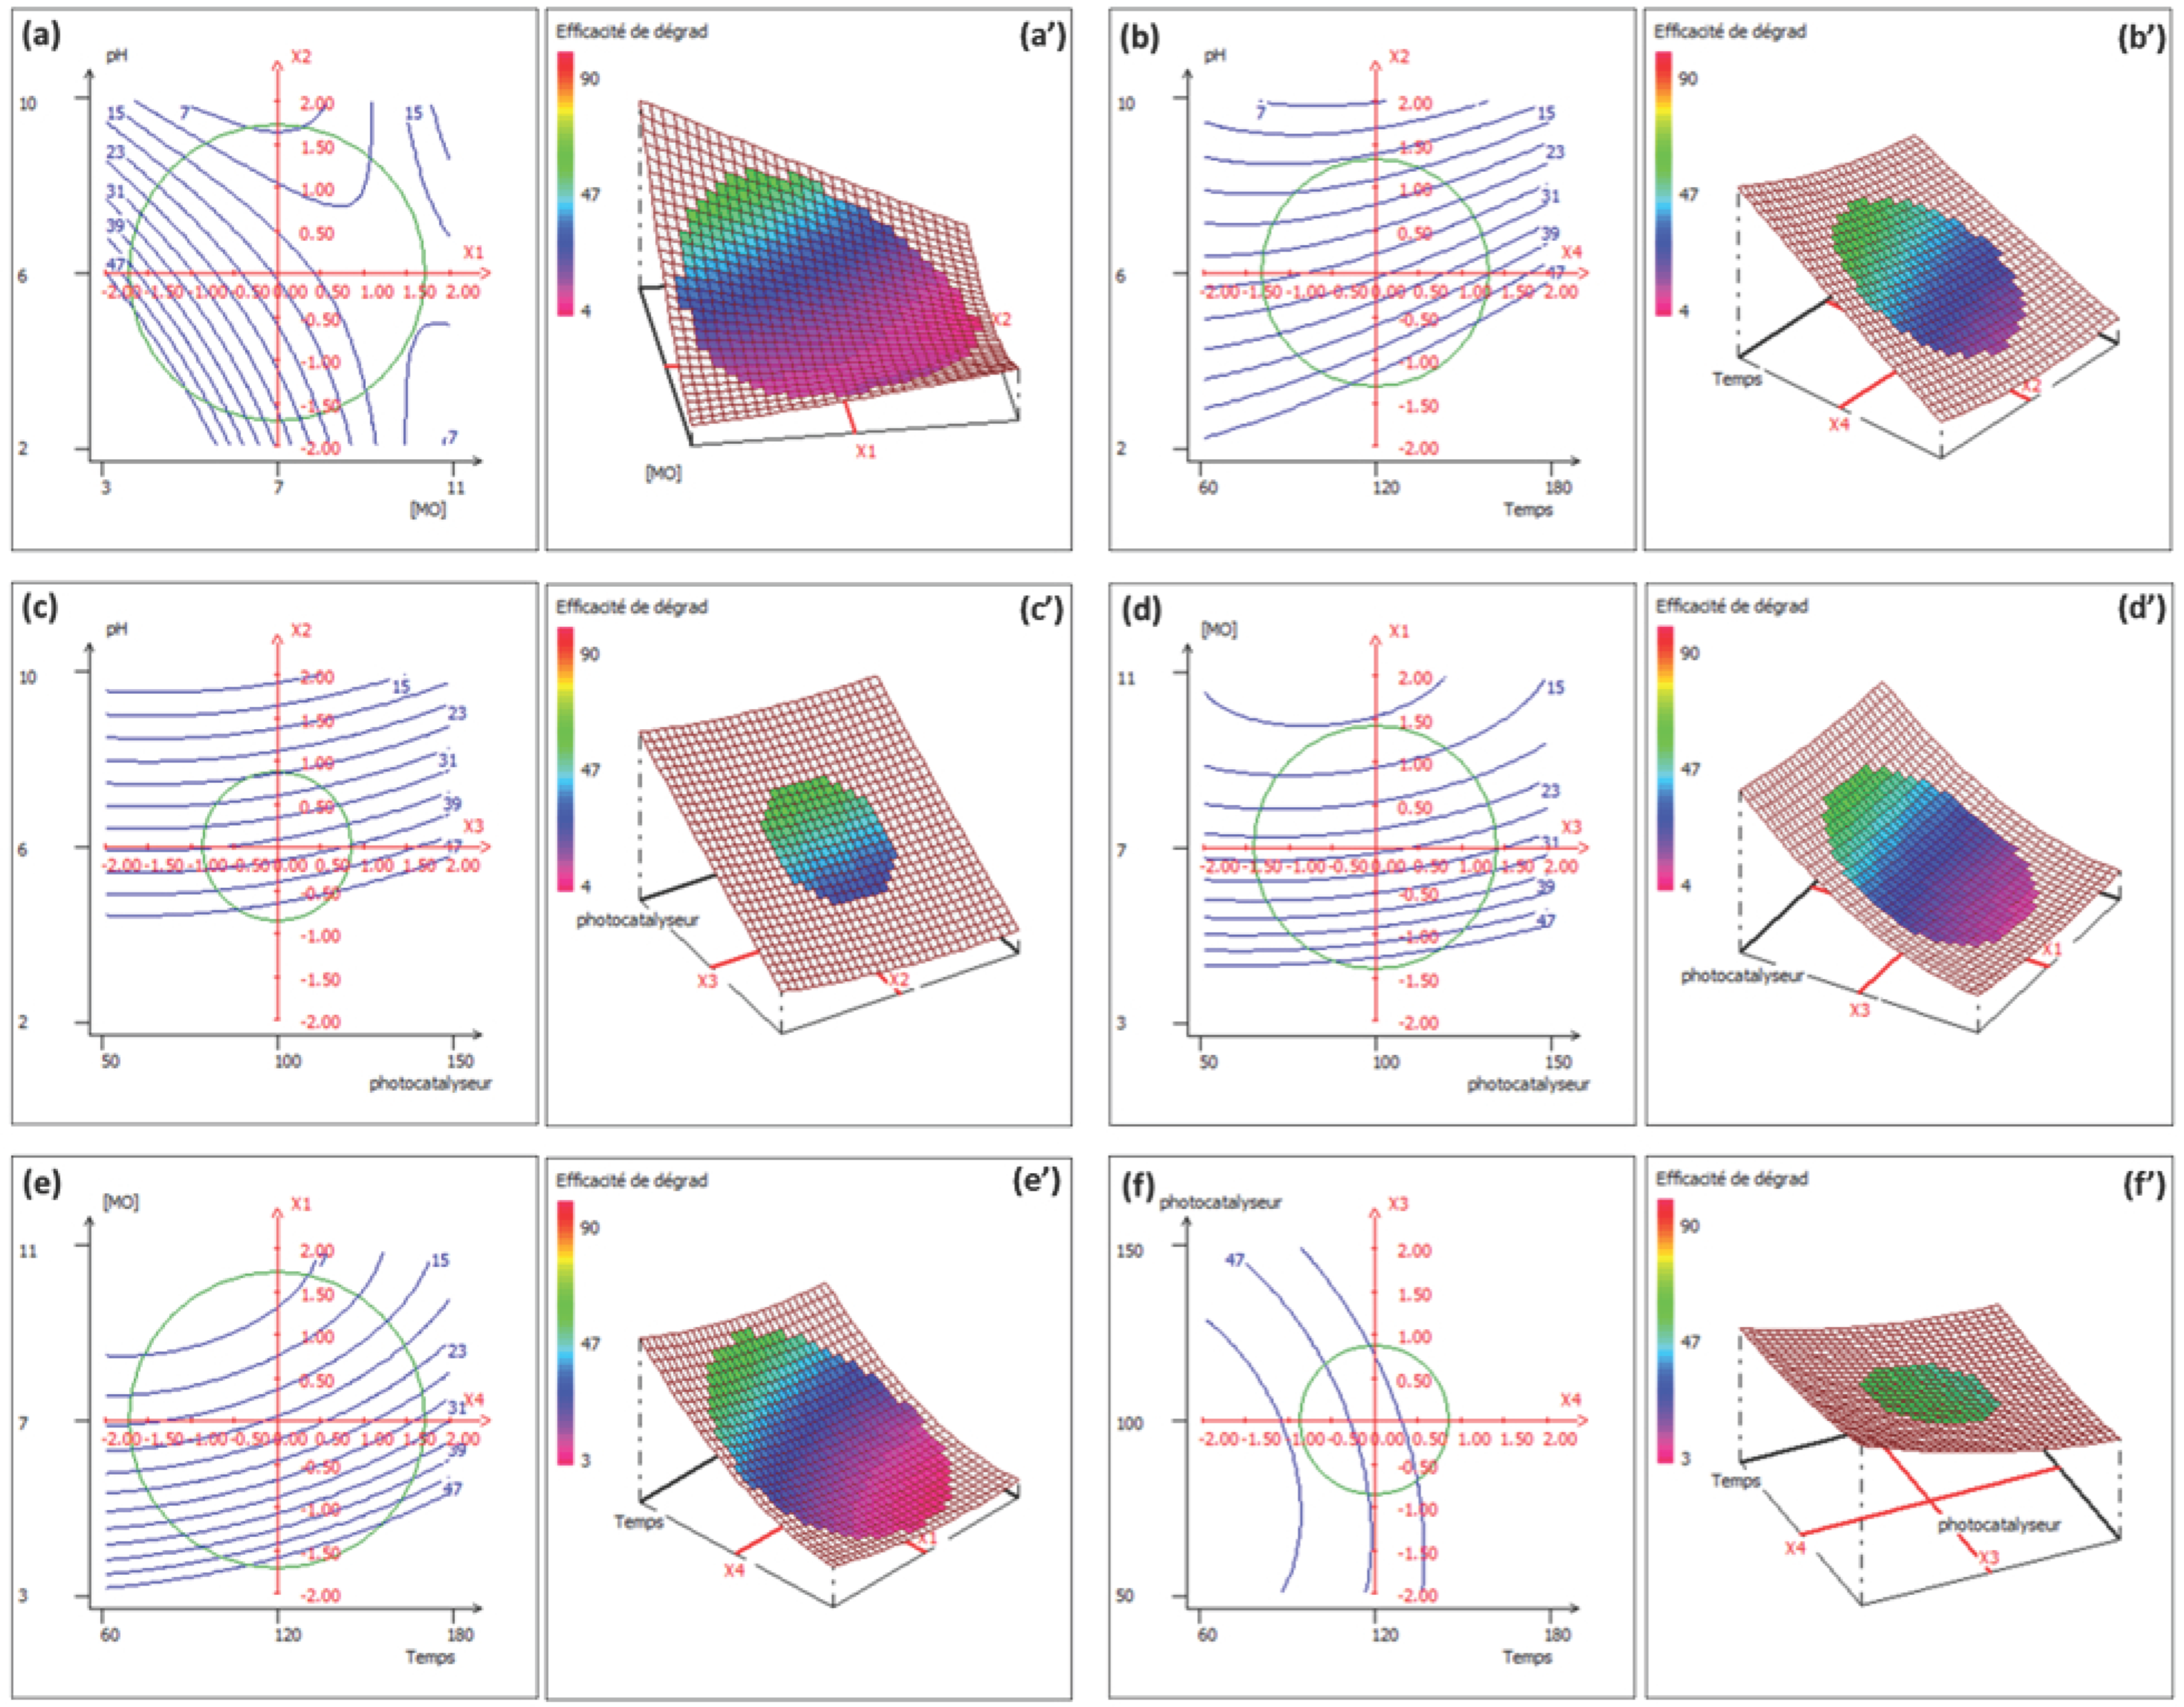
The fitted models were graphically visualized through 2D contour plots (Figure 5a–f and Figure 6a–f) and 3D response surfaces (Figure 5a’–f’ and Figure 6a’–f’). These representations illustrate the combined influence of variable pairs on degradation efficiency. For RhB (Figure 5), degradation is enhanced by high pH combined with low concentration or longer irradiation (Figure 5a,b), but also by low concentration and long irradiation time (Figure 5e). For MO (Figure 6), the combination of low pH and moderate concentration favors degradation, while prolonged irradiation has less impact.
Based on the RSM model, the optimized conditions predicted to yield maximum photodegradation are listed in Table 4. Under these optimal parameters, the model forecasts RhB degradation reaching 85% at 5 ppm, pH 9, catalyst mass of 110 mg, and 150 min irradiation, while MO degradation is predicted at 55% at 4 ppm and pH 4, with similar catalyst loading and exposure time.

2.5. Kinetic Study of the Photocatalytic Activity of the Compound CoVO

The photocatalytic efficiency of CoVO particles was obtained by decomposing two solutions of RhB and MO, under the optimum conditions previously defined by the RSM model (Table 4). Figure 7 shows the evolution of the visible absorption spectra of the RhB and MO solutions in the presence of CoVO particles over varying irradiation times. Figure 7a,b reveal that the absorption peaks decrease progressively over the 150 min of illumination. The photocatalytic Ct/C0 yield was 80% for RhB and 50% for MO, achieved with rate constants of 0.009 and 0.00146 min−1, respectively (Figure 7d,f).
The results of photocatalytic decomposition of dye-type organic pollutants show a strong dependence on the pH of the solutions. As already indicated, the efficiency of photo degradation is linked in particular to the state of charge of the surfaces, which allows better interaction between the radical species created on the surface of the material and the pollutant molecules. In this case, these interactions are conditioned by the pH at the catalyst’s zero charge point.
Figure 7g shows that the pH at the zero-charge point (pHpzc) of CoVO is equal to 5.6. The photocatalytic performance can be attributed to electrostatic interactions: at pH values above pHpzc (5.6), the negatively charged catalyst surface favors attraction with the cationic dye RhB, while at pH values below 5.6, the positively charged surface enhances interaction with the anionic dye MO.
The enhanced photocatalytic degradation of RhB compared to MO using CoVO can be ascribed to a number of key factors related to the physicochemical nature of these dyes and their interaction with the catalyst. Compared to other dyes, Rhodamine B (RhB) undergoes photocatalytic degradation more readily due to its relatively simple and highly π-conjugated molecular structure [47]. In contrast, Methyl Orange (MO) is an anionic azo dye containing a stable –N=N– azo bond, which is chemically more resistant and requires higher energy to cleave, making it less reactive under photocatalytic conditions [48]. Although both dyes were tested under optimal conditions, the results were better with rhodamine, which tends to prove that the photocatalyst reacts selectively.

2.6. Trapping Test and Recyclability

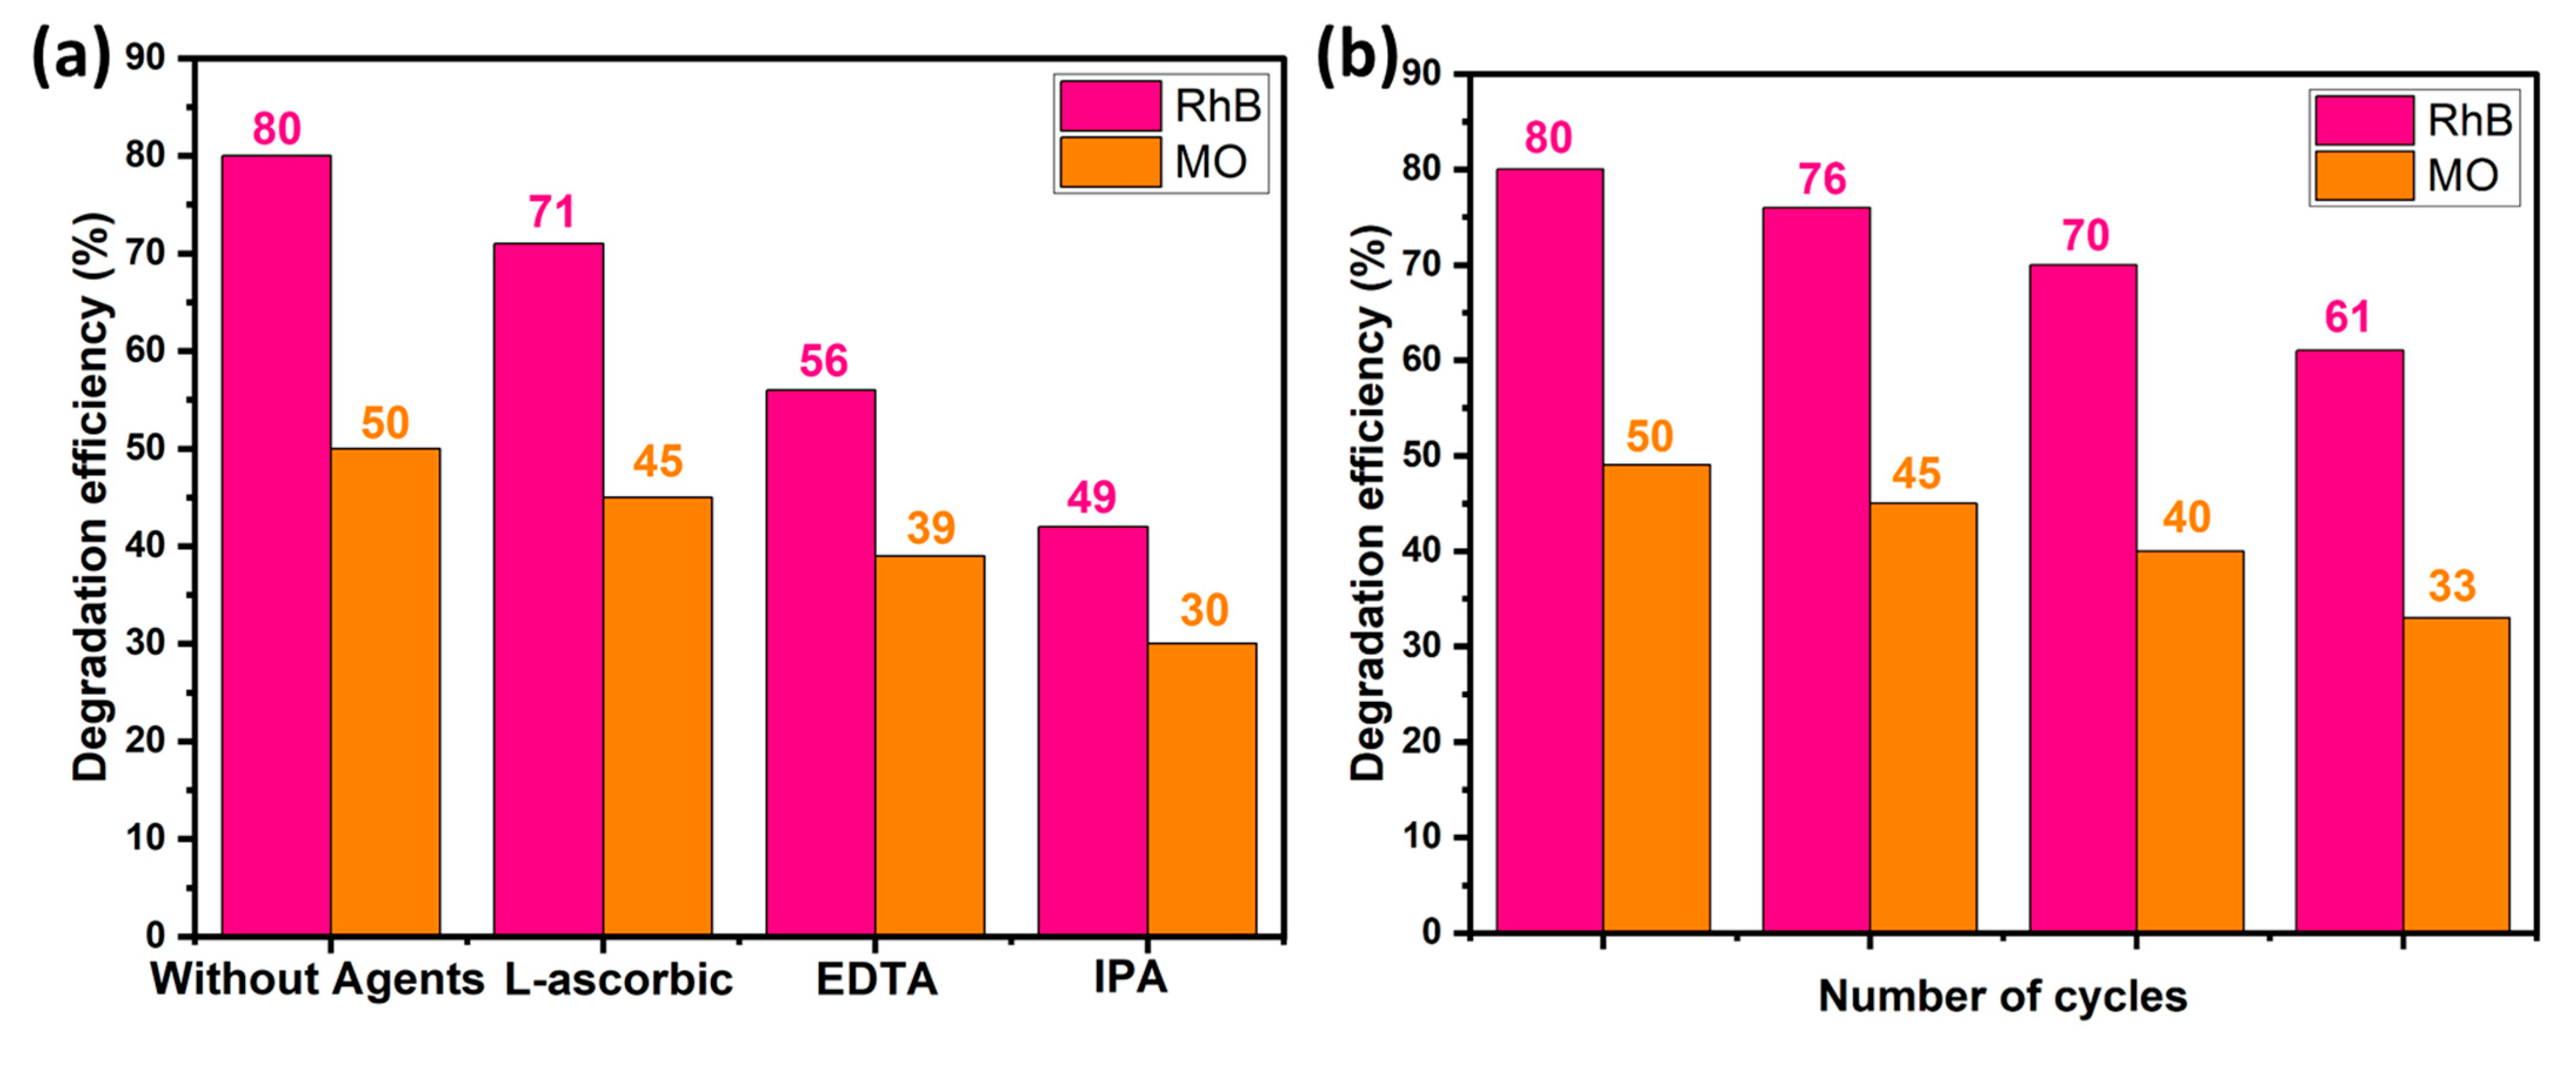
In order to get an idea of the radicals involved in the photodegradation of MO and RhB on the CoVO photocatalyst, Figure 8a presents the results of the scavenging tests (EDTA, L-asc, and IPA). This figure clearly shows that the addition of IPA and EDTA leads to a greater reduction in efficiency than the addition of ascorbic acid, indicating that OH hydroxyl radicals and h+ holes are the main agents in the photo-decomposition of MO and RhB, although O2•− superoxides make a limited contribution to the photocatalytic process. In addition, the stability of the CoVO photocatalyst was tested by reusing the catalyst after each photocatalytic degradation cycle. The data shown in Figure 8b reveal a reduction in photocatalytic activity after four consecutive cycles. A decrease of 61% and 33% is observed for RhB and MO, respectively.
The comparison with the literature results on the same type of material is summarized in Table 5, it highlights the novelty and effectiveness of our study. Unlike previous works, which often relied on additives like H2O2 or composite materials, our solvothermally synthesized CoV2O6 catalyst demonstrated competitive degradation efficiency without external agents. Moreover, the integration of RSM optimization, absent in earlier studies, provides an added strategic advantage in enhancing photocatalytic performance.

2.7. Breakdown Levels of Dye Decomposition by COD and TOC Analysis

The degradation pathways of organic contaminants into intermediate by-products may be estimated by analyzing the organic carbon (TOC) levels and oxygen consumption (COD) before and after photocatalysis reactions. This approach makes it possible to assess the mineralization of dyes. It should be noted that the reduction in TOC and COD corresponds to the reduction in organic carbon content, i.e. organic pollutants.
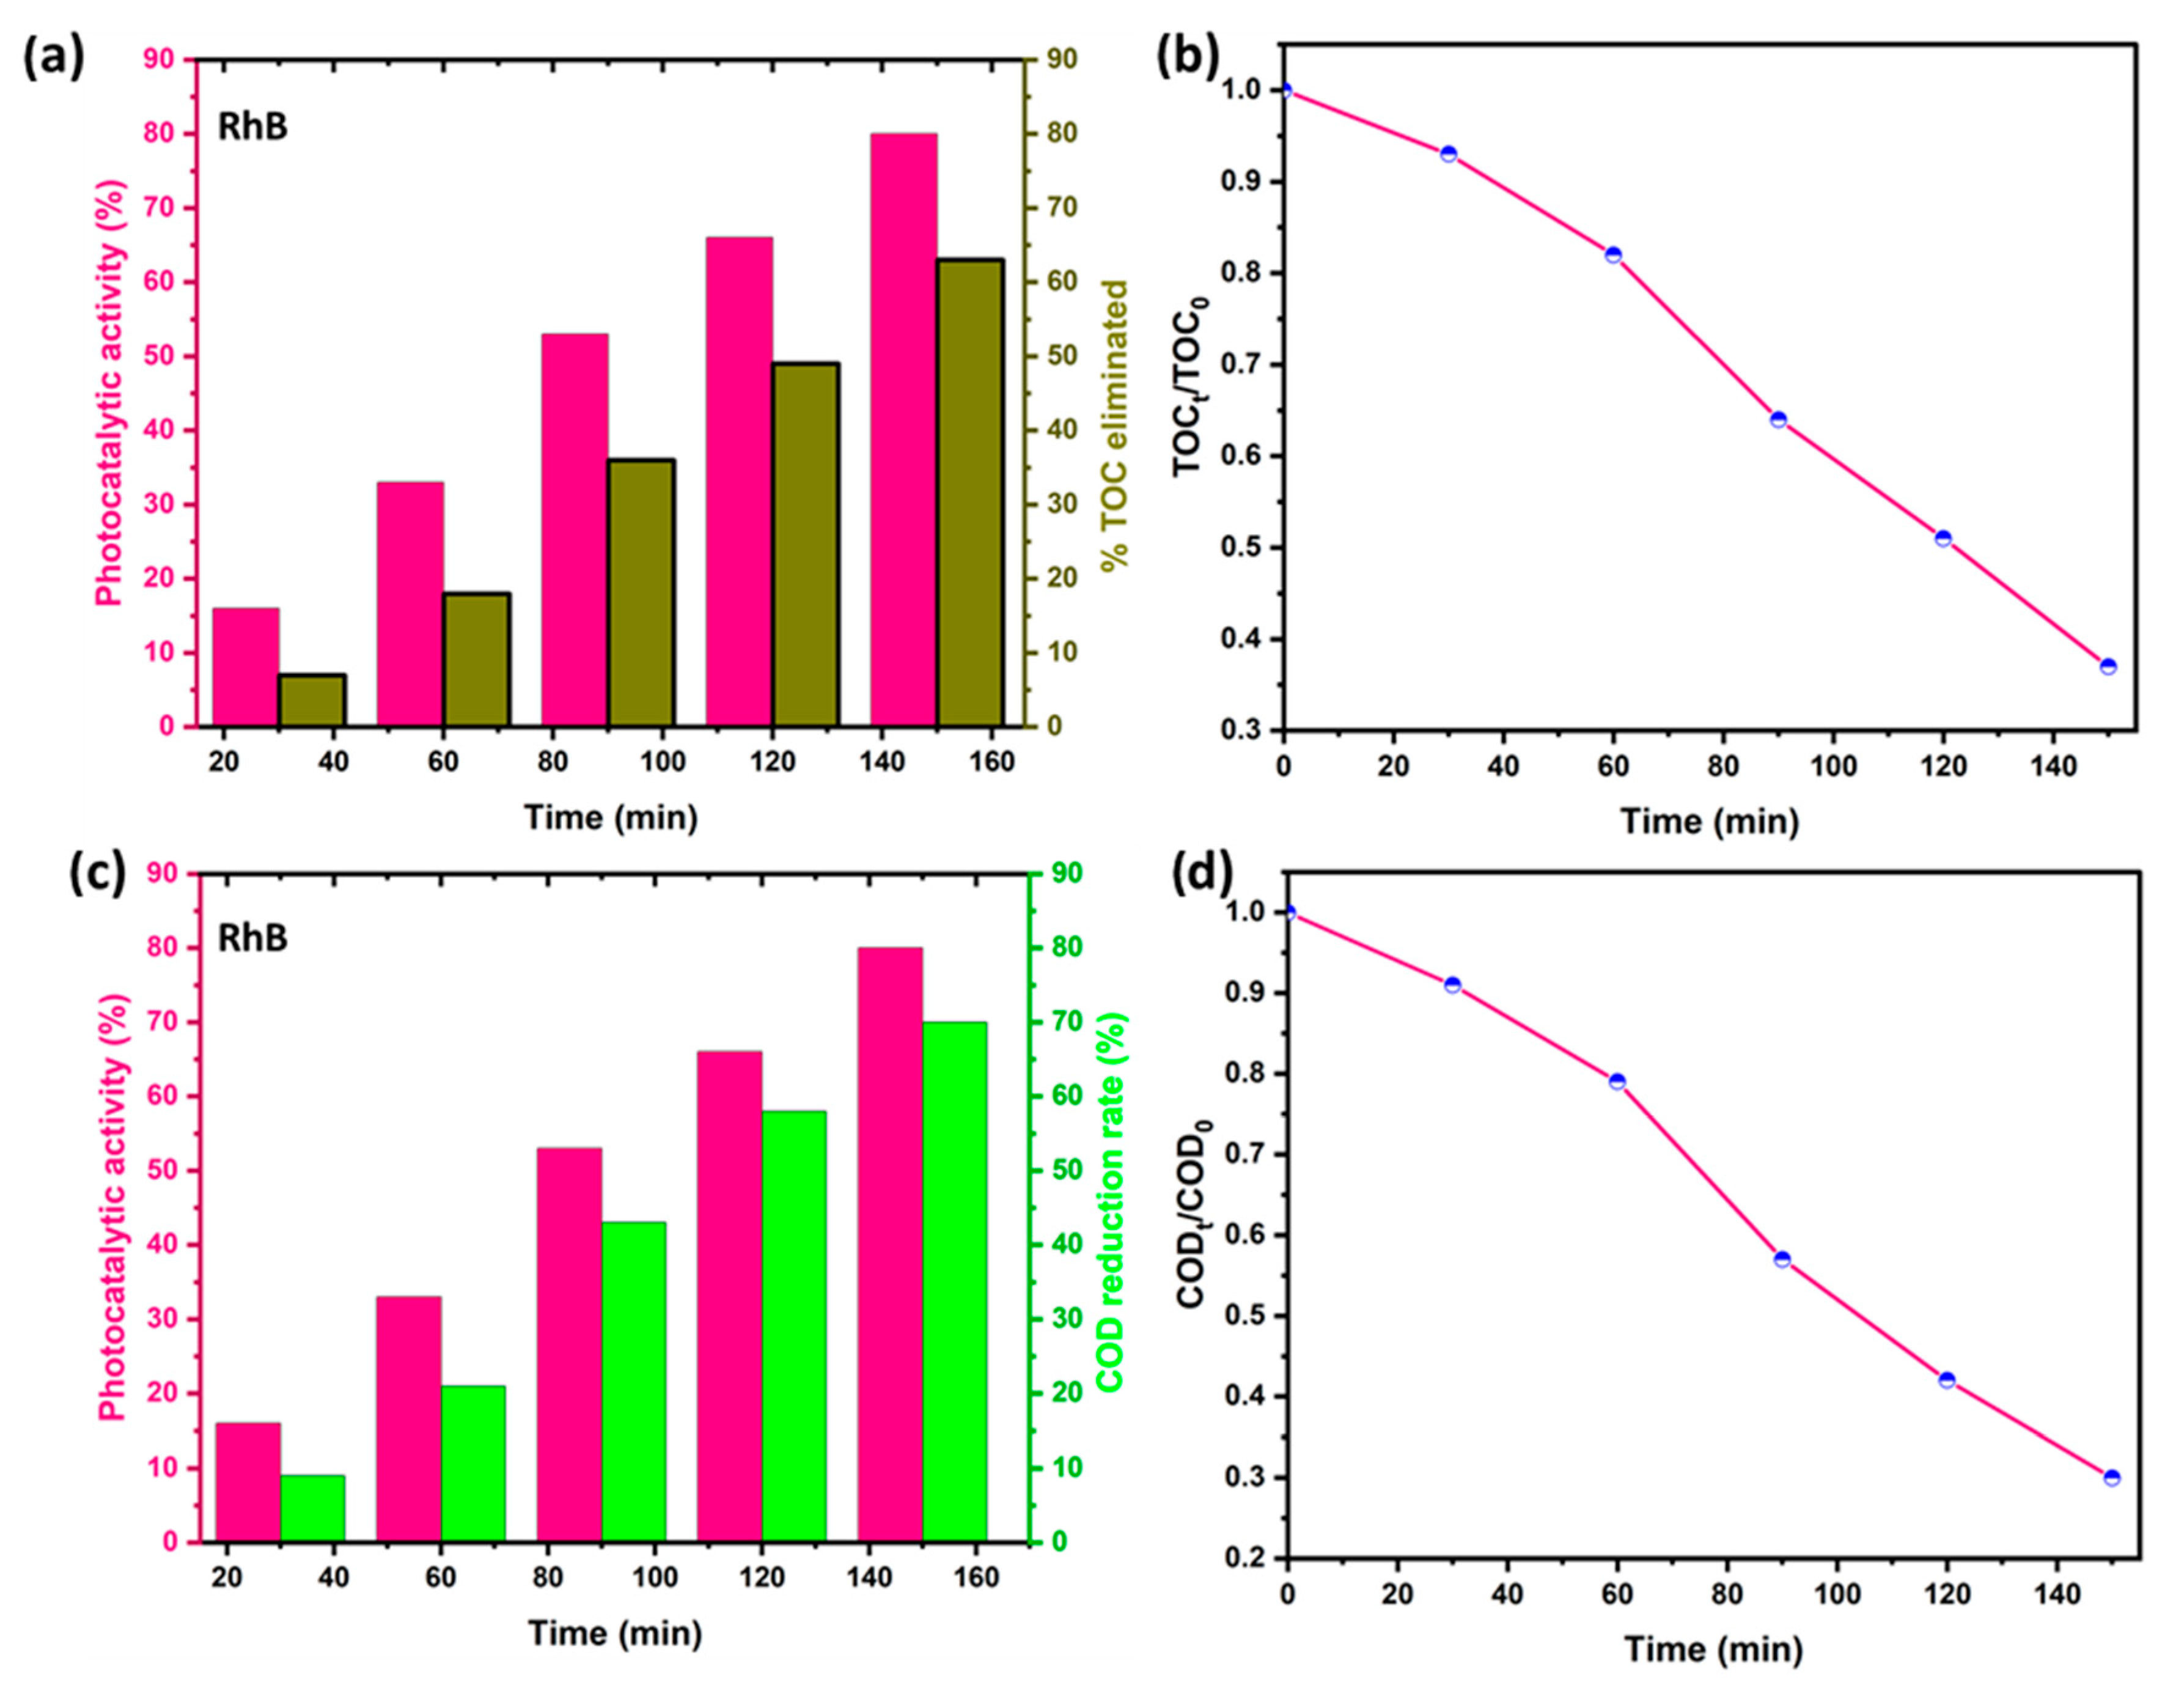
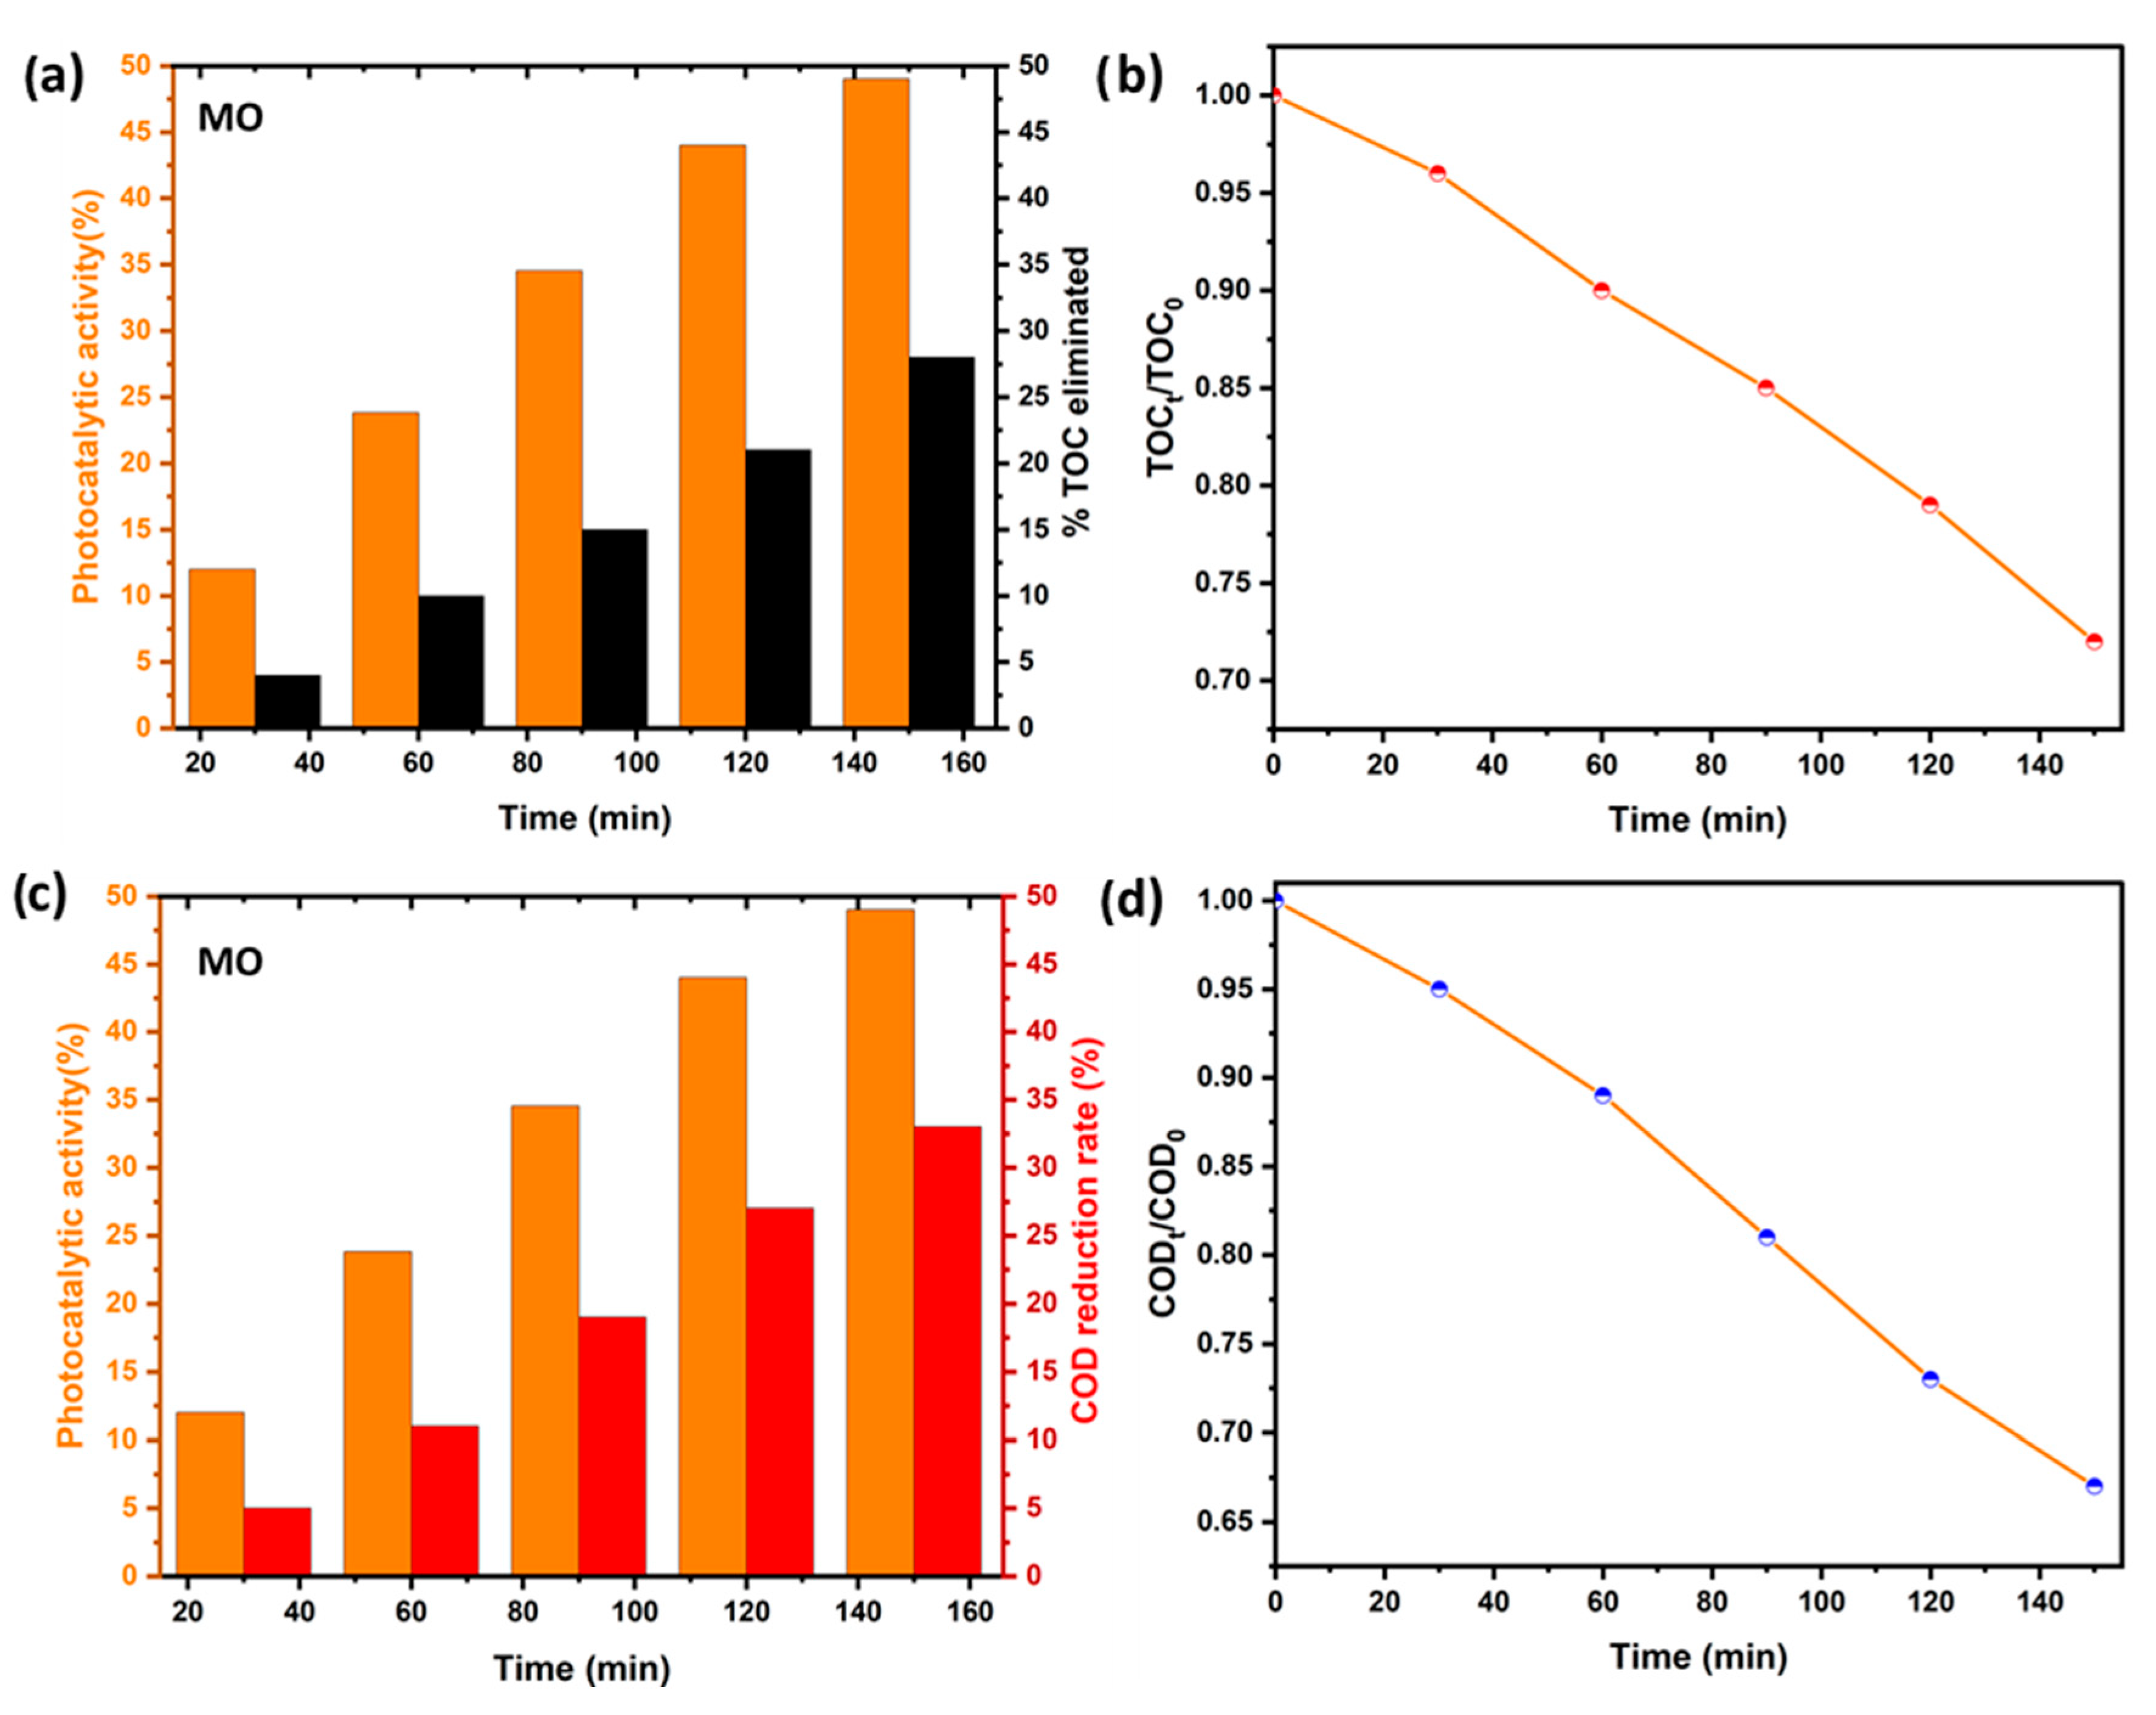
Figure 9 and Figure 10 show the organic carbon content TOC and the oxygen content COD consumed during the photo-decomposition of RhB and MO. Figure 9a,c and Figure 10a,c show clearly that the rate of organic carbon removal and the decrease in COD evolve in parallel with the photocatalytic activity. After 150 min of irradiation (Figure 9b and Figure 10b), the catalyst was able to remove 63% and 28% of the organic carbon present in the RhB and MO solutions, respectively. At the same time, the rate of COD evolution (Figure 9d and Figure 10d) was 70% for RhB and 33% for MO. These findings highlight the catalyst’s ability to promote not only dye degradation but also partial mineralization of the pollutants, with markedly higher efficiency observed for RhB compared to MO.

2.8. Proposed Mechanism for Photodegradation of RhB and MO on CoVO

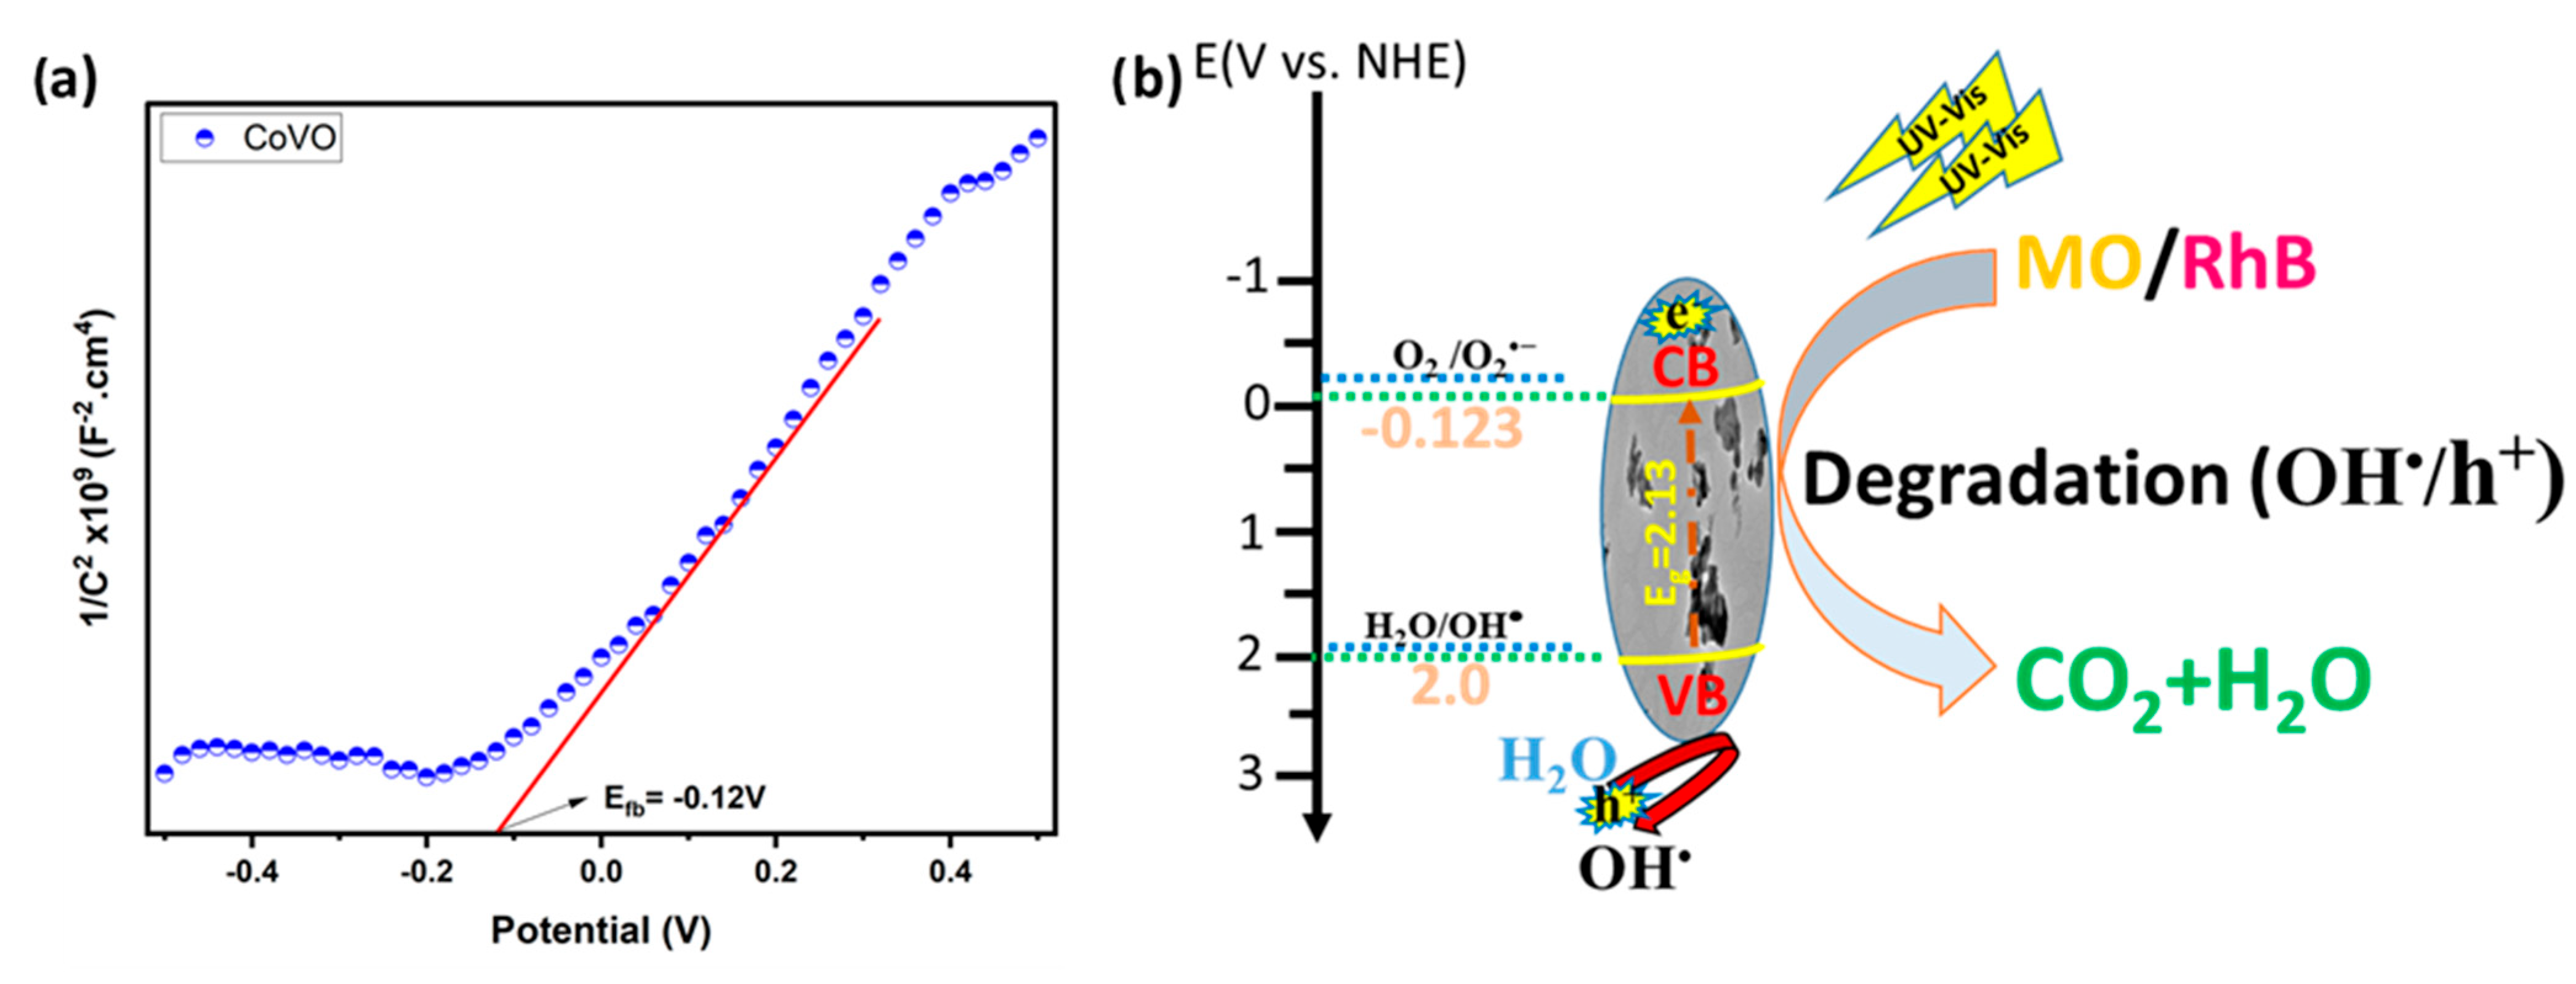
Photocatalytic decomposition generally takes place in an aqueous medium under irradiation. The necessary degradation elements, H2O and HO, are naturally available in the medium. The reaction of these elements with charge carriers, formed during irradiation of the photocatalyst, produces highly oxidizing species (such as OH radicals). Moreover, the action of these radicals is mainly linked to the energy of the edges of the conduction (EBC) and valence (EBV) bands, energy levels calculated following Mott–Schottky (MS) analyses. Figure 11a, representing the MS profile, for applied potentials greater than −0.22 V with respect to the AgCl/Ag electrode, shows a positive slope which indicates that the CoVO produced is an n-type semiconductor. The value of the flat band potential (Vfb) corresponds to the point of intersection of the linear part of the MS plots with the x-axis, which gives a value of −0.12 V with respect to the AgCl/Ag electrode. Moreover, the normal hydrogen electrode (NHE) potential of the CoVO particles can be calculated by EAg/AgCl = ENHE − 0.197. The photocatalyst band structure can be determined by applying the following equations [51]:
E C B = V f b 0.2 V
E g = E V B E C B
Combined bandgap value and flat band potential. The EBC value is 0.077 V relative to the Ag/AgCl electrode and −0.123 V relative to the NHE reference.
The EBV is therefore determined on the basis of the EBC and Eg values and is 2.0 V relative to NHE. The energy diagram Figure 11b, shows that the ECB potential is more positive than the potential of the O2/O2•− redox couple so the O2•− species cannot be formed by reduction of dissolved oxygen at the conduction. Moreover, as the EBV potential is more positive than the potential of the H2O/OH•− redox couple, this favors the creation of OH species. In summary, only hydroxyl radicals (R2) contribute to the degradation of MO and RhB according to the position of the energy levels in the CoVO band structure.
Figure 11b schematically summarizes the photocatalytic decomposition mechanism with the various possible reactions, from R1 to R4.
CoVO + hv → CoVO (h+, e)
H2O + h+ → OH + H+
h+ + (RhB, MO) → Oxidation products
(MO, RhB) + (OH/h+) → CO2 + H2O

3. Experimental Section

3.1. Materials and Reagents

The reagents used for the synthesis of the CoV2O6 photocatalyst included cobalt acetylacetonate (Co(C5H7O2)2, 99.9%, Sigma-Aldrich, Saint-Quentin-Fallavier, France), vanadyl acetylacetonate (C10H14O5V, 99.5%, ACROS Organics), ethylene glycol, glycerol, and isopropanol (IPA, 99.9% Sigma-Aldrich). Additional reagents used in trapping experiments were ethylenediaminetetraacetic acid disodium salt (EDTA, 99.8%, Sigma-Aldrich), L-ascorbic acid (99.9%, Sigma-Aldrich), and isopropanol. All chemicals were used as received without further purification. A 45 mL Teflon-lined stainless-steel autoclave was used for the solvothermal synthesis.

3.2. Synthesis of CoV2O6

CoV2O6 was synthesized via a solvothermal method followed by thermal treatment, as illustrated in Figure 12. Typically, 0.6 g of cobalt acetylacetonate Co(C5H7O2)2 and 0.4 g of vanadyl acetylacetonate C10H14O5V were dispersed in 27 mL of ethylene glycol under magnetic stirring for 20 min. Subsequently, 3 mL of glycerin was added to the mixture. The resulting suspension was transferred into a 45 mL Teflon-lined autoclave and heated at 200 °C for 24 h. After cooling to room temperature, the obtained grey precipitate was washed several times with deionized water and absolute ethanol, before drying in an oven at 60 °C for 12 h. Finally, the dried powder was calcined at 500 °C for 3 h in air to obtain CoVO photocatalyst.

3.3. Material Characterizations

The crystalline structure of CoVO was analyzed using XRD with an EMPYREAN Panalytical diffractometer which is instrumented with a copper X-ray source (λ(Kα) = 1.5440 Å) and a Ni filter to eliminate Kβ radiation. The scan angle range was 10 – 80° with a step size of 0.026 degrees and a scan speed of 0.001 degrees per second. Raman spectra were recorded at room temperature using a RENISHAW spectrometer equipped with a 633 nm laser and an exposure time of 30 s to probe the vibrational modes. The morphology of the synthesized CoVO was investigated via scanning electron microscopy (SEM, Supra 40 VP Gemini Zeiss operated at 5 kV) and transmission electron microscopy (TEM, Tecnai G2 operating at 200 kV), complemented by selected area electron diffraction (SAED) analysis. UV–Visible diffuse reflectance spectroscopy (DRS) was conducted in the 200–800 nm range using a Shimadzu UV-1800 spectrophotometer to determine the optical properties and band gap energy of CoVO. Mott–Schottky experiments were also conducted to measure the electrochemical capacitance of the photocatalyst versus the applied potential at a fixed frequency of 500 Hz. Plotting the inverse square of the capacitance against the applied potential enabled the flat-band potential and charge carrier density to be extracted, providing valuable insight into the semiconductor-type behavior of the CoVO3 oxide.
Photoluminescence (PL) and time-resolved fluorescence emission decay (TRFL) measurements were carried out using a Fluoromax (Horiba) fluorescence spectrophotometer. The charge carrier lifetime was calculated by fitting the TRFL decay curves to a bi-exponential function [52].
I t = I 1 e ( t / τ 1 ) + I 2 e ( t / τ 2 )
The average lifetime, τmoy, was determined using:
τ m o y = I 1 τ 1 2 + I 2 τ 2 2 I 1 τ 1 + I 2 τ 2
where I1 and I2 refer to the intensities at various times, and τ1 and τ2 refer to their respective lifetimes.
X-ray photoelectron spectroscopy (XPS) measurements, including both survey and high-resolution spectra, were performed using a spectrometer equipped with a concentric hemispherical analyzer.

3.4. Point of Zero Charge Determination

The point of zero charge (pHpzc), defined as the pH at which the surface charge is zero, was determined following the method described by Al-Harahsheh [41]. Briefly, 0.05 g of CoVO was dispersed in six different beakers each containing 50 mL of 0.1 M KNO3 solution. The initial pH values were recorded, then adjusted to 2.2, 4.1, 6.2, 8.2, 10.1, and 12.1 using 0.1 M nitric acid (HNO3) or 0.1 M sodium hydroxide (NaOH). The suspensions were stirred for 24 h before recording the final pH values.

3.5. CCD-RSM Design and Data Analysis

To optimize the photocatalytic degradation conditions, central composite design (CCD) under the response surface methodology (RSM) framework was applied [53,54]. Four key independent variables—dye concentration, pH, catalyst loading, and irradiation time—were selected based on prior knowledge and preliminary experiments (see Table 1 and Table 2). The design matrix and response data were processed using NemrodW 2007 software. The total number of experiments (N) was calculated as:
N = 2k + 2k + C0
where k is the number of parameters (k = 4) and C0 is the number of repetitions at the center.
The photocatalytic response (i.e., RhB degradation efficiency) was modeled using a second-order polynomial equation:
Ŷ = b 0 + i = 1 k b i X i + i = 1 k b i i X i 2 + i = 1 k 1 j = i + 1 k b i j X i X j + ε
where Ŷ is the predicted response, Xi and Xj are the coded values of the factors, b0, bi, bii, and bij are the regression coefficients for the, linear intercept, quadratic and interactions between the input factors, respectively.

3.6. Photocatalytic Procedure

Photocatalytic activity was evaluated using RhB and MO dye solution under visible light irradiation. In a typical experiment, CoVO was dispersed in the dye solution and sonicated for 10 min, followed by stirring in the dark for 1 h to establish adsorption–desorption equilibrium. Irradiation was carried out without an AM 1.5 G filter and using Philips lamps (300 W) emitting primarily in the visible range, with minor UVA (13.6 W) and UVB (3.0 W) contributions. At designated intervals, 3 mL of the suspension was withdrawn, centrifuged at 13,400 rpm for 10 min, and the supernatant analyzed using a Shimadzu UV 2600 spectrophotometer in the 400–800 nm range. Radical trapping experiments were conducted using EDTA, L-ascorbic acid, and isopropanol. EDTA scavenges the holes, L-ascorbic acid the superoxide radicals, and isopropanol the hydroxyl radicals to identify the main active species involved in the degradation process.

3.7. Total Organic Carbon (TOC) and Chemical Oxygen Demand (COD)

To assess the mineralization degree of RhB and MO, TOC and COD measurements were conducted. TOC was analyzed using a Shimadzu TOC-L Series analyzer with a non-dispersive infrared detector. Calibration was performed using potassium hydrogen phthalate as standards. TOC removal was calculated using:
T O C % = T O C 0 T O C t T O C 0 100
where TOC0 and TOCt are the TOC values before illumination (but after adsorption–desorption equilibrium) and after irradiation time t.
COD was determined using a Lovibond COD kit and measured with a MD 200 COD spectrophotometer. The degradation efficiency was calculated by:
C O D % = C O D 0 C O D t C O D 0 100
where COD0 and CODt are the initial and t time COD values (mg/L of O2), respectively.

4. Conclusions

In summary, the synthesized CoVO material exhibited a monoclinic crystal system and an optical band gap energy of 2.13 eV, making it suitable for visible-light-driven applications. XPS analysis confirmed the successful incorporation of cobalt, vanadium, and oxygen elements within the structure. Morphological characterization by SEM and TEM revealed that the particles obtained had no defined or uniform shape, indicating a high degree of structural irregularity. The ANOVA results demonstrated that the quadratic model used in the response surface methodology (RSM) was statistically significant, with a p-value < 0.05, validating the reliability of the optimization process. Under optimal conditions, the photocatalytic degradation efficiency reached 80% for RhB and 50% for MO, highlighting the higher reactivity of CoVO toward cationic dyes. Radical scavenging tests further revealed that hydroxyl radicals and photogenerated holes were the primary active species involved in the RhB degradation pathway. By applying RSM, we successfully identified the optimal reaction conditions needed to maximize pollutant degradation efficiency, representing a significant advancement in the design of high-performance and environmentally friendly photocatalytic water treatment technologies.

Author Contributions

Conceptualization, Investigation, Supervision, Writing—review and editing, M.A. and H.A.A.; Investigation, Data curation, Formal analysis, writing original draft preparation, M.E.O.; Investigation, Writing—review and editing, V.M., V.C., A.B., M.S. and H.H. All authors have read and agreed to the published version of the manuscript.

Funding

This study is supported by the Departmental Council of Var (CD83), the urban community of Toulon Provence Mediterranean (TPM) and University of Toulon for their financial supports in the framework of the “NanoCat”-“Disolar, Acte n°: CO 2023-1273” and “NSPEC, TPM, Acte N° 24/150” projects. János Bolyai Research Fellowship of the Hungarian Academy of Sciences (BO/682/22), TKP2021-NVA-19 project, under the TKP2021-NVA funding scheme. Project no. RRF-2.3.1–21-2022-00009 (National Laboratory for Renewable Energy) was funded by the Recovery and Resilience Facility of the European Union within the framework of Programme Széchenyi Plan Plus. Project (PNURSP2025R230) supported by at Princess Nourah bint Abdulrahman University, Riyadh, Saudi Arabia.

Institutional Review Board Statement

Not applicable.

Informed Consent Statement

Not applicable.

Data Availability Statement

Data will be made available on request.

Acknowledgments

The authors gratefully acknowledge the Departmental Council of Var (CD83), the urban community of Toulon Provence Mediterranean (TPM) and University of Toulon for their financial supports in the framework of the “NanoCat”, “Disolar” and “NSPEC” projects. H. Haspel gratefully acknowledges financial support from the János Bolyai Research Fellowship of the Hungarian Academy of Sciences. H. Haspel expresses gratitude for funding received through projects K 21 138714 and SNN_135918 supported by the National Research, Development and Innovation Fund. Support from the Ministry for Innovation and Technology, is also acknowledged. The project received funding from the HUN-REN Hungarian Research Network. A. Baqai gratefully acknowledges the support of the Researchers Supporting Project at Princess Nourah bint Abdulrahman University, Riyadh, Saudi Arabia.

Conflicts of Interest

The authors declare no conflicts of interest.

References

  1. El Allaoui, B.; Benzeid, H.; Zari, N.; el kacem Qaiss, A.; Bouhfid, R. Cellulose Beads Supported CoFe2O4: A Novel Heterogeneous Catalyst for Efficient Rhodamine B Degradation via Advanced Oxidation Processes. Int. J. Biol. Macromol. 2023, 259, 128893. [Google Scholar] [CrossRef] [PubMed]
  2. El Aouni, A.; El Ouardi, M.; Arab, M.; Saadi, M.; Haspel, H.; Kónya, Z.; Ben Ali, A.; Jada, A.; BaQais, A.; Ait Ahsaine, H. Design of Bismuth Tungstate Bi2WO6 Photocatalyst for Enhanced and Environmentally Friendly Organic Pollutant Degradation. Materials 2024, 17, 1029. [Google Scholar] [CrossRef]
  3. Teh, C.Y.; Budiman, P.M.; Shak, K.P.Y.; Wu, T.Y. Recent Advancement of Coagulation–Flocculation and Its Application in Wastewater Treatment. Ind. Eng. Chem. Res. 2016, 55, 4363–4389. [Google Scholar] [CrossRef]
  4. Asghari, A.; Hemati, M.; Ghaedi, M.; Rajabi, M.; Mirtamizdoust, B. Ultrasonic Assisted Adsorption of Basic Dyes from Binary Component Systems onto ZnO Nanoparticles Loaded on Activated Carbon Derived from Almond Shell: Optimization by Central Composite Design. J. Nanostructures 2014, 4, 17–30. [Google Scholar] [CrossRef]
  5. Dardari, O.; El Idrissi, A.; El Ouardi, M.; Channab, B.-E.; Layachi, O.A.; Farsad, S.; Marrane, S.E.; Mazkad, D.; BaQais, A.; Arab, M.; et al. Polyester Fabric Supported Graphene Oxide/Cu-Ag Bimetallic Nanoparticles as a “Dip Catalyst” for the Reduction of p-Nitrophenol and Organic Dyes. Colloids Surf. A Physicochem. Eng. Asp. 2024, 697, 134314. [Google Scholar] [CrossRef]
  6. Elaadssi, Y.; Madigou, V.; Arab, M. Cobalt Ferrites CoxFe3-xO4 (x = 1 and x = 1.5) as Photocatalysts under Simulated Sunlight: An Experimental Study Coupled to Predictive RSM Approach. Surf. Interfaces 2025, 68, 106655. [Google Scholar] [CrossRef]
  7. Chakravorty, A.; Roy, S. A Review of Photocatalysis, Basic Principles, Processes, and Materials. Sustain. Chem. Environ. 2024, 8, 100155. [Google Scholar] [CrossRef]
  8. Beil, S.B.; Bonnet, S.; Casadevall, C.; Detz, R.J.; Eisenreich, F.; Glover, S.D.; Kerzig, C.; Næsborg, L.; Pullen, S.; Storch, G.; et al. Challenges and Future Perspectives in Photocatalysis: Conclusions from an Interdisciplinary Workshop. JACS Au 2024, 4, 2746–2766. [Google Scholar] [CrossRef] [PubMed]
  9. Lee, D.-E.; Kim, M.-K.; Danish, M.; Jo, W.-K. State-of-the-Art Review on Photocatalysis for Efficient Wastewater Treatment: Attractive Approach in Photocatalyst Design and Parameters Affecting the Photocatalytic Degradation. Catal. Commun. 2023, 183, 106764. [Google Scholar] [CrossRef]
  10. El Ouardi, M.; Arab, M.; Saadi, M.; BaQais, A.; Ait Ahsaine, H. Vanadate-Based Photocatalytic Materials: A Perspective on Synthesis Approaches and Pollutants Photocatalytic Degradation. Nano Mater. Sci. 2024. [Google Scholar] [CrossRef]
  11. He, Y.; Cai, J.; Zhang, L.; Wang, X.; Lin, H.; Teng, B.; Zhao, L.; Weng, W.; Wan, H.; Fan, M. Comparing Two New Composite Photocatalysts, t-LaVO4/g-C3N4 and m-LaVO4/g-C3N4, for Their Structures and Performances. Ind. Eng. Chem. Res. 2014, 53, 5905–5915. [Google Scholar] [CrossRef]
  12. Jenifer, A.; Sriram, S. Enhanced Photocatalytic Organic Dye Degradation Activities of Pristine and Zn-Doped V2O5 Nanoparticles. Appl. Surf. Sci. 2023, 611, 155629. [Google Scholar] [CrossRef]
  13. Channab, B.-E.; Ouardi, M.E.; Layachi, O.A.; Marrane, S.E.; Idrissi, A.E.; BaQais, A.A.; Ahsaine, H.A. Recent Trends on MIL-Fe Metal-Organic Frameworks: Synthesis Approaches, Structural Insights, and Applications in Organic Pollutant Adsorption and Photocatalytic Degradation: A Review. Environ. Sci. Nano 2023, 10, 2957–2988. [Google Scholar] [CrossRef]
  14. Elaouni, A.; Ouardi, M.E.; Zbair, M.; BaQais, A.; Saadi, M.; Ahsaine, H.A. ZIF-8 Metal Organic Framework Materials as a Superb Platform for the Removal and Photocatalytic Degradation of Organic Pollutants: A Review. RSC Adv. 2022, 12, 31801–31817. [Google Scholar] [CrossRef]
  15. Mukherjee, A.; Dhak, P.; Hazra, V.; Goswami, N.; Dhak, D. Synthesis of Mesoporous Fe/Al/La Trimetallic Oxide for Photodegradation of Various Water-Soluble Dyes: Kinetic, Mechanistic, and pH Studies. Environ. Res. 2023, 217, 114862. [Google Scholar] [CrossRef]
  16. Meena, P.L.; Poswal, K.; Surela, A.K.; Saini, J.K. Synthesis of Graphitic Carbon Nitride/Zinc Oxide (g-C3N4/ZnO) Hybrid Nanostructures and Investigation of the Effect of ZnO on the Photodegradation Activity of g-C3N4 against the Brilliant Cresyl Blue (BCB) Dye under Visible Light Irradiation. Adv. Compos. Hybrid. Mater. 2022, 6, 16. [Google Scholar] [CrossRef]
  17. Chen, C.; Wang, Y.; Yi, Z.; Wang, S.; Ma, J.; Gao, H.; Wu, X.; Liu, G.; Yang, H. PH-Induced Structural Evolution, Photodegradation Mechanism and Application of Bismuth Molybdate Photocatalyst. Adv. Powder Technol. 2022, 33, 103858. [Google Scholar] [CrossRef]
  18. Mgidlana, S.; Nyokong, T. Asymmetrical Zinc (II) Phthalocyanines Cobalt Tungstate Nanomaterial Conjugates for Photodegradation of Methylene Blue. J. Photochem. Photobiol. A Chem. 2021, 418, 113421. [Google Scholar] [CrossRef]
  19. Sasikumar, K.; Rajamanikandan, R.; Ju, H. Z-Scheme Charge Transfer Heterostructure with NiV2O6@gC3N4 Nanocomposite: A Competent Photocatalyst for Boosting the Photodegradation of Antibiotics. J. Taiwan Inst. Chem. Eng. 2025, 168, 105960. [Google Scholar] [CrossRef]
  20. El Ouardi, M.; Madigou, V.; Chevallier, V.; Merlen, A.; BaQais, A.; Saadi, M.; Ait Ahsaine, H.; Arab, M. Synthesis of ZnV2O6 Nanosheet Photocatalysts for Efficient Photodegradation of Rhodamine B: Experimental and RSM Modeling. J. Environ. Chem. Eng. 2024, 12, 113505. [Google Scholar] [CrossRef]
  21. Wang, S.; She, L.; Zheng, Q.; Song, Y.; Yang, Y.; Chen, L. Ag-Doped CuV2O6 Nanowires for E hanced Visible-Light Photocatalytic CO2 Reduction. Ind. Eng. Chem. Res. 2023, 62, 455–465. [Google Scholar] [CrossRef]
  22. Mohamad Yusop, M.F.; Tamar Jaya, M.A.; Idris, I.; Abdullah, A.Z.; Ahmad, M.A. Optimization and Mass Transfer Simulation of Remazol Brilliant Blue R Dye Adsorption onto Meranti Wood Based Activated Carbon. Arab. J. Chem. 2023, 16, 104683. [Google Scholar] [CrossRef]
  23. Mohammadi, A.; Nemati, S.; Mosaferi, M.; Abdollahnejhad, A.; Almasian, M.; Sheikhmohammadi, A. Predicting the Capability of Carboxymethyl Cellulose-Stabilized Iron Nanoparticles for the Remediation of Arsenite from Water Using the Response Surface Methodology (RSM) Model: Modeling and Optimization. J. Contam. Hydrol. 2017, 203, 85–92. [Google Scholar] [CrossRef]
  24. Marrane, S.E.; Dänoun, K.; Allouss, D.; Sair, S.; Channab, B.-E.; Rhihil, A.; Zahouily, M. A Novel Approach to Prepare Cellulose-g-Hydroxyapatite Originated from Natural Sources as an Efficient Adsorbent for Heavy Metals: Batch Adsorption Optimization via Response Surface Methodology. ACS Omega 2022, 7, 28076–28092. [Google Scholar] [CrossRef]
  25. Vaez, M.; Zarringhalam Moghaddam, A.; Alijani, S. Optimization and Modeling of Photocatalytic Degradation of Azo Dye Using a Response Surface Methodology (RSM) Based on the Central Composite Design with Immobilized Titania Nanoparticles. Ind. Eng. Chem. Res. 2012, 51, 4199–4207. [Google Scholar] [CrossRef]
  26. Cho, I.-H.; Zoh, K.-D. Photocatalytic Degradation of Azo Dye (Reactive Red 120) in TiO2/UV System: Optimization and Modeling Using a Response Surface Methodology (RSM) Based on the Central Composite Design. Dye. Pigment. 2007, 75, 533–543. [Google Scholar] [CrossRef]
  27. Hua, K.; Xu, X.; Fang, D.; Bao, R.; Fu, Z.; Hu, J.; You, X.; Yi, J. In-Situ Synthesis and Room Temperature Magnetic Properties of Cobalt Vanadate Nanowire Array. J. Magn. Magn. Mater. 2019, 473, 435–441. [Google Scholar] [CrossRef]
  28. von Dreifus, D.; Pereira, R.; Rodrigues, A.D.; Pereira, E.C.; de Oliveira, A.J.A. Sol-Gel Synthesis of Triclinic CoV2O6 Polycrystals. Ceram. Int. 2018, 44, 19397–19401. [Google Scholar] [CrossRef]
  29. Moschogiannaki, M.; Zouridi, L.; Sukunta, J.; Phanichphant, S.; Gagaoudakis, E.; Liewhiran, C.; Kiriakidis, G.; Binas, V. High Performance Hydrogen Gas Sensors Based on PdO-Decorated p-Type CoV2O6 Nanoparticles. Sens. Actuators B Chem. 2020, 324, 128744. [Google Scholar] [CrossRef]
  30. Dhananjaya, M.; Guru Prakash, N.; Lakshmi Narayana, A.; Hussain, O.M. Microstructural and supercapacitive properties of one-dimensiona vanadium pentoxide nanowires synthesized by hydrothermal method. APPL PHYS A 2018, 124, 185. [Google Scholar] [CrossRef]
  31. Helal, A.; El-Sheikh, S.M.; Yu, J.; Eid, A.I.; El-Haka, S.A.; Samra, S.E. Novel Synthesis of BiVO4 Using Homogeneous Precipitation and Its Enhanced Photocatalytic Activity. J. Nanopart Res. 2020, 22, 132. [Google Scholar] [CrossRef]
  32. Chen, W.; Mai, L.; Peng, J.; Xu, Q.; Zhu, Q. Raman Spectroscopic Study of Vanadium Oxide Nanotubes. J. Solid State Chem. 2004, 177, 377–379. [Google Scholar] [CrossRef]
  33. He, X.; Zhang, C.; Tian, D. The Structure, Vibrational Spectra, and Thermal Expansion Study of AVO4 (A=Bi, Fe, Cr) and Co2V2O7. Materials 2020, 13, 1628. [Google Scholar] [CrossRef]
  34. Teng, Y.; Li, Y.; Yu, D.; Meng, Y.; Wu, Y.; Zhao, X.; Liu, X. The Microwave-Assisted Hydrothermal Synthesis of CoV2O6 and Co3V2O8 with Morphology Tuning by pH Adjustments for Supercapacitor Applications. ChemistrySelect 2019, 4, 956–962. [Google Scholar] [CrossRef]
  35. Chai, H.; Wang, Y.; Fang, Y.; Lv, Y.; Dong, H.; Jia, D.; Zhou, W. Low-Cost Synthesis of Hierarchical Co3V2O8 Microspheres as High-Performance Anode Materials for Lithium-Ion Batteries. Chem. Eng. J. 2017, 326, 587–593. [Google Scholar] [CrossRef]
  36. Soundharrajan, V.; Sambandam, B.; Song, J.; Kim, S.; Jo, J.; Kim, S.; Lee, S.; Mathew, V.; Kim, J. Co3V2O8 Sponge Network Morphology Derived from Metal–Organic Framework as an Excellent Lithium Storage Anode Material. ACS Appl. Mater. Interfaces 2016, 8, 8546–8553. [Google Scholar] [CrossRef] [PubMed]
  37. Li, Y.; Teng, Y.; Zhang, Z.; Feng, Y.; Xue, P.; Tong, W.; Liu, X. Microwave-Assisted Synthesis of Novel Nanostructured Zn3(OH)2V2O7·2H2O and Zn2V2O7 as Electrode Materials for Supercapacitors. New J. Chem. 2017, 41, 15298–15304. [Google Scholar] [CrossRef]
  38. Wu, F.; Yu, C.; Liu, W.; Wang, T.; Feng, J.; Xiong, S. Large-Scale Synthesis of Co2V2O7 Hexagonal Microplatelets under Ambient Conditions for Highly Reversible Lithium Storage. J. Mater. Chem. A 2015, 3, 16728–16736. [Google Scholar] [CrossRef]
  39. Maitra, A.; Das, A.K.; Karan, S.K.; Paria, S.; Bera, R.; Khatua, B.B. A Mesoporous High-Performance Supercapacitor Electrode Based on Polypyrrole Wrapped Iron Oxide Decorated Nanostructured Cobalt Vanadium Oxide Hydrate with Enhanced Electrochemical Capacitance. Ind. Eng. Chem. Res. 2017, 56, 2444–2457. [Google Scholar] [CrossRef]
  40. Desseigne, M.; Madigou, V.; Coulet, M.-V.; Heintz, O.; Chevallier, V.; Arab, M. Au/WO3 Nanocomposite Based Photocatalyst for Enhanced Solar Photocatalytic Activity. J. Photochem. Photobiol. A Chem. 2023, 437, 114427. [Google Scholar] [CrossRef]
  41. Al-Harahsheh, M.; Shawabkeh, R.; Al-Harahsheh, A.; Tarawneh, K.; Batiha, M.M. Surface Modification and Characterization of Jordanian Kaolinite: Application for Lead Removal from Aqueous Solutions. Appl. Surf. Sci. 2009, 255, 8098–8103. [Google Scholar] [CrossRef]
  42. Luo, J.; Zhou, X.; Yang, F.; Ning, X.; Zhan, L.; Wu, Z.; Zhou, X. Generating a Captivating S-Scheme CuBi2O4/CoV2O6 Heterojunction with Boosted Charge Spatial Separation for Efficiently Removing Tetracycline Antibiotic from Wastewater. J. Clean. Prod. 2022, 357, 131992. [Google Scholar] [CrossRef]
  43. Hossain, M.K.; Sotelo, P.; Sarker, H.P.; Galante, M.T.; Kormányos, A.; Longo, C.; Macaluso, R.T.; Huda, M.N.; Janáky, C.; Rajeshwar, K. Rapid One-Pot Synthesis and Photoelectrochemical Properties of Copper Vanadates. ACS Appl. Energy Mater. 2019, 2, 2837–2847. [Google Scholar] [CrossRef]
  44. Yang, A.; Luo, J.; Xie, Z.; Chen, Q. Photocatalytic Activity of V2O5/ZnV2O6 Catalysts and Its Origin: Insights into Enhanced Photocatalytic Mechanisms via DFT Study. Appl. Surf. Sci. 2022, 599, 153894. [Google Scholar] [CrossRef]
  45. Zang, S.; Cai, X.; Chen, M.; Teng, D.; Jing, F.; Leng, Z.; Zhou, Y.; Lin, F. Tunable Carrier Transfer of Polymeric Carbon Nitride with Charge-Conducting CoV2O6∙2H2O for Photocatalytic O2 Evolution. Nanomaterials 2022, 12, 1931. [Google Scholar] [CrossRef]
  46. Lin, X.; Yu, L.-L.; Yan, L.-N.; Guan, Q.-F.; Yan, Y.-S.; Zhao, H. Controllable Synthesis and Photocatalytic Activity of Spherical, Flowerlike and Threadlike Bismuth Vanadates. Acta Phys.-Chim. Sin. 2013, 29, 1771–1777. [Google Scholar] [CrossRef]
  47. Haleem, A.; Ullah, M.; ur Rehman, S.; Shah, A.; Farooq, M.; Saeed, T.; Ullah, I.; Li, H. In-Depth Photocatalytic Degradation Mechanism of the Extensively Used Dyes Malachite Green, Methylene Blue, Congo Red, and Rhodamine B via Covalent Organic Framework-Based Photocatalysts. Water 2024, 16, 1588. [Google Scholar] [CrossRef]
  48. Oon, Y.-L.; Ong, S.-A.; Ho, L.-N.; Wong, Y.-S.; Dahalan, F.A.; Oon, Y.-S.; Teoh, T.-P.; Lehl, H.K.; Thung, W.-E. Constructed Wetland–Microbial Fuel Cell for Azo Dyes Degradation and Energy Recovery: Influence of Molecular Structure, Kinetics, Mechanisms and Degradation Pathways. Sci. Total Environ. 2020, 720, 137370. [Google Scholar] [CrossRef] [PubMed]
  49. Jayanthi, R.; Suresh, R.; Jayaprakash, N. One-Step Formation of CoV2O6 Nanostructure and Its Photocatalytic Activity. AJC 2025, 37, 2237–2243. [Google Scholar] [CrossRef]
  50. Ghiyasiyan-Arani, M.; Masjedi-Arani, M.; salavati-Niasari, M. Size Controllable Synthesis of Cobalt Vanadate Nanostructures with Enhanced Photocatalytic Activity for the Degradation of Organic Dyes. J. Mol. Catal. A Chem. 2016, 425, 31–42. [Google Scholar] [CrossRef]
  51. Matsumoto, Y. Energy positions of oxide semiconductors and photocatalysis with iron complex oxides. J. Solid. State Chem 1996, 126, 227–234. [Google Scholar] [CrossRef]
  52. Wang, H.; Yu, M.; Lin, C.K.; Lin, J. Core–Shell Structured SiO2@YVO4:Dy3+/Sm3+ Phosphor Particles: Sol–Gel Preparation and Characterization. J. Colloid Interface Sci. 2006, 300, 176–182. [Google Scholar] [CrossRef] [PubMed]
  53. Zhang, G.; Zhang, Q.; Chen, G.; Yan, B.; Yao, J.; Wang, H.; Wang, R.; Zhang, Y. Application of S-Type Heterojunction CaTiO3/rGO-g-C3N4 Photocatalyst in the Conversion of Waste Cooking Oil to Biodiesel: Optimization via RSM and Performance Evaluation. Sep. Purif. Technol. 2025, 362, 131922. [Google Scholar] [CrossRef]
  54. Sulaiman, N.F.; Mubin, M.H.A.; Gunasekaran, S.S.; Sofiah, A.G.N.; Chaudhary, K.T.; Mohamad, S.N.; Ali, J. Optimization Using RSM-CCD in the Fabrication of Magnesium-Doped Bismuth Ferrite Nanoparticles via Sol–Gel Auto-Combustion Method for Enhanced Photocatalytic Performance. Results Phys. 2025, 69, 108114. [Google Scholar] [CrossRef]
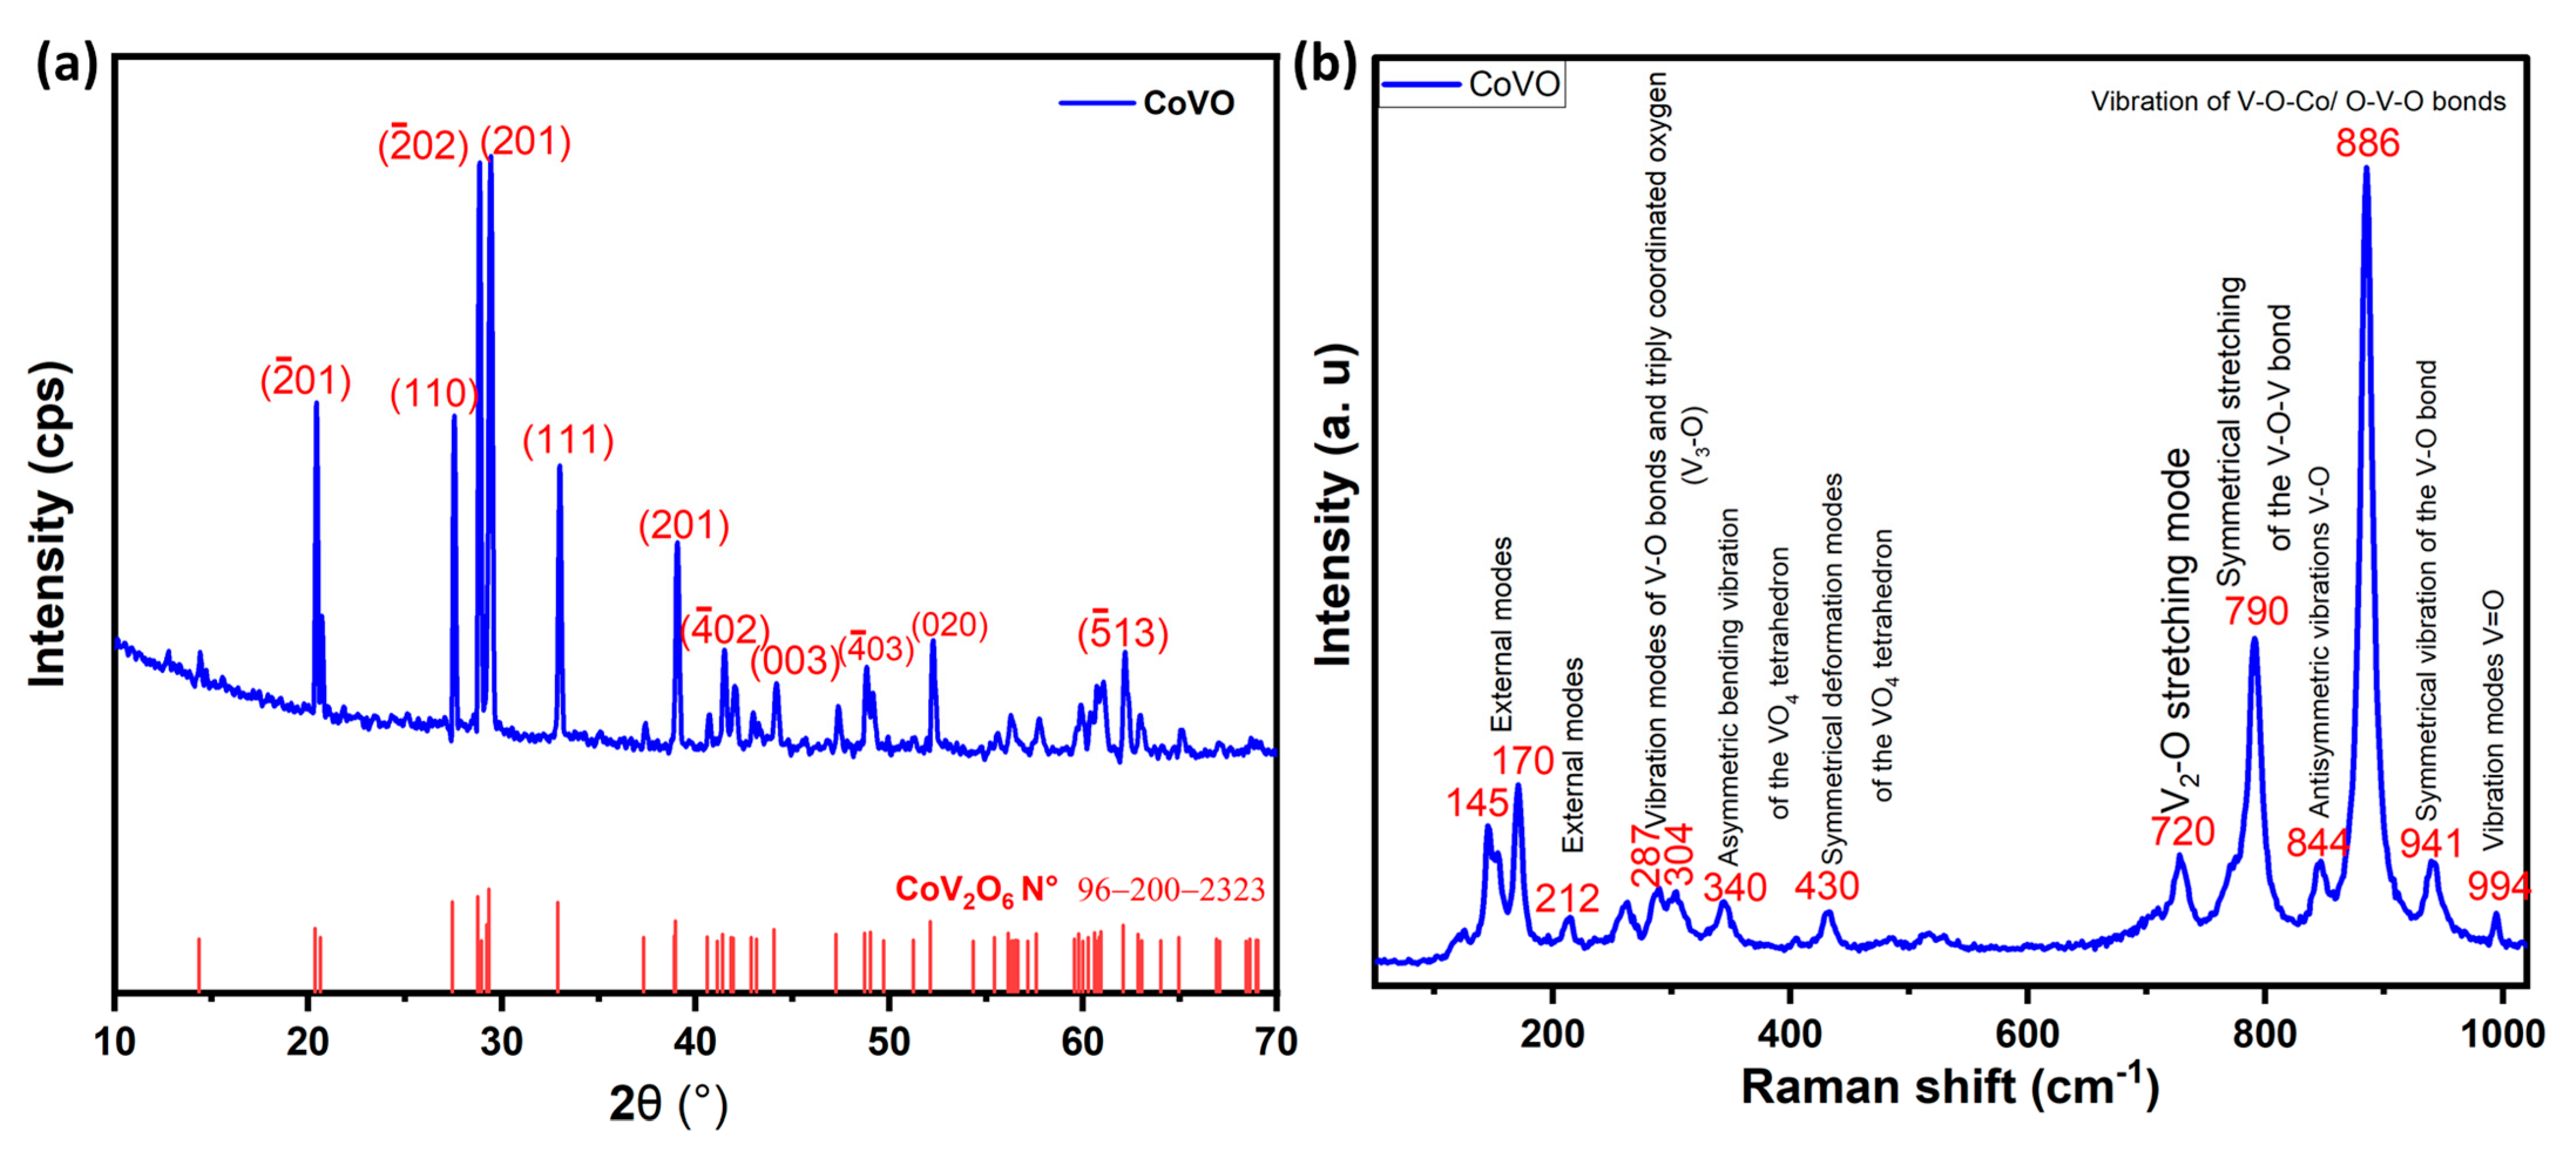
Figure 1. (a) XRD pattern and (b) Raman spectrum of CoV2O6 synthesized via solvothermal method.
Catalysts 15 00908 g001
Figure 2. (a) Survey XPS spectrum of CoVO; high-resolution XPS spectra of (b) O 1s, (c) V 2p, and (d) Co 2p core levels.
Catalysts 15 00908 g002
Figure 3. SEM micrographs (a,b) and TEM images (c,d) of the CoVO photocatalyst synthesized via the solvothermal method.
Catalysts 15 00908 g003
Figure 4. (a) UV-Vis absorption spectrum, (b) band gap energy determination using the Kubelka–Munk method, (c) photoluminescence (PL) emission spectrum, and (d) time-resolved PL decay curve of the CoVO photocatalyst.
Catalysts 15 00908 g004
Figure 5. 2D and 3D surface response graphs for the photo-decomposition efficacy of RhB on CoVO. The plots depict the influence of various parameters, including (a) RhB concentration and pH, (b) time and pH, (c) photocatalyst mass and pH, (d) photocatalyst mass and RhB concentration, (e) time and RhB concentration, and (f) time and photocatalyst mass. 2D contour plots (af) and 3D response surfaces (a′–f′).
Catalysts 15 00908 g005
Figure 6. 2D and 3D surface response plots for the photo-decomposition efficacy of MO on CoVO. The graphs illustrate the effects of different combinations of experimental variables, such as (a) pH and MO concentration, (b) pH and time, (c) pH and photocatalyst mass, (d) MO concentration and photocatalyst mass, (e) MO concentration and time, and (f) photocatalyst mass and time. 2D contour plots (af) and 3D response surfaces (a′–f′).
Catalysts 15 00908 g006
Figure 7. (a,b) Time evolution of the UV-Vis absorption spectra of the RhB/MO solutions using the CoVO catalyst under irradiation; (c,e) variation in the Ct/C0 ratio vs. illumination time for the RhB/MO situation; (d,f) pseudo-first-order kinetics relating to the photo-decomposition reaction; (g) measurement of the pHpzc of CoVO particles.
Catalysts 15 00908 g007
Figure 8. (a) Evaluation of RhB and MO degradation using CoVO with different radical scavengers. (b) Recyclability test of the CoVO photocatalyst for the two pollutants.
Catalysts 15 00908 g008
Figure 9. (a,b) Measurement of TOC over irradiation time; (c,d) analysis of COD in relation to photocatalytic reaction time in the RhB case.
Catalysts 15 00908 g009
Figure 10. (a,b) Determination TOC content at various irradiation time; (c,d) measurement of COD in the case of MO and using CoVO.
Catalysts 15 00908 g010
Figure 11. (a) Mott–Schottky graph of the CoVO catalyst, (b) diagram of the band structure indicating the decomposition mechanism envisaged.
Catalysts 15 00908 g011
Figure 12. Schematic illustration of the synthesis process of the CoV2O6 photocatalyst via the solvothermal method.
Catalysts 15 00908 g012
Table 1. Experimental variables and their coded levels used in the CCD model for RhB and MO degradation studies.
Parameters Levels
PollutantsRhBMO
CCD levels−α−10+1+αα−10+1+α
[Pollutants] (mg L−1): A357911357911
pH: B357911246810
mass of photocatalyst (mg): C50751001251505075100125150
Irradiation time (min): D60901201501806090120150180
Table 2. Experimental design and corresponding response values for CoVO photocatalytic degradation of RhB and MO.
RhBMO
TestACDBY Experience (%)Y Predicted
(%)
BY Experience (%)Y Predicted (%)
157590523.8724.836435.231.8
297590513.3217.53411.36.4
357590950.6150.34813.812.7
497590922.2416.4688.210.1
5512590529.1929.6437.634.7
6912590519.3320.73411.57.3
7512590958.957.41815.915.0
8912590929.9821.96810.310.4
9575150532.4137.08446.643.0
10975150521.1720.71417.913.7
11575150975.8272.47818.117.1
12975150933.2929.53811.210.6
135125150541.1044.93455.348.2
149125150530.0726.99419.216.8
155125150990.1982.63820.221.6
169125150941.0338.12814.813.1
173100120772.6971.43639.644.5
1811100120713.0819.6266.810.6
197100120310.782.15214.226.2
2071001201124.8838.78106.73.4
21750120737.1936.42610.214.4
227150120743.7249.77615.219.8
23710060722.9224.5468.211.7
247100180749.2952.94620.325.6
257100120738.1237.93613.313.7
267100120737.8837.93613.813.7
277100120737.7937.93614.013.7
Table 3. Statistical significance of regression coefficients for RhB and MO degradation using CoVO photocatalyst.
RhBMO
SourceCoefficientsp-ValueCoefficientsp-Value
Model-<0.01-<0.01
b037.93<0.0113.70.0199
bA−12.95<0.01−8.5<0.01
bB9.15<0.01−5.70.0143
bC3.330.01091.40.250
bD7.09<0.013.50.0384
bA-A1.890.03783.50.0438
bB-B−4.362<0.010.36.2
bC-C1.290.08160.80.729
bD-D0.2043.111.20.344
bA-B−6.64<0.015.70.0215
bA-C−0.391.16−0.52.58
bB-C0.5760.543−0.219.4
bA-D−2.260.0354−10.705
bB-D2.470.0297−1.70.241
bC-D0.7710.3040.62.17
R20.937 0.89
Adj, R20.862 0.77
Table 4. RSM-predicted optimal parameters and corresponding predicted and experimental degradation rates for RhB and MO with CoVO photocatalyst.
RhBMO
FactorOptimum
Values
Predicted
Rate (%)
Exp
Rate (%)
Optimum
Values
Predicted
Rate (%)
Exp
Rate (%)
[RhB] (mg/L): A585%80%455%50%
pH: B94
Mass of photocatalyst
(mg): C
110100
Time (min): D150150
Table 5. Comparative overview of recent studies on CoV2O6-based photocatalysts for organic pollutant degradation.
PhotocatalystPollutant StudiedSynthesis
Procedure
Conditions (Concentration,
Light Source)
Decomposition EfficacyReference
CoV2O6Methylene Blue, Sunset Yellow, Brilliant BlueThermal
decomposition
1 × 10⁻⁵ M;
Visible light + H2O2
MB: ~92.8% in 30 min; SY: 72% in 135 min; BB: 12.5% in 150 min[49]
CuBi2O4/CoV2O6Tetracycline antibioticsIn situ precipitation-calcination20 mg L−1;
Visible light
93.4% in 180 min[42]
CoV2O6Methylene BlueSolid-stateUV and visible source39% in 120 min[50]
CoV2O6Rhodamine B (RhB) and Methyl OrangeSolvothermal5 mg L−1 for RhB and 4 mg L−1 for MO and visible sourceRhB: 80% in 150 min;
MO: 50% in 150 min
This study
Disclaimer/Publisher’s Note: The statements, opinions and data contained in all publications are solely those of the individual author(s) and contributor(s) and not of MDPI and/or the editor(s). MDPI and/or the editor(s) disclaim responsibility for any injury to people or property resulting from any ideas, methods, instructions or products referred to in the content.