Article

Carbon- and Nitrogen-Doped XTiO3 (X = Ba and Ca) Titanates for Efficient CO2 Photoreduction Under Solar Light

1
Department of Molecular Sciences and Nanosystems, Ca’ Foscari University of Venice and INSTM RU Ve, via Torino 155, 30172 Venice, Italy
2
Faculty of Chemistry, University of Mazandaran, Babolsar 47416-95447, Iran
3
Department of Chemistry, Faculty of Science, University of Maragheh, Maragheh 55181-83111, Iran
4
Centre and INSTM RUTo, Chemistry Department and NIS Interdept, University of Turin, Via P. Giuria 7, 10125 Turin, Italy
5
Department of Physics and Geology, University of Perugia, Via Pascoli, 06123 Perugia, Italy
6
Department of Physics and Earth Science, University of Ferrara, Via Saragat 1, 44122 Ferrara, Italy
7
Chimie des Interactions Plasma-Surface (ChIPS), University of Mons, 7000 Mons, Belgium
*
Author to whom correspondence should be addressed.
Catalysts 2025, 15(9), 828; https://doi.org/10.3390/catal15090828
Submission received: 28 July 2025 / Revised: 18 August 2025 / Accepted: 19 August 2025 / Published: 1 September 2025
(This article belongs to the Special Issue Heterogeneous Catalysis in Air Pollution Control)

Abstract

In recent decades, photocatalysis has received huge attention as a way to address the main environmental challenges affecting planet Earth. Among these, the control of CO2 emission and its concentration in the atmosphere, as one of the greenhouse gases causing global warming, is of primary importance. This study focuses on the hydrothermal preparation of doped Ba and Ca-based titanates as efficient photocatalytic materials for CO2 photoreduction under solar light. The materials were characterized by SEM-EDX, XPS, FT-IR ATR, DRS, CHNS, XRD, and N2 physisorption analyses, and tested for gas-phase methane production from the target reaction. According to the results, the visible light harvesting properties were significantly improved with C and N doping, where glucose and a bio-based chitosan acted as the C and C+N sources, respectively. In particular, C-Ba-based titanate (CBaT) indicated the highest CH4 productivity, 2.3 µmol/gcat, against zero activity of the corresponding bare titanate structure, BaT. The larger surface area and pore volume, as well as its narrower band gap, are suggested as the major reasons for the promising performance of CBaT. This work provides new insights for the facile fabrication of efficient photoactive perovskite materials with the aim of CO2-to-CH4 photoreduction under solar light.

1. Introduction

In recent decades, global warming has gained attention, due to the possible consequences of increasing emissions of greenhouse gases. Among these, carbon dioxide (CO2) is the most abundant, accounting for 79% of global warming, with atmospheric concentrations reaching 410 ppm [1,2]. Given the urgency of reducing CO2 emissions, different strategies are being implemented, including carbon capture and storage (CCS), carbon capture and utilization (CCU) technologies, and conversion into high-value products. Achieving scalable CO2 conversion into valuable chemicals like methane (CH4) could be of high interest, aligning with the principles of the circular economy. CO2 is an apolar, abundant, inexpensive, non-toxic, and thermodynamically stable molecule, with high binding energies primarily associated with the C=O bond. Its standard Gibbs free energy is Δ G ° = 394.4   k J / m o l , making CO2 conversion an energy-intensive process [3]. To overcome this energy barrier, catalytic strategies are widely employed [4].
Photocatalysis is a promising approach that exploits solar energy, a renewable and lasting energy source, despite its intermittent nature, to drive CO2 conversion. The photocatalytic process involves the use of semiconducting materials containing conduction and valence bands with the potential of inserting crucial oxidizing/reducing levels/species in the reaction systems to be selectively accelerated. When a semiconductor is irradiated by a radiation of energy equal to or greater than the band gap, excitation occurs, generating a negative excited electron in the conduction band and a corresponding positive hole left on the valence band. The excited electrons can migrate to the semiconductor surface, where they are available to participate in reduction reactions, such as CO2 activation and conversion, while the holes can catalyze the oxidation reactions, such as water oxidation into oxygen and hydrogen, which are essential reactants in solar fuel production [3,4]. Efficient charge carrier separation and mobility are crucial for promoting the desired photocatalytic reactions on the catalyst surface. One of the major limitations in photocatalysis is the electron–hole recombination rate, in which excited electrons return to the valence band and recombine with the holes, dissipating energy as heat or photons [5]. This phenomenon significantly reduces photocatalytic efficiency and should be maximally prevented.
Titanium dioxide (TiO2) has been widely explored as a photocatalyst owing to its non-toxicity, availability, cost-effectiveness, and stability [6]. However, its application is limited to the ultraviolet (UV) region, accounting for only 5% of the solar spectrum, due to its large band gap (3.0–3.2 eV) [7,8]. Additionally, TiO2 suffers from surface degradation and a high recombination rate, which hinder its overall performance [5]. In this context, perovskites such as titanates are emerging as promising alternatives for photocatalysis. Perovskites represent a class of materials that exhibit ferroelectric, piezoelectric, and photocatalytic properties [9]. They offer photostability, corrosion resistance in aqueous solution, and a suitable band gap for CO2 photoreduction. Specifically, barium titanate (BaTiO3) and calcium titanate (CaTiO3) possess intrinsic basicity, which improves their interactions with CO2, which is slightly acidic, facilitating the photoreduction process [10,11].
BaTiO3 and CaTiO3 can be synthesized via hydrothermal treatment in a simple, cost-effective, and sustainable bottom-up approach [12,13]. This method is considered to be environmentally friendly since it uses water as the reaction solvent and allows operation under relatively mild reaction conditions, without requiring calcination. Although perovskites such as BaTiO3 and CaTiO3 exhibit promising photocatalytic properties, further strategies are needed to enhance their photoactivity and enable their efficient utilization across the full solar spectrum. One approach to overcoming these limitations is doping impurities, which introduces new intra-gap energy levels, effectively reducing the band gap and extending light absorption into the visible region [14]. Over the past decades, carbon (C) and nitrogen (N) non-metal elements have been identified as appealing doping candidates for photocatalysis due to their availability, low cost, and non-toxic nature. Nitrogen doping is particularly attractive as it induces formation of intra-gap energy levels between the valence and the conduction bands, enhancing material activation under visible light. In addition to its suitable compatibility for being added to the crystal structure, nitrogen has a lower electronegativity and ionization energy than oxygen. Nitrogen’s ionic radius is similar to oxygen, potentially facilitating the mixing between N 2p and O 2p orbitals [15,16]. Furthermore, nitrogen doping can promote CO2 adsorption and act as an active site for photoreduction. Functional groups of nitrogen also enable strong chemisorption of the reaction intermediates, enhancing selectivity towards methane formation [12]. On the other hand, carbon doping can enhance the photocatalytic activity by stabilizing the material and promoting molecular adsorption onto the catalyst surface. Also, the C 2p—O 2p orbital mixing phenomenon can help to introduce localized intra-gap energy levels, facilitating visible light absorption [5]. In recent years, carbon and nitrogen co-doping has frequently been reported to further improve photocatalytic performance under both UV and solar irradiation. Olivo et al. reported that doping TiO2 with C and N using chitosan as a precursor significant enhanced photocatalytic pollutant degradation under visible light [17]. Similarly, Chen et al. observed that the synergistic effects of C and N co-doping improved methylene blue degradation under solar irradiation, attributed to the formation of intra-gap energy states between the valence and conduction bands [18]. In the field of perovskite materials, Humayun et al. synthetized N-doped LaFeO3 and demonstrated a four-fold enhancement in CO2 conversion efficiency, compared to the undoped perovskite [15]. Nitrogen was suggested to facilitate CO2 interaction and act as an active adsorption site. Additionally carbon doping in NaTaO3 was shown to reduce the band gap energy, thereby enhancing visible-light activity [19]. However, carbon and nitrogen doping of Ba- and Ca-based titanates has not been explored yet.
In the present study, bare and non-metal-doped Ba and Ca-based titanates were synthesized via a hydrothermal treatment method. Carbon and nitrogen doping were carried out using two sustainable precursors, glucose (as C source) and chitosan (as a source of C and N). The photocatalytic performance was evaluated for the gas-phase CO2 photoreduction under both UV and solar irradiation.

2. Results

2.1. Structural Properties

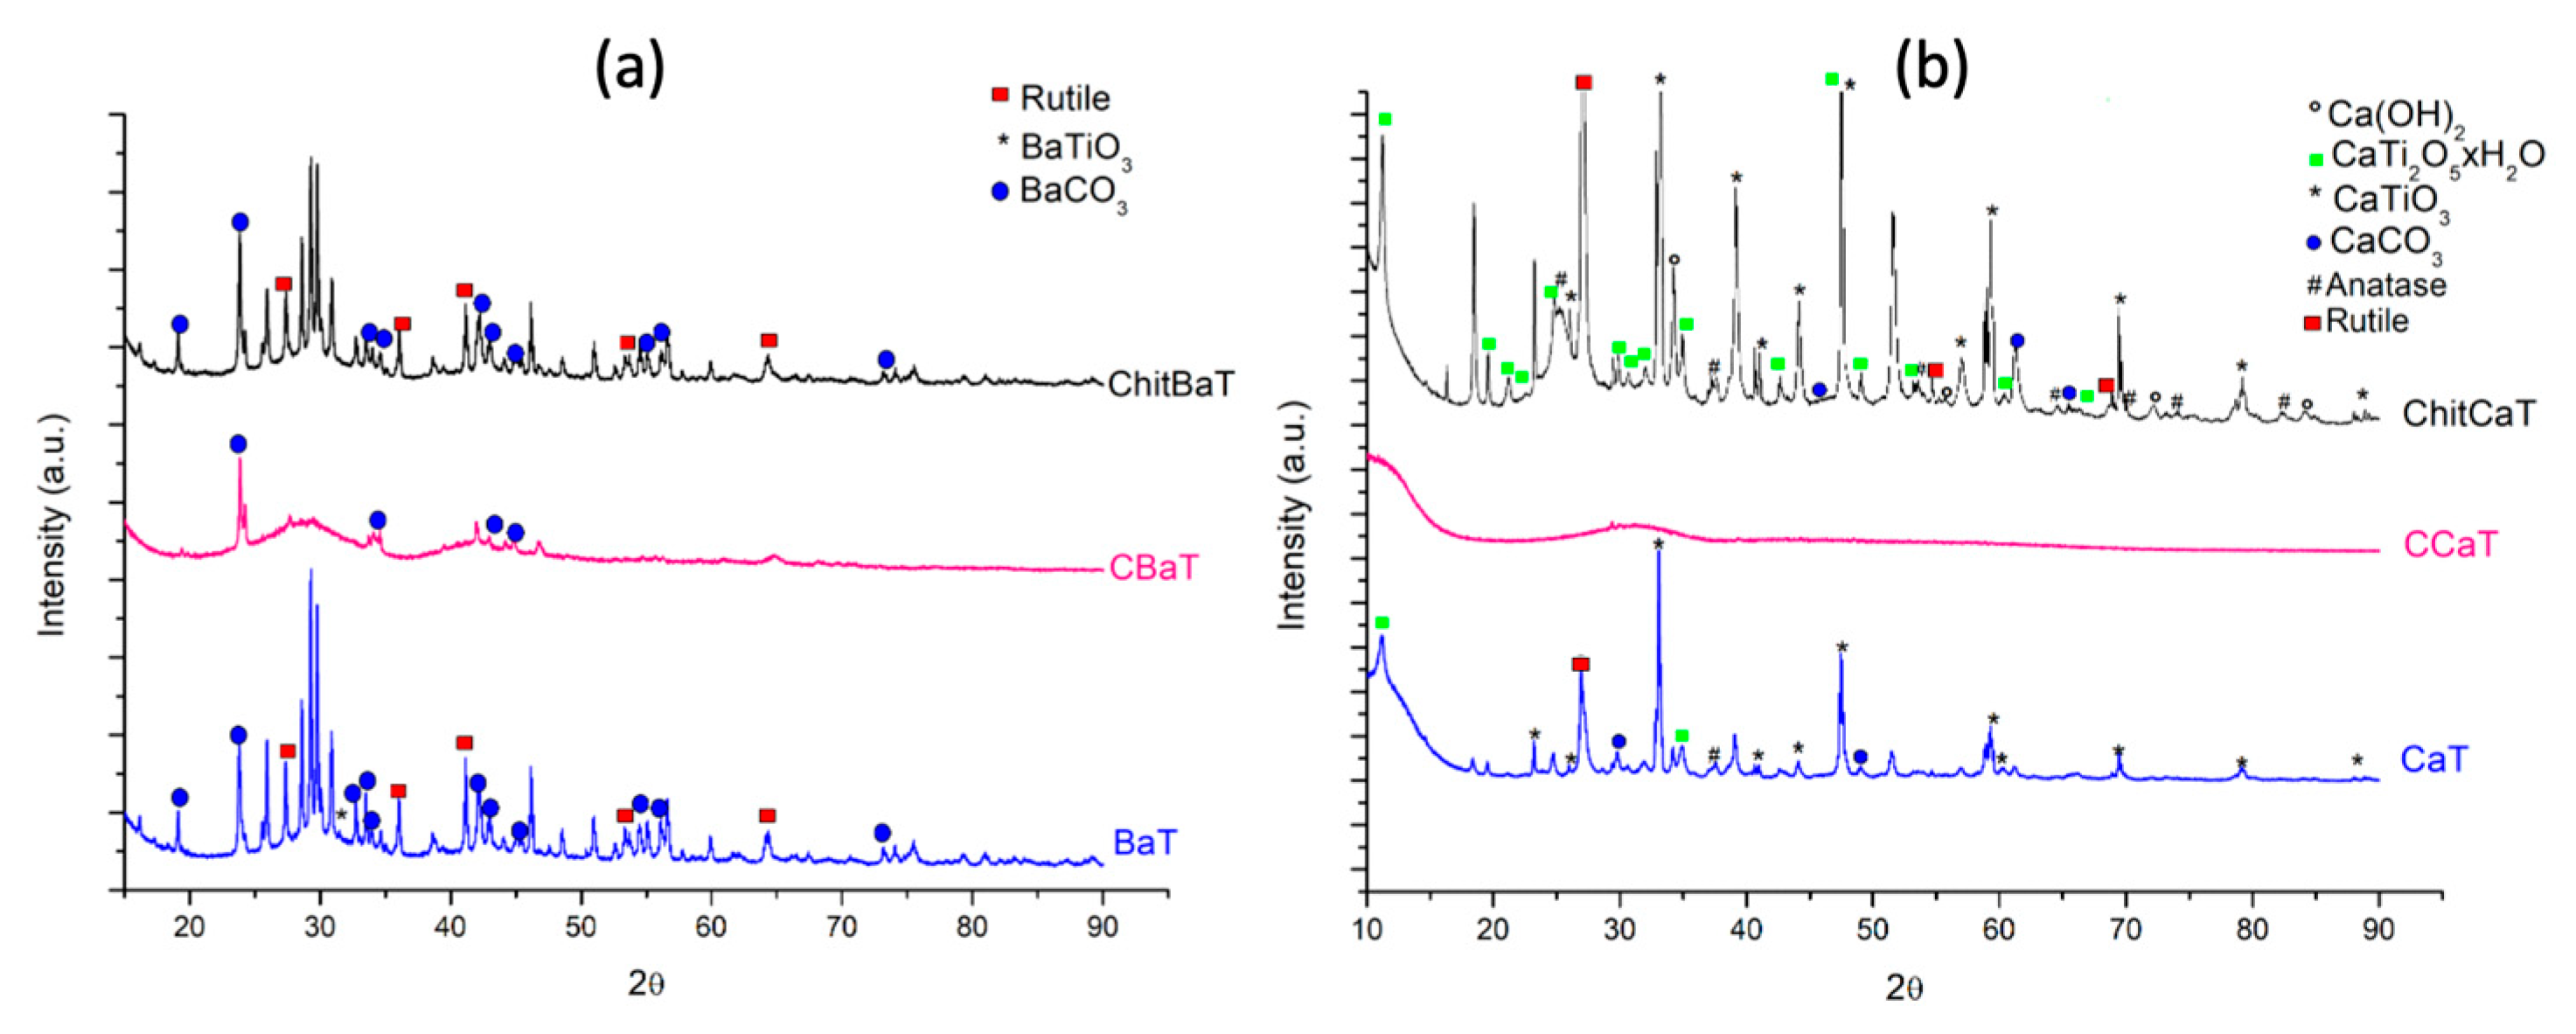
The XRD pattern of undoped BaT (Figure 1a) revealed the presence of different crystalline phases along with non-crystalline phases. The presence of cubic BaTiO3 phase (PDF 89-2475) was detected, mainly by its characteristic (110) peak at 31.5°, among other crystalline Ba-titanate related phases with different stoichiometries (BaTi4O9, Ba2Ti9O20 and BaTi2O5). Rutile was found in a minor fraction. A small amount of barium carbonate (BaCO3) (PDF 45-1471) was also identified. The CBaT’s pattern showed an amorphous material, possibly related to the effect of adding glucose to the synthesis batch. Treating with chitosan did not cause any change in the crystalline phases. The XRD pattern of undoped CaT (Figure 1b) showed the occurrence of mostly crystalline phases including the orthorhombic phase CaTiO3 (PDF 42-0423) with a phase fraction of about 40 wt%. Portlandite (Ca(OH)2) (PDF 44-1481), rutile (TiO2) (PDF 21-1276), and cafetite (CaTi2O5·H2O) (COD 9002897) with phase fractions ~7, ~10, and ~41 wt%, respectively, were also detected, the latter phase resulting from the lack post-synthesis thermal treatment. Similar to CBaT, CCaT consisted entirely of an amorphous structure. The ChitCaT’s XRD pattern presented the same phases as CaT, with CaTiO3 ~38 wt% (PDF 42-0423), cafetite ~26 wt% (COD 9002897), calcite <1.0 wt% (PDF 05-0586), portlandite ~7 wt% (PDF 44-1481), and rutile ~7 wt% (PDF 21-1276), in addition to ~21 wt% nanocrystalline TiO2 anatase (PDF 05-0586).
Scanning electron microscopy (SEM) analysis was applied to investigate the surface morphology of the catalysts. This technique was paired with EDX to determine the distribution and presence of defined elements in the materials. BaT (Figure 2a) showed an irregularly shaped spherical morphology, together with longer elongated structures. CBaT (Figure 2b) exhibited aggregates on the BaT surface, which could be attributed to carbon deposition, as supported by EDX analysis (Figure S1a,b). Compared with the other Ba-titanates, ChitBaT (Figure 2c) showed a different morphology characterized by a fibrous structure on which spherical particles were deposited, possibly as carbonaceous residuals from chitosan treatment. CaT’s morphology (Figure 2d) was quite different from BaT, even though it was characterized by aggregated microstructures composed of spherical particles. Similarly, structures with elongated morphology were observed. The CCaT (Figure 2e) image demonstrated the formation of spherical particles. The ChitCaT SEM image (Figure 2f) showed a heterogeneous morphology composed of cubic structures and spherical particles, probably related to CaTiO3, portlandite, cafetite, and calcite, as well as elongated structures due to chitosan deposition.
Elemental analysis was performed to further assess the presence of nitrogen and carbon in the doped titanates. As reported in Table 1, neither BaT nor CaT contained nitrogen or carbon. The presence of BaCO3, as detected by XRD, was not detected by CHNS analysis, possibly because it was below the minimum detection limit.
CBaT and CCaT showed the presence of 2.45 and 4.05 wt% of carbon, respectively. The chitosan-treated samples exhibited the presence of both nitrogen and carbon. In general, it was observed that the presence of N and C was higher in the Ca-based samples. A similar effect was detected for the Chit-based materials, which resulted in higher amounts of both C and N%, although the final C/N ratio remained constant (Table 1).
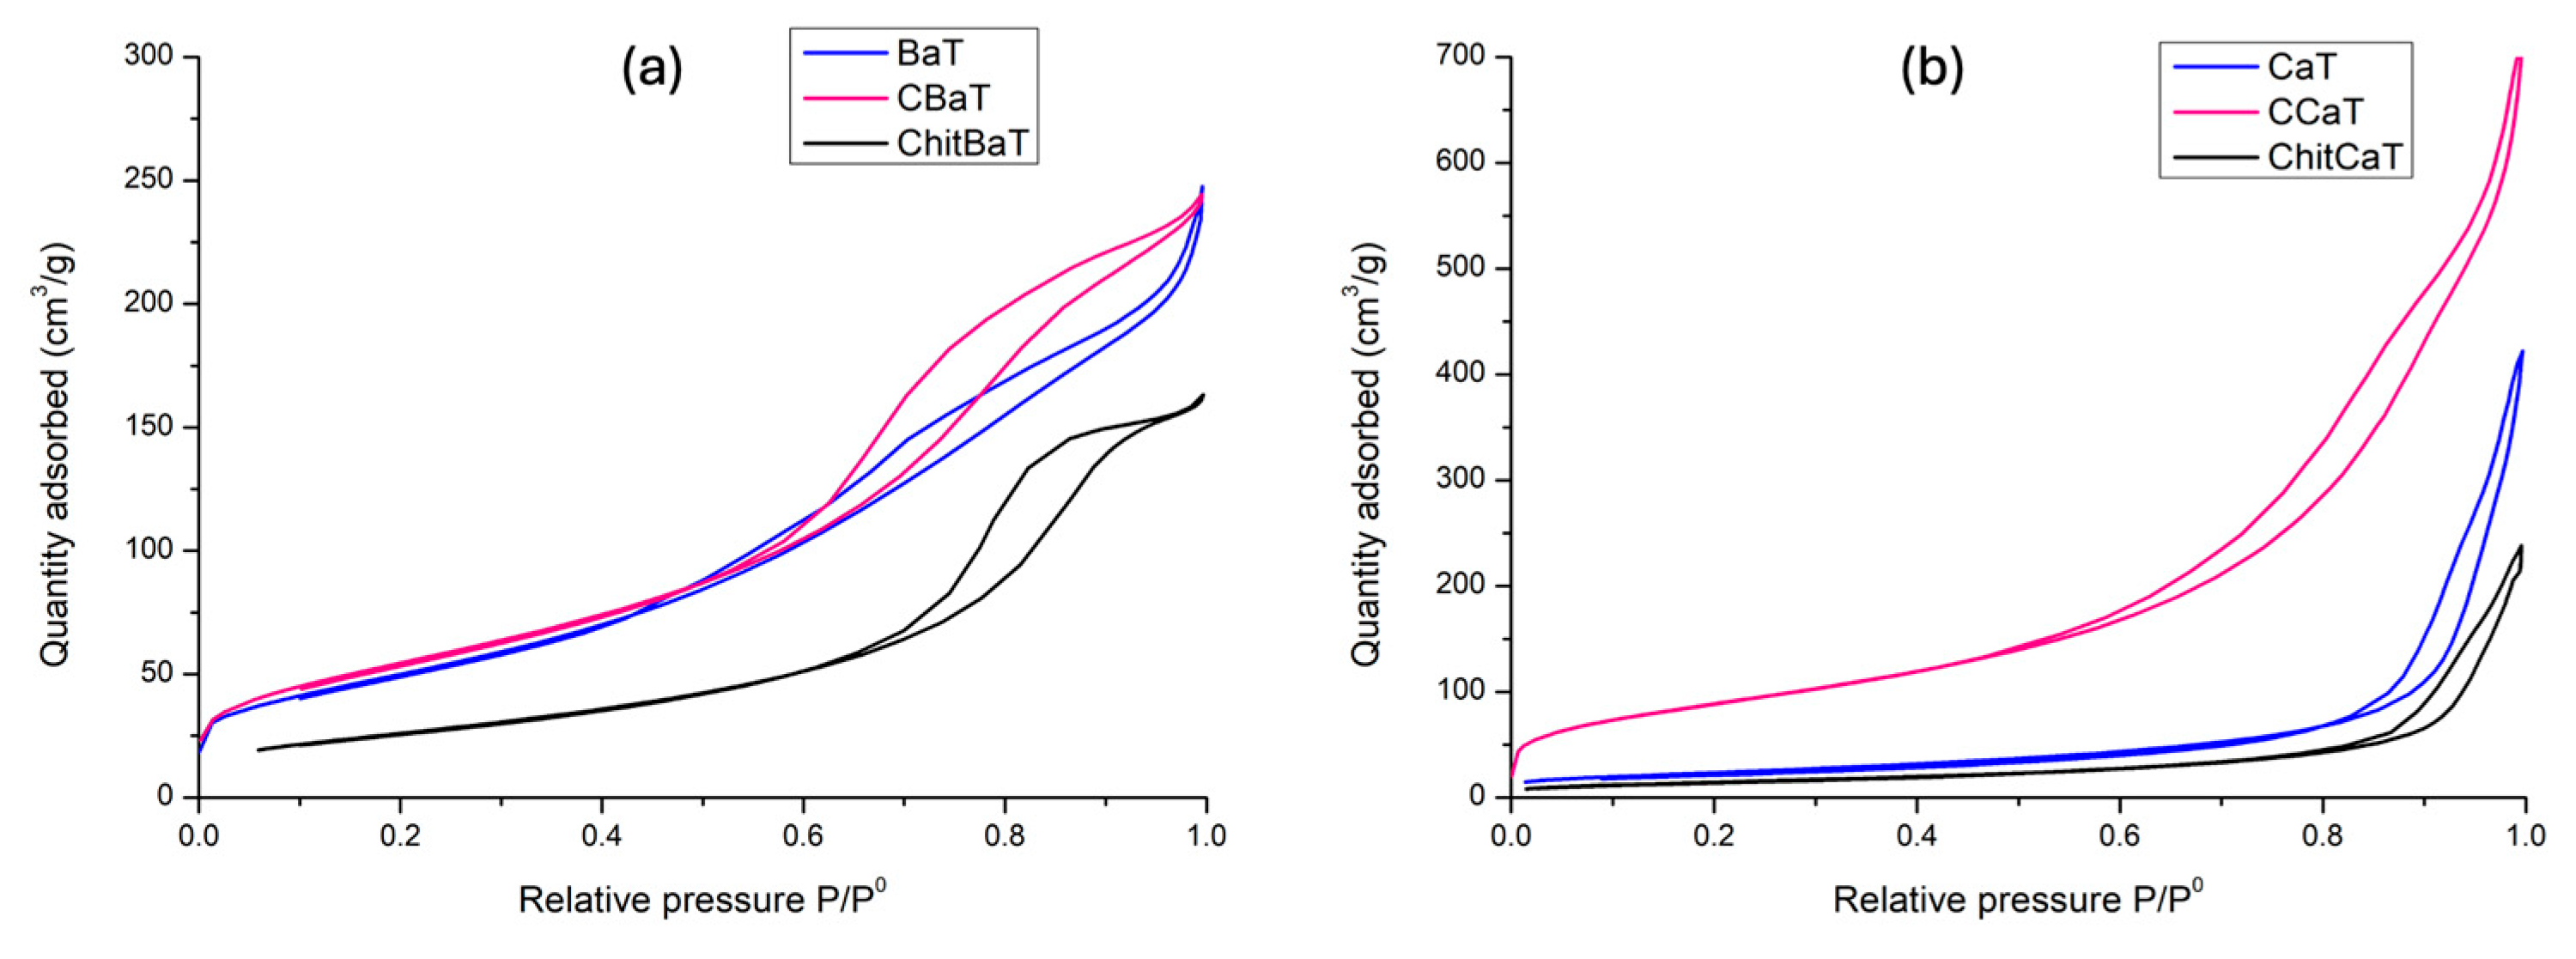
N2 physisorption analysis was conducted to determine the surface area, porosity, and ability of adsorption/desorption performance. In general, barium-based samples showed the isotherms type IV. In particular, BaT and CBaT (Figure 3) presented an unclosed type H1 hysteresis loop, which could be attributed to the variety of pores, including macro and mesopores [20]. BaT and CBaT materials showed surface areas corresponding to 181 and 196 m2/g, respectively (Table 2). As reported in Figure 3b and compared with the corresponding Ba-based samples (Figure 3a), the Ca-based materials presented a mix of type IV and V isotherms with hysteresis loop shapes associated with a wide range of pore sizes, as typically expected from a multi-porous system. In addition, the hysteresis concavity was related to weak adsorbate–surface interactions. CCaT, characterized by type IV isotherm, adsorbed more gas than the others. ChitCaT showed a reduced surface area with a trend similar to ChitBaT.
The Ca-based samples indicated an overall lower surface area compared with the Ba-based materials, except for CCaT.

2.2. Optical Properties

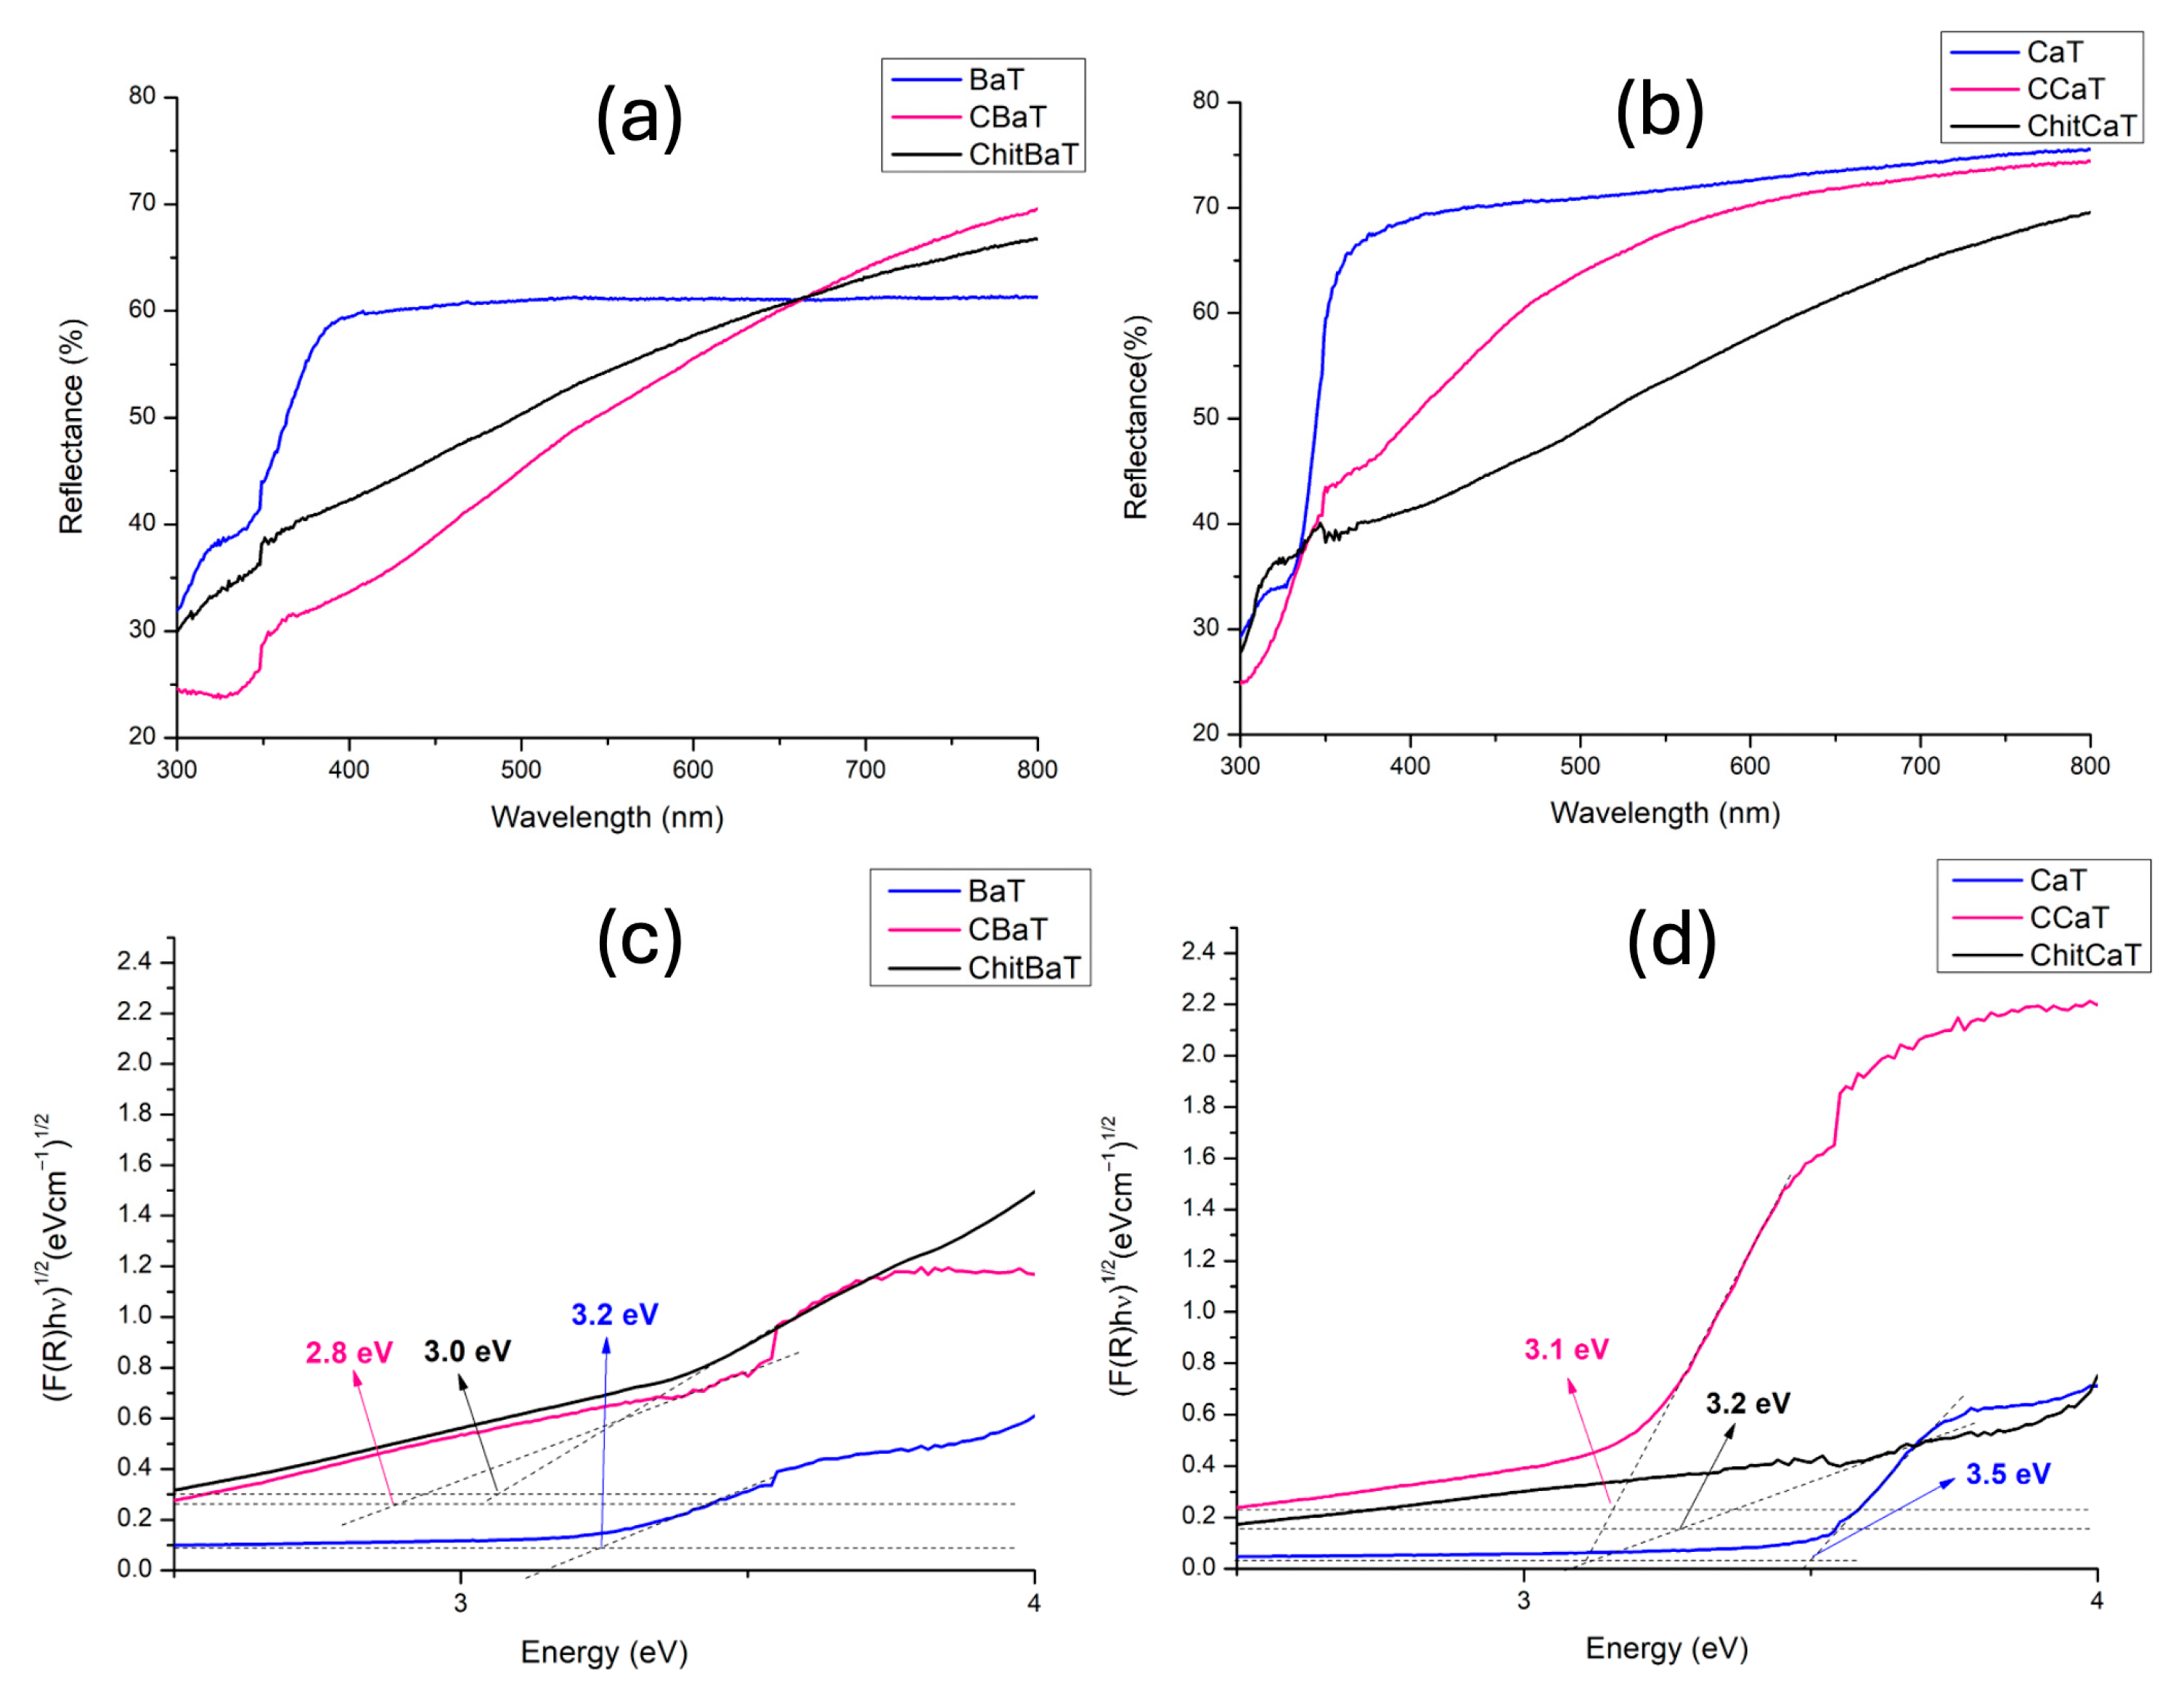
Diffuse reflectance spectroscopy (DRS) was applied to explore the semiconducting behavior and light harvesting features of the samples. Reflectance spectra of barium-based samples are reported in Figure 4a,b. The patterns showed that all the materials absorbed in the UV region, while CBaT and ChitBaT were also active in the visible region (400–600 nm). Among the Ba-based materials, BaT exhibited the largest band gap, approximately 3.2 eV (Table 3), whereas CBaT and ChitBaT had the band gaps of 2.8 and 3.0 eV, respectively, as shown by Tauc plots (Figure 4c). Figure 4b shows the reflectance spectra of all the Ca-based materials. Doped materials showed strong absorption in the visible region. ChitCaT indicated the highest absorption performance, while CaT had the largest band gap of 3.5 eV, leading to the predominant absorption capacity in the ultraviolet region, as previously reported [10]. In contrast, the doped materials showed lower band gaps (3.2 and 3.1 eV), indicating the possible formation of intra-gap energy levels, which contributed to narrowing the band gap regions. Comparing the Tauc plots of the Ca-based (Figure 4d) and the Ba-based materials (Figure 4c), CaT showed a wider starting energy gap region (3.5 eV) than BaT (3.2 eV), as reported elsewhere [11]. However, upon carbon doping, the band gap in both materials was reduced by a factor of four compared to their undoped counterparts. For the chitosan-based samples, the band gap is reduced by a factor of two in ChitBaT and by a factor of three in ChitCaT.
FT-IR ATR spectra (Figure S2a) of barium-based samples presented a very similar pattern. A broad and intense band between 3600–3000 cm−1 was characteristic of water molecules absorbed on the surface and interacting by hydrogen bonding, and the corresponding bending mode was observed at 1630 cm−1 [21]. The intense band at 1430 cm−1 and the sharp signal at 860 cm−1 were related to crystalline BaCO3 formed on the surface, as discussed above in the XRD results section (Figure 1a) [22]. For the doped samples, the other signals in spectral range 1200–950 cm−1 can be attributed to the residual of glucose and chitosan precursors, particularly the mode of C-OH groups, where the intensity of the bands where higher for ChitBaT [23,24,25]. Here, the bands were identified as stretching and bending vibrations of the O-H bonds of the molecules of interlayer water, hydroxyl, and carboxyl groups (2900–3700 cm−1), ketones (1220 cm−1), basal-plane hydroxyls and epoxides (972 cm−1), and edge-located hydroxyls (1060 cm−1).
Signals related to Ti-O modes generate a broad band at low wavenumbers (700–400 cm−1). This band was more distinct in plain BaT than in the doped samples, which is consistent with the more amorphous nature of CBaT and the presence of chitosan on the surface of the ChitBaT particles [26,27].
The same signals were present in the FT-IR ATR spectra of calcium titanate samples (Figure S2b). For these samples, it was observed that the intensity and pattern of the band related to surface water changed in the doped samples, suggesting the alteration of surface hydrophilicity from one to another. The sharp signal at 3460 cm−1 in the spectrum of ChitCaT was attributed to the Ca-OH mode of portlandite. Signals at 640, 540, and 490 cm−1 were assigned to the Ti-O modes of the different phases present in CaT and CCaT [26]. These signals became a broad band in the spectrum of CCaT, suggesting the poor crystallinity of the sample [28].
X-ray photoelectron spectroscopy (XPS) was carried out to evaluate the chemical states and elemental composition of the samples. The XPS survey spectra for the CaT, CCaT, and ChitCaT samples are presented in Figure S3. The spectra exhibit the expected peaks corresponding to the characteristic core-level binding energies of calcium (Ca 2p ~350 eV), titanium (Ti 2p ~460 eV), and oxygen (O 1s ~530 eV). Additionally, a low-intensity peak associated with carbon (C 1s ~285 eV) can be observed, indicating a minor presence of this element on the surface. The XPS survey spectrum for CCaT shows an increase in the relative intensity of the carbon (C 1s) peak compared with the CaT sample, suggesting a higher carbon content. Furthermore, the XPS spectrum for ChitCaT, in addition to the previously mentioned characteristic peaks, exhibits a low-intensity nitrogen (N 1s) peak at around 400 eV binding energy, probably due to the introduction of chitosan during the synthesis process. The XPS survey spectrum recorded on sample BaT revealed the elemental composition of the sample surface, which included barium (Ba), titanium (Ti), carbon (C), and oxygen (O). The prominent peaks correspond to the core level binding energies of these elements, with the Ba 3d peak around 800 eV, the Ti 2p peak around 460 eV, the C 1s peak around 285 eV, and the O 1s peak around 530 eV. The relative intensities of these peaks provide a semi-quantitative indication of the elemental composition, with carbon and oxygen likely to be the dominant surface species. The asymmetric shape of the C 1s peak suggests the presence of different carbon-containing chemical species on the surface. Further analysis would be required to fully resolve the specific chemical states and environments of the detected elements. The XPS survey spectrum for the CBaT sample included barium (Ba), titanium (Ti), and a more prominent carbon (C) signal than the previous sample, along with oxygen (O). The increased intensity of the C 1s peak suggests a higher carbon content on the surface, probably due to the introduction of additional carbon during the sample synthesis. The spectrum for the ChitBaT sample showed peaks corresponding to the core level binding energies of the Ba 3d, Ti 2p, C 1s, and O 1s, similar to the previous sample. The introduction of chitosan in the synthesis resulted in the appearance of a low-intensity N 1s peak, suggesting minor nitrogen content.
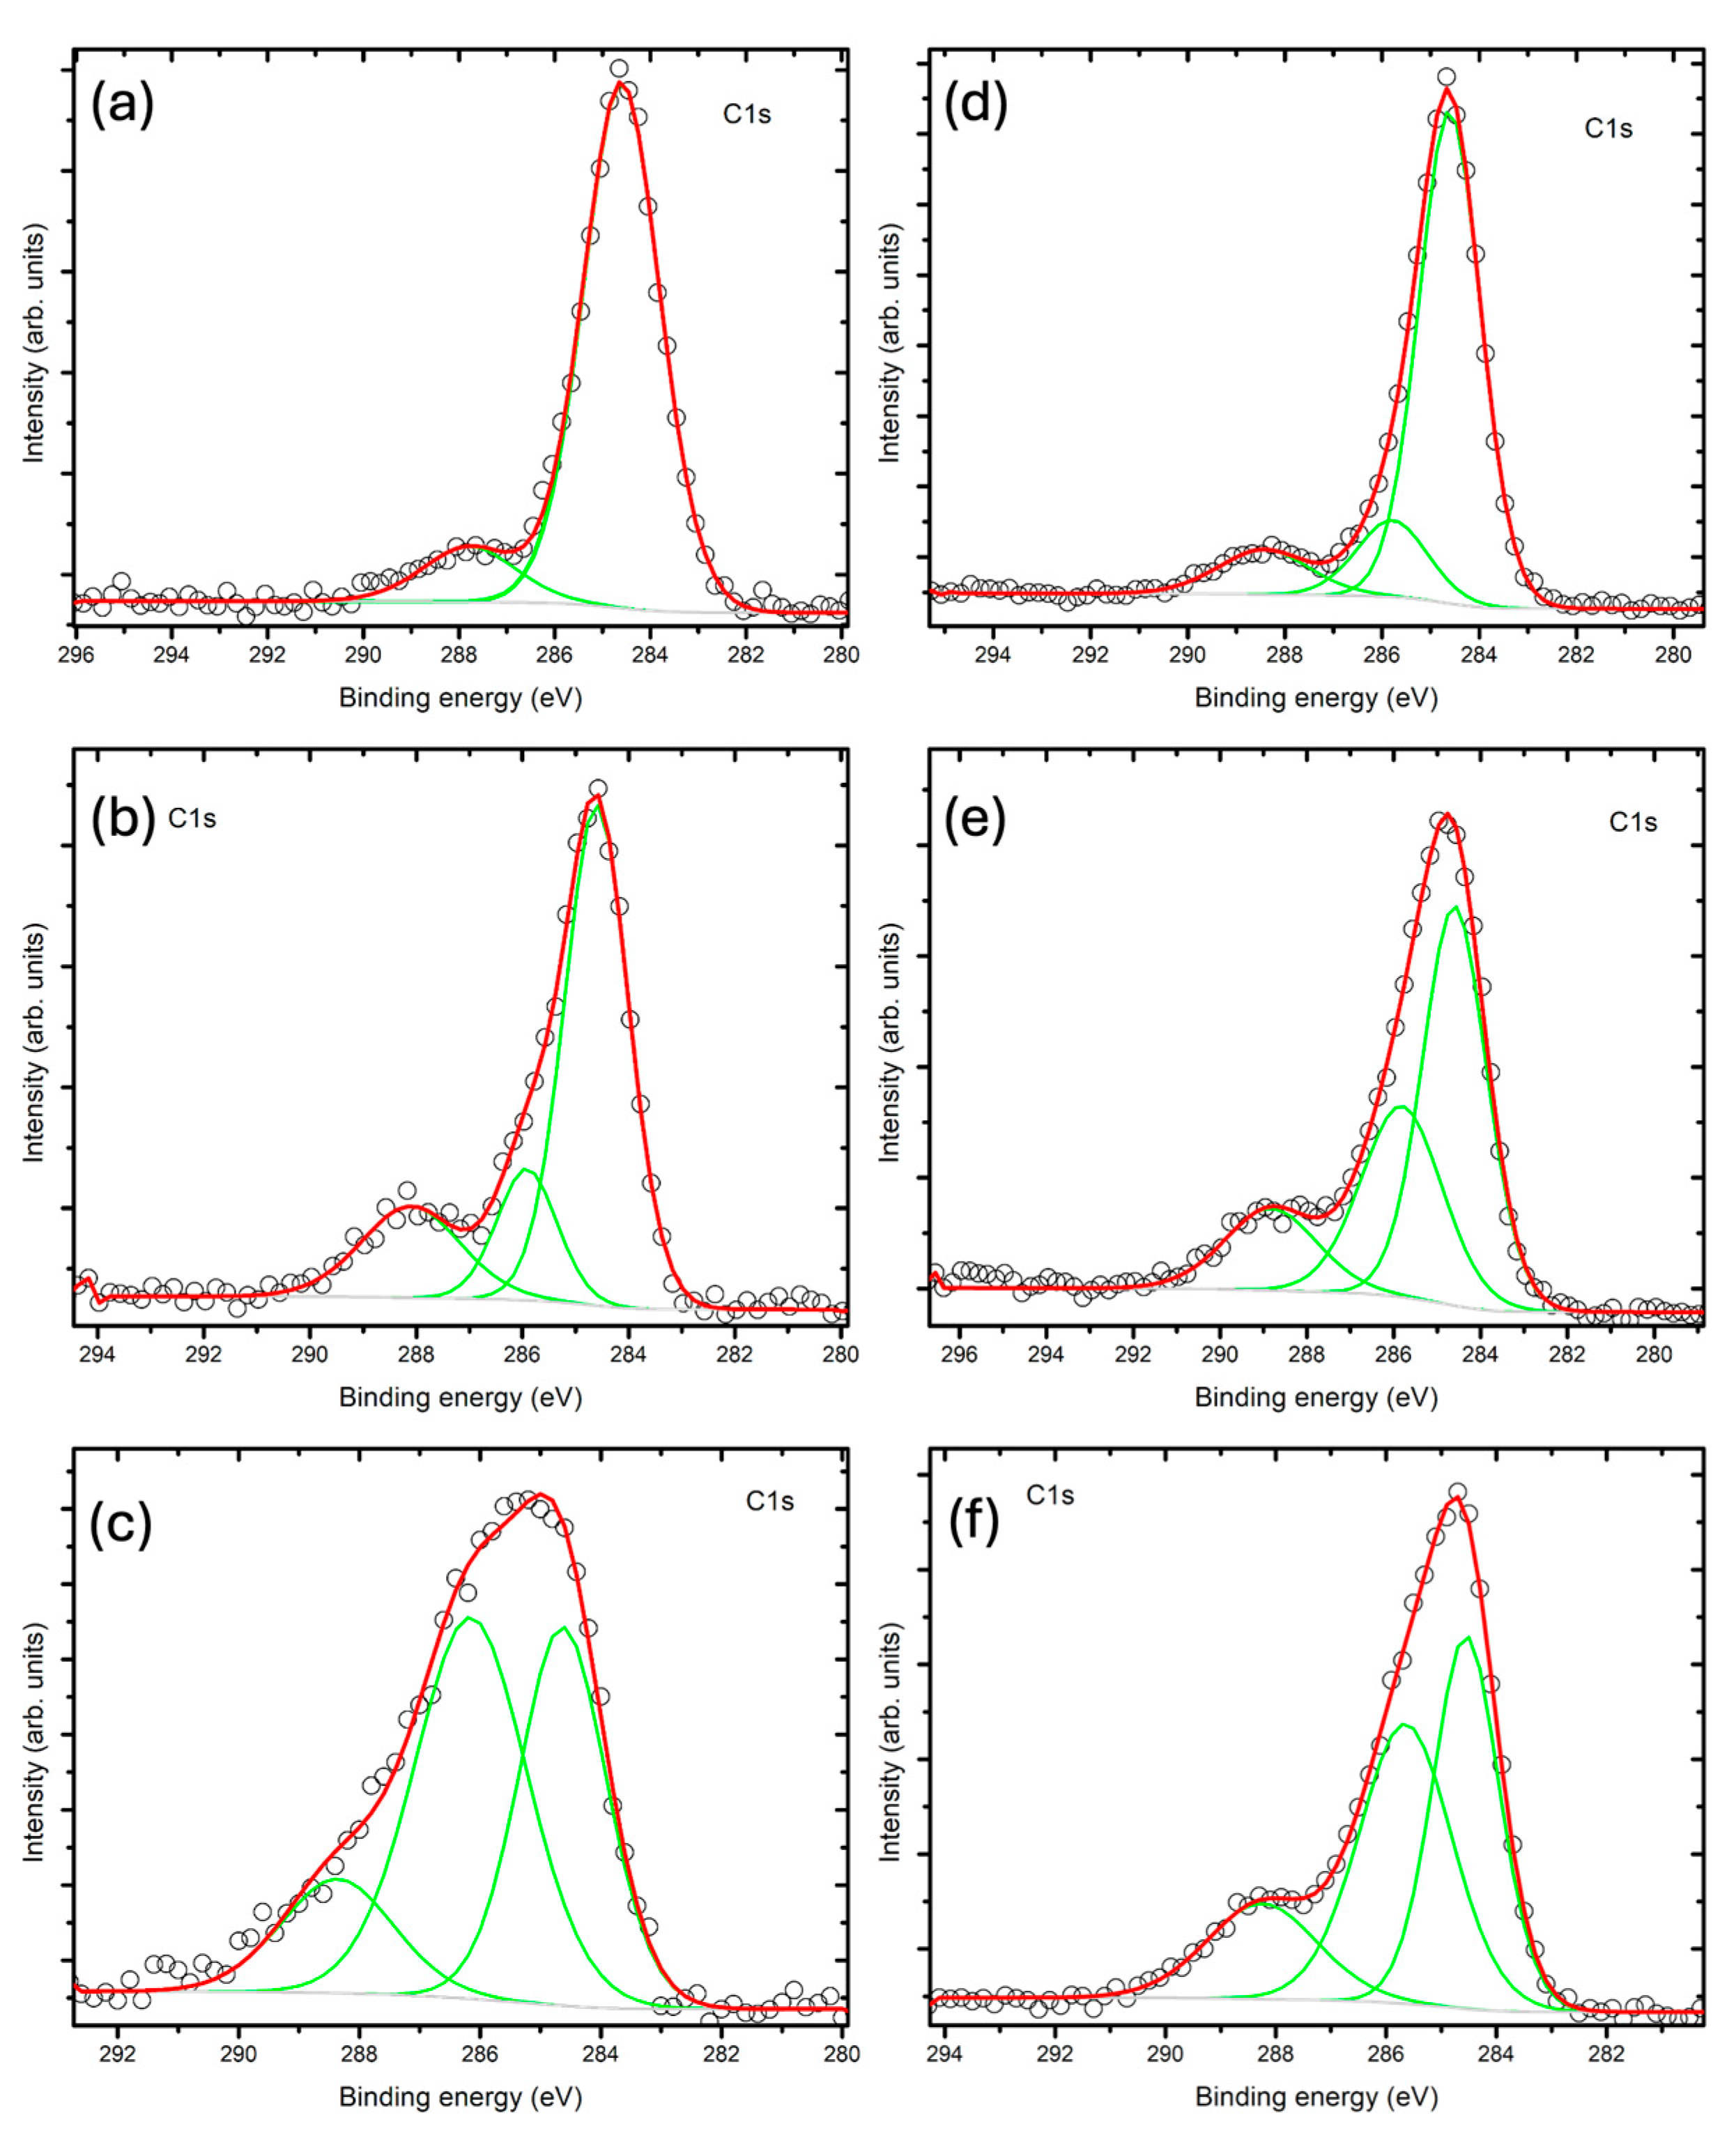
The C 1s XPS spectra are presented in Figure 5, while the Ba 3d, Ca 2p, Ti 2p, and O1s XPS spectra are illustrated in Figure S4. The characteristic peak corresponding to the Ba2+ state was observed in all the Ba-based materials at 779 eV, attributed to the Ba 3d5/2 orbital. Notably, the doped BaT-based samples exhibited a slight asymmetry and a chemical shift to 778 eV, probably due to the incorporation of nitrogen and carbon atoms. In relation to the Ca-related materials, the characteristic peaks of Ca2+ were observed at the binding energies of 347 and 360 eV, corresponding to Ca 2p3/2 and Ca 2p1/2 [29]. Titanium displayed two characteristic peaks at 458 eV and 463 eV, associated with Ti 2p3/2 and Ti 2p1/2 [30]. The O1s XPS spectra presented a more complex profile, with peaks at 529 and 531 eV attributed to either reticular oxygen in Ba-O-Ti/Ca-O-Ti and Ti-O-Ti bonds, or oxygenated species adsorbed on the surface [31,32]. The relative amount of carbon in CBaT and CCaT was found to be 1.1 and 1.2 times higher than in BaT and CaT, respectively (Table S1), while the O content decreased by a similar ratio. This suggests that carbon was either incorporated into the materials or deposited as graphitic carbon on the surface, as suggested by the peak at 285 eV in C1s XPS spectra [33]. Additionally, the presence of the component at 286 eV may be attributed to carbon contamination in the form of carbonates [31].
Conversely, ChitBaT and ChitCaT exhibited a more prominent component at 286 eV and an additional one at 288 eV in the C1s spectra, which coincided with a more evident peak prominent at 531 eV in the O1s spectra. These features can be attributed to the aromatic carbon C-OH, C-N, C-O, and C=O bonds typical of chitosan. The relative percentages of the surface atoms are reported in Table S1. The Ti/O ratio of the samples closely approximated the theoretical Ti/O ratio of 1:3. However, Ba/Ti and Ca/Ti ratios were found to be non-stoichiometric, consistent with heterogeneous phases identified through XRD analysis.
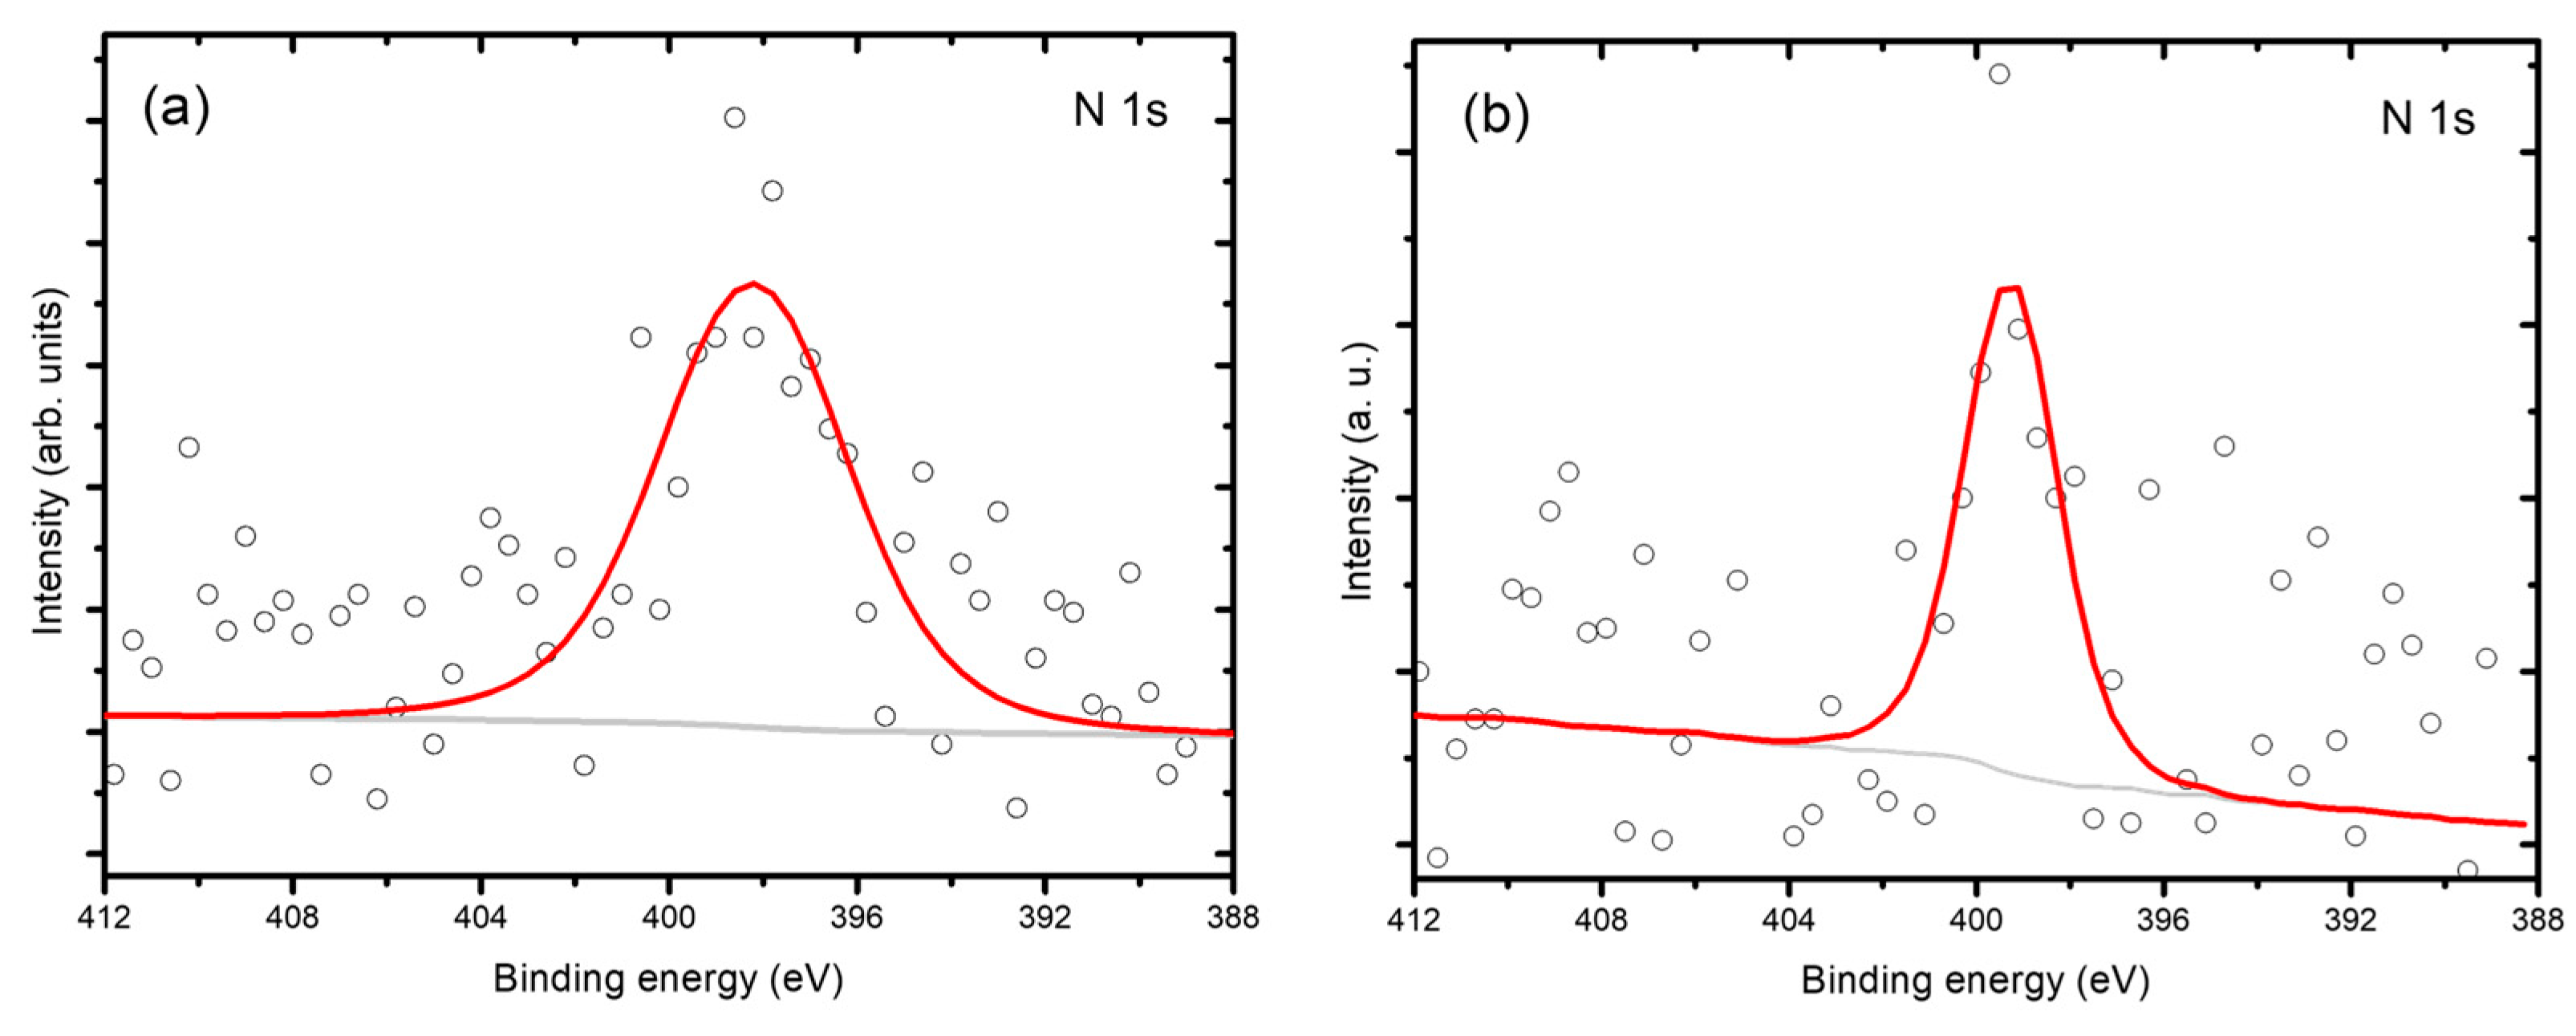
The N 1s XPS spectra are shown in Figure 6. Both samples display a dominant peak centered at 398.2 eV, typically attributed to graphitic or pyrrolic nitrogen species embedded within the carbon matrix [34]. The broader peak in ChitBaT suggested the possible coexistence of different functionalities, such as oxidized nitrogen, also potentially referring to interstitial N introduced by the doping process [35]. However, due to the low N content and high noise during the measurement (Table S1), it was not possible to further deconvolute the peaks.

2.3. CO2 Photoreduction

2.3.1. UV Activity

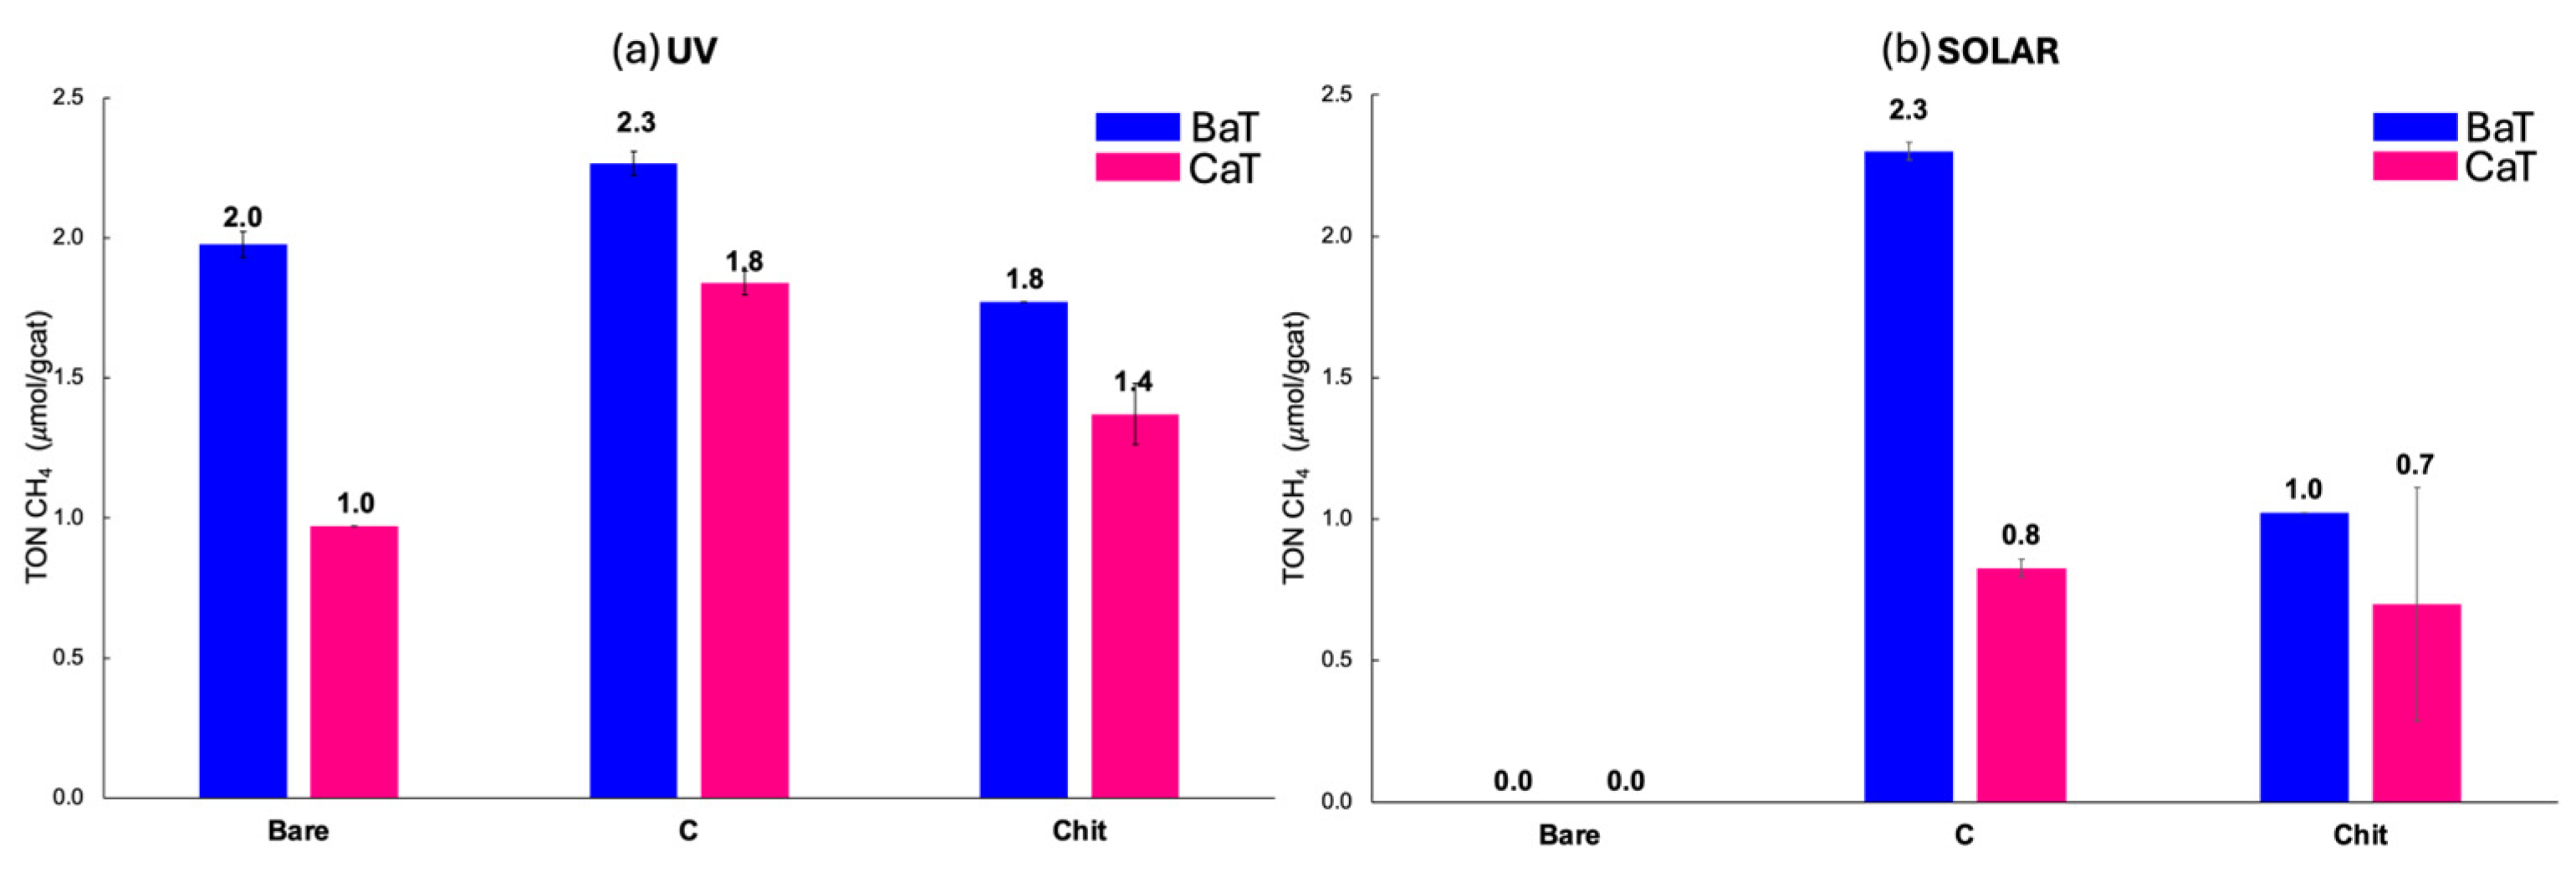
According to the results reported in Figure 7a, all materials were active under UV light, producing approximately 2.3 μmol/gcat of CH4 using the CBaT sample. This photocatalyst showed the highest CH4 productivity, against the corresponding CCaT, which generated 1.8 μmol/gcat of CH4. Mainly, Ba-based catalysts showed higher production of CH4 compared to the corresponding Ca-based ones. BaT reached 2.0 μmol/gcat of CH4 against 1.0 μmol/gcat for CaT; ChitBaT produced 1.8 μmol/gcat of CH4, compared with 1.4 μmol/gcat for ChitCaT.
Overall, C-doped catalysts showed higher activity than both bare and Chit-doped titanates under UV light.

2.3.2. Solar Activity

Concerning the solar light activity, which is the main objective of this study, the obtained results were incredibly promising (Figure 7b). As expected, undoped titanates’ activity under solar light was hindered.
As reported in Figure 7, doping the materials with carbon improved the photoactivity significantly. CBaT emerged as the best catalyst under solar light conditions, reaching TON of 2.3 μmol/gcat. Moreover, the CCaT photocatalyst showed increased photoactivity compared with CaT (0.8 μmol/gcat). The photocatalytic activity of chitosan-treated materials (1.0 and 0.7 μmol/gcat of CH4) under solar light was found to be lower than that of carbon-doped ones, but still higher than the bare materials.
Recycle tests were performed with the best catalyst, CBaT, and the results showed that the photocatalytic efficiency remained constant with the same CH4 selectivity after five cycles under solar light, indicating the good stability of the CBaT photocatalyst (Figure S5).

3. Discussion

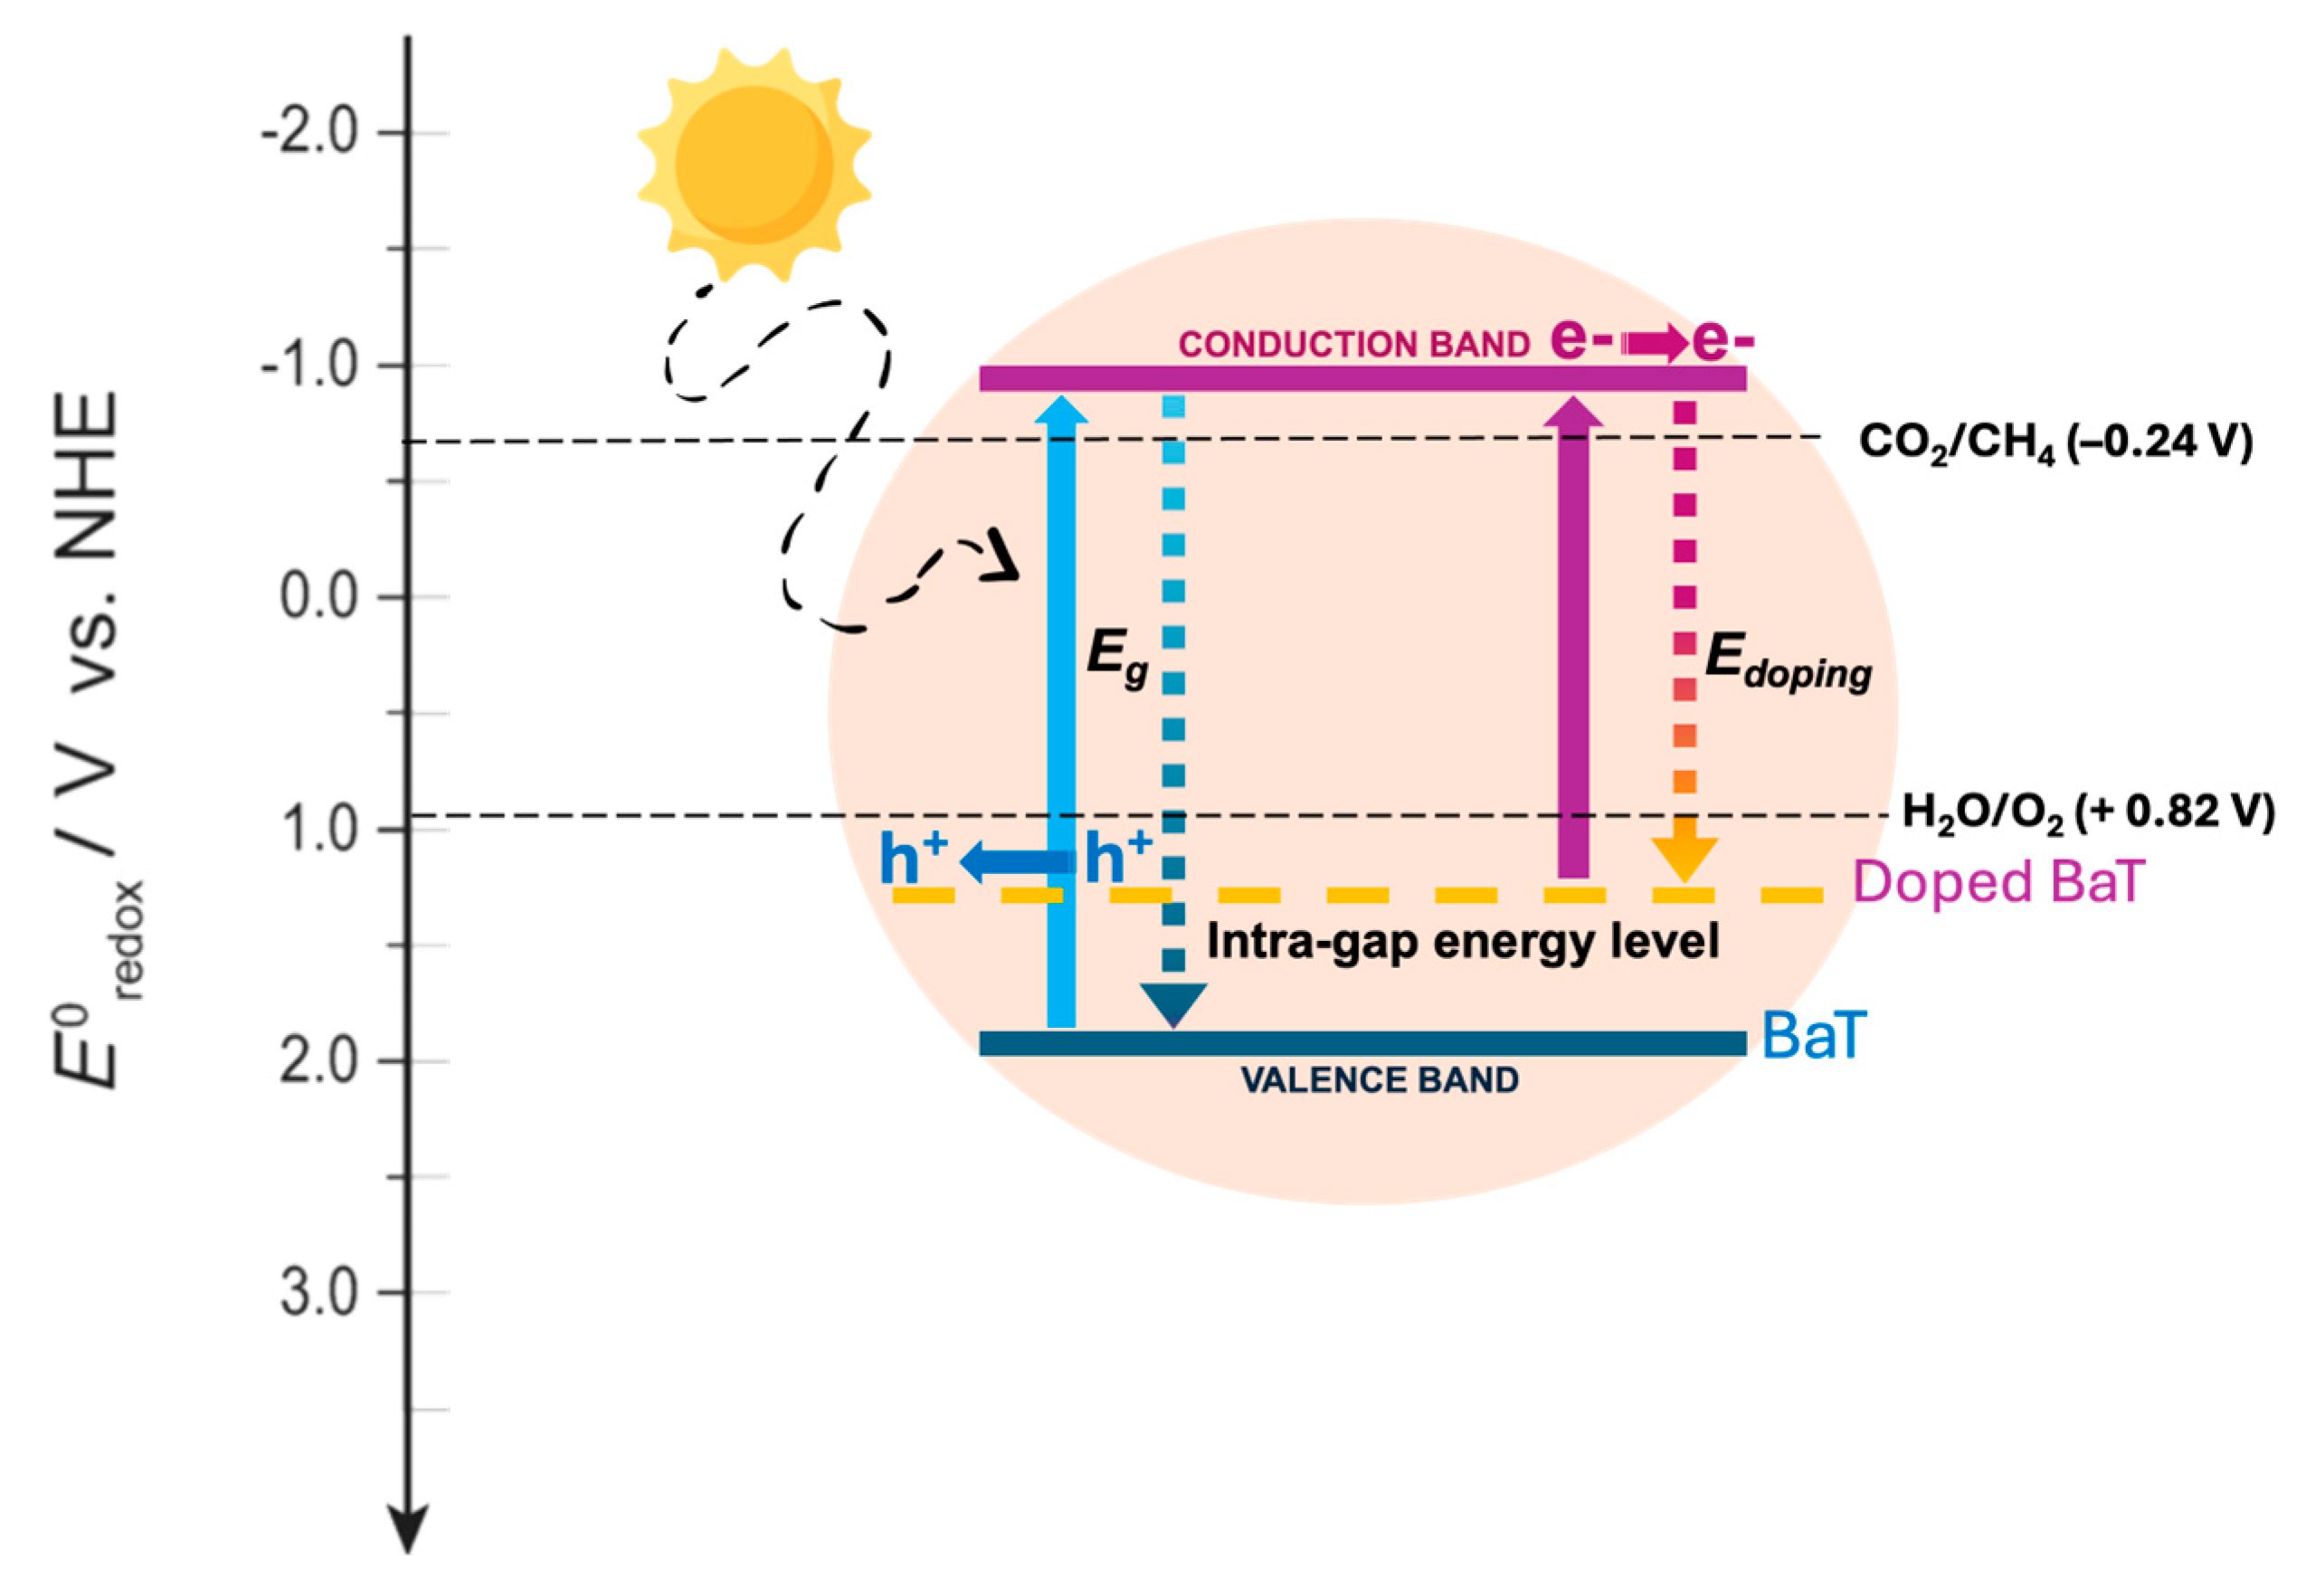
The photocatalytic performance of the prepared structures was examined for CO2 photoreduction in the gaseous phase for methane production. Three different pathways have been proposed in the literature for CO2 photoreduction reactions [36,37]: formaldehyde, carbene, and glyoxal pathways. Of these, the first two are the most broadly accepted. For the BaTiO3 structure, the main pathway is the carbene one, which is characterized by the following steps: CO2(g) → CO2−• → CO+OH → CO−• → C+OH → CH−• → CH2−• → CH3−• → CH4(g) [38]. In the carbene pathway, CO2−•, carbon coordinates the semiconductor and reacts with a proton that breaks the C-O bond, forming CO−•; then, CH4 is formed through multiple reduction steps. A schematic representation of the electronic behavior in doped titanates is shown in Figure 8. As an example, pure BaT exhibits band edge positions suitable for both CO2 reduction and H2O oxidation: the conduction band is more negative than the CO2/CH4 reduction potential, while the valence band is more positive than the H2O/O2 oxidation potential. Upon doping with carbon and/or nitrogen, visible-light absorption is improved possibly due to the introduction of intra-gap states, which also helped to reduce charge carrier recombination. Under solar irradiation, the doped material generates electron–hole pairs. Excited electrons in the conduction band participate in CO2 reduction, while holes in the valence band catalyze water oxidation into protons and hydroxyl radicals. The generated hydrogen ions are crucial for the subsequent CO2-to-CH4 conversion.
From the CO2 photocatalytic results, all materials demonstrated to be active under UV light [39]. Concerning solar light activity, undoped titanates’ performance was hindered by their large band gaps, as demonstrated by Tauc plot analyses reported in Figure 4c,d.
CBaT emerged as the best catalyst under both solar and UV light conditions, reaching TON of 2.3 μmol/gcat. Moreover, recycling tests on CBaT showed that the photocatalytic efficiency remained constant with the same CH4 selectivity after five cycles under solar light, suggesting a good stability of CBaT photocatalyst (Figure S5). It is possible that the high surface area (196 m2/g) and pore volume (0.34 cm3/g) of the sample facilitated the reactants’ interaction and consequent adsorption on the titanate surface as a means to promote the reaction mechanism. Dolat et al. reported that the surface charge decreases as the carbon content on the surface increases, preventing particle agglomeration and enhancing the specific surface area [40]. In addition, Tauc plot analysis (Figure 4c) suggested the formation of intra-gap energy levels, narrowing the band gap to 2.8 eV, which can contribute to suppress the recombination events and improve the photocatalytic activity [41]. Carbon atoms could be replaced with some oxygen atoms or gained interstitial positions in the bulk structure, generating intra-gap energy levels and lattice distortions, thereby shifting the perovskite-type absorption into the visible region [5]. Teng et al. studied the density of states of the orbitals for CBaT and suggested that the C 2p states of the dopant are distributed on both sides of the Fermi level, resulting in a narrower band gap [42]. As supported by elemental analyses, the successful doping of carbon was demonstrated, in accordance with the XRD pattern (Figure 1a), in which CBaT showed the occurence of an amorphous phase, which can promote photoactivity. CBaT (Figure 2b) exhibited aggregates on the BaT surface, which could be attributed to carbon deposition, as supported by EDX analysis (Figure S1a,b).
Regarding the CCaT photocatalyst, this showed greater photoactivity than CaT (0.8 μmol/gcat) under solar light, attributed to the narrow band gap, high surface area (314 m2/g), and small particle size, as revealed by the physisorption analysis (Figure 3b), which supported more efficient CO2 adsorption on its surface compared with bare CaT [43]. The absorption at lower relative pressures could be attributed to its higher BET surface area of 314 m2/g, probably reflecting the higher C% detected by elemental analysis. The XRD pattern (Figure 1) highlights the amorphous nature of carbon-doped materials. However, the CCaT catalyst showed lower performance than CBaT for CO2 degradation, although this sample exhibited a high surface area. As reported in Table 3, the lower photocatalytic activity of CCaT under solar light could be attributed to its wider band gap energy (3.1 eV) compared with CBaT (2.8 eV), restricting the CCaT’s photoactivity to the UV region. Additionally, the lower pore volume of CCaT (Table 2) might hinder the interactions between the reactants and the catalyst surface [44]. Furthermore, the ferroelectric properties of BaTiO3 enhance the electron mobility and charge separation in CBaT, thereby promoting the target reaction more effectively than in CCaT [45].
Regarding Chit-based titanates, as reported, ChitBaT produced 1.8 μmol/gcat of CH4 compared with 1.4 μmol/gcat for ChitCaT under UV irradiation. The solar photocatalytic activity of chitosan-treated materials (1.0 and 0.7 μmol/gcat of CH4) was found to be lower than that of carbon-doped ones, but still higher than the bare materials. From the SEM images (Figure 2c,f), chitosan seemed to be deposited on the titanate surface, possibly acting as an active or anchoring site, participating in the reaction. SEM images showed that mainly the Chit-doped materials presented carbon deposited on their surfaces, although without completely excluding the possibility of C incorporation into the crystal structure. Beyond acting as a dopant source, chitosan appears to function as a templating agent that influences crystal growth. Preethi et al. demonstrated the chitosan templating effect during the hydrothermal synthesis of TiO2, which affected crystallite orientation and limited crystallite size. This behavior was attributed to strong interactions between the functional groups of chitosan and titania, promoting the controlled growth of titania nanoparticles [46]. Similarly, Hamden et al. reported that chitosan templating enabled TiO2 crystallization at low temperatures of about 200 °C, generating TiO2 nanoparticles. Therefore, the presence of chitosan may have contributed to the observed structural and morphological features of the doped samples [47]. The lower surface area observed for ChitBaT (Table 2) was attributed to the accumulation of high molecular weight chitosan (and/or its derivatives) inside the pores of BaT during the synthesis, reducing the gas interaction at the surface of the perovskite. Additionally, as reported by Hussein et al. [48], chitosan modifies the electronic structure of TiO2 by forming surface complexes between their functional groups. This creates intermediate energy levels within the band gap, facilitating electronic transitions at lower photon energies. These states can effectively reduce the band gap and alter charge distribution, enhancing light absorption. A similar mechanism was hypothesized for Ba- and Ca-based titanates doped with chitosan, resulting in enhanced Ba- and Ca-based titanates, as also suggested by the calculated band gap values, Table 3 [48]. In the XPS spectra (Figure 5), ChitBaT and ChitCaT exhibited peaks which can be attributed to the aromatic carbon C-OH, C-N, C-O, and C=O bonds typical of chitosan, suggesting the possible deposition of carbon on the surface rather than its incorporation within the bulk material, as also highlighted by SEM analyses, Figure 2 [20]. Lastly, as reported by Zhang et al., it was not possible to distinguish carbon potentially incorporated into interstitial sites of the perovskite-related structure forming Ti-O-C bonds [31]. From these results, although the reflectance spectra (Figure 4a,b) suggested that CaT is more strongly affected by the presence of chitosan than BaT, the ChitBaT sample actually shows a higher amount of chitosan deposited on its surface compared to ChitCaT. Beside acting as doping and templating agent, chitosan tended to deposit on the titanate surface, possibly due to its high molecular weight. In contrast, glucose doping is more likely to have favored the incorporation of C into the titanate lattice while also contributing to particle size reduction. Concerning ChitCaT, the heterogeneous composition was related to a polycrystalline phase of the material, as supported by the XRD profile in Figure 1b. Badovinac et al. reported that these nanoparticles or small grains can play an important role in prompting the catalytic route due to the increase of the active surface area [49].
As expected and demonstrated by the large band gaps in the Tauc plot analyses reported in Figure 4c,d [43,50], undoped titanates (both BaT and CaT) had lower activity under solar irradiation. However, they exhibited higher photoactivity if irradiated by UV light, reaching TON values of 2.0 and 1.0 μmol/gcat of CH4, respectively. Although the band gap values were similar, the higher activity of BaT compared with CaT could be attributed to the ferroelectricity of BaTiO3, which promotes the electron mobility and improves charge separation, enhancing chemical reactions on its surface [43,51]. However, CaTiO3 does not possess ferroelectricity, possibly leading to a less efficient charge separation process. In addition, Ba2+ polarizability is higher than Ca2+; so, Ba2+ can more efficiently interact with CO2, stabilizing it on the surface. The XRD results (Figure 1b) indicate that the high crystallinity of Ca-based materials could negatively affect the photocatalytic activity, due to the lower presence of defects [52]. Furthermore, Kwak et al. reported that BaTiO3 shows a higher photocatalytic activity for CO2 photoreduction compared to SrTiO3 and CaTiO3, because of the lower recombination rate, the higher surface area, and the better interaction with carbon dioxide [53]. In the BaT’s XRD pattern, a small amount of barium carbonate (BaCO3) (PDF 45-1471) was identified, which was attributed to the superficial adsorption of CO2 from air during the synthesis steps [54]. Although an increased affinity for CO2 is desirable, a too high affinity could be an issue, resulting in the fast saturation of active superficial sites [21]. Therefore, the BaT’s XRD pattern in Figure 1a highlights the polycrystalline nature of Ba-derived titanate, which is also indicated by the SEM image (Figure 2a) [32].
In general, in the SEM images, carbon deposition on the surface is visible only on Chit-based materials. The observed increase in surface areas in both Ba and Ca samples was partially linked to the carbon deposition on the surface, as discussed above and as already reported [40]. The number of active sites, specific surface area, and the type of porosity played a crucial role in the photocatalytic reaction by supplying stronger interactions with the substrates and enhanced charge migration at the interfaces.
Among the C-doped materials, CBaT was the best photocatalyst under both solar and UV lights, reaching the same TON values of 2.3 μmol/gcat. Concerning the calcium-based titanates, they were just active under UV light, with CH4 productivity ranging from 1.4, for ChitCaT, to 1.8 μmol/gcat, for CCaT. The improved performance of the doped samples compared with bare CaT could be attributed to the presence of residual chitosan precursors in ChitCaT, which improves the catalyst–reactant interaction. On the other hand, CCaT exhibits a higher surface area, increasing the number of accessible active sites for CO2 reduction.
Concerning the Chit-based photocatalysts, chitosan was employed as a dual carbon and nitrogen source. As reported by Chen et al., who used urea as a C/N dopant, the synergistic effect of carbon and nitrogen doping can be explained by the fact that carbon acts as a photosensitizer, facilitating the accumulation of electrons in the conduction band, while nitrogen introduces intra-bandgap energy states. These N-induced states can contribute to band gap narrowing, thereby enhancing light absorption and potentially accelerating electron transfer.
Overall, doped catalysts achieved higher TON values under both UV and solar light compared to the bare ones, which were inactive under solar irradiation, supporting that doping is a valuable strategy to both enhance the photoactivity and broaden the absorption spectrum of photocatalysts. Furthermore, the use of glucose and chitosan as carbon and C/N dopants, respectively, highlights the potential of employing bio-sourced materials for CO2 photoreduction under solar light, aligning with principles of sustainability and green chemistry, such as the use of renewably sourced dopants, without compromising photocatalytic performance.
Table 4 shows a comparison with similar perovskite-containing structures applied in the same reaction in some recent works. The reported doped titanates demonstrate such similar or lower activity than our samples. In addition, carbon-doped Ba or Ca-based titanates have not been investigated under solar irradiating conditions, highlighting the novelty of this study within the literature.
4. Materials and Methods

4.1. Materials Preparation

Barium-based titanate (BaT) was prepared by mixing 50 mL of 0.1 M BaCl2·2H2O (5 mmol) (Sigma-Aldrich, Saint Louis, MO, USA, ≥99%), as the barium precursor, and 1.5 mL of titanium tetraisopropoxide (TTIP) (Sigma-Aldrich, 97%) in a beaker. The pH was adjusted to 12 by adding a 4 M solution of sodium hydroxide (NaOH) (Sigma-Aldrich, ≥98%) dropwise. After stirring at 300 rpm for 20 min, the solution was transferred into a Teflon vessel and kept at 180 °C in an autoclave for 8 h. The resulting mixture was allowed to cool down, filtered using a Gooch crucible, and washed with distilled water and ethanol. The white precipitate was dried in an oven at 110 °C for 12 h. The same procedure was applied for the calcium-based titanate (CaT).
For doped samples, some modifications were applied. After the solution of barium or calcium and titanium became homogeneous, glucose dextrose (Sigma-Aldrich) and chitosan with medium molecular weight 190–310 kDa (Sigma-Aldrich), acting respectively as carbon and carbon-nitrogen dopants, were added; the ratios and calculated moles are shown in Table 5. After stirring at 300 rpm for 20 min, the resulting solution was transferred into the autoclave. In these cases, the process was carried out at 180 °C for 20 h.

4.2. Photocatalytic Tests

CO2 photoreduction with water vapor was carried out in a gas-phase borosilicate batch reactor. A 125 W mercury UVA lamp (spectral range 315–400 nm; Helios Italquartz, Cambiago, Milan, Italy, GN125RZS) and a solar simulator (ABET technologies; Milford, CT, USA; model number 10500, 150 W Xenon arc lamp with AM 1.5G atmospheric filter) were used as the light sources, with irradiance of 40 W/m2 and 1000 W/m2, respectively. The 40 W/m2 and 1000 W/ m2 (AM 1.5 G spectrum, 1 sun) irradiance settings were selected as to simulate the ultraviolet (UV) portion of the solar spectrum and the total solar energy reaching the Earth’s surface, respectively.
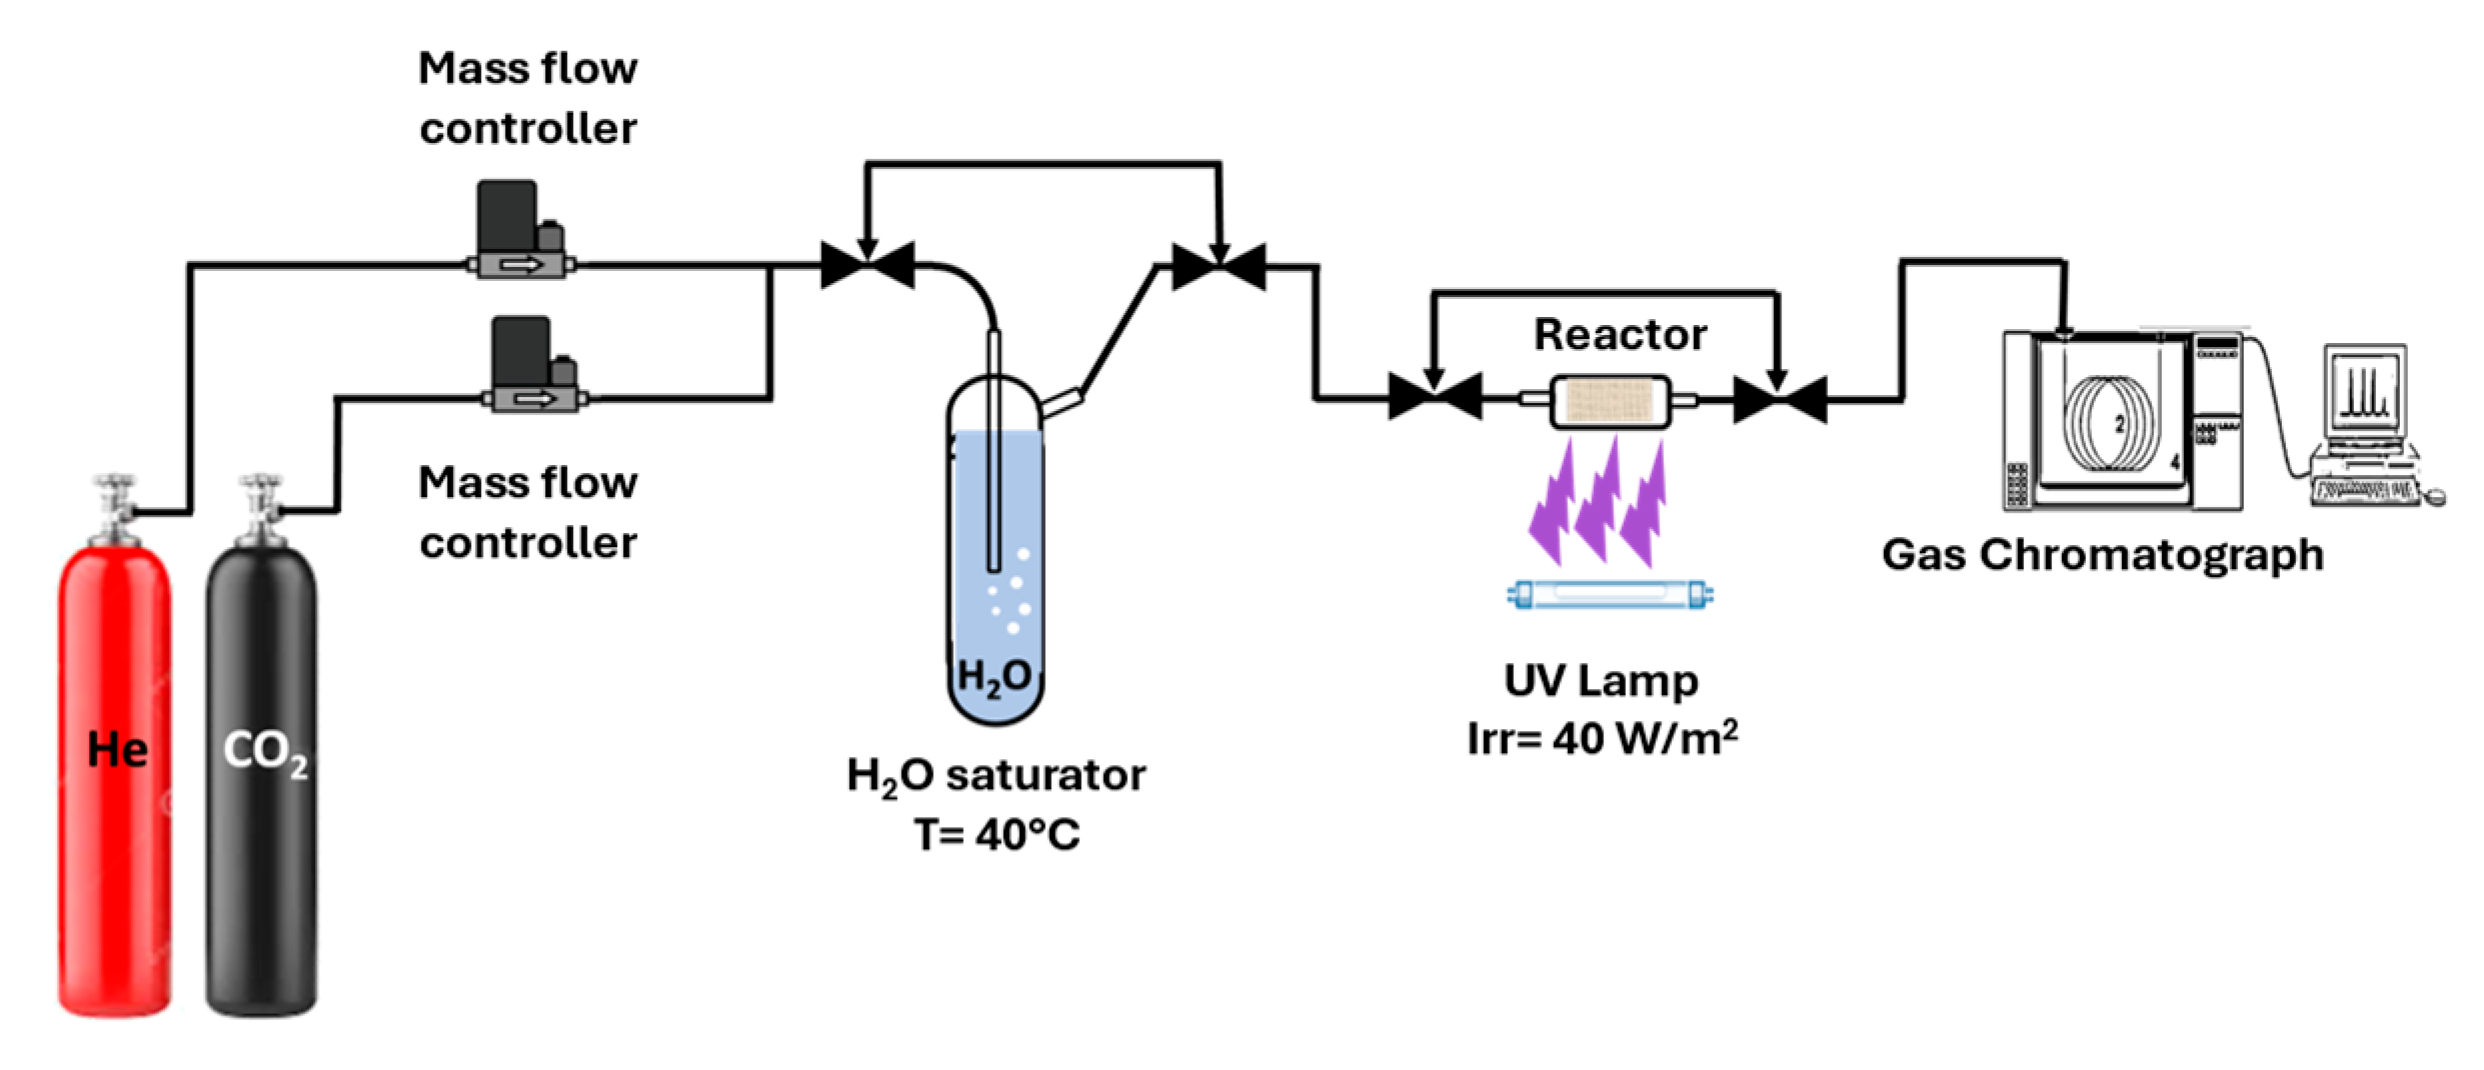
A schematic representation of the photoreduction system is shown in Figure 9. The gas-phase reaction conditions are reported in Table 6. The tests were carried out in the presence of gas reagents and light for 6 h. Reaction products were analyzed by gas chromatography (6890 Plus GC system, Agilent Technologies, Santa Clara, CA, USA) equipped with a Porapak Q column and a thermo-conductivity detector (TCD) using helium as carrier gas. The results are expressed in turnover number (TON), according to Equation (1).
T O N = μ m o l   ( p r o d u c t ) g   c a t a l y s t
Reusability studies were performed using the best structure under both UV and solar light to assess the photocatalyst stability. The catalyst was recycled in 5 runs; between every 2 runs, the catalyst-loaded reactor was kept under He flow overnight.

4.3. Materials Characterizations

To investigate the crystalline structure, X-ray diffraction (XRD) was performed with a Bruker D8 Advanced DaVinci diffractometer (Bruker France S.A.S, Champs-sur-Marne, France) equipped with a 1D detector LynxEye-XT (Bruker AXS GmbH, Karlsruhe, Germany) and using a CuKα radiation (λ = 1.5406 Å) source. Phase identification was performed using Bruker DIFFRAC.EVA with reference to the ICDD Powder Diffraction File (PDF) and the Crystallography Open Database (COD). Quantitative phase analysis (QPA) was achieved by the Rietveld method as implemented in the Bruker DIFFRAC.EVA v. 7.3 and TOPAS v. 7.0 software.
Scanning electron microscopy analysis was employed to investigate materials morphologies, using a field emission electron microscope (Electron Microscopy LEO 1525 ZEISS (Oberkochen, Germany), provided by the SmartSEM v. 2.0 software) equipped with an X-ray energy dispersion (EDX) detector (Bruker Quantax EDS, Berlin, Germany). Elemental composition and chemical mapping were determined using a Bruker Quantax EDX system equipped with a peltier-cooled BRUKER XFlash 410-M silicon drift detector. Semi-quantitative (standardless) results were based on a peak-to-background ZAF evaluation method (P/B-ZAF correction technology) and a series fit deconvolution model provided by the Esprit 1.9 software (Bruker). Nitrogen physisorption plots were employed to analyze the surface area and the type of porosity, using a Micromeritics TriStar II PLUS instrument (Malvern Panalytical, Worcestershire, UK). CHNS elemental analyses were applied to investigate the amount of carbon, hydrogen, nitrogen, and sulfur in the samples, using a UNICUBE organic elemental analyzer (Elementar Analysensysteme GmbH, Langenselbold, Germany), provided by Windows based UNICUBE operating 1.0.1 software with LIMS integration and auto sleep and wake-up function for automated and unattended overnight operation.
Nitrogen physisorption plots were employed to analyze the surface area and the type of porosity using a Micromeritics TriStar II PLUS instrument (Micromeritics Instrument Corporation, Norcross, GA, USA) provided by MicroActive v. 7.0 software.
Diffuse reflectance spectroscopy (DRS) was used to determine catalysts’ interaction with light and their band gaps. A Cary 100 Agilent (Santa Clara, CA, USA) operating at room temperature in the range of 300–800 nm (UV-VIS-NIR) was used. The results are reported as reflectance spectra. The Kubelka–Munk method (Equation (2)) was used to initially assess the band gap values from the absorption spectra.
F R = ( 1 R ) 2 2 R = K S
where R, K, and S are, respectively, the reflectance, absorption, and scattering coefficients of the sample [62]. Furthermore, Tauc plots are reported to correlate the absorption coefficient, α, to hν using Equation (3).
( α h ν ) η = C ( h ν E g )
where C is a constant and E g is the band gap. The exponent η refers to the nature of the electronic transition, which in this case is indirect (η = 1/2). The function of reflectance F(R) is directly proportional to ( α h ν ) . The band gap was calculated by extrapolating the intercept on the x-axis of the tangent drawn on the inflection point of the curve. FT-IR ATR (attenuated total reflection) spectra were obtained from pure samples with a Bruker Vertex 70 (Bruker, Ettlingen, Germany) spectrometer equipped with Platinum ATR-QL diamond cell and DTGS detector (4 cm−1 resolution, 32 scans). ATR correction was performed on spectra using OPUS v. 8.0 software. Surface chemical states were examined utilizing an ESCA-5000 Versa Probe X-ray Photoelectron Spectroscopy (XPS) system (Physical Electronics), employing an Al Kα radiation source (1486.7 eV) in conjunction with a 124 mm hemispherical electron analyzer, utilizing a PHI Genesis instrument from Physical Electronics (Chanhassen, MN, USA). Calibration during the XPS measurements was performed using the C 1s peak as a reference standard. The energy resolution of the system was set at 0.6 eV, with a pass energy of 27 eV for core level region acquisition and 224 eV during survey scans. To mitigate charge accumulation during X-ray irradiation, a dual-mode charge compensation technique was employed. Binding energy calibration was performed using the C 1s peak, standardized at 285.0 eV. The analysis of XPS data was conducted using CASA XPS software Version 2.3.17PR1.1. Baseline correction was applied via the Shirley method to remove background noise, thereby ensuring accurate peak representation. Peak identification relied on binding energy values sourced from the literature, and Gaussian–Lorentzian line shapes were utilized for peak fitting to resolve overlapping peaks, with the full width at half maximum (FWHM) values constrained to theoretical expectations. An asymmetric line shape was applied specifically for the sp2 component of the C 1s peak. The area under each fitted peak was integrated for quantification, employing sensitivity factors to convert peak areas into atomic percentages. Additionally, peak deconvolution was performed to differentiate between various oxidation states or chemical environments of the same element. The fitting results were validated against reference materials, ensuring reproducibility across multiple measurements.

5. Conclusions

In this study, Ba and Ca-based titanates were investigated as efficient photocatalytic materials for CO2 photoreduction under solar light. To enhance the photocatalytic activity, the support materials were doped with heteroatoms (C and C/N). Doping led to significant changes in the morphology and crystalline structure of the pristine materials, promoting the formation of amorphous phases. These modifications resulted in increased surface area and reduced band gaps, thereby improving light absorption in the visible region. Notably, the use of chitosan as both carbon and nitrogen source altered the morphology of Ba-based titanate, while preserving its crystalline structure. In addition, chitosan served not only as a dopant precursor but also as a templating agent, despite partially depositing on the catalyst surface. Meanwhile, glucose doping promoted the incorporation of carbon into the titanate lattice, thereby actively contributing to altering the optical behavior of the pristine materials. Overall, Ba-based materials exhibited a higher activity for CO2 photoreduction, where CBaT showed the best performance under solar light irradiation producing up to 2.3 μmol/gcat of methane, as a result of its high surface area, pore volume, and narrower band gap. Furthermore, the activity of the catalyst remained constant upon recycling, for up to five cycles. These findings indicate that doping Ca- and Ba-based titanates with heteroatoms could be a valuable strategy to enhance the photocatalytic efficiency of CO2 reduction into methane under solar light irradiation, which can potentially address the energy crisis of the current century.

Supplementary Materials

The following supporting information can be downloaded at: https://www.mdpi.com/article/10.3390/catal15090828/s1, Figure S1: XEDS images; Figure S2: FT-IR ATR spectra; Figure S3: XPS survey spectra; Figure S4: XPS spectra; Table S1: Relative concentration of elements of the samples; Figure S5: Recycling tests.

Author Contributions

Conceptualization, G.F. (Giulia Forghieri); methodology, G.F. (Giulia Forghieri) and G.F. (Giorgia Ferraro); validation, M.S. and G.C. (Giuseppina Cerrato); formal analysis, S.T., M.S., G.C. (Giuseppina Cerrato) and M.P.; investigation, G.C. (Giuseppe Cruciani), A.G., A.D.M. and C.B.; writing—original draft preparation, G.F. (Giorgia Ferraro); writing—review and editing, G.F. (Giulia Forghieri), S.T., M.P. and M.S.; supervision and funding acquisition, M.S. All authors have read and agreed to the published version of the manuscript.

Funding

This research was funded by SCORE-CARIPLO INSTM and PRIN SCORE2 projects.

Data Availability Statement

The data supporting the findings of this study are openly available under a creative common license. Further inquiries can be directed to the corresponding author.

Conflicts of Interest

The authors declare no conflicts of interest.

Abbreviations

The following abbreviations are used in this manuscript:
SEM-EDXScanning electron microscopy–dispersive X-ray spectroscopy
XPSX-ray photoelectron spectroscopy
FT-IR ATRFourier transform–infrared attenuated total reflection spectroscopy
DRSDiffuse reflectance spectroscopy
CHNSCarbon hydrogen nitrogen sulfur elemental analysis
XRDX-ray diffraction
CODCrystallography Open Database
CCSCarbon capture and storage
CCUCarbon capture and utilization
UVUltraviolet radiation
TONTurnover number
TTIPTitanium tetraisopropoxide
TCDThermo-conductivity detector

References

  1. IPCC_AR6_SYR_LongerReport.Pdf. Available online: https://www.ipcc.ch/report/ar6/syr/downloads/report/IPCC_AR6_SYR_LongerReport.pdf (accessed on 5 July 2023).
  2. U.S. Environmental Protection Agency (US EPA). Overview of Greenhouse Gases. Available online: https://www.epa.gov/ghgemissions/overview-greenhouse-gases (accessed on 2 July 2023).
  3. Nguyen, T.P.; Nguyen, D.L.T.; Nguyen, V.-H.; Le, T.-H.; Vo, D.-V.N.; Trinh, Q.T.; Bae, S.-R.; Chae, S.Y.; Kim, S.Y.; Le, Q.V. Recent Advances in TiO2-Based Photocatalysts for Reduction of CO2 to Fuels. Nanomaterials 2020, 10, 337. [Google Scholar] [CrossRef]
  4. Ma, J.; Sun, N.; Zhang, X.; Zhao, N.; Xiao, F.; Wei, W.; Sun, Y. A Short Review of Catalysis for CO2 Conversion. Catal. Today 2009, 148, 221–231. [Google Scholar] [CrossRef]
  5. Trevisan, V.; Olivo, A.; Pinna, F.; Signoretto, M.; Vindigni, F.; Cerrato, G.; Bianchi, C.L. C-N/TiO2 Photocatalysts: Effect of Co-Doping on the Catalytic Performance under Visible Light. Appl. Catal. B Environ. 2014, 160–161, 152–160. [Google Scholar] [CrossRef]
  6. Som, I.; Roy, M. Recent Development on Titania-Based Nanomaterial for Photocatalytic CO2 Reduction: A Review. J. Alloys Compd. 2022, 918, 165533. [Google Scholar] [CrossRef]
  7. Ferraro, G.; Pizzolato, M.; Botrè, T.; Cerrato, G.; Menegazzo, F.; Signoretto, M. CO2 Photoreduction Under Visible Light by TiO2 and Carbon Dots Derived from Pyrolized Bio-Oil. ChemistryOpen 2025, 14, e202400286. [Google Scholar] [CrossRef]
  8. Korčušková, M.; Svatík, J.; Tomal, W.; Šikyňová, A.; Vishakha, V.; Petko, F.; Galek, M.; Stalmach, P.; Ortyl, J.; Lepcio, P. Anatase and Rutile Nanoparticles in Photopolymer 3D-Printed Nanocomposites: Band Gap-Controlled Electron Interactions in Free-Radical and Cationic Photocuring. React. Funct. Polym. 2024, 200, 105923. [Google Scholar] [CrossRef]
  9. Grabowska, E. Selected Perovskite Oxides: Characterization, Preparation and Photocatalytic Properties—A Review. Appl. Catal. B Environ. 2016, 186, 97–126. [Google Scholar] [CrossRef]
  10. Kanhere, P.; Chen, Z. A Review on Visible Light Active Perovskite-Based Photocatalysts. Molecules 2014, 19, 19995–20022. [Google Scholar] [CrossRef] [PubMed]
  11. Mai, H.; Chen, D.; Tachibana, Y.; Suzuki, H.; Abe, R.; Caruso, R.A. Developing Sustainable, High-Performance Perovskites in Photocatalysis: Design Strategies and Applications. Chem. Soc. Rev. 2021, 50, 13692–13729. [Google Scholar] [CrossRef]
  12. Domingo-Tafalla, B.; Martínez-Ferrero, E.; Franco, F.; Palomares-Gil, E. Applications of Carbon Dots for the Photocatalytic and Electrocatalytic Reduction of CO2. Molecules 2022, 27, 1081. [Google Scholar] [CrossRef]
  13. Ferraro, G.; Di Vera, A.; Ghedini, E.; Marchiori, M.; Forghieri, G.; Canton, P.; Signoretto, M. Carbon-Dots-Conjugated Semiconductors for Enhanced Solar-Driven Photocatalysis. Appl. Catal. O Open 2024, 192, 206942. [Google Scholar] [CrossRef]
  14. Kumari, V.; Mittal, A.; Jindal, J.; Yadav, S.; Kumar, N. S-, N- and C-Doped ZnO as Semiconductor Photocatalysts: A Review. Front. Mater. Sci. 2019, 13, 1–22. [Google Scholar] [CrossRef]
  15. Humayun, M.; Qu, Y.; Raziq, F.; Yan, R.; Li, Z.; Zhang, X.; Jing, L. Exceptional Visible-Light Activities of TiO2-Coupled N-Doped Porous Perovskite LaFeO3 for 2,4-Dichlorophenol Decomposition and CO2 Conversion. Environ. Sci. Technol. 2016, 50, 13600–13610. [Google Scholar] [CrossRef] [PubMed]
  16. Arora, I.; Chawla, H.; Chandra, A.; Sagadevan, S.; Garg, S. Advances in the Strategies for Enhancing the Photocatalytic Activity of TiO2: Conversion from UV-Light Active to Visible-Light Active Photocatalyst. Inorg. Chem. Commun. 2022, 143, 109700. [Google Scholar] [CrossRef]
  17. Olivo, A.; Ghedini, E.; Pinna, F.; Marchese, D.; Signoretto, M.; Cruciani, G.; Manzoli, M. Tuning the Synthetic Parameters to Obtain Smart C-N Co-Doped Titania Photocatalysts for NOx Abatement. ChemistrySelect 2017, 2, 728–739. [Google Scholar] [CrossRef]
  18. Chen, D.; Jiang, Z.; Geng, J.; Wang, Q.; Yang, D. Carbon and Nitrogen Co-Doped TiO2 with Enhanced Visible-Light Photocatalytic Activity. Ind. Eng. Chem. Res. 2007, 46, 2741–2746. [Google Scholar] [CrossRef]
  19. Kanhere, P.; Shenai, P.; Chakraborty, S.; Ahuja, R.; Zheng, J.; Chen, Z. Mono- and Co-Doped NaTaO3 for Visible Light Photocatalysis. Phys. Chem. Chem. Phys. 2014, 16, 16085–16094. [Google Scholar] [CrossRef]
  20. Polidoro, D.; Perosa, A.; Rodríguez-Castellón, E.; Canton, P.; Castoldi, L.; Rodríguez-Padrón, D.; Selva, M. Metal-Free N -Doped Carbons for Solvent-Less CO2 Fixation Reactions: A Shrimp Shell Valorization Opportunity. ACS Sustain. Chem. Eng. 2022, 10, 13835–13848. [Google Scholar] [CrossRef]
  21. Phan, T.T.M.; Chu, N.C.; Luu, V.B.; Nguyen Xuan, H.; Pham, D.T.; Martin, I.; Carrière, P. Enhancement of Polarization Property of Silane-Modified BaTiO3 Nanoparticles and Its Effect in Increasing Dielectric Property of Epoxy/BaTiO3 Nanocomposites. J. Sci. Adv. Mater. Devices 2016, 1, 90–97. [Google Scholar] [CrossRef]
  22. Salem, M.M.; Darwish, M.A.; Altarawneh, A.M.; Alibwaini, Y.A.; Ghazy, R.; Hemeda, O.M.; Zhou, D.; Trukhanova, E.L.; Trukhanov, A.V.; Trukhanov, S.V.; et al. Investigation of the Structure and Dielectric Properties of Doped Barium Titanates. RSC Adv. 2024, 14, 3335–3345. [Google Scholar] [CrossRef] [PubMed]
  23. Revathi, M.; Saravanan, R.; Shanmugam, A. Production and Characterization of Chitinase from Vibrio Species, a Head Waste of Shrimp Metapenaeus Dobsonii (Miers, 1878) and Chitin of Sepiella Inermis Orbigny, 1848. Adv. Biosci. Biotechnol. 2012, 03, 392–397. [Google Scholar] [CrossRef]
  24. Sarhan, W.S.; Shiltagh, N.M. Structural and Electronic Properties of AgNPs Adsorbed by Glucose Molecules Determined Using DFT Theory. Heliyon 2024, 10, e38890. [Google Scholar] [CrossRef]
  25. Shnitov, V.V.; Rabchinskii, M.K.; Brzhezinskaya, M.; Stolyarova, D.Y.; Pavlov, S.V.; Baidakova, M.V.; Shvidchenko, A.V.; Kislenko, V.A.; Kislenko, S.A.; Brunkov, P.N. Valence Band Structure Engineering in Graphene Derivatives. Small 2021, 17, 2104316. [Google Scholar] [CrossRef] [PubMed]
  26. Davranov, K.T.; Normuradov, M.T.; Davlatov, M.A.; Dovranov, K.T.; Toshev, T.U.; Kurbonov, N.A. Preparation of Calcium Titanate Perovskite Compound, Optical and Structural Properties. East Eur. J. Phys. 2024, 3, 350–354. [Google Scholar] [CrossRef]
  27. Rached, A.; Wederni, M.A.; Khirouni, K.; Alaya, S.; Martín-Palma, R.J.; Dhahri, J. Structural, Optical and Electrical Properties of Barium Titanate. Mater. Chem. Phys. 2021, 267, 124600. [Google Scholar] [CrossRef]
  28. Nakamoto, K. Applications in Inorganic Chemistry. In Infrared and Raman Spectra of Inorganic and Coordination Compounds; John Wiley & Sons, Ltd.: Hoboken, NJ, USA, 2008; pp. 149–354. [Google Scholar]
  29. Yan, Y.; Yang, H.; Zhao, X.; Li, R.; Wang, X. Enhanced Photocatalytic Activity of Surface Disorder-Engineered CaTiO3. Mater. Res. Bull. 2018, 105, 286–290. [Google Scholar] [CrossRef]
  30. Virdee, A.K.; Martin, I.; Tan, J.Z.Y.; Forghieri, G.; Maroto-Valer, M.M.; Signoretto, M.; Van Der Spek, M.; Andresen, J.M. Investigation of Process Parameters for Solar Fuel Production Using Earth-Abundant Materials. J. CO2 Util. 2023, 75, 102568. [Google Scholar] [CrossRef]
  31. Zhang, J.; Huang, G.-F.; Li, D.; Zhou, B.-X.; Chang, S.; Pan, A.; Huang, W.-Q. Facile Route to Fabricate Carbon-Doped TiO2 Nanoparticles and Its Mechanism of Enhanced Visible Light Photocatalytic Activity. Appl. Phys. A 2016, 122, 994. [Google Scholar] [CrossRef]
  32. Lee, W.W.; Chung, W.-H.; Huang, W.-S.; Lin, W.-C.; Lin, W.-Y.; Jiang, Y.-R.; Chen, C.-C. Photocatalytic Activity and Mechanism of Nano-Cubic Barium Titanate Prepared by a Hydrothermal Method. J. Taiwan Inst. Chem. Eng. 2013, 44, 660–669. [Google Scholar] [CrossRef]
  33. Mishakov, I.V.; Bauman, Y.I.; Brzhezinskaya, M.; Netskina, O.V.; Shubin, Y.V.; Kibis, L.S.; Stoyanovskii, V.O.; Larionov, K.B.; Serkova, A.N.; Vedyagin, A.A. Water Purification from Chlorobenzenes Using Heteroatom-Functionalized Carbon Nanofibers Produced on Self-Organizing Ni-Pd Catalyst. J. Environ. Chem. Eng. 2022, 10, 107873. [Google Scholar] [CrossRef]
  34. Xu, B.; Tian, H.; Chen, J.; Wei, L.; Wang, K.; Wang, J. Adsorptive Removal of Sr(II) from Aqueous Solution by Xanthate Modified Chitosan. Prog. Nucl. Energy 2025, 180, 105621. [Google Scholar] [CrossRef]
  35. Li, D.; Calebe, V.C.; Li, Y.; Liu, H.; Lei, Y. Interstitial N-Doped TiO2 for Photocatalytic Methylene Blue Degradation under Visible Light Irradiation. Catalysts 2024, 14, 681. [Google Scholar] [CrossRef]
  36. Habisreutinger, S.N.; Schmidt-Mende, L.; Stolarczyk, J.K. Photocatalytic reduction of CO2 on TiO2 and other semiconductors. Angew. Chem. Int. Ed. 2013, 29, 7372–7408. [Google Scholar] [CrossRef] [PubMed]
  37. Shen, H.; Peppel, T.; Strunk, J.; Sun, Z. Photocatalytic Reduction of CO2 by Metal-Free-Based Materials: Recent Advances and Future Perspective. Sol. RRL 2020, 4, 1900546. [Google Scholar] [CrossRef]
  38. Le, Q.V.; Nguyen, V.-H.; Nguyen, T.D.; Sharma, A.; Rahman, G.; Nguyen, D.L.T. Light-Driven Reduction of Carbon Dioxide: Altering the Reaction Pathways and Designing Photocatalysts toward Value-Added and Renewable Fuels. Chem. Eng. Sci. 2021, 237, 116547. [Google Scholar] [CrossRef]
  39. Hu, Q.; Chen, L.; Xie, X.; Qin, Z.; Ji, H.; Su, T. Construction of Electron Bridge and Activation of MoS2 Inert Basal Planes by Ni Doping for Enhancing Photocatalytic Hydrogen Evolution. Acta Phys.-Chim. Sin. 2024, 40, 2406024. [Google Scholar] [CrossRef]
  40. Dolat, D.; Quici, N.; Kusiak-Nejman, E.; Morawski, A.W.; Li Puma, G. One-Step, Hydrothermal Synthesis of Nitrogen, Carbon Co-Doped Titanium Dioxide (N,CTiO2) Photocatalysts. Effect of Alcohol Degree and Chain Length as Carbon Dopant Precursors on Photocatalytic Activity and Catalyst Deactivation. Appl. Catal. B Environ. 2012, 115–116, 81–89. [Google Scholar] [CrossRef]
  41. Zhang, S.; Song, L. Preparation of Visible-Light-Active Carbon and Nitrogen Codoped Titanium Dioxide Photocatalysts with the Assistance of Aniline. Catal. Commun. 2009, 10, 1725–1729. [Google Scholar] [CrossRef]
  42. Teng, Z.; Jiang, J.; Chen, G.; Ma, C.; Zhang, F. The Electronic Structures and Optical Properties of B, C or N Doped BaTiO3. AIP Adv. 2018, 8, 095216. [Google Scholar] [CrossRef]
  43. Bantawal, H.; Krishna Bhat, D. Hierarchical Porous BaTiO3 Nano-Hexagons as A Visible Light Photocatalyst. Int. J. Eng. Technol. 2018, 7, 105. [Google Scholar] [CrossRef]
  44. Jin, Y.; Yuan, X.; Zhou, B.; Mo, S.; Zhang, W.; Peng, Y.; Wang, Q.; Li, J.; Si, W. Constructing Active Lattice Oxygen in High Covalent Perovskites for Boosting Catalytic Activity. Appl. Catal. B Environ. Energy 2024, 359, 124510. [Google Scholar] [CrossRef]
  45. Feng, K.; Liu, X.; Si, D.; Tang, X.; Xing, A.; Osada, M.; Xiao, P. Ferroelectric BaTiO3 Dipole Induced Charge Transfer Enhancement in Dye-Sensitized Solar Cells. J. Power Sources 2017, 350, 35–40. [Google Scholar] [CrossRef]
  46. Preethi, T.; Abarna, B.; Rajarajeswari, G.R. Influence of Chitosan–PEG Binary Template on the Crystallite Characteristics of Sol–Gel Synthesized Mesoporous Nano-Titania Photocatalyst. Appl. Surf. Sci. 2014, 317, 90–97. [Google Scholar] [CrossRef]
  47. Hamden, Z.; Bouattour, S.; Ferraria, A.M.; Ferreira, D.P.; Vieira Ferreira, L.F.; Botelho Do Rego, A.M.; Boufi, S. In Situ Generation of TiO2 Nanoparticles Using Chitosan as a Template and Their Photocatalytic Activity. J. Photochem. Photobiol. Chem. 2016, 321, 211–222. [Google Scholar] [CrossRef]
  48. Hussein, E.M.; Desoky, W.M.; Hanafy, M.F.; Guirguis, O.W. Effect of TiO2 Nanoparticles on the Structural Configurations and Thermal, Mechanical, and Optical Properties of Chitosan/TiO2 Nanoparticle Composites. J. Phys. Chem. Solids 2021, 152, 109983. [Google Scholar] [CrossRef]
  49. Guo, L.; Yang, Y.; Fraser, P.J.; Velders, G.J.M.; Liu, Z.; Cui, D.; Quan, J.; Cai, Z.; Yao, B.; Hu, J.; et al. Projected Increases in Emissions of High Global Warming Potential Fluorinated Gases in China. Commun. Earth Environ. 2023, 4, 205. [Google Scholar] [CrossRef]
  50. Alammar, T.; Hamm, I.; Wark, M.; Mudring, A.-V. Low-Temperature Route to Metal Titanate Perovskite Nanoparticles for Photocatalytic Applications. Appl. Catal. B Environ. 2015, 178, 20–28. [Google Scholar] [CrossRef]
  51. Shi, R.; Waterhouse, G.I.N.; Zhang, T. Recent Progress in Photocatalytic CO2 Reduction Over Perovskite Oxides. Sol. RRL 2017, 1, 1700126. [Google Scholar] [CrossRef]
  52. Brown, J.J.; Ke, Z.; Ma, T.; Page, A.J. Defect Engineering for Photocatalysis: From Ternary to Perovskite Oxynitrides. ChemNanoMat 2020, 6, 708–719. [Google Scholar] [CrossRef]
  53. Kwak, B.S.; Kang, M. Evaluation of Photoreduction Performance of CO2 to CH4 with H2O Over Alkaline-Earth-Metal-Based Peroskite Nanoparticles. J. Nanosci. Nanotechnol. 2017, 17, 7351–7357. [Google Scholar] [CrossRef]
  54. Utara, S.; Hunpratub, S. Ultrasonic Assisted Synthesis of BaTiO3 Nanoparticles at 25 °C and Atmospheric Pressure. Ultrason. Sonochem. 2018, 41, 441–448. [Google Scholar] [CrossRef]
  55. Yang, G.; Xiong, J.; Lu, M.; Wang, W.; Li, W.; Wen, Z.; Li, S.; Li, W.; Chen, R.; Cheng, G. Co-Embedding Oxygen Vacancy and Copper Particles into Titanium-Based Oxides (TiO2, BaTiO3, and SrTiO3) Nanoassembly for Enhanced CO2 Photoreduction through Surface/Interface Synergy. J. Colloid Interface Sci. 2022, 624, 348–361. [Google Scholar] [CrossRef]
  56. Ma, Y.; Yi, X.; Wang, S.; Li, T.; Tan, B.; Chen, C.; Majima, T.; Waclawik, E.R.; Zhu, H.; Wang, J. Selective Photocatalytic CO2 Reduction in Aerobic Environment by Microporous Pd-Porphyrin-Based Polymers Coated Hollow TiO2. Nat. Commun. 2022, 13, 1400. [Google Scholar] [CrossRef]
  57. Zhou, H.; Guo, J.; Li, P.; Fan, T.; Zhang, D.; Ye, J. Leaf-Architectured 3D Hierarchical Artificial Photosynthetic System of Perovskite Titanates Towards CO2 Photoreduction Into Hydrocarbon Fuels. Sci. Rep. 2013, 3, 1667. [Google Scholar] [CrossRef] [PubMed]
  58. Xie, K.; Umezawa, N.; Zhang, N.; Reunchan, P.; Zhang, Y.; Ye, J. Self-Doped SrTiO3−δ Photocatalyst with Enhanced Activity for Artificial Photosynthesis under Visible Light. Energy Environ. Sci. 2011, 4, 4211. [Google Scholar] [CrossRef]
  59. Zhang, Q.; Gao, T.; Andino, J.M.; Li, Y. Copper and Iodine Co-Modified TiO2 Nanoparticles for Improved Activity of CO2 Photoreduction with Water Vapor. Appl. Catal. B Environ. 2012, 123–124, 257–264. [Google Scholar] [CrossRef]
  60. Edelmannová, M.; Lin, K.-Y.; Wu, J.C.S.; Troppová, I.; Čapek, L.; Kočí, K. Photocatalytic Hydrogenation and Reduction of CO2 over CuO/ TiO2 Photocatalysts. Appl. Surf. Sci. 2018, 454, 313–318. [Google Scholar] [CrossRef]
  61. Li, P.; Ouyang, S.; Xi, G.; Kako, T.; Ye, J. The Effects of Crystal Structure and Electronic Structure on Photocatalytic H2 Evolution and CO2 Reduction over Two Phases of Perovskite-Structured NaNbO3. J. Phys. Chem. C 2012, 116, 7621–7628. [Google Scholar] [CrossRef]
  62. Murzin, A.O.; Samsonova, A.Y.; Stoumpos, C.C.; Selivanov, N.I.; Emeline, A.V.; Kapitonov, Y.V. Diffuse Reflectance Spectroscopy with Dilution: A Powerful Method for Halide Perovskites Study. Molecules 2023, 28, 350. [Google Scholar] [CrossRef]
Figure 1. XRD patterns of (a) Ba-based and (b) Ca-based photocatalysts.
Catalysts 15 00828 g001
Figure 2. SEM images of (a) BaT, (b) CBaT, (c) ChitBaT, (d) CaT, (e) CCaT, and (f) ChitCaT.
Catalysts 15 00828 g002
Figure 3. N2 Adsorption/desorption isotherms of (a) Ba-based and (b) Ca-based titanates.
Catalysts 15 00828 g003
Figure 4. Diffuse reflectance spectra of (a) Ba-based and (b) Ca-based titanates; and the corresponding Tauc plots of (c) Ba-based and (d) Ca-based titanates.
Catalysts 15 00828 g004
Figure 5. C 1s XPS spectra of (a) BaT, (b) CBaT, (c) ChitBaT, (d) CaT, (e) CCaT, and (f) ChitCaT.
Catalysts 15 00828 g005
Figure 6. N 1s XPS spectra of (a) ChitBaT and (b) ChitCaT. Red line results of fitting using a GL(30) single component.
Catalysts 15 00828 g006
Figure 7. CO2 photoreduction results under (a) UV and (b) solar light.
Catalysts 15 00828 g007
Figure 8. Schematic mechanism for CO2 photoreduction with H2O on doped titanates.
Catalysts 15 00828 g008
Figure 9. Schematic representation of the CO2 photoreduction setup.
Catalysts 15 00828 g009
Table 1. Atomic percentage of nitrogen and carbon in the materials.
SampleN (%)C (%)C/N
BaT0.000.00-
CBaT0.002.45-
ChitBaT0.614.056.63
CaT0.000.00-
CCaT0.004.29-
ChitCaT0.936.176.63
Table 2. Surface area and pore volume values measured by N2 physisorption method.
SampleBET Surface Area (m2/g)Pore Volume (cm3/g)
BaT1810.04
CBaT1960.34
ChitBaT960.23
CaT840.23
CCaT3140.07
ChitCaT530.14
Table 3. The energy band gap values of the prepared titanates.
SampleEnergy Band Gap (eV)
BaT3.2
CBaT2.8
ChitBaT3.0
CaT3.5
CCaT3.1
ChitCaT3.2
Table 4. Summary of titanate photocatalysts for the photocatalytic reduction of CO2 in gas phase.
Photocatalytic MaterialReaction MediumIncident LightTime (h)CH4 Yield (μmol/g.h)References
BaTiO3GasUV-SolarNot mentioned0.160[55]
TiO2GasUV–Solar24.200[56]
Au-CaTiO3GasSolar240.029[57]
Au-SrTiO3GasSolar240.231[57]
Pt-SrTiO3GasSolar30.250[58]
Cu-TiO2GasUV–Solar50.076[59]
CuO-TiO2LiquidUV41.750[60]
Pt-NaNbO3GasUV–Solar80.245 *[61]
LaFeO3LiquidSolar82.500 *[15]
CBaTGasSolar60.380Present study
* μmol/h.
Table 5. Materials labels, doping precursors and the composition percentage.
Sample CodeMaterial StructureDoping PrecursorRatioTheoretical Moles (mmol)
BaTBa-based titanates--5.0
CBaTC-Ba-based titanatesGlucose1Ba:1Ti:1C0.8
ChitBaTChitosan–Ba-based titanatesChitosan1Ba:1Ti:0.5N:0.5C0.5
CaTCa-based titanates--5.0
CCaTC-Ca-based titanatesGlucose1Ca:1Ti:1C0.8
ChitCaTChitosan–Ca-based titanatesChitosan1Ca:1Ti:0.5N:0.5C0.5
Table 6. Experimental conditions for the gas-phase CO2 photoreduction.
ParametersUV LightSOLAR Light
CO2/H2O (a.u.)13.313.3
Temperature (°C)6035
Pressure (atm)11
Time (hours)66
Light intensity (W/m2)401000
Catalyst mass (mg)1010
Disclaimer/Publisher’s Note: The statements, opinions and data contained in all publications are solely those of the individual author(s) and contributor(s) and not of MDPI and/or the editor(s). MDPI and/or the editor(s) disclaim responsibility for any injury to people or property resulting from any ideas, methods, instructions or products referred to in the content.