Article

Mechanism and Kinetic Parameters of Functionalized Composite Carbon-Based Electrocatalyst During Oxidation of Glycerol Using Dynamic Electrochemical Impedance Spectroscopy

by
Faisal Abnisa
1,*,
Pater Adeniyi Alaba
2,* and
Ramesh Kanthasamy
1
1
Department of Chemical and Materials Engineering, Faculty of Engineering, King Abdulaziz University, Rabigh 21911, Saudi Arabia
2
Department of Chemical Engineering, Faculty of Engineering, University of Malaya, Kuala Lumpur 50603, Malaysia
*
Authors to whom correspondence should be addressed.
Catalysts 2025, 15(9), 805; https://doi.org/10.3390/catal15090805
Submission received: 30 May 2025 / Revised: 10 August 2025 / Accepted: 16 August 2025 / Published: 25 August 2025
(This article belongs to the Section Electrocatalysis)

Abstract

This research investigates the glycerol oxidation reaction on carbon-functionalized composites using Tafel behavior, exchange current density (ECD), rate constant, and dynamic electrochemical impedance spectroscopy (DEIS) data fitting. The aim is to gather essential data for fabricating glycerol electrooxidation electrodes in an alkaline medium. Corrected net current analysis reveals that the nitrogen-doped activated carbon black composite electrode (ACB-N2) exhibits the highest instantaneous catalytic activity, with a net current density of 1.3 mA cm−2 at 1.0 V vs. SCE. However, the dual-doped nitrogen and fluorine composite (ACB-N2F2) demonstrates the lowest Tafel slope (177.97 mV dec−1), indicating faster kinetics, and it maintains superior electrochemical stability during chronoamperometric testing. ACB-N2F2 exhibits the highest ECD (1.0129 mA cm−2) and the lowest Ts and rate constant (2.62 × 109 cm s−1), indicating the fastest electron transfer. These findings suggest that while ACB-N2 offers the highest net GOR activity, ACB-N2F2 combines kinetic efficiency and long-term durability, making it a promising candidate for practical GOR applications. The rate-determining step is water adsorption at low overpotentials (0.55 V, 0.5 V, and 0.4 V vs. SCE for ACB-F2, ACB-N2, and ACB-N2F2, respectively).

1. Introduction

As developments in materials technology continue, fabrication of electrocatalysts for alcohol electrooxidation has become a vital consideration in the fields of electrochemical energy conversion, the production of value-added chemicals, and storage devices like metal–air batteries, polymer electrolyte fuel cells (PEFCs), and anion exchange membrane fuel cells (AEMFCs) [1,2,3,4]. Although ethanol and methanol are already being utilized in fuel cells, glycerol may be a more suitable option due to its higher energy content than other alcohols. However, the C-C bond cleavage in glycerol presents a challenge. This has resulted in an extensive search for more effective electrocatalytic materials [5,6,7,8].
Several studies have investigated the mechanism of alcohol oxidation over platinum-based electrodes using various techniques, including electrochemical methods [9,10], differential electrochemical mass spectrometry (DEMS) [11,12], nonlinear optics [13], and Fourier transform infrared spectroscopy (FTIR) [14]. Some scientists have also observed oscillations and bistability under current control [15] and voltammograms with sharp peaks [10,16]. The primary products of glycerol oxidation are oxalic acid, glycolic acid, tartronic acid, and glyceric acid [17]. Extensive research has been performed on the oxidation of glycerol over noble metals and their alloys using various techniques [18,19,20].
The study of glycerol oxidation mechanisms using electrochemical impedance spectroscopy faces challenges due to contradictory outcomes reported in the literature. While some authors observe single inductive or capacitive loops on the complex plane plots, others report multiple loops or negative resistances [21,22,23]. A vital aspect of electrochemical impedance spectroscopy (EIS) analysis involves constructing an equivalent circuit model representing the process. This model gives numerical values for characterizing the electrochemical reaction. Several such models include redox representations based on numerical process models [24] and classical equivalent circuits [25,26,27]. However, choosing a single, generally applicable circuit for describing complex redox reactions remains a significant challenge. Moreover, several scientists have utilized EIS to study electrode ageing under constant current conditions or overpotential [28].
While EIS can be employed in studying electrocatalyst kinetics, such as charge transfer resistance at the electrode–electrolyte interface under specific conditions [29], its application during potential cycling for the oxidation of glycerol has been limited.
To resolve this gap, Seland et al. [29] investigated formic acid oxidation over Pt-based electrodes using dynamic electrochemical impedance spectroscopy (DEIS). It can analyze the surface state under dynamic conditions by investigating the relationship between adsorbate coverage and potential during a slow sweep. Their earlier work on methanol oxidation was reachable and demonstrated the effectiveness of DEIS in revealing surface information that is not accessible via steady-state EIS [30]. With DEIS, the complex plane plot structure changes as the potential is affected by a small number of millivolts, even where the cyclic voltammetry (CV) exhibits a poor structure [29,30,31,32,33].
Although previous studies have explored the Tafel kinetics of electrooxidation reactions involving methanol, ethanol, and glycerol using electrochemical impedance spectroscopy (EIS) and cyclic voltammetry (CV) [29,30,32,33], a comprehensive understanding of the kinetic parameters specifically for glycerol oxidation remains limited. Extensive experiments are necessary to establish the rate-determining step (rds), compute the theoretical Ts, and find the exchange current density (ECD) and rate constants. Our recent studies explored glycerol electrooxidation using heteroatom-doped activated carbon black (ACB) composites, demonstrating the promise of rationally doped ACB [17]. We further investigated the parameters of these composite electrodes using perturbation amplitude-based DEIS [31]. However, further research is needed to understand the electrode mechanism and kinetic parameters for the oxidation of glycerol on functionalized composite carbon electrodes.
This study aims to uncover the vital aspects of glycerol reactivity on composite carbon electrodes using corresponding electrochemical analysis with DEIS under potential cycling conditions. It explores the identification of rds and the determination of the ECD, rate constant, and theoretical Ts. These findings will be essential for fabricating effective glycerol electrooxidation electrodes in basic solutions.

2. Results and Discussion

2.1. Impedance Spectra

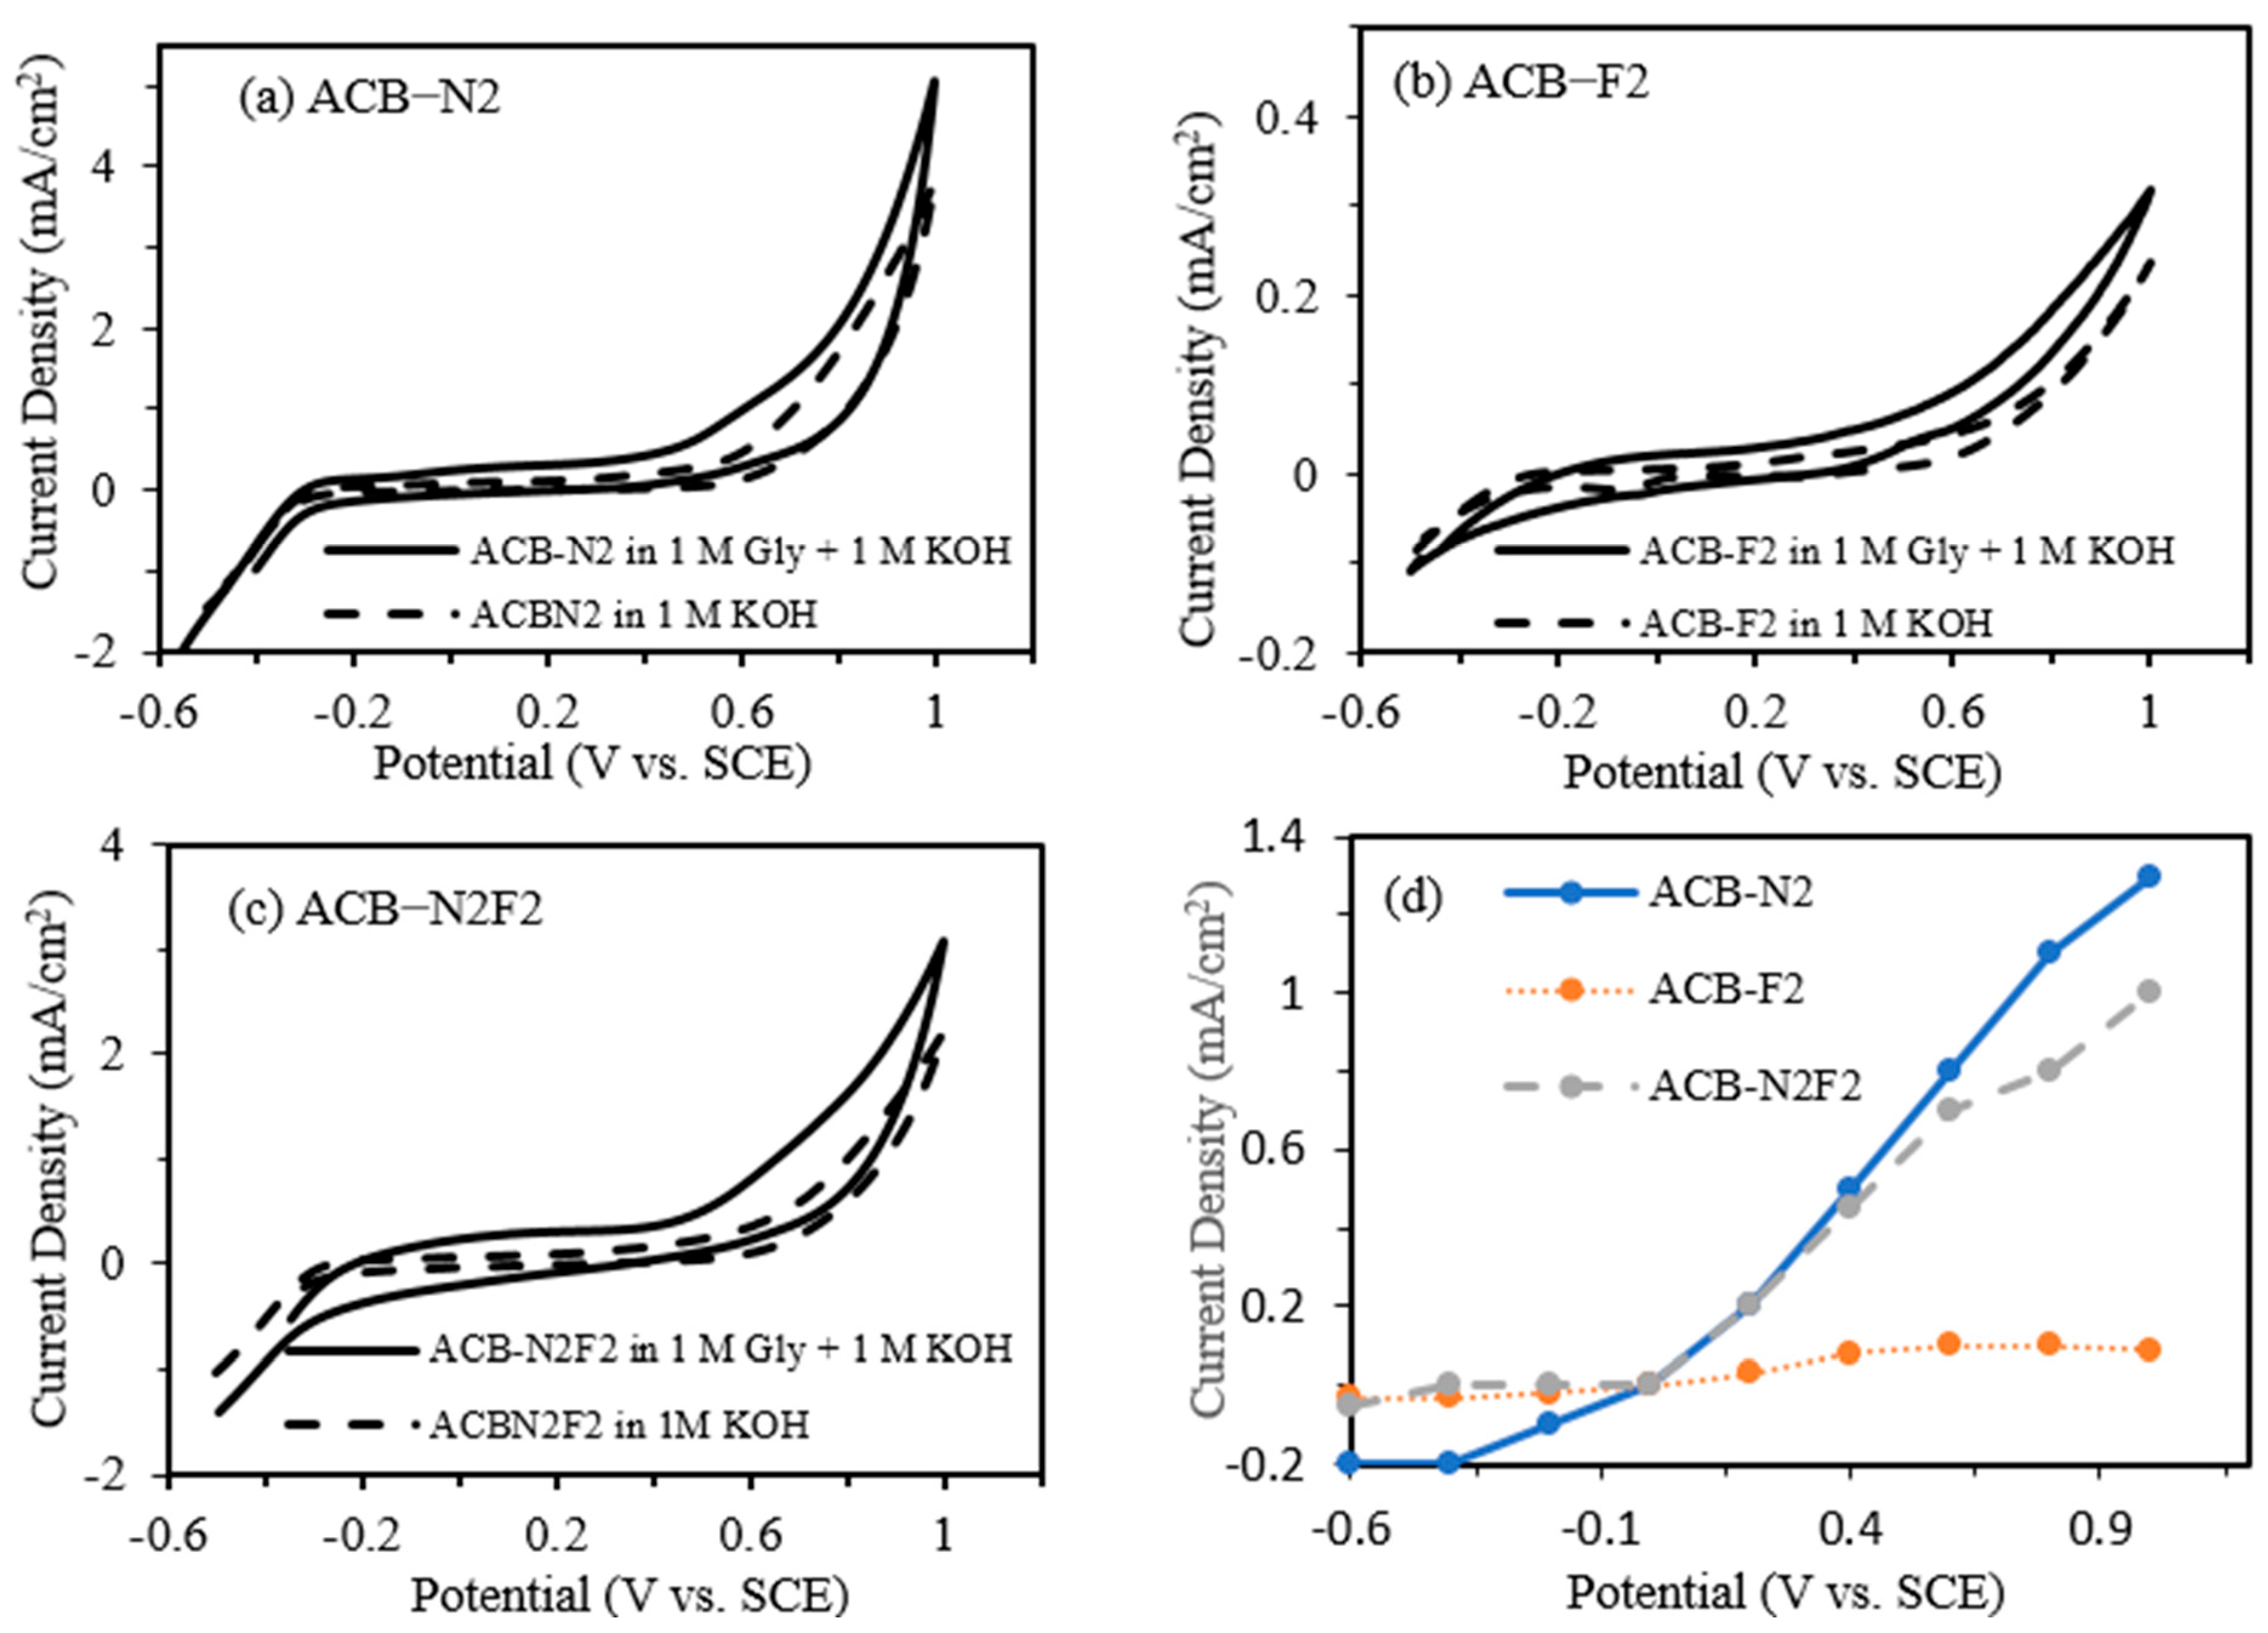
Figure 1 gives the CV results comparing the performance of the electrodes with and without 1 M glycerol. Adding 1 M glycerol considerably improves the electrochemical response of the composite electrodes. The electrocatalytic activity toward glycerol oxidation is more accurately assessed by the difference in current densities between the two conditions. For example, at 1.0 V vs. SCE, the ACB-N2F2 electrode exhibits a current density of 3.08 mA/cm2 in the presence of 1 M glycerol, compared to 1.99 mA/cm2 in its absence, resulting in a net glycerol oxidation current of approximately 1.09 mA/cm2 (Figure 1d). This net enhancement, rather than the absolute current, serves as a more reliable indicator of catalytic activity. Notably, this difference reflects the contribution of glycerol electrooxidation over the background capacitive and surface oxidation processes. Similar behavior is observed for the ACB-N2 and ACB-F2 electrodes. These observations align with the literature reports, which emphasize the importance of subtracting baseline currents to isolate true electrocatalytic effects. Accordingly, we have revised our analysis to emphasize these differences as a more accurate reflection of the electrode’s activity.
The corrected values (Figure 1d) indicate that the ACB-N2 electrode consistently exhibits the highest net current density across the potential window, with a maximum of 1.3 mA/cm2 at 1.0 V, followed by ACB-N2F2 (1.0 mA/cm2) and ACB-F2 (0.09 mA/cm2). This trend highlights ACB-N2 as the most active catalyst for glycerol oxidation based on instantaneous reaction current, contrary to earlier interpretations.
However, the glycerol electrooxidation activity of these electrodes, as measured using cyclic amperometry (CA), was previously reported [31]. The outstanding activity of ACB-N2F2 is attributed to the high electronegativity difference between fluorine and nitrogen. Therefore, when long-term performance and reaction kinetics are considered, ACB-N2F2 displays notable advantages. Despite its lower ECSA (1057.10 cm2/g) compared to ACB-N2 (1309.84 cm2/g) and ACB-F2 (1751.39 cm2/g), ACB-N2F2 exhibits the lowest Tafel slope (177.97 mV dec−1), indicating faster kinetics and more efficient charge transfer during glycerol oxidation. This kinetic advantage suggests that the synergistic effect of dual N-F doping enhances active site reactivity and electronic conductivity, compensating for the reduction in surface area.
Additionally, chronoamperometry results confirm the superior stability of ACB-N2F2, which maintains a stable current over extended periods, unlike ACB-N2 and ACB-F2, which show significant current decay. This behavior reflects the enhanced structural integrity and electrochemical robustness conferred by dual doping, supporting its suitability for long-term catalytic applications.
In summary, while ACB-N2 demonstrates the highest net glycerol oxidation current, ACB-N2F2 excels in kinetic efficiency and electrochemical stability, making it a promising candidate for durable electrocatalysis in glycerol oxidation systems. The performance differences underscore the importance of evaluating both instantaneous activity and stability when selecting electrocatalysts for real-world applications.
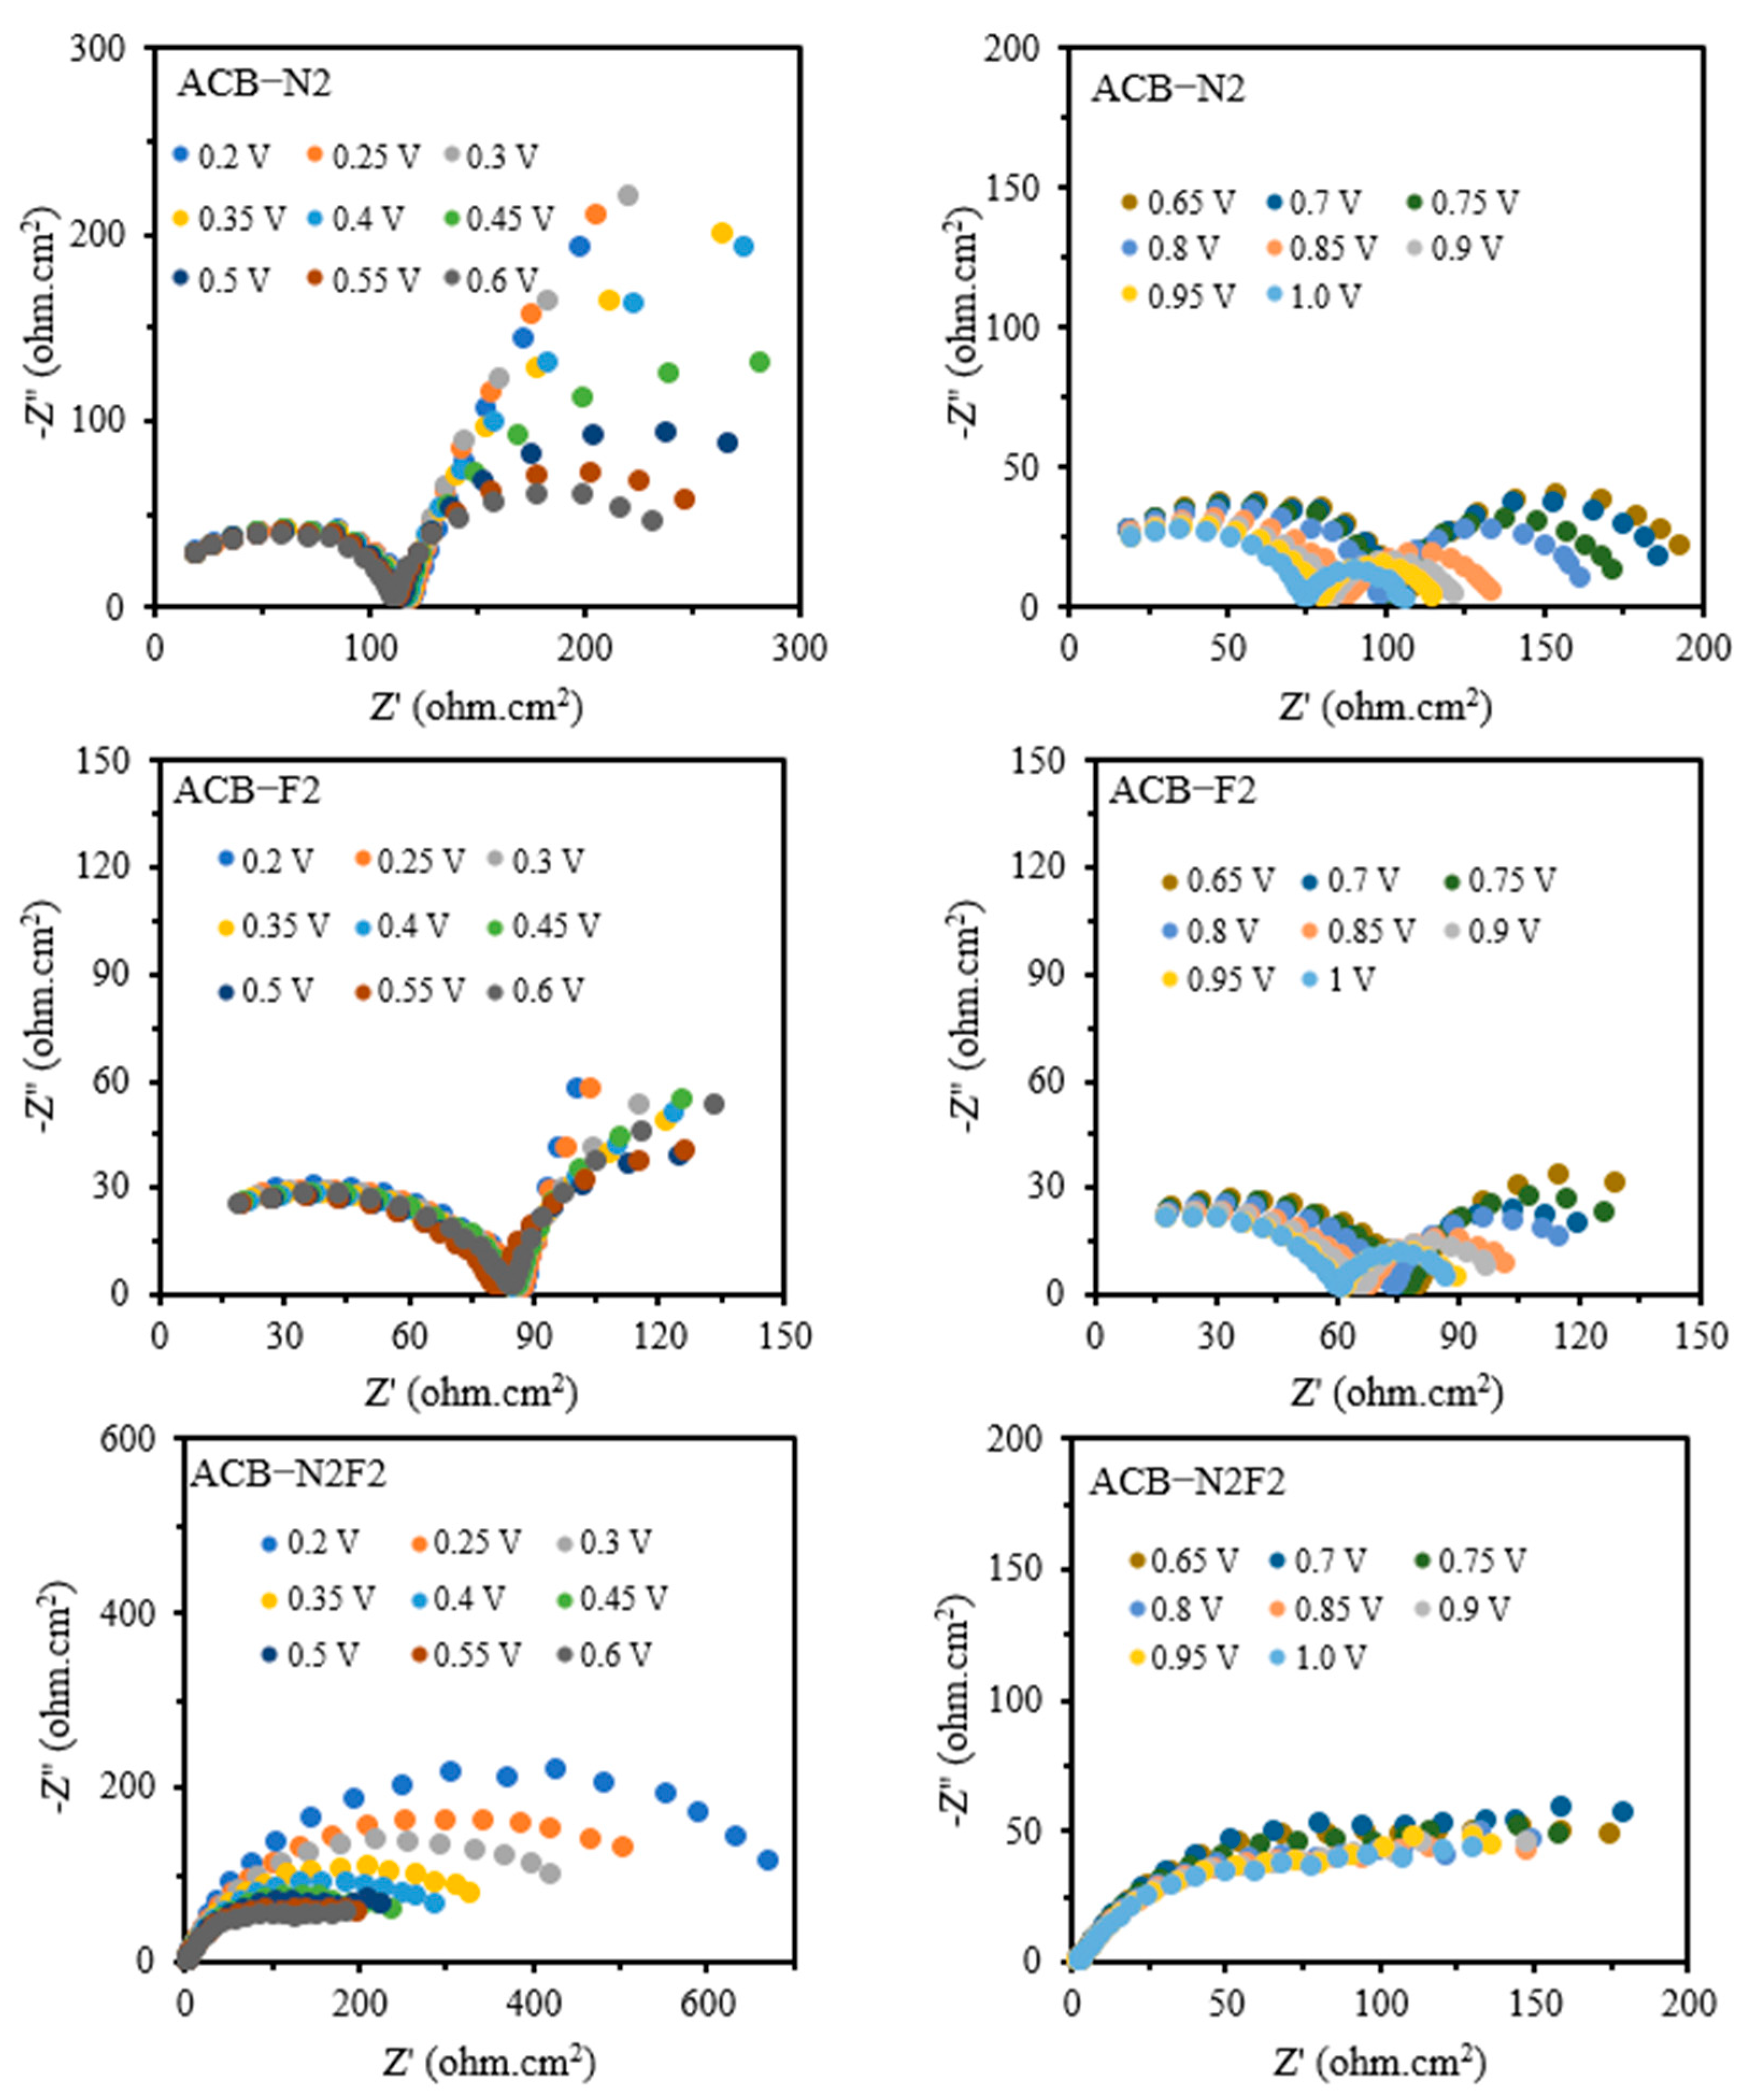
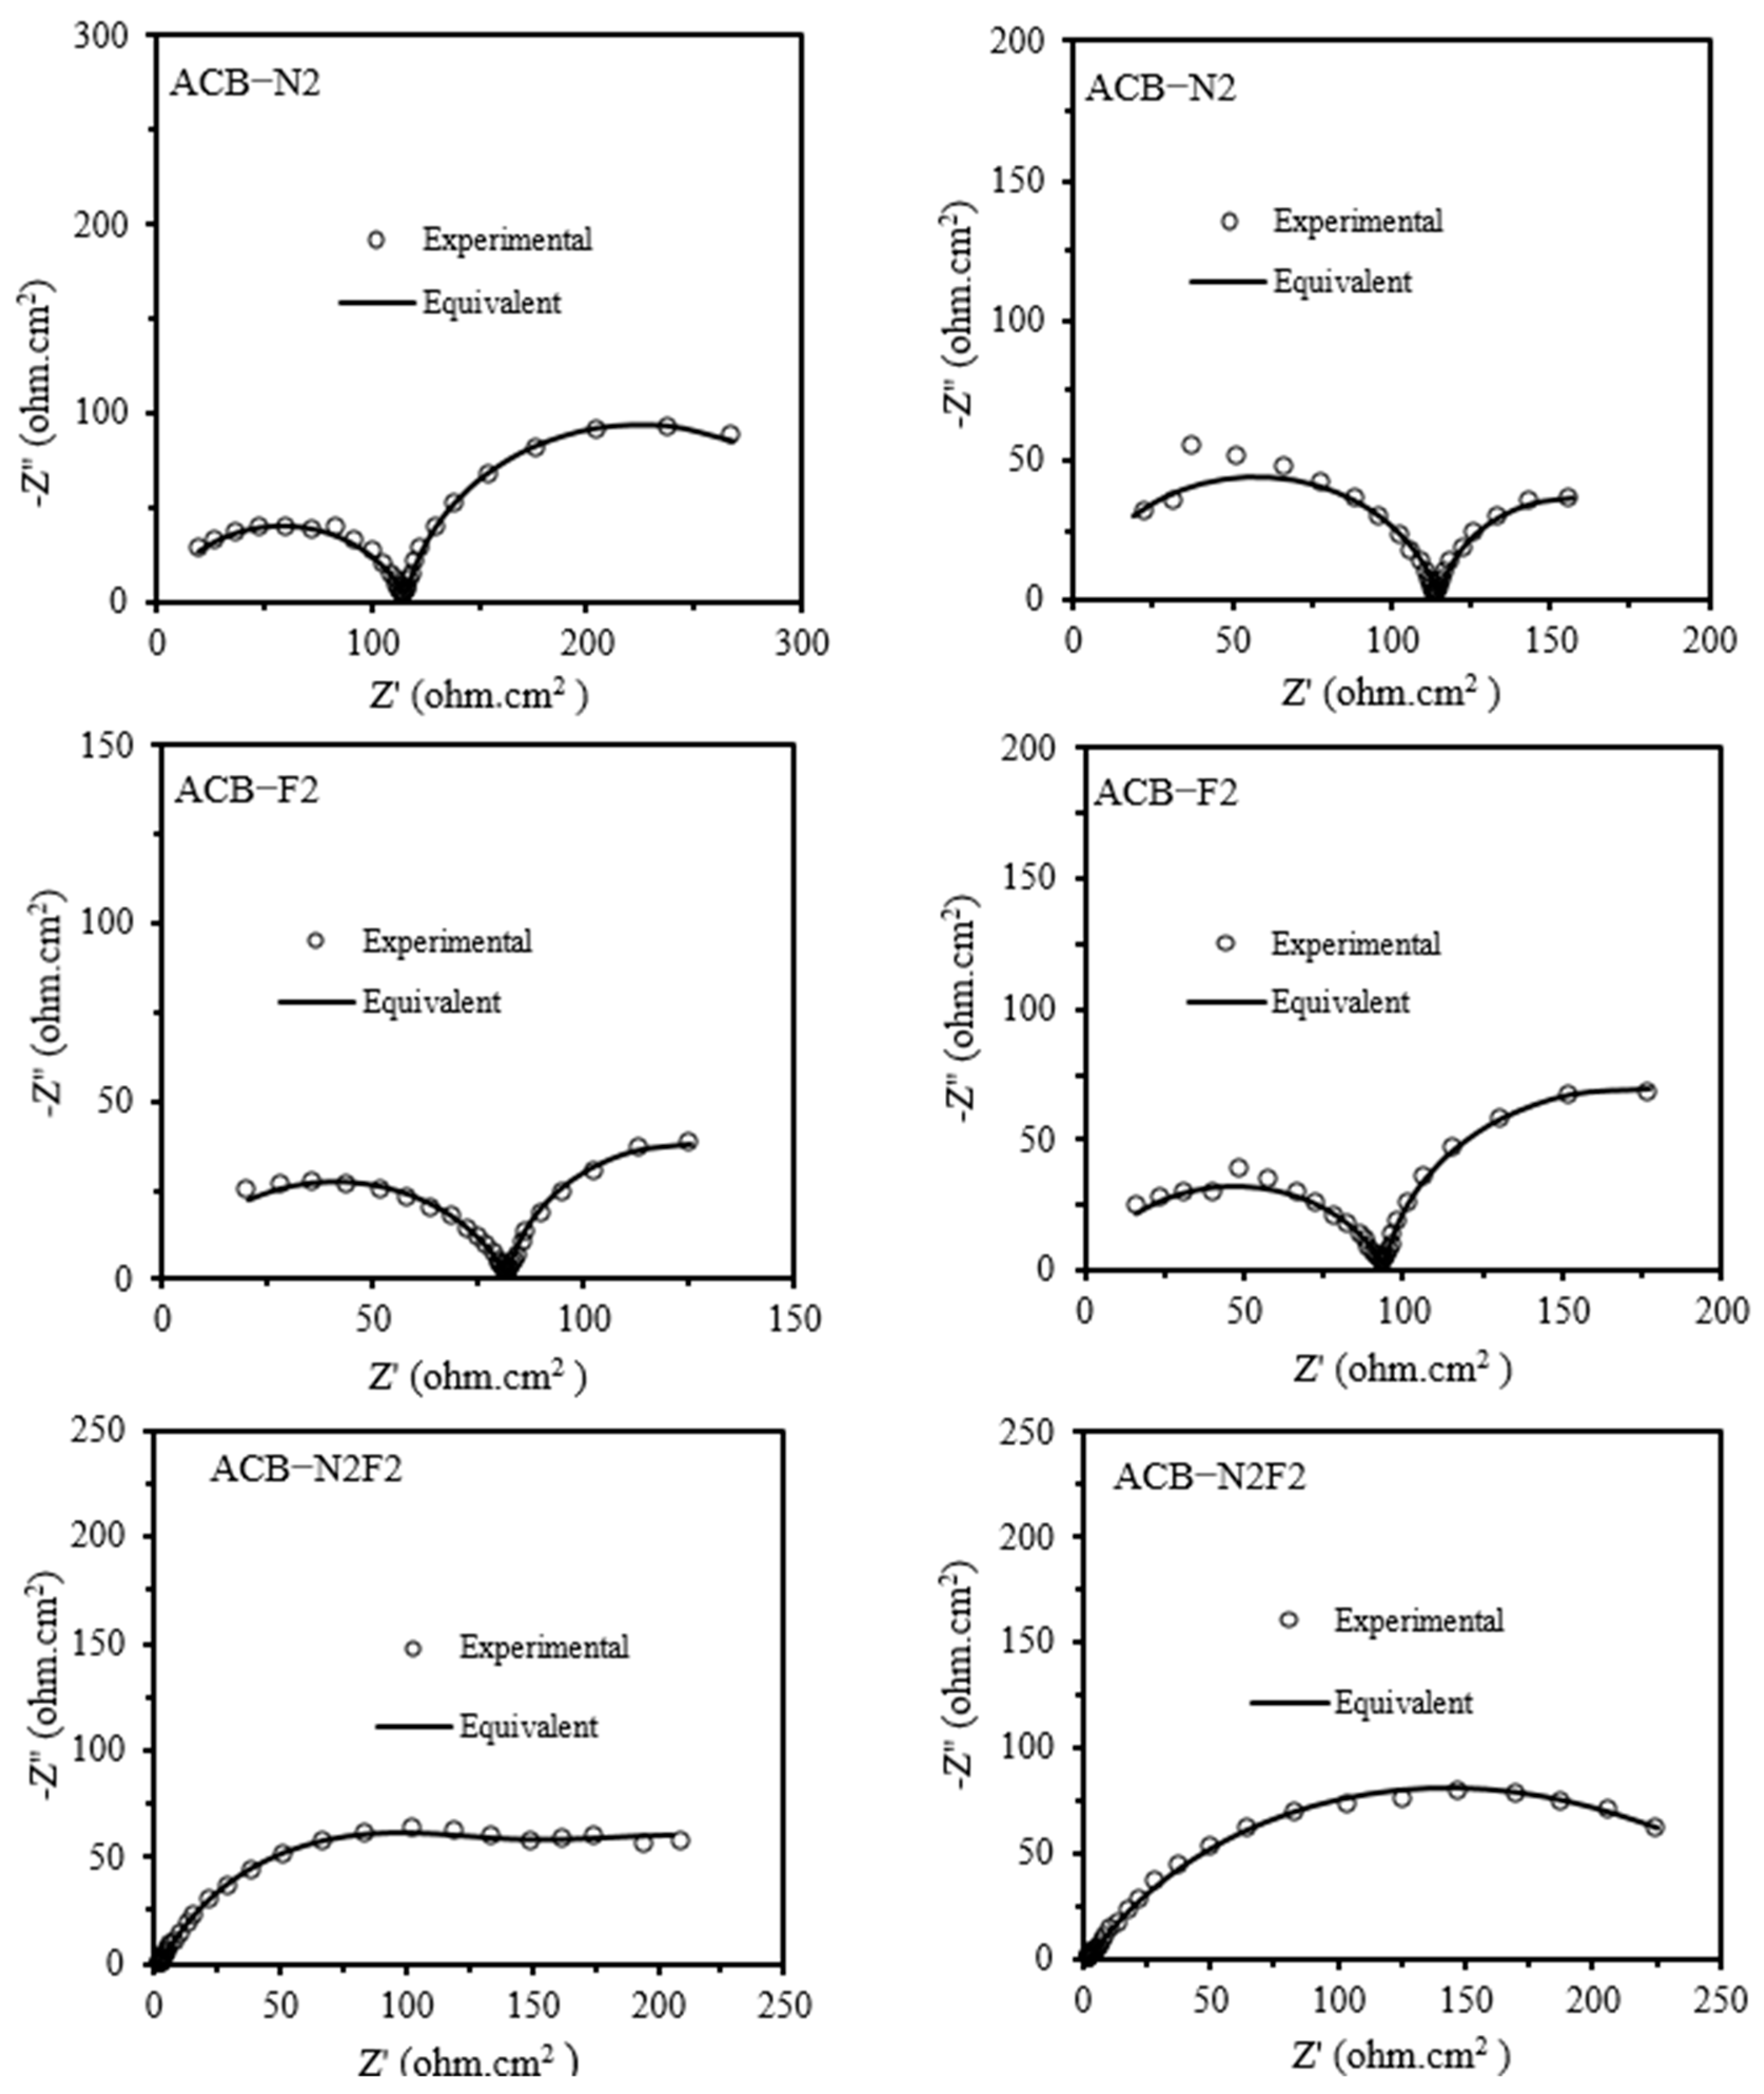
Figure 2 gives the EIS complex plane plot determined for the anode under potentiostatic conditions. The number of elementary frequencies is N = 31. The experimental spectra of the ACB-N2 and the fluorine-doped activated carbon black composite electrode (ACB-F2) show two suppressed semicircles, whereas that of ACB-N2F2 exhibits only one. The catalytic layer of the anode and the processes that occur there are detected in a mid-frequency range. A low-frequency loop seems the most interesting as it provides information about diffusion. A low-frequency range is assigned to slow oxygen diffusion or diffusion of generated water through the catalyst layer [34].
However, various equivalent circuits have revealed that the choice of a suitable equivalent circuit for a complete and universal description of a redox reaction remains a herculean task. A Randles equivalent electrical circuit is the most commonly used basic circuit to assess electrode mechanisms. In an equivalent circuit, double-layer capacitance (CDL) or constant phase element (CPE) represents the double-layer capacity [25,35]. In the Randles equivalent circuit, we also have Rs and Rct. CPE is used for electrodes with a porous structure and electrical inhomogeneity. Warburg semi-infinite impedance represents the diffusion of the reagent to the surface of the electrode, whereas Warburg impedance accounts for finite diffusion. The spectra of ACB-N2 and ACB-F2 were analyzed using Rs + Q1/Rct + Q2/R3, while that of ACB-N2F2 was analyzed using Rs + Q1/(Rct + W). The presence of both nitrogen and fluorine dopants modifies the electronic structure of the carbon matrix, reducing charge transfer resistance. This results in a more homogenous electrochemical environment, leading to a single dominant time constant in the impedance response. Nitrogen doping enhances electron-donating properties, improving conductivity and facilitating charge transfer. Fluorine doping modifies surface hydrophobicity and electronic density, reducing undesired side reactions and stabilizing intermediate species. The co-doping of nitrogen and fluorine harmonizes the catalyst surface, streamlining reaction pathways and eliminating secondary resistive processes, typically resulting in multiple time constants.
In ACB-N2 and ACB-F2, isolated doping sites may introduce multiple reaction centers with varying charge transfer resistances, leading to a double time constant model. However, in ACB-N2F2, the optimized distribution of active sites mitigates these discrepancies, resulting in a more uniform electrochemical response. The dual-doped system enhances electrode–electrolyte interactions, facilitating faster charge transfer and mitigating diffusion-related impedance effects. This further supports the single time constant model, which features a streamlined and efficient charge transfer pathway.
The capacity CPE accounts for the sum of the capacities of the double layer for glycerol oxidation diffusion and the double layer for the oxidation process via the adsorption of glycerol to form the product. The use of CPEs typically reflects surface heterogeneity and non-ideal capacitive behavior. This indirectly accounts for phenomena like the adsorption of glycerol and its oxidation intermediates. It is used to describe the nonfaradaic capacitances of oxidation of anode pores. The values of the CPE exponent α are more stable across potential regions. Moreover, the presence of Warburg impedance in the equivalent circuit of ACB-N2F2 hints at deeper electrochemical dynamics beyond simple charge transfer. In glycerol oxidation reactions, this element captures not just diffusion phenomena but also potentially adsorption-mediated transport processes, which are critical in systems involving polyols.

2.2. Fitting Coefficient Parameter

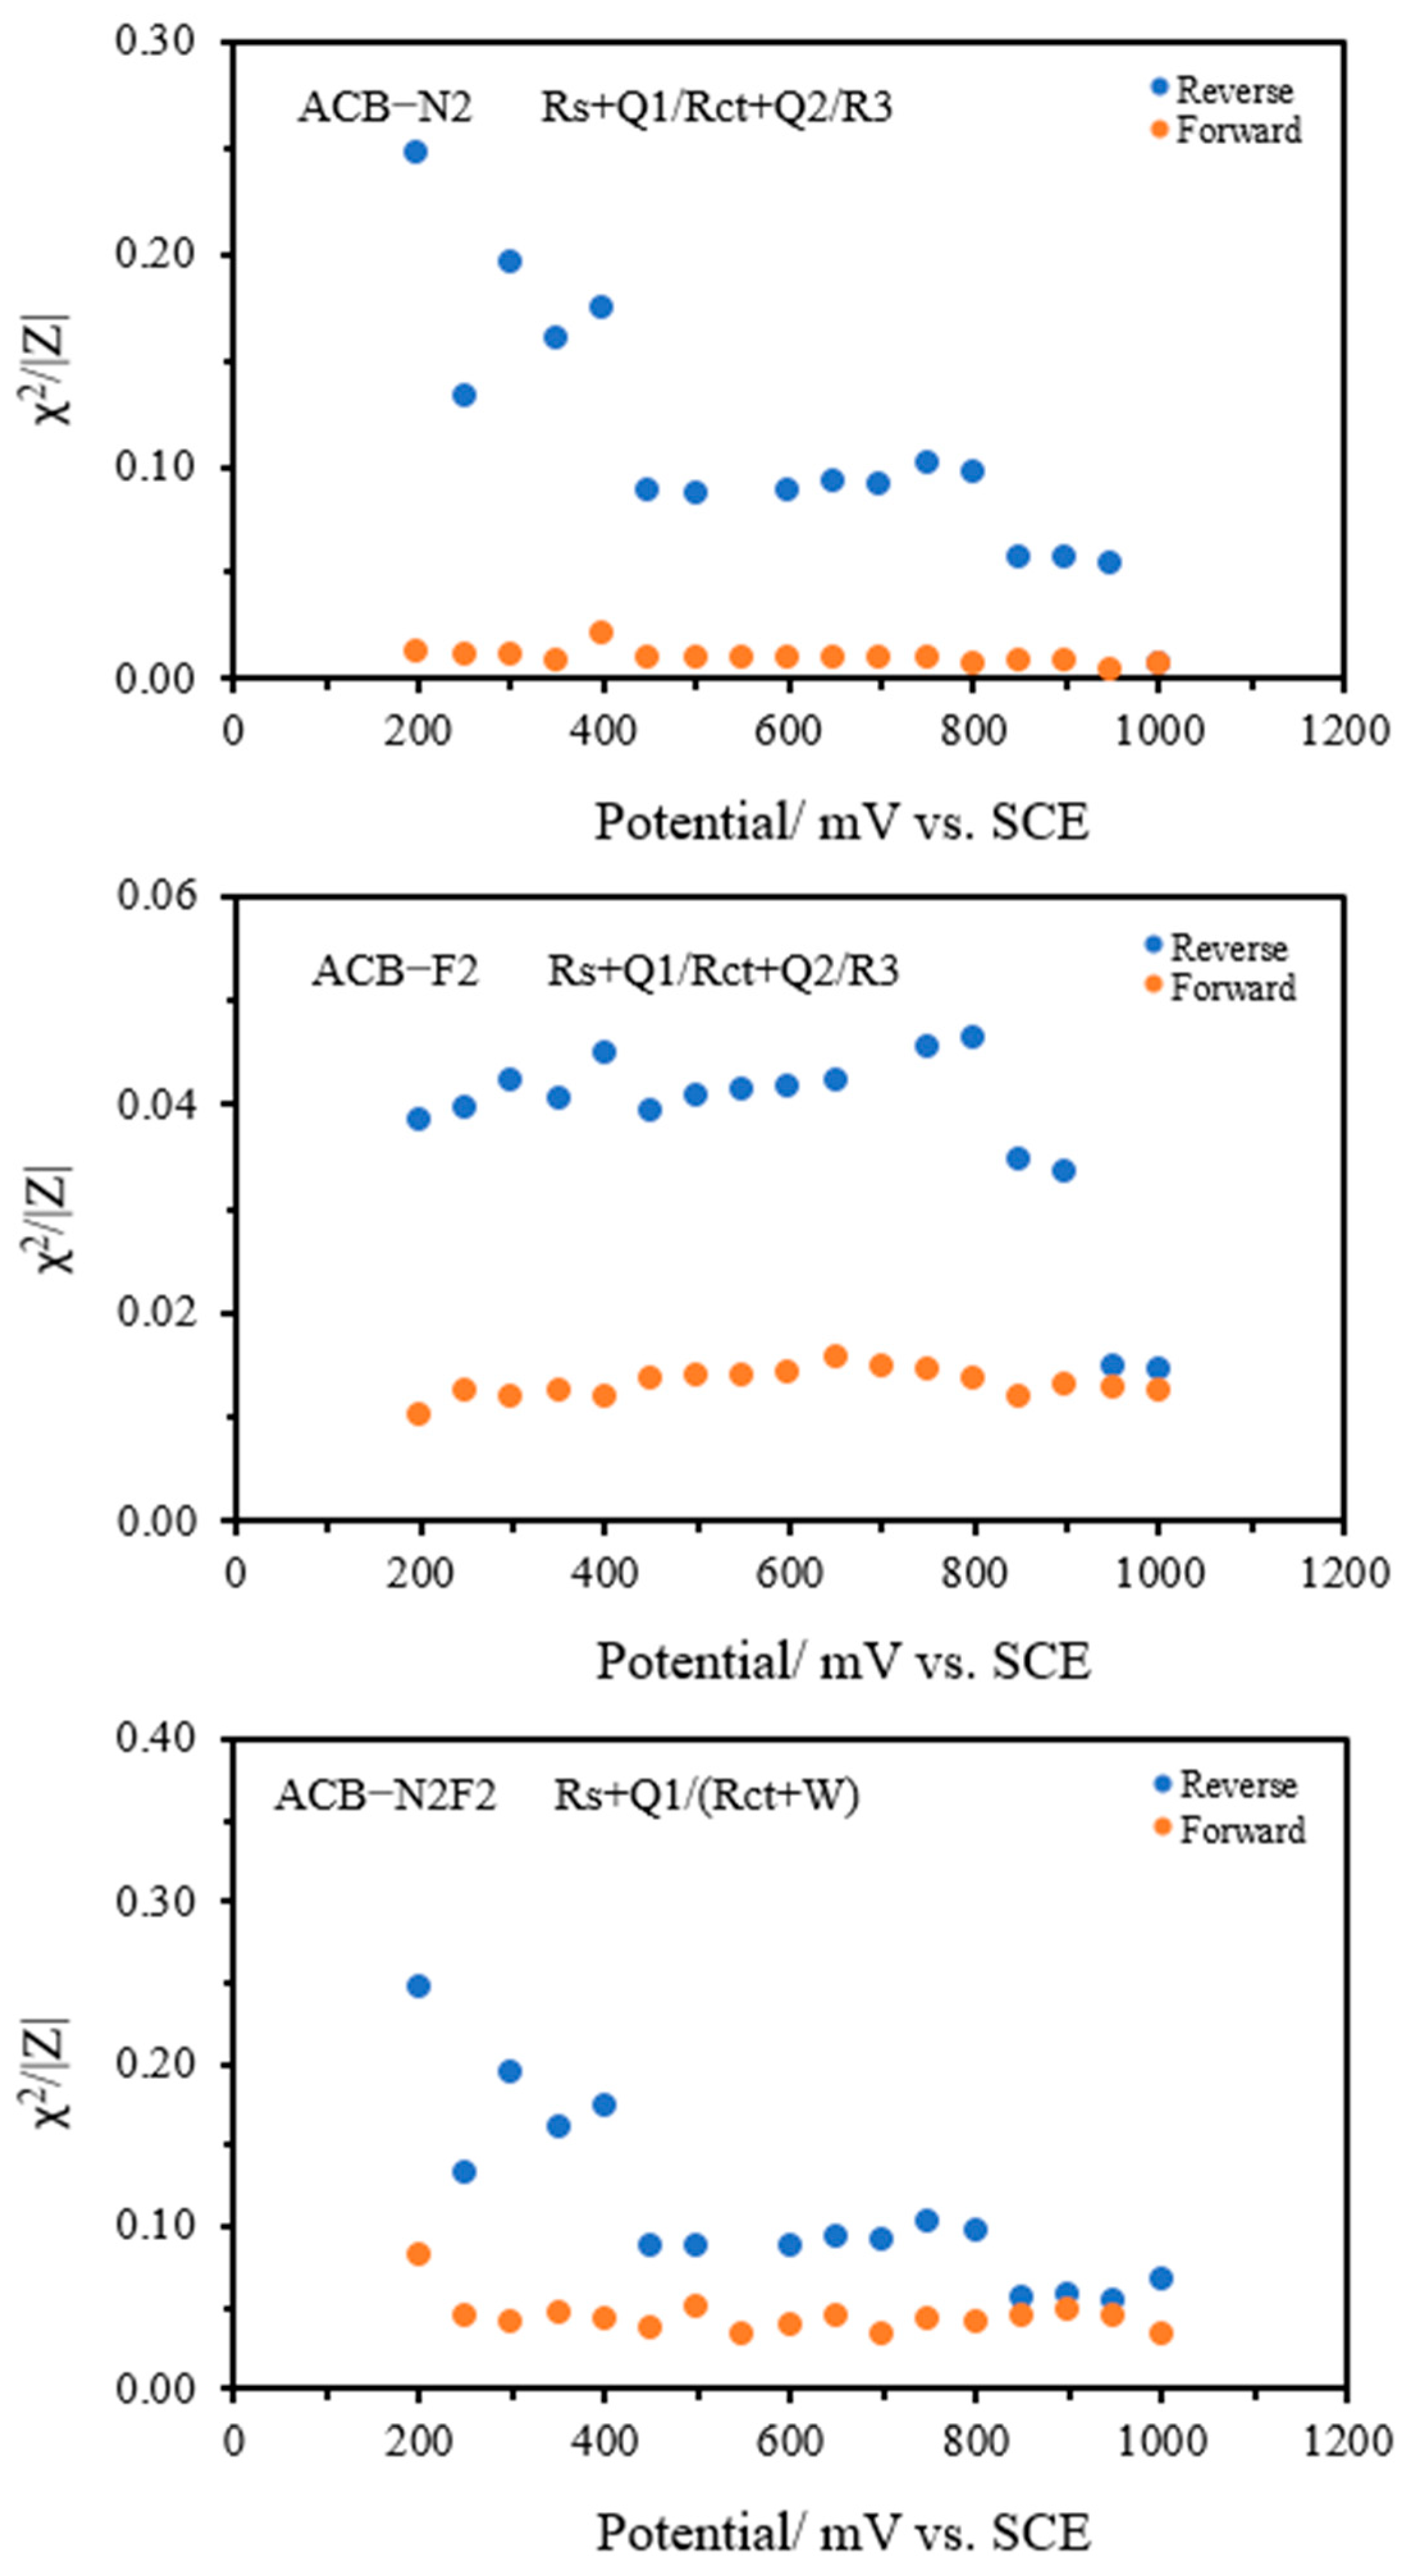
Figure 3 illustrates the effect of overpotential on the fitting coefficient χ2/|Z|. Particularly, using CPE (Q) consistently generated lower χ2/|Z| values than CDL. Furthermore, the equivalent Randles circuits used for ACB-F2 and ACB-N2 exhibited lower χ2/|Z| values than ACB-N2F2. This is due to the two-time constants (two CPEs) in the models for ACB-F2 and ACB-N2. Furthermore, the equivalent circuits for ACB-F2 exhibited the most promising χ2/|Z| values overall.

2.3. Forward Sweep

Figure 4 illustrates the Nyquist (complex plane) plots for the forward potential sweeps of the three electrodes, ACB-F2, ACB-N2, and ACB-N2F2, across the investigated potential cycles. The onset of charge transfer, identified by a deviation from the baseline in the corresponding direct current (DC) voltammograms, occurs at approximately 0.36 V for ACB-F2, 0.16 V for ACB-N2, and 0.37 V for ACB-N2F2. This deviation marks the initiation of faradaic processes and reflects the activation of surface redox sites. The impedance data across all potential cycles were fitted using the same equivalent circuit model for each electrode, achieving residual fitting errors below 3%, 2%, and 9% for ACB-F2, ACB-N2, and ACB-N2F2, respectively. This confirms the adequacy and robustness of the selected model in capturing the electrode interfacial phenomena under varied electrochemical conditions.
In the high-frequency region of the impedance spectra typically associated with rapid charge transfer and double-layer capacitance dynamics, distinct semicircular arcs are evident. For ACB-F2 and ACB-N2, these arcs initiate around mid-to-high frequencies and extend toward the mid-frequency region. The partial nature of these arcs indicates overlapping electrochemical processes, primarily governed by interfacial kinetics and double-layer effects. A second semicircle emerges as frequency further decreases, attributed to slower phenomena, such as intermediate adsorption or surface-bound species relaxation.
Conversely, the ACB-N2F2 electrode presents a more coherent impedance profile, with a semicircle forming from the onset of the high-frequency region and gradually transitioning to the low-frequency domain within the first quadrant. This continuous progression suggests improved charge carrier mobility and a more unified response across time constants, implying enhanced electrochemical performance and lower recombination losses.
The semicircle diameter, representing the effective charge transfer resistance, decreases with increasing applied potential for all electrodes. This trend highlights improved electrode kinetics and increased conductivity at elevated potentials, particularly for ACB-N2F2, which consistently exhibits lower impedance across the voltage range, affirming its superior electrochemical reactivity.

2.4. Reverse Sweep

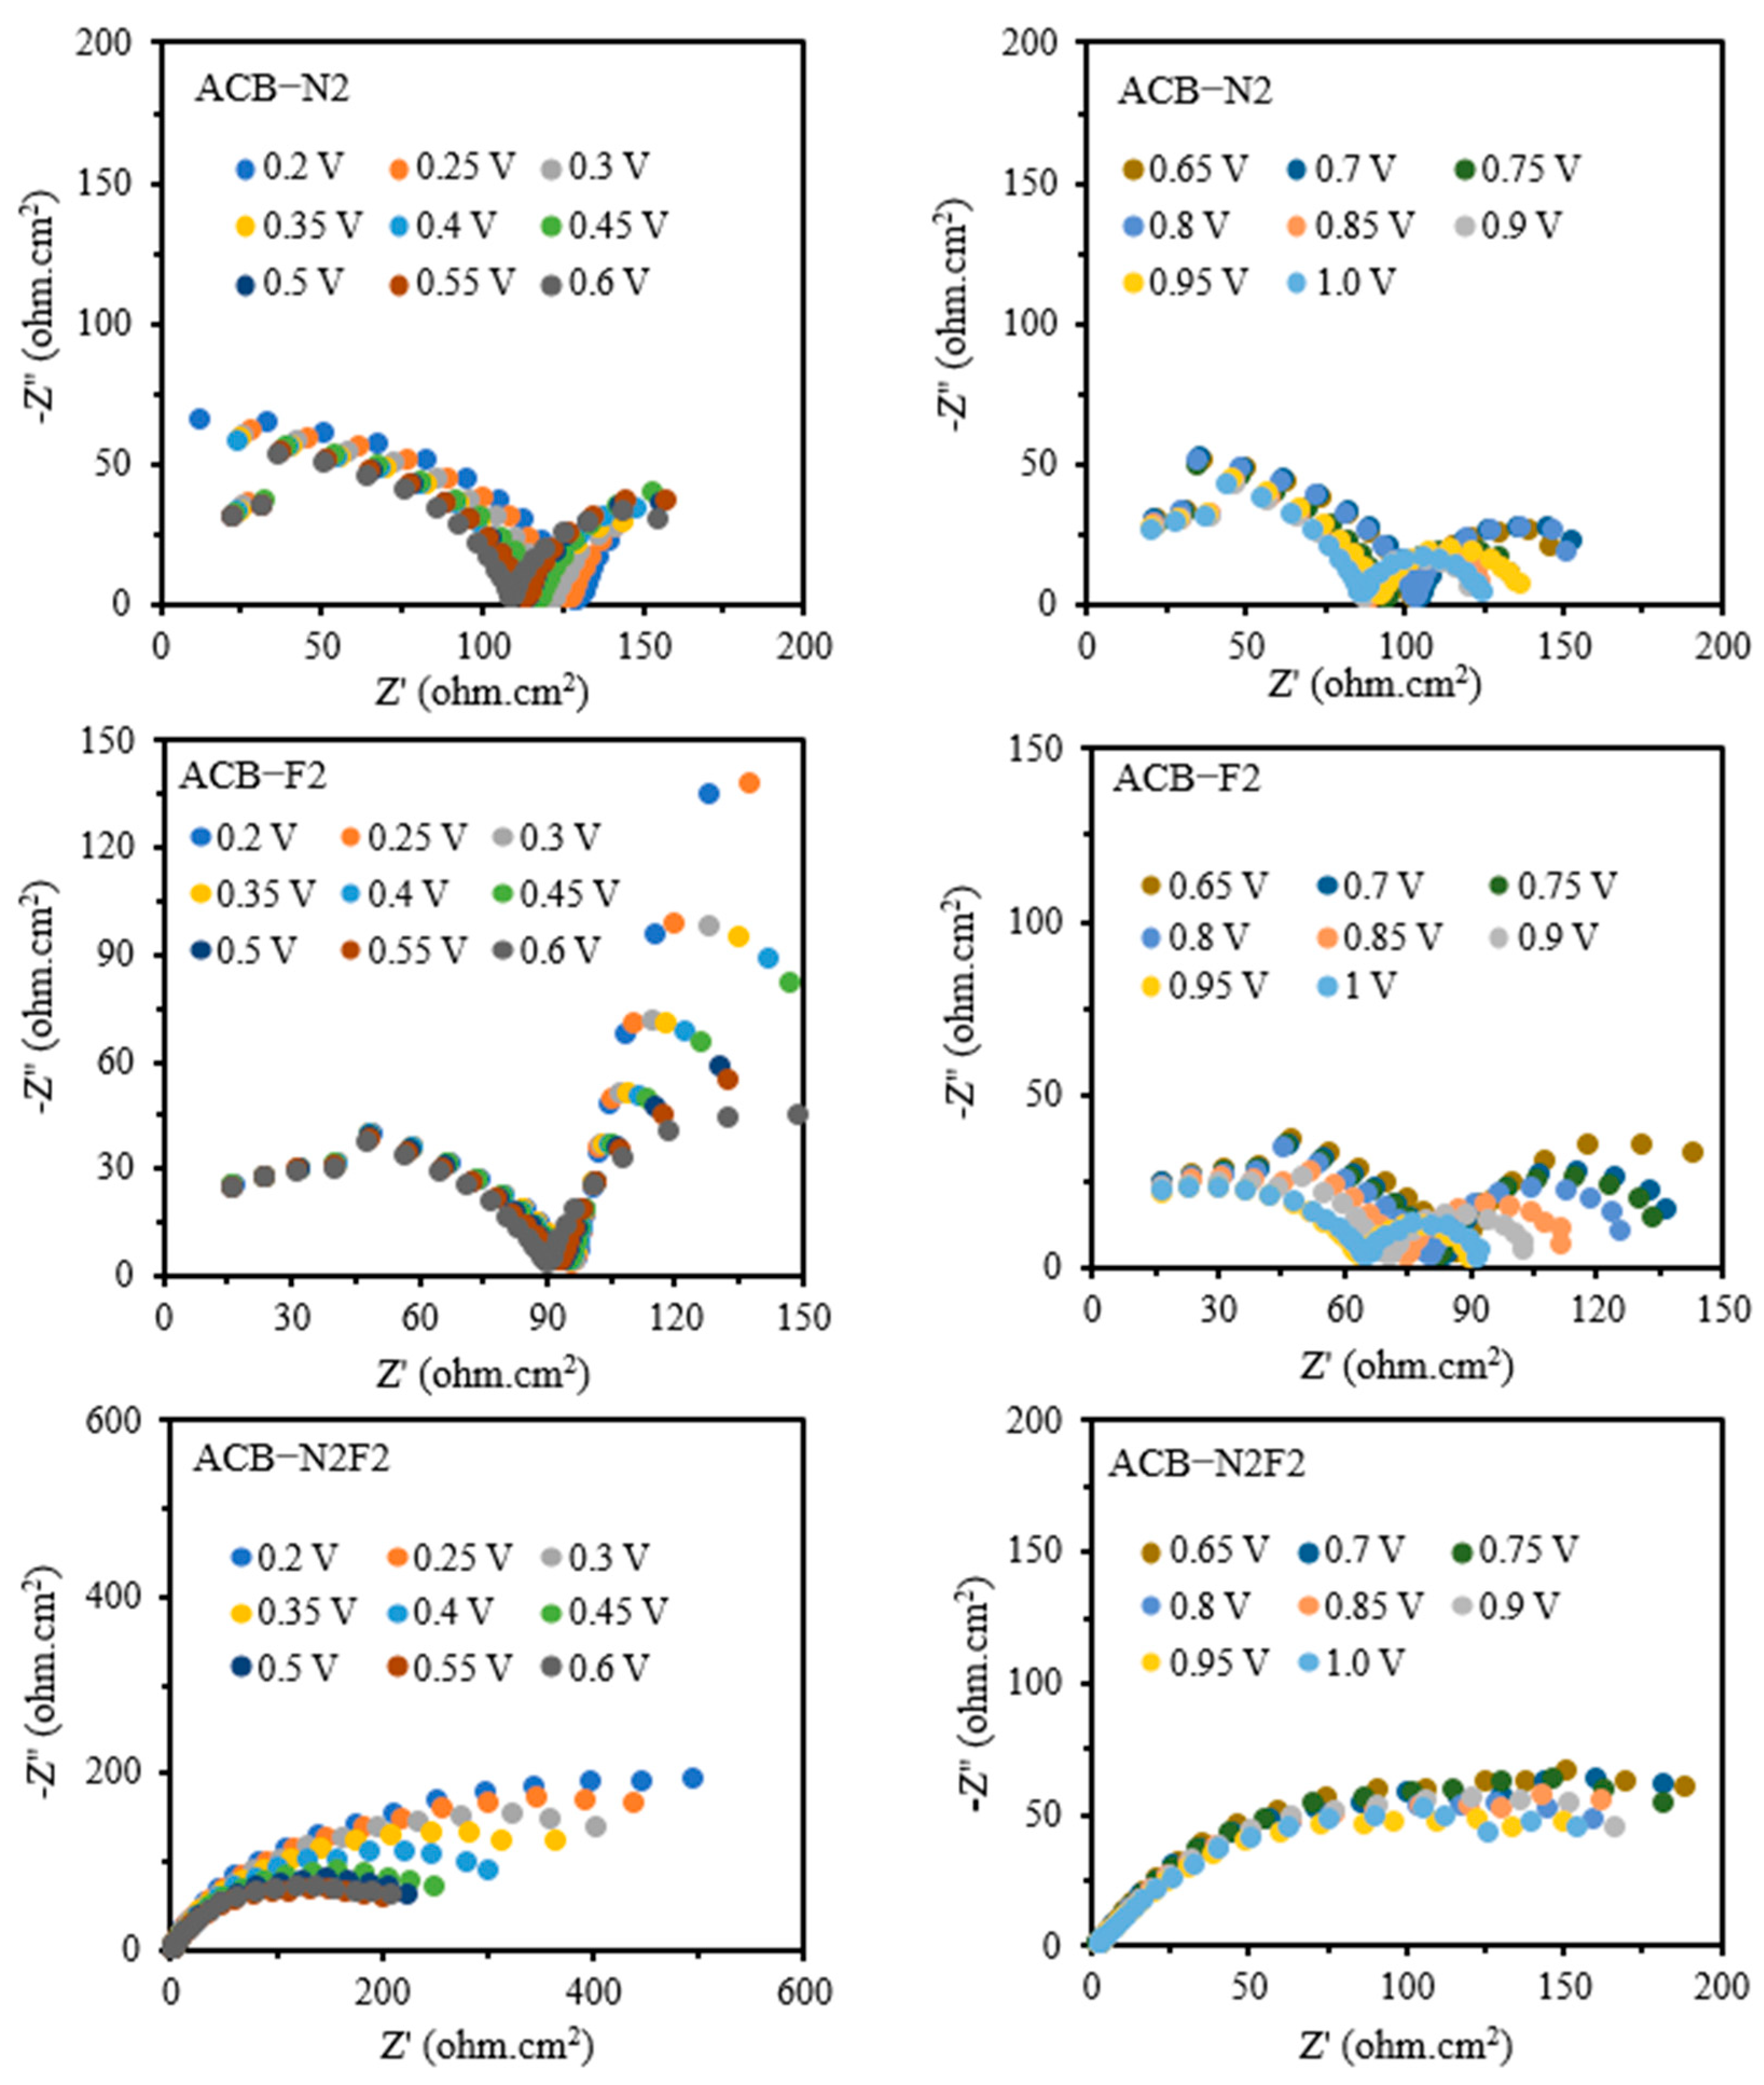
In the reverse sweep (Figure 5), the same trends as the forward sweep persist with notable differences. The semicircle diameters for all electrodes decrease significantly, suggesting enhanced conductivity or surface activation effects following the forward polarization. However, the quality of fitting, expressed by the χ2/|Z| parameter, deteriorates—especially for ACB-N2 and ACB-N2F2 at low potentials—indicating more complex interfacial dynamics during cathodic scanning. Additionally, the appearance of noise in the second quadrant for ACB-F2 and ACB-N2 and in the first quadrant for ACB-N2F2 at high potentials suggests external perturbations, likely from acoustic or mechanical vibrations, which become more pronounced at low impedance or under highly capacitive conditions.
Overall, the combination of EIS features, including the number and size of semicircles, noise patterns, and model fitting fidelity, points to distinct electrochemical behaviors among the electrode systems. ACB-N2F2, in particular, exhibits a more stable and unified response, possibly due to synergistic effects between nitrogen and fluorine doping that streamline interfacial charge transport.

2.5. Zeroes of the Interfacial Impedance

The zeroes of the interfacial impedance are determined from the fitted capacitances and resistances. The successful fitting of circuits, as shown in Figure 3, indicates the validity of the zeroes. The transfer function is the interfacial admittance, given that the current is measured as the interfacial potential is controlled. This is referred to as a “chemical” or “purely potentiostatic” case. System stability is evaluated by analyzing the zeroes and poles of the interfacial impedance function. Stability is indicated when the poles (or inverse of time constants) of the impedance have negative real parts. This ensures that the system’s response decays over time rather than growing unbounded. In practice, the equivalent circuit model for interfacial impedance often comprises elements with physically meaningful positive values, such as resistors and capacitors. However, in modeling, idealized elements (e.g., negative inductances or resistances) may sometimes be mathematically valid when representing specific behaviors.
The zeroes of the interfacial impedance, denoted as B, are governed not directly by potential but by the partial derivatives of reaction rates with respect to surface coverage and potential. Specifically, Equations (1) and (2) [30] express these relationships as follows:
B = 1 L = 1 C 2 R c t 2 = F Γ m r e θ E r θ E θ
τ 1 = R c t + R 2 C 2 R c t R 2 = R 0 L = 1 Γ m r θ θ E
F is the Faraday constant (C mol−1), E is the electric field, and θ is the depression angle of a semicircular arc below the real axis. C is pseudo-capacitance (F cm−2) and L is a pseudo-inductance (H cm2), provided that the signs of the elements are not constrained to always be positive, but for real data, one or the other circuit gives better fits. For the galvanostatic and potentiostatic cases, the relationship between the mechanistic parameters and the zeroes and poles has been given in general [29]. Therefore, the zeroes of the interfacial impedance are directly associated with the chemical mechanism (chemical reaction step), disregarding the potential dependency of the rate constants.
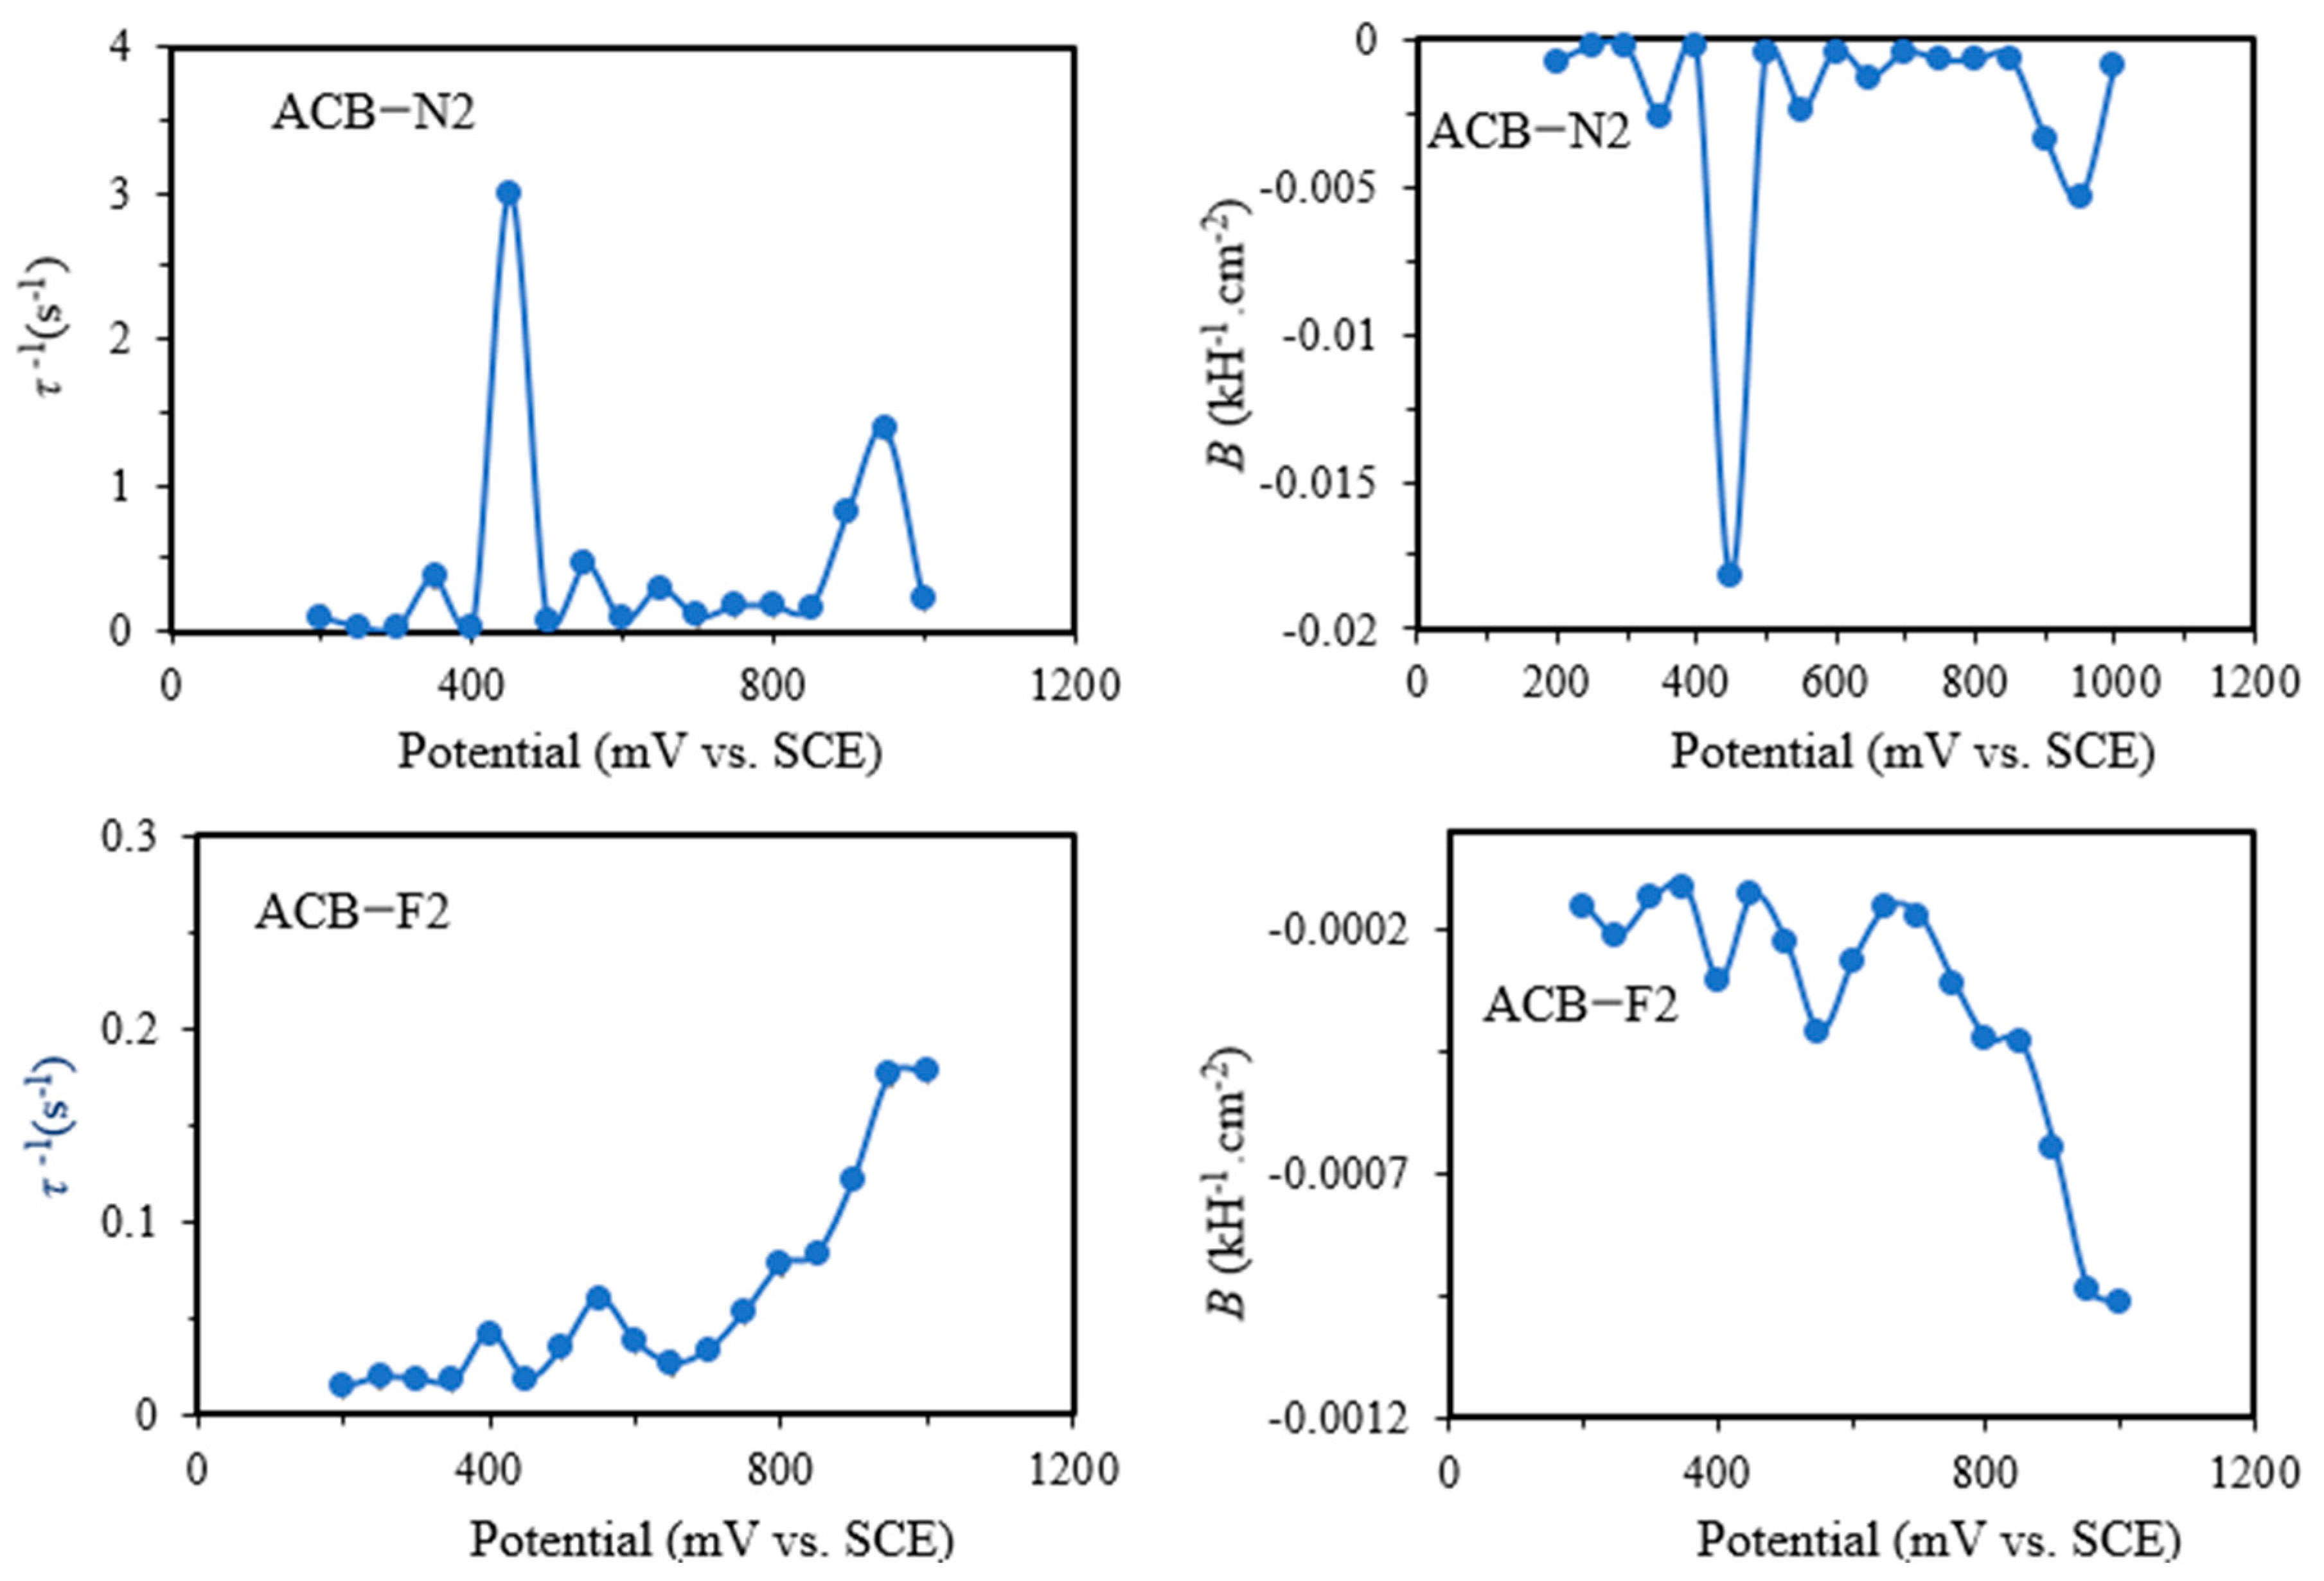
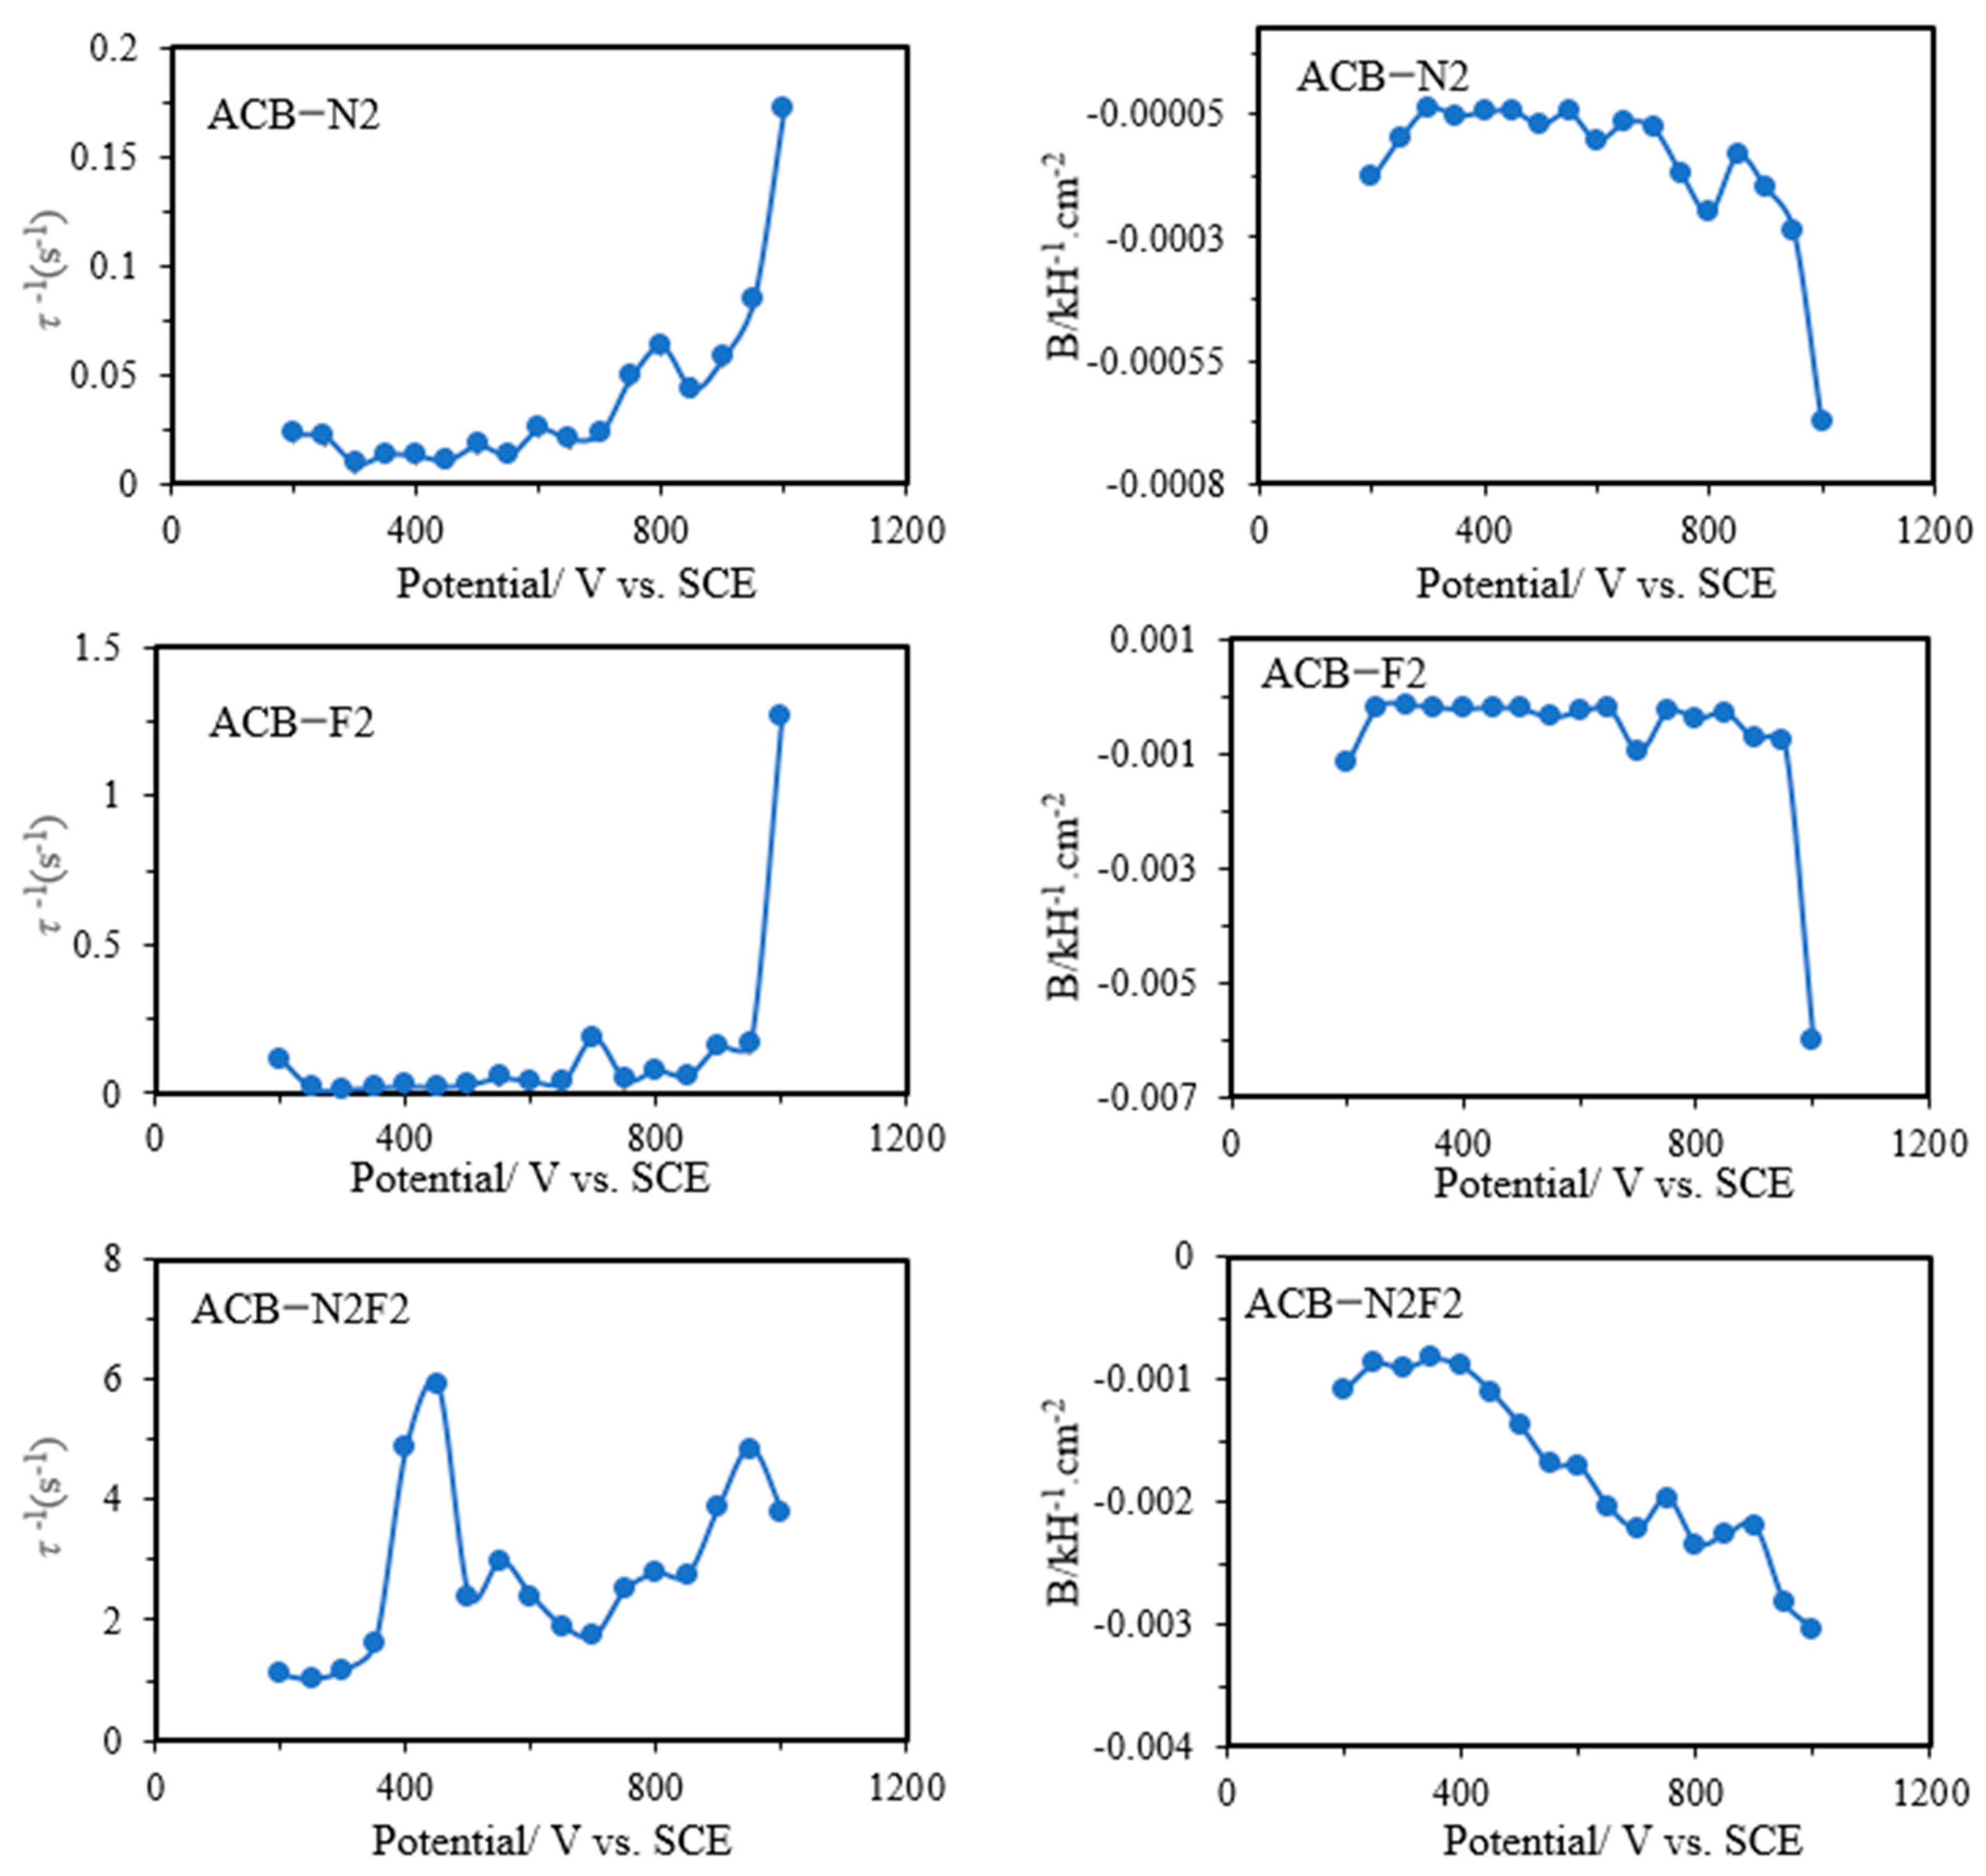
Figure 6 shows the values of the derived parameters B = 1/C2Rct2 and the time constant τ, τ−1 = (Rct + R2)/(C2RctR2) as a function of applied potential. The parameters have a simpler meaning than the elements of the equivalent circuit, which have a higher degree of complexity, especially for reaction mechanisms involving only one absorbed intermediate species that is not controlled by diffusion. The parameter τ quantifies the rate at which the fractional surface coverage of the adsorbed carbon monoxide (θCO) relaxes to a new value after a change in potential. In addition to the faradaic contribution, the adsorption of intermediates could influence the double-layer charge, making CDL a function of θCO. This claim could be justified by the two-time constant exhibited by the electrodes, complemented by the two semicircles exhibited by ACB-N2 and ACB-F2, and the presence of the Warburg element exhibited by ACB-N2F2. The parameter exhibits a somewhat constant slope as a function of potential and a change at the shoulder peak potential at higher overpotential for ACB-N2 and ACB-F2 and lower overpotential for ACB-N2F2 (Figure 7). This trend could be due to the partial derivative of the net generation of rCO concerning the θCO at a constant potential. Since the rCO parameter depends on both the reaction intermediate step and the oxidation step of the intermediate species in the glycerol oxidation pathway, the changes attributed to CO are expected to be larger for the reaction intermediate step, particularly if it involves more than one available site [36].
Parameter B also reveals the shoulder peaks, which can be attributed to charge transfer resistance, resulting in a change in the coverage of intermediate species. Experimentally, the two-time constant was merged into a single semicircle. For all the electrodes, the values of parameter B are negative across the cycled potential, and all the capacitive circuit (τ) elements are positive, indicating that the electrodes exhibit a stable chemical mechanism consistent with their natural characteristics.
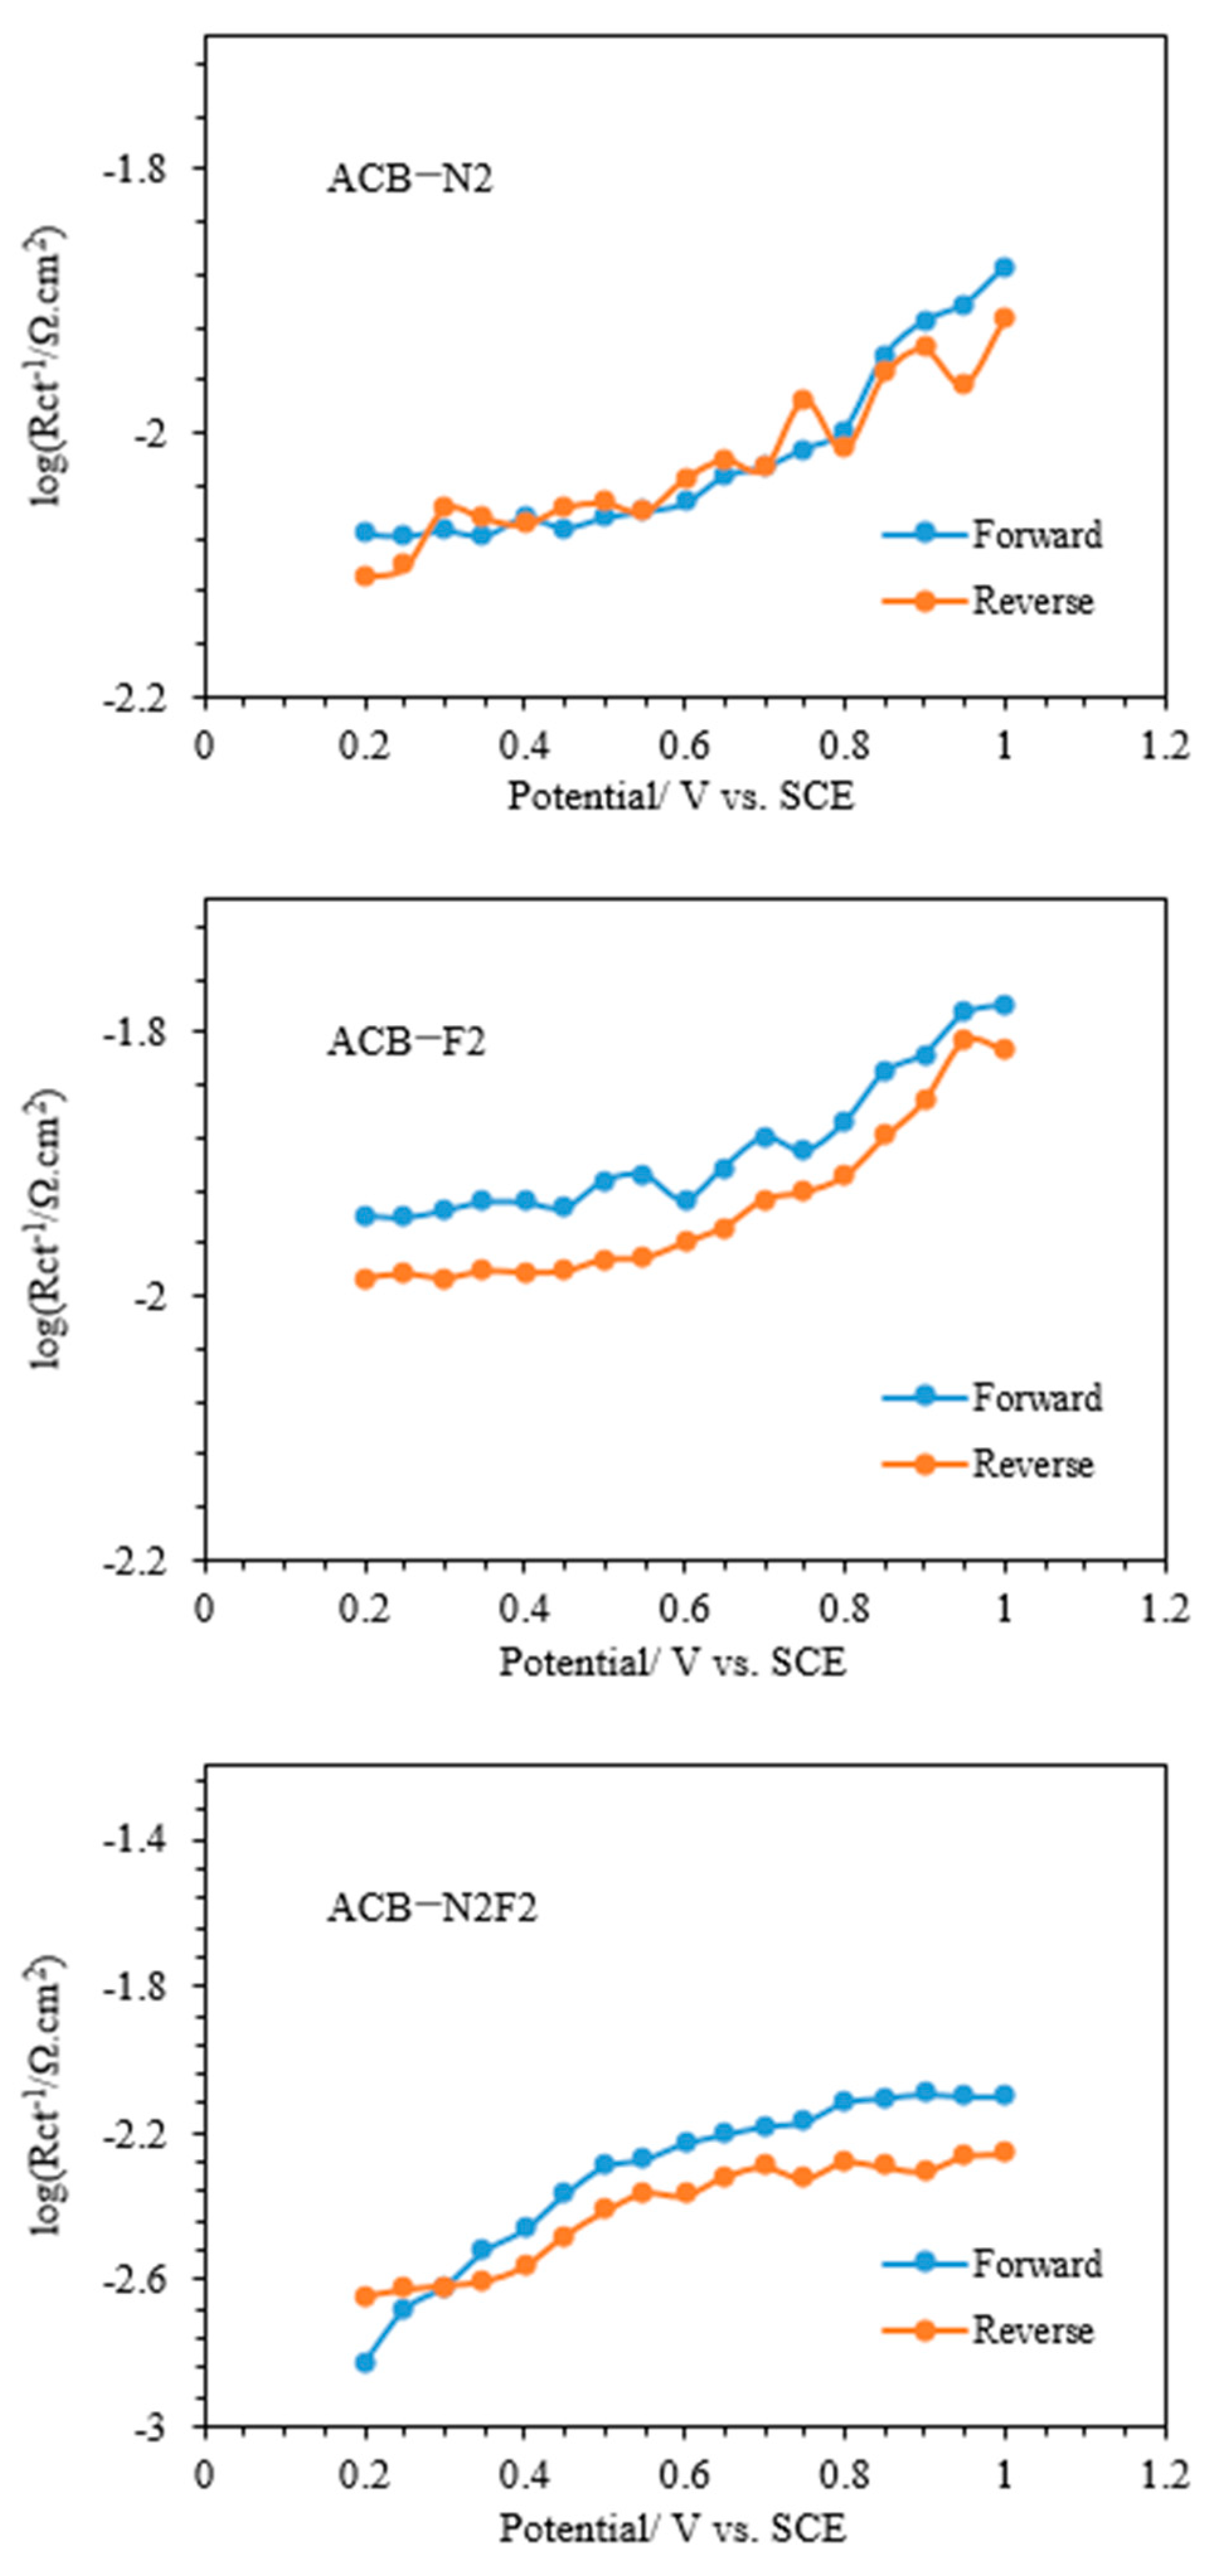
The noise generated by initial instability in the chemistry of the electrodes during the reverse sweeps causes the values and variability of the parameters B and τ−1 in Figure 7 to differ significantly from those of the forward reaction. The estimated zero-frequency resistance shown in Figure 8 reveals that the impedance crosses into the second quadrant, and all the data points fall within this quadrant.
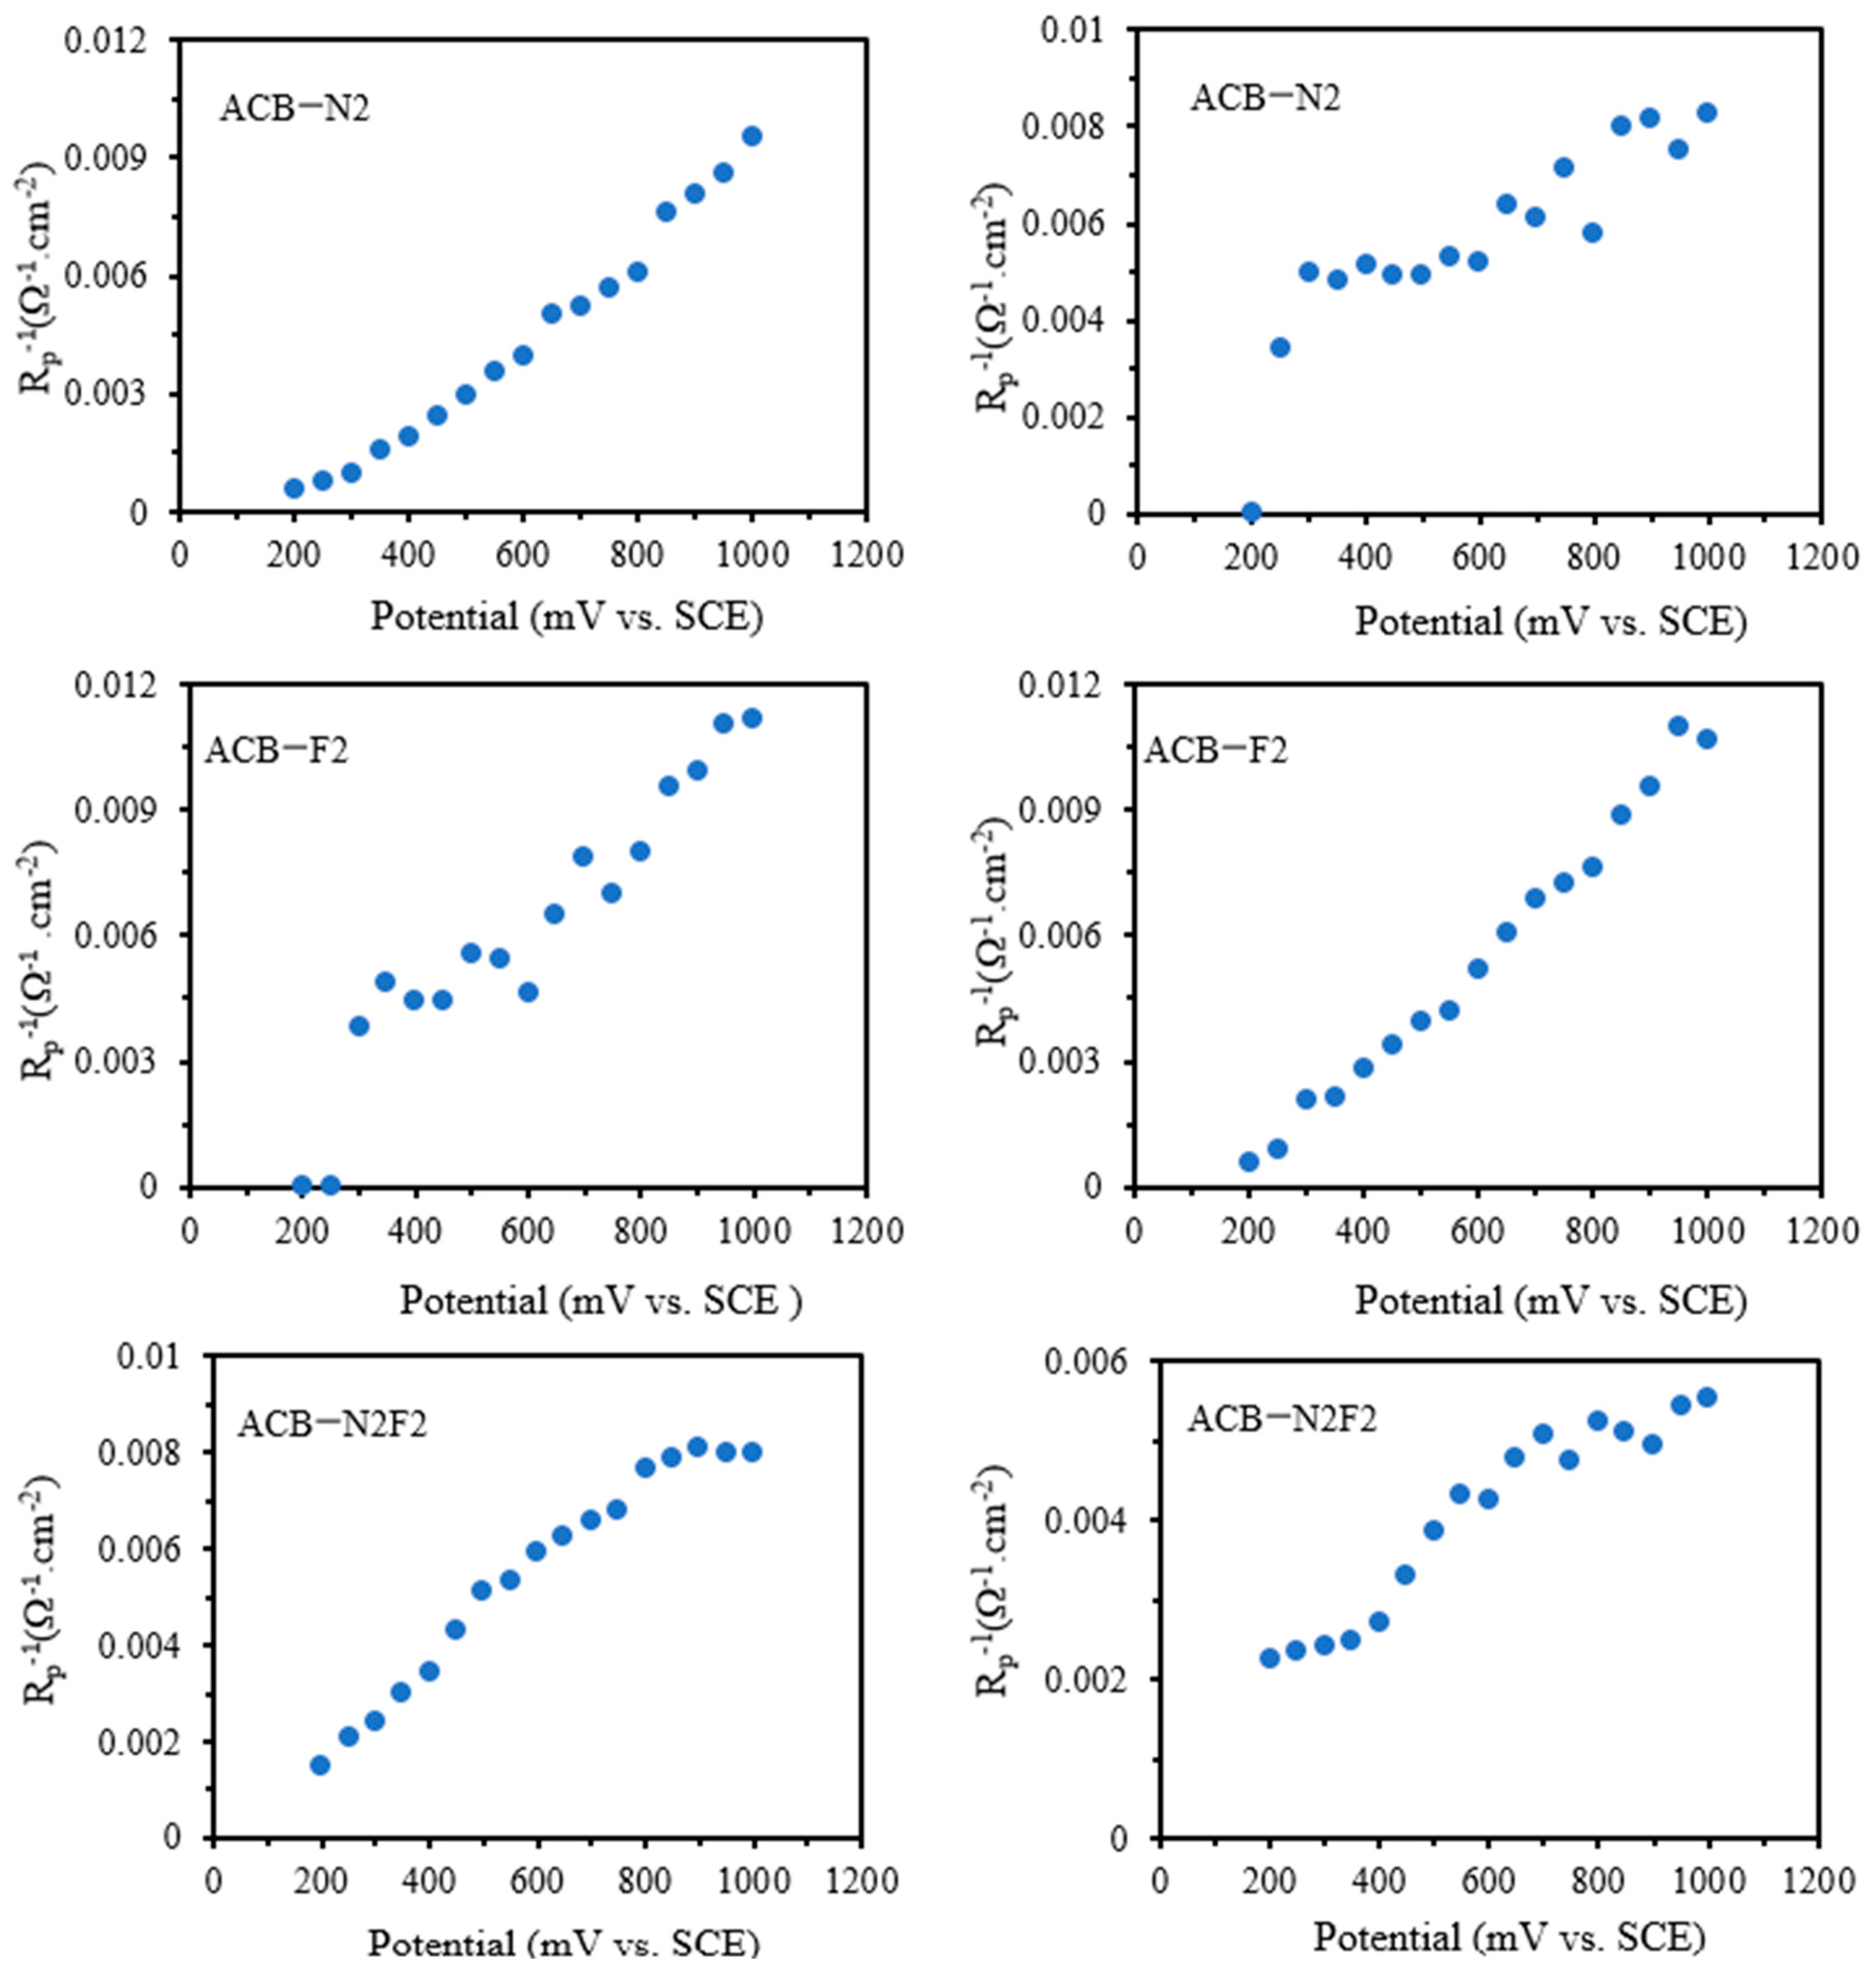
The impedance at zero frequency was determined from the parameters of the fitted equivalent circuit to assess the adequacy of the EIS spectra, as the features cannot be measured at a lower frequency. At 0 frequency, the impedance is real and estimated to be the inverse of the slope of the quasi-steady-state polarization curve for equivalent circuits with a direct current path [30] as follows:
R p 1 = lim ω 0 Z 1 = d j s s d E
For ACB-N2F2, the circuits exhibit blocking characteristics at direct current. The impedance tends to be significantly higher at zero frequency and low potential. This condition also fulfils the above equation. Furthermore, the relationship holds for all the potential cycle regions of the three electrodes since τ > 0. The polarization curves in Figure 9 resemble the voltammetry curves of all the electrodes due to little or no perturbation.
The obtained values of Rp from the equivalent circuit agree in sign with djss/dE on the forward sweep for all the potential cycles. In the Tafel region, Rct = Rp, meaning that the Ts for Rct agree with the Ts of the current at a steady state [30]. Considering ACB-N2F2 with an equivalent containing a Warburg element, the last part of the forward sweep may exhibit unquantifiable features at lower frequencies, which are not accessible in the experiment. Similar to the voltammetry slope, the values of Rp remain positive throughout the potential circuit during the reverse sweep.

2.6. Charge-Transfer Parameters

The EIS spectra in Figure 3 revealed the qualitative features of the electrodes in the electrooxidation reaction. The spectra were analyzed using the equivalent circuits inserted in Figure 3. The values of the circuit’s elements were transformed to parameters applicable in the kinetic theory for a single adsorbed species mechanism [36] as follows:
R c t 1 = F r e E θ
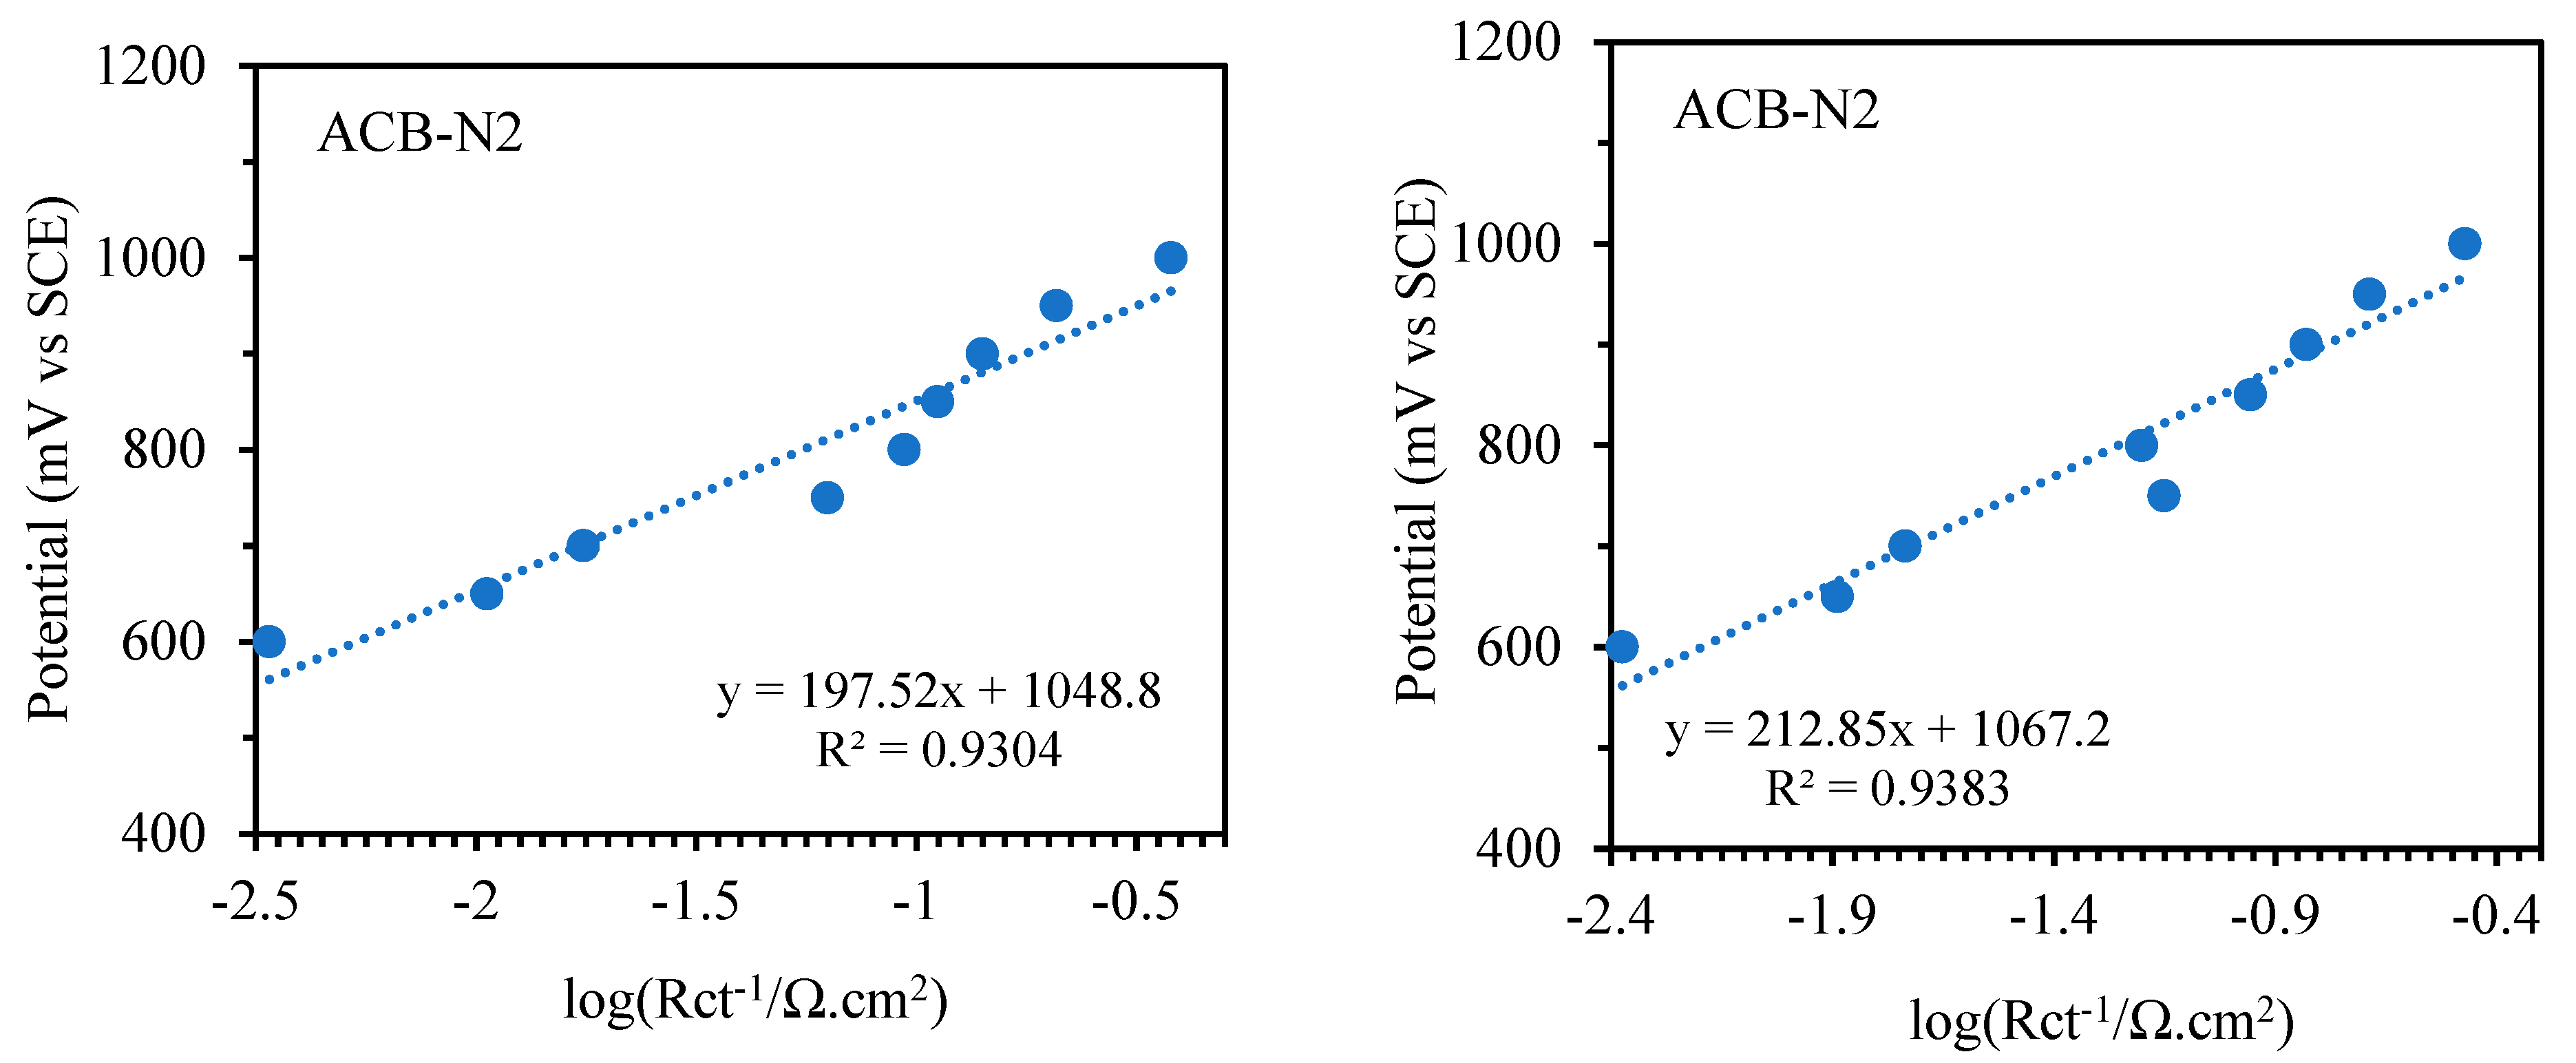
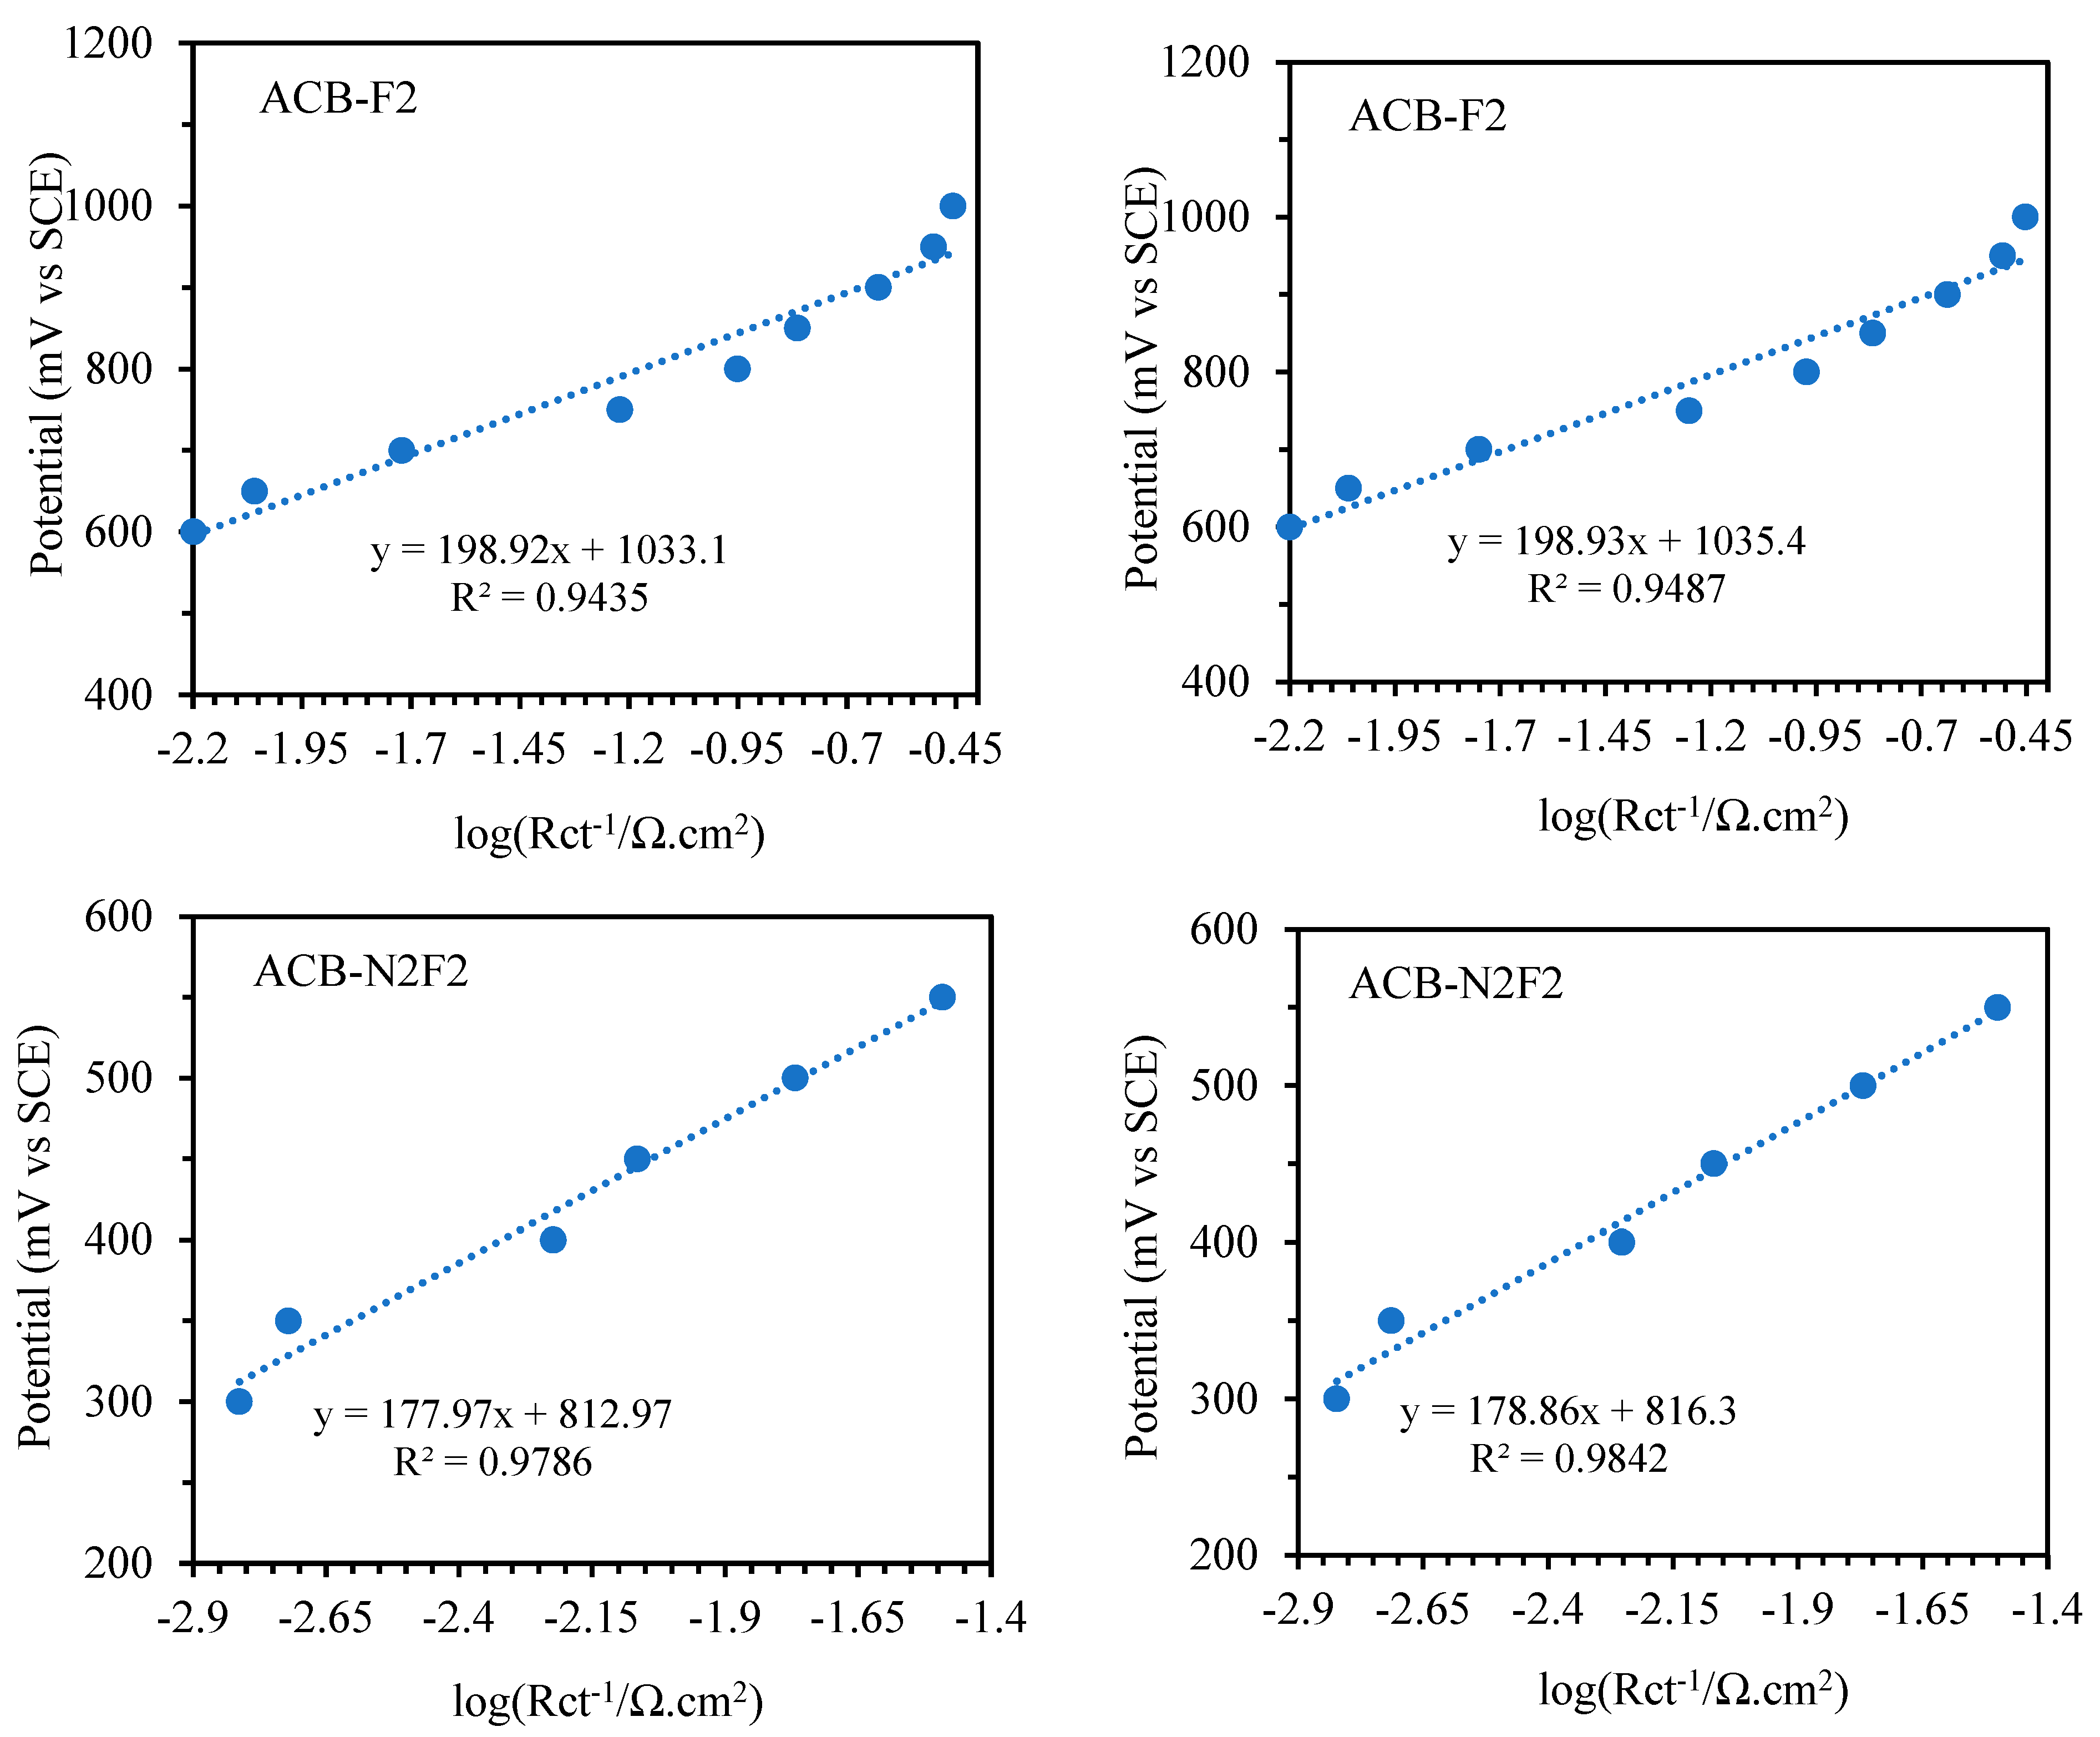
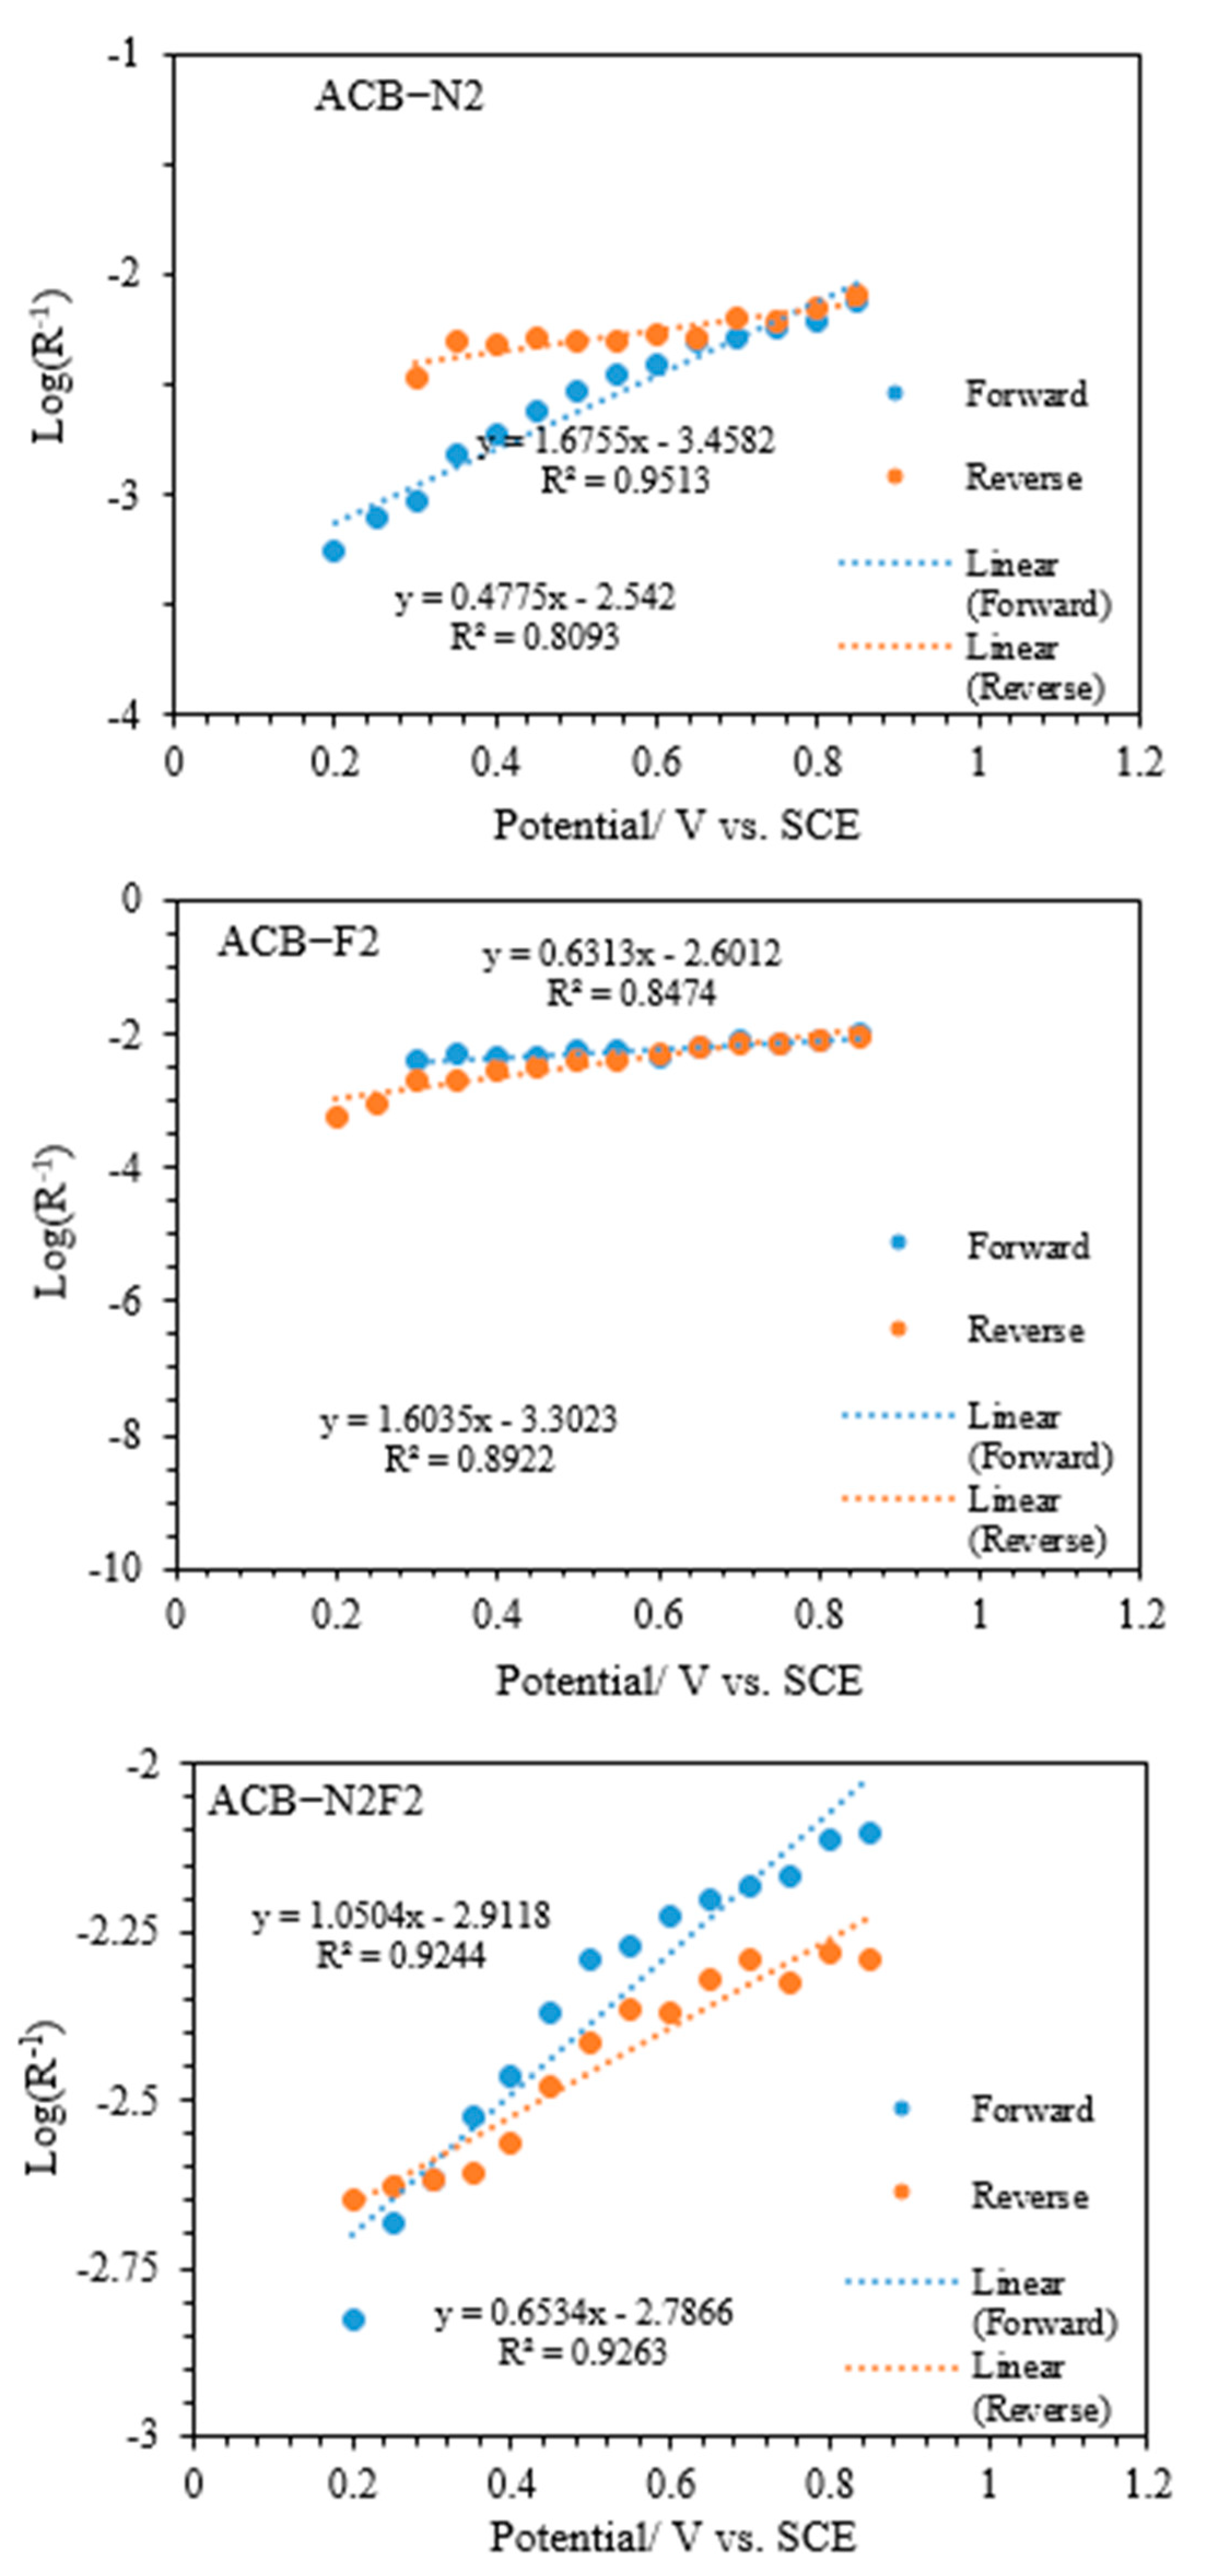
To explore the kinetic parameters of the functionalized carbon composite catalysts for glycerol electrooxidation, the Tafel plots in Figure 10, which are plotted according to E (vs. SCE) vs. log (Rct−1) [2], follow the Tafel equation below:
b = 2.3 R T β T
Figure 11 presents the curves of the charge-transfer resistances obtained from the equivalent circuits. A Ts (b) of 197.52 and 198.92 mV dec−1 were achieved for ACB-F2 and ACB-N2, respectively, in the potential range of 0.6 to 1 V vs. SCE. In contrast, 172.61 mV dec−1 was obtained for ACB-N2F2 in the potential range of 0.25 to 0.5 V vs. SCE for the forward sweep. The reverse sweep showed a higher Ts than the forward sweep of the oxidation peak for all the electrodes within the same potential region. Table 1 presents the deduced Ts and β (charge transfer coefficient) at room temperature for the reaction, considering both reverse and forward sweeps, assuming the process is based on the adsorption of one-electron species. ACB-F2 and ACB-N2 have relatively comparable Ts and exhibit a similar reaction mechanism for glycerol electrooxidation. ACB-N2F2 exhibits the fastest kinetics, having the highest charge transfer coefficient.
In comparison with metal-based electrocatalysts, ACB-N2F2 is similar to Au-based (Ts = 0.177 V dec−1) but significantly slower than Pt (Ts = 160 to 169 mV dec−1) [32,37] and Pd-based (Ts = 136 mV dec−1) electrodes (Table 2). The elevated Tafel slopes observed in our study highlight the fundamental differences in charge transfer kinetics between metal-free and metal-supported systems. The absence of metal sites likely contributes to a less efficient electron transfer pathway, increasing reaction resistance [29,30,31,32,33]. However, despite slower kinetics, functionalized composite carbon materials offer a cost-effective and sustainable alternative for glycerol oxidation, reducing dependency on noble metals.

2.7. Rate-Determining Step (rds)

Tafel plot analysis is the primary approach for investigating the kinetic parameters of glycerol electrooxidation. Refs. [38,39] employed a mathematical method to derive kinetic parameters for anodic reactions, such as the oxygen evolution reaction (OER) on lead electrodes. Their study presents the relationship between parameters like Tafel slope, rate-determining step resistance (R), apparent charge transfer coefficient (αapa), and exchange current density as described below:
log R 1 = l o g R * 1 + β a p a F ( E E 0 ) 2.303 R T
R* is a function of exchange current density. The overpotential (EE0) is an independent variable; αapa can be determined from the slope obtained from the plot of log (R−1) against (EE0). The catalyst exchange current density can be obtained using the intercept value of the plot.
A microkinetic modeling technique can also be used to determine kinetic parameters such as exchange current density and Tafel slope of the electrocatalysts based on the above Costal model.
For the anodic process, Costa and Da Silva [38] proposed microkinetic modeling kinetic parameters for the anode catalyst, expressing the total resistance (R) as Equation (7) as follows:
R = j E T 1
Meanwhile, the Butler–Volmer equation describes the relationship between electrode potential (E) and current density (j), and the equation can be transformed into Equation (7), considering that the rds of the electrooxidation process is the adsorption of hydroxyl species on the electrode.
v = j 4 F A k a p a 0 1 θ [ H 2 O ] g l y 2 e x p β a p a F ( E E 0 ) R T
where v is the rate of electrooxidation. A is the ECSA of the composite electrocatalyst and kapa is the apparent rate constant. θ is the rate of coverage of the adsorbed OH species. [H2O]gly is the glycerol concentration, and βapa is the rds-based apparent charge transfer coefficient. Hence, the current density (j) can be expressed as Equation (9) as follows:
j 4 F A k a p a 0 1 θ [ H 2 O ] g l y 2 e x p β a p a F ( E E 0 ) R T
According to Costa et al., the total resistance (R) of the electrooxidation process can be demonstrated by introducing a term denoted by Y (reaction admittance), which is the reciprocal of R. From the foregoing, Equation (10) was obtained as follows:
R * = R T 4 F 2 k a p a 0 β a p a H 2 O g l y 2 = R T β a p a F j 0 ( a p a )
Take R as the rds, the overpotential (EE0) as the independent variable, and R as the dependent variable.
The curves follow a logarithmic expression proposed by Costa et al. [40] as follows:
β a p a = 2 R T b 4 F
where b represents the Tafel slope.
Take the overpotential (V) as the independent variable and log (R−1) as the dependent variable to obtain a straight-line plot, as presented in Figure 8. Then, the value of the slope is
β a p a F 2.303 R T
And, the intercept is log (R*−1), according to Equation (5). According to this microkinetic model, Table 3 presents the calculated exchange current density and Tafel slope for all the electrodes. ACB-N2F2 exhibits the lowest Tafel slope and the highest exchange current density, indicating the fastest electron transfer, while ACB-F2 has the highest Tafel slope. The relativity of the Tafel slope and exchange current density for ACB-N2 and ACB-F2 observed in both forward and reverse sweeps is irregular due to a complex mechanism. The complexity of the ACB-N2 and ACB-F2 mechanisms is a function of how closely the curves follow the logarithmic expression proposed by Costa et al. [39]. The simpler mechanism of ACB-N2F2 relative to ACB-N2 and ACB-F2 is due to the synergistic effect of both nitrogen and fluorine on the composite carbon. The higher exchange current density exhibited by ACB-N2F2 indicates a faster electrode oxidation reaction, a vital factor for efficient electrocatalysts and remarkable glycerol oxidation performance [32].
Using Equation (9), important electrooxidation kinetic parameters, like the apparent charge transfer coefficient (βapa) and the apparent rate constant ( k a p a 0 ), are also computed, and their values are presented in Table 3. ACB-N2F2 has the highest rate constant, while ACB-N2 has the lowest for both the forward and reverse sweeps. This result agrees with the Tafel slope, which shows that ACB-N2F2 is the best catalyst. The apparent charge transfer coefficient value mainly depends on the catalyst [40].
The results of the electrooxidation kinetic process study and the electrocatalyst microkinetic modeling investigated in this work are important for future studies of novel electrooxidation catalysts. The catalytic glycerol electrooxidation activity evaluation techniques in this study provide a suitable protocol for electrooxidation kinetic studies.

2.8. Double-Layer Capacitance

The double-layer capacitance was estimated from the value of the CPE parameters using the equation proposed by Brug et al. [41] for complex plane plots in the form of a depressed semicircle with the assumption that the simple distribution of time constants τ = Rs·Cdl.
C ¯ d l = T d l 1 ( R s 1 + R c t 1 ) 1 1 /
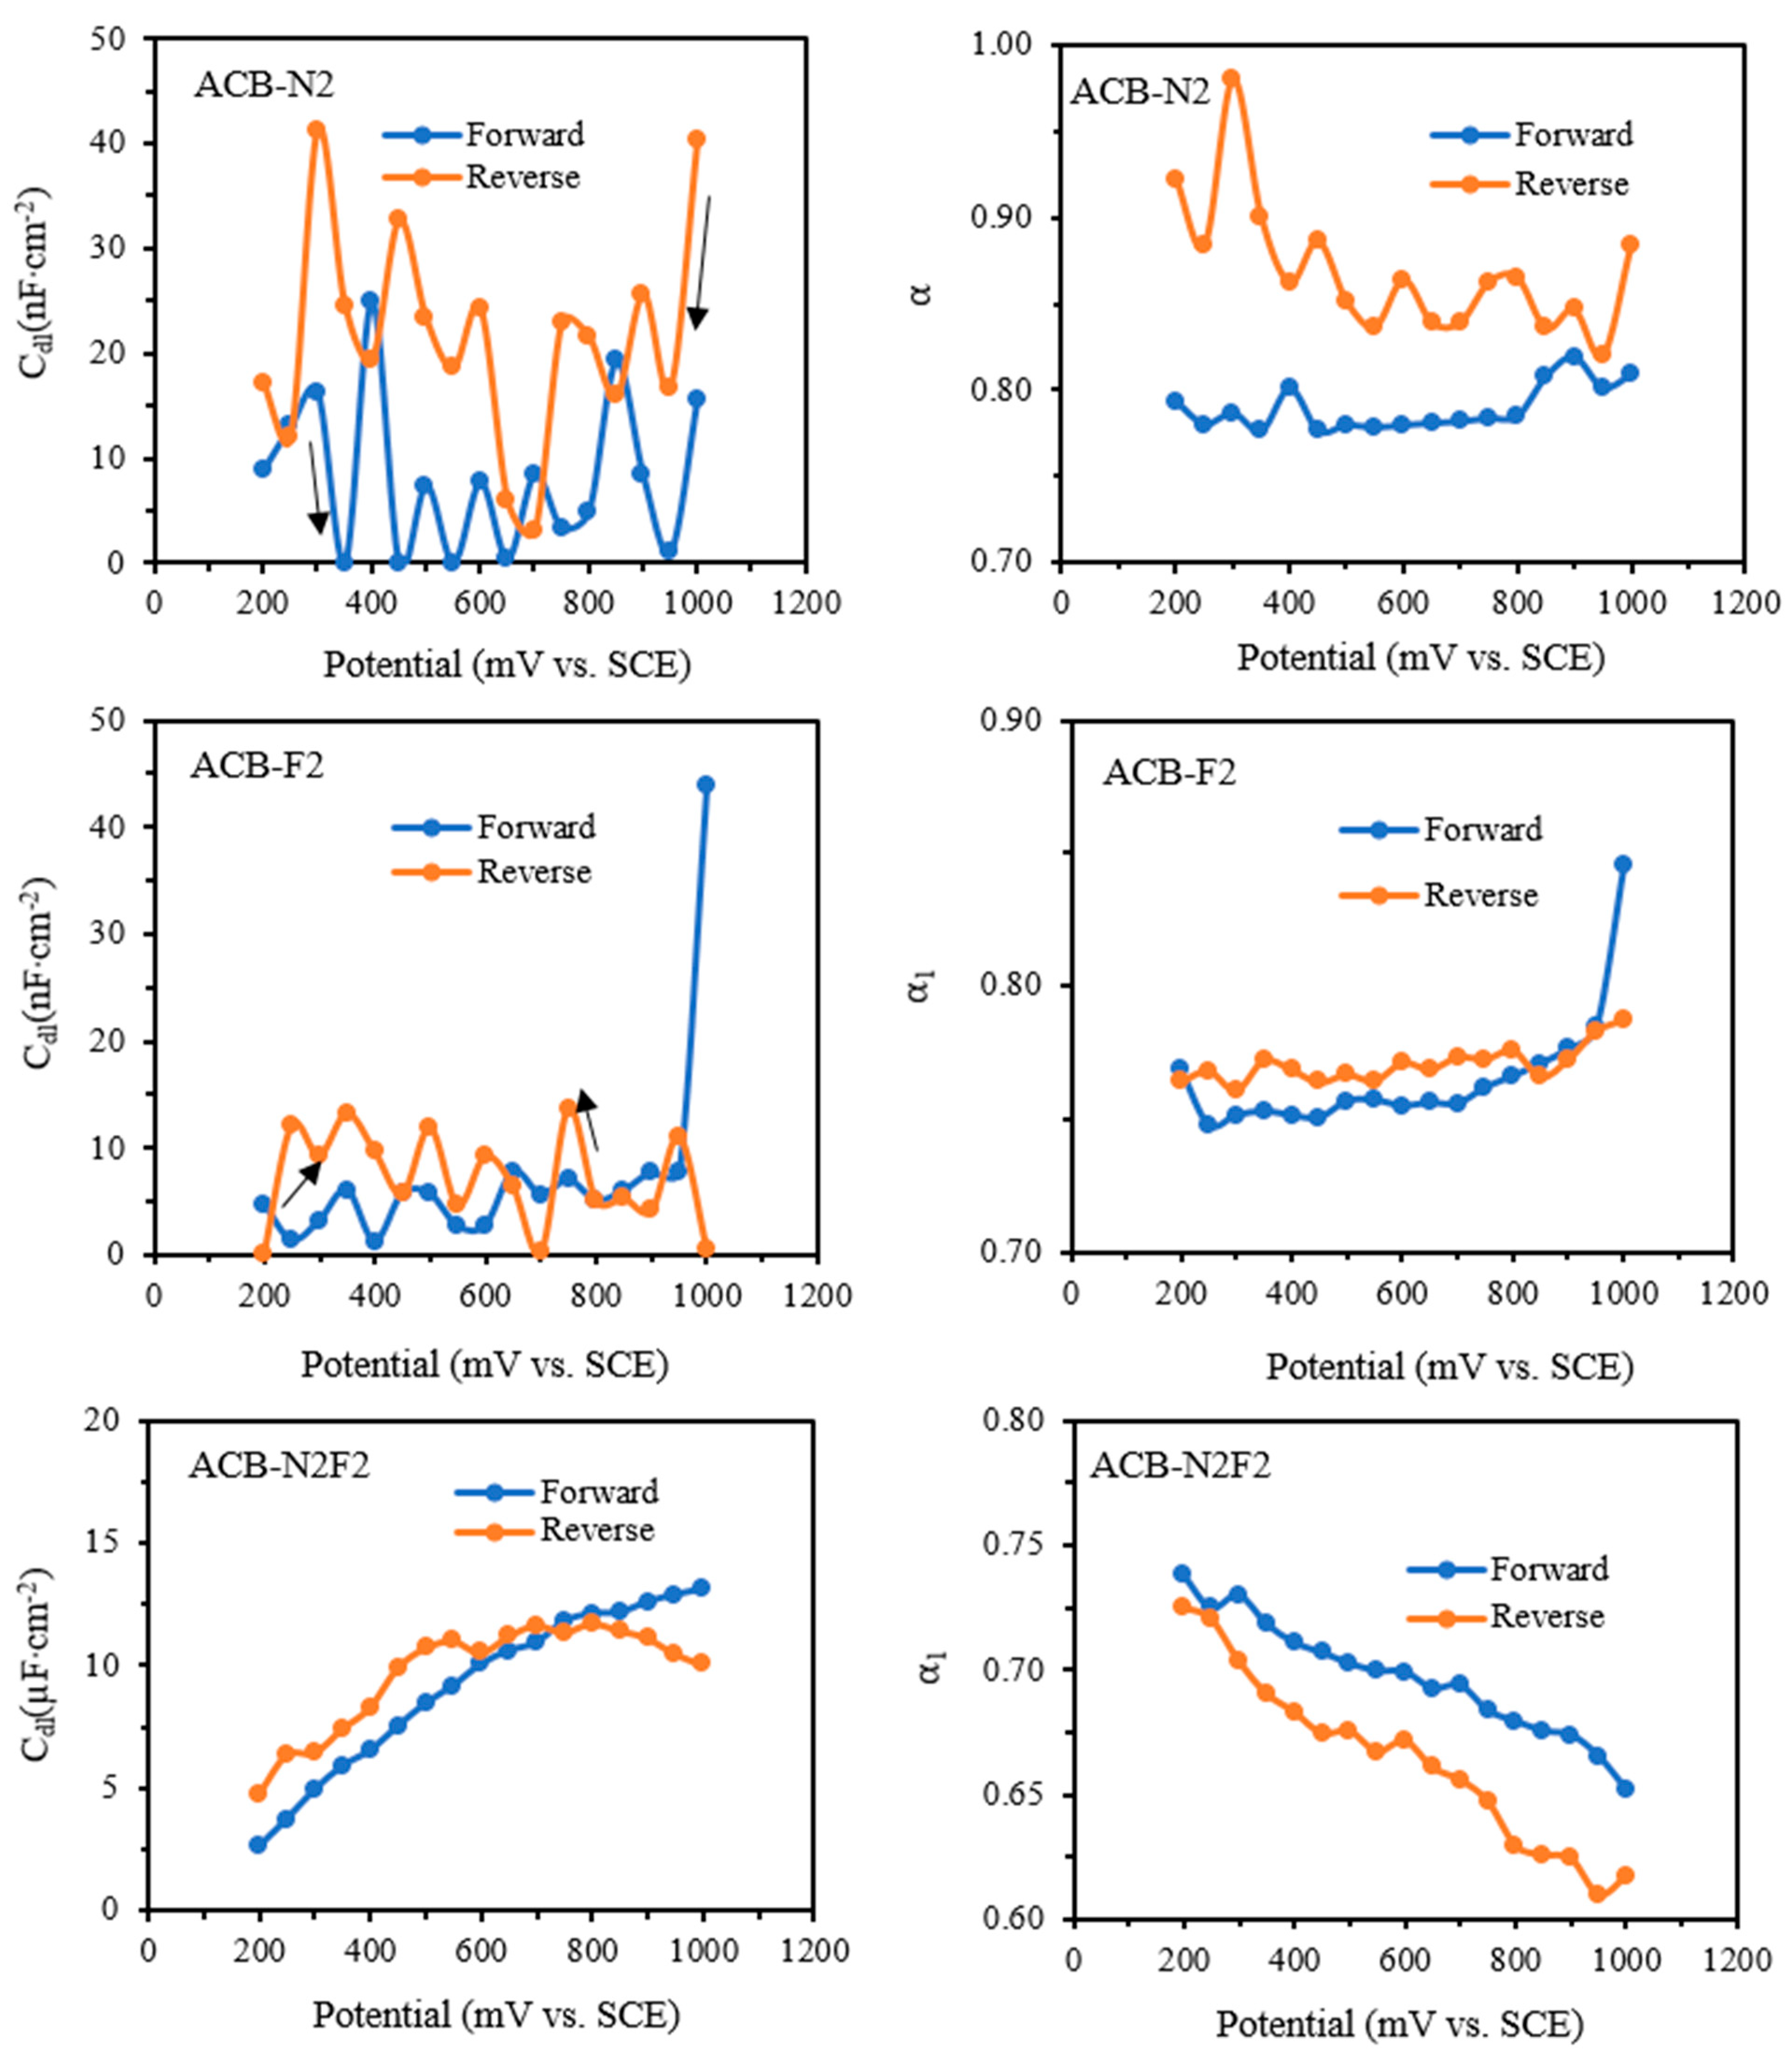
Figure 12 illustrates the impact of overpotential on double-layer capacitance and the CPE exponent α from fits to all circuits in both forward and reverse sweeps. For ACB-N2 and ACB-F2, the capacitance exhibits a disproportionate relationship with the overpotential, while the capacitance increases with an increase in the overpotential for the ACB-N2F2 electrode. This trend indicates that glycerol oxidation increases significantly with an increase in overpotential using ACB-N2F2, and it exhibits better kinetics at lower potentials. The trend holds for both forward and backward sweeps, but the increase is more linear for the forward sweep. This is because the heteroatoms act as oxidizing agents, and the oxidizing effect becomes more stable when synergistically and rationally combined.
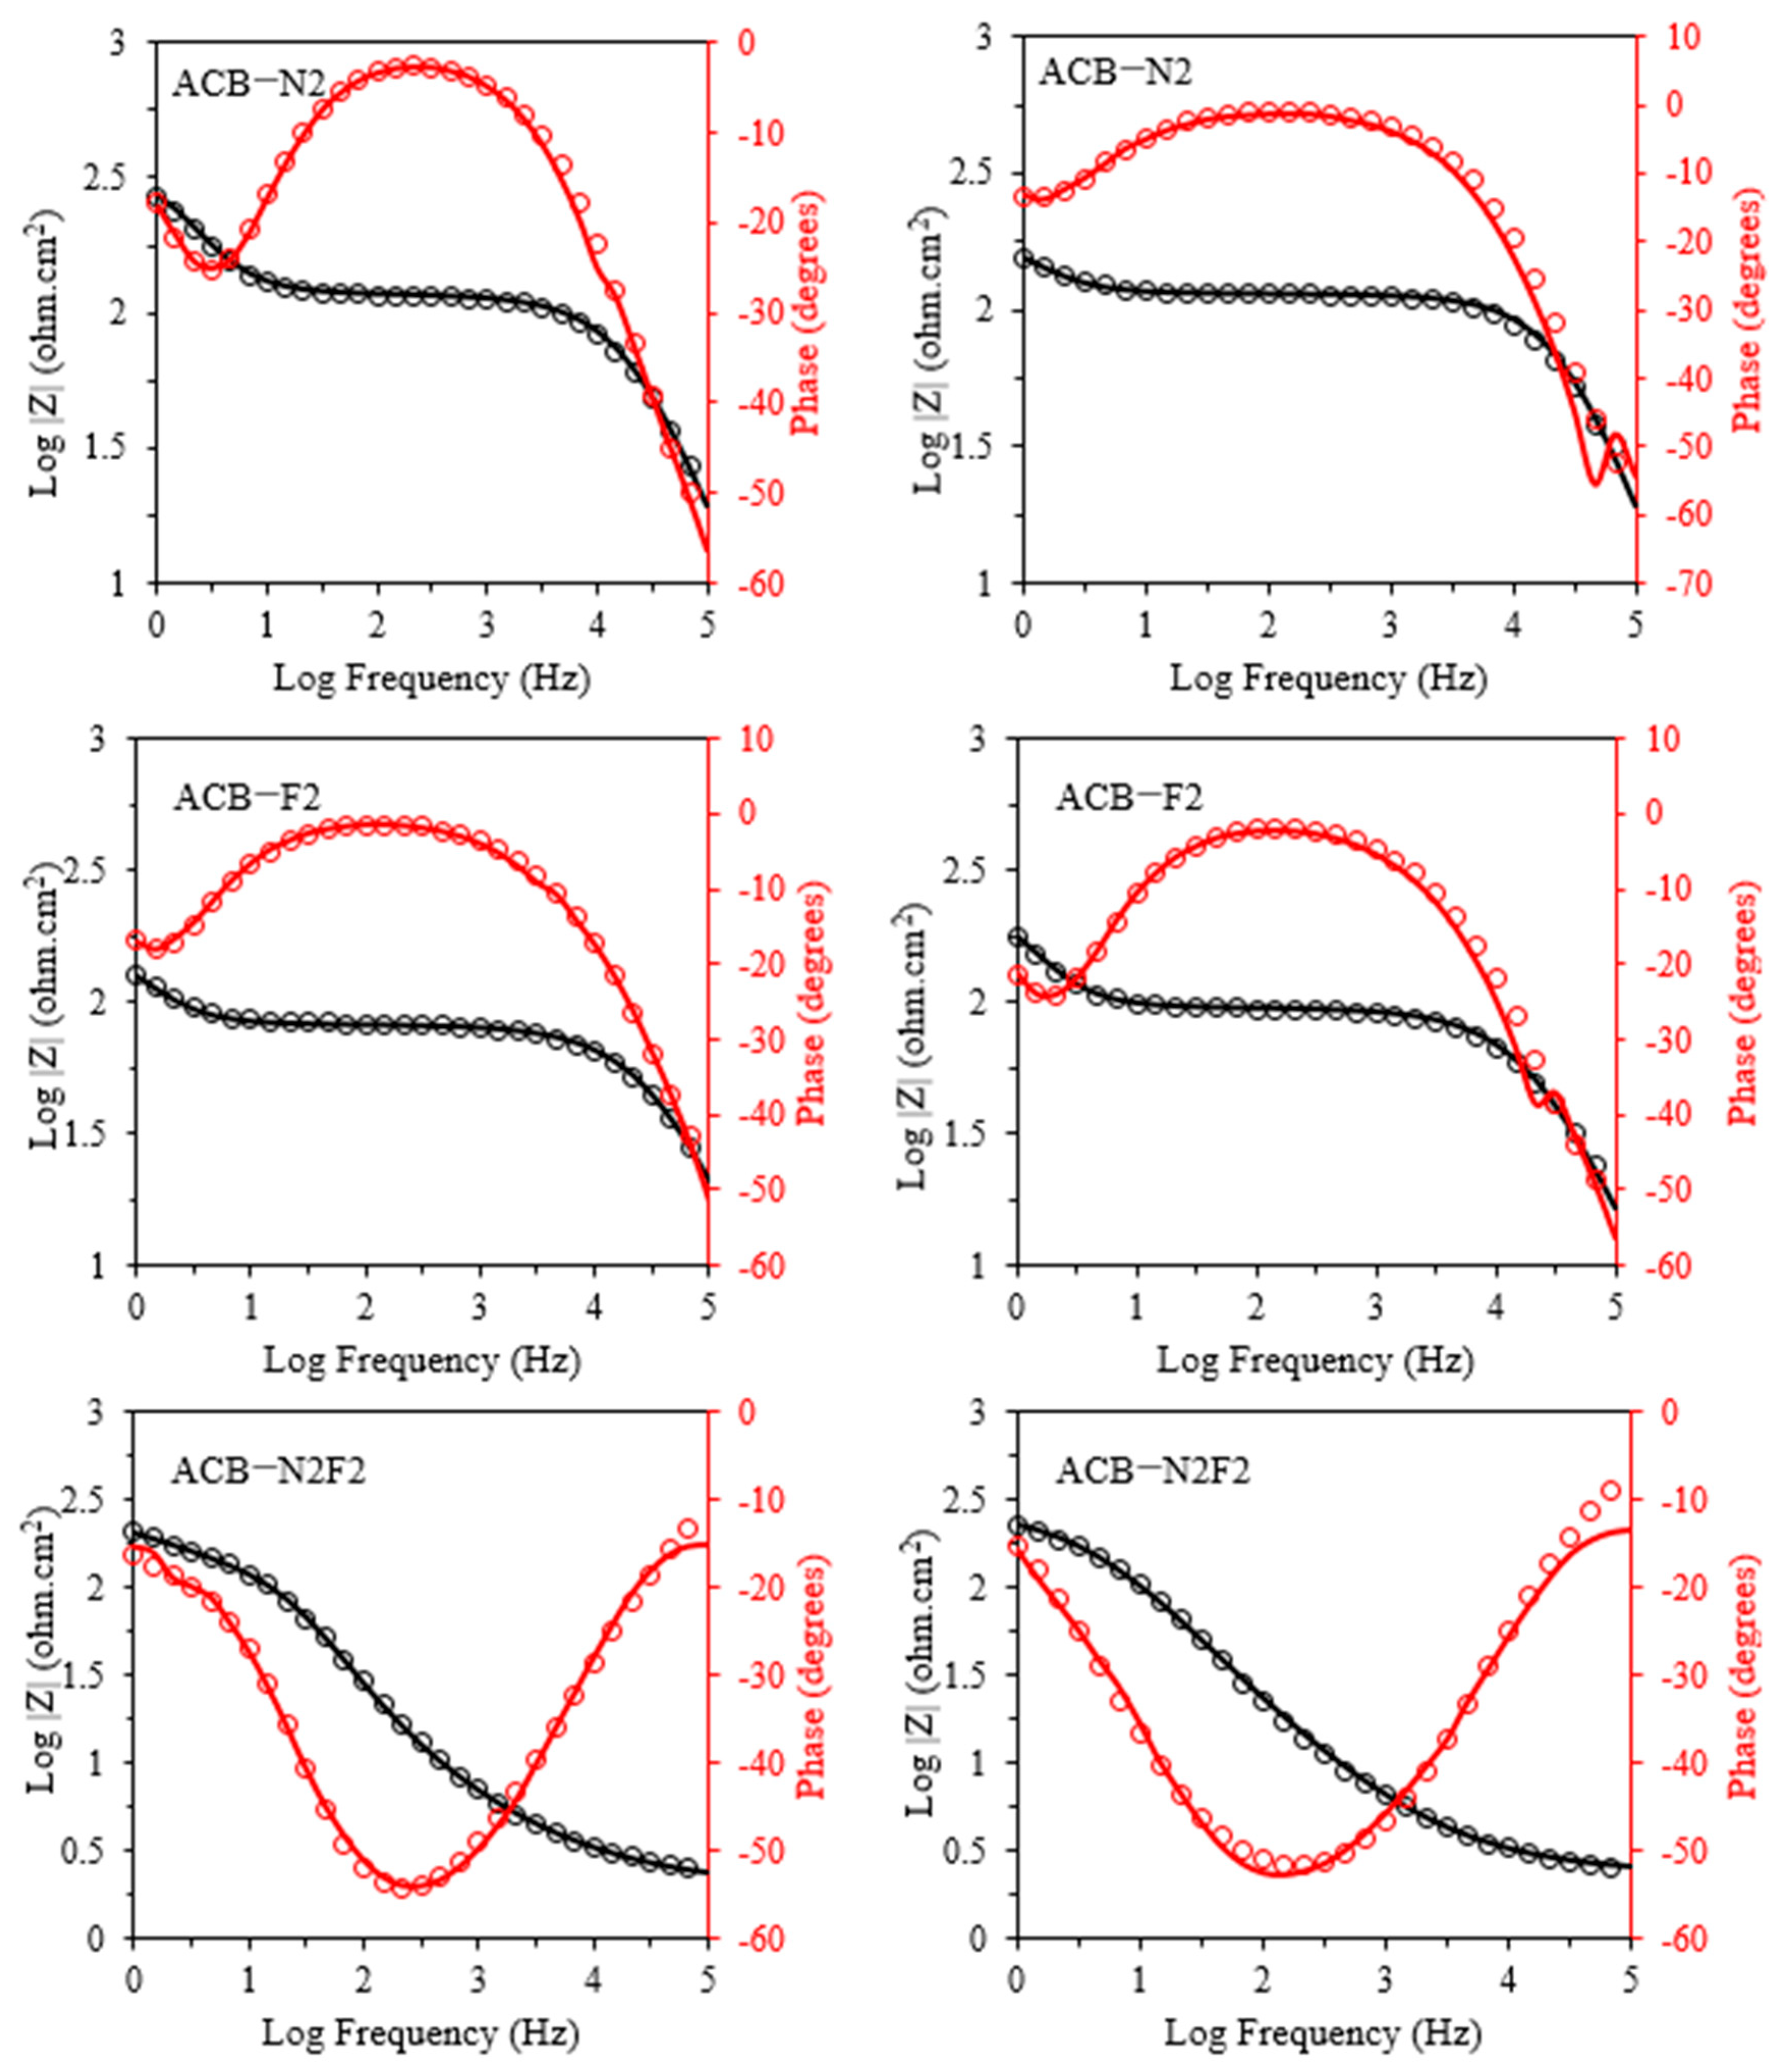
All the electrodes exhibit a dip in the phase in the region where the direct current departs from the baseline of the forward and reverse sweep. The dip in phase could be ascribed to a double-layer effect. Figure 13 reveals a dip in phase at 0.5 V on both forward and reverse sweeps, indicating a phase change that occurs around 200 Hz. For ACB-N2 and ACB-F2, the dip in phase occurred at a high frequency, whereas for ACB-N2F2, it occurred at a mid-frequency. Moreover, the dip in phase is more severe for ACB-N2F2, showing a higher value of CDL. The dip in phase justifies why both ACB-N2 and ACB-F2 exhibit two depressed semicircle equivalent circuits (Rs + Q1/Rct + Q2/R3) rather than a single depressed semicircle equivalent circuit, which is also evident in the complex plane plot. Although the complex plane plot of ACB-N2F2 exhibits a vivid depressed semicircle, an element of Warburg for infinite diffusion can be slightly noticed at a lower frequency (especially at a lower potential), which is justified by the phase angles in Figure 13 and the equivalent circuit (Rs + Q1/(Rct + W)).
The values of capacitance in the forward sweep circuit of ACB-N2 and ACB-F2 are in the nano range (7.45 and 5.7 nF cm−2 at 0.5 V), while that of ACB-N2F2 is in the micro range. This means that the process is based on a double-layer rather than an adsorption relaxation, and the capacitance can be combined with CPE to obtain a more accurate fit of the double-layer phase in this region. This trend is also observed in the reverse sweep of the electrodes, confirming that the feature is fundamental. The electrodes exhibited high-frequency relaxation with a resistance of several tens of ohms/cm2, which declined with increasing potential.

2.9. Kinetic Process of Glycerol Oxidation and Integration with Impedance Data

Glycerol oxidation in an alkaline medium follows a complex reaction pathway that involves multiple electron transfer steps, adsorption/desorption equilibria, and the formation of various intermediate species. The overall reaction mechanism can be understood through the following key steps.
1.
Glycerol Adsorption and Initial Deprotonation
Glycerol (C3H8O3) is adsorbed onto the functionalized carbon electrode surface, where the hydroxyl (-OH) groups interact with active sites. The first deprotonation step occurs via hydroxide ions (OH) from the electrolyte, leading to the formation of glyceroxide species as follows:
C 3 H 8 O 3 + O H C 3 H 7 O 3 + H 2 O
The impedance response at this stage typically shows high charge transfer resistance (Rct), as the initial adsorption and electron transfer processes are not yet fully established.
2.
Formation of Glyceraldehyde and Intermediates
The adsorbed glyceroxide undergoes successive oxidation steps, forming intermediates, such as glyceraldehyde (C3H6O2) and dihydroxyacetone. These intermediates are crucial in determining the overall oxidation efficiency as follows:
C 3 H 7 O 3 + O H C 3 H 6 O 2 + H 2 O + e
The emergence of these intermediates leads to a decrease in impedance (lower Rct), indicating an increased electron transfer rate.
3.
Further Oxidation to Carboxylates. As the potential increases, glyceraldehyde is further oxidized to glyceric acid, which can subsequently be cleaved into smaller carboxylate species, such as formate and oxalate, as follows:
C 3 H 6 O 2 + O H C 3 H 5 O 3 + H 2 O + e
The impedance spectrum at this stage reflects a more stable charge transfer process, with the Warburg impedance (W) indicating diffusion-controlled kinetics at higher potentials.
4.
Rate-Determining Step and Water Adsorption Influence
The observed Tafel slopes suggest that the rate-determining step for ACB-N2F2 occurs at lower overpotentials than ACB-N2 and ACB-F2 (0.4 V vs. SCE for ACB-N2F2). This indicates that water adsorption plays a crucial role in controlling the reaction rate, as water molecules are required for the oxidative cleavage of C–C bonds in glycerol as follows:
H 2 O + O H + H +
Here, the impedance model for ACB-N2F2 (single time constant) suggests that the reaction proceeds via a direct, streamlined pathway with minimal secondary resistive components.
5.
Electrochemical Impedance Spectroscopy (EIS) Interpretation
For ACB-N2 and ACB-F2 (double time constant model), two distinct charge transfer resistances suggest sequential reaction steps with intermediate charge accumulation, likely due to multiple active sites with varying electron transfer efficiencies. For ACB-N2F2 (single time constant model), the single dominant charge transfer resistance (Rct) in the impedance model indicates a uniform and highly conductive electron transport pathway facilitated by the co-doping of nitrogen and fluorine. This suggests that the synergistic effects of both dopants create a more homogenous catalyst surface, reducing the occurrence of intermediate resistance phases.
3. Materials and Methods

3.1. Materials

This study used several chemicals, like activated carbon black Super P (13 nm particle size, 550 m2/g SSA, 99% purity), paraffin oil (98%), polytetrafluoroethylene (PTFE) (60% dispersion in H2O), aniline (99%), KOH (86%), and carbon (99.5% purity, 950 m2/g SSA, 100 mm particle size). These were obtained from suppliers like Sigma-Aldrich, Saint Louis, MO, USA, and PlasmaChem GmbH, Schwarzschildstr 10, 12489 Berlin Germany.

3.2. Material Synthesis

F- and N-doped activated carbon black (ACB) composites for glycerol oxidation were prepared using a previously documented technique [17]. Aniline and PTFE served as precursors for N and F doping, respectively. The preparation involves stirring 10 g of ACB in 10 g of 1,3-propanediol, 100 mL of water, 2 g of aniline, and 2 g of PTFE in a fume cupboard at ambient temperature until solvent evaporation occurs. The dried mixture was then calcined at 20 °C/min heating rate up to 1000 °C for 1 h in high-purity N2. The obtained samples, designated ACB-F2, ACB-N2, and ACB-N2F2 for F, N, and co-doped versions, were previously characterized spectroscopically and microscopically [17,31]. The ECSAs for ACB-F2, ACB-N2, and ACB-N2F2 are 1751.39, 1309.84, and 1057.10 cm2 g−1 [31].

3.3. Electrochemical Measurements

Following a previously reported procedure by Alaba et al. [17], electrodes were synthesized by blending 25 mg of catalyst with 30% paraffin for 0.5 h to form a paste. This paste was loaded at a depth of 2 mm and a 4.5 mm internal diameter PTFE rod using a stainless steel rod as a charge collector. Although every effort was made to maintain consistent catalyst loading across electrodes, slight variations were observed during the drop-casting process. The actual mass loading of catalyst on each electrode was measured gravimetrically and found to vary between 0.30 ± 0.01 mg/cm2 for ACB-N2, 0.29 ± 0.01 mg/cm2 for ACB-F2, and 0.26 ± 0.01 mg/cm2 for ACB-N2F2. These minor differences in loading account for the variation in activity trends when comparing surface-normalized (mA/cm2) versus mass-normalized (mA/mg) current densities. Accordingly, both sets of metrics were presented for a comprehensive evaluation of catalytic performance.
Electrochemical measurements were performed in a 15 mL solution comprising 1 M glycerol and 1 M KOH and adjusted to pH 15 and conductivity 63 mS. An Ag/AgCl reference electrode and a Pt counter electrode were used under atmospheric conditions.
To identify the important aspects of the electrodes, chronoamperometry (CA) was performed at 0.5 V vs. SCE, and linear sweep voltammetry analysis was performed between −0.2 and 1 V vs. SCE at a 0.05 V s−1 scan rate. CV was also performed at a similar scan rate in the same potential range. EIS was employed between 0.10 Hz and 1.0 Hz at varying potentials (0.2 to 0.1 V vs. SCE) with a 0.01 V ac amplitude and a 0.05 Vs−1 scan rate to study the electrochemical kinetics of glycerol oxidation. The system was stabilized for 2 min before each EIS measurement.
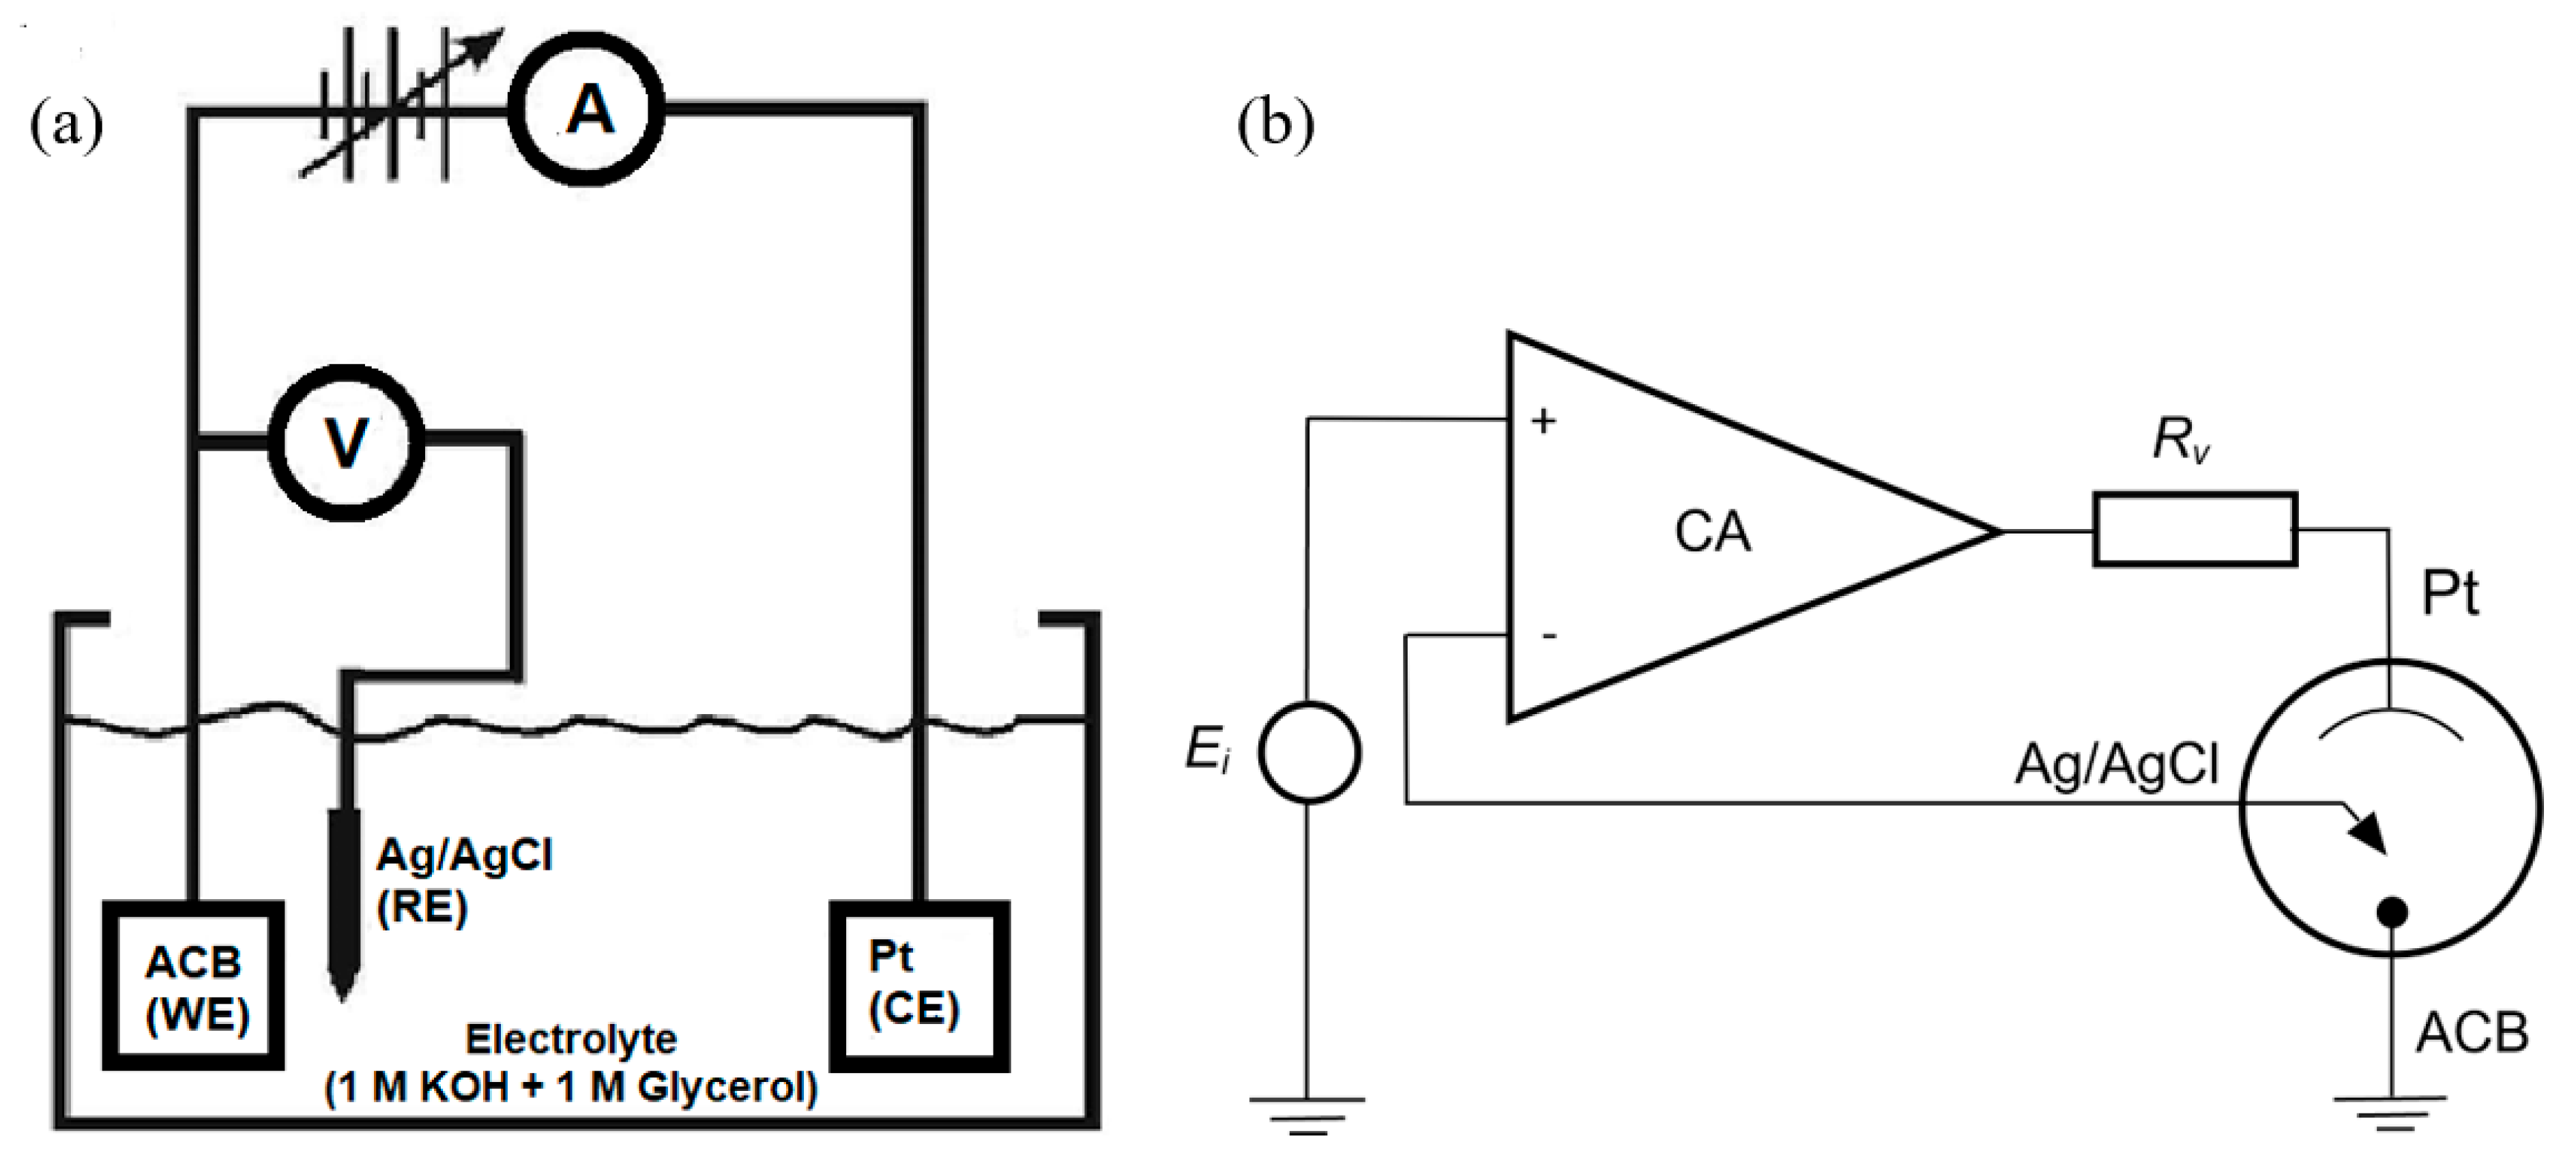
All electrochemical measurements were performed using EC-Lab V11.31 software on a BioLogic Science instrument, BioLogic, Seyssinet-Pariset, France. This equipment uses a control amplifier to maintain the potential difference between the reference and working electrodes as close as possible to the input voltage source. The counter electrode channels the applied current, which is measured as the voltage drop across a series resistor Rv, as shown in Figure 14.

3.4. Fitting Coefficient Parameter

To select a suitable equivalent circuit model, the correlation parameter χ2 must be minimized [36]. Also known as the “fitting coefficient parameter” or “goodness of fit,” χ2 measures the quality of the equivalent circuit’s fit to the experimental data shown on the complex plane. The mathematical expression is given as follows:
χ 2 = i = 1 n Z m e a s i Z s i m u l ( f i , p a r a m ) 2 σ i 2
where Zmeas(i) represents the obtained impedance at a frequency (fi) and fi is the frequency i, Zsimul(fi, param) is a function of the proposed model, where param represents the parameters (e.x., electrolyte resistance (Rs), charge transfer resistance (Rct), CDL (double-layer capacitor), and CPE (constant phase element)) of the model, and the standard deviation is represented by σi.
Therefore, when no weight is selected or “Weight = 1”, then the Z Fit criterion is adopted for the χ2 criterion and is given as follows:
χ 2 = i = 1 n Z m e a s i Z s i m u l ( f i , p a r a m ) 2
where χ2 is expressed in Ohm2.
If the impedance modulus, |Z| is chosen to weigh the data points, then χ2/|Z| becomes the correlation parameter to be minimized and is expressed in Ohm, as given by the following:
χ 2 | Z | = i = 1 n Z m e a s i Z s i m u l ( f i , p a r a m ) 2 Z m e a s i |
The correlation parameter measures the dependability of the selected equivalent circuit model. The Pearson test is employed to estimate the value of χ2 [34]. Moreover, the value of χ2 is determined by the range of measuring frequencies, the quality of experimental data, and the complexity of the electrical elements in the equivalent circuit model [42].

4. Conclusions

The mechanism and kinetic parameters of glycerol oxidation on functionalized carbon composite are essential for properly understanding the process. This study demonstrates that impedance spectra can obtain information regarding the chemical mechanism and microkinetic parameters based on Tafel behavior, rate constant, and exchange current density.
The zeroes of the interfacial potential are extracted from the equivalent circuits, showing that all electrodes exhibit stable interfacial zeroes. This indicates that the positive feedback is related to the potential dependency of the rate constants at the observed origin. However, a more comprehensive modeling of the shapes of the impedance based on the reaction steps needs to be explored to obtain a more detailed mechanism.
The fittings of the equivalent circuit of the DEIS spectra and the observed data revealed the following:
  • Water adsorption is the rate-limiting step at low overpotentials (0.55 V, 0.55 V, and 0.4 V for ACB-N2, ACB-F2, and ACB-N2F2), leading to CO accumulation and low total current due to site blockage.
  • Activation of adsorbed water at higher potentials enables the oxidation of glycerol intermediates, increasing total current and facilitating CO removal.
  • The shoulder peaks in the voltammetry (at 0.5 V, 0.7 V, and 0.55 V for ACB-N2, ACB-F2, and ACB-N2F2) mark a transition to glycerol adsorption as the rate-determining step.
Among the three electrodes, ACB-N2F2 demonstrated the highest ECD, lowest Tafel slope, and lowest rate constant, indicating the most efficient charge transfer. The synergistic effects of dual doping enhance electron transport, reduce recombination losses, and simplify the reaction pathway, resulting in superior glycerol electrooxidation performance. The integration of DEIS with kinetic modeling presents a valuable approach for probing complex electrochemical mechanisms and optimizing electrode materials for biomass-derived alcohol oxidation.

Author Contributions

Conceptualization, F.A. and P.A.A.; methodology, P.A.A.; validation, F.A., P.A.A., and R.K.; formal analysis, P.A.A.; investigation, F.A., P.A.A., and R.K.; resources, F.A. and R.K.; writing—original draft preparation, F.A. and P.A.A.; writing—review and editing, F.A., P.A.A., and R.K.; funding acquisition, F.A. and R.K. All authors have read and agreed to the published version of the manuscript.

Funding

The Deanship of Scientific Research (DSR) at King Abdulaziz University (KAU), Jeddah, Saudi Arabia, has funded this project under grant number G:470-829-1443.

Acknowledgments

This project was funded by the Deanship of Scientific Research (DSR) at King Abdulaziz University (KAU), Jeddah, under grant number G:470-829-1443. The authors, therefore, acknowledges with thanks the DSR for technical and financial support.

Conflicts of Interest

The authors declare no conflicts of interest.

References

  1. Tareq, S.; Yap, Y.H.T.; Saleh, T.A.; Abdullah, A.H.; Rashid, U.; Saiman, M.I. Synthesis of bimetallic gold-pallidum loaded on carbon as efficient catalysts for the oxidation of benzyl alcohol into benzaldehyde. J. Mol. Liq. 2018, 271, 885–891. [Google Scholar] [CrossRef]
  2. Désilets, C.; Lasia, A. Dynamic impedance study of ethanol and acetaldehyde oxidation at platinum in acid solutions. Electrochim. Acta 2012, 78, 286–293. [Google Scholar] [CrossRef]
  3. Saleh, T.A. Trends in the sample preparation and analysis of nanomaterials as environmental contaminants. Trends Environ. Anal. Chem. 2020, 28, e00101. [Google Scholar] [CrossRef]
  4. Alshaheri, A.A.; Tahir, M.I.M.; Rahman, M.B.A.; Ravoof, T.B.; Saleh, T.A. Catalytic oxidation of cyclohexane using transition metal complexes of dithiocarbazate Schiff base. Chem. Eng. J. 2017, 327, 423–430. [Google Scholar] [CrossRef]
  5. Alaba, P.A.; Mazari, S.A.; Farouk, H.U.; Sanni, S.E.; Agboola, O.; Lee, C.S.; Abnisa, F.; Aroua, M.K.; Daud, W.M.A.W. Harvesting Electricity from CO2 Emission: Opportunities, Challenges and Future Prospects. Int. J. Precis. Eng. Manuf.-Green Technol. 2021, 8, 1061–1081. [Google Scholar] [CrossRef]
  6. Zalineeva, A.; Serov, A.; Padilla, M.; Martinez, U.; Artyushkova, K.; Baranton, S.; Coutanceau, C.; Atanassov, P.B. Self-supported Pd x Bi catalysts for the electrooxidation of glycerol in alkaline media. J. Am. Chem. Soc. 2014, 136, 3937–3945. [Google Scholar] [CrossRef]
  7. Alaba, P.A.; Lee, C.S.; Abnisa, F.; Aroua, M.K.; Cognet, P.; Pérès, Y.; Daud, W.M.A.W. A review of recent progress on electrocatalysts toward efficient glycerol electrooxidation. Rev. Chem. Eng. 2020, 37, 779–811. [Google Scholar] [CrossRef]
  8. Houache, M.S.; Safari, R.; Nwabara, U.O.; Rafaïdeen, T.; Botton, G.A.; Kenis, P.J.; Baranton, S.; Coutanceau, C.; Baranova, E.A. Selective Electrooxidation of Glycerol to Formic Acid over Carbon Supported Ni1–x M x (M = Bi, Pd, and Au) Nanocatalysts and Coelectrolysis of CO2. ACS Appl. Energy Mater. 2020, 3, 8725–8738. [Google Scholar] [CrossRef]
  9. Hu, J.; Lu, H.; Li, M.; Xiao, G.; Li, M.; Xiang, X.; Lu, Z.; Qiao, Y. Cobalt valence modulating in CoOx incorporated carbon nanofiber for enhanced glucose electrooxidation. Mater. Rep. Energy 2022, 2, 100091. [Google Scholar]
  10. Mahapatra, S.; Dutta, A.; Datta, J. Temperature effect on the electrode kinetics of ethanol oxidation on Pd modified Pt electrodes and the estimation of intermediates formed in alkali medium. Electrochim. Acta 2010, 55, 9097–9104. [Google Scholar] [CrossRef]
  11. Wang, H.; Jusys, Z.; Behm, R. Ethanol and Acetaldehyde Adsorption on a Carbon-Supported Pt Catalyst: A Comparative DEMS Study. Fuel Cells 2004, 4, 113–125. [Google Scholar] [CrossRef]
  12. Rao, V.; Cremers, C.; Stimming, U.; Cao, L.; Sun, S.; Yan, S.; Sun, G.; Xin, Q. Electro-oxidation of ethanol at gas diffusion electrodes a DEMS study. J. Electrochem. Soc. 2007, 154, B1138–B1147. [Google Scholar] [CrossRef]
  13. Gomes, J.F.; Busson, B.; Tadjeddine, A. SFG Study of the Ethanol in an Acidic Medium− Pt (110) Interface: Effects of the Alcohol Concentration. J. Phys. Chem. B 2006, 110, 5508–5514. [Google Scholar] [CrossRef]
  14. Kowal, A.; Li, M.; Shao, M.; Sasaki, K.; Vukmirovic, M.; Zhang, J.; Marinkovic, N.S.; Liu, P.; Frenkel, A.I.; Adzic, R.R. Ternary Pt/Rh/SnO2 electrocatalysts for oxidizing ethanol to CO2. Nat. Mater. 2009, 8, 325–330. [Google Scholar] [CrossRef]
  15. Chen, S.; Schell, M. Bistability and excitability in the electrochemical oxidation of ethanol. Electrochim. Acta 1999, 44, 4773–4780. [Google Scholar] [CrossRef]
  16. Camara, G.A.; Iwasita, T. Parallel pathways of ethanol oxidation: The effect of ethanol concentration. J. Electroanal. Chem. 2005, 578, 315–321. [Google Scholar] [CrossRef]
  17. Alaba, P.A.; Lee, C.S.; Abnisa, F.; Aroua, M.K.; Abakr, Y.A.; Ibrahim, M.D.; Cognet, P.; Pérès, Y.; Daud, W.M.W. Investigating the electrocatalytic oxidation of glycerol on simultaneous nitrogen-and fluorine-doped on activated carbon black composite. Diam. Relat. Mater. 2020, 101, 107626. [Google Scholar] [CrossRef]
  18. Bambagioni, V.; Bianchini, C.; Marchionni, A.; Filippi, J.; Vizza, F.; Teddy, J.; Serp, P.; Zhiani, M. Pd and Pt–Ru anode electrocatalysts supported on multi-walled carbon nanotubes and their use in passive and active direct alcohol fuel cells with an anion-exchange membrane (alcohol = methanol, ethanol, glycerol). J. Power Sources 2009, 190, 241–251. [Google Scholar] [CrossRef]
  19. Fernández, P.S.; Martins, C.A.; Martins, M.E.; Camara, G.A. Electrooxidation of glycerol on platinum nanoparticles: Deciphering how the position of each carbon affects the oxidation pathways. Electrochim. Acta 2013, 112, 686–691. [Google Scholar] [CrossRef]
  20. Falase, A.; Main, M.; Garcia, K.; Serov, A.; Lau, C.; Atanassov, P. Electrooxidation of ethylene glycol and glycerol by platinum-based binary and ternary nano-structured catalysts. Electrochim. Acta 2012, 66, 295–301. [Google Scholar] [CrossRef]
  21. Gupta, S.S.; Datta, J. A comparative study on ethanol oxidation behavior at Pt and PtRh electrodeposits. J. Electroanal. Chem. 2006, 594, 65–72. [Google Scholar] [CrossRef]
  22. Bonesi, A.; Moreno, M.; Triaca, W.; Luna, A.C. Modified catalytic materials for ethanol oxidation. Int. J. Hydrogen Energy 2010, 35, 5999–6004. [Google Scholar] [CrossRef]
  23. Bai, Y.; Wu, J.; Xi, J.; Wang, J.; Zhu, W.; Chen, L.; Qiu, X. Electrochemical oxidation of ethanol on Pt–ZrO2/C catalyst. Electrochem. Commun. 2005, 7, 1087–1090. [Google Scholar] [CrossRef]
  24. Sun, H.; Xu, X.; Fei, L.; Zhou, W.; Shao, Z. Electrochemical oxidation of small molecules for energy-saving hydrogen production. Adv. Energy Mater. 2024, 14, 2401242. [Google Scholar] [CrossRef]
  25. Seifitokaldani, A.; Savadogo, O.; Perrier, M. Stability and catalytic activity of titanium oxy-nitride catalyst prepared by in-situ urea-based sol–gel method for the oxygen reduction reaction (ORR) in acid medium. Int. J. Hydrogen Energy 2015, 40, 10427–10438. [Google Scholar] [CrossRef]
  26. Niya, S.M.R.; Hoorfar, M. Process modeling of electrodes in proton exchange membrane fuel cells. J. Electroanal. Chem. 2015, 747, 112–122. [Google Scholar] [CrossRef]
  27. Fu, Y.; Poizeau, S.; Bertei, A.; Qi, C.; Mohanram, A.; Pietras, J.; Bazant, M. Heterogeneous electrocatalysis in porous cathodes of solid oxide fuel cells. Electrochim. Acta 2015, 159, 71–80. [Google Scholar] [CrossRef]
  28. Darab, M.; Dahlstrøm, P.K.; Thomassen, M.S.; Seland, F.; Sunde, S. Dynamic electrochemical impedance spectroscopy of Pt/C-based membrane-electrode assemblies subjected to cycling protocols. J. Power Sources 2013, 242, 447–454. [Google Scholar] [CrossRef]
  29. Seland, F.; Tunold, R.; Harrington, D.A. Impedance study of formic acid oxidation on platinum electrodes. Electrochim. Acta 2008, 53, 6851–6864. [Google Scholar] [CrossRef]
  30. Seland, F.; Tunold, R.; Harrington, D.A. Impedance study of methanol oxidation on platinum electrodes. Electrochim. Acta 2006, 51, 3827–3840. [Google Scholar] [CrossRef]
  31. Alaba, P.; Lee, C.S.; Abnisa, F.; Aroua, M.K.; Cognet, P.; Pérès, Y.; Daud, W.M.A.W. Kinetic parameters for glycerol electrooxidation over nitrogen-and fluorine-doped composite carbon: Dynamic electrochemical impedance spectroscopy analysis based. J. Electroanal. Chem. 2021, 883, 115043. [Google Scholar] [CrossRef]
  32. Lee, S.; Kim, H.J.; Choi, S.M.; Seo, M.H.; Kim, W.B. The promotional effect of Ni on bimetallic PtNi/C catalysts for glycerol electrooxidation. Appl. Catal. A Gen. 2012, 429, 39–47. [Google Scholar] [CrossRef]
  33. Velázquez-Palenzuela, A.; Centellas, F.; Garrido, J.A.; Arias, C.; Rodríguez, R.M.; Brillas, E.; Cabot, P.-L. Kinetic analysis of carbon monoxide and methanol oxidation on high performance carbon-supported Pt–Ru electrocatalyst for direct methanol fuel cells. J. Power Sources 2011, 196, 3503–3512. [Google Scholar] [CrossRef]
  34. Darowicki, K.; Gawel, L. Impedance measurement and selection of electrochemical equivalent circuit of a working PEM fuel cell cathode. Electrocatalysis 2017, 8, 235–244. [Google Scholar] [CrossRef]
  35. Schulz, T.; Weinmüller, C.; Nabavi, M.; Poulikakos, D. Electrochemical impedance spectroscopy analysis of a thin polymer film-based micro-direct methanol fuel cell. J. Power Sources 2010, 195, 7548–7558. [Google Scholar] [CrossRef]
  36. Holm, T.; Dahlstrøm, P.K.; Sunde, S.; Seland, F.; Harrington, D.A. Dynamic electrochemical impedance study of methanol oxidation at Pt at elevated temperatures. Electrochim. Acta 2019, 295, 139–147. [Google Scholar] [CrossRef]
  37. Habibi, E.; Razmi, H. Glycerol electrooxidation on Pd, Pt and Au nanoparticles supported on carbon ceramic electrode in alkaline media. Int. J. Hydrogen Energy 2012, 37, 16800–16809. [Google Scholar] [CrossRef]
  38. Costa, F.R.; Da Silva, L.M. Fabrication and characterization of a porous gas-evolving anode constituted of lead dioxide microfibers electroformed on a carbon cloth substrate. Electrochim. Acta 2012, 70, 365–374. [Google Scholar] [CrossRef]
  39. Costa, F.R.; Franco, D.V.; Da Silva, L.M. Electrochemical impedance spectroscopy study of the oxygen evolution reaction on a gas-evolving anode composed of lead dioxide microfibers. Electrochim. Acta 2013, 90, 332–343. [Google Scholar] [CrossRef]
  40. O’hayre, R.; Cha, S.-W.; Colella, W.; Prinz, F.B. Fuel Cell Fundamentals; John Wiley & Sons: Hoboken, NJ, USA, 2016. [Google Scholar]
  41. Brug, G.J.; Van Den Eeden, A.L.G.; Sluyters-Rehbach, M.; Sluyters, J.H. The analysis of electrode impedances complicated by the presence of a constant phase element. J. Electroanal. Chem. Interfacial Electrochem. 1984, 176, 275–295. [Google Scholar] [CrossRef]
  42. Orazem, M.E.; Tribollet, B. An integrated approach to electrochemical impedance spectroscopy. Electrochim. Acta 2008, 53, 7360–7366. [Google Scholar] [CrossRef]
Figure 1. Cyclic voltammograms of 1 M glycerol in 1 M KOH over (a) ACB-N2, (b) ACB-F2, (c) ACB-N2F2, and (d) net glycerol oxidation current of ACB-N2, ACB-F2, ACB- N2F2, at 50 mV/s sweep rates.
Catalysts 15 00805 g001
Figure 2. Complex plane plot for forward (left) and reverse (right) sweeps between 100 kHz and 1 Hz at the potential of 0.5 V and 10 mV perturbation amplitude.
Catalysts 15 00805 g002
Figure 3. Effect of overpotential on the fitting coefficient parameter χ2/|Z| for both forward and reverse sweeps for ACB-N2, ACB-F2, and ACB-N2F2 between 100 kHz and 1 Hz, at a sweep rate of 50 mV/s.
Catalysts 15 00805 g003
Figure 4. Complex plane plots for forward sweeps between 100 kHz and 1 Hz at varying potentials and 50 mV/s sweep rates, 0.2 to 0.6 V (left), and 0.65 to 1.0 V (right).
Catalysts 15 00805 g004
Figure 5. Complex plane plots for the reverse sweep between 100 kHz and 1 Hz at varying potentials and 50 mV/s sweep rates, 0.2 to 0.6 V (left), and 0.65 to 1.0 V (right).
Catalysts 15 00805 g005
Figure 6. Parameters B (right) and τ (left) for the forward sweeps. Extracted from the equivalent circuits using Equations (3) and (4).
Catalysts 15 00805 g006
Figure 7. Fitted dynamic electrochemical impedance spectra data parameter, Rct−1 for ACB–N2, ACB–F2, and ACB–N2F2.
Catalysts 15 00805 g007
Figure 8. Parameters B (right) and τ (left) for the reverse sweeps extracted from the equivalent circuits using Equations (3) and (4).
Catalysts 15 00805 g008
Figure 9. Polarization resistance Rp estimated by extrapolating the impedance to zero frequency for forward (left) and reverse (right) sweeps.
Catalysts 15 00805 g009
Figure 10. Tafel plots of Rct for forward (left) and reverse (right) sweeps at the fitted regions, showing the regression lines, equations, and coefficient of determination.
Catalysts 15 00805 g010aCatalysts 15 00805 g010b
Figure 11. Simulation curve for kinetic parameter calculation for ACB–N2, ACB–F2, and ACB–N2F2.
Catalysts 15 00805 g011
Figure 12. Double-layer capacitance and CPE exponent α from fits to all circuits in forward and reverse sweeps.
Catalysts 15 00805 g012
Figure 13. Bode plot at 0.5 V on forward (left) and reverse (right) sweeps shows the phase change. The fits for the equivalent circuit are presented with solid lines, while the circles represent the experimental data.
Catalysts 15 00805 g013
Figure 14. (a) Experimental setup for glycerol electrooxidation; (b) schematic diagram of the three-electrode potentiostat.
Catalysts 15 00805 g014
Table 1. Comparison of the extrapolated Tafel slopes and charge transfer coefficient (β) at 23 °C for the reaction for both forward and reverse sweeps.
SampleForward Reverse
Tafel slope βTafel slope β
mV dec−1 mV dec−1
ACB-N2197.520.0284212.850.0205
ACB-F2198.920.0229198.930.0248
ACB-N2F2177.970.093178.860.0671
Table 2. Comparing the Tafel behavior of the glycerol electrooxidation on supported noble metals with the investigated heteroatom-doped composite carbon.
Catalyst TypeReaction MediumElectrochemical MethodTafel Slope
(mV dec−1)
Ref.
Pt/CCE0.5 M glycerol in 0.3 M NaOHCV166[38]
Pd/CCE0.5 M glycerol in 0.3 M NaOHCV136[38]
Au/CCE0.5 M glycerol in 0.3 M NaOHCV177[38]
Pt/C2 M glycerol in 0.5 M H2SO4CV169[32]
Pt1Ni1/C2 M glycerol in 0.5 M H2SO4CV162[32]
Pt2Ni1/C2 M glycerol in 0.5 M H2SO4CV160[32]
Pt3Ni1/C2 M glycerol in 0.5 M H2SO4CV166[32]
ACB-N21 M glycerol in 1 M KOHEIS197.52This work
ACB-F21 M glycerol in 1 M KOHEIS198.92This work
ACB-N2F21 M glycerol in 1 M KOHEIS177.97This work
CCE: carbon ceramic electrode.
Table 3. Microkinetic parameters for the heteroatom-doped carbon composite electrocatalysts during glycerol oxidation at 23 °C for both forward and reverse sweeps.
Forward Reverse
Sampleβa
(mV dec−1)
βapaj0
(mA cm−2)
k
(cm s−1)
βa
(mV dec−1)
βapaj0
(mA cm−2)
k
(cm s−1)
ACB-N23.860.130.18014.67 × 10−1010.210.130.00092.39 × 10−12
ACB-F213.200.170.00024.53 × 10−133.690.050.27007.00 × 10−10
ACB-N2F22.420.031.01292.62 × 10−91.500.022.17255.63 × 10−9
Disclaimer/Publisher’s Note: The statements, opinions and data contained in all publications are solely those of the individual author(s) and contributor(s) and not of MDPI and/or the editor(s). MDPI and/or the editor(s) disclaim responsibility for any injury to people or property resulting from any ideas, methods, instructions or products referred to in the content.