Article

Loading Eu2O3 Enhances the CO Oxidation Activity and SO2 Resistance of the Pt/TiO2 Catalyst

1
Key Laboratory of Beijing on Regional Air Pollution Control, Department of Environmental Engineering, Beijing University of Technology, Beijing 100124, China
2
National Engineering Research Center of Urban Environmental Pollution Control, Beijing Municipal Research Institute of Eco-Environmental Protection, Beijing 100037, China
*
Authors to whom correspondence should be addressed.
Catalysts 2025, 15(8), 783; https://doi.org/10.3390/catal15080783 (registering DOI)
Submission received: 8 July 2025 / Revised: 13 August 2025 / Accepted: 14 August 2025 / Published: 16 August 2025
(This article belongs to the Special Issue Heterogeneous Catalysis in Air Pollution Control)

Abstract

Pt/TiO2 and Pt-Eu2O3/TiO2 catalysts were prepared via the impregnation method for catalytic oxidation of CO. The Pt-2Eu2O3/TiO2 catalyst exhibited better CO oxidation activity as well as greater SO2 resistance than the Pt/TiO2 catalyst. For the inlet gas consisting of 0.8% CO, 5% O2, and balanced N2, the lowest complete conversion temperatures (T100) of CO were 120 °C and 140 °C for the Pt-2Eu2O3/TiO2 and Pt/TiO2 catalysts, respectively. During the 72 h SO2-resistance test at 200 °C under an inlet gas composition of 0.8% CO, 5% O2, 15% H2O, 50 ppm SO2, and balanced N2, the CO conversion on the Pt-2Eu2O3/TiO2 catalyst remained >99%, while that on the Pt/TiO2 catalyst gradually decreased to 77.8%. Pre-loading 2 wt% Eu2O3 on TiO2 enhanced the dispersion of Pt, increased the proportion of Pt0, and facilitated the adsorption and dissociation of H2O, all of which promoted CO oxidation. SO2 preferentially occupied the Eu2O3 sites by forming stable sulfates on the Pt-2Eu2O3/TiO2 catalyst, which protected the Pt active sites from poisoning. The OH* species produced from the dissociation of H2O played a significant role in promoting CO oxidation through the formation of COOH* as the key reaction intermediate. The developed Pt-2Eu2O3/TiO2 catalyst has great application potential in terms of the removal of CO from industrial flue gases.

1. Introduction

Carbon monoxide (CO) is considered one of the most dangerous air pollutants because it can cause tissue hypoxia and fatal asphyxiation [1]. As a typical byproduct of the incomplete combustion of fossil fuels, CO is primarily emitted from energy-intensive industries. For example, exhaust gas from the sintering process in the steel industry includes about 1 vol% of CO [2]. Catalytic oxidation emerges as the most viable approach to remove CO at the low temperatures (<200 °C) of industrial flue gases, which has attracted considerable research interest [3].
A wide range of catalysts have been studied for CO oxidation, including noble-metal-based catalysts such as Pt [4], Pd [5], and Au [6] and non-noble metal catalysts such as Co [7], Cu [8], and Mn [9]. Non-noble metal catalysts are highly susceptible to the H2O and SO2 contained in industrial flue gases, hindering their widespread application. Among all the investigated noble metal catalysts, Pt-based catalysts exhibit promising potential for industrial applications due to their excellent low-temperature activity in the presence of H2O [10]. It is well recognized that H2O promotes CO oxidation over Pt-based catalysts, mainly by weakening the CO adsorption on Pt surfaces (avoiding CO self-poisoning) and generating highly reactive OH species that facilitate CO oxidation [11]. However, the presence of SO2 in flue gases, even at low concentrations (tens of ppm), has been shown to cause serious deactivation of Pt-based catalysts in low-temperature conditions. The sulfur poisoning can be attributed to H2SO4-induced pore blockage and sulfation processes affecting both the catalyst support (e.g., TiO2, Al2O3) and the Pt active sites [2,12,13,14]. Therefore, it is meaningful to further enhance the sulfur resistance of Pt-based catalysts.
Among the Pt-based catalysts used for CO oxidation, modified Pt/TiO2 catalysts have received broad attention due to their superior sulfur resistance. The modification strategies explored in previous studies include modifying the TiO2 support with hydrophobic graphite and introducing WS2, WO3, MoO3, and CeO2 [15,16,17,18,19]. Notably, loading 0.1% CeO2 was found to significantly enhance the CO oxidation activity and SO2 resistance of the 0.1% Pt/TiO2 catalyst at temperatures as low as 160 °C, an effect attributed to increased adsorbed oxygen species and preferential binding with SO2 by CeO2 [19]. Introducing various rare earth oxides (LnOx, Ln = La, Ce, Nd, Sm and Dy) was shown to enhance the CO oxidation activity of the Pt/SiO2 catalyst as well [20]. These findings suggest that modifying Pt/TiO2 catalysts with rare earth oxides constitutes a promising strategy to simultaneously enhance the catalytic activity and sulfur resistance at low temperatures. To the best of our knowledge, no studies have investigated the effects of Eu2O3 loading on the performance of Pt-based catalysts used for CO oxidation, although introduction of Eu2O3 into Pt/CeO2 catalyst was proved to facilitate the oxidation of toluene [21].
The main objective of this study is to investigate the effects of Eu2O3 addition on the activity and SO2 resistance of the Pt/TiO2 catalyst for CO oxidation. A series of Pt-Eu2O3/TiO2 catalysts were prepared by a two-step impregnation method. The physiochemical characteristics of typical catalysts were investigated by the SEM, TEM, XRD, N2 adsorption, CO chemisorption, H2-TPR, XPS, NH3-TPD, SO2-TPD and H2O-TPD techniques to establish the catalyst structure–performance relationships. Additionally, in situ DRIFTS studies of the CO oxidation were conducted to elucidate the catalytic promotion mechanisms of Eu2O3.

2. Results and Discussion

2.1. Catalyst Activity and SO2 Resistance

As shown in Figure 1a, the Pt/TiO2 and Pt-Eu2O3/TiO2 catalysts exhibited characteristic S-type conversion profiles for CO oxidation over noble metal catalysts, which can be attributed to the rapid increase in the catalyst surface temperature owing to the release of a large amount of chemical heat after the ignition of CO oxidation [22]. The TiO2 and 2Eu2O3/TiO2 samples demonstrated negligible activity at the temperatures investigated (Figure 1a), indicating that Pt species are essential for catalytic CO oxidation. Introducing different contents of Eu2O3 all enhanced the catalytic activity of Pt/TiO2. As the Eu2O3 content increased, the catalytic activity first increased and then decreased, with the Pt-2Eu2O3/TiO2 catalyst exhibiting the highest activity. The lowest complete conversion temperature (T100) decreased from 140 °C for the Pt/TiO2 catalyst to 120 °C for the Pt-2Eu2O3/TiO2 catalyst. The TOF of the Pt-2Eu2O3/TiO2 catalyst was calculated as 0.13 s−1 at 100 °C, higher than most values reported in previous studies for Pt/TiO2-based catalysts (Table S1) [23,24,25,26,27]. This result identifies Eu2O3 as a promising modifier for enhancing catalytic activity. As shown in Table S1, the test temperatures of the SO2 resistance for the Pt/10EG-TiO2-10 [15], 0.1Pt-5WS2/TiO2-400 [16], 0.1Pt-5W/Ti-A [17], and 0.1Pt/3Mo/Ti [18] catalysts ranged from 220 to 300 °C, exceeding the typical flue gas temperatures and thus presenting challenges for industrial implementation. Although the Pt0.1%Ce0.1%/TiO2 [19], Pt/TiO2 [23], Pt/TiO2-Na [25], and Pt-0.125P&M/TiO2 [26] exhibited some SO2 resistance at temperatures below 200 °C, their CO conversion activities after sulfur poisoning remained lower than that of the Pt-2Eu2O3/TiO2 catalyst developed in this study.
Figure 1b shows the Arrhenius plots of the CO oxidation over the Pt/TiO2 and Pt-2Eu2O3/TiO2 catalysts. In the tested temperature range, the reaction rates on the Pt-2Eu2O3/TiO2 catalyst were higher than those observed on the Pt/TiO2 catalyst. Furthermore, the apparent activation energy (Ea) of the Pt-2Eu2O3/TiO2 catalyst was 36.2 kJ/mol, much lower than that of 49.2 kJ/mol for the Pt/TiO2 catalyst. These results demonstrate that the introduction of Eu2O3 increased the reaction rate and lowered the energy barrier for CO oxidation, which is likely attributable to the enhanced dispersion and elevated intrinsic activity of Pt species when Eu2O3 is present on the TiO2 support.
Figure 1c presents the CO oxidation performance under reaction gas containing 3% H2O. A comparison of Figure 1a,c reveals that the presence of 3% H2O significantly enhanced the CO oxidation over all the catalysts. The Pt-2Eu2O3/TiO2 catalyst still exhibited the highest activity under H2O-containing conditions, achieving a T100 value of 100 °C. Xu et al. [17] also reported a similar water-promoting effect for CO oxidation over the Pt-W/TiO2 catalyst.
Figure 1d illustrates the conversion of CO during the 72 h stability test in the presence of 50 ppm SO2 and 15% H2O at 200 °C. The CO conversion over the Pt/TiO2 catalyst showed a slightly fluctuating but generally declining trend, decreasing from an initial 100% to the final 77.8%. In contrast, the Pt-2Eu2O3/TiO2 catalyst maintained >99% CO conversion throughout the entire 72 h stability test. Obviously, the Pt-2Eu2O3/TiO2 catalyst exhibited superior SO2 resistance compared to the Pt/TiO2 catalyst.

2.2. SEM and TEM Results

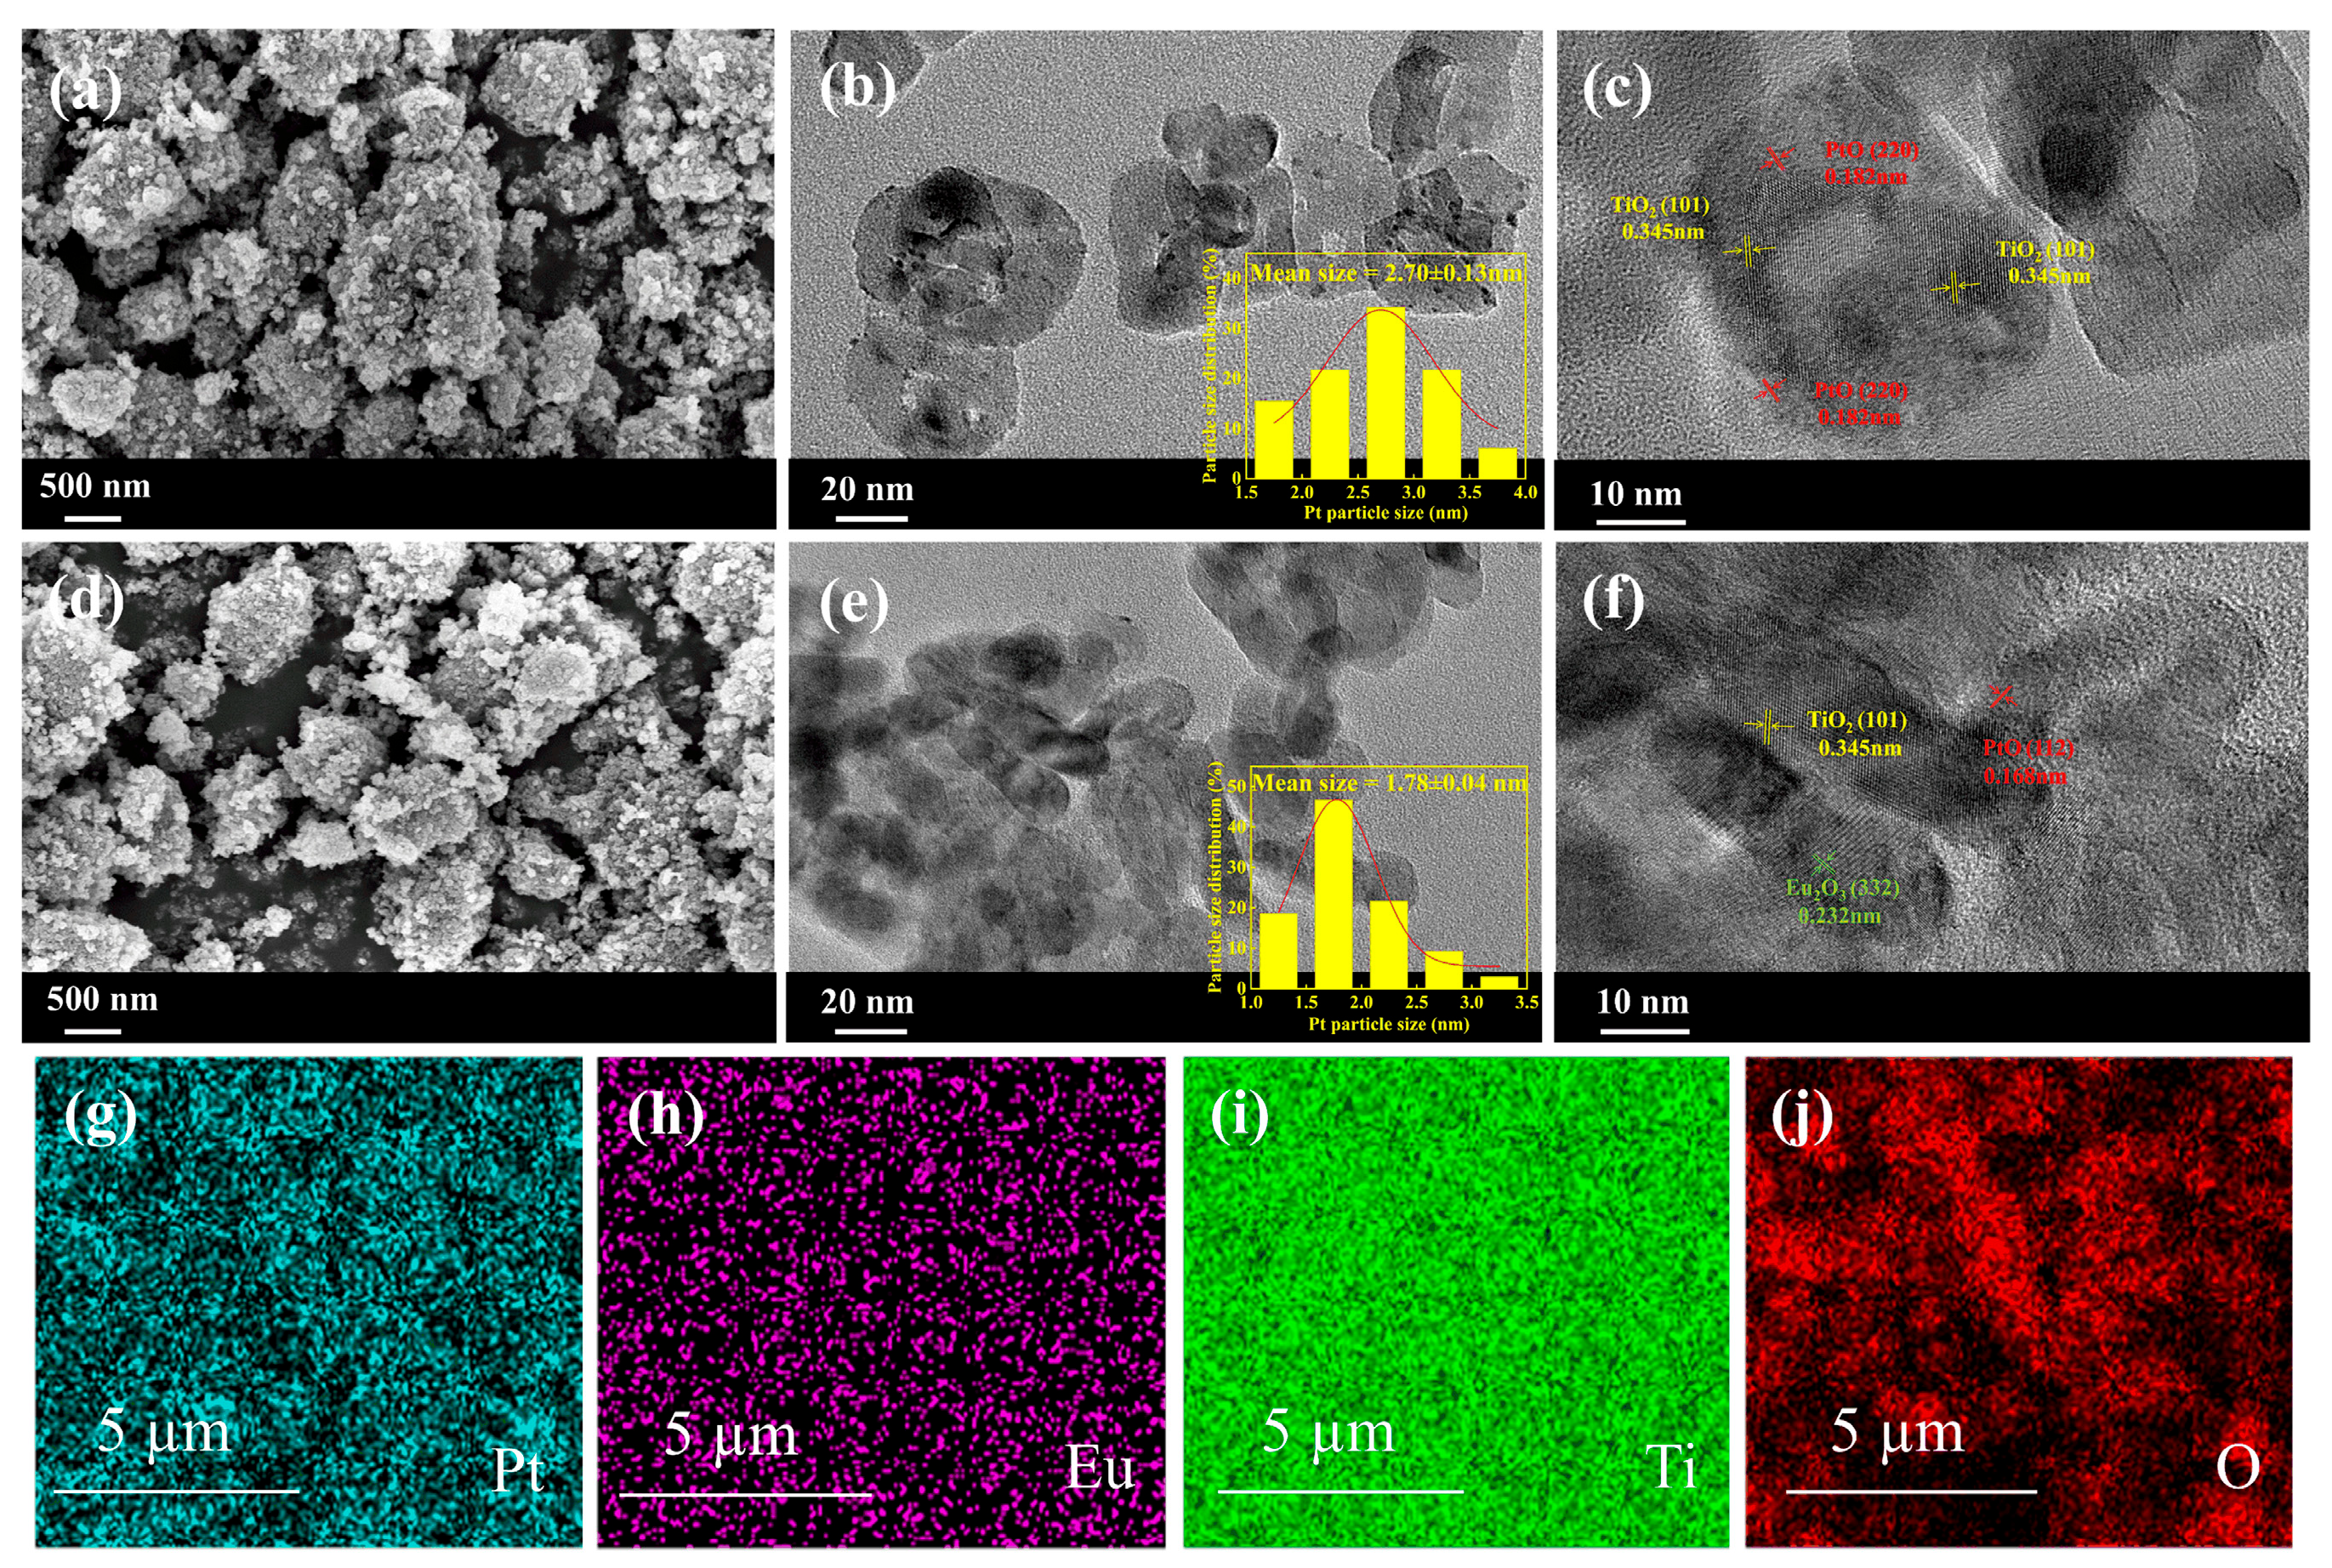
The SEM images in Figure 2a,d depict the Pt/TiO2 and Pt-2Eu2O3/TiO2 samples, respectively. It can be seen that the two samples have similar surface morphologies, characterized by particles of varying sizes and irregular shapes. Figure 2b,c,e,f are TEM images of the Pt/TiO2 and Pt-2Eu2O3/TiO2 samples, respectively. As shown in Figure 2b,e, the Pt nanoparticles exhibit uniform dispersion on both catalysts. The mean particle sizes were measured as 2.70 ± 0.13 nm and 1.78 ± 0.04 nm for Pt/TiO2 and Pt-2Eu2O3/TiO2, respectively, indicating that the Eu2O3 loading enhanced the dispersion of Pt.
High-resolution TEM analysis confirmed the lattice fringes of anatase TiO2 and PtO in the Pt/TiO2 catalyst (Figure 2c) and the additional Eu2O3 lattice fringes in the Pt-2Eu2O3/TiO2 catalyst (Figure 2f). SEM-EDS elemental maps of the Pt-2Eu2O3/TiO2 catalyst (Figure 2g–j) further confirmed that the Pt and Eu species were uniformly dispersed on the surface of TiO2.

2.3. XRD Results

The XRD patterns of the Pt/TiO2 and Pt-2Eu2O3/TiO2 samples are shown in Figure S2. Both samples exhibited XRD peaks at 2θ = 25.40°, 37.06°, 37.75°, 38.54°, 47.98°, 54.00°, 55.03°, 62.63°, 68.73°, 70.23°, 75.1°, and 76.1°, which are indexed to anatase TiO2 (PDF#21-1272) [28]. No diffraction peaks corresponding to Eu or Pt species were detected in either catalyst, which could be due to the low contents and/or highly dispersed states of Eu and Pt.

2.4. Specific Surface Area and Pore Structure Characteristics

Figure S3 shows the N2 adsorption–desorption isotherms and pore size distributions for the Pt/TiO2, Pt/TiO2-WS, Pt-2Eu2O3/TiO2, and Pt-2Eu2O3/TiO2-WS samples. All the samples presented type V isotherms according to the IUPAC classification (Figure S3a), characteristic of mesoporous structures [29]. As shown in Figure S3b, the pore size distributions span 2–50 nm across all the samples, with the average pore diameters being 21.7, 22.7, 22.2, and 23.9 nm for Pt/TiO2, Pt/TiO2-WS, Pt-2Eu2O3/TiO2, and Pt-2Eu2O3/TiO2-WS, respectively (Table 1). Notably, the average pore diameters of the Pt/TiO2 and Pt-2Eu2O3/TiO2 catalysts slightly increased following the 72 h SO2-resistance test.
Table 1 also lists the BET specific surface areas and pore volumes of the four samples. It can be seen that compared with Pt/TiO2, Pt-2Eu2O3/TiO2 has a slightly higher specific surface area and larger pore volume, providing more reaction surface and space [30]. After the 72 h SO2-resistance test, the specific surface area of Pt/TiO2 decreased marginally from 69.4 to 67.0 m2·g−1, while Pt-2Eu2O3/TiO2 showed a more pronounced decrease in specific surface area, from 72.1 to 61.4 m2·g−1, with a concurrent decrease in the pore volume from 0.41 to 0.38 cm3·g−1. These results might suggest the preferential deposition of sulfur species on the Eu2O3 surface.

2.5. CO Chemisorption Results

As shown in Table 1, the dispersion of Pt increased from 47.5% for the Pt/TiO2 catalyst to 53.5% for the Pt-2Eu2O3/TiO2 catalyst, which is consistent with the observed decrease in the average Pt particle size after introduction of Eu2O3 (Figure 2). This enhanced Pt dispersion on Pt-2Eu2O3/TiO2 may be attributed to the formation of Pt-O-Eu bonds. Nagai et al. [31] claimed that Pt-O-Ce bond formation in the Pt/Ce-Zr-Y catalyst suppressed the migration of Pt nanoparticles, thereby enhancing the Pt dispersion. The enhanced Pt dispersion indicates increased availability of Pt active sites, which could partially explain the higher CO oxidation activity of Pt-2Eu2O3/TiO2 compared to Pt/TiO2 (Figure 1).

2.6. H2-TPR Results

Figure 3 displays the H2-TPR profiles of the Pt/TiO2 and Pt-xEu2O3/TiO2 catalysts. All the samples exhibit a minor H2 consumption peak at 50–125 °C (peak I) corresponding to the reduction of PtOx and Eu2O3 species and a prominent peak around 300 °C (peak II) due to the reduction of TiO2 by hydrogen spillover from the Pt sites [26,32,33]. As the Eu2O3 content increased, the peak temperature of peak I first decreased and then increased, reaching a minimum of 79.8 °C for Pt-2Eu2O3/TiO2. This indicates the best reducibility of PtOx and Eu2O3 species in Pt-2Eu2O3/TiO2, explaining its superior CO oxidation activity (Figure 1a). The enhanced reducibility of Pt-2Eu2O3/TiO2 is likely due to the formation of Pt-O-Eu bonds, which facilitates the electron transfer from Eu to Pt due to the lower electronegativity of Eu (compared to Pt) [34].
The reduction peak II shifted to a higher temperature range with increasing Eu2O3 content, indicating that strong Pt-Eu interactions impede hydrogen spillover from Pt to TiO2, thereby elevating the reduction temperatures of the surface TiO2. Table 2 lists the H2 consumption amounts of different catalysts. It can be observed that as the Eu2O3 content increased, the H2 consumption at low temperature (peak I) increased due to the increased H2 consumption by more Eu2O3. Meanwhile, the H2 consumption at high temperature (peak II) notably decreased after introducing Eu2O3, but the Eu2O3 content did not largely affect the H2 consumption amount, suggesting that the hindering effects of Pt–Eu interactions on the reduction of TiO2 did not enhance with increasing Eu2O3 loadings.

2.7. Surface Element Valences

2.7.1. XPS Results

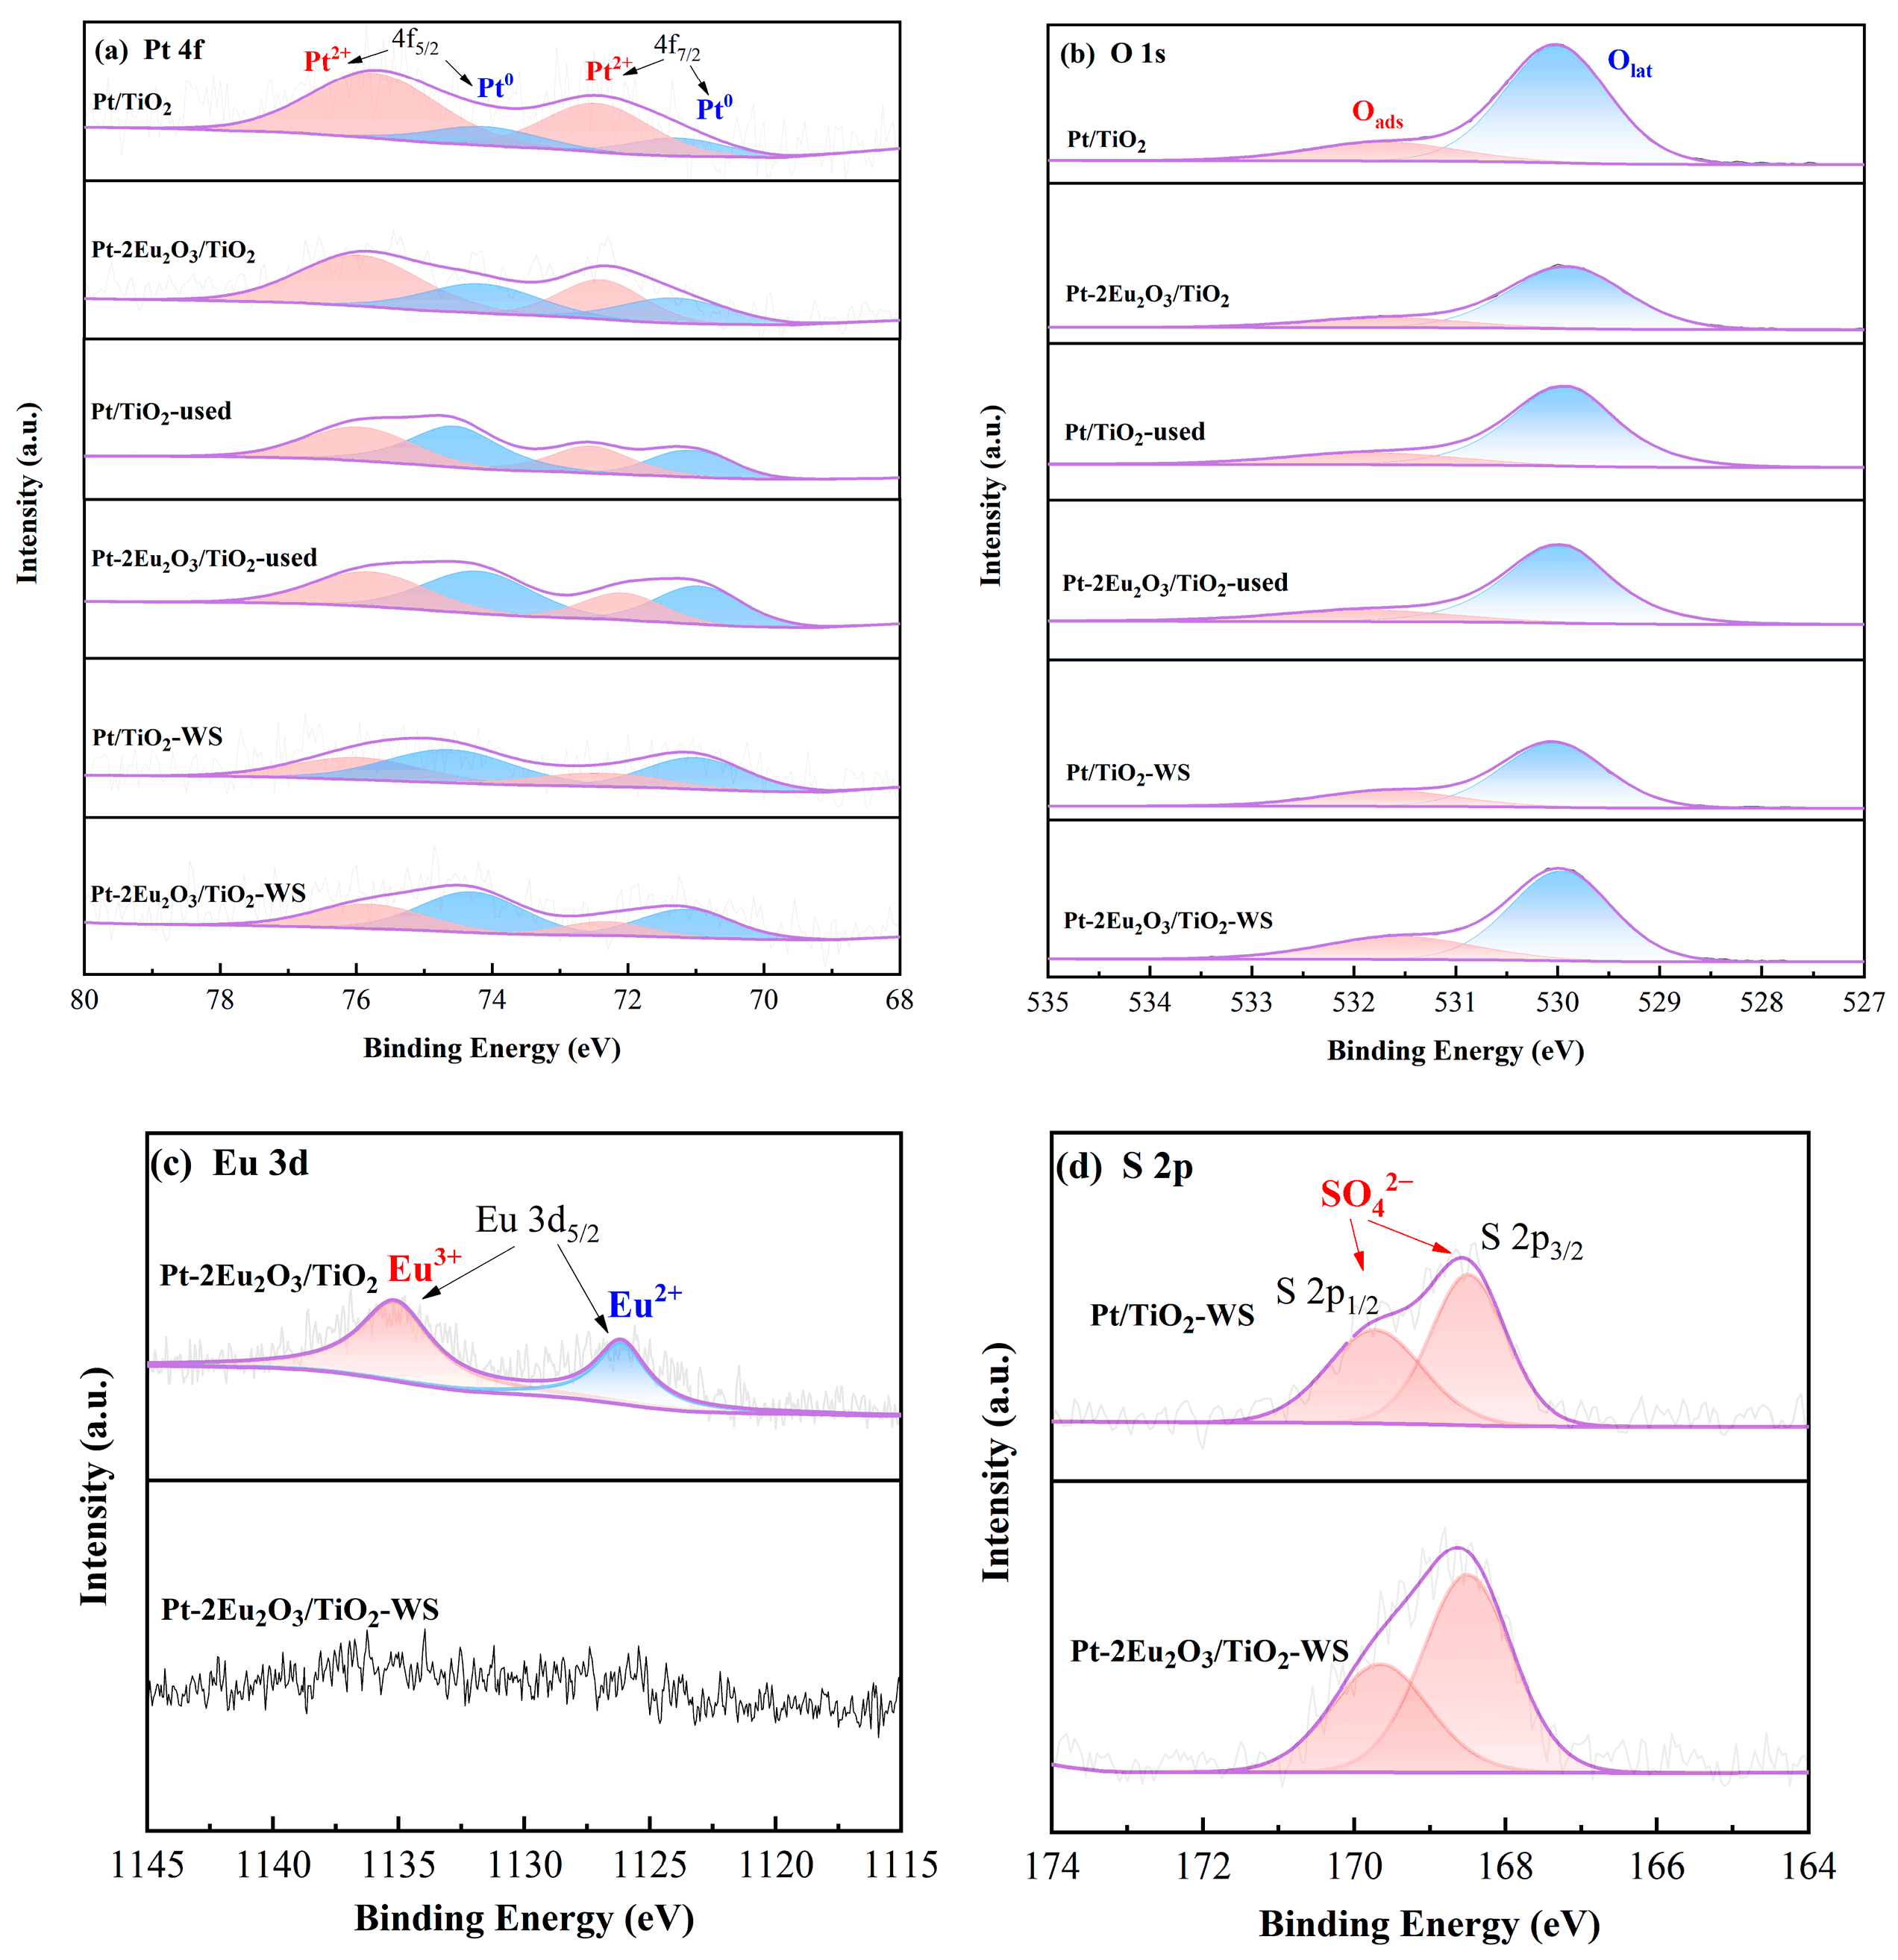
Figure 4a presents the Pt 4f XPS spectra of the six samples. The characteristic peaks observed at binding energies of around 75.7 and 72.4 eV are attributed to surface Pt2+ species [23], while those at 74.2 and 71.3 eV correspond to surface Pt0 species [35]. The proportion of Pt0 (Pt0/(Pt0 + Pt2+)) was determined by integrating the areas under these peaks, with the results listed in Table 3. It can be seen that the proportion of Pt0 was 20.0% and 38.7% on the surface of Pt/TiO2 and Pt-2Eu2O3/TiO2, respectively. These findings confirm that Pt2+ species predominate on both catalysts, with Eu2O3 addition promoting the formation of Pt0. As previously reported, Pt0 has higher catalytic activity for CO oxidation compared to PtOx species [36]. The elevated Pt0 proportion on the Pt-2Eu2O3/TiO2 catalyst could explain its higher activity compared to Pt/TiO2 (Figure 1a). The electron transfer from Eu to Pt via the Pt-O-Eu bonds may explain the enhanced formation of Pt0 on the Pt-2Eu2O3/TiO2 catalyst, which also accounts for the aforementioned weakened Pt-O bonds in the catalyst.
Furthermore, as shown in Table 3, the Pt0 proportion increased to 52.0% and 56.5% for the Pt/TiO2-used and Pt-2Eu2O3/TiO2-used catalysts, respectively, which is primarily attributed to the reduction of PtOx by CO during the catalytic reaction. After the 72 h SO2-resistance test, the Pt0 proportion showed a further increase to 62.3% and 63.3% for the Pt/TiO2-WS and Pt-2Eu2O3/TiO2-WS catalysts, respectively.
Figure 4b shows the O 1s spectra of the six samples, which were divided into two peaks. The main peak around 529.9 eV is assigned to the lattice oxygen (denoted as Olat) on the catalyst surface, while the broad peak around 531.6 eV corresponds to the surface adsorbed oxygen and hydroxyl oxygen (denoted as Oads) [25]. These surface Oads play a significant role in the catalytic oxidation of CO [37,38]. The proportion of Oads (Oads/(Olat + Oads)) was calculated to be 18.7% and 18.0% for the fresh Pt/TiO2 and Pt-2Eu2O3/TiO2 catalysts, respectively, and it increased to 22.1% and 22.2% for the Pt/TiO2-used and Pt-2Eu2O3/TiO2-used catalysts, respectively (Table 3). This enhancement in terms of the Oads proportion can be attributed to the replenishment of oxygen vacancies by molecular oxygen during the CO oxidation process, leading to an increased concentration of adsorbed oxygen species. After the SO2-resistance test, the Oads/(Olat + Oads) ratios showed a further increase to 24.5% and 27.6% for the Pt/TiO2-WS and Pt-2Eu2O3/TiO2-WS catalysts, respectively, which can be attributed to the accumulation of surface OH* generated from the dissociation of H2O during the reaction process [39]. Moreover, the Pt-2Eu2O3/TiO2-WS sample displayed the highest Oads/(Olat + Oads) ratio (27.6%), suggesting that Eu2O3 addition enhanced the dissociation of H2O under reaction conditions.
Figure 4c presents the Eu 3d XPS spectra of the Pt-2Eu2O3/TiO2 and Pt-2Eu2O3/TiO2-WS samples. Obviously, there are two different Eu valence states in the Pt-2Eu2O3/TiO2 catalyst, namely Eu2+ at 1126.1 eV and Eu3+ at 1135.3 eV [40,41,42]. The proportion of Eu3+ (Eu3+/(Eu3+ + Eu2+)) was determined to be 59.5%, indicating a predominant presence of Eu3+ (Eu2O3) over Eu2+ (EuO) in the as-prepared catalyst. After the SO2-resistance test, the Eu 3d XPS signals became indistinguishable (Figure 4c), probably due to the deposition of sulfur-containing species on the Eu2O3 domains.
The S 2p XPS spectra of the Pt/TiO2-WS and Pt-2Eu2O3/TiO2-WS catalysts are shown in Figure 4d. The peaks at 168.5 eV (S 2p3/2) and 169.7 eV (S 2p1/2) are attributed to sulfate species (SO42−) [17]. Obviously, sulfur accumulated on both catalysts after the SO2-resistance tests, mainly in the form of sulfates. However, the deposition sites of these sulfates probably differ between the two catalysts, as evidenced by the distinct changes in the Eu 3d XPS signals. Specifically, sulfates primarily occupied the Pt sites on the Pt/TiO2 catalyst, whereas they preferentially deposited on the Eu sites on the Pt-2Eu2O3/TiO2 catalyst.

2.7.2. In Situ DRIFTS Results of CO Adsorption

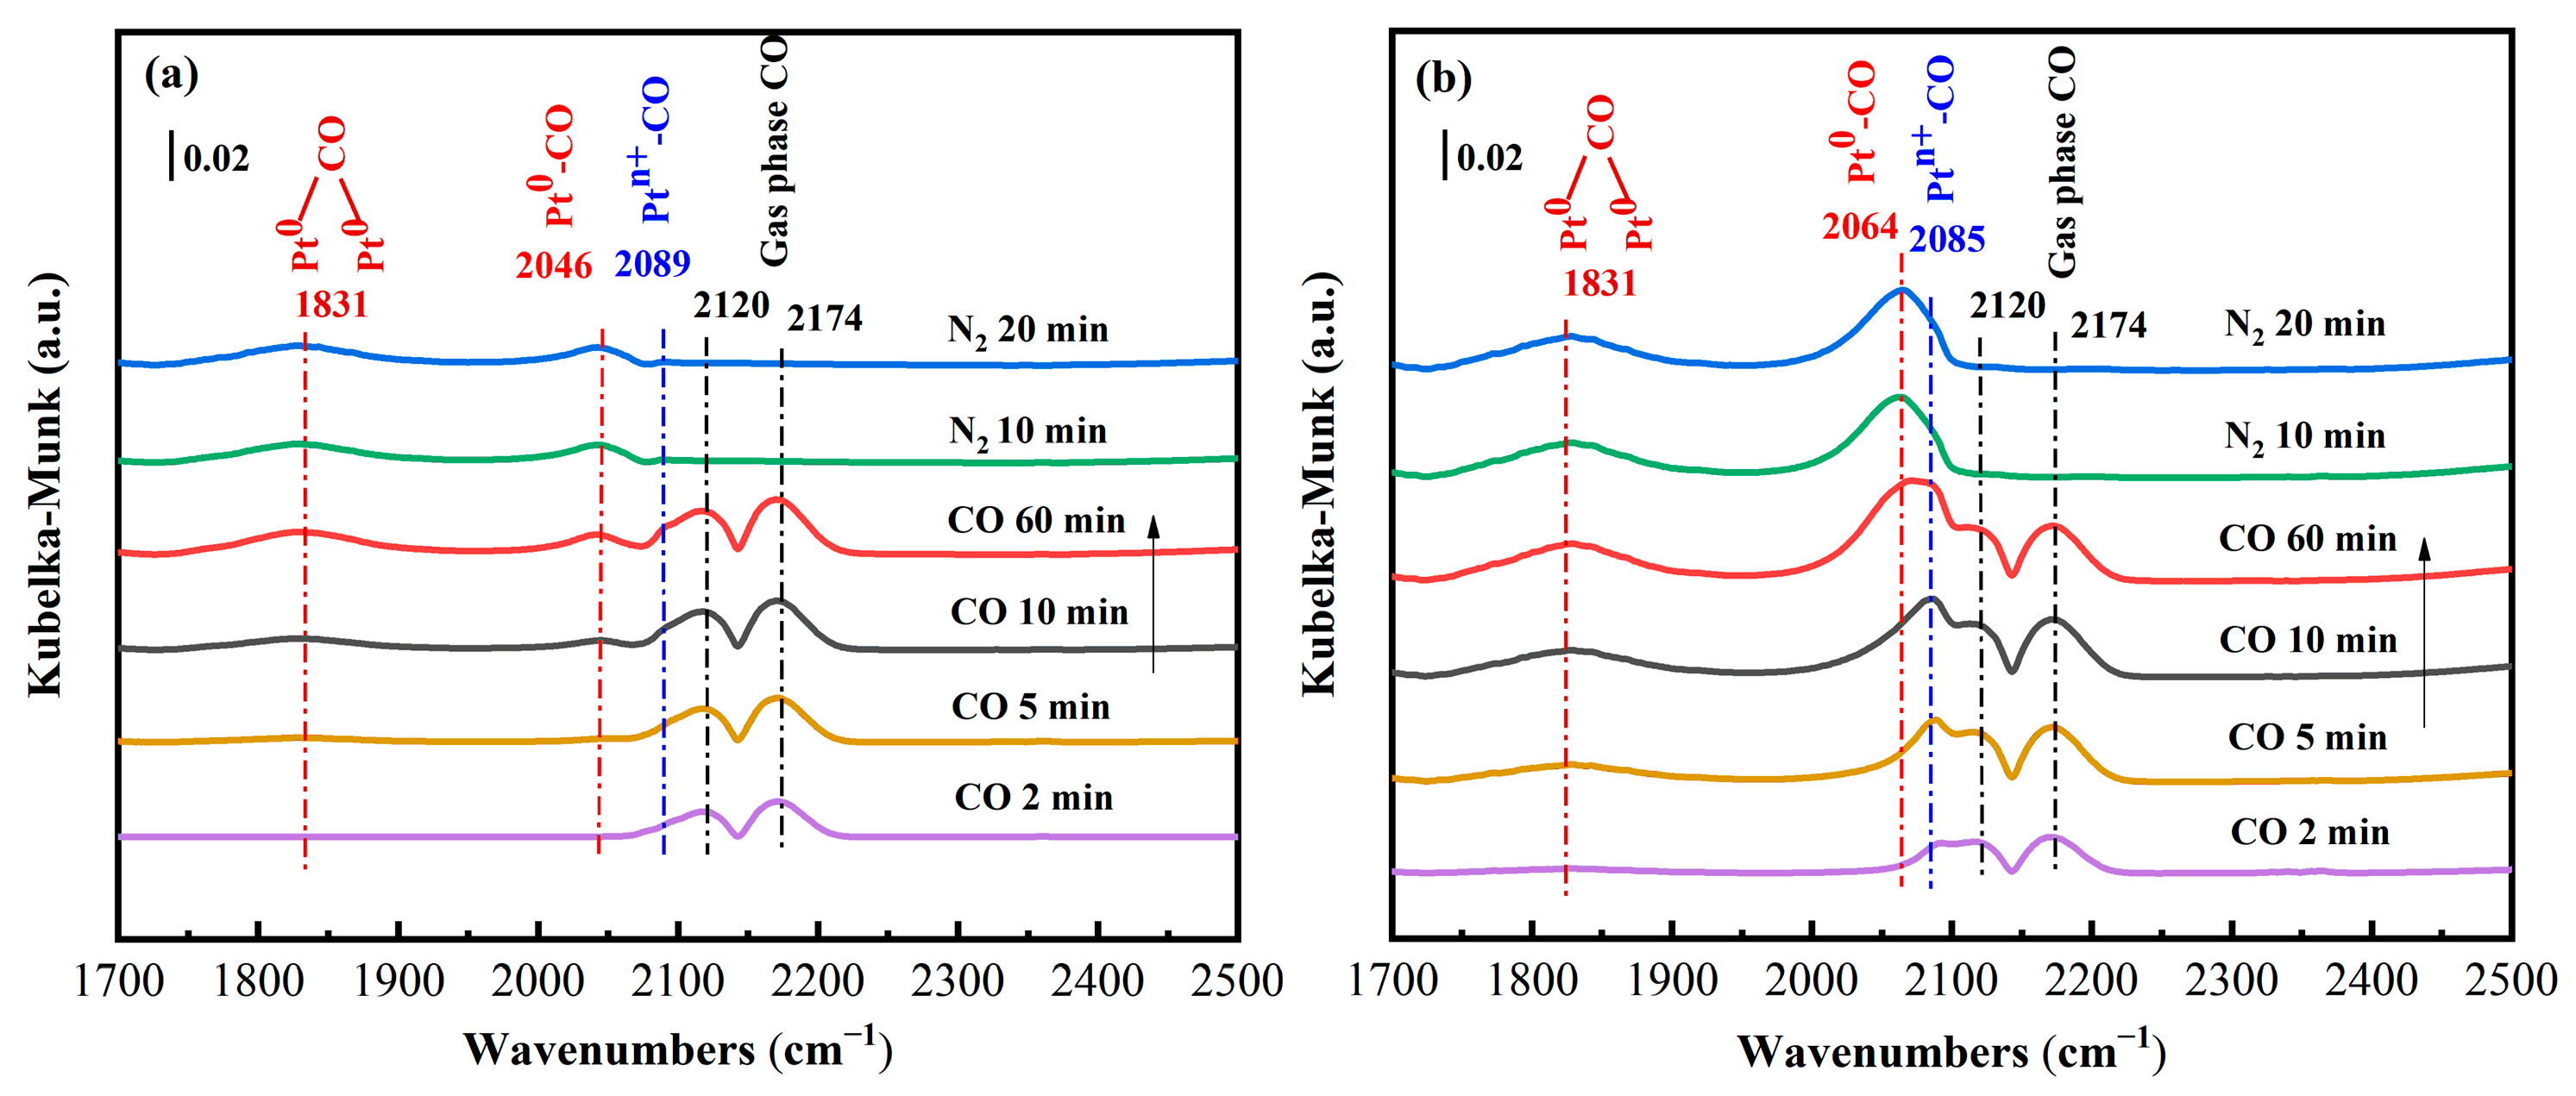
Figure 5a shows that characteristic bands appeared at 2174, 2120, 2089, 2046 and 1831 cm−1 during CO adsorption on the Pt/TiO2 catalyst at 25 °C. The peaks at 2174 cm−1 and 2120 cm−1 were assigned to gaseous CO [43]. The peak at 2089 cm−1 was assigned to CO linearly adsorbed on the Ptn+ (1 < n<2) sites. The peaks at 2046 cm−1 and 1831 cm−1 were attributed to CO coordinated in a linear and a bridging manner on the Pt0 sites, respectively [38,39,44]. After the N2 purge, the peaks for the CO adsorbed on the Pt0 sites remained unchanged, while those for the gaseous CO and CO adsorbed on the Ptn+ sites disappeared, which confirms the strong adsorption of CO on the Pt0 sites and the weak adsorption on the Ptn+ sites [44].
Figure 5b shows characteristic bands at similar positions (2174, 2120, 2085, 2064 and 1831 cm−1) for CO adsorption on the Pt-2Eu2O3/TiO2 catalyst. It is also similar that the peaks for the gaseous CO and CO adsorbed on the Ptn+ sites vanished after the N2 purge, whereas the peaks corresponding to the CO adsorbed on the Pt0 sites remained unchanged. Despite these similarities, a comparison of the CO adsorption spectra acquired after 60 min reveals significantly enhanced CO adsorption on the Pt-2Eu2O3/TiO2 catalyst. This observation aligns with the finding that Eu2O3 addition promotes the dispersion of Pt.

2.8. Catalyst Acidity and Basicity

2.8.1. NH3-TPD Results

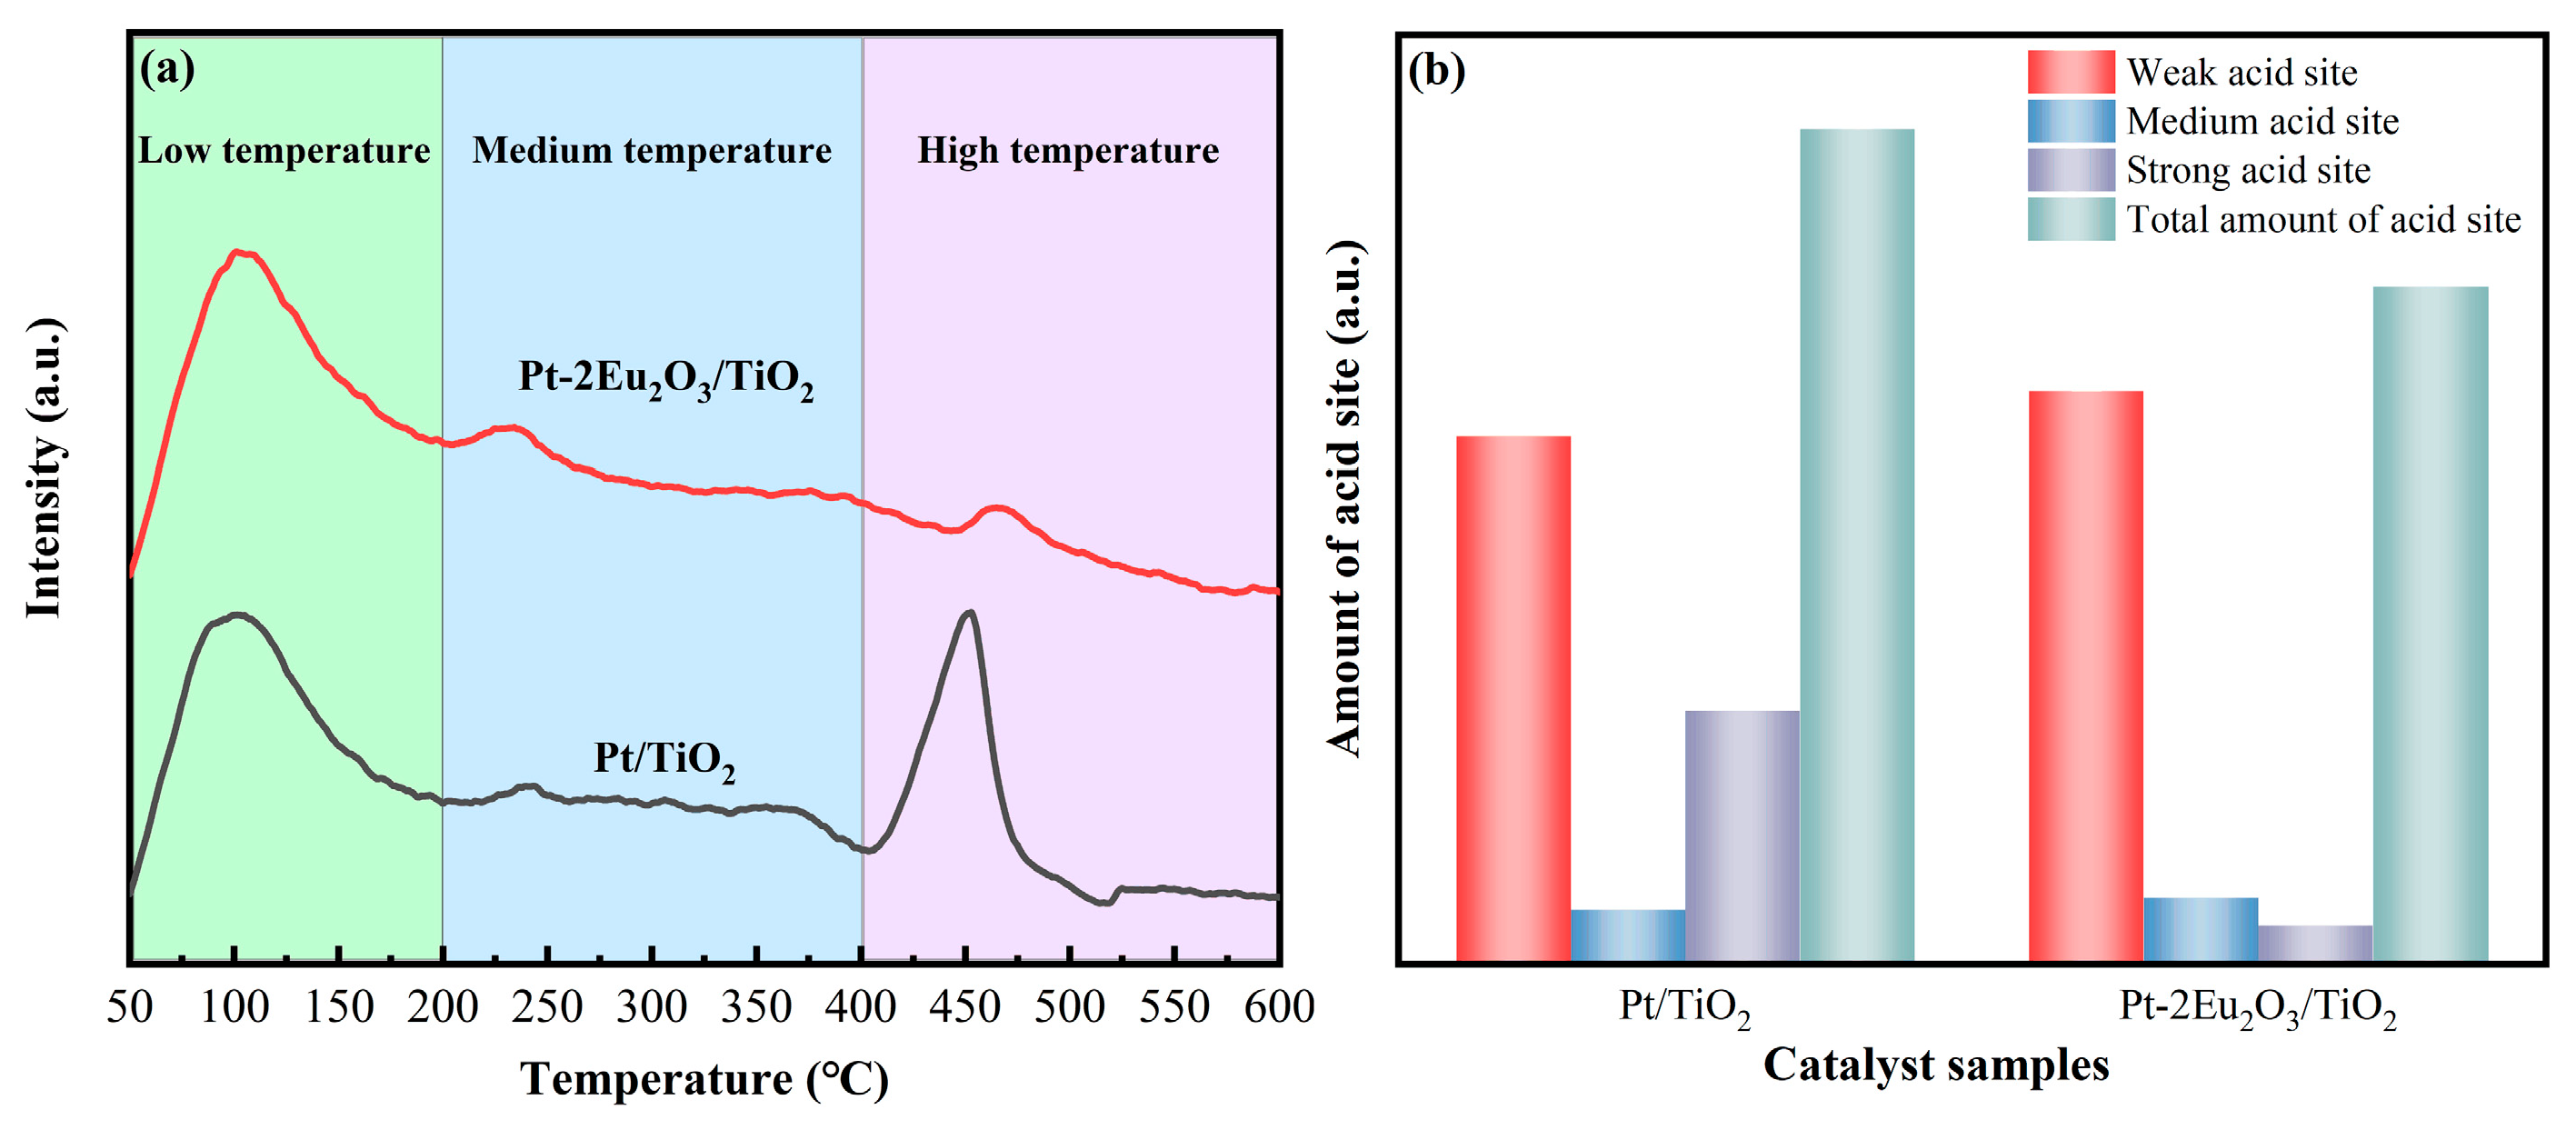
NH3-TPD was conducted to titrate the acidity of the Pt/TiO2 and Pt-2Eu2O3/TiO2 catalysts. As shown in Figure 6a, both catalysts have NH3 desorption peaks at low (<200 °C), medium (200–400 °C) and high temperatures (>400 °C), which correspond to weak, medium, and strong acid sites, respectively. Figure 6b compares the number of acid sites of different strengths as well as the total number of acid sites on the two catalysts, which were calculated based on the peak areas. It can be seen that the number of strong acid sites significantly decreased after introducing Eu2O3, leading to the lower total acidity of the Pt-2Eu2O3/TiO2 catalyst compared to Pt/TiO2. Notably, the decrease in strong acidity with the introduction of Eu2O3 did not compromise the catalyst’s SO2 resistance.

2.8.2. SO2-TPD Results

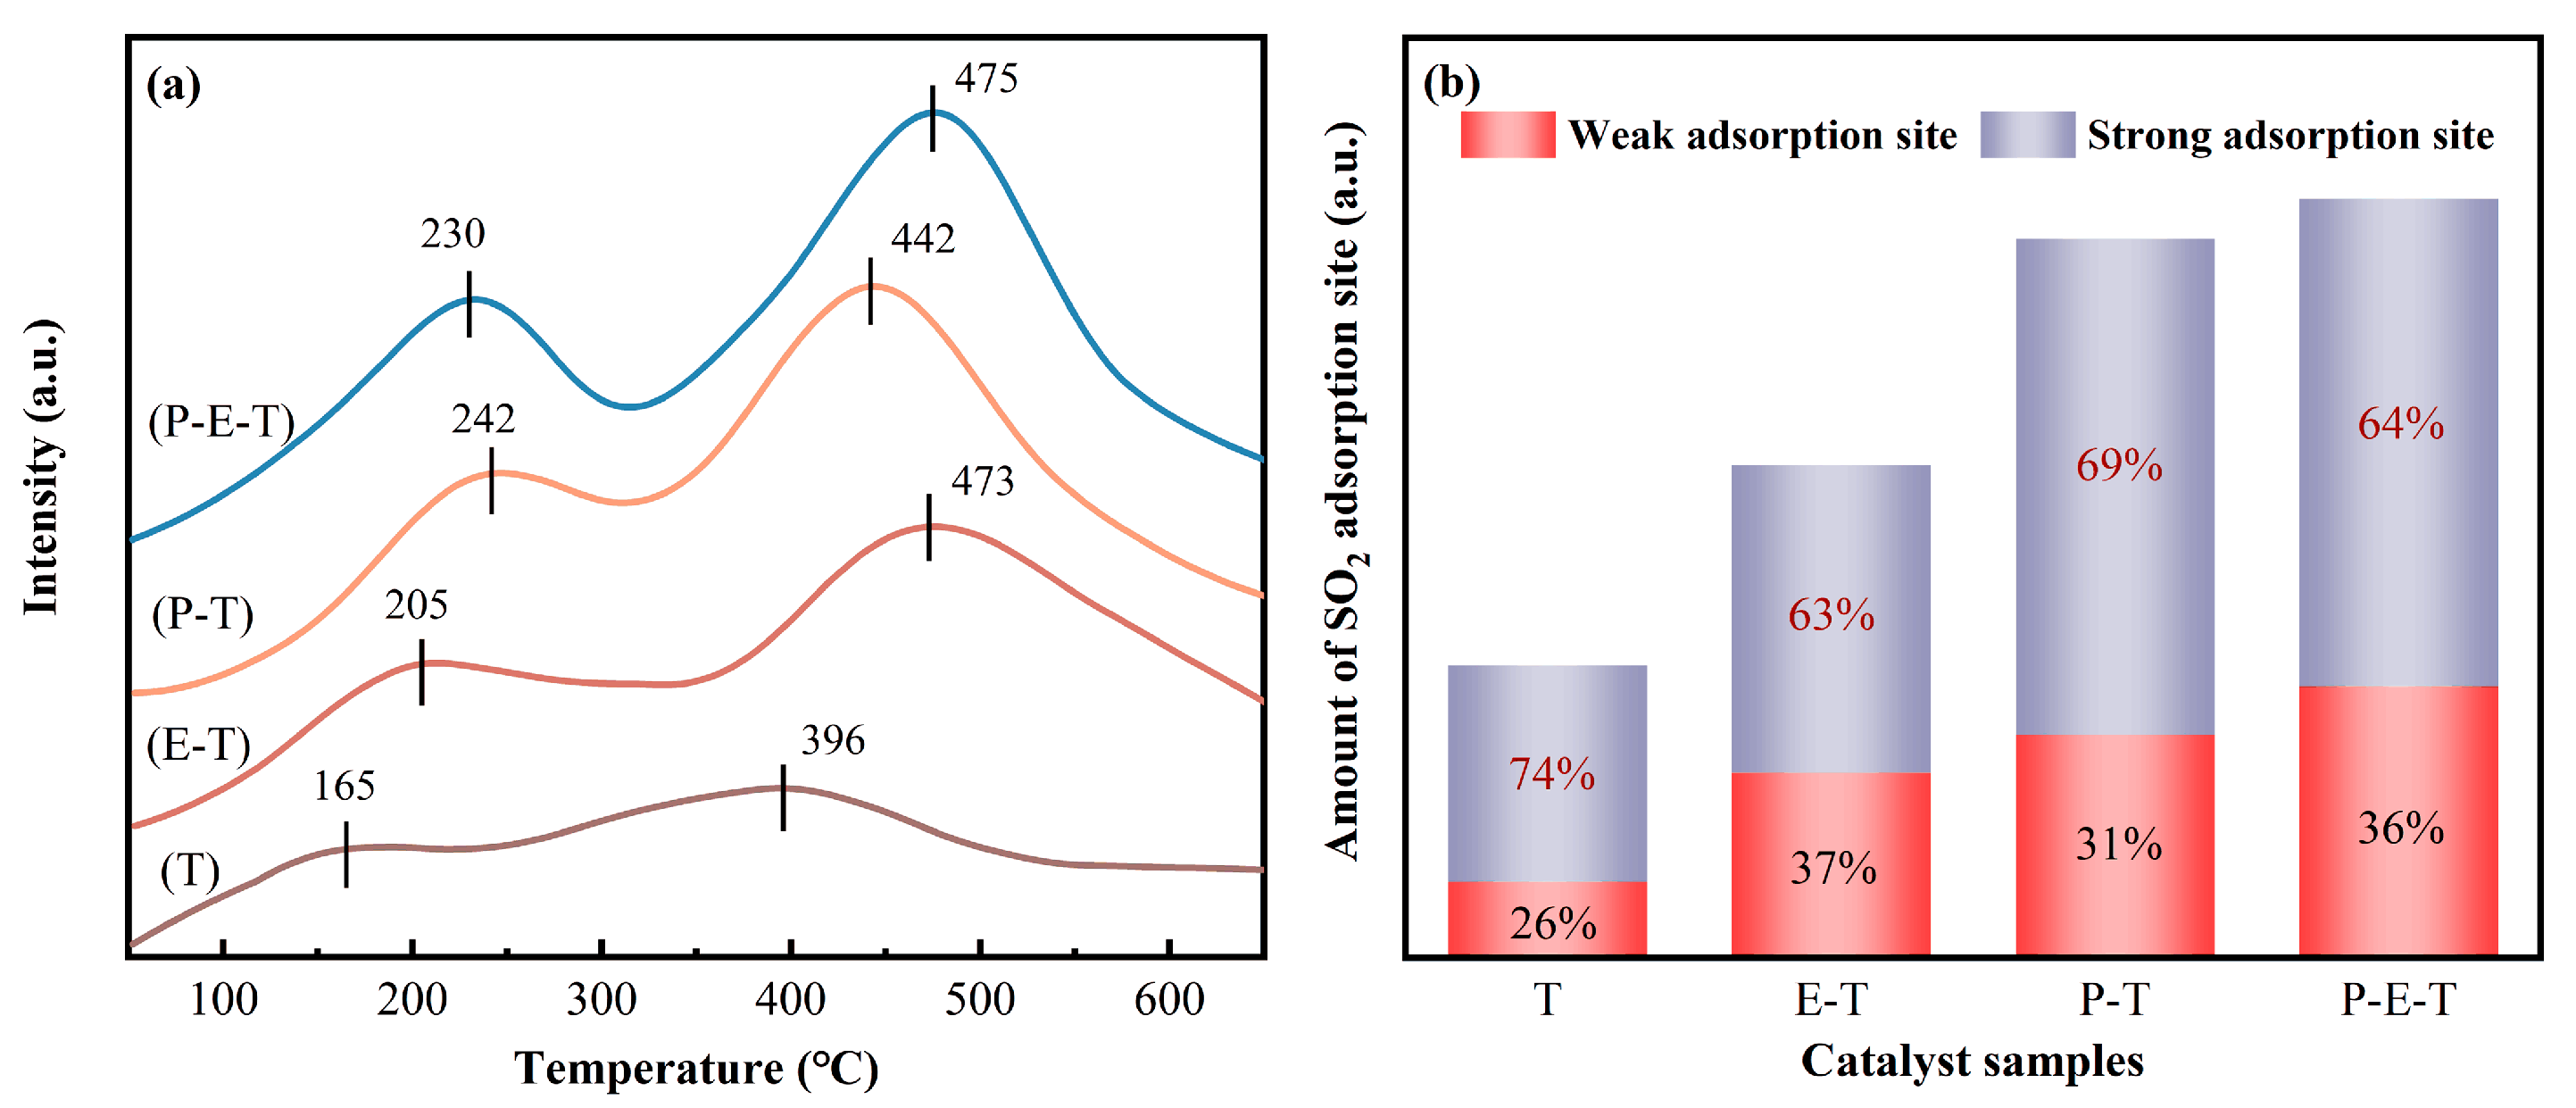
To better understand the different SO2 resistance of the Pt/TiO2 and Pt-2Eu2O3/TiO2 catalysts, SO2-TPD analysis of TiO2, 2Eu2O3/TiO2, Pt/TiO2, and Pt-2Eu2O3/TiO2 was performed. As shown in Figure 7a, two SO2 desorption peaks, one at temperatures lower than 300 °C and the other at higher temperatures, were observed for all the investigated samples, corresponding to weak and strong adsorption sites for SO2, respectively. Compared to TiO2, the desorption peaks became larger and shifted to higher temperature ranges after loading Eu2O3 and/or Pt species, indicating that Eu2O3 and Pt species have stronger affinity for SO2 than the TiO2 support.
For the weakly adsorbed SO2, the desorption temperature decreased in the order of Pt/TiO2 (242 °C) > Pt-2Eu2O3/TiO2 (230 °C) > 2Eu2O3/TiO2 (205 °C) (Figure 7a). Obviously, in the low-temperature region, Pt species exhibited stronger SO2 adsorption affinity than Eu2O3. The presence of Eu2O3 led to the lower SO2 desorption temperature for Pt-2Eu2O3/TiO2 compared to Pt/TiO2. For the strongly adsorbed SO2, the desorption temperature followed the order of Pt-2Eu2O3/TiO2 (475 °C) ≈ 2Eu2O3/TiO2 (473 °C) > Pt/TiO2 (442 °C) (Figure 7a). Notably, in the high-temperature region, SO2 exhibited stronger adsorption on Eu2O3 than on Pt species. Eu2O3 acted as the primary sites for strong SO2 adsorption on the Pt-2Eu2O3/TiO2 catalyst, thereby explaining the observed disappearance of the Eu XPS signals in Pt-2Eu2O3/TiO2-WS (Figure 4c).
Figure 7b compares the numbers of weak, strong, and total SO2 adsorption sites calculated based on the peak areas. It can be seen that loading Eu2O3 and/or Pt on TiO2 increased the SO2 adsorption at both weak and strong sites. The total adsorbed amount of SO2 decreased in the order of Pt-2Eu2O3/TiO2 > Pt/TiO2 > 2Eu2O3/TiO2 > TiO2 (Figure 7b). Compared to Pt/TiO2, only slightly higher amounts of SO2 were adsorbed on Pt-2Eu2O3/TiO2, due to the slight increase in the number of weak adsorption sites for SO2.
Overall, the Eu2O3 in Pt-2Eu2O3/TiO2 contributed to the increased adsorption sites for weakly adsorbed SO2 while lowering its desorption temperature, and the Eu2O3 functioned as strong SO2 adsorption sites, thereby protecting the Pt species. These synergistic effects provide a plausible explanation for the enhanced SO2 resistance of Pt-2Eu2O3/TiO2 compared to Pt/TiO2 (Figure 1d).

2.9. H2O-TPD Results

The H2O adsorption–desorption behaviors of the Pt/TiO2 and Pt-2Eu2O3/TiO2 catalysts were investigated using the H2O-TPD. As shown in Figure 8a, both samples displayed several H2O desorption peaks, which were classified into three types (I, II, and III). The peaks appearing below 150 °C (type I) were attributed to H2O physically adsorbed on the catalyst surface [45]. The peaks at 231/236 °C (type II) and 402/406 °C (type III) corresponded to hydroxyl species formed via the dissociative adsorption of H2O and structural hydroxides, respectively [46,47]. Notably, the loading of Eu2O3 significantly increased the desorption temperature of type I H2O, indicating stronger physisorption of H2O on Pt-2Eu2O3/TiO2 than on Pt/TiO2. In contrast, both surface hydroxyl species (type II H2O) and structural hydroxides (type III H2O) desorbed at similar temperatures for the two catalysts.
Figure 8b compares the desorbed amount of H2O calculated based on the peak areas. It can be seen that introducing Eu2O3 increased the desorbed amounts of all the types of H2O, indicating that Eu2O3 enhanced the physisorption of H2O, the dissociation of H2O into hydroxyl groups, and the formation of structural hydroxides. These finding might be explained by the hygroscopic nature of Eu2O3 [48], resulting in the much higher CO oxidation activity of Pt-2Eu2O3/TiO2 than Pt/TiO2 in the presence of H2O (Figure 1c).

2.10. In Situ DRIFTS Results of CO Oxidation

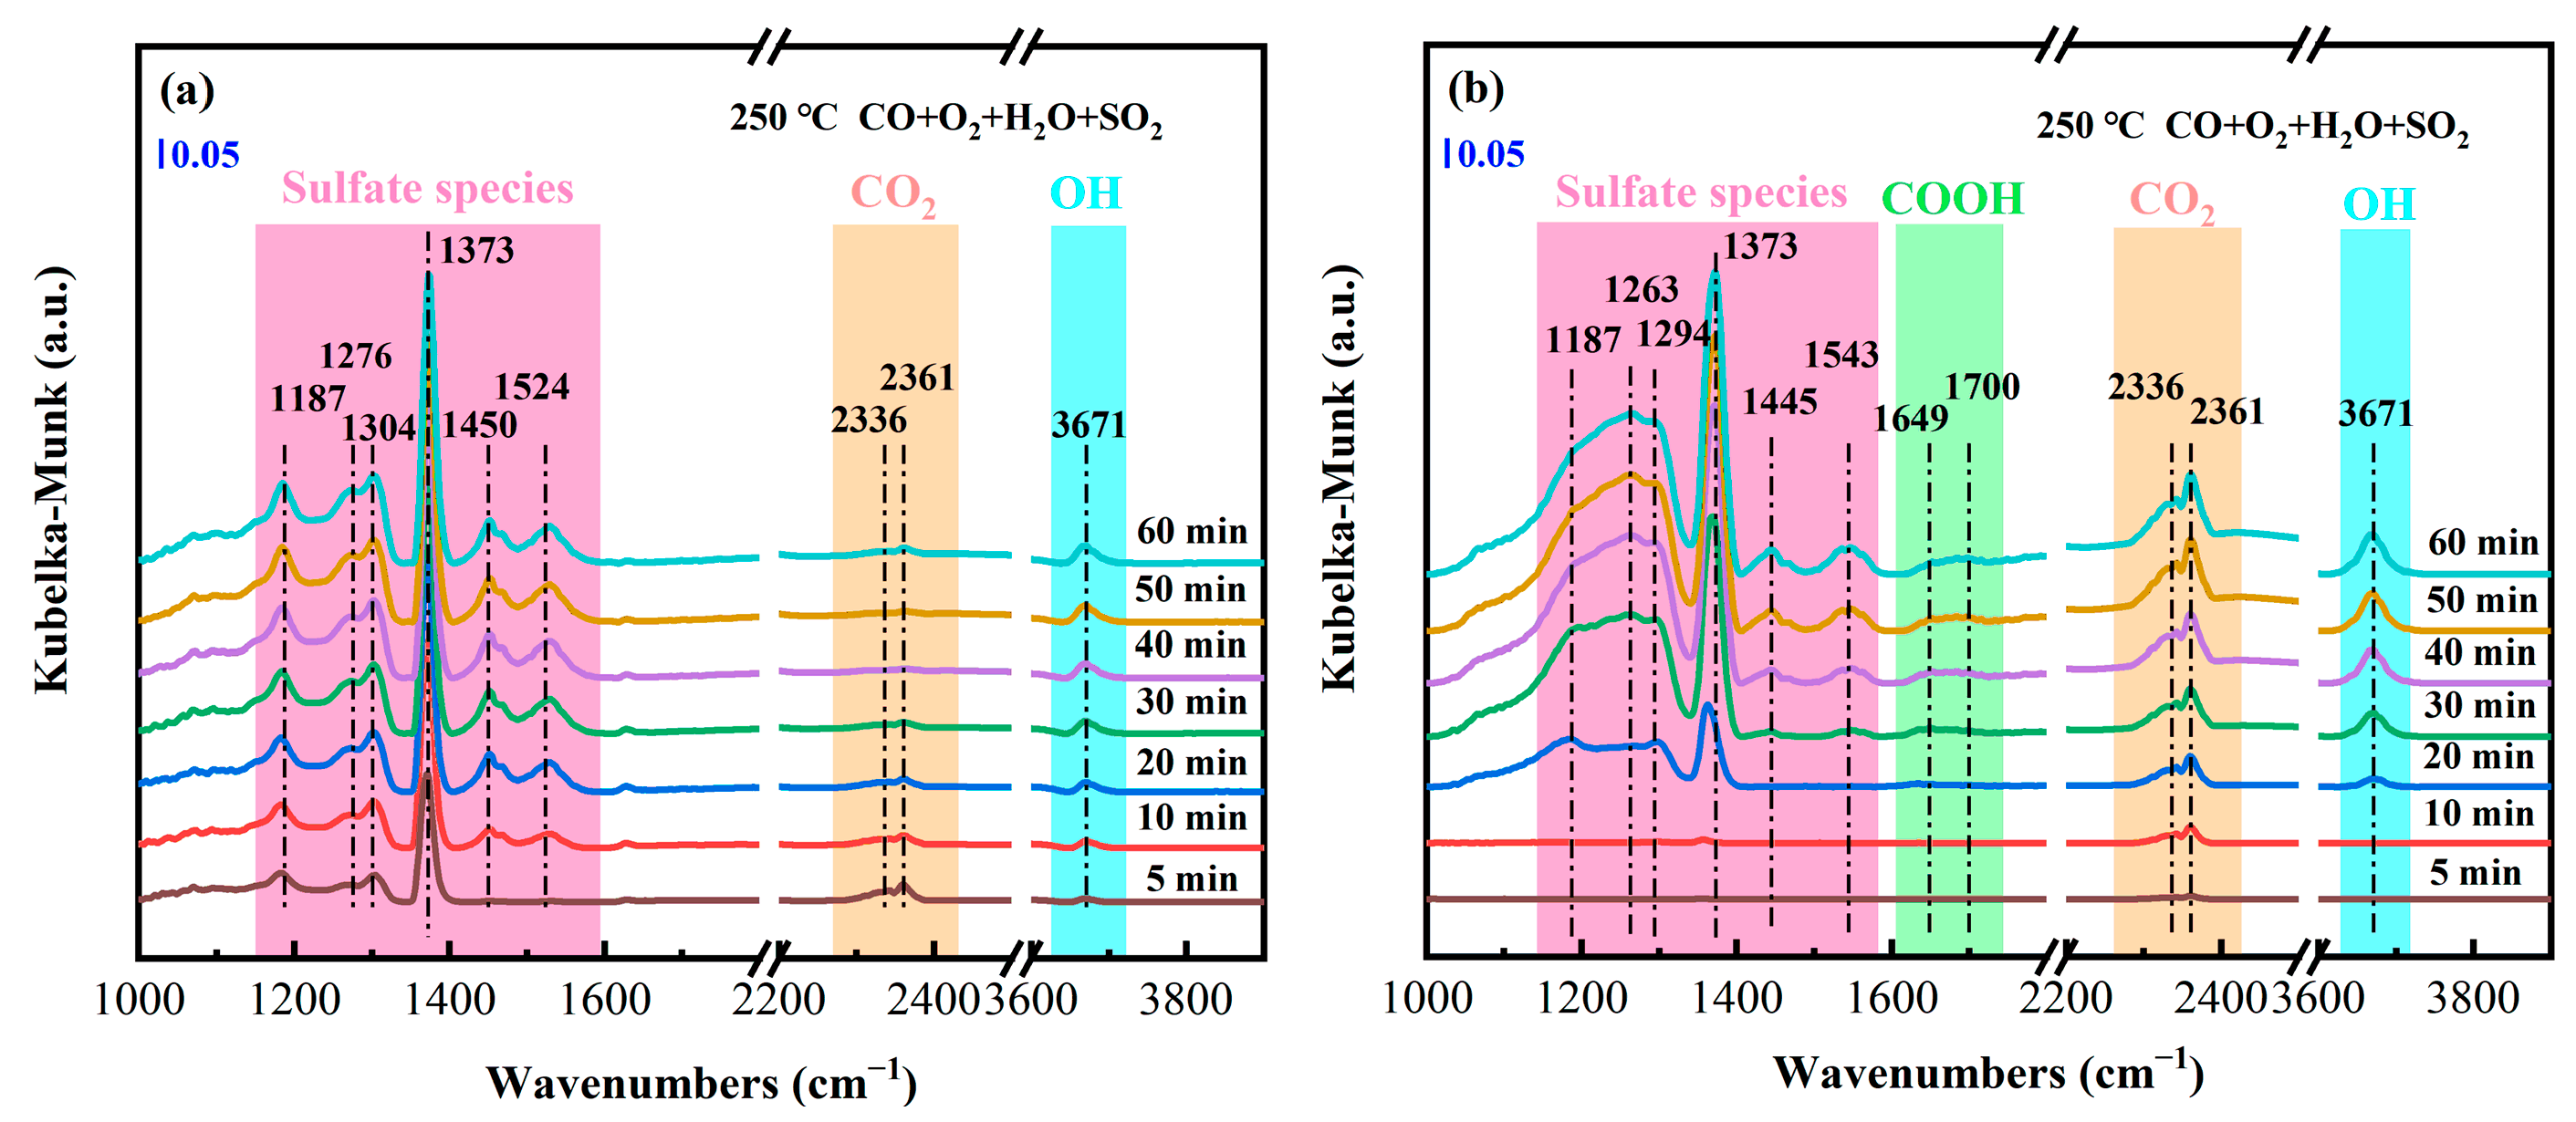
To further elucidate the influence mechanisms of SO2 and H2O on the oxidation of CO, the in situ DRIFTS spectra of CO oxidation in the presence SO2 and H2O were recorded at 250 °C, as shown in Figure 9. Figure 9a shows that characteristic peaks appeared at 3671, 2361, 2336, 1524, 1450, 1373, 1304, 1276 and 1187 cm−1 during CO oxidation on the Pt/TiO2 catalyst. The peak at 3671 cm−1 is assigned to bridge-bonding OH, which originates from the dissociation of H2O on the oxygen vacancies [49]. The peaks at 2361 and 2336 cm−1 correspond to gas phase CO2 [39]. The peaks at 1524, 1450, 1373, 1304, 1276 and 1187 cm−1 are related to sulfur-containing compounds. Specifically, the peak at 1524 cm−1 is attributed to the stretching vibration of HSO4. The peaks at 1450, 1373 and 1304 cm−1 correspond to surface sulfate species [50,51,52]. The peak at 1276 cm−1 is ascribed to the stretching vibration of the bridging bidentate sulfate species [15]. The peak at 1187 cm−1 is assigned to the stretching vibration of bulk sulfate species [51].
As the reaction time extended, the peaks correlated with sulfate and OH* species increased in intensity (Figure 9a), indicating that these species accumulated on the Pt/TiO2 catalyst’s surface. The accumulation of sulfate species led to the gradual deactivation of the catalyst, explaining the weakening of the CO2 peaks observed during the oxidation of CO on the Pt/TiO2 catalyst (Figure 9a).
Figure 9b shows that, in addition to the characteristic peaks corresponding to sulfate species, OH* species, and CO2, new peaks attributable to adsorbed COOH* species were observed at 1700 and 1649 cm−1 during CO oxidation on the Pt-2Eu2O3/TiO2 catalyst [53]. The intensity of all the peaks increased progressively with the reaction time, and the OH* peak (3671 cm−1) exhibited a significant higher intensity on Pt-2Eu2O3/TiO2 than on Pt/TiO2. This observation indicates that H2O dissociation into OH* species is more favorable on the Pt-2Eu2O3/TiO2 surface, which aligns with the XPS and H2O-TPD results.
The enhanced generation of OH* species, the detection of COOH* species, and the promoted production of CO2 on the Pt-2Eu2O3/TiO2 catalyst collectively suggest that Eu2O3 facilitates water dissociation, thereby promoting CO oxidation via forming COOH* as a key reaction intermediate. Notably, more sulfate species were accumulated on the Pt-2Eu2O3/TiO2 surface compared to Pt/TiO2, which is consistent with the SO2-TPD results (Figure 7). However, these sulfate species had little effect on the long-term stability of the Pt-2Eu2O3/TiO2 catalyst (Figure 1d), which might be due to the preferential adsorption of sulfate species on Eu2O3 sites, thereby protecting the Pt active sites from deactivation.

2.11. CO Oxidation Pathway

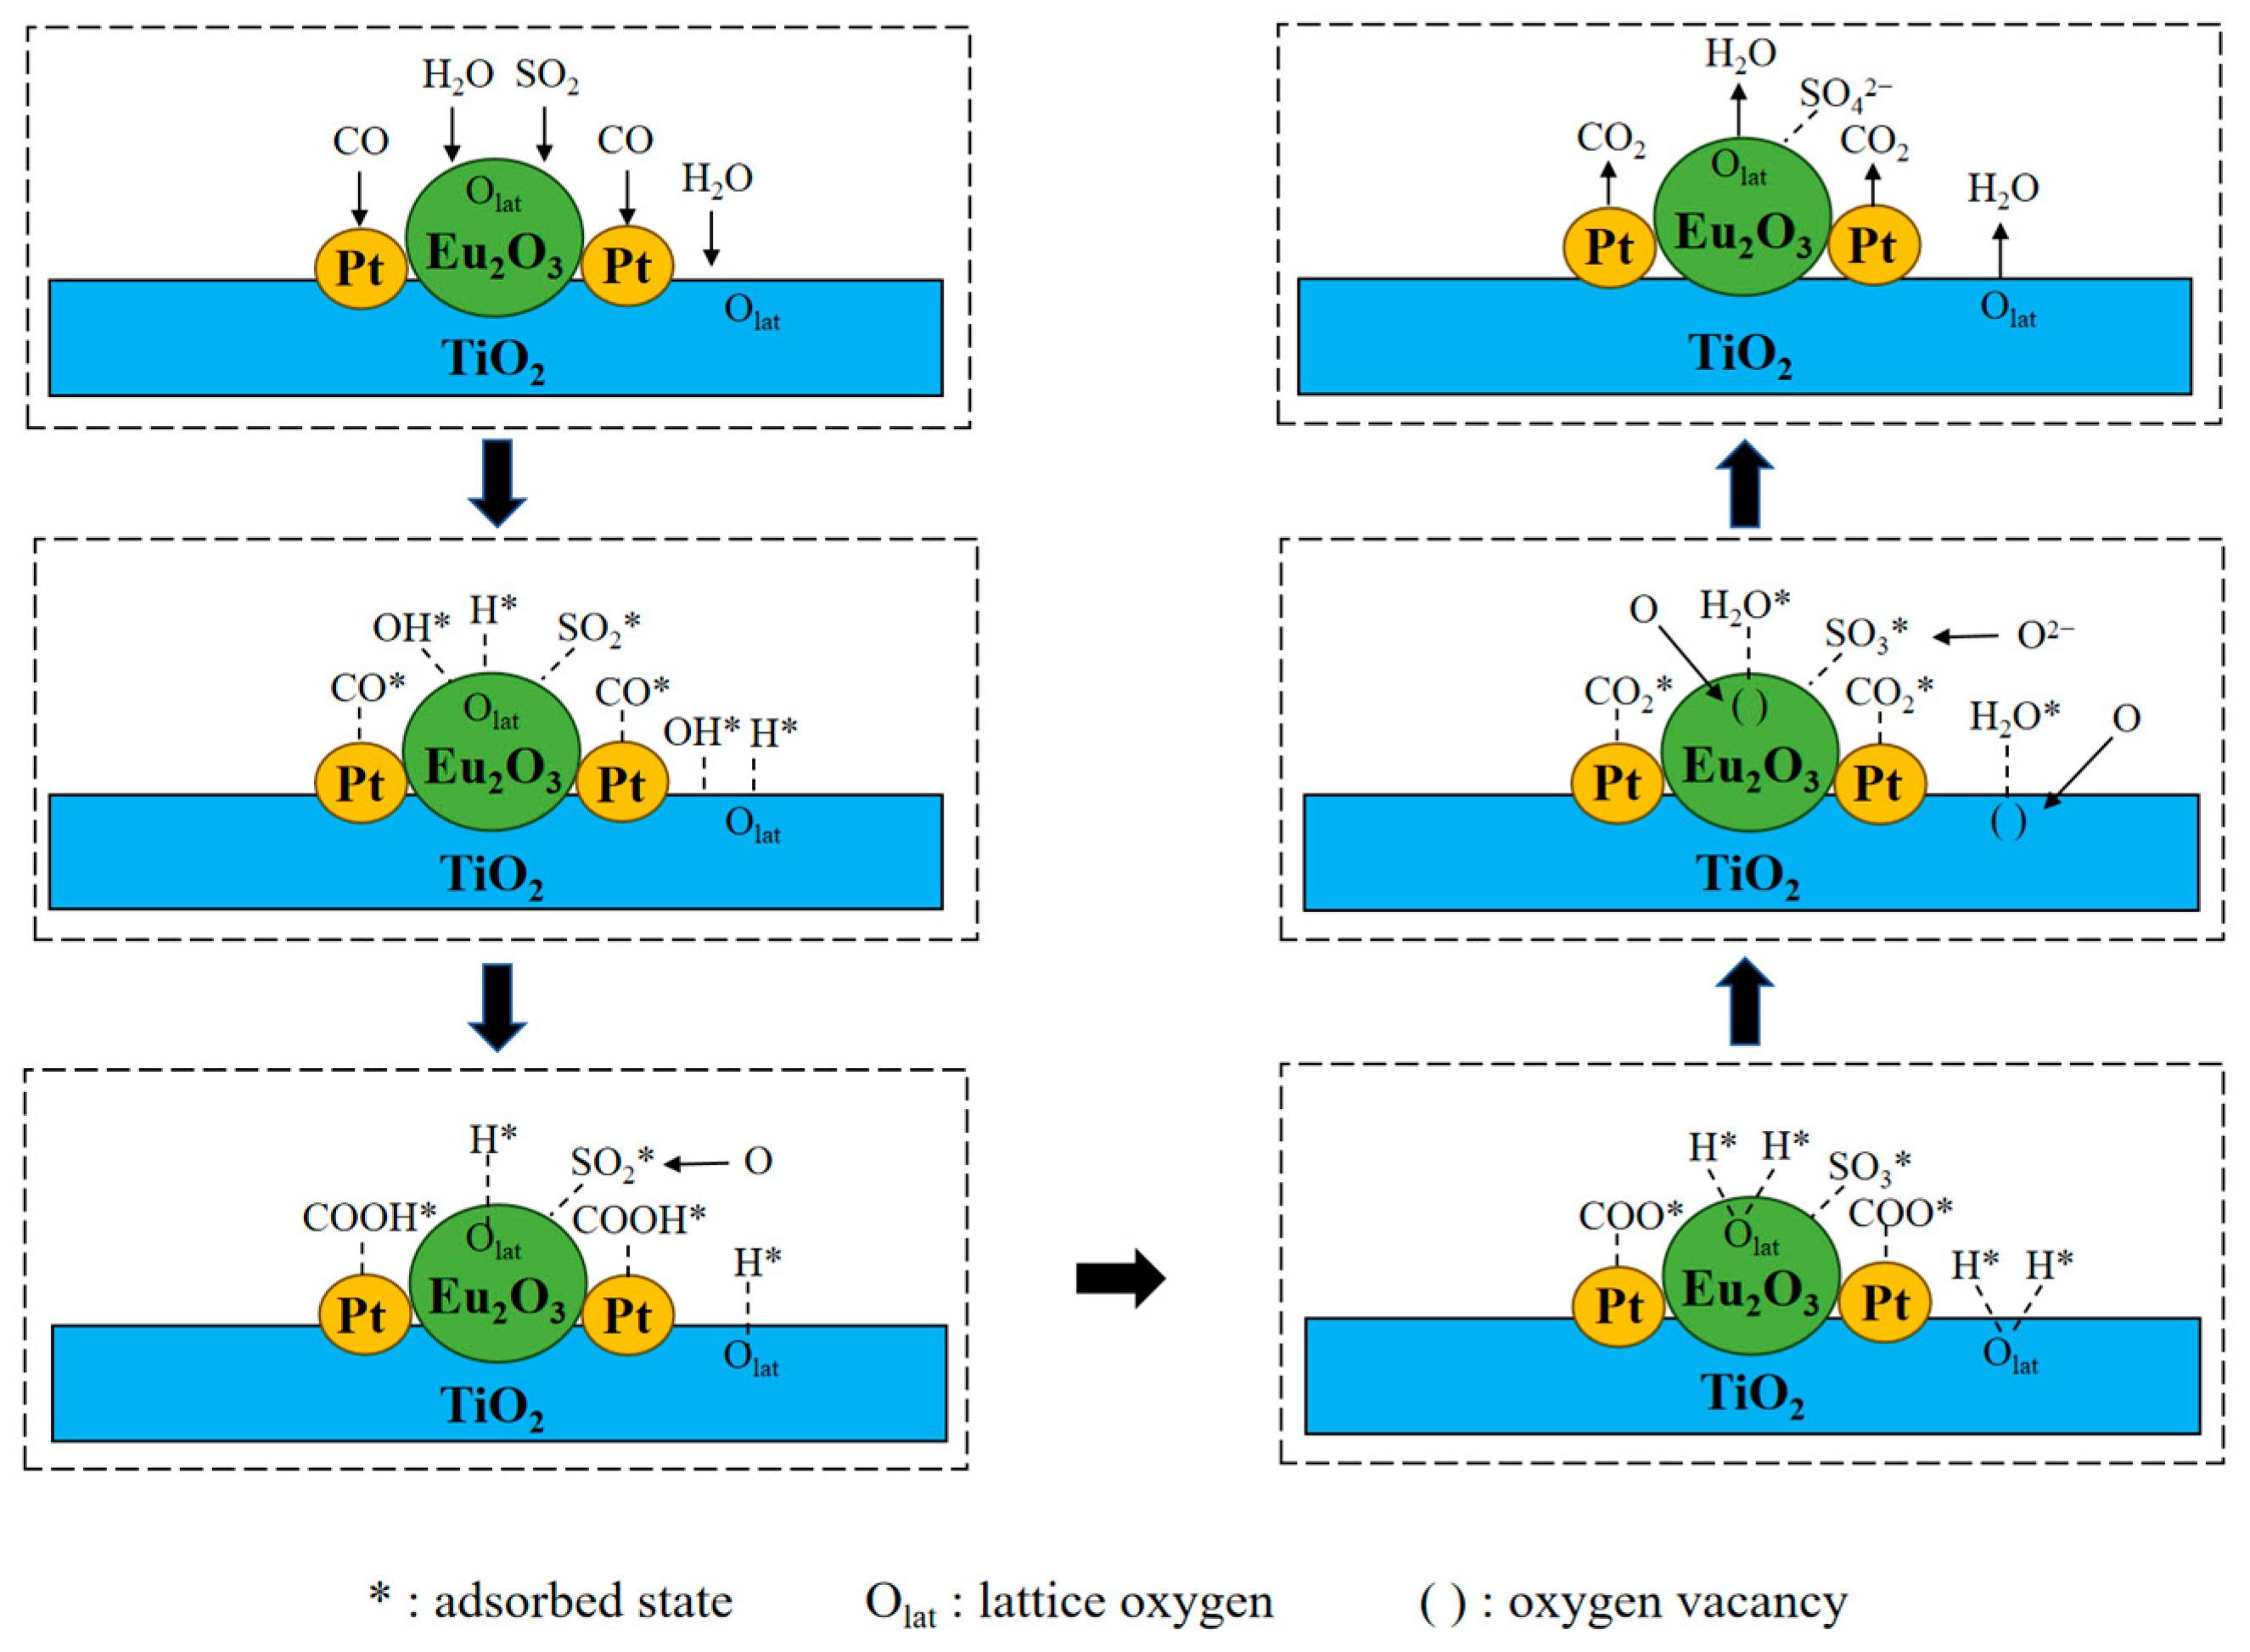
Figure 10 illustrates the H2O-mediated CO oxidation pathway on the Pt-2Eu2O3/TiO2 catalyst. The major steps include the adsorption of CO and H2O (R1, R2), the dissociation of H2O (R3), and the oxidation of CO accompanied by the consumption and replenishment of the lattice oxygen (R4~R9). The formation of sulfate species on the Eu2O3 sites (R10~R12) is also presented in Figure 10.
CO CO *
H 2 O H 2 O *
H 2 O * OH * + H *
OH * + CO * COOH *
H * + O lat O lat H *
COOH * + O lat H * CO 2 * + H 2 O * + (   )
CO 2 * CO 2
H 2 O * H 2 O
(   ) + 1 / 2 O 2 O lat
SO 2 SO 2 *
SO 2 * + O SO 3 *
SO 3 * + O 2 - SO 4 2 -
where *, Olat and ( ) indicate the adsorption state, lattice oxygen and oxygen vacancy, respectively.

3. Experimental Section

3.1. Catalyst Preparation

The Pt-Eu2O3/TiO2 catalysts were prepared via a two-step impregnation method. First, calculated amounts of TiO2 and Eu(NO3)3·6H2O were added to 200 mL of deionized water and ultrasonically agitated at 75 °C for 4 h. After drying at 110 °C for 6 h, the solid powder was calcined in a muffle furnace at 500 °C for 3 h to obtain the Eu2O3/TiO2 composite. Subsequently, this composite was impregnated with aqueous Pt(NO3)2 solution, followed by identical ultrasonic treatment (75 °C/4 h), drying (110 °C/6 h), and calcination (500 °C/3 h) to yield the final catalyst. For comparison, Pt/TiO2 was prepared by impregnating TiO2 with aqueous Pt(NO3)2 solution, following the same ultrasonic treatment–drying–calcination procedures. The obtained catalysts were pressed, crushed, and sieved into particles of 20–40 meshes before testing.
The mass fraction of Pt in all the catalysts was fixed at 0.5%, while that of Eu2O3 in the Pt-Eu2O3/TiO2 catalysts was varied (1%, 1.5%, 2%, and 2.5%). The catalysts with different Eu2O3 contents were denoted as Pt-xEu2O3/TiO2 (x = 1, 1.5, 2, 2.5). The Pt/TiO2 and Pt-2Eu2O3/TiO2 catalysts that had been tested under conditions without H2O and SO2 were designated as Pt/TiO2-used and Pt-2Eu2O3/TiO2-used, respectively. The Pt/TiO2 and Pt-2Eu2O3/TiO2 catalysts that had been tested under conditions containing 15% H2O and 50 ppm SO2 at 200 °C for 72 h were designated as Pt/TiO2-WS and Pt-2Eu2O3/TiO2-WS, respectively.

3.2. Catalytic Activity Test

The catalytic CO oxidation activity was tested using a continuous-flow fixed-bed quartz microreactor. The standard inlet gas composition was 0.8% CO, 5% O2, and N2 balance. The influence of H2O on CO catalytic oxidation was studied by injecting deionized water at a given flow rate into the inlet gas using a syringe pump. All the pipes before the reactor inlet were kept at around 110 °C to avoid condensation of the water vapor. The total flow rate of the feed gas was 1500 mL·min−1, corresponding to a space velocity of ca. 45,000 mL·g−1·h−1. The long-term (72 h) SO2 resistance of the Pt/TiO2 and Pt-2Eu2O3/TiO2 catalysts was evaluated in the presence of 15% H2O and 50 ppm SO2 at 200 °C. The CO concentration in the inlet and outlet gases was analyzed using an MGA6 Plus infrared flue gas analyzer (MRU, Heidelberg, Germany).
The CO conversion was calculated by the following equation.
CO   conversion = CO in CO out CO in × 100 %
where [CO]in and [CO]out indicate the inlet and outlet concentration of CO, respectively.
The turnover frequency (TOF) was calculated by the following equation.
TOF = x C 0 D Pt nPt
where x, C0 (mol/s), nPt (mol), and DPt represent the CO conversion, the inlet molar flow rate of CO, the molar amount of Pt, and Pt dispersion, respectively.

3.3. Kinetic Measurements

The CO oxidation rates under standard inlet gas composition (0.8% CO, 5% O2, and N2 balance) over the Pt/TiO2 and Pt-2Eu2O3/TiO2 catalysts were measured using the same apparatus as used for the CO oxidation activity test. Prior to the kinetic measurements, CO oxidation experiments were conducted at increasing WHSV to search for reaction conditions free from external mass-transfer limitations. The experimental details and results (Figure S1) of these preliminary experiments are described in the Supporting Information. To ensure that the collected data fell within kinetically relevant regimes (CO conversion < 20% and free from external diffusion limitations), the loading amount of the catalyst was fixed at 0.30 g and the total flow rate of the inlet gas was kept at 1.6 L/min to provide a WHSV of 320,000 mL·g−1·h−1 for the CO oxidation kinetic tests, which were conducted in the temperature range of 120–180 °C.

3.4. Catalyst Characterization

Scanning electron microscopy (SEM) analysis was conducted on a JSM-7401F instrument (JEOL, Tokyo, Japan). Transmission electron microscopy (TEM) images were captured using a JEM-2100F instrument (JEOL, Tokyo, Japan).
The X-ray diffraction (XRD) patterns of the catalysts were recorded with a Bruker D8 Advance instrument (Germany) using nickel-filtered Cu Kα radiation (λ = 1.54 Å) at 40 kV and 40 mA. The samples were scanned from 10° to 80° (2θ) with a step size of 0.02°.
The N2 adsorption–desorption isotherms of the catalysts were obtained using an ASAP 2050 automatic gas adsorption analyzer (Micromeritics, Norcross, GA, USA). The catalysts were degassed under a vacuum at 250 °C for 5 h before the measurement. The specific surface area of the catalyst was calculated by the Brunauer–Emmett–Teller (BET) method, and the pore volume and pore size distribution were determined by the Barrett–Joyner–Halenda (BJH) method.
CO chemisorption experiments were performed on an Auto Chem II 2920 chemisorption analyzer (Micromeritics, Norcross, GA, USA) to analyze the Pt dispersion of the catalysts. The dispersion of Pt was determined by dividing the molar amount of CO adsorbed by the molar amount of Pt contained in the tested samples.
Hydrogen temperature-programmed reduction (H2-TPR) was performed on an Auto Chem II 2920 chemisorption analyzer (Micromeritics, USA). The sample (100 mg) was pre-treated in air at 300 °C for 30 min before it was cooled down to room temperature. The sample was then purged in an Ar atmosphere until the baseline was stable. The TPR profile was obtained by heating the sample from 30 °C to 600 °C in a flow of 5% H2/Ar at a rate of 10 °C min−1. The H2 consumption was detected by a thermal conductivity detector (TCD). The CuO standard sample was used to quantify the H2 consumption amount.
X-ray photoelectron spectroscopy (XPS) data were collected on a Thermo Scientific ESCALAB 250xi equipment (Thermo Fisher Scientific, Waltham, MA, USA) using an Al Kα X-ray source (1486.7 eV) at 15 kV and 25 W, with the binding energy calibrated by C 1s at 284.8 eV.
The NH3 temperature-programmed desorption (NH3-TPD) was tested on a TP-5080 chemisorption analyzer (Tianjin Xianquan Industry and Trade Development Co., LTD, Tianjin, China). The sample (100 mg) was pre-treated in He flow at 300 °C for 1 h, cooled down to room temperature, and then exposed to 5% NH3/He for 1 h. The gas was then switched to He, and the sample were heated to 600 °C at a rate of 10 °C min−1 to detect the desorbed NH3 by a TCD.
The SO2 temperature-programmed desorption (SO2-TPD) was performed on an Auto Chem II 2920 chemisorption analyzer (Micromeritics, USA). The SO2-TPD test procedure was identical to that of NH3-TPD, except that the adsorbate was changed from NH3 to SO2.
The H2O temperature-programmed desorption (H2O-TPD) was tested on an Auto Chem II 2920 chemisorption analyzer (Micromeritics, USA). Approximately 100 mg of the sample (40–60 mesh) was pre-treated in He flow at 300 °C for 1 h, cooled down to 50 °C under the same He flow, and then exposed to saturated water vapor for 1 h. The gas was then switched to He, and the samples were heated to 500 °C at a rate of 10 °C min−1 to detect the desorbed H2O by a TCD.
In situ diffuse reflectance infrared Fourier transform spectroscopic (in situ DRIFTS) tests were conducted on a Tensor II Fourier transform infrared spectrometer (Bruker Optics, Ettlingen, Germany) equipped with an MCT detector. The in situ DRIFTS spectra of CO chemisorption on the Pt/TiO2 and Pt-2Eu2O3/TiO2 catalysts at 25 °C, and the spectra of CO oxidation in the presence of SO2 and H2O at 250 °C, were recorded. The samples were pre-treated in N2 at 300 °C for 1 h before being cooled down to the target temperature (25 or 250 °C). During the CO chemisorption test, 5% CO/N2 was introduced into the chamber for 1 h, followed by a 20 min N2 purge. During the CO oxidation test, a reaction gas mixture composed of 0.8% CO, 5% O2, 1% H2O, 50 ppm SO2, and N2 as the balance gas was fed into the chamber for 1 h.

4. Conclusions

In this study, Pt/TiO2 and Pt-Eu2O3/TiO2 catalysts were prepared via the impregnation method for catalytic oxidation of CO. The catalytic activity, SO2 resistance, physicochemical properties of representative catalysts, and reaction mechanism of CO oxidation were systematically investigated. The main findings can be summarized as follows.
(1) Introducing different contents of Eu2O3 enhanced the catalytic activity of Pt/TiO2 and the presence of H2O favored CO oxidation. The Pt-2Eu2O3/TiO2 catalyst exhibited the highest catalytic activity no matter whether H2O was present or not. Under the inlet gas composition of 0.8% CO, 5% O2, 3% H2O, and balanced N2, the lowest complete conversion temperature (T100) of CO decreased from 120 °C for the Pt/TiO2 catalyst to 100 °C for the Pt-2Eu2O3/TiO2 catalyst.
(2) The Pt-2%Eu2O3/TiO2 catalyst exhibited superior SO2 resistance to the Pt/TiO2 catalyst. During the 72 h SO2-resistance test at 200 °C under an inlet gas composition of 0.8% CO, 5% O2, 15% H2O, 50 ppm SO2, and balanced N2, the CO conversion on the Pt-2%Eu2O3/TiO2 catalyst remained >99% while that on the Pt/TiO2 catalyst gradually decreased to 77.8%.
(3) Compared with the Pt/TiO2 catalyst, the Pt-2Eu2O3/TiO2 catalyst exhibited enhanced dispersion of Pt species, an elevated proportion of metallic Pt0, and facilitated adsorption and dissociation of H2O. These collectively accounted for the superior catalytic performance of Pt-2Eu2O3/TiO2 in terms of CO oxidation. The OH* species derived from H2O dissociation played a crucial role in the CO oxidation by forming COOH* as the key reaction intermediate.
(4) Introducing 2 wt% Eu2O3 decreased the desorption temperature of weakly adsorbed SO2 while increasing that of strongly adsorbed SO2. SO2 preferentially occupied the Eu2O3 sites by forming stable sulfates on the Pt-2Eu2O3/TiO2 catalyst, thereby protecting the Pt active sites from sulfur poisoning.

Supplementary Materials

The following supporting information can be downloaded at https://www.mdpi.com/article/10.3390/catal15080783/s1, Figure S1: Effects of the WHSV and catalyst loading amount on the CO conversion at 180 °C on (a) Pt/TiO2 and (b) Pt-2Eu2O3/TiO2 (feed gas composition: 0.8% CO, 5% O2, and N2 balance); Figure S2: XRD patterns of the Pt/TiO2 and Pt-2Eu2O3/TiO2 samples; Figure S3: (a) N2 adsorption–desorption isotherms and (b) the BJH pore size distribution of Pt/TiO2, Pt/TiO2-WS, Pt-2Eu2O3/TiO2 and Pt-2Eu2O3/TiO2-WS; Table S1: Comparison of the catalytic activities and SO2 resistance of the catalysts developed in this work and reported in the literature.

Author Contributions

Conceptualization, W.L.; methodology, J.L. and Y.M.; formal analysis, J.C.; investigation, Z.Y., J.C., Y.M., W.L., and X.F.; resources, J.L.; data curation, Z.Y.; writing—original draft preparation, Z.Y.; writing—review and editing, J.C., Y.M., W.L., and X.F.; supervision, J.L. and X.F.; funding acquisition, J.L. and W.L. All authors have read and agreed to the published version of the manuscript.

Funding

This work was financially supported by the National Natural Science Foundation of China (22378008).

Data Availability Statement

The original contributions presented in this study are included in the article/Supplementary Material. Further inquiries can be directed to the corresponding author(s).

Acknowledgments

The authors would like to acknowledge the support of the National Natural Science Foundation of China (22378008).

Conflicts of Interest

The authors declare no conflicts of interest.

References

  1. Shi, Y.; Ruan, S.; Xu, K.; He, C.; Qin, C.; Zhang, L. Theoretical investigation of chemical reaction kinetics of CO catalytic combustion over NiNx-Gr. Colloid. Surf. A Physicochem. Eng. Asp. 2022, 653, 129962. [Google Scholar] [CrossRef]
  2. Taira, K.; Nakao, K.; Suzuki, K.; Einaga, H. SOx tolerant Pt/TiO2 catalysts for CO oxidation and the effect of TiO2 supports on catalytic activity. Environ. Sci. Technol. 2016, 50, 9773–9780. [Google Scholar] [CrossRef]
  3. Soliman, N.K. Factors affecting CO oxidation reaction over nanosized materials: A review. J. Mater. Res. Technol. JMRT 2019, 8, 2395–2407. [Google Scholar] [CrossRef]
  4. He, Y.; Liu, H.; Wang, Y.; Liu, X.; Chai, Y.; Kang, J.; Liu, L. Theoretical study on the effects of flue gas impurities on the oxidation/dissociation of CO over Pt catalysts. Surf. Interfaces 2025, 72, 107093. [Google Scholar] [CrossRef]
  5. Shi, G.; Wei, Y.; Liang, F.; Zhang, L. High-activity evolution of adjustable Pd in Pd/P-CeO2-Al2O3 monolithic catalyst for CO oxidation properties: A crucial function of the Brønsted/Lewis acidic site. Appl. Surf. Sci. 2025, 707, 163648. [Google Scholar] [CrossRef]
  6. Valechha, D.; Megarajan, S.K.; Al-Fatesh, A.; Jiang, H.; Labhasetwar, N. Low Temperature CO Oxidation Over a Novel Nano-Structured, Mesoporous CeO2 Supported Au Catalyst. Catal. Lett. 2019, 149, 127–140. [Google Scholar] [CrossRef]
  7. Zhao, G.; Guo, Y.; Huang, P.; Zhang, Z.; Zhao, C. Enhanced low-temperature CO oxidation over CuO-Co3O4 catalysts promoted with transition metal oxides. Fuel 2026, 403, 136113. [Google Scholar] [CrossRef]
  8. Chen, W.; Xu, J.; Huang, F.; Zhao, C.; Guan, Y.; Fang, Y.; Hu, J.; Yang, W.; Luo, Z.; Guo, Y. CO oxidation over CuOx/TiO2 catalyst: The importance of oxygen vacancies and Cu plus species. Appl. Surf. Sci. 2023, 618, 156539. [Google Scholar] [CrossRef]
  9. Afonasenko, T.N.; Glyzdova, D.V.; Yurpalov, V.L.; Konovalova, V.P.; Rogov, V.A.; Gerasimov, E.Y.; Bulavchenko, O.A. The Study of Thermal Stability of Mn-Zr-Ce, Mn-Ce and Mn-Zr Oxide Catalysts for CO Oxidation. Materials 2022, 15, 7553. [Google Scholar] [CrossRef] [PubMed]
  10. Hu, Y.; Liu, X.; Zou, Y.; Xie, H.; Zhu, T. Nature of support plays vital roles in H2O promoted CO oxidation over Pt catalysts. J. Catal. 2022, 416, 364–374. [Google Scholar] [CrossRef]
  11. Wang, T.; Xing, J.; Zhu, L.; Jia, A.; Wang, Y.; Lu, J.; Luo, M. CO oxidation over supported Pt/CrxFe2-xO3 catalysts and their good tolerance to CO2 and H2O. Appl. Catal. B Environ. Energy 2019, 245, 314–324. [Google Scholar] [CrossRef]
  12. Taira, K.; Einaga, H. The Effect of SO2 and H2O on the Interaction Between Pt and TiO2(P-25) during catalytic CO oxidation. Catal. Lett. 2019, 149, 965–973. [Google Scholar] [CrossRef]
  13. Hamzehlouyan, T.; Sampara, C.S.; Li, J.; Kumar, A.; Epling, W.S. Kinetic study of adsorption and desorption of SO2 over γ-Al2O3 and Pt/γ-Al2O3. Appl. Catal. B Environ. Energy 2016, 181, 587–598. [Google Scholar] [CrossRef]
  14. Happel, M.; Luckas, N.; Viñes, F.; Sobota, M.; Laurin, M.; Görling, A.; Libuda, J. SO2 adsorption on Pt(111) and oxygen precovered Pt(111): A combined infrared reflection absorption spectroscopy and density functional study. J. Phys. Chem. C 2011, 115, 479–491. [Google Scholar] [CrossRef]
  15. Zhu, H.; Qiu, W.; Wu, R.; Li, K.; He, H. Spatial confinement: An effective strategy to improve H2O and SO2 resistance of the expandable graphite-modified TiO2-supported Pt nanocatalysts for CO oxidation. J. Environ. Sci. 2025, 148, 57–68. [Google Scholar] [CrossRef]
  16. Park, K.Y.; Lee, M.J.; Kim, W.G.; Kim, S.J.; Jeong, B.; Ye, B.; Kim, H.D. Oxidation of CO and slipped NH3 over a WS2-Loaded Pt/TiO2 catalyst with an extended reaction temperature range. Mater. Chem. Phys. 2023, 309, 128341. [Google Scholar] [CrossRef]
  17. Xu, T.; Liu, X.; Zhu, T.; Feng, C.; Hu, Y.; Tian, M. New insights into the influence mechanism of H2O and SO2 on Pt-W/Ti catalysts for CO oxidation. Catal. Sci. Technol. 2022, 12, 1574–1585. [Google Scholar] [CrossRef]
  18. Yu, C.; Yang, C.; Wang, R.; Dai, G.; Chen, H.; Huang, Z.; Zhao, H.; Zhou, Z.; Wu, X.; Jing, G. Mechanistic insight into the catalytic CO oxidation and SO2 resistance over Mo-decorated Pt/TiO2 catalyst: The essential role of Mo. Chem. Eng. J. 2024, 486, 150319. [Google Scholar] [CrossRef]
  19. Li, H.; Tang, Y.; Kang, J.; Wang, Y.; Liu, S.; Ding, L.; Long, H. Study on CO oxidation in sintering flue gas based on Pt-Ce-Ti catalyst. J. Cent. South Univ. 2022, 53, 4886–4895. [Google Scholar]
  20. Wang, F.; Lu, G. High performance rare earth oxides LnOx (Ln = La, Ce, Nd, Sm and Dy)-modified Pt/SiO2 catalysts for CO oxidation in the presence of H2. J. Power Sources 2008, 181, 120–126. [Google Scholar] [CrossRef]
  21. Zhao, B.; Jian, Y.; Jiang, Z.; Albilali, R.; He, C. Revealing the unexpected promotion effect of EuO on Pt/CeO2 catalysts for catalytic combustion of toluene. Chin. J. Catal. 2019, 40, 543–552. [Google Scholar] [CrossRef]
  22. Jung, C.H.; Yun, J.; Qadir, K.; Naik, B.; Yun, J.Y.; Park, J.Y. Catalytic activity of Pt/SiO2 nanocatalysts synthesized via ultrasonic spray pyrolysis process under CO oxidation. Appl. Catal. B Environ. Energy 2014, 154, 171–176. [Google Scholar] [CrossRef]
  23. Cai, J.; Yu, Z.; Fan, X.; Li, J. Effect of TiO2 calcination pretreatment on the performance of Pt/TiO2 catalyst for CO oxidation. Molecules 2022, 27, 3875. [Google Scholar] [CrossRef]
  24. Jain, N.; Ravishankar, N.; Madras, G. Spectroscopic and kinetic insights of Pt-dispersion over microwave-synthesized GO-supported Pt-TiO2 for CO oxidation. Mol. Catal. 2017, 432, 88–98. [Google Scholar]
  25. He, J.; Li, J.; Liang, W.; Song, L.; Yuan, J.; Cai, J.; Yu, Z. Unveiling the promotional performance of CO oxidation over Na-doped Pt-0.5P&W/TiO2 catalyst: “SMSI” effect of Na in catalysis. Fuel 2024, 372, 132199. [Google Scholar]
  26. He, J.; Li, J.; Yu, Z.; Li, S.; Yuan, J.; Cai, J. Strong metal support interaction (SMSI) and MoO3 synergistic effect of Pt-based catalysts on the promotion of CO activity and sulfur resistance. Environ. Sci. Pollut. Res. 2024, 31, 1530–1542. [Google Scholar] [CrossRef] [PubMed]
  27. Einaga, H.; Urahama, N.; Tou, A.; Teraoka, Y. CO Oxidation Over TiO2-Supported Pt-Fe Catalysts Prepared by Coimpregnation Methods. Catal. Lett. 2014, 144, 1653–1660. [Google Scholar] [CrossRef]
  28. Rathore, R.R.S.; Paul, D.; Chaure, N.B.; Rathore, D. Investigation of novel BaFe2O4/SiC/TiO2 nanocomposites as gas sensor towards NH3 (g): Structural, morphological, optical and dielectric properties. Appl. Phys. A Mater. Sci. Process. 2024, 130, 36. [Google Scholar] [CrossRef]
  29. Buttersack, C. Modeling of type IV and V sigmoidal adsorption isotherms. Phys. Chem. Chem. Phys. 2019, 21, 5614–5626. [Google Scholar] [CrossRef]
  30. Wang, H.; Yao, R.; Zhang, R.; Ma, H.; Gao, J.; Liang, M.; Zhao, Y.; Miao, Z. CeO2-supported TiO2-Pt nanorod composites as efficient catalysts for CO oxidation. Molecules 2023, 28, 1867. [Google Scholar] [CrossRef] [PubMed]
  31. Nagai, Y.; Hirabayashi, T.; Dohmae, K.; Takagi, N.; Minami, T.; Shinjoh, H.; Matsumoto, S. Sintering inhibition mechanism of platinum supported on ceria-based oxide and Pt-oxide-support interaction. J. Catal. 2006, 242, 103–109. [Google Scholar] [CrossRef]
  32. Cai, J.; Yu, Z.; Li, J. Effect of preparation methods on the performance of Pt/TiO2 catalysts for the catalytic oxidation of carbon monoxide in simulated sintering flue gas. Catalysts 2021, 11, 804. [Google Scholar] [CrossRef]
  33. Ye, J.; Zhu, B.; Cheng, B.; Jiang, C.; Wageh, S.; Al-Ghamdi, A.A.; Yu, J. Synergy between platinum and gold nanoparticles in oxygen activation for enhanced room-temperature formaldehyde oxidation. Adv. Funct. Mater. 2022, 32, 2110423. [Google Scholar] [CrossRef]
  34. Rahm, M.; Zeng, T.; Hoffmann, R. Electronegativity seen as the ground-state average valence electron binding energy. J. Am. Chem. Soc. 2019, 141, 342–351. [Google Scholar] [CrossRef] [PubMed]
  35. Tang, T.; Wang, Y.; Dong, W.; Liu, C.; Xu, C. Pt nanoclusters controllably prepared by impregnation method and its catalytic property for glycerol oxidation. Catal. Lett. 2021, 151, 593–599. [Google Scholar] [CrossRef]
  36. Kim, G.J.; Kwon, D.W.; Hong, S.C. Effect of Pt particle size and valence state on the performance of Pt/TiO2 catalysts for CO oxidation at room temperature. J. Phys. Chem. C 2016, 120, 17996–18004. [Google Scholar] [CrossRef]
  37. Liu, J.; Ding, T.; Zhang, H.; Li, G.; Cai, J.; Zhao, D.; Tian, Y.; Xian, H.; Bai, X.; Li, X. Engineering surface defects and metal-support interactions on Pt/TiO2(B) nanobelts to boost the catalytic oxidation of CO. Catal. Sci. Technol. 2018, 8, 4934–4944. [Google Scholar] [CrossRef]
  38. Zhao, X.; Hu, Y.; Jiang, H.; Yu, J.; Jiang, R.; Li, C. Engineering TiO2 supported Pt sub-nanoclusters via introducing variable valence Co ion in high-temperature flame for CO oxidation. Nanoscale 2018, 10, 13384–13392. [Google Scholar] [CrossRef]
  39. Feng, C.; Liu, X.; Zhu, T.; Hu, Y.; Tian, M. Catalytic oxidation of CO over Pt/TiO2 with low Pt loading: The effect of H2O and SO2. Appl. Catal. A Gen. 2021, 622, 118218. [Google Scholar] [CrossRef]
  40. Kumar, S.; Prakash, R.; Choudhary, R.J.; Phase, D.M. Structural, XPS and magnetic studies of pulsed laser deposited Fe doped Eu2O3 thin film. Mater. Res. Bull. 2015, 70, 392–396. [Google Scholar] [CrossRef]
  41. Unal, F.; Alp, E.; Kazmanli, K. Production, characterization, and photocatalytic properties of Eu:Y2O3 nanopowders. J. Chin. Chem. Soc. 2022, 69, 1744–1753. [Google Scholar] [CrossRef]
  42. Mashkovtsev, M.A.; Kosykh, A.S.; Ishchenko, A.V.; Chukin, A.V.; Kukharenko, A.I.; Troshin, P.A.; Zhidkov, I.S. Unraveling oxygen vacancies effect on chemical composition, electronic structure and optical properties of Eu doped SnO2. Nanomaterials 2024, 14, 1675. [Google Scholar] [CrossRef] [PubMed]
  43. Chen, J.; Jiang, M.; Xu, W.; Chen, J.; Hong, Z.; Jia, H. Incorporating Mn cation as anchor to atomically disperse Pt on TiO2 for low-temperature removal of formaldehyde. Appl. Catal. B Environ. Energy 2019, 259, 118013. [Google Scholar] [CrossRef]
  44. Meunier, F.C.; Cardenas, L.; Kaper, H.; Smíd, B.; Vorokhta, M.; Grosjean, R.; Aubert, D.; Dembélé, K.; Lunkenbein, T. Synergy between metallic and oxidized Pt sites unravelled during room temperature CO oxidation on Pt/Ceria. Angew. Chem. Int. Ed. Energy 2021, 60, 7472. [Google Scholar] [CrossRef]
  45. Ma, C.; Yang, C.; Wang, B.; Chen, C.; Wang, F.; Yao, X.; Song, M. Effects of H2O on HCHO and CO oxidation at room-temperature catalyzed by MCo2O4 (M = Mn, Ce and Cu) materials. Appl. Catal. B Environ. Energy 2019, 254, 76–85. [Google Scholar] [CrossRef]
  46. Zhang, X.; Bi, F.; Zhu, Z.; Yang, Y.; Zhao, S.; Chen, J.; Lv, X.; Wang, Y.; Xu, J.; Liu, N. The promoting effect of H2O on rod-like MnCeOx derived from MOFs for toluene oxidation: A combined experimental and theoretical investigation. Appl. Catal. B Environ. Energy 2021, 297, 120393. [Google Scholar] [CrossRef]
  47. Zhang, X.; Dai, L.; Liu, Y.; Deng, J.; Jing, L.; Yu, X.; Han, Z.; Zhang, K.; Dai, H. 3DOM CeO2-supported RuyM (M = Au, Pd, Pt) alloy nanoparticles with improved catalytic activity and chlorine-tolerance in trichloroethylene oxidation. Catal. Sci. Technol. 2020, 10, 3755–3770. [Google Scholar] [CrossRef]
  48. Zhou, J.; He, J.; Wang, T.; Chen, X.; Sun, D. Synergistic effect of RE2O3 (RE = Sm, Eu and Gd) on Pt/mesoporous carbon catalyst for methanol electro-oxidation. Electrochim. Acta 2009, 54, 3103–3108. [Google Scholar] [CrossRef]
  49. He, K. In situ DRIFTS and TPD studies on surface properties affecting SO2-resistance of Pt/TiO2 catalyst in low-temperature CO oxidation. Surf. Sci. 2023, 734, 122315. [Google Scholar] [CrossRef]
  50. Zhang, T.; Qiu, W.; Zhu, H.; Ding, X.; Wu, R.; He, H. Promotion effect of the keggin structure on the sulfur and water resistance of Pt/CeTi catalysts for CO oxidation. Catalysts 2022, 12, 4. [Google Scholar] [CrossRef]
  51. Jin, R.; Liu, Y.; Wang, Y.; Cen, W.; Wu, Z.; Wang, H.; Weng, X. The role of cerium in the improved SO2 tolerance for NO reduction with NH3 over Mn-Ce/TiO2 catalyst at low temperature. Appl. Catal. B Environ. Energy 2014, 148, 582–588. [Google Scholar] [CrossRef]
  52. Ye, D.; Qu, R.; Song, H.; Gao, X.; Luo, Z.; Ni, M.; Cen, K. New insights into the various decomposition and reactivity behaviors of NH4HSO4 with NO on V2O5/TiO2 catalyst surfaces. Chem. Eng. J. 2016, 283, 846–854. [Google Scholar] [CrossRef]
  53. Wang, W.; Xu, D.; Cheng, B.; Yu, J.; Jiang, C. Hybrid carbon@TiO2 hollow spheres with enhanced photocatalytic CO2 reduction activity. J. Mater. Chem. A 2017, 5, 5020–5029. [Google Scholar] [CrossRef]
Figure 1. (a) CO conversion under inlet gas composition of 0.8% CO, 5% O2, and N2 balance (WHSV: 45,000 mL·g−1·h−1). (b) Arrhenius plots of CO oxidation over Pt/TiO2 and Pt-2Eu2O3/TiO2 catalysts. (c) CO conversion under inlet gas composition of 0.8% CO, 5% O2, 3% H2O, and N2 balance (WHSV: 45,000 mL·g−1·h−1). (d) Stability of Pt/TiO2 and Pt-2Eu2O3/TiO2 catalysts at 200 °C under inlet gas composition of 0.8% CO, 5% O2, 15% H2O, 50 ppm SO2, and N2 balance (WHSV: 45,000 mL·g−1·h−1).
Catalysts 15 00783 g001
Figure 2. SEM and TEM images of (ac) Pt/TiO2 and (df) Pt-2Eu2O3/TiO2, and (gj) SEM-EDS elemental maps of Pt-2Eu2O3/TiO2.
Catalysts 15 00783 g002
Figure 3. H2-TPR curves of (a) Pt/TiO2, (b) Pt-1Eu2O3/TiO2, (c) Pt-1.5Eu2O3/TiO2, (d) Pt-2Eu2O3/TiO2, and (e) Pt-2.5Eu2O3/TiO2.
Catalysts 15 00783 g003
Figure 4. XPS spectra of (a) Pt 4f, (b) O 1s, (c) Eu 3d, and (d) S 2p.
Catalysts 15 00783 g004
Figure 5. In situ DRIFTS spectra of CO chemisorption on the (a) Pt/TiO2 and (b) Pt-2Eu2O3/TiO2 catalysts at 25 °C.
Catalysts 15 00783 g005
Figure 6. (a) NH3-TPD curves of Pt/TiO2 and Pt-2Eu2O3/TiO2 and (b) the number of acid sites on Pt/TiO2 and Pt-2Eu2O3/TiO2.
Catalysts 15 00783 g006
Figure 7. (a) SO2-TPD curves of TiO2 (T), 2Eu2O3/TiO2 (E-T), Pt/TiO2 (P-T) and Pt-2Eu2O3/TiO2 (P-E-T) and (b) number of SO2 adsorption sites on (T), (E-T), (P-T) and (P-E-T).
Catalysts 15 00783 g007
Figure 8. (a) H2O-TPD curves of Pt/TiO2 and Pt-2Eu2O3/TiO2 and (b) amounts of H2O adsorbed on Pt/TiO2 and Pt-2Eu2O3/TiO2.
Catalysts 15 00783 g008
Figure 9. In situ DRIFTS spectra of CO oxidation in the presence SO2 and H2O over (a) Pt/TiO2 and (b) Pt-2Eu2O3/TiO2 catalysts at 250 °C.
Catalysts 15 00783 g009
Figure 10. Oxidation pathways of CO and SO2 on the Pt-2Eu2O3/TiO2 catalyst.
Catalysts 15 00783 g010
Table 1. Surface structure parameters and Pt dispersion of different catalysts.
SamplesBET Specific Surface Area (m2·g−1)Pore Volume (cm3·g−1)Average Pore Diameter (nm)Pt Dispersion (%)
Pt/TiO269.40.3921.747.5
Pt/TiO2-WS67.00.3922.7/
Pt-2Eu2O3/TiO272.10.4122.253.5
Pt-2Eu2O3/TiO2-WS61.40.3823.9/
Table 2. H2 consumption amounts of Pt/TiO2 and Pt-xEu2O3/TiO2 catalysts.
SamplesH2 Consumption (μmol/gcat)
Peak IPeak IITotal
Pt/TiO29.7673.2682.9
Pt-1Eu2O3/TiO213.1491.1504.2
Pt-1.5Eu2O3/TiO216.6509.8526.4
Pt-2Eu2O3/TiO219.0498.8517.8
Pt-2.5Eu2O3/TiO223.0492.0515
Table 3. Surface element compositions of different catalysts.
SamplesOads/(Olat + Oads) (%)Pt0/(Pt0 + Pt2+) (%)
Pt/TiO218.720.0
Pt-2Eu2O3/TiO218.038.7
Pt/TiO2-used22.152.0
Pt-2Eu2O3/TiO2-used22.256.5
Pt/TiO2-WS24.562.3
Pt-2Eu2O3/TiO2-WS27.663.3
Disclaimer/Publisher’s Note: The statements, opinions and data contained in all publications are solely those of the individual author(s) and contributor(s) and not of MDPI and/or the editor(s). MDPI and/or the editor(s) disclaim responsibility for any injury to people or property resulting from any ideas, methods, instructions or products referred to in the content.