2.1. Characterisation of Alumina-Based Catalysts
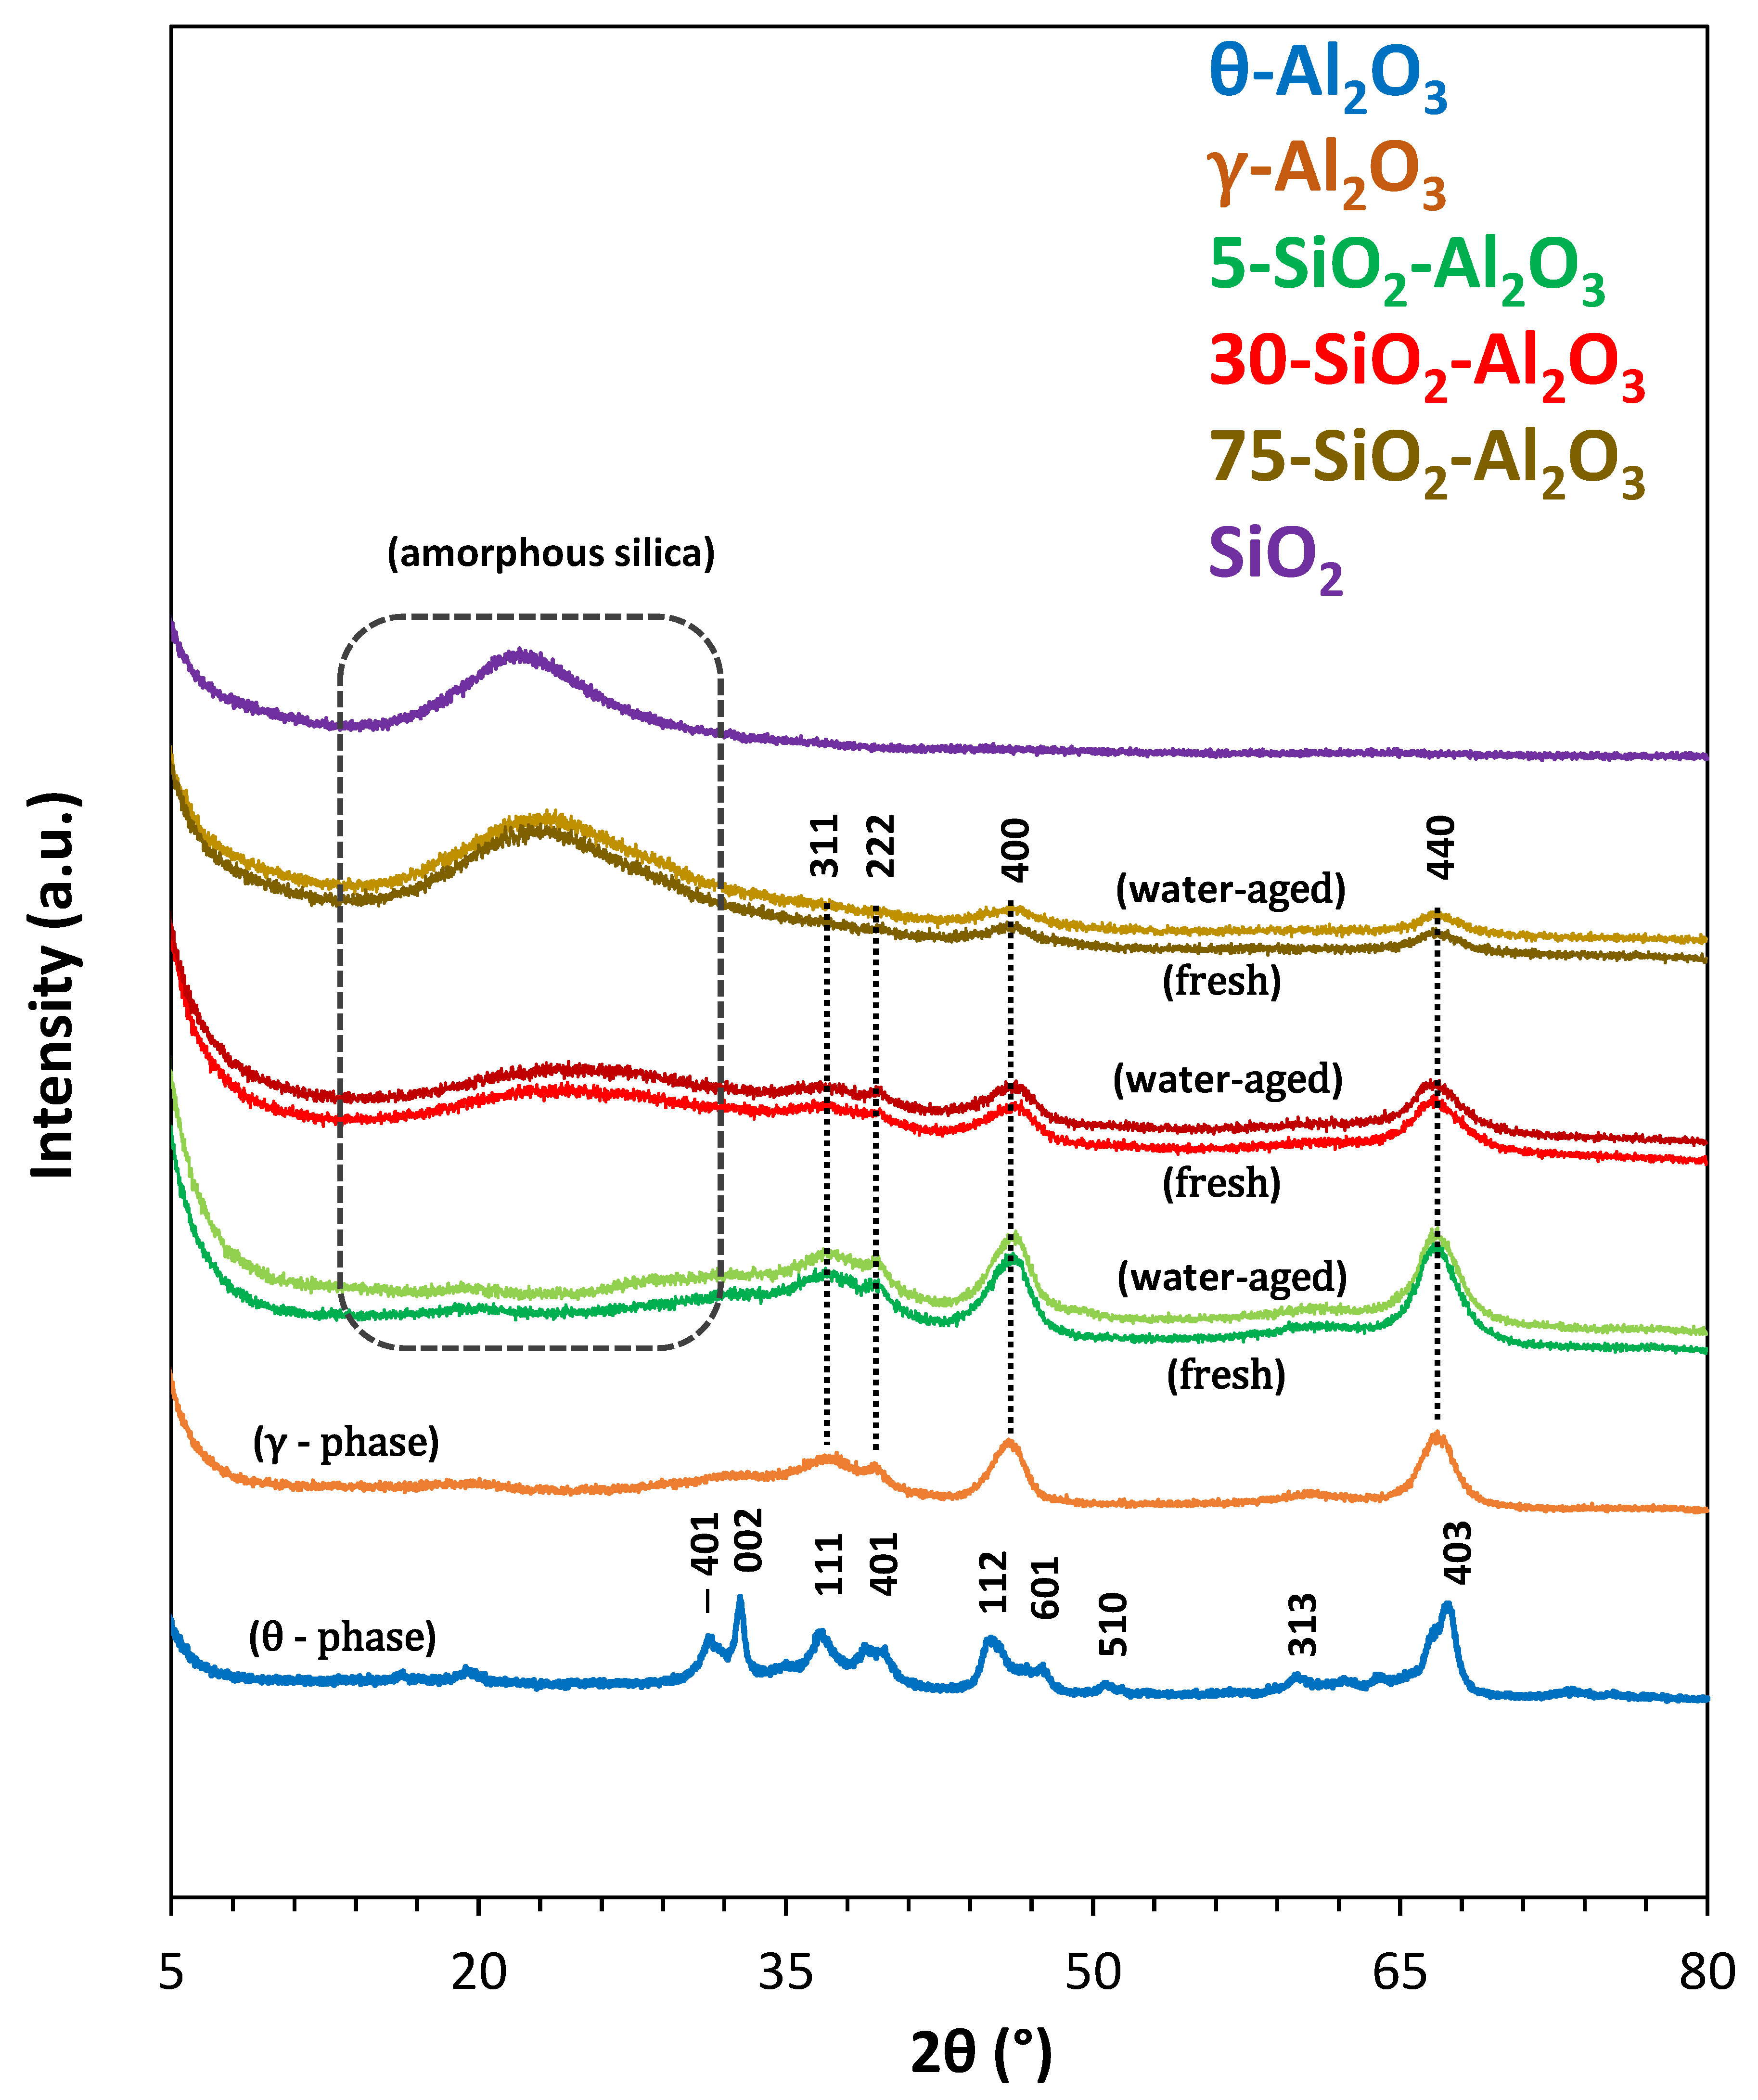
Figure 1 shows the XRD patterns of studied solids. The peak positions for alumina pure samples corresponded to gamma (2θ = 36.9°, 39.4°, 46.0° and 67.0° [
18]) and theta (2θ = 31.6°, 32.8°, 37.1°, 39.9°, 45.3°, 50.9°, 60.1° and 67.5° [
19]) phases with cubic and monoclinic crystal systems, respectively. Both γ and θ phases are metastable aluminas with similar face-centred cubic oxygen sublattices but cations present in various proportions in both octahedral and tetrahedral lattice sites [
18]. Indeed, the γ-to-θ phase transition takes place by aluminium migration in order to reduce strong Al–Al interactions, while oxygen atoms remain fixed [
20]. SiO
2-Al
2O
3 with lowest silica content exhibits diffraction peaks corresponding to (311), (222), (400) and (440) crystal planes of the γ-Al
2O
3 cubic system. With increasing silica content in 30-SiO
2-Al
2O
3, the intensity of γ-Al
2O
3 characteristic peaks was decreased, and a new broad diffraction peak was visible at 2θ = 15–30°, attributed to amorphous silica. The peak assigned to silica phase became more pronounced in 75-SiO
2-Al
2O
3, while the characteristic peaks of alumina almost disappeared.
The broad peak at 21.9° for the SiO
2 is attributed to the (111) crystallographic plane. The XRD patterns of different solids suggest that they present a small degree of crystallinity. No changes in diffractograms could be revealed for the water-aged materials. The surface area and porous structure of solids are important parameters in avoiding the diffusion limitations during catalytic testing, by providing abundant surface-active sites that facilitate the catalytic performance and can have an impact for the undesired reactions and the catalyst regeneration. The textural properties of the commercial oxides (as received, denoted as fresh samples and water-aged) were determined from N
2 adsorption–desorption measurements.
Table 1 summarises the results obtained, including BET surface area, mean size of pores, mesoporous (V
meso) and total (V
porous) pore volumes.
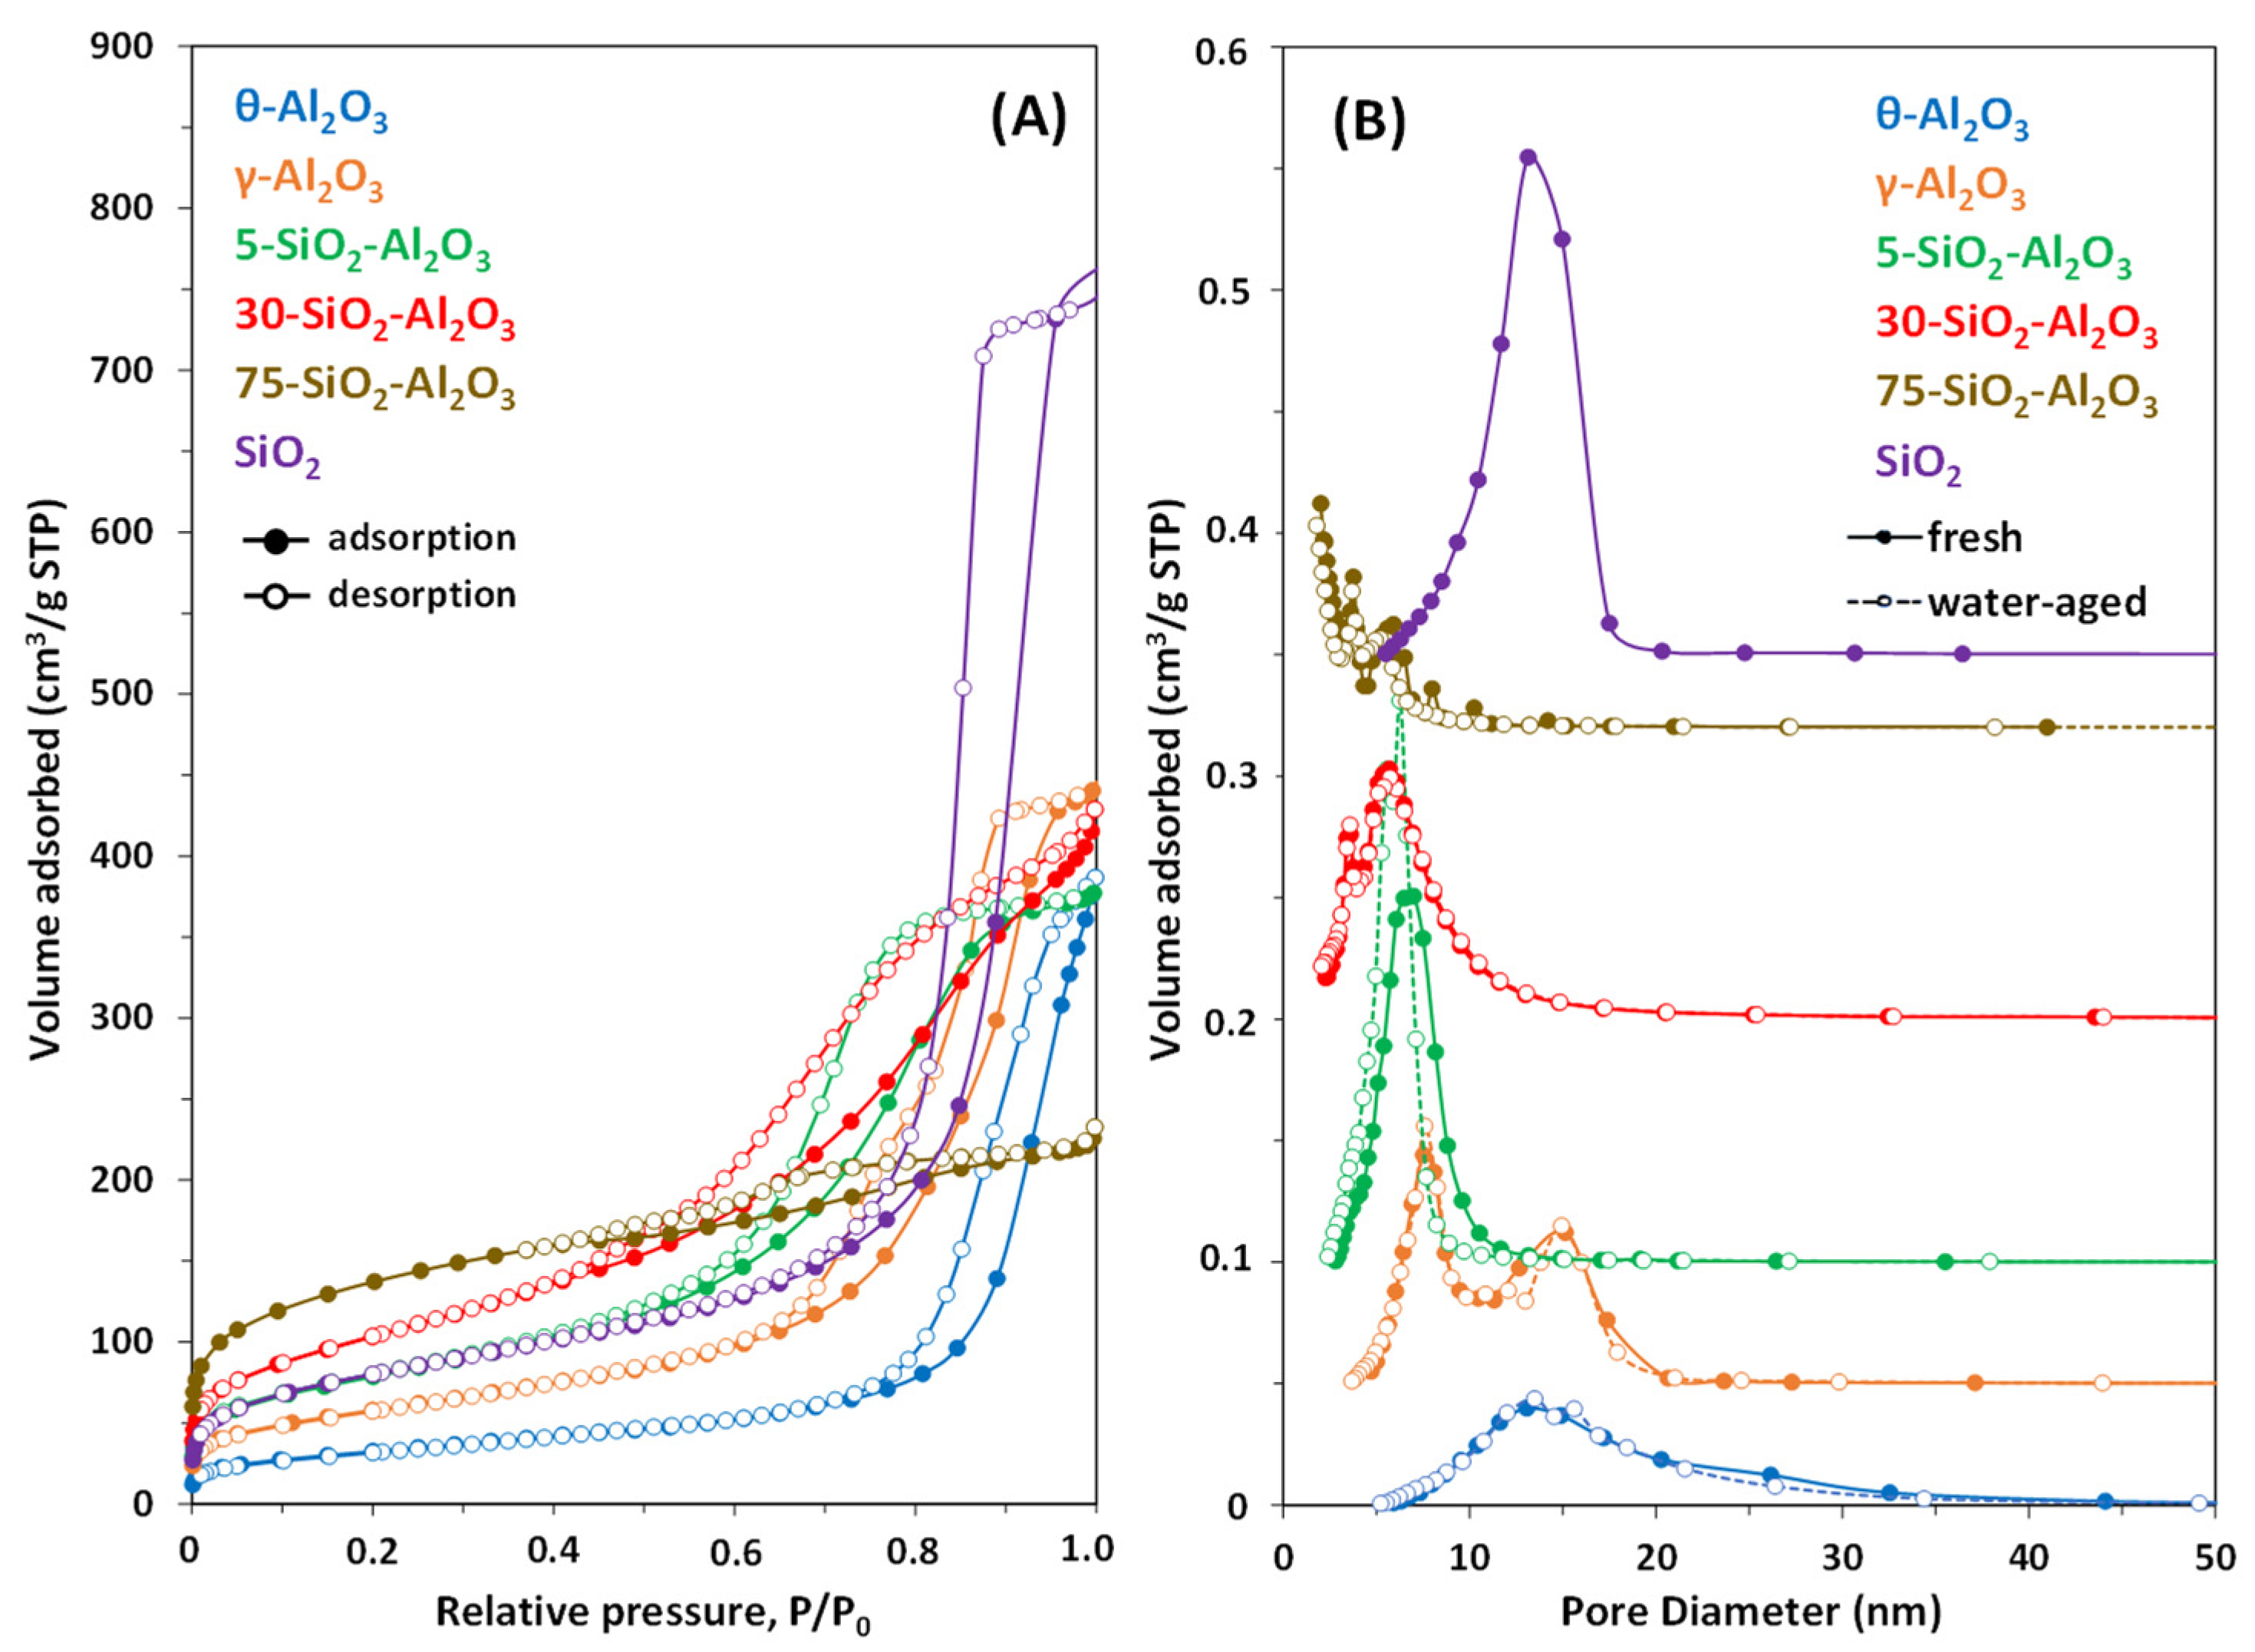
Figure 2A,B show the nitrogen adsorption–desorption isotherms and pore-size distributions of different oxides.
All materials were porous, having BET specific surface areas between 110 and 480 m
2/g. The N
2 adsorption–desorption isotherms of SiO
2, γ-Al
2O
3 and 5-SiO
2-Al
2O
3 samples were of type IV (IUPAC classification), characteristic of mesoporous structures [
21]. The increase in N
2 uptake at P/P
0 < 0.06 is related to monolayer formation. This is followed by a very slow evolution of the adsorption curve until a P/P
0 of about 0.7, attributed to the transition from monolayer to multilayer adsorption of nitrogen. For P/P
0 < 0.7, the adsorption and desorption curves are overlapped for SiO
2 and γ-Al
2O
3, while a hysteresis loop is gradually formed for 5-SiO
2-Al
2O
3 at P/P
0 > 0.5. At higher pressures, capillary condensation takes place, which is translated in the adsorption curve by a sharp increase into N
2 uptake until P/P
0 of 0.90−0.95 and an almost constant uptake at the end of isothermal adsorption. During this last stage, the three samples present a hysteresis loop of H1 type, often associated with porous materials consisting of well-defined cylindrical-like pore channels or agglomerates of approximately uniform spheres [
21].
SiO
2 showed the highest saturated adsorption capacity and a monomodal pore-size distribution in the range of 5–20 nm. γ-Al
2O
3 is characterised by two capillary condensation steps at 0.65 < P/P
0 < 0.80 and 0.80 < P/P
0 < 0.96 (
Figure 2A, the desorption step at high pressures showing a climbing slope). This isotherm shape indicates the bimodal mesoporous character of the material [
22,
23], as also evidenced by the pore-size distribution plot (
Figure 2B). γ-Al
2O
3 is characterised by the presence of mesopores up to 20 nm with maxima around 7.5 and 15.1 nm. 5-SiO
2-Al
2O
3 showed a monomodal pore-size distribution in the range of 2 to 15 nm. The presence of smaller mesopores in the composite oxides, when comparing with SiO
2 and Al
2O
3 samples, is also confirmed for 30-SiO
2-Al
2O
3 and 75-SiO
2-Al
2O
3 powders.
Nitrogen adsorption–desorption isotherms changed from IV types for low content silica sample to a combination of type I and IV for 75-SiO
2-Al
2O
3, indicating a bimodal porous structure for this powder. The 75-SiO
2-Al
2O
3 sample also showed the highest volume of N
2 adsorption at low P/P
0 < 0.4, which reflects the presence of micropores along with mesopores in its structure. This is confirmed by data presented in
Table 1: except 75-SiO
2-Al
2O
3, all samples present a high percentage (>93%) of mesoporous volume with respect to the total porous volume. 75-SiO
2-Al
2O
3 is characterised by small-sized mesopores (2−5 nm) and an H4-type hysteresis loop characteristic of narrow slip-like pores. 30-SiO
2-Al
2O
3 showed IV-type isotherms with only a slight decrease in the N
2 adsorption rate at the end of isothermal adsorption. The hysteresis loop is close to a H2 type, associated with pores with narrow necks and wide bodies (ink-bottle pores). Diffusion into/from ink-bottle pores is directly related to the width of the neck and may become the rate-determining step for the catalytic process. It is worth mentioning that not only the particular pore shapes but also the connectivity of the pore network plays an important role in determining the extent of hysteresis [
21]. 30-SiO
2-Al
2O
3 showed quite narrow pore-size distributions, centred at 5.7 nm.
A similar isotherm type with a smaller volume of N
2 adsorption was also observed for the θ-Al
2O
3 sample, which showed a H3 type hysteresis loop often associated with aggregates of plate-like particles, giving rise to slip-shaped pores. θ-Al
2O
3 was characterised by a broad distribution of pores, stretching into the complete mesopore regime, with a main contribution of 13.1 nm pore size, as shown in
Figure 2B.
As summarised in
Table 1, the BET surface area of fresh materials increases in the order θ-Al
2O
3 < γ-Al
2O
3 < 5-SiO
2-Al
2O
3 ≈ SiO
2 < 30-SiO
2-Al
2O
3 < 75-SiO
2-Al
2O
3, whereas the total porous volume follows a different trend: 75-SiO
2-Al
2O
3 < θ-Al
2O
3≈ 5-SiO
2-Al
2O
3 < 30-SiO
2-Al
2O
3 < γ-Al
2O
3 < SiO
2. No straightforward relationship between the surface area and pore volume could be deduced from the analysis of the obtained results.
The water-ageing treatment induced only very minor changes (slight increase in surface area) in the textural properties of alumina and 30-SiO
2-Al
2O
3 samples, highlighting their structural stability in the presence of humidity. Note that such a treatment was not performed for pure SiO
2 powder. Water-aged 75-SiO
2-Al
2O
3 showed a reduction in both surface area and pore volume. This may be caused by either the coalescence of microparticles to form larger particles, or by the partial filling/blockage of micropores by water molecules, the removal of which was not complete at an outgassed temperature of 300 °C. The decrease in the average pore diameter observed for all materials could be related to the partial blockage of mesopores. The shape of the sorption isotherm remained unchanged (not shown here for the clarity of
Figure 2A). The similar pore-size distribution of fresh and aged samples could be explained by the variation in the BET surface areas and the pore volumes proportionally to each other.
Interestingly, structural changes of the 5-SiO
2-Al
2O
3 catalyst caused by hot water ageing included the increase in surface area, the disappearance of the residual microporosity and a pore distribution shift towards lower sizes (
Table 1 and
Figure 2B). A slight increase in BET surface area was already reported in the literature for SiO
2-Al
2O
3 with low loading silica [
24] and is explained by structural changes occurring in alumina under hot water. The Al content in 5-SiO
2-Al
2O
3 is high enough to allow its partial reorganisation with the possible formation of gibbsite or boehmite phases, although not detected by XRD.
2.2. Acid–Base Properties of Alumina-Based Catalysts
Adsorption constitutes the primary step of every catalytic reaction involving solid catalysts. Understanding the nature of the adsorbate–adsorbent interaction provides useful insight into the properties of the solid surface. The acidic and basic character of different oxides was studied by adsorption microcalorimetry of NH3 and SO2, respectively. The heats evolved are related to the ability of the surface sites to interact with the probe molecules and provide a valuable insight into the strength and distribution of exposed sites.
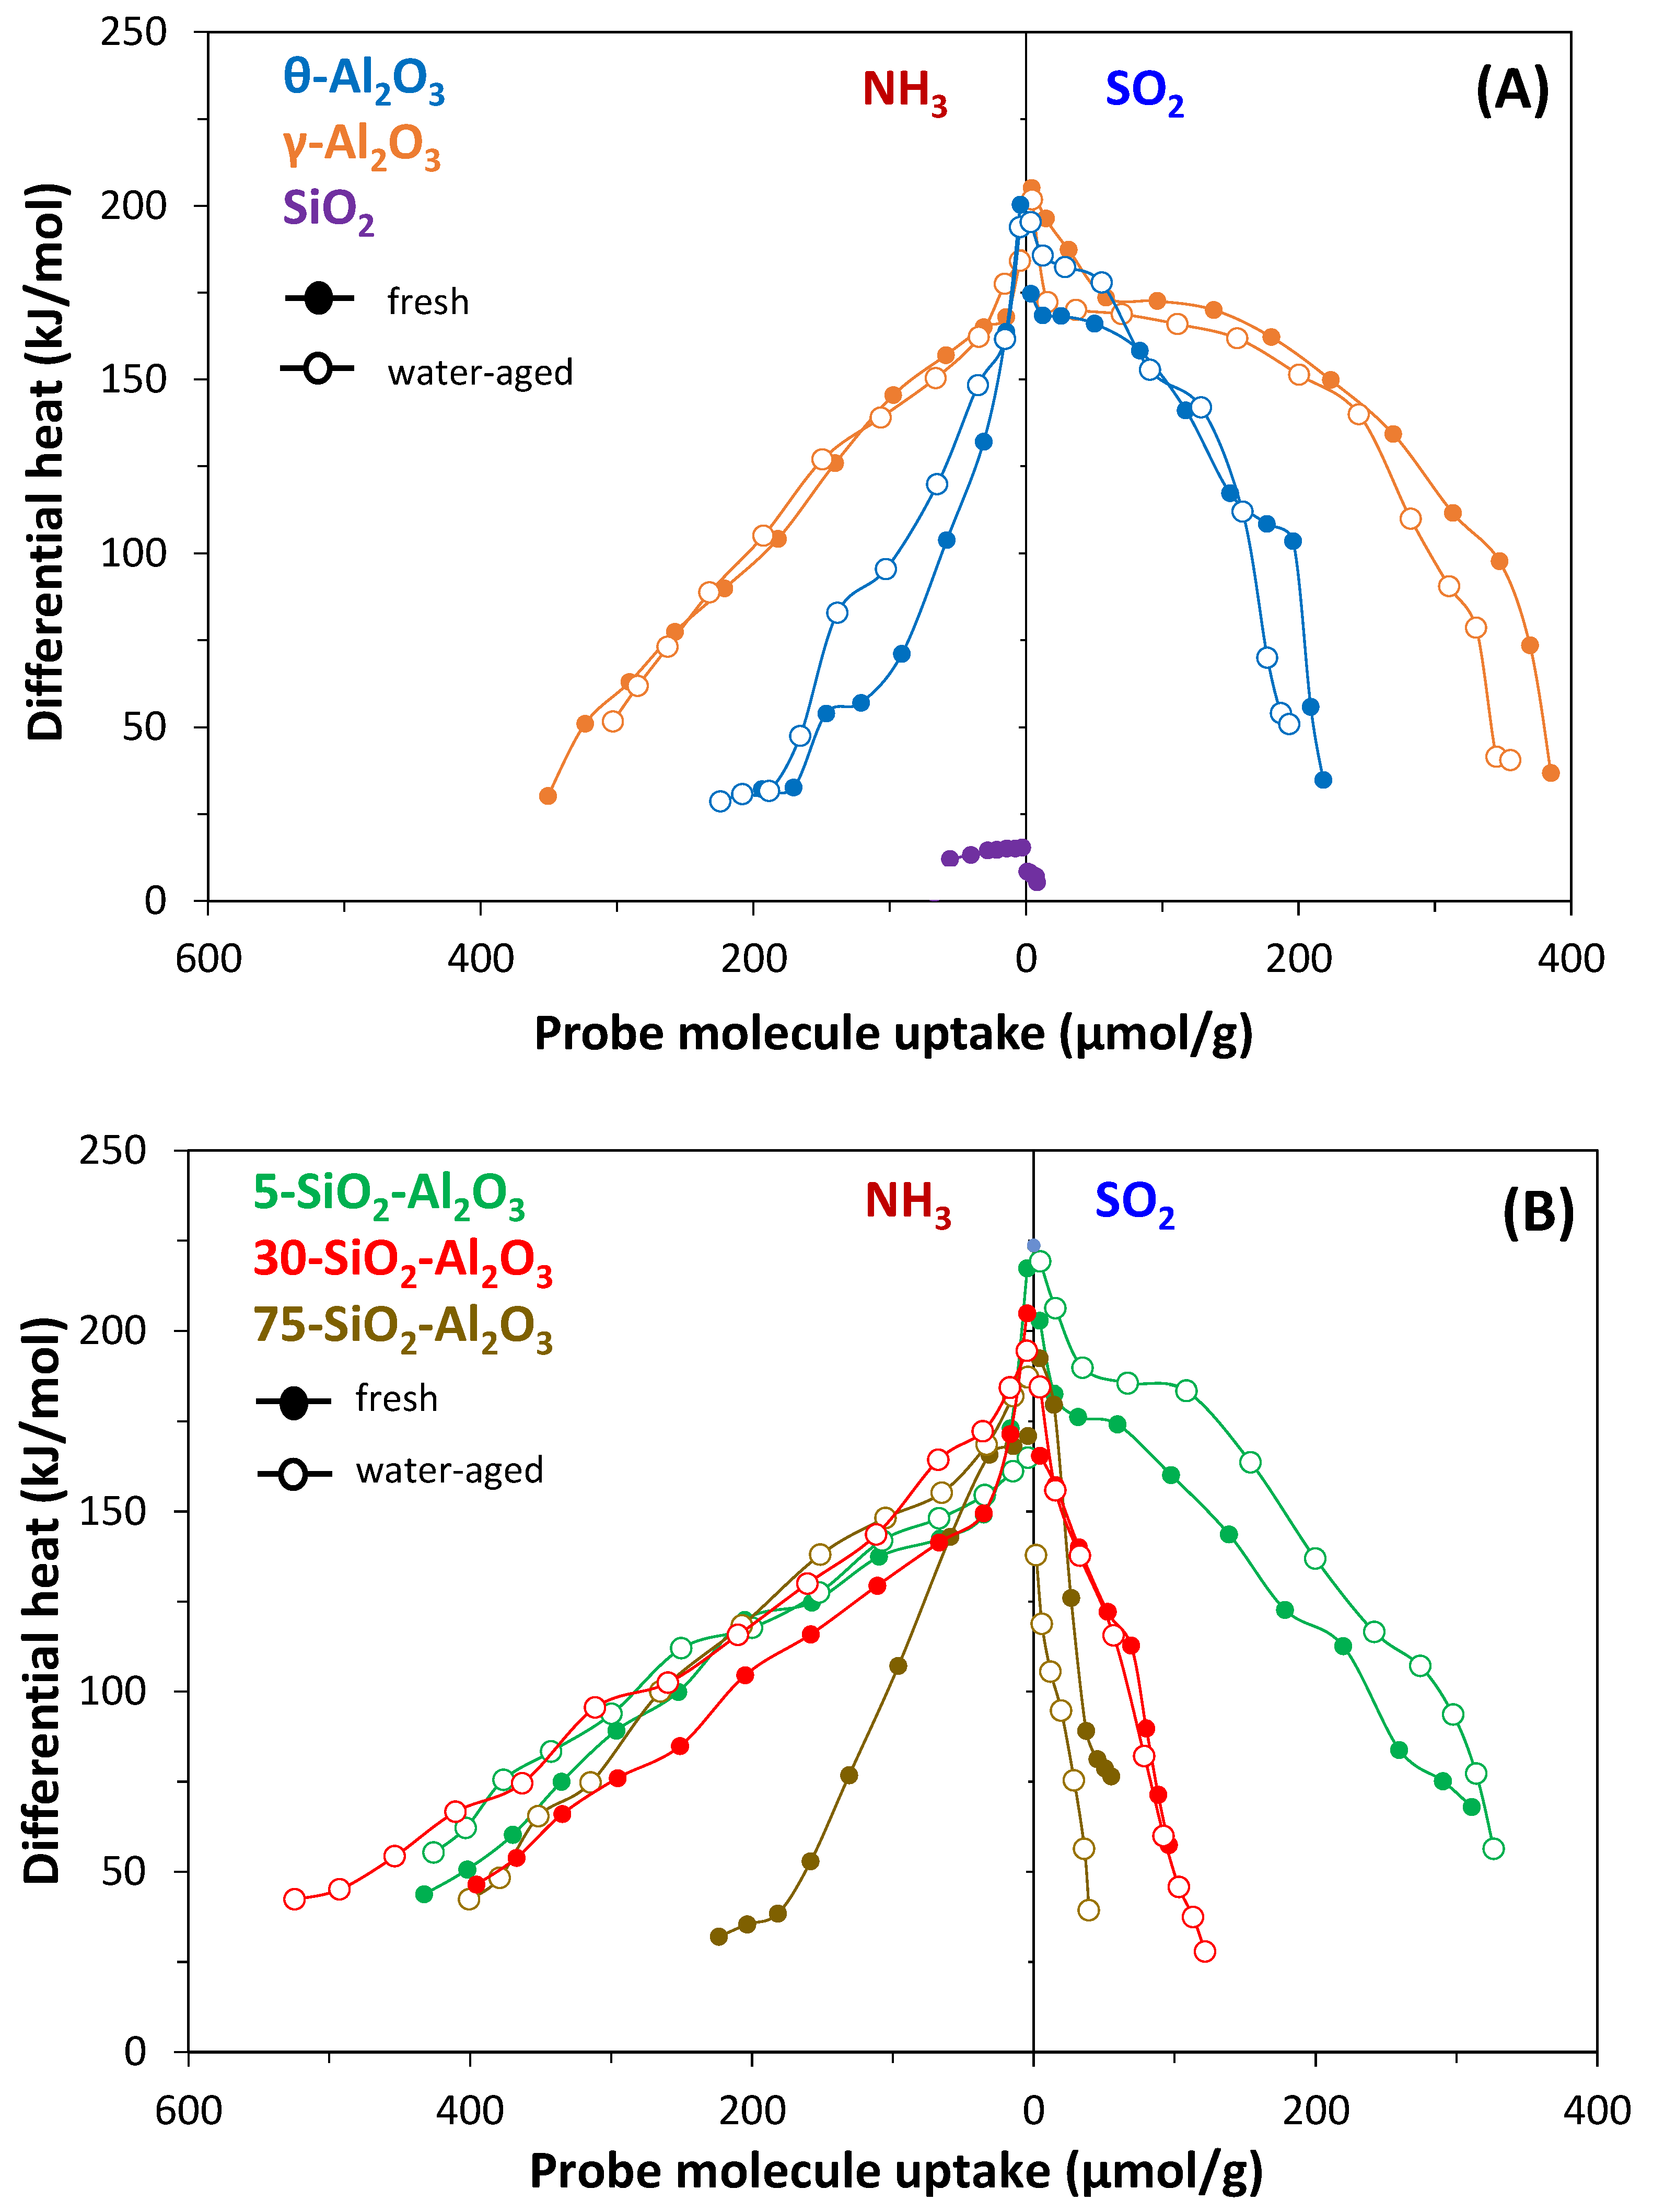
The differential heats of NH
3 and SO
2 adsorption curves vs. coverage are represented in
Figure 3A for pure oxides and in
Figure 3B for the silica–alumina catalysts. All samples except SiO
2 show similar features regarding NH
3 adsorption with high initial differential heats (170−200 kJ/mol) related to ammonia adsorption on the strongest sites, followed by a continuous drop in the differential heats with increasing coverage due to adsorption on weaker sites. At high coverage, the values of adsorption heats are characteristic of physisorption or hydrogen-bonded NH
3 (Q
diff around 40 kJ/mol). Such behaviour accounts for a heterogeneous distribution of acid site strengths on the solid surface. Both alumina and low-loading SiO
2-Al
2O
3 samples displayed a similar density of acid sites (≈0.8 sites/nm
2), while the acidic character of 30- and 75-SiO
2-Al
2O
3 decreased with increasing silica content.
SiO2 presents only very weak and very few homogeneous acid sites.
Alumina surfaces exhibit a remarkable chemical heterogeneity with an almost similar amount and strength of acidic and basic sites and can be considered typical amphoteric solids. After the decrease in the differential heat of SO2 adsorption at very low uptakes, a plateau or a slight decrease in Qdiff values is observed (at about 170 kJ/mol), corresponding to heats released during adsorption on the predominant surface sites. At high coverage, the sharp decrease in Qdiff accounts for the saturation of the chemisorption sites. The three SiO2-Al2O3 solids preserved the amphoteric character of alumina, but the differential heats of SO2 adsorption decreased fast and almost monotonically with increasing uptake. Silica–alumina samples are characterised by a lower number of basic sites and lower values of SO2 adsorption heats on the medium and weak strengths when comparing with pure Al2O3.
Table 2 reports, for the fresh oxides, the total NH
3 and SO
2 adsorption uptakes under an equilibrium pressure of 27 Pa and the chemisorbed ones calculated at the same pressure from the difference between the adsorption and readsorption isotherms (see experimental section). The ratio Q
int,total/n
total was also calculated and reported in
Table 2. Q
int,total is the integral heat representing the total heat of adsorption evolved under an equilibrium pressure of 27 Pa and so is associated with the solid acid or basic site density. Q
int,total/n
total values may be taken as a criterion to compare the average strength of the main exposed acid and basic sites, knowing that the heats of adsorption correspond to an average over all adsorbed surface species. Both Al
2O
3 samples presented similar basicity, in number and strength, when considering their surface areas.
The surface density of acid sites is slightly higher for γ-Al2O3, which also showed the strongest interaction with NH3 between studied oxides. SiO2-Al2O3 samples were characterised by lower surface densities of active sites (sites/nm2) with respect to aluminas, and this gap increases with increasing amounts of SiO2.
The number of strong acid sites (n
irrev(NH
3)) increased with the Si/Al ratio up to 30, when compared with pure γ-Al
2O
3, from 164 to 225 µmol/g (
Table 2). Then, the number of strong acid sites strongly decreased for high silica-loading in 75-SiO
2-Al
2O
3 with 109 µmol/g.
Acid–Base properties were studied in fresh samples but also after water-ageing, except with SiO
2. The evolution of differential heats of NH
3 and SO
2 adsorption at 150 °C with coverage is displayed in
Figure 3A,B.
Table 3 gives the strength distribution of the acid sites.
The water-ageing process produced additional acid sites responsible for the enhanced acid character of SiO2-Al2O3 catalysts, and this becomes more pronounced with the increase in the silica content. For water-aged 75-SiO2-Al2O3, the density of acidic sites is more than doubled in comparison with the fresh sample (0.5 versus only 0.2 sites/nm2 for the fresh sample under an equilibrium pressure of 27 Pa).
New medium and strong acid sites appeared. The increase in the acidic character observed could be caused by the development of partly uncovered alumina on the surface during the hydrothermal treatment. However, no increase in the basic character was observed (
Figure 3B, left side). The increase in acidity could be caused by the formation of new Brönsted sites (e.g., Si(OH)Al, Si-Al(OH)-Si, Q ≈ 100−150 kJ/mol) and of some coordinatively unsaturated aluminium atoms (Q > 150 kJ/mol) in a geometric environment similar to that of Lewis acidic sites on alumina. To a lesser extent, the same behaviour was observed for 30-SiO
2-Al
2O
3, with average density of acid sites increasing from 0.5 sites/nm
2 for the fresh powder to 0.7 for the water-aged one while preserving the basic character. The weak strengths (Q < 100 kJ/mol) of acid sites could be related to the development of Brönsted acid sites such as SiOH or AlOH type during ageing together. 5-SiO
2-Al
2O
3 preserved the amount of acid sites, but a detailed examination of the differential heat curve shows a redistribution of their strengths with the decrease in the number of the weakest sites (Q < 100 kJ/mol) and the increase in the number of medium- (150 > Q > 100 kJ/mol) and high- (Q > 150 kJ/mol) strength sites (
Table 3). It was observed that the strongest basic sites also emerged after hot-water treatment.
Regarding pure aluminas, the results obtained show the overall stability of their acid–base character, although the distribution of the active sites (surface hydroxyls and aluminium cations embedded in a specific neighbourhood [
25]) seems slightly different when comparing water-aged and fresh samples.
The catalytic properties of oxides are intimately linked to their surface properties. The steam added or formed during reaction can induce changes in the acid–base site distribution of silica–alumina solids.
2.3. 29Si and 27Al NMR
The coordination of aluminium and silicon in fresh powders was examined by
27Al and
29Si NMR spectroscopy. The spectra obtained are given in
Figure 4A,B. The
27Al chemical shifts depend primarily on the coordination of aluminium with respect to oxygen. Generally, chemical shifts from 55 to 80 ppm are assigned to tetrahedral coordination of aluminium, while octahedral Al shows a resonance signal at 0−22 ppm [
26].
On the other hand, the
29Si chemical shifts when Si-O ligands are exchanged for Al-O ligands can be used to determine the structure and the degree of homogeneity of SiO
2 distribution in silica–alumina powders [
27].
NMR spectra of
27Al (
Figure 4A) are characterised by an intense resonance signal at 8 ± 0.8 ppm, a large peak at 65,5 ± 0.5 ppm and several spinning side bands. The chemical shifts at 8 and 65 ppm reveal the presence of six- and four-coordinated Al, respectively. The Al
VI/Al
IV ratio varied in the following order: 5-SiO
2-Al
2O
3 (2.2) > 30-SiO
2-Al
2O
3 and γ-Al
2O
3 (2.1) > 75-SiO
2-Al
2O
3 (1.9) > ϴ-Al
2O
3 (1.7). The coordination number of the surface aluminium atoms in SiO
2-Al
2O
3 samples is consistent with the corresponding value of a spinel type of alumina such as γ-Al
2O
3, [
28]. The
27Al signal for 75-SiO
2-Al
2O
3 shows two contributions, at 54.9 and 65.2 ppm, indicating the presence of crystallographically non-equivalent sites for tetrahedral Al (e.g., Al in alumina and aluminium isomorphously substituting Si
4+ in silica).
Figure 4B displays the changes in
29Si chemical shifts with increasing silica content in the mixed oxides. 5-SiO
2-Al
2O
3 showed only one well-defined peak at ca. −78 ppm, a lower frequency shift than expected. Indeed, in NMR studies for amorphous aluminosilicates,
29Si chemical shifts are observed in the region from ca. −83 to −115 ppm [
26,
29]. For example, the chemical shift assignments suggested by Man at al. [
30] are as follows: Q
4[Si(2Al)], Q
3[(SiO)
2(AlO)SiOH] and Q
2[(SiO)
2Si(OH)
2] at −92 ppm; Q
4[Si(1Al)] and Q
3[(SiO)
3SiOH] at −101 to −102 ppm; Q
4[Si(0Al)] at −108 to −111 ppm. In Q
n,
n refers to the number of bridging oxygens around a central silicon atom, while
m in [Si(
mAl)] is the number of Al atoms substituting Si atoms in the first layer. Based on the work of McMillan et al. [
27], the resonance band at −78 ppm seems to represent silica units bonded to the surface of alumina in a strained environment. The authors [
27] observed a good correlation between the stabilisation of the alumina porosity and the amount of the −78 ppm surface framework species formed by silica addition. This result showed that 5-SiO
2-Al
2O
3 is most probably a mechanical mixture of two oxides rather than a solid solution.
For 30-SiO2-Al2O3, a broad resonance band between −80 and −125 ppm was measured, which may be dominated by resonance chemical shifts at −89 and −107 ppm. Such spectra could contain all characteristic signals of silicates from Si(0Al) to Si(4Al). Due to the low signal-to-noise ratio, the distribution of different Si species was not determined.
With increasing the Si content, this band becomes narrower with a maximum at −109 ppm and two visible shoulders at ca. −102 and −92 ppm. Careful fits indicate the presence of 67% of bulk silica (silicon coordinated to four silicate tetrahedra expressed as Si(0Al) at −109 ppm), which may explain the acid character decrease observed by adsorption microcalorimetry. In addition, the resonance peaks at −102 and −92 ppm, in similar proportion (17 and 16%, respectively), are most probably related to [Si(1Al)] and [Si(2Al)] species, respectively. These chemical shifts may also correspond to the terminal (SiO)
3SiOH and the geminal (SiO)
2Si(OH)
2 tetrahedra as well as to (SiO)
2(AlO)SiOH groups [
31].
The
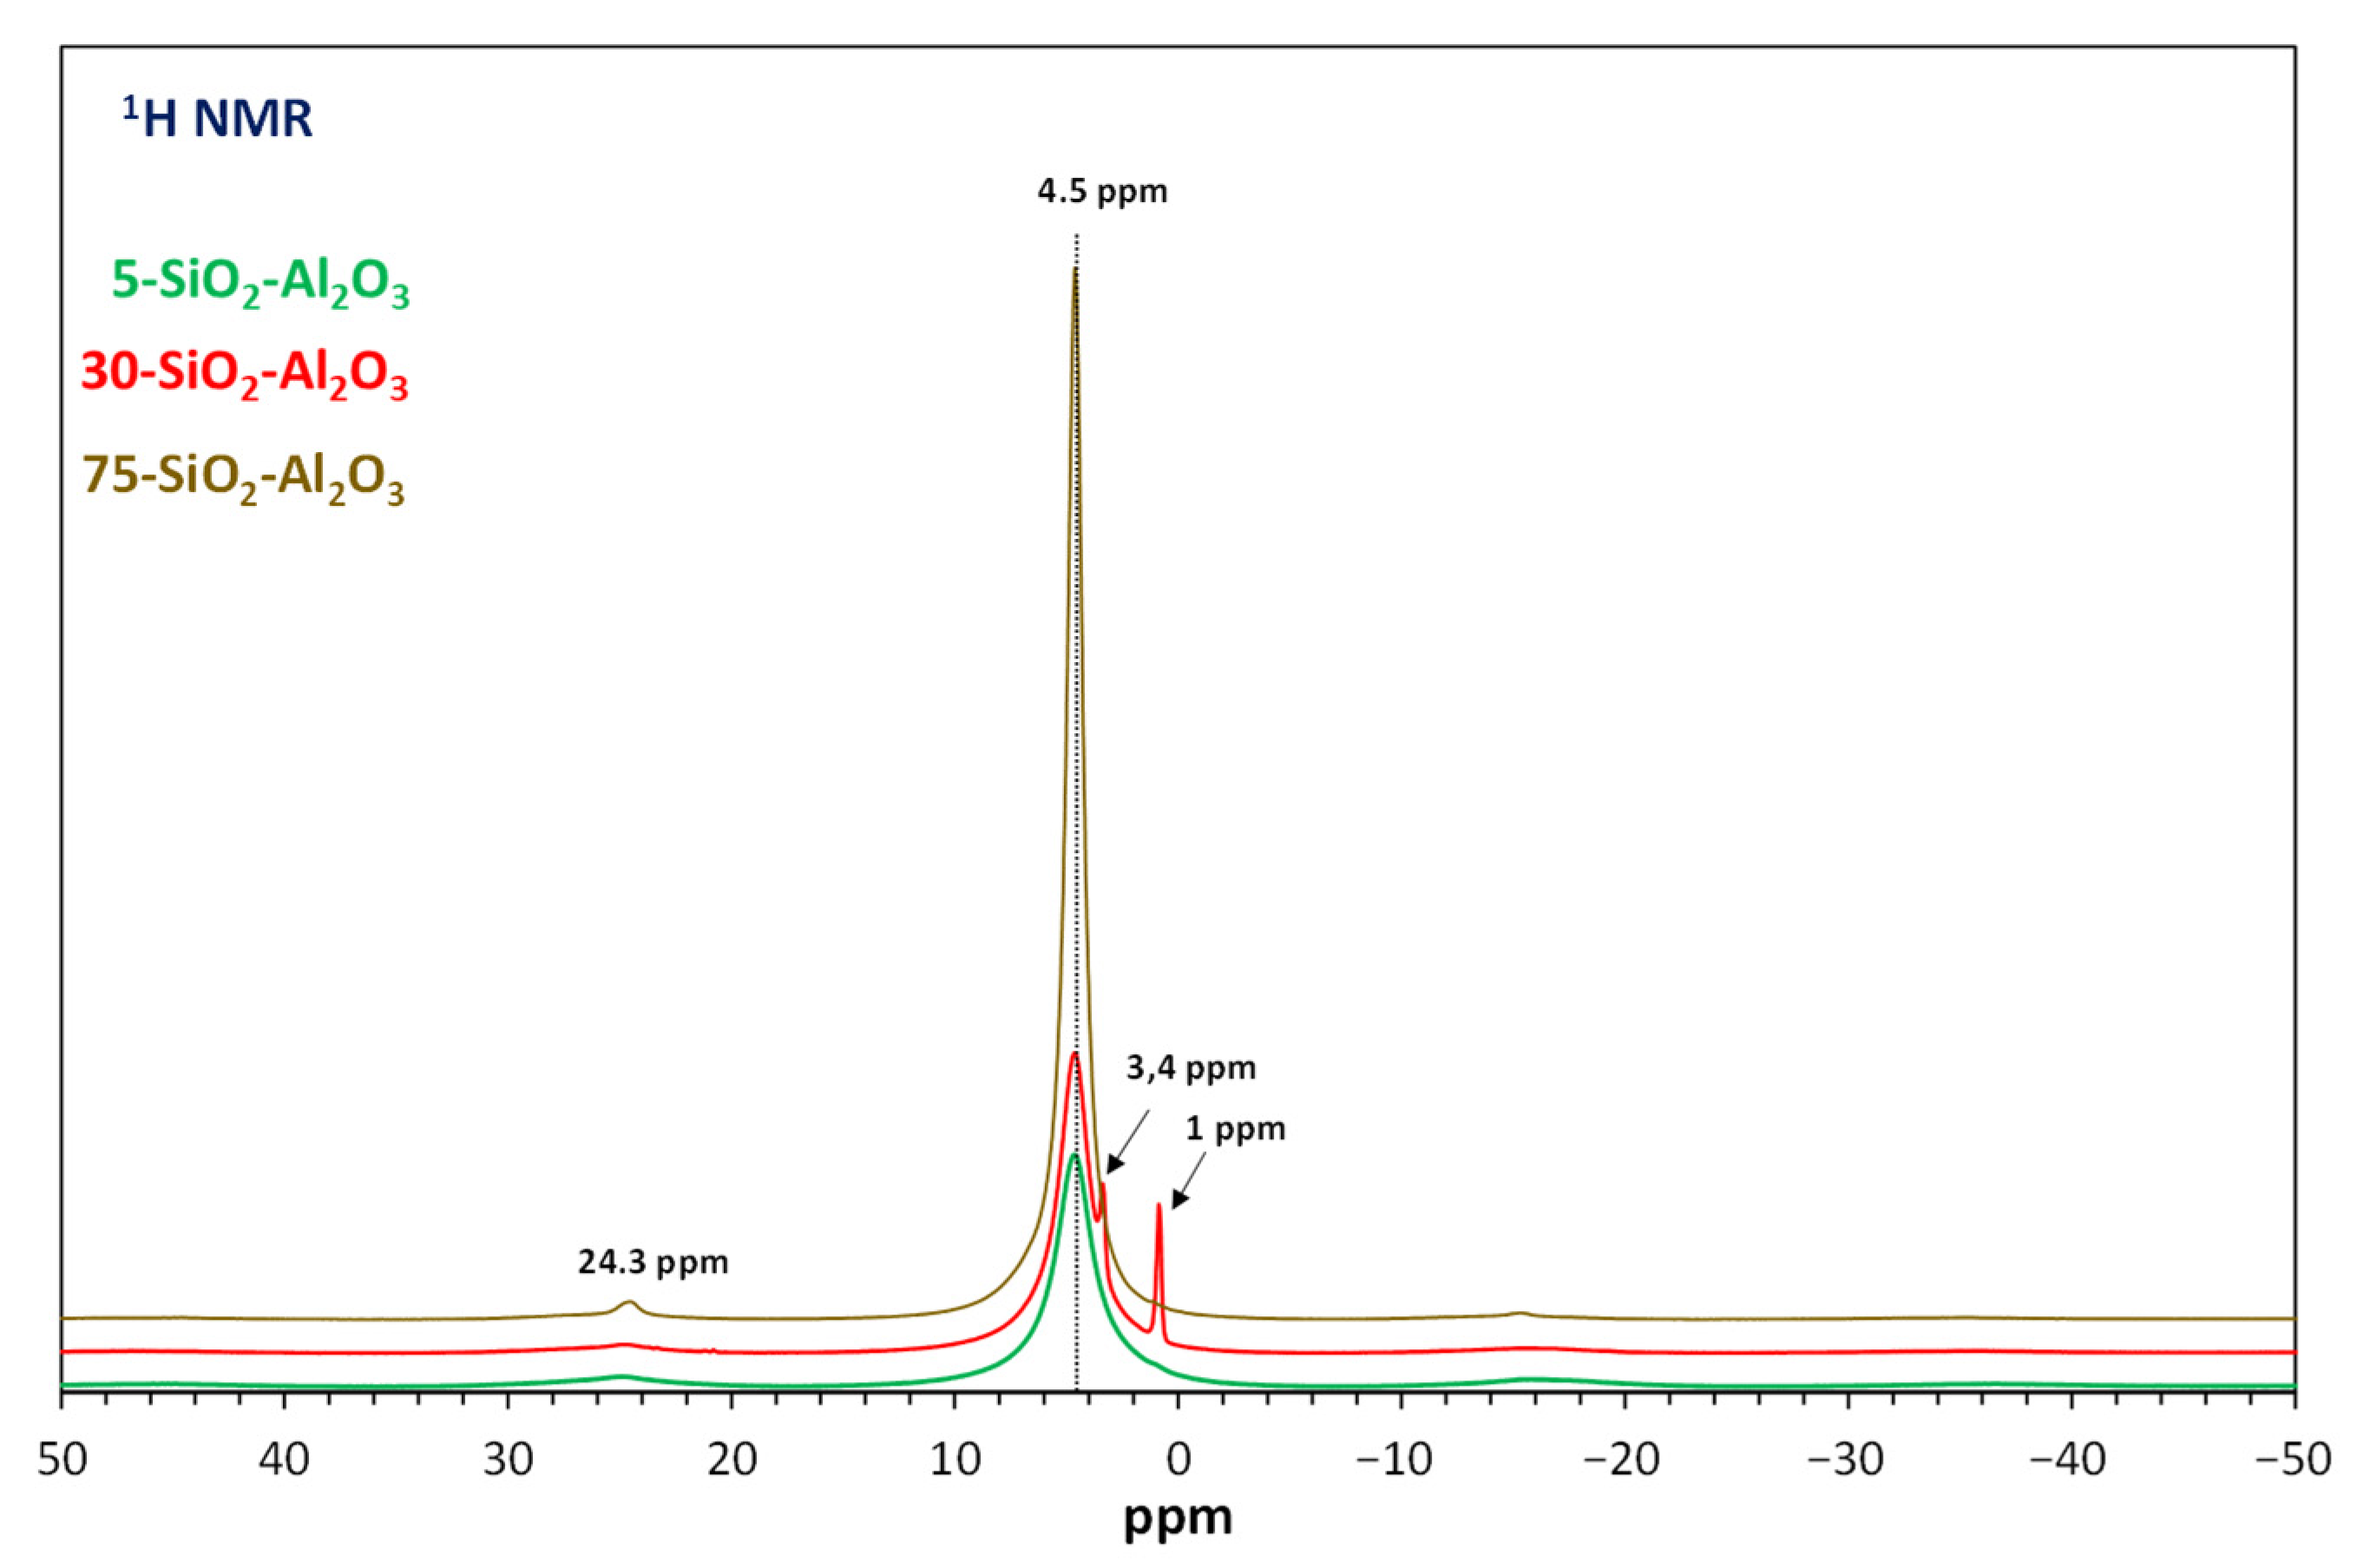
1H MAS-NMR spectra for silica–alumina are displayed in
Figure 5. The shapes of all spectra are qualitatively the same whatever the Si/Al ratio, with one Lorentzian type resonance peak at a chemical shift of ca 4.5 ppm, the intensity of which increases with SiO
2 amount. Dorémieux-Morin et al. [
32] attributed this signal to protons in fast chemical exchange between mainly acidic OH groups and water molecules. The additional Gaussian signals observed for 30-SiO
2-Al
2O
3 could be assigned to silanol groups or to acidic bridging OH groups [
31].
2.4. FTIR Study
The structural characterisation of silica–alumina powders was further performed by Fourier-transformed infrared spectroscopy.
Figure 6 shows the infrared spectra for fresh samples, including pure alumina and silica, and water-aged SiO
2-Al
2O
3. The spectra of alumina powders are similar to those reported in the literature for γ and ϴ phases [
33,
34], being consistent with XRD analysis. γ-Al
2O
3 is characterised by vibrations in the region of 1200−400 cm
−1 with two broad contributions at about 627 and 804 cm
−1. The former one corresponds to the Al-O-Al stretching mode of condensed AlO
6 octahedra, generally occurring in the range of 400−750 cm
−1 [
34]. The second contribution is related with the stretching mode of a lattice of condensed or interlinked AlO
4 tetrahedra reported in the region of 750−900 cm
−1 [
33]. The large bands account for the disorder in the cation distribution in this phase. The additional broad absorption observed as a shoulder in the region 1100−950 cm
−1 is indicative of surface species involving tetrahedral Al cations [
35]. For ϴ-Al
2O
3, the same contributions could be observed at about 573 and 828 cm
−1, partly resolved into several sharp components associated with the ordering of cation vacancies into clusters in octahedral sites (higher crystalline order is achieved in the theta phase when comparing with the defective spinel-type of gamma-phase) [
33,
36]. Both samples are also characterised by (i) a broad band in between 3200 and 3700 cm
−1 assigned to -OH stretching vibration that is bonded to Al
3+ and (ii) a band at ≈ 1630 cm
−1 corresponding to physisorbed water. It is worth mentioning that these two contributions are present in all analysed oxides (
Figure 6). Additionally, SiO
2 showed an intense band at ca. 1100 cm
−1 attributed to asymmetric stretching vibrations of Si-O-Si [
37]. The symmetric stretching vibrations of Si-O-Si and its bending mode were observed at ca. 804 and 471 cm
−1, respectively.
The SiO2-Al2O3 samples showed an IR fingerprint of both silica and alumina components:
(i) The FTIR spectrum of 5-SiO2-Al2O3 shows a similar shape to that observed for γ-Al2O3, with more broad and less defined vibrations, most probably due to the overlapping of bands related to Al-O and Si-O, all appearing in the 1200−400 cm−1 region. The Al-O-Al stretching mode of condensed AlO6 octahedra is clearly observed at ca. 584 cm−1, while the band between 750 and 1000 cm−1 may contain both contributions deriving from lattice AlO4 tetrahedra and stretching vibrations of the Si-O-Al bond. No well-defined absorption related to Si-O-Si stretching bands could be observed.
(ii) With increasing silica content in SiO2-Al2O3, the Si-O stretching vibration mode of Si-O-Si groups appeared at ca. 1077, 800 and 460 cm−1 accompanied by the band characteristic of octahedral coordination of Al3+ ions. The new vibration between 1000 and 800 cm−1 may be related to the interaction of Si and Al atoms with the formation of a SiO2-Al2O3 amorphous phase.
(iii) Though FT-IR spectroscopy could give information about the changes provoked by ageing, the similar features observed for fresh and water-aged powders in
Figure 6B show that the SiO
2-Al
2O
3 structure was minimally affected by the soft hydrothermal process applied.
The nature of the acid character of silica–aluminas was recently reviewed by Busca [
38,
39] based on IR experiments, structural considerations and theoretical studies. Brönsted acid sites were associated with the terminal silanols not bridged but activated by nearby Al
3+ ions. The improved acid character of silica rich water-aged materials could be the result of such medium-strength Brönsted sites formed, together with small numbers of strong Lewis sites, during the hydrothermal treatment by the migration of some aluminium ions in the amorphous silica phase. In 5-SiO
2-Al
2O
3, acid–base couple sites were created by treatment in hot water.
NH
3 adsorption–desorption FT-IR was further used to assess the nature of the acid sites and their strengths. Before adsorption, all samples were thermally treated under oxygen flow up to 400 °C and outgassed under a vacuum at 400 °C. The FT-IR spectra in the OH stretching region after this pre-treatment are displayed in
Figure 7A. 75-SiO
2-Al
2O
3 showed a noisy spectrum and is not displayed in the figure for the clarity reasons. Similarly to what was already reported [
35], the pure Al
2O
3 spectrum shows three well-defined bands at ≈3770, 3726 and 3679 cm
−1, which were assigned, respectively, to (1) terminal OH groups over one tetrahedrally coordinated Al ion, either in a non-vacant environment or near a cation vacancy; (2) terminal OH over an octahedrally coordinated Al ion; and (3) bridging OH groups. Spectra of 5-SiO
2-Al
2O
3 appear similar to those of γ-Al
2O
3, with a band at 3726 cm
−1 showing a tail to higher wavenumbers, in the region of O-H stretching of surface silanol groups. Indeed, over pure silica, this vibration is found at 3745 cm
−1. The increased silica content in the mixed oxides is accompanied by a growth in the surface silanol band, while the absorption related to surface hydroxyl groups bonded to tetrahedral aluminium ions appears only as a shoulder at 3743 cm
−1. The surface phase contains fewer concentrated tetrahedral Al ions with increasing amounts of SiO
2, in accordance with NMR date and calorimetric results.
The IR bands characteristic of the N-H stretching and bending asymmetric/symmetric vibrations in gaseous ammonia are observed, respectively, at 3444/3336 cm
−1 and 1628/950 cm
−1 [
40].
Figure 7B displays the NH
3−FTIR spectra obtained after exposing the outgassed solids to 15 mbars of NH
3 vapour for 1 h, evacuating for 30 min, both at 25 °C, and subtraction of the spectra registered after outgassing treatment at 400 °C. In the O-H stretching frequency region, the adsorption of ammonia gave rise to a large band at ≈3350 cm
−1, partly resolved into several components, with a tail towards lower wavenumbers. The bands at ≈1620 cm
−1 and 1100–1350 cm
−1 in the bending vibration region of ammonia are assigned to NH
3 coordinated species to Lewis acid sites. In the region of low wavenumbers, the band at ≈1440 cm
−1 is characteristic of NH
4+ ions formed at Brönsted acid sites (proton-donating sites of the surface). The intensity of this last band increased with increasing silica content in the mixed oxides.
Since the N-H stretching region is not well-resolved, the differences in spectra of various forms of adsorbed ammonia with the temperature will be further followed in the N-H bending region.
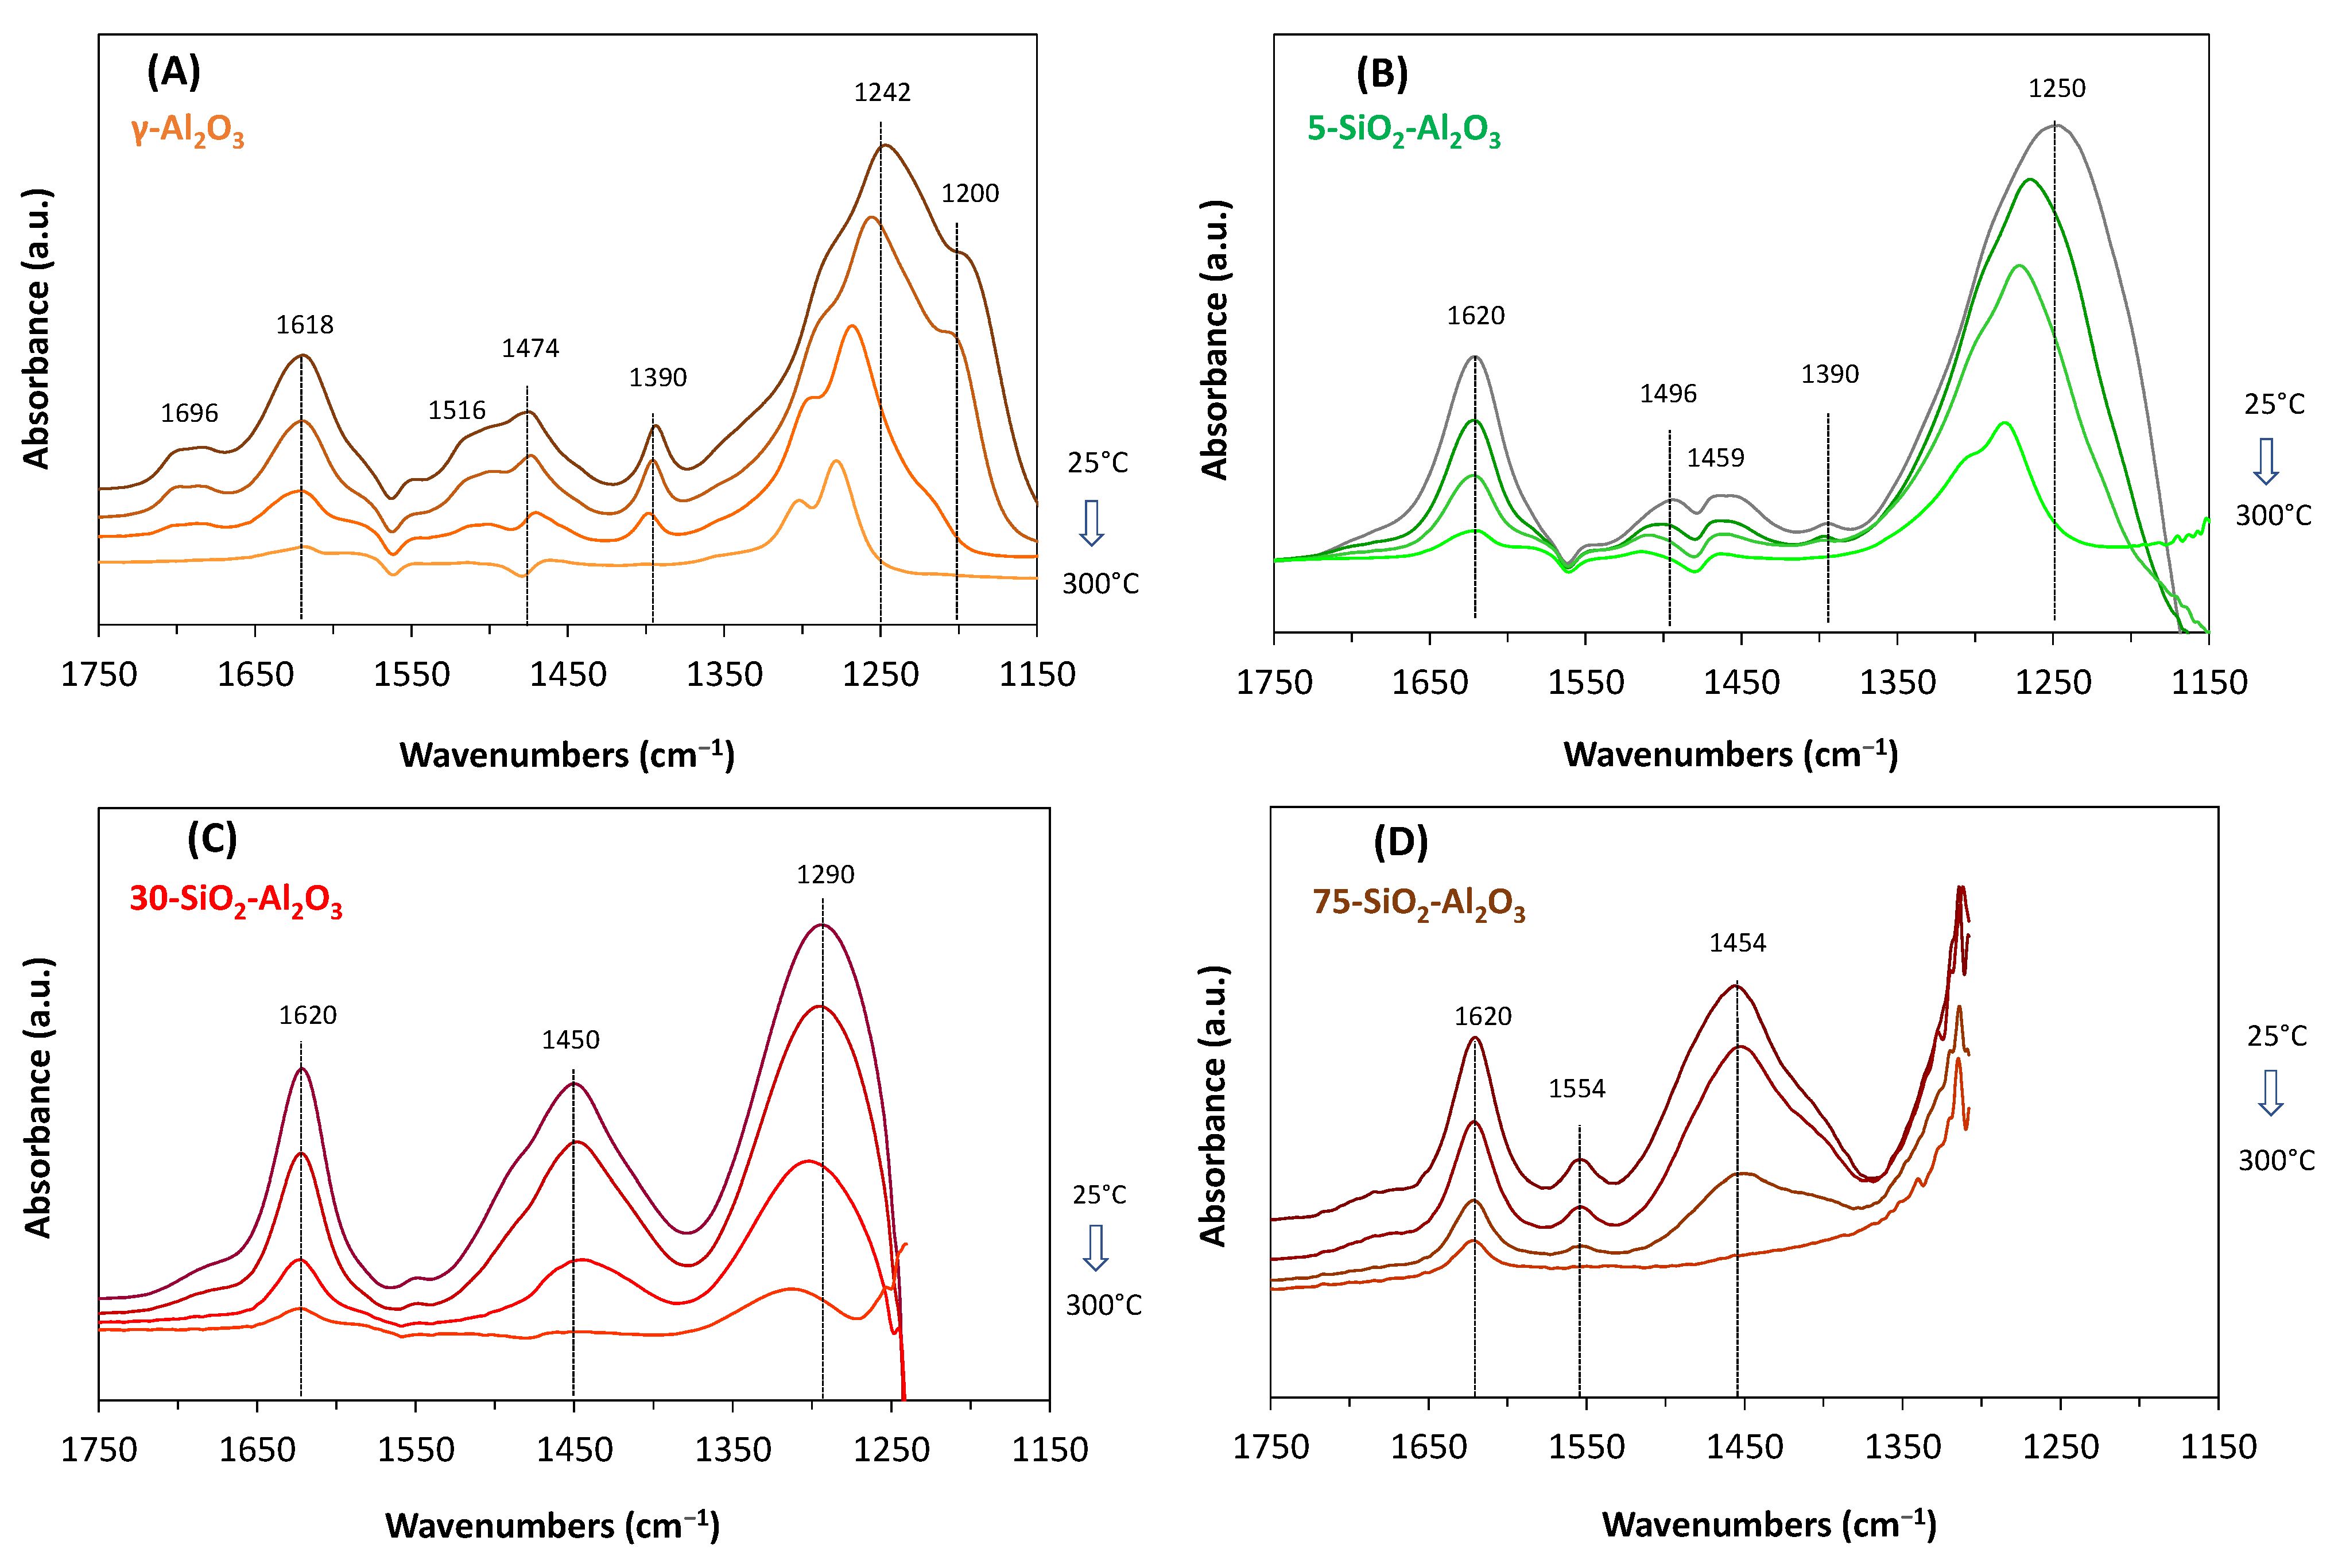
Figure 8 shows the evolution of NH
3 adsorbed species when evacuating the samples at 25, 100, 200 and 300 °C. When NH
3 is admitted to pure alumina samples, bands at ≈ 1242, 1390, 1474, 1618 and 1696 cm
−1 of adsorbed ammonia appeared in the spectrum. As the pumping temperature increases, the intensity of all bands progressively decreases. At 300 °C, all signals vanish, except the band at 1242 cm
−1, which becomes narrower and shifts at higher wavenumbers (1275 cm
−1 at 300 °C). This shift was expected to be related to the strength of the bond formed (the higher the wavenumber, the higher the stability of the bond). Further, the broad band at 1242 cm
−1 with shoulders at ≈1200 and 1280 cm
−1 (broad with shoulders), assigned to coordinated ammonia molecules (symmetric deformation) [
40,
41], is characteristic of heterogeneous Lewis acid sites, in good agreement with adsorption microcalorimetric data. The corresponding asymmetric deformation band of coordinated ammonia species appeared at 1618 cm
−1. Bands found at 1696 cm
−1 (symmetric deformation) and 1474 cm
−1 (asymmetric deformation) are characteristic of NH
4+ ions. The presence of the shoulder at 1516 cm
−1 and the band at 1390 cm
−1, and the assumed the presence of Brönsted acid sites, account for ammonia adsorbed on different OH species. Finally, the small band at ≈1550 cm
−1 accounts for a small amount of -NH
2 surface groups.
The results obtained evidenced that, at the reaction temperature of the targeted application here, the acidity of alumina is mostly of Lewis type with high-strength sites (Q > 150 kJ/mol,
Table 3) as determined by NH
3 adsorption microcalorimetry. However, it is worth mentioning that during catalytic testing (between 200 and 300 °C), water vapours are produced by IPA dehydration, and the strong Lewis acid sites will be partly hydrated. Indeed, the electron-pair vacancy of aluminium is filled by the sharing of one of the free electron-pairs of the oxygen in water, making one of the protons of water readily ionizable, which will react as Brönsted acid sites [
42]. Further, a decrease in the strength of Lewis acid sites on γ-Al
2O
3 is expected under reaction conditions in the presence of water, as found by Li and Shen [
43].
The low-silica-content SiO
2-Al
2O
3 (
Figure 8B) showed similar properties to γ-alumina. Characteristic bands for both NH
3 (1620 cm
−1) and NH
4+ (1496, 1459, 1390 cm
−1) appeared in the spectrum of 5-SiO
2-Al
2O
3 together with a small signal at ≈ 1550 cm
−1. The latter band, assigned to –NH
2 species formation by NH
3 dissociation on a suitable acid–base site, became better-defined with increasing silica content. In all samples, the Lewis acid sites are predominant at 300 °C, while at 200 °C, both Lewis- and Brönsted-type acid sites are present on the surface of SiO
2-Al
2O
3 powders. Larmier et al. [
13] showed that the Brönsted moiety in silica–alumina helps to stabilise the transition state such as the -OH leaving group in isopropanol dehydration when comparing with the naked Al Lewis site. The authors [
13] found that the most likely active acid sites in isopropanol dehydration on amorphous silica–alumina are the so-called “pseudo bridging silanols”, dual sites with both Lewis and Brönsted functions. The synergy between SiOH and Al sites in silica–alumina, leading to the formation of pseudo-bridging silanol groups, was also evidenced by Chizallet and Raybaud [
44].
The fraction of sites that bond NH3 between 200 and 300 °C is expected to play a role in the catalytic performances of studied solids in isopropanol dehydration to propylene.
2.5. Catalytic Conversion of IPA
The catalytic activity of the commercial oxides was initially tested as a function of the reaction temperature in the range of 200–300 °C.
Table 4 shows the IPA conversion and selectivities of the formed products at different temperatures. At 200 °C, the conversion varied between 1.0 % for θ-Al
2O
3 and 100 % 75-SiO
2-Al
2O
3, with PEN being the only product detected. 75-SiO
2-Al
2O
3 showed complete conversion of isopropanol between 200 and 300 °C, while SiO
2 presented low activity in all temperature ranges. For the other alumina-based catalysts, as the temperature increased to 250 °C, the conversion of IPA increased to 100 %, except with θ-Al
2O
3. At 300 °C, the isopropanol was completely converted over all Al
2O
3 catalysts. The high selectivity for propylene formation was preserved at all studied temperatures, with only traces of ACE being detected, mostly at 300 °C. For SiO
2, the increase in the reaction temperature induced the enhancement of the conversion and dehydrogenation pathway, with acetone selectivity up to 21.5%. However, the conversion and yields of PEN and ACE are negligible for pure silica in comparison with Al
2O
3 and SiO
2-Al
2O
3.
At low temperatures, gamma-alumina exhibits 10-fold superior activity to θ-Al
2O
3. Interestingly, both alumina samples present similar average surface densities of 1.01 ± 0.01 basic sites per nm
2 and 0.83 ± 0.02 acid sites per nm
2 when taking into account the total adsorbed SO
2 and NH
3, respectively, under an equilibrium pressure of 27 Pa at 150 °C. Differences found when taking into account the density of the strong chemisorption acid sites (0.47 sites/nm
2 for γ-Al
2O
3 over 0.31 sites/nm
2 for θ-Al
2O
3) and the average strength of the main exposed acid sites (
Table 2, second column), in agreement with the literature findings [
45], can justify the difference of reactivity between the aluminas.
The activity gap between alumina samples decreases with increasing temperature, and at 300 °C, IPA is completely converted on both catalysts in the experimental conditions used here. No further comparison can be made concerning the number and the strength of active sites, since only a fraction of these sites are necessary to achieve full conversion.
Depending on the silica-to-alumina ratio, SiO
2-Al
2O
3 samples presented different characteristics in terms of acid/base (strength and density) and textural properties. As seen in
Table 4, the dehydration efficiency in terms of IPA conversion, at 200 °C, increases with the silica loading. The improvement of the catalytic performance with silica content may be explained by the combined action of the increase in specific surface area of the catalyst, different porous structure and acid/base properties induced by the increase in the Si/Al molar ratio. At 250 and 300 °C, the IPA was completely consumed over all three catalysts.
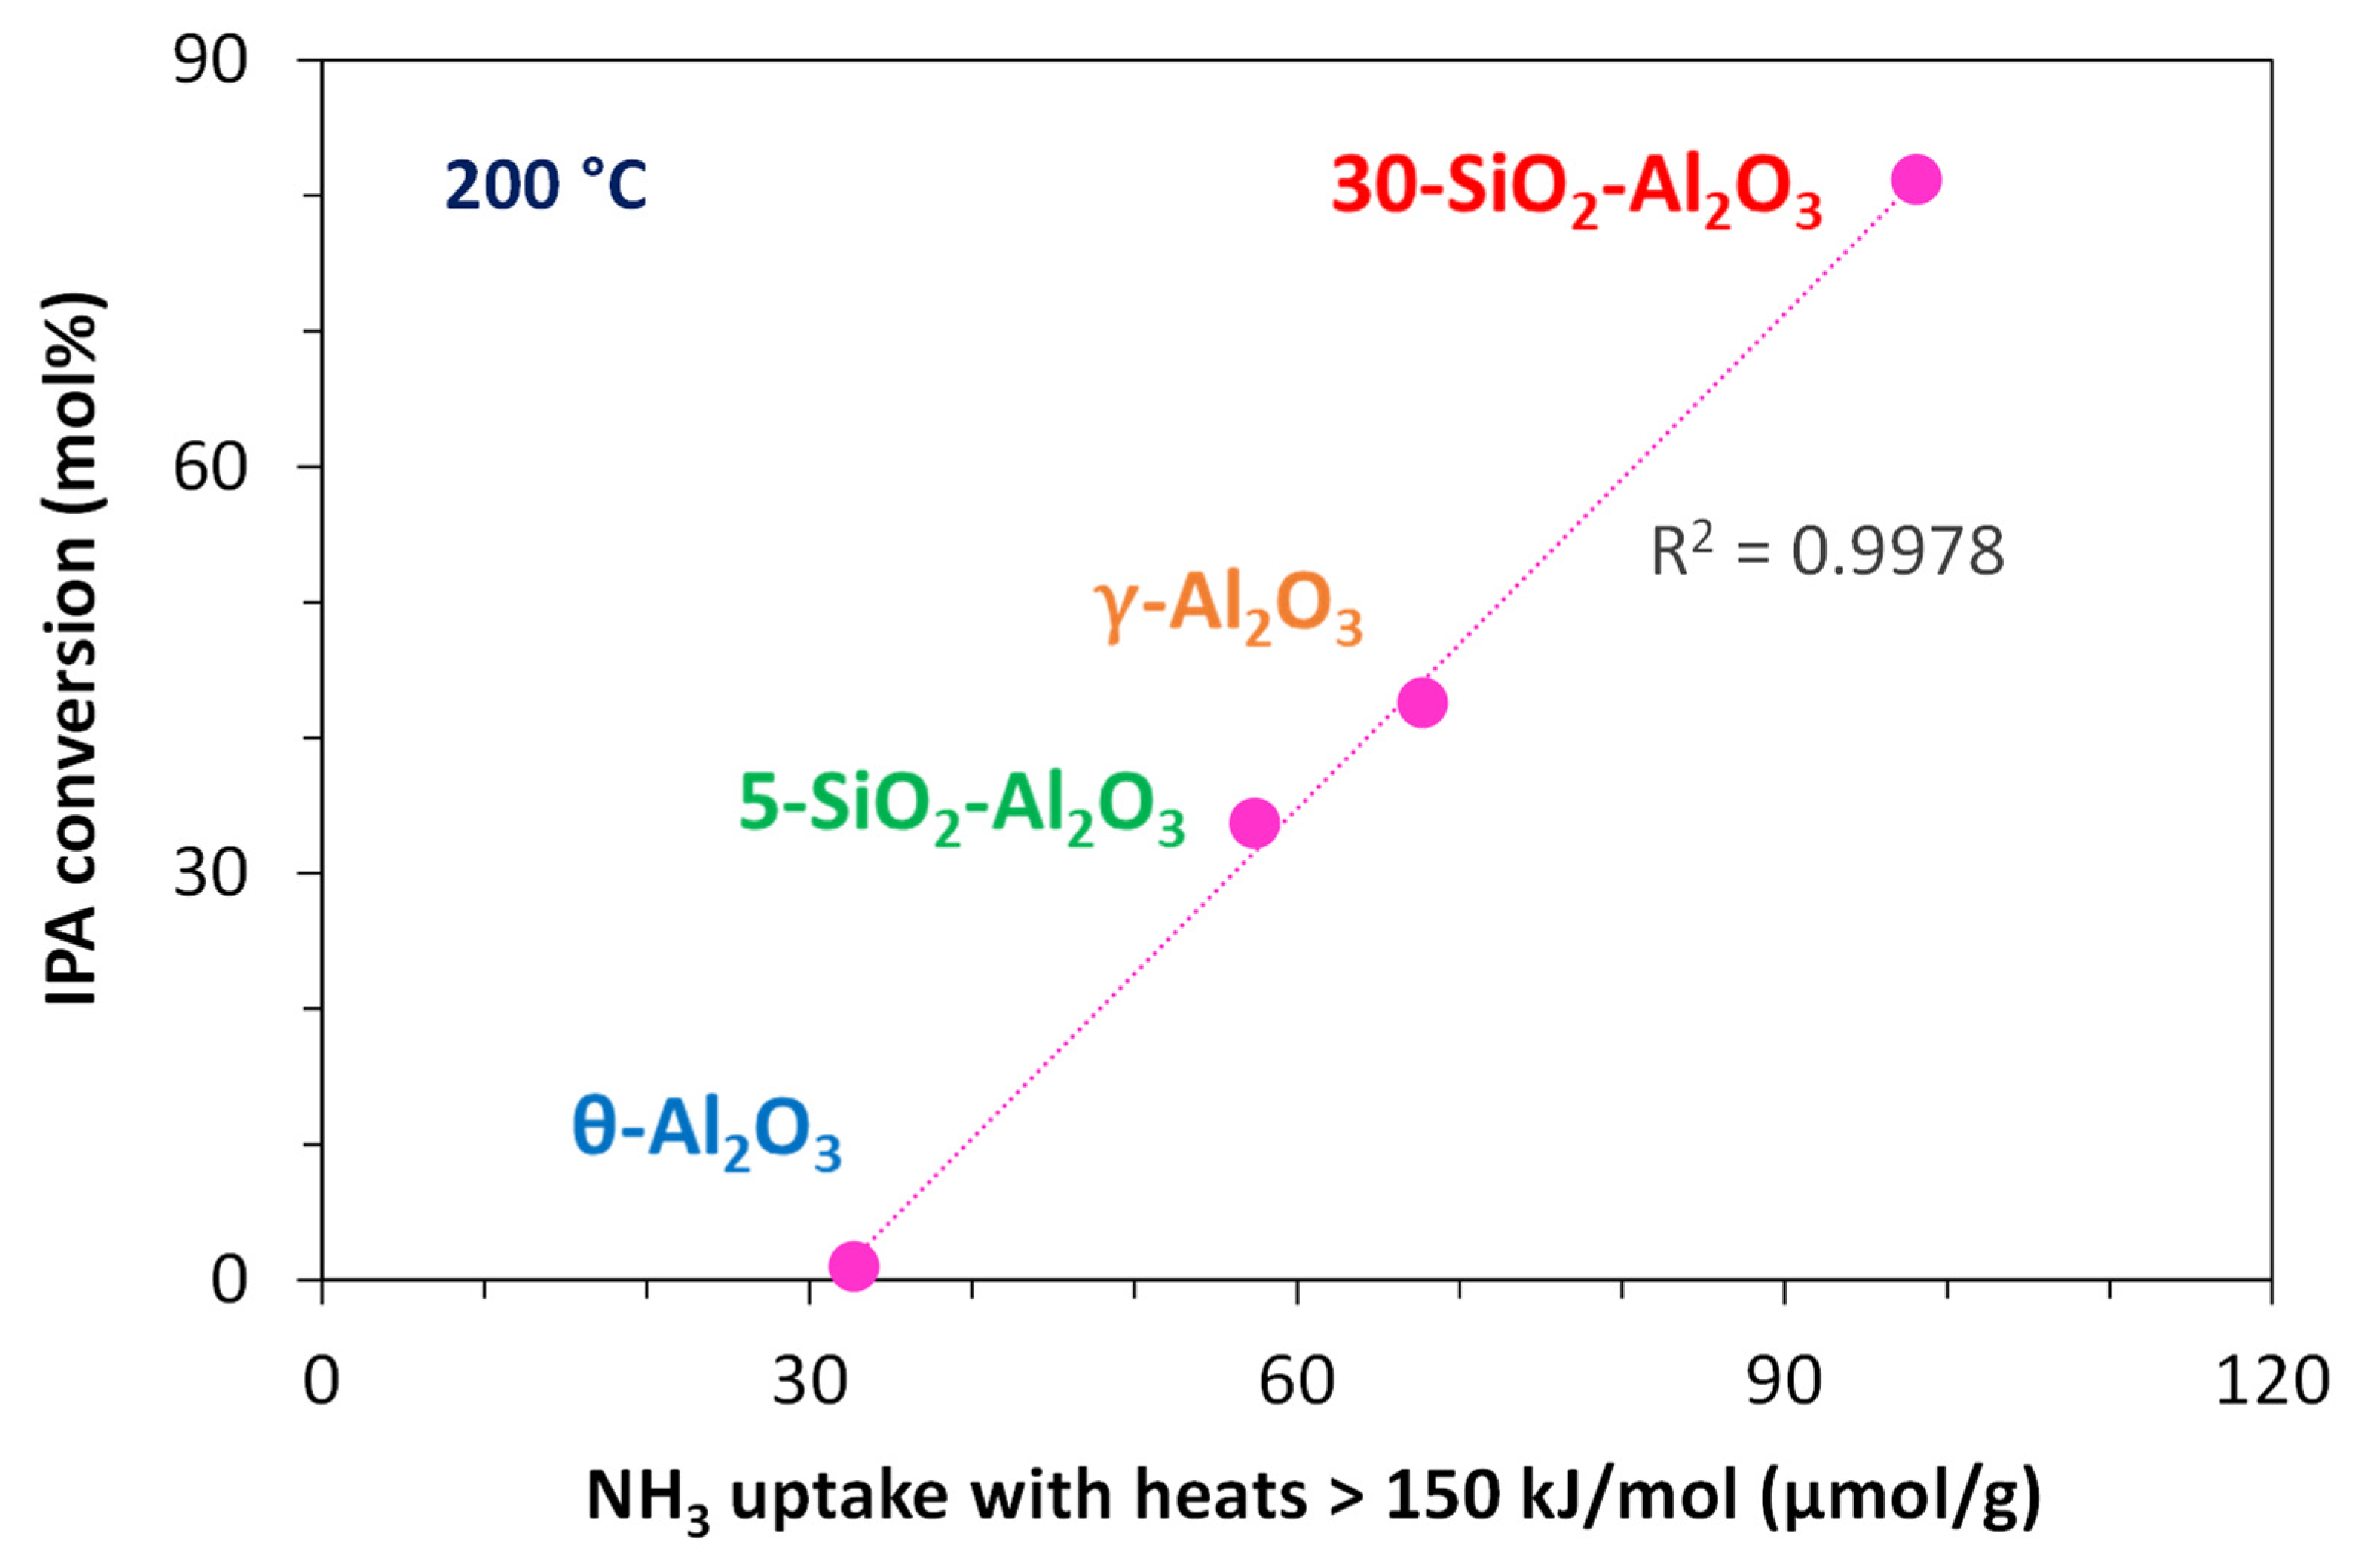
No direct correlation between the number of the total or strong acid sites determined by adsorption microcalorimetry for the fresh samples and the catalytic activity at 200 °C could be established. On the contrary, when comparing the activity results at 200 °C with the adsorption calorimetry data of water-aged powders, it was found that the IPA conversion correlates well with the proportion of high-strength sites (Q > 150 kJ/mol,
Table 3), as seen in
Figure 9.
75-SiO2-Al2O3 catalyst was not considered for this comparison, already giving 100% conversion at 200 °C, while SiO2 was not studied under water-aged conditions.
Although the highest conversions were measured for 75-SiO2/Al2O3, it should be noted that this catalyst suffered the most significant changes in the textural and acid properties during hydrothermal treatment. Compared with 30-SiO2-Al2O3, fresh and water-aged 75-SiO2/Al2O3 samples are characterised by a lower density of acid/base sites but present a higher BET surface area and a narrower distribution of pore size with both micro-and meso-pores.
Although the catalytic activity of solid acids may also be related to their textural properties, no linear-dependence relationship between the converted IPA at 200 °C and the BET surface area, the mean pore diameter or porous volume taken independently could be established. From Mitsui’s patent [
46], the key features of alumina performing in IPA dehydration to PEN are (i) a low content of alkaline metals (less than 0.5 wt.%), (ii) less than 10 wt.% silica, and (iii) a mean pore diameter between 3 and 15 nm (preferably 4 to 7 nm) and pore volumes preferably between 0.5 and 0.8 cm
3/g. In the experimental conditions used in this work, such parameters are likely not limiting factors. For example, when comparing the pore-size distribution of tested solids in
Figure 2B and
Table 1 with the kinetic diameters of IPA (0.47 nm), H
2O (0.30 nm) and PEN (0.45 nm) [
47,
48], it can be concluded that the diffusion of a gaseous mixture of reactive and products is not a determining factor of the activity of different catalysts. This is probably because Mitsui operates under pressure, while we operate near atmospheric pressure.
These findings highlight the importance of specific active acid sites, which could be generated in situ, when steam is present in the reaction mixture (here, IPA produces PEN and H
2O), which correlates with catalytic performances at high conversions and in the absence of textural limiting factors. The determination of acid-base characteristics of fresh powders does not give all relevant information for understanding their catalytic activity in the presence of water. Therefore, the nature, number and strength distribution of acid sites must be considered for aged catalysts (solids in contact with water/steam). It is worth noting that for silica-alumina-like catalysts, characterised by a large variety of acid sites, the adsorption microcalorimetry of probe molecules coupled to manometry is a powerful tool (among different techniques used to probe acidity of solids such as TPD [
49], NMR [
50], EPR [
51] and FTIR [
52]) for quantification and further selection of active sites with defined strengths. Between the methods used to determine the acid/base properties of solid catalysts, based on different chemical and physical principles, adsorption microcalorimetry is the most accurate technique for measuring the differential heats of adsorption and so of characterising a catalyst by the energy distribution of its surface sites [
25,
53,
54]. As demonstrated in this study, determining the number of acid sites with different strengths in solids creates the possibility of finding correlations between the acidity and activity of the catalytic systems.
Comparing the performances of studied catalysts to other investigations is not straightforward because of the different reaction temperatures, contact times and inlet gas compositions used, which are different from those optimised for propylene production, coupled with its further transformation into value-added compounds and at industrial scale.
2.6. Conceptual Process Design
Isopropanol dehydration is better performed under pressure if propylene is the targeted end product [
8]. In such a case, the separation of the produced water and remaining isopropanol is facilitated, as propylene is gaseous when other products are liquid.
However, there are a few cases where diluted propylene is a better choice. In the usual selective oxidation of propylene to acrolein, the reaction stream is a mix of propylene, steam, oxygen and nitrogen [
55]. The cited reference indicates the current operating conditions: propylene 8–10 mols%, propylene space velocity 150 h
−1, pressure 1–1.4 Bar gauge (2–2.4 bars abs) and 300–360 °C. The reaction is highly exothermic and practiced in multitubular reactors, as described in the above reference. To control the reaction, steam is usually added to propylene, and diluted air is necessary to operate outside the flammability limits. A feed composition of propylene/steam/O
2/N
2 in a ratio of 8/8/10.5/73.5 is appropriate. As much water as propylene is commonly used. When isopropanol is dehydrated to propylene, it will also generate as much water. The O
2 content could be reformulated as propylene/steam/air/N
2 = 8/8/47/37, for example. So, isopropanol diluted in nitrogen at about 18 vol % concentration is an appropriate stream to feed a dehydration reactor. The reaction products would be immediately mixed with air and sent to the oxidation reactor. Older acrolein reactions (about four decades ago) used a 5 mol% propylene concentration, so more diluted isopropanol is also possible. However, higher concentrations are limited by the heat released in the selective oxidation reaction and to avoid runaway conditions.
Alternatively, isopropanol can be mixed with diluted air and sent to the dehydration reactor. In the most appropriate configuration, the dehydration reaction has to be sufficiently fast so that the contact time required would be a fraction of the contact time needed for the oxidation reaction. The reactor is still the conventional multitubular reactor, but on top of the oxidation catalyst, a thin layer of dehydration catalyst is added. With such a design, the capital cost in an existing unit is minimised, as it is not necessary to replace the expensive multitubular reactor, and the downstream purification unit would remain identical (provided that no new impurities is generated). To simplify a contact time for the dehydration reaction in the range of 0.2–0.4 s is required with a temperature of the catalyst layer at the entrance of the reactor between 200 and 300 °C.
When no catalyst working in such conditions can be found, then a separate reactor for the dehydration reaction is needed with the appropriate residence time and temperature. It operates either in the presence of oxygen or not. The dehydration reaction being endothermic, it benefits from the heat generated by the oxidation reaction, and could be heated either by the molten salt or by the steam produced by the boiler while cooling the salt.
For such an application, it is needed to develop a catalyst working near atmospheric pressure, at a temperature between 200 and 300 °C, eventually in the presence of oxygen. It must operate at very high conversion, as isopropanol would be oxidised to acetone and/or acetic acid in the oxidation reactor, and it must not generate side products that would compromise the acrolein quality. Some acetone and acetaldehyde are possible, as they are already impurities produced in the selective oxidation reaction. Trace amounts of formaldehyde are also possible, as well as a very low concentration of propanaldehyde. It is unexpected to be produced in the dehydration reaction; however, n-propanol could be produced by dehydration–rehydration of propylene. N-propanol is expected to lead to n-propanaldehyde in the selective oxidation reaction. Therefore, it is very important to identify the operating conditions and catalysts that minimise the formation of n-propanol from isopropanol.
