Article

Integrating Carbon-Coated Cu/Cu2O Nanoparticles with Biochars Enabled Efficient Capture and Electrocatalytic Reduction of CO2

1
School of Environmental Science and Engineering, Southwest Jiaotong University, Chengdu 610097, China
2
Department of Energy and Power Engineering, Tsinghua University, Beijing 100084, China
3
School of Chemistry and Life Resources, Renmin University of China, Beijing 100872, China
*
Author to whom correspondence should be addressed.
Catalysts 2025, 15(8), 767; https://doi.org/10.3390/catal15080767
Submission received: 4 July 2025 / Revised: 7 August 2025 / Accepted: 7 August 2025 / Published: 11 August 2025

Abstract

Because the interfacial Cu0/Cu+ in Cu-based electrocatalyst promotes CO2 electroreduction activity, it would be highly desirable to physically separate Cu-based nanoparticles through coating shells and load them onto porous carriers. Herein, multilayered graphene-coated Cu (Cu@G) nanoparticles with tailorable core diameters (28.2–24.2 nm) and shell thicknesses (7.8–3.0 layers) were fabricated via lased ablation in liquid. A thin Cu2O layer was confirmed between the interface of the Cu core and the graphene shell, providing an interfacial Cu0/Cu+. Cu@G cross-linked biochars (Cu@G/Bs) with developed porosity (31.8–155.9 m2/g) were synthesized. Morphology, crystalline structure, porosity, and elemental chemical states of Cu@G and Cu@G/Bs were characterized. Cu@G/Bs captured CO2 with a maximum sorption capacity of 107.03 mg/g at 0 °C. Furthermore, 95.3–97.1% capture capacity remained after 10 cycles. Cu@G/Bs exhibited the most superior performance with 40.7% of FEC2H4 and 21.7 mA/cm2 of current density at −1.08 V vs. RHE, which was 1.7 and 2.7 times higher than Cu@G. Synergistic integration of developed porosity for efficient CO2 capture and the fast charge transfer rate of interfacial Cu2O/Cu enabled this improvement. Favorable long-term stability of the phase/structure and CO2 electroreduction activity were present. This work provides new insight for integrating Cu@G and a biochar platform to efficiently capture and electro-reduce CO2.

1. Introduction

Excessive usage of fossil fuels during the last decade has induced the sharply increasing concentration of carbon dioxide (CO2) in the atmosphere. The concentration of CO2 over 400 ppm nowadays has far exceeded the safe limit of 350 ppm, which disturbs the carbon cycle in nature [1,2]. Excessive CO2 is the main cause of global warming, desertification, and species extinction. To maintain a relatively safe level of CO2, it is necessary to rapidly reduce the net emission of CO2 in a short time period and realize the net zero emission of CO2 around 2050. Among the various carbon sequestration and transformation techniques, electrocatalytic reduction of CO2 is flexible and controllable without external environmental influences, which is an ideal choice to achieve the stable and efficient conversion of CO2 [3,4,5,6]. Specifically, electrolyte and proton sources in electrocatalysis can be recycled and are harmless to the environment. The reduction process can be carried out at an ambient temperature and pressure, which reduces the requirements for equipment and saves on costs [7]. Meanwhile, the electric energy for reduction can be stored in chemical bonds, making it convenient to store and transport. Most products are valuable, including CO and, oxygenated and hydrocarbon fuels [8].
CO2 molecules can be converted into carbon monoxide (CO), formic acid (CH2O2), methanol (CH3OH), acetic acid (C2H4), ethylene (C2H6O), and other chemicals through electrochemical reduction [9,10]. C2 products have higher volume energy densities than C1 products and greater potential for solving energy problems. However, the electrochemical conversion path from CO2 to C2 products is complex, involving many intermediates and a large number of proton and electron transfer processes. The production efficiency of C2 product is significantly lower than that of C1 products. A variety of catalysts have been developed to efficiently catalyze CO2 to produce C2 products recently [11,12,13]. Fierce competition with byproducts significantly reduces the selectivity of C2 products, and the coupling efficiency of low carbon also leads to a poor catalytic activity.
Metal materials were divided into four groups based on the major products of CO2 reduction in aqueous media. On Ni, Fe, and Pt materials, the hydrogen evolution reaction (HER) is the predominant reaction. On Au, Ag, and Zn, CO is the main product. On In, Sn, and Bi, formate is the main product. Cu is the only metal that generates a considerable amount of highly reduced (>2 electrons) products. Although a few Cu-free catalysts are also capable of converting CO2 into highly reduced products, the FEs are substantially lower compared with Cu-based catalysts [14,15,16]. Materials with discrete 3d metal sites, including metal−organic frameworks (MOF), covalent organic frameworks (COF), and single-atom catalysts with metal−Nx motifs embedded in a carbon matrix, are another family of catalysts for CO2 reduction to generate CO as the major product [17,18,19]. By changing the composition or structure of Cu-based catalysts, the number of active sites can be increased, and C-C coupling can be optimized. Then, the electrocatalytic activity and product selectivity of Cu-based catalysts can be adjusted appropriately. At present, the modification strategies for preparing high-performance Cu-based catalysts mainly include alloying, nanostructure modification, heteroatom doping, hydrophilic/hydrophobic adjustment, and monoatomic catalyst preparation. Alloying can provide more binding sites for the reaction intermediates of Cu-based catalysts with variable components. Compared with the single-element composition, alloying showed more excellent activity and selectivity [20,21]. Adjusting the nano-scale structure of Cu-based catalysts can improve their catalytic activity and selectivity [22,23]. The particle size, spatial structure, crystal plane, and surface roughness of Cu-based catalysts have a great influence on its performance. Heteroatom doping can effectively improve the inherent characteristics of Cu-based catalysts and improve the catalytic activity and selectivity of Cu-based catalysts in the process of electrocatalytic CO2 reduction reactions [24,25]. Moreover, the difference in hydrophilicity/hydrophobicity of Cu-based catalysts mainly affects the local environment of the electrode–electrolyte interface, thus changing the electrocatalytic performance of the CO2 reduction reaction [26,27].
The Cu2O catalyst stands out from many catalysts because of its unique adsorption and activation ability for CO2 [28]. The interfacial Cu+/Cu0 plays an essential role in the electroreduction process by improving the sorption of ∗CO intermediates and accelerating the coupling of C–C. Meanwhile, the appropriate oxidation state of Cu in the interface of Cu+/Cu0 suffers from the large current electrolysis operation and the strong reductive condition [29]. Aiming at producing C2 products with high selectivity and maintaining Cu+/Cu0 stability with high activity, the stabilization of interfacial Cu+/Cu0 sites in the electroreduction process would be highly desirable. Encapsulation of Cu2O/Cu nanoparticles (NPs) via physical separation shells is a promising approach to overcome the leaching and extremely active surface of metal NPs. Among various shell materials, including oxides, carbon, and polymers, graphene-based shells stand out because of their excellent electron conduction and chemical/thermal stability [30,31,32]. N-doped, carbon-coated Cu/Cu2O nanoparticles reported by Li et al. presented high selectivity for C2+ products (reaching 70%) with a C2H4 selectivity of up to 40% [33]. Kim et al. prepared N- and B-doped carbon-protected Cu nanoplatform, showing selectivity and up to 82% faradaic efficiency for C2+ products with a partial current density over 320 mA/cm2 and increased stability [34].
Because various technologies have been developed to fabricate core/shell nanostructures, it is challenging to achieve desirable nanostructures and properties of core/shell NPs. Pulsed laser ablation in liquids is a one-step, environmentally friendly and facile approach to fabricating carbon-coated metal NPs [35,36]. The preparation of few-layered graphene-coated Cu/Cu2O NPs via laser ablation has been seldom reported. Moreover, the efficient utilization of nano-sized particles is limited in the long term because of its serious agglomeration. A carrier with a developed surface area and porosity would be favorable to load metal NPs to prevent their agglomeration in aquatic systems [37,38]. Carbon-based materials with large surface areas, diverse structures, high conductivity, and adjustable functional modification can reduce reaction overpotential and improve energy conversion efficiency, making them the first choice for carrying Cu/Cu2O NPs. Compared with carbonaceous materials, including carbon nanotubes, graphene, and activated carbon, biochars (Bs) derived from agricultural and forest residuals have obtained considerable attention due to their much lower cost and larger production amount [39,40,41]. Moreover, the developed porosity of biochars also allows them to capture CO2 efficiently, which was promising for the following electroreduction of CO2 [42].
In this work, aminated, multilayered, graphene-coated Cu (Cu@G) NPs with interfacial Cu+/Cu0 were pre-fabricated via pulsed laser ablation in ammonia solution. Aminated biochars were pre-synthesized from the pyrolysis of urea-soaked corncob at 300 °C, 450 °C, and 600 °C, respectively. Then, Cu@G-loaded biochars (Cu@G/Bs) were successfully prepared via the cross-link using glutaraldehyde. The microstructure, elemental distribution, crystalline structure, porosity, and elemental chemical states of Cu@G NPs and Cu@G/Bs were characterized to confirm the successful preparation. Capture of CO2 as a function of enrichment time, circumstance temperature, and sample species was investigated with kinetic and isothermal fittings. The activity, selectivity, and durability of CO2 electrocatalytic reduction were evaluated.

2. Results and Discussion

2.1. Characterization of Laser-Ablated Cu@G NPs

As shown in Figure 1a–f, NPs with spherical cores and well-coated graphite shells were successfully fabricated via pulsed laser ablation in ammonia-containing solution. Each metallic core was physically separated by graphite shells. Moreover, this specific core/shell nanostructure was confirmed using transmission electron microscopy (TEM)/elemental dispersive spectroscopy (EDS) mapping, as shown in Figure 1c–f. The Cu core presented a typical spherical shape (red color) and was well-encapsulated by the carbon shell (green color) without any core exposure outside. It is worth noting that a thin oxygen shell (gray color) was observed on the surface of the Cu core. The thickness of this gray shell was obviously lower than that of the carbon shell. It is believed that this layer should be attributed to the oxidized Cu layers, which would be Cu2O or CuO.
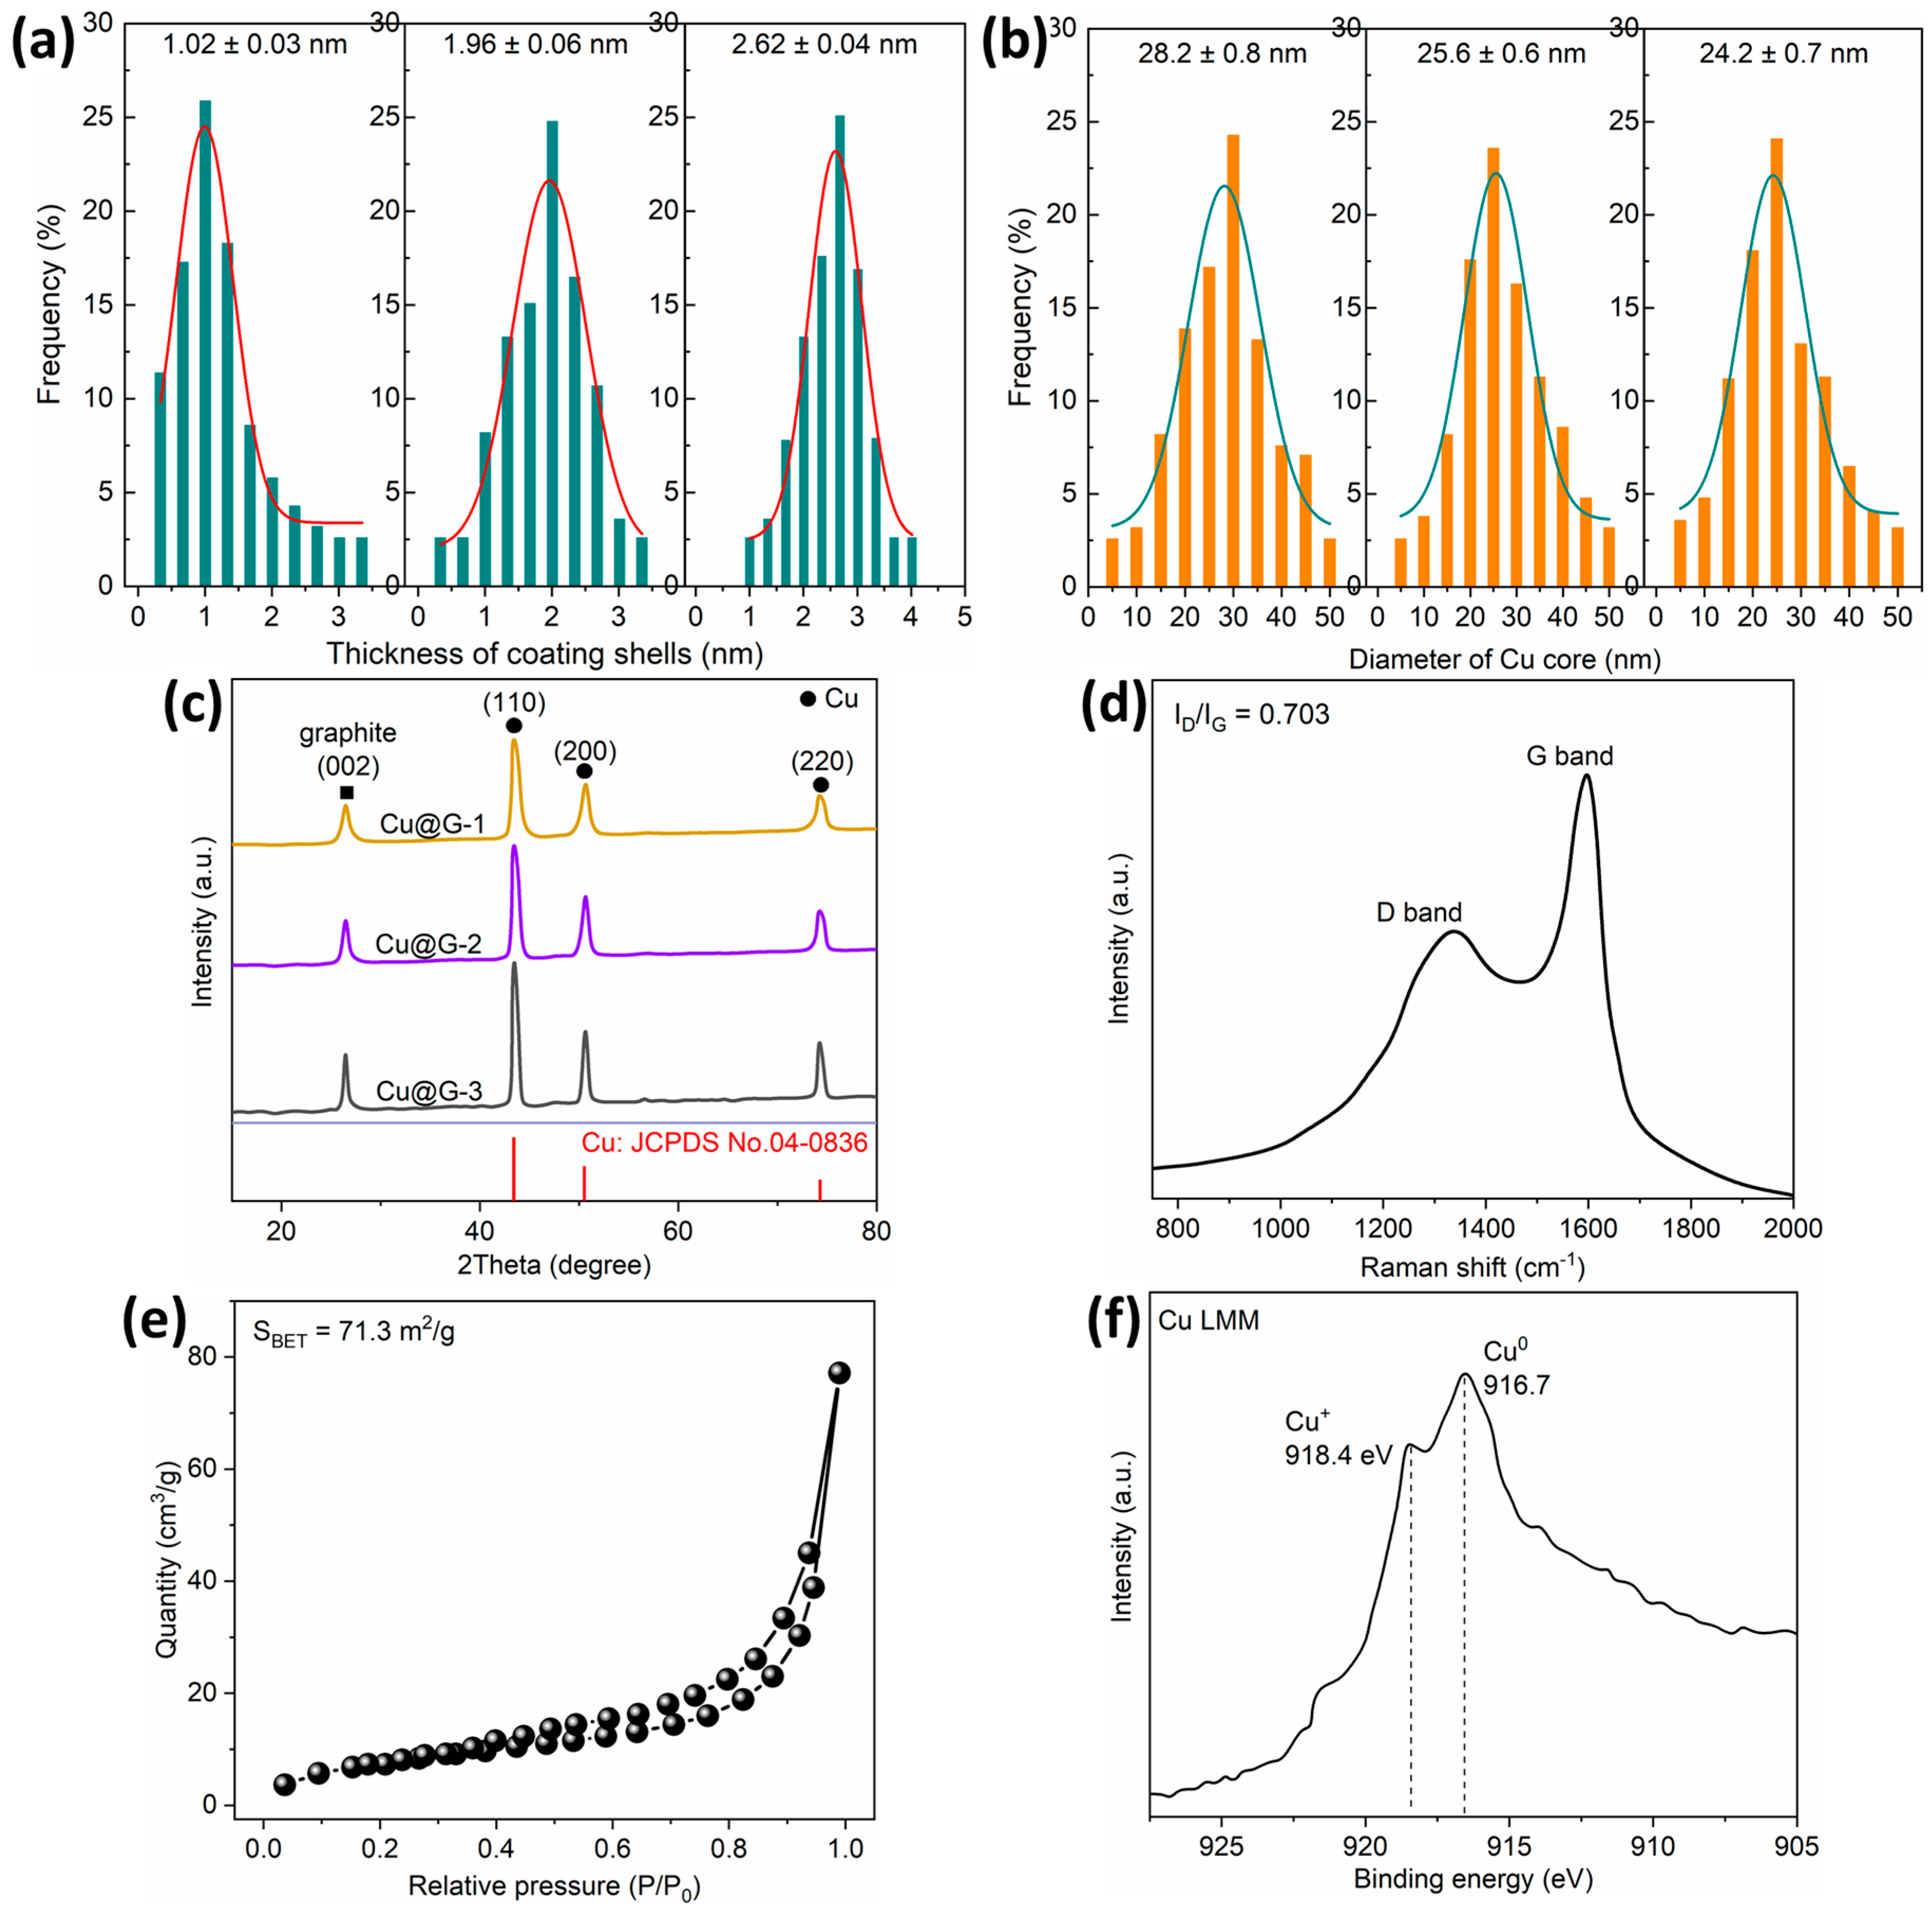
A Gauss model was applied to fit the distribution of the core’s diameter and shell thickness, as shown in Figure 2a,b. The average shell thicknesses were 1.02 ± 0.03 nm for Cu@G-3 NPs, 1.96 ± 0.06 nm for Cu@G-2 NPs, and 2.62 ± 0.04 nm for Cu@G-1 NPs. The theoretical distance of graphite layers was 0.335 nm. Thus, the average layer number of multilayered graphene shells was ~3.0 layers for Cu@G-3 NPs, ~5.9 layers for Cu@G-2 NPs, and 7.8 layers for Cu@G-1 NPs. The average core diameters were 28.2 ± 0.8 nm for Cu@G-3 NPs, 25.6 ± 0.6 nm for Cu@G-2 NPs, and 24.2 ± 0.7 nm for Cu@G-1 NPs. Because the layer number of this graphite was less than 10, we would like to name it multiple layered graphene. As the mass ratio of Cu/graphite in the composite precursor plate for laser ablation increased from 1:1 to 3:1, the core/shell nanostructure of Cu@G NPs evolved with reduced shell thickness. Figure 2c illustrates the diffraction patterns of Cu@G NPs. Diffraction peak at 26.5° was attributed to the (002) reflection of graphite. Diffraction peaks at 43.3°, 50.4°, and 74.8° corresponded to the (111), (200), and (220) reflections of Cu (JCPDS No.04-0836) [43]. As a commonly used standard to evaluate the disorder/graphitic structure in carbonaceous materials, the intensity ratio of the D band and the G band (ID/IG) in the Raman spectrum of Cu@G-3 NPs was 0.703 (Figure 2d). The extent of defective nanostructures in Cu@G-3 NPs was less than many reported carbon-coated metallic NPs [44]. Cu@G-3 NPs presented a high specific SA of 71.3 m2/g, offering abundant reaction sites for the capture and electroreduction of CO2 (Figure 2e). It is worth noting that the mixed chemical state of Cu+/Cu0 was distinctly presented in the Cu LMM spectrum as shown in Figure 2f, which confirmed the coexistence of Cu+/Cu0. Thus, we believed that a thin coating layer of Cu2O existed between the Cu core and the graphene shell.
The regulation of the core/shell nanostructure of Cu@G NPs was explained as follows. When the laser arrived at the pressed composite plate, the precursors in these plates would be gasified instantaneously because of the extremely high temperature induced by the pulsed laser. Cu atoms would collide and merge with each other to form Cu NPs. Carbon atoms would deposit onto the surface of Cu NPs and be catalyzed to form coated multilayered graphene layers due to the catalytic property of Cu NPs at high temperatures. Meanwhile, given the liquid system for the formation of Cu@G NPs, the formed Cu NPs would also react with oxygen in liquid to form Cu2O or CuO on the surface of the Cu core. Once the coated multilayered graphene layer was formed, oxygen would be physically separated from the Cu core. That is why the oxygen was distributed in the interface of the Cu core and the graphene shell. Ammonia-containing solution would also be activated by the laser and form a plasma region as NH3 + e → NH2 + H + e and NH3 + e → NH + H + H + e [45]. Once Cu@G NPs entered the region of the NH3 plasma, NH2 species would be modified on the surface of Cu@G NPs as amino groups.

2.2. Characterization of Cu@G/Bs

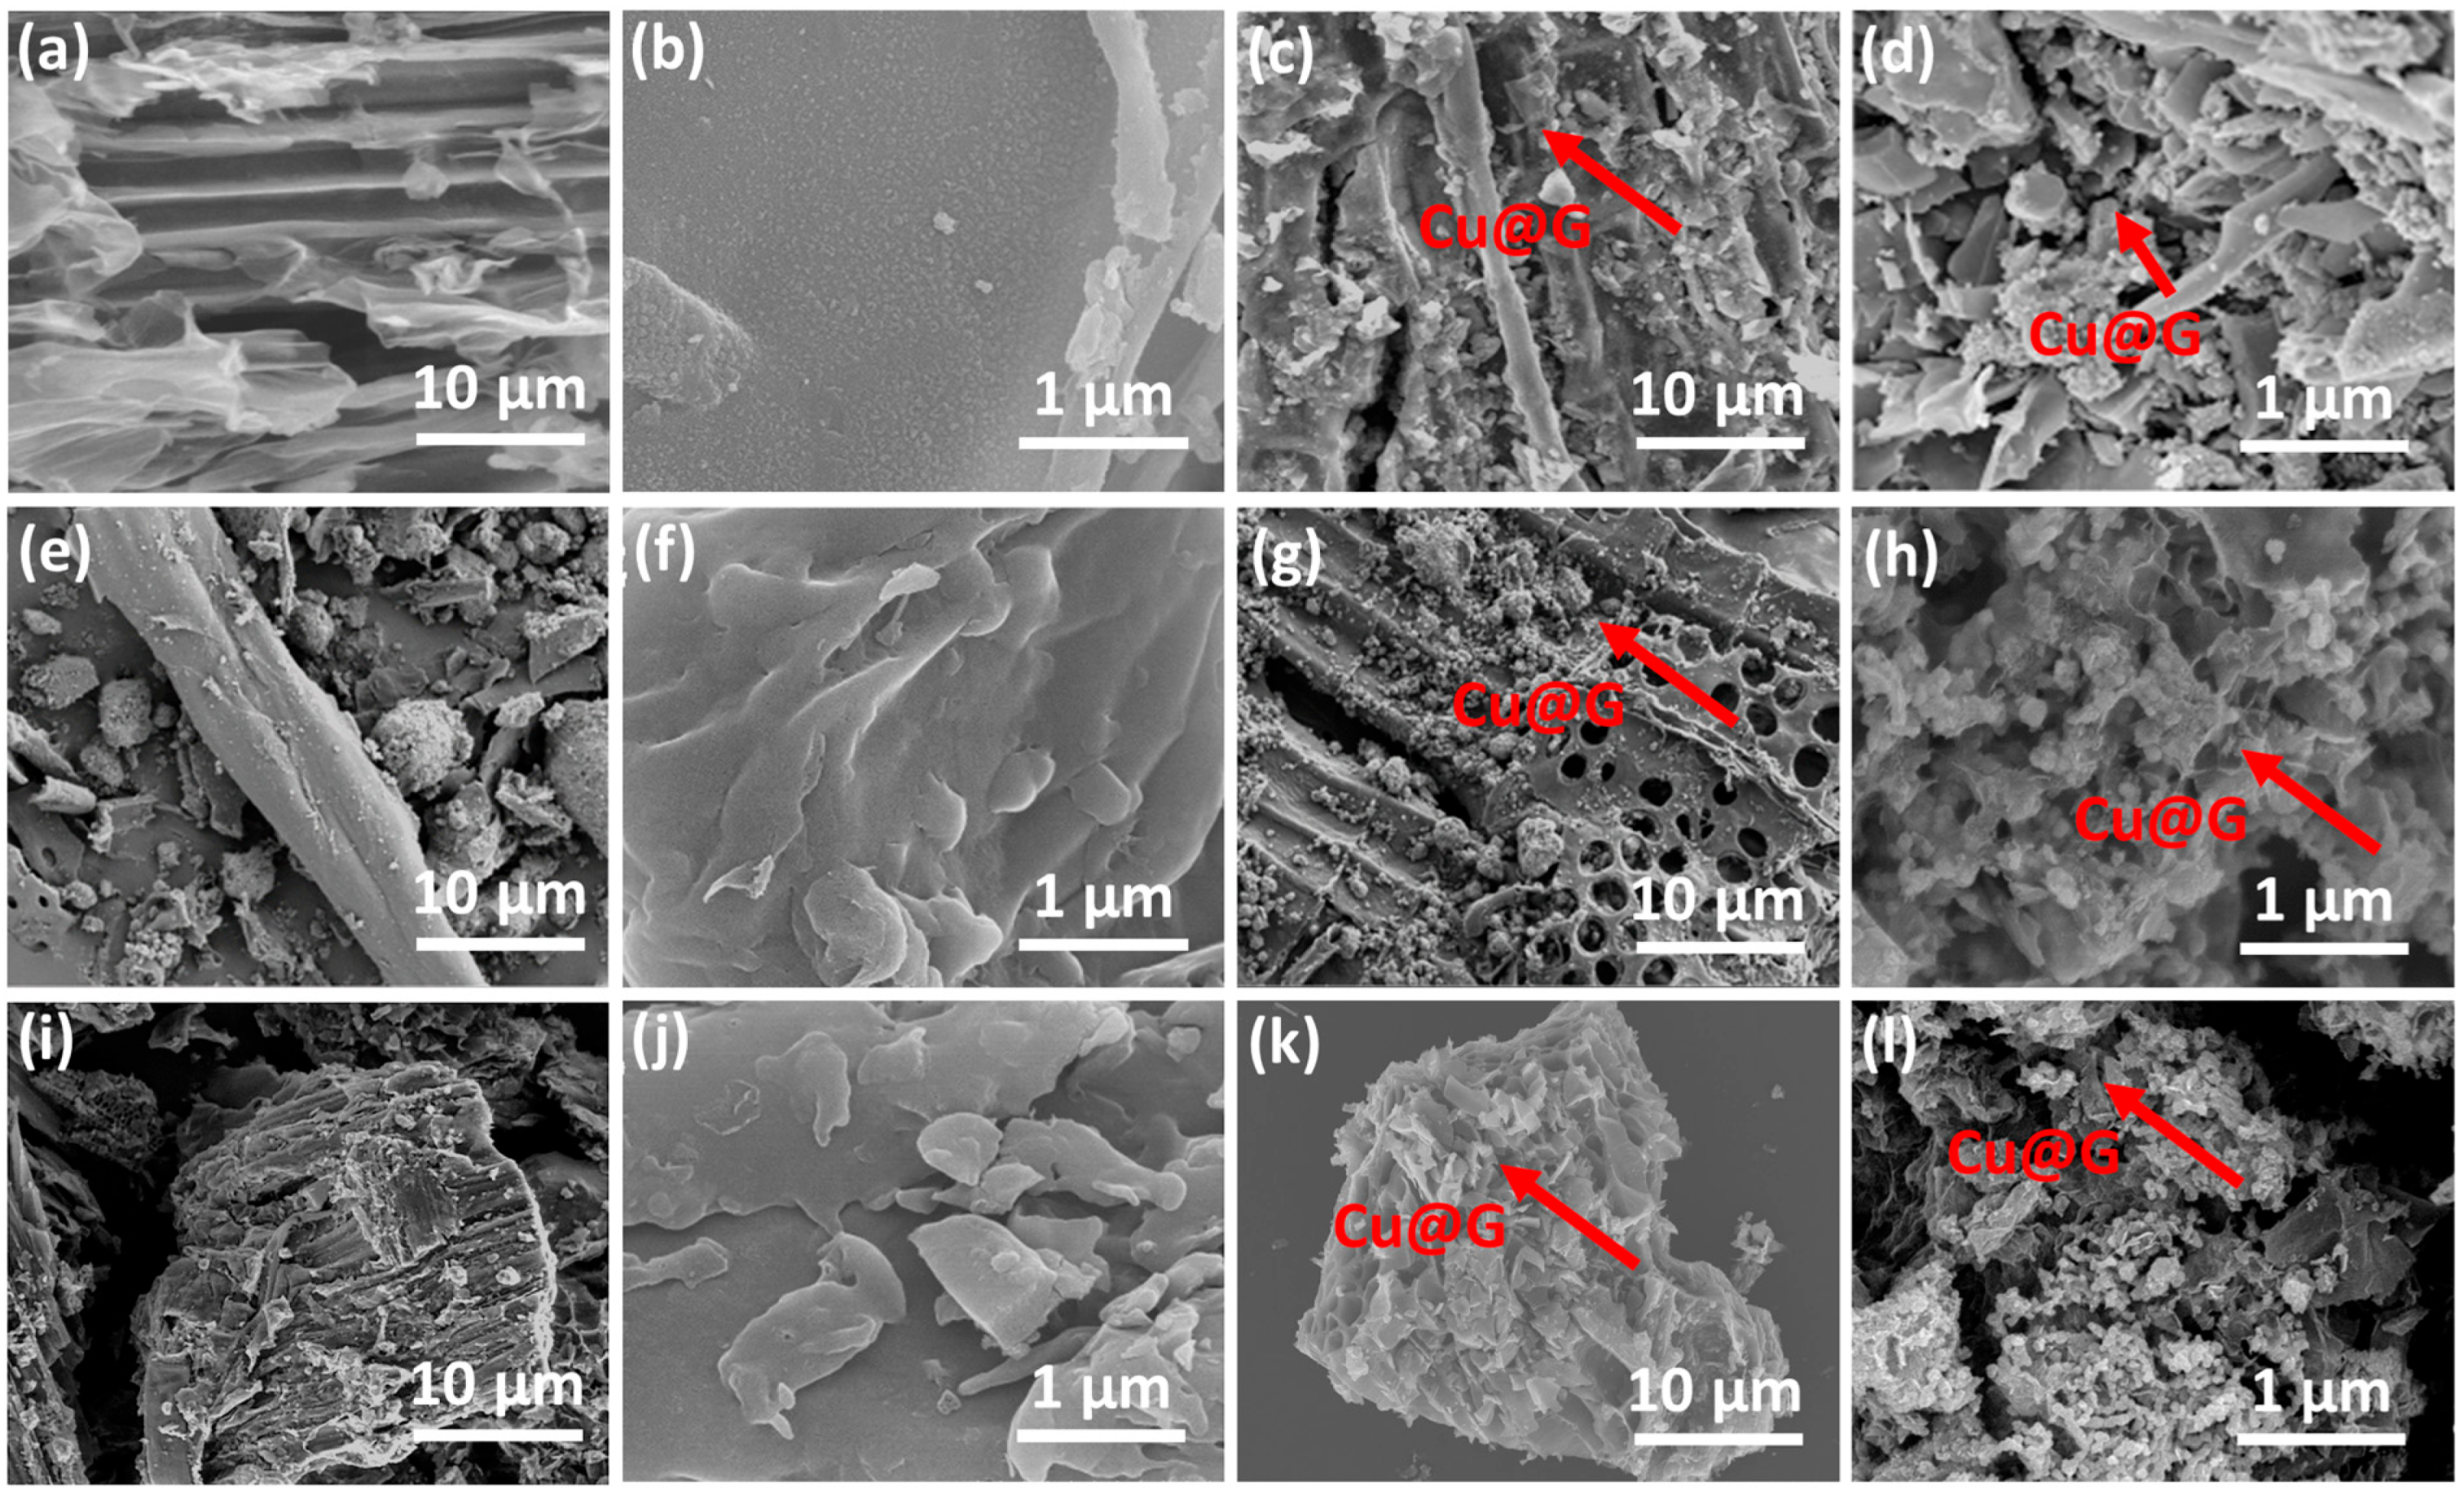
Morphologies of Cu@G/Bs were exhibited in Figure 3. For Bs, the pristine microstructure of corncob was kept, and some long strips were observed. Compared with the unbroken surface of B300 with large particle sizes (ten to several hundred micrometers) (Figure 3a,b), the surface integrity of B450 and B600 tended to be weakened, and the smooth surface of raw Bs tended to be granulated but still less exposed (Figure 3e,f,i,j). More debris and pores were observed in the matrix of Bs, and the surface of Bs became more fragmented and looser as the pyrolysis temperature increased from 300 °C to 600 °C. Bs appeared as inhomogeneous particulate matter with irregular geometry. With the addition of Cu@G NPs, the pristine microstructure and morphologies of Bs were not affected and remained as matrixes to support Cu@G NPs (Figure 3c,d,g,h,k,l). Cu@G NPs were distinctly exhibited on the surface and in the holes of biochar matrixes, which indicated the integration of Cu@G NPs with Bs to prevent the significant agglomeration of Cu@G NPs. For Cu@G/B300, Cu@G/B300, and Cu@G/B300, the distribution uniformity of Cu@G NPs was not obviously influenced by the biochar matrix.
Figure 4a presented the distribution of Cu@G NPs on/in the matrix of Bs. Because Cu@G NPs commonly agglomerated in aquatic environments, no obvious agglomeration of Cu@G NPs on/in the matrix of Bs was observed. The integration of Cu@G NPs with biochar carrier enabled their effective dispersion in biochars, which would be highly desirable for their efficient utilization in aquatic solutions. XRD patterns of Cu@G/Bs are displayed in Figure 4b. Besides the diffraction peaks of Cu, a broad peak in the range of 10–30° was present, which was attributed to the diffraction peak of biochars [42]. As the pyrolysis temperature increased from 300 °C to 600 °C, the intensities or areas of these broad peaks gradually decreased. A more aromatic and amorphous substance in the corncob precursor was removed given the higher pyrolysis content of corncob at higher heating temperatures. As listed in Table 1, the specific SA values of Cu@G/Bs were 31.8 m2/g for Cu@G/B300, 75.2 m2/g for Cu@G/B450, and 155.9 m2/g for Cu@G/B600 (Figure 4c). The average diameter of particles was reduced from 14.2 nm to 7.8 nm. Total pore volumes of Cu@G/Bs improved from 0.0428 cm3/g to 0.2696 cm3/g. The element species located on the surface of Cu@G/Bs recorded through XPS are shown in Figure 4d. C, O, N, and Cu were observed on the XPS survey spectra of Cu@G/Bs. From the above characterization results, it is demonstrated that Cu@G NPs were successfully integrated with biochar carriers, including B300, B450, and B600, as Cu@G/B composites.

2.3. Sorption of CO2 on Cu@G/Bs

As illustrated in Figure 5a, sorption capacities of CO2 were 19.6 mg/g for Cu@G/B300, 31.5 mg/g for Cu@G/B450, and 42.6 mg/g for Cu@G/B600. These values were comparable to many published biochars but lower than those of activated carbons, which were commonly prepared through multiple processing procedures [46]. Cu@G/B600 presented the highest sorption capacity because of its highest specific SA and pore volume. As the temperature of thermogravimetric analysis (TGA) measurement increased with the following sequence (i.e., 0 °C, 25 °C, 45 °C, and 65 °C), the sorption capacity of CO2 presented a reduced tendency, i.e., 51.9–14.6 mg/g for Cu@G/B300 (71.9% of declined ratio), 69.5–18.1 mg/g for Cu@G/B450 (74.0% of declined ratio), and 93.8–23.3 mg/g for Cu@G/B600 (75.2% of declined ratio) (Figure 5b). It is indicated that the sorption of CO2 on Cu@G/Bs was an exothermic physical process. Brownian motion of CO2 molecules would be more severe to promote desorption with increasing sorption temperature [47].
Because the sorption isotherm is effective for evaluating the migration and transformation of sorbate, sorption isotherms of CO2 on Cu@G/Bs were recorded at 0 °C, as shown in Figure 5c. To infer the sorption mechanism, Langmuir and Freundlich models were applied to fit sorption isotherms. Based on the correlation coefficients (R2) listed in Table 2, the Langmuir model was more appropriate to describe isotherms, which suggested that the capture of CO2 by Cu@G/Bs followed a monolayer sorption and the sorption sites were distributed uniformly on the surface of Cu@G/Bs. Moreover, the recycling usage of Cu@G/Bs was evaluated via 10 cycles, as illustrated in Figure 5d. The recovery ratio of the sorption capacity was in the range of 95.3–97.1% after 10 cycles, presenting excellent reusability due to the reversible physical sorption of CO2 of Cu@G/Bs.

2.4. Evaluation of Electroreduction Performance

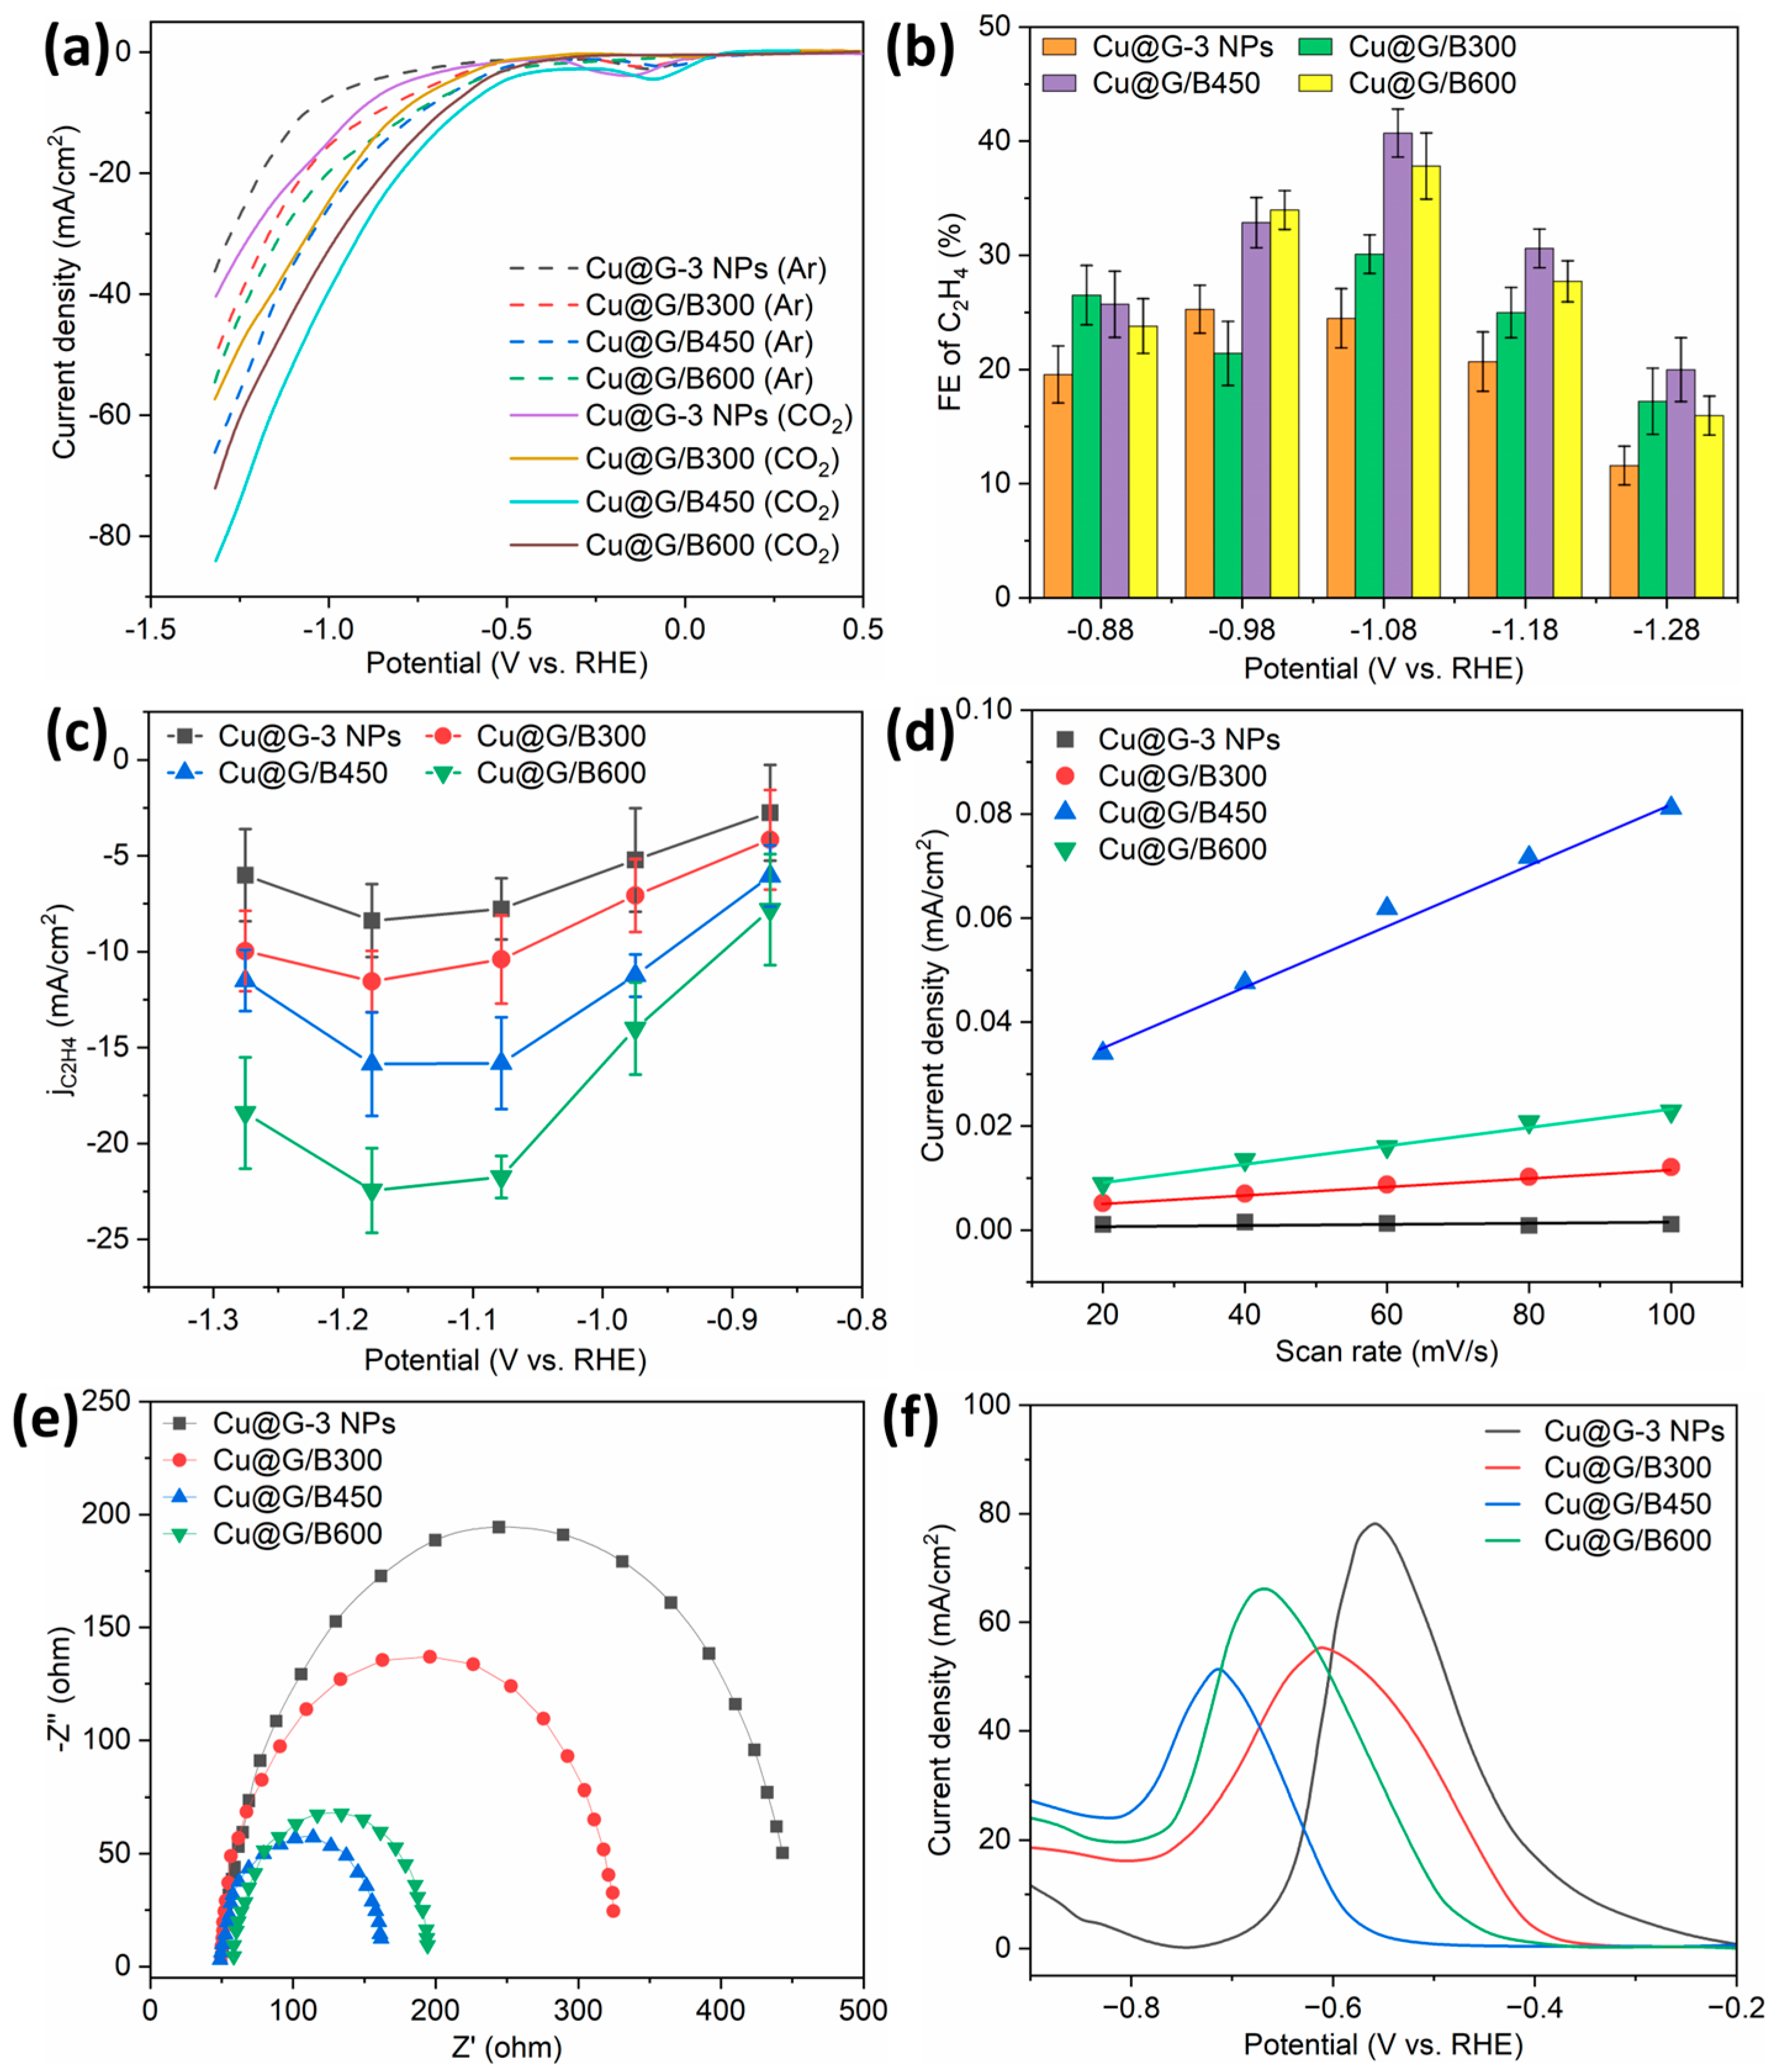
A linear sweep voltammetry test was carried out to evaluate the electrocatalytic activity of electrodes in CO2-saturated and Ar-saturated systems, where the electrode material was Cu@G-3 NPs, Cu@G/B300, Cu@G/B450, and Cu@G/B600, respectively. On the one hand, the current densities of samples in CO2-saturated electrolyte were higher than those in Ar-saturated electrolyte, showing excellent activities for the electrocatalytic reduction of CO2. On the other hand, Cu@G/Bs presented lower potentials and higher current density than Cu@G-3 NPs. Among the three Cu@G/Bs, Cu@G/B450 presented the lowest potential and the highest current density (Figure 6a). The electrocatalytic reduction of CO2 to C2+ products could be accelerated through the synergistic integration of Cu0/Cu+ in the specific nanostructure of Cu@G-3 NPs [48]. Moreover, the integration of biochar carrier and Cu@G-3 NPs improved the electrocatalytic activity of the composite effectively. As shown in Figure 6b, Cu@G/B450 exhibited a higher FE value of C2H4 (40.7% at −1.08 V vs. RHE) than those of Cu@G/B600 (37.8%), Cu@G/B300 (30.1%), and Cu@G-3 NPs (24.5%). Enhanced selectivity towards C2H4 should be attributed to the improved sorption capacity for CO2 and more exposed activity sites due to the high BET SA. Compared with many published catalysts in previous studies, the FE value of Cu@G/B450 was superior, as listed in Table S1. The partial current density of C2H4 was calculated as jC2H4 = jtotal × FEC2H4 [49]. As illustrated in Figure 6c, the jC2H4 of Cu@G/B450 was 21.7 mA/cm2 at −1.08 V vs. RHE, which was 2.7-, 2.2-, and 1.5-fold greater enhancement compared with those of the Cu@G-3 NPs Cu@G/B300 and Cu@G/B600, respectively. It is demonstrated that Cu@G/B450 had good selectivity for C2H4.
The double-layer capacitance (Cdl) of Cu@G/B450 calculated from cyclic voltammetry (CV) curves was 641.3 µF/cm2 (Figure 6d and Table S2), which was 1.4-fold greater enhancement than Cu@G/B600 (452.7 µF/cm2), 7.4-fold greater enhancement than Cu@G/B300 (87.2 µF/cm2), and 1.4-fold greater enhancement than Cu@G-3 NPs (18.7 µF/cm2). As the electrochemical impedance spectroscopy plots exhibit in Figure 6e, the charge transfer resistance (Rct) of four samples followed the sequence of Cu@G/B450 (109.8 Ω) < Cu@G/B600 (135.7 Ω) < Cu@G/B300 (256.3 Ω) < Cu@G-3 NPs (391.4 Ω). Hence, Cu@G/B450 presented the fastest charge transfer rate and the largest electronic conductivity [50]. As expected, Cu@G/B450 delivered the lowest Rct, which could produce more reaction activity sites and promote the formation of a C–C bond, thereby enhancing the electrocatalytic properties and C2H4 selectivity. Furthermore, these four catalysts were electrolyzed in CO2-saturated KHCO3 electrolyte at −1.08 V vs. RHE for 0.5 h to measure the sorption capacity of OH from intermediates. As displayed in Figure 6f, the sorption potential for OH followed the sequence of −0.72 V vs. RHE (Cu@G/B450) < −0.67 V vs. RHE (Cu@G/B600) < −0.59 V vs. RHE (Cu@G/B300) < −0.56 V vs. RHE (Cu@G-3 NPs). The dissolved OH- in KOH electrolyte is usually used as a surrogate to evaluate the adsorption strength of active *CO2 intermediates. The more negative adsorption potential of Cu@G/B450 indicated an enhanced binding affinity with OH, thus inferring an optimized stabilizing capacity with *CO2 compared to other counterparts [51,52]. This is mainly because the presence of the carbon layer and N doping can alter the d-band center and the electronic structure of Cu@G NPs, thereby improving the binding ability with *CO2 intermediates. Therefore, on the basis of the results above, it would be expected that the strong interactions between the carbon layer and Cu@G/B450 could be helpful to enhance the activity of the CO2 reduction reaction.
TGA curves of Cu@G/B300, Cu@G/B450, and Cu@G/B600 composites are shown in Figure S2. As the TGA temperature increased to 800 °C, all carbon species were burned and removed from the chamber. Most pristine Cu content in Cu@G/B300, Cu@G/B450, and Cu@G/B600 composites analyzed using XPS should be attributed to Cu0. Thus, the remaining products should be CuO. The ratios of remaining CuO were 8.5% for Cu@G/B300, 25.9% for Cu@G/B450, and 13.8% for Cu@G/B600. The mass contents of Cu in Cu@G/Bs were deduced to be 6.8% for Cu@G/B300, 20.7% for Cu@G/B450, and 11.0% for Cu@G/B600. Therefore, the attached Cu content in Cu@G/B450 was higher than that of the other two composites. That is probably why Cu@G/B450 displays the highest Faradaic efficiency for C2H4 despite not having the highest CO2 adsorption capacity.
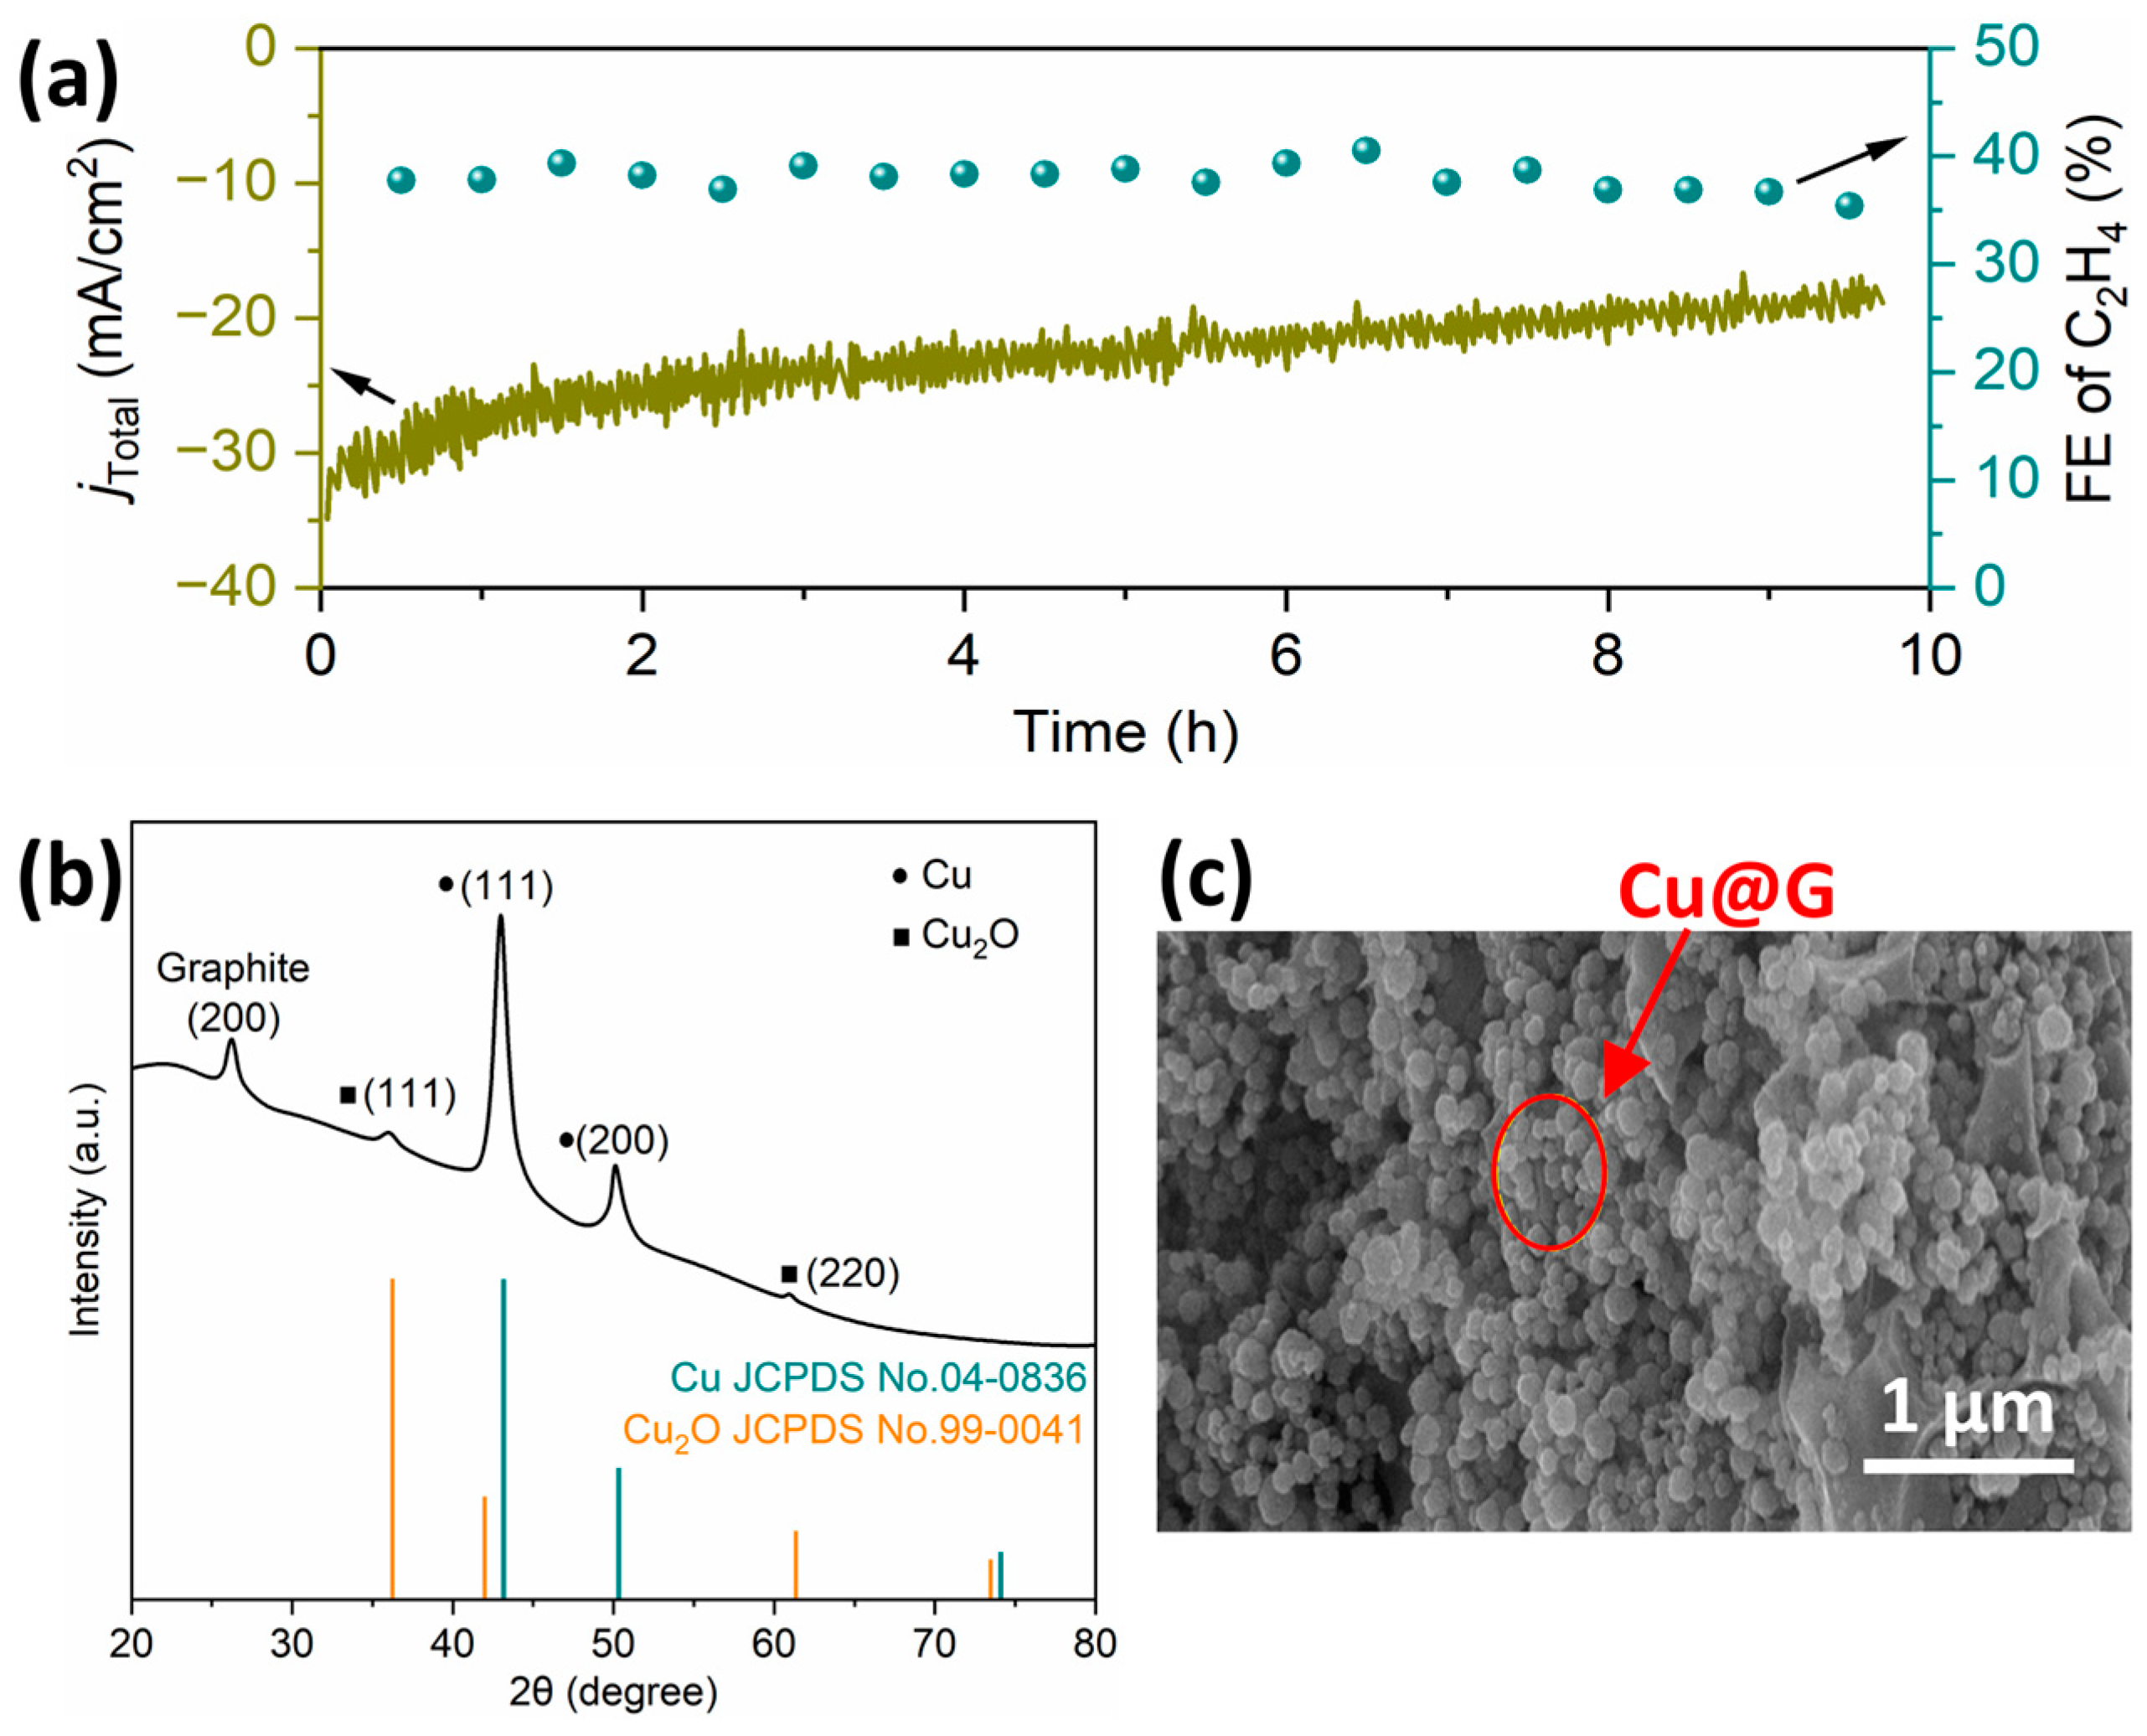
The long-term stability of electrocatalytic reduction of CO2 on Cu@G/B450 at the potential of −1.08 V vs. RHE in CO2-saturated KHCO3 solution (0.5 mol/L) was studied. As shown in Figure 7a, the total current density of Cu@G/B450 electrode reduced from −34.9 mA/cm2 to −17.6 mA/cm2 after 9.5 h of working, and FE of C2H4 reduced from 39.1% to 35.4%, presenting a slow decline of electrocatalytic activity. The crystalline structure of Cu@G/B450 after 9.7 h of electrocatalytic reduction recorded through XRD is shown in Figure 7b. Dominant species were kept stable as Cu and graphite. Small diffraction peaks corresponding to Cu2O were observed. Moreover, nano-sized particles distributed on the biochar carrier were still clearly exhibited, indicating the excellent stability of Cu@G/B450 catalyst (Figure 7c). Cu@G/B450 showed the highest reduction efficiency of Cu+ to Cu0 at the lowest potential (−0.72 V vs. RHE) compared with other materials, indicating that Cu2O can be easily reduced to Cu [53]. It was reported that the coexistence of a Cu+/Cu0 mixture could synergistically boost the reduction of CO2 to C2+ products related to enhanced CO2 activation and CO dimerization [54]. The above fact revealed that the introduction of the biomass carbon notably improved the current density, and the Cu@G/B450 was more effective in the reduction reaction of CO2 compared to the other two catalysts.
Furthermore, gas chromatography was used to analyze the gas-phase products of all samples in the reduction reaction of CO2 at potentials ranging from −0.88 to −1.28 V vs. RHE. The products detected were C2H4, C2H6, CO, CH4, and H2, as shown in Figure S3. It is notable that C2H4 is the main reaction product, while H2 as a byproduct was generated in the hydrogen evolution reaction. Apparently, the Cu@G/B450 achieved the highest C2H4 selectivity, and the FE of C2H4 was 46.9% at −1.08 V vs. RHE, followed by Cu@G/B600 (39.9%) and Cu@G/B300 (27.2%). More importantly, the addition of biochar significantly impedes the complete hydrogen evolution reaction. In particular, Cu@G/B450 had the best property of hydrogen evolution reaction suppression.
The possible pathways for the reduction of CO2 to C2H4 were proposed as follows. Firstly, CO2 molecules were efficiently adsorbed on the surface and the pores of the biochar matrix and further activated by Cu@G NPs. A CO2 molecule received one single electron to be reduced to CO2-intermediate. Secondly, the CO2-intermediate was hydrogenated to *COOH with the help of a proton. Thirdly, *COOH acquired an electron and proton to dissociate into water and adsorbed *CO as *COOH + H+ + e → H2O + *CO. The step of adsorption of two *CO intermediates dimerizing to *C2HxO2 for C–C bond coupling was typically considered to be a potential determining step, as 2*CO + H+ + e → *C2HxO2. Finally, *C2HxO2 was further hydrogenated to produce C2H4, which is desorbed from the catalyst surface as *C2HxO2 + H+ + e → C2H4 + H2O.
The carbon conversion efficiencies of the system under the tested conditions were estimated as follows. The single-pass carbon efficiency (SPCE) was calculated using the equation S P C E H C O O H % = n H C O O H n C O 2 = ( I H C O O H × 60   s ) / ( N × F ) ( R × 1   min ) / ( 24.05   L / mol ) , where IHCOOH was the partial current of formic acid, n was the number of electrons transferred and it was two for HCOOH, and R was the flow rate of CO2 (in L/min). Figure S4 depicts the HCOOH production SPCE using the Cu@G/B450 catalyst at different pH values as a function of the CO2 flow rate (3, 6, and 10 sccm). In a single flow cell with an active area of 1.0 cm × 1.5 cm, an SPCE of 64.8% was achieved for HCOOH at a CO2 flow rate of 3 sccm and a current density of 100 mA/cm2.

3. Materials and Methods

3.1. Materials

Urea, copper powder, graphite powder, glutaraldehyde, isopropyl alcohol, and Nafion solution were purchased from Sigma-Aldrich Co., Ltd. (Taufkirchen, Germany) Wheat straw was collected from a local rice field. All of the chemicals were used as received without any further purification.

3.2. Fabrication of Cu@G/Bs

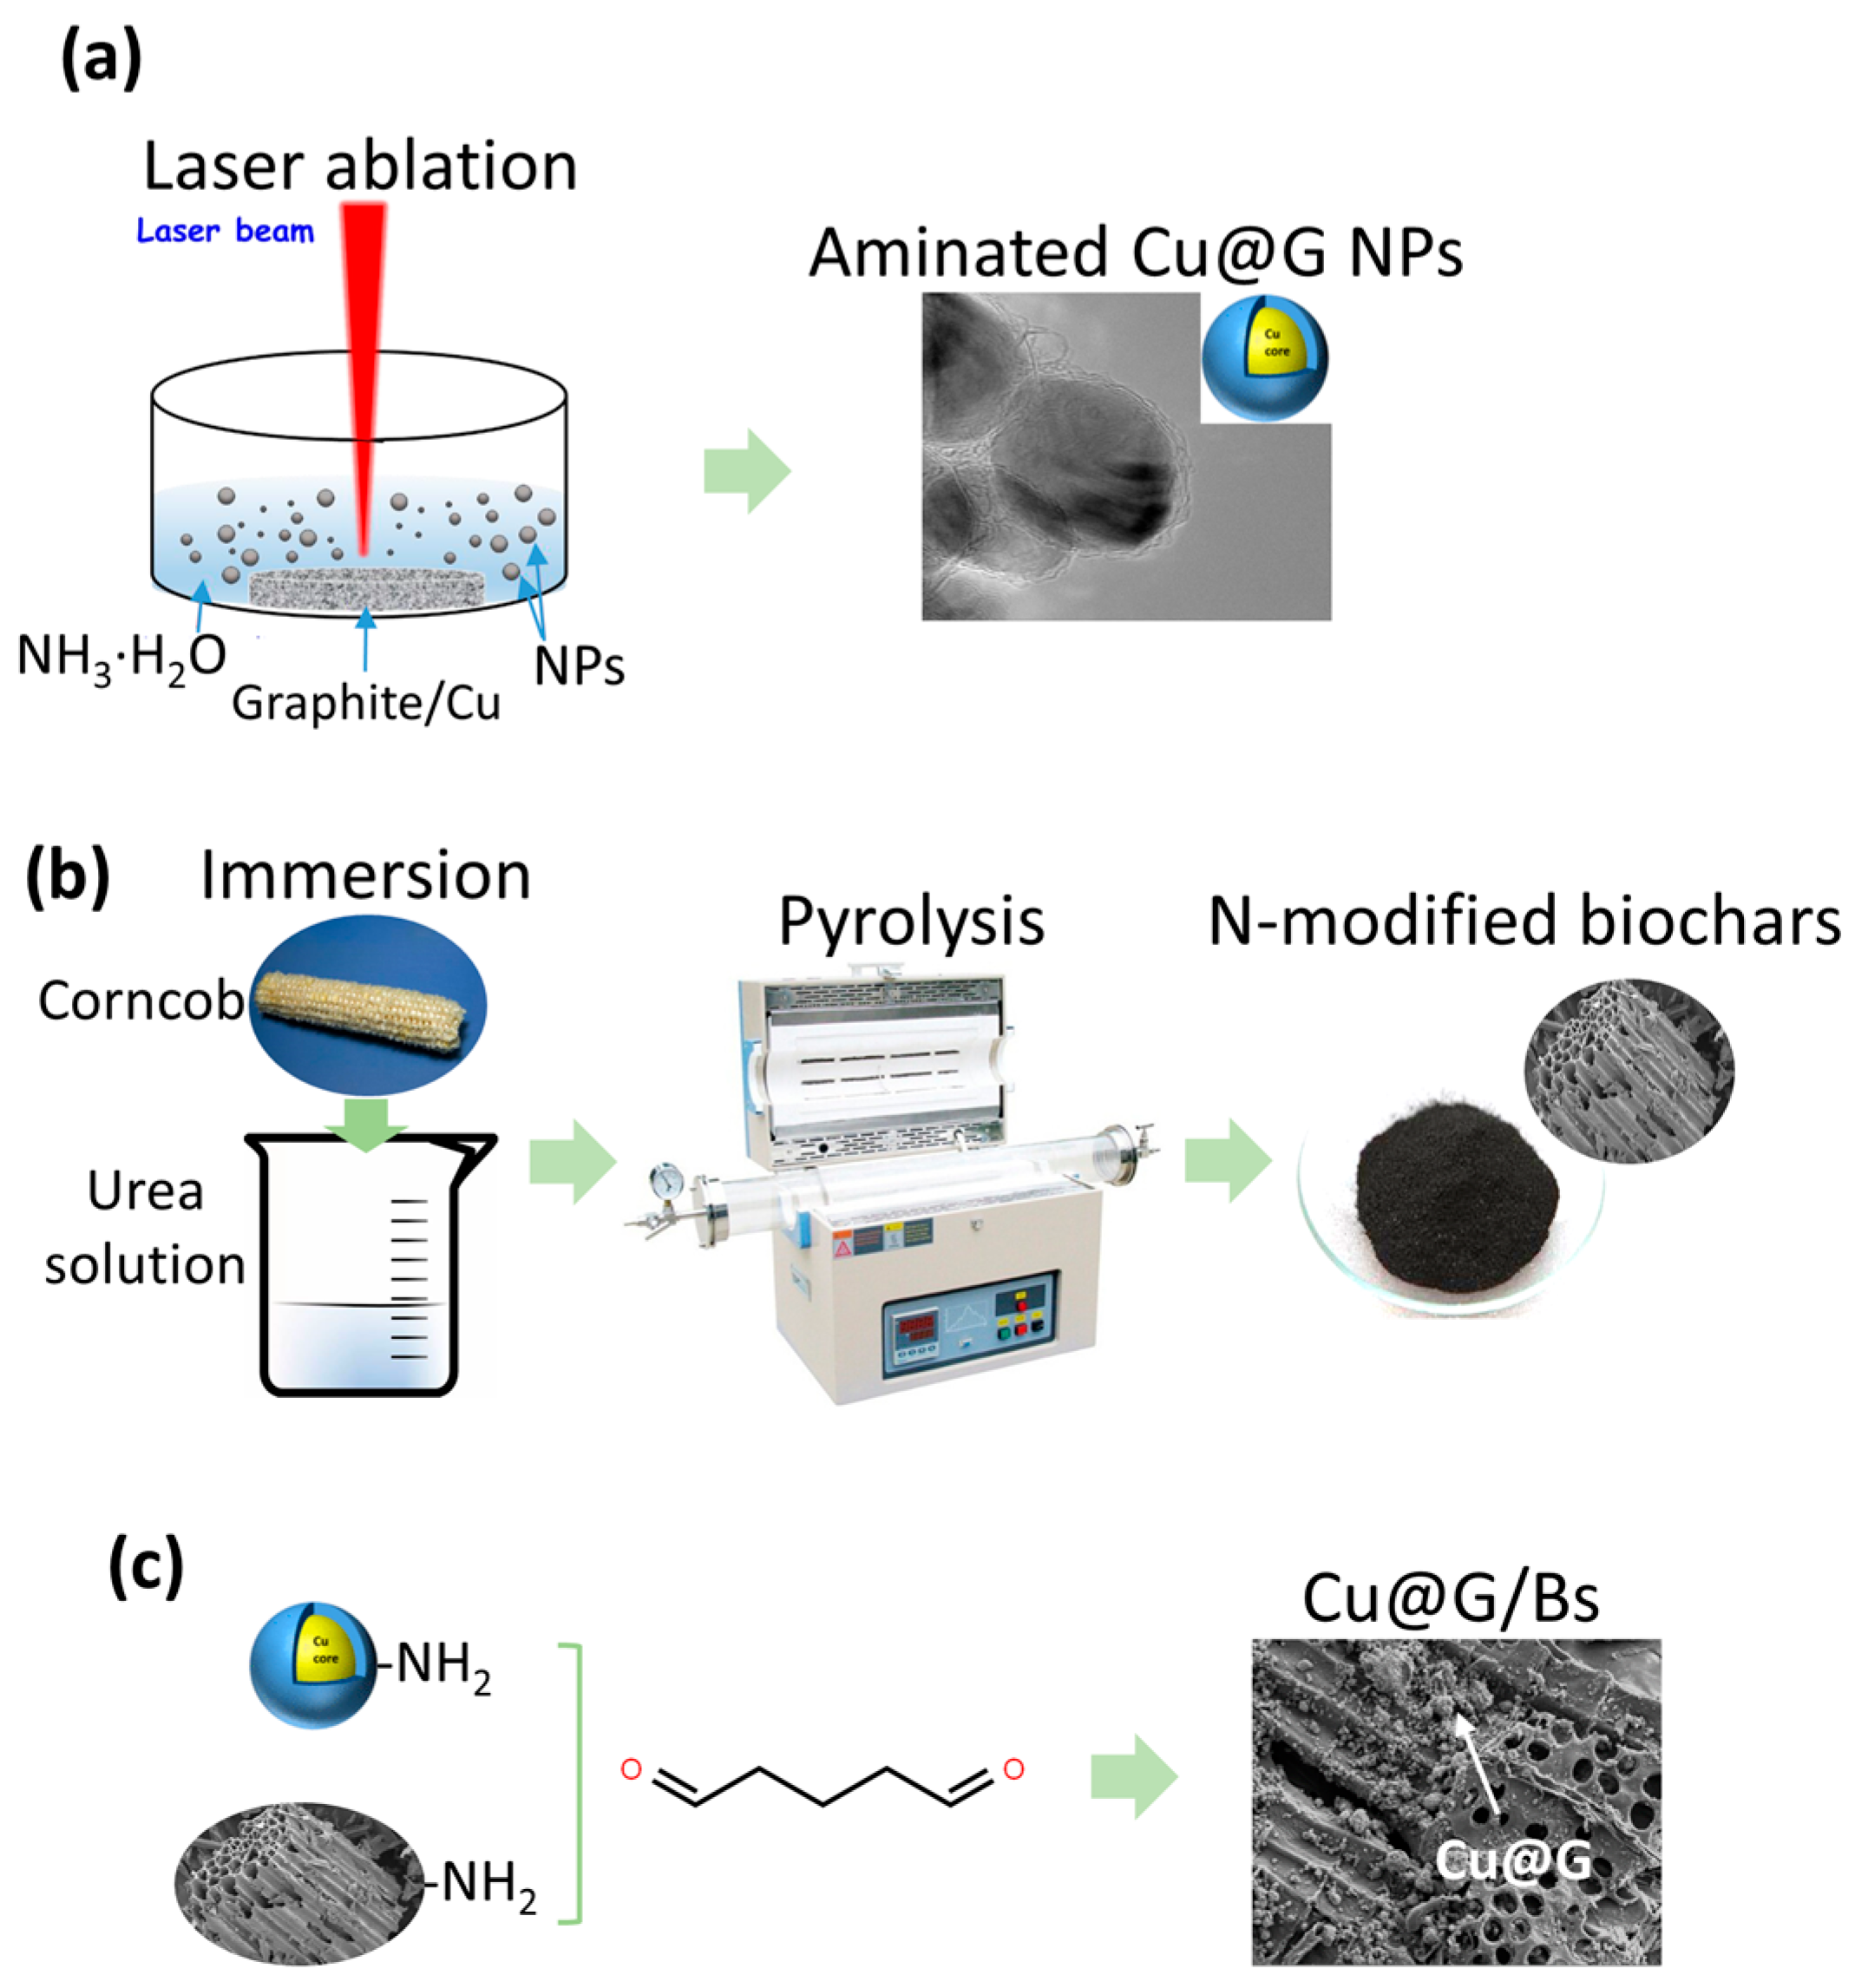
Fabrication of Cu@G NPs: First, 10.0 g, 20.0 g, and 30.0 g of copper powder was mixed uniformly with 10.0 g of graphite powder. These three mixtures were added to a plate mould with a pressing pressure of 8 MPa. Then, these three pressed plates were continuously rotated in a vessel filled with urea solution (50 mL and 1.0 g/L) for laser ablation, as displayed in Figure 8a. The distance of the plate’s top surface to the urea solution’s top surface was kept at 6.0 mm. Specific parameters for laser ablation were a laser type of Nd:YAG pulsed laser, a wavelength of 1064 nm, a spot size of 2.0 mm, a pulsed duration of 7.0 ns, a repetition rate of 10 Hz, and a pulse energy of 100 mJ. After ablation for 10.0 min, Cu@G NPs modified with amino function groups were collected through the centrifuge and washed thoroughly. The three types of laser-ablated Cu@G NPs obtained (i.e., Cu core and graphite shell) were termed Cu@G-x (i.e., Cu@G-1, Cu@G-2, and Cu@G-3), where x was the mass ratio of copper powder and graphite powder in precursors.
Preparation of Cu@G/Bs: Corncob was cut into small pieces and rinsed thoroughly. Dried corncob pieces were dispersed into urea solution (1.0 g/L) for 6 h with the assistance of sonication. Then, urea-soaked corncob pieces were heated in a tube furnace at 300 °C, 450 °C, and 600 °C, respectively, for 2 h with a heating rate of 5 °C/min under a nitrogen atmosphere (Figure 8b). Obtained products were named Bs, including B300, B450, and B600, according to the pyrolysis temperature. Bs were grinded and passed through the sieve. Bs (0.9 g) were blended with Cu@G NPs (0.1 g) and well-dispersed into aqueous solutions using sonication. Then, the cross-linking of Bs and Cu@G NPs was performed by adding glutaraldehyde (1.0 mol%) at 40 °C for 6 h (Figure 8c). After thoroughly washing to remove residual glutaraldehyde, obtained samples were termed Cu@G/Bs, including Cu@G/B300, Cu@G/B450, and Cu@G/B60.

3.3. Characterization

SEM (Zeiss Ultra55 system, Carl Zeiss NTS GmbH, Oberkochen, Germany) and transmission electron microscopy (TEM, H7000, Hitachi, Tokyo, Japan) were applied to observe the morphology of Cu@G NPs and Cu@G/Bs. For spraying treatment before SEM observation, Au was selected as the target material to coat the Au film with a thickness of about 4 μm. The vacuum degree was 0.001 mbar, the applied current was 10 mA, and the spraying time was 1 min. The spraying device was the Leica EM ACE200 Coater (Wetzlar, Germany). The condition for SEM observation was set as 5.0 kV of accelerating voltage. An energy-dispersive X-ray spectroscopy instrument equipped on a TEM (SU8600, Hitachi, Tokyo, Japan) was used to analyze the distribution of C, Cu, and O elements. An XRD instrument (D6 Advance X-ray diffractometer, Bruker, Germany) was employed to record the crystalline structures of samples. The scan range for XRD was 5–80°. The current for XRD was 40 mA, and the voltage was 40 kV. The scanning speed for XRD was 0.1°/s. NRS-104 (JASCO, Tokyo, Japan) was utilized to record the Raman spectra at the excitation wavelength of 532 nm. X-ray photoelectron spectroscopy (XPS) with an ESCALAB Mark II system (VG Scientific, London, UK) equipped with two ultra-high vacuum (UHV) chambers was applied to analyze the chemical states of surface elements. ASAP 2460 (Micromeritics, Norcross, GA, USA) was utilized to measure the specific surface area (SA), pore volume, and pore size of samples. TGA analysis was carried out on a 449 F5 Jupiter simultaneous thermal analyzer (Munchen, Germany) with air atmosphere, an analysis temperature range of 40–800 °C, and a heating rate of 10 °C/min.

3.4. Adsorption Experiments of CO2

TGA (Mettler Toledo TGA/DSC 3+, Zurich, Switzerland) was applied to measure the adsorption of CO2. Firstly, Cu@G/Bs were added into an alumina crucible (0.15 mL) and set in the TGA device. The weight of samples was recorded accurately, with an accuracy of 1.0 μg. Secondly, the temperature of TGA rose to 100 °C under a nitrogen atmosphere (40 mL/min) with a maintained duration of 50 min to remove the moisture adsorbed by the samples. Thirdly, as the TGA temperature decreased to a specific value (i.e., 298 K, 318 K, and 338 K), CO2 was inserted as the inlet gas to replace nitrogen gas. After sorption of 60 min to achieve equilibrium, the weight change of the sample was the adsorbed amount of CO2. The adsorption isotherm of CO2 at 0 °C was measured via Kubo X1000 volumetrically while increasing gas pressures to 100 kPa. Measurement of the reusability of the adsorbent was performed for 10 cycles while monitoring the TGA measurement. Desorption was performed by increasing the heating temperature of samples from 25 °C to 200 °C with a heating speed of 10 °C/min, and it was then held at this temperature for 5 min. All of the measurements carried out in this work were repeated three times. CV was used to determine electrochemical activities with a scanning potential of −0.88–0.72 V at 5 mV/s. Electrochemical impedance spectroscopy (EIS) was measured at −0.68 V with 1 mHz–10 mHz frequency at 10 mV amplitude.

3.5. Electrochemical Experiments

3.5.1. Electrode Preparation

Ink was prepared by mixing Nafion solution (86 μL, 5.0 wt %), isopropyl alcohol (320 μL), and catalyst (12 mg) and uniformly dispersed through sonication for 30 min. Then, the ink was brushed on carbon cloth (length of 3 cm and width of 2 cm) and vacuum dried at 35 °C.

3.5.2. Electrochemical Activity Measurement

Electrochemical activity was tested in a Nafion proton exchange membrane separated dual-chamber cell (H type) equipped with a three-electrode system (i.e., a working electrode of synthesized samples, a counter electrode of platinum gauze, and a reference electrode of a Ag/AgCl electrode with saturated KCl). The reaction was carried out in Ar or CO2-saturated solution by purging high-purity Ar or CO2 for 1 h before tests with a flow speed of 40 mL/min. The products were detected using a Shimadzu GC-2014C gas chromatographer. A flame ionization detector was equipped for the gaseous products produced by the reduction reaction of CO2, while a thermal conductivity detector was used to measure H2 produced by the hydrogen evolution reaction. The columns were selected as TDX-01 and GDX-502.

3.5.3. Reduction of CO2 and Stability Study

The CO2-saturated electrolyte was KHCO3 solution (0.1 mol/L) purged with pure CO2 for a flow rate of 15 mL/min in the whole reduction process. A flame ionization detector (FID) was equipped to measure the gaseous products produced through the CO2 reduction reaction, while a thermal conductivity detector was used to measure the H2 produced by the hydrogen evolution reaction. The columns were selected as TDX-01 and GDX-502. Gas produced from the H-type cell was collected after reacting for 1 h and analyzed via the gas chromatographer equipped with two flame ionization detectors (GC, Agilent 7890 B). Measurement of the stability of the electrocatalytic reduction for the Cu@G/B450 catalyst was carried out at the working electrode potential of −1.08 V vs. RHE, and the changes in current density and Faraday efficiency of ethylene during electrolysis were tracked and recorded. The performance of the H-type electrolytic cell produced by Gaoshiruilian Company was tested as shown in Figure S1. To ensure that the test results were not affected by the electrode, a Nafion-117 proton exchange membrane was used to effectively isolate the cathode chamber and the anode chamber of the H-type electrolytic cell. At the top of the cathode chamber, there were four sealing holes for installing the working electrode, the reference electrode, the air inlet pipe, and the air outlet pipe, respectively. The top of the anode chamber was provided with two knob-type sealing holes for installing the gas outlet pipe and the counter electrode. To prepare the working electrode, 3 mg of catalyst was first dispersed in 1 mL of Nafion–isopropanol solution with a concentration of 0.05 wt% to prepare the catalyst ink. Subsequently, 10 μL of catalyst ink was dropped on the surface of an L-shaped glassy carbon electrode with a diameter of 5 mm and dried to prepare a working electrode. A square platinum mesh with a projection area of 1.5 cm2 (1 mm × 1.5 mm) was used as the counter electrode. The reference electrode was a silver/silver chloride electrode (Ag/AgCl, 3.5 mol/L KCl). The neutral electrolyte used in this work was a KHCO3 solution saturated with CO2 (0.1 mol/L). Before electrolysis, high-purity CO2 was introduced into the cathode chamber at a flow rate of 15 sccm for 30 min to purify the air at the top of the cathode chamber, and CO2 was continuously introduced into the solution during the reaction to maintain the CO2 concentration of the electrolyte.

4. Conclusions

In summary, the core/shell nanostructure of Cu@G NPs was regulated as a declined core diameter from 28.2 nm to 24.2 nm and a reduced shell thickness from ~7.8 layers to ~3.0 layers. Cu@G-3 NPs presented a favorable graphitic structure (ID/IG of 0.703) and a high specific SA of 71.3 m2/g. A thin oxidized Cu2O shell was confirmed between the interface of the Cu core and the graphene shell, providing an interfacial Cu0/Cu+. Cu@G/Bs with developed porosity (31.8–155.9 m2/g) were successfully synthesized by cross-linking Cu@G NPs on the matrix of Bs. Cu@G/B600 presented an excellent sorption capacity of CO2 as 93.8–23.3 mg/g at 0–65 °C. Sorption of CO2 on Cu@G/Bs followed a monolayer sorption on uniformly distributed sorption sites with a qmax value of 107.03 mg/g at 0 °C. The reusability of Cu@G/B600 for CO2 capture was also excellent (95.3–97.1% remained after 10 cycles). For the electroreduction of CO2, Cu@G/B450 exhibited the most superior performance, with 40.7% of FEC2H4 and 21.7 mA/cm2 current density at −1.08 V vs. RHE, which was a 1.7- and 2.7-fold greater enhancement compared with those of Cu@G NPs. This improvement should be attributed to the synergistic integration of developed porosity for efficient CO2 capture and the fast charge transfer rate of interfacial Cu2O/Cu. Moreover, Cu@G/B450 presented a favorable long-term phase and structural and performance stability for the electroreduction of CO2. This work provided a valuable reference for the integration of laser-ablated Cu@G NPs and porous biochar as a promising candidate to efficiently capture and electro-reduce CO2.

Supplementary Materials

The following supporting information can be downloaded at https://www.mdpi.com/article/10.3390/catal15080767/s1, Figure S1. Photograph and schematic diagram of H-type electrolytic cell. Figure S2: TGA curves of Cu@G/B300, Cu@G/B450, and Cu@G/B600. Figure S3: The total FEs of Cu@G/B300, Cu@G/B450, and Cu@G/B600. Figure S4: SPCE in the reduction of CO2 to HCOOH conversion using the Cu@G/B450 electrode at 100 mA/cm2 at different CO2 flow rates and different pH values. Table S1: Electroreduction activities of CO2 compared with reported Cu-based catalysts. Table S2: Cdl values of Cu@O-3 NPs, Cu@O/B300, Cu@O/B450, and Cu@O/B600 [55,56,57,58,59,60,61,62].

Author Contributions

Y.H.: investigation, methodology, data curation, validation, conceptualization, writing—original draft. X.Z.: resources. F.Z.: resources, supervision, writing—reviewing and editing. All authors have read and agreed to the published version of the manuscript.

Funding

This research received no external funding.

Data Availability Statement

Dataset available upon request from the authors.

Conflicts of Interest

The authors declare that they have no known competing financial interests or personal relationships that could have appeared to influence the work reported in this paper.

References

  1. Peter, S.C. Reduction of CO2 to Chemicals and Fuels: A Solution to Global Warming and Energy Crisis. ACS Energy Lett. 2018, 3, 1557–1561. [Google Scholar] [CrossRef]
  2. Tong, D.; Zhang, Q.; Liu, F.; Geng, G.; Zheng, Y.; Xue, T.; Hong, C.; Wu, R.; Qin, Y.; Zhao, H.; et al. Current Emissions and Future Mitigation Pathways of Coal-Fired Power Plants in China from 2010 to 2030. Environ. Sci. Technol. 2018, 52, 12905–12914. [Google Scholar] [CrossRef] [PubMed]
  3. Zhang, S.; Fan, Q.; Xia, R.; Meyer, T.J. CO2 Reduction: From Homogeneous to Heterogeneous Electrocatalysis. Acc. Chem. Res. 2020, 53, 255–264. [Google Scholar] [CrossRef]
  4. Zheng, H.; Yang, Z.; Luo, L.; Cheng, J.; Jin, Y.; Gao, Q.; Fan, M.; Zhao, Z.; Kong, X.; Zhang, X.; et al. Engineering the Stable BiOx Species for Efficient Electroreduction of CO2 into Formic Acid at Ampere-Level Current. Nano Lett. 2025, 25, 8750–8757. [Google Scholar] [CrossRef] [PubMed]
  5. Wang, C.; Chen, B.; Wang, Q.; Hu, H.; Xia, R.; Zhu, J.; Sun, Q.; Wu, Z.; Miao, R.K.; Guan, Q.; et al. Dynamic Activation of Edge-Hosted Co–N4 Sites for Energy-Efficient Electrochemical CO2 Reduction at Industry-Level Current Density. ACS Catal. 2025, 15, 8540–8550. [Google Scholar] [CrossRef]
  6. Baek, S.; Gutierrez-Portocarrero, S.; Gerulskis, R.; Minteer, S.D.; German, S.R.; White, H.S. Detection of CO2 Locally Generated by Formate Dehydrogenase Using Carbonate Ion-Selective Micropipette Electrodes. ACS Nano 2025, 19, 13240–13249. [Google Scholar] [CrossRef] [PubMed]
  7. Naz, R.; Tahir, M. Recent Developments in Metal-free Materials for Photocatalytic and Electrocatalytic Carbon Dioxide Conversion into Value Added Products. Energy Fuels 2025, 39, 6127–6150. [Google Scholar] [CrossRef]
  8. Hazari, N.; Shafaat, H.S.; Yang, J.Y. Transforming Highly Oxidized and Reduced Carbon Feedstocks: Strategies for Catalytic CO2 and CH4 Valorization. Acc. Chem. Res. 2024, 57, 3451–3453. [Google Scholar] [CrossRef]
  9. Gong, L.; Zhang, W.; Zhuang, Y.; Zhang, K.; Zhao, Q.; Xiao, D.; Liu, S.; Liu, Z.; Zhang, Y. High-Entropy Metal Sulfide Promises High-Performance Carbon Dioxide Reduction. ACS Appl. Mater. Interfaces 2024, 16, 66211–66218. [Google Scholar] [CrossRef]
  10. Jolly, B.J.; Pung, M.J.; Liu, C. Integrated electrochemical CO2 reduction and hydroformylation. Dalton Trans. 2024, 53, 18834–18838. [Google Scholar] [CrossRef]
  11. Li, Y.; Li, Y.; Sun, H.; Gao, L.; Jin, X.; Li, Y.; Lv, Z.; Xu, L.; Liu, W.; Sun, X. Current Status and Perspectives of Dual-Atom Catalysts Towards Sustainable Energy Utilization. Nano-Micro Lett. 2024, 16, 139. [Google Scholar] [CrossRef]
  12. Hou, J.; Xu, B.; Lu, Q. Influence of electric double layer rigidity on CO adsorption and electroreduction rate. Nat. Commun. 2024, 15, 1926. [Google Scholar] [CrossRef] [PubMed]
  13. Xiao, J.; Masana, J.J.; Qiu, M.; Yu, Y. Cu−based bimetallic sites’ p-d orbital hybridization promotes CO asymmetric coupling conversion to C2 products. Mater. Today Phys. 2024, 48, 101565. [Google Scholar] [CrossRef]
  14. Nellaiappan, S.; Sharma, S. Substitution of Zinc(II) in Nickel(II) Oxide as Proficient Copper-Free Catalysts for Selective CO2 Electroreduction. ACS Appl. Energy Mater. 2019, 2, 2998–3003. [Google Scholar] [CrossRef]
  15. Lin, L.; Liu, T.; Xiao, J.; Li, H.; Wei, P.; Gao, D.; Nan, B.; Si, R.; Wang, G.; Bao, X. Enhancing CO2 Electroreduction to Methane with a Cobalt Phthalocyanine and Zinc–Nitrogen–Carbon Tandem Catalyst. Angew. Chem. Int. Ed. Engl. 2020, 59, 22408–22413. [Google Scholar] [CrossRef] [PubMed]
  16. Kornienko, N.; Zhao, Y.; Kley, C.S.; Zhu, C.; Kim, D.; Lin, S.; Chang, C.J.; Yaghi, O.M.; Yang, P. Metal–Organic Frameworks for Electrocatalytic Reduction of Carbon Dioxide. J. Am. Chem. Soc. 2015, 137, 14129–14135. [Google Scholar] [CrossRef]
  17. Al-Attas, T.A.; Marei, N.N.; Yong, X.; Yasri, N.G.; Thangadurai, V.; Shimizu, G.; Siahrostami, S.; Kibria, G. Ligand-Engineered Metal–Organic Frameworks for Electrochemical Reduction of Carbon Dioxide to Carbon Monoxide. ACS Catal. 2021, 11, 7350–7357. [Google Scholar] [CrossRef]
  18. Lin, S.; Diercks, C.S.; Zhang, Y.-B.; Kornienko, N.; Nichols, E.M.; Zhao, Y.; Paris, A.R.; Kim, D.; Yang, P.; Yaghi, O.M.; et al. Covalent organic frameworks comprising cobalt porphyrins for catalytic CO2 reduction in water. Science 2015, 349, 1208–1213. [Google Scholar] [CrossRef]
  19. Liu, H.; Chu, J.; Yin, Z.; Cai, X.; Zhuang, L.; Deng, H. Covalent Organic Frameworks Linked by Amine Bonding for Concerted Electrochemical Reduction of CO2. Chem 2018, 4, 1696–1709. [Google Scholar] [CrossRef]
  20. Wang, J.; Li, Y.; Zhao, J.; Xiong, Z.; Zhao, Y.; Zhang, J. PtCu alloy cocatalysts for efficient photocatalytic CO2 reduction into CH4 with 100% selectivity. Catal. Sci. Technol. 2022, 12, 3454–3463. [Google Scholar] [CrossRef]
  21. Fu, X.; Zhu, A.; Chen, X.; Zhang, S.; Wang, M.; Yuan, M. Stabilization of Cu/Ni Alloy Nanoparticles with Graphdiyne Enabling Efficient CO2 Reduction. Chem. Res. Chin. Univ. 2021, 37, 1328–1333. [Google Scholar] [CrossRef]
  22. Yu, J.; Liu, S.; Mu, X.; Yang, G.; Luo, X.; Lester, E.; Wu, T. Cu-ZrO2 catalysts with highly dispersed Cu nanoclusters derived from ZrO2@ HKUST-1 composites for the enhanced CO2 hydrogenation to methanol. Chem. Eng. J. 2021, 419, 129656. [Google Scholar] [CrossRef]
  23. Fu, Y.; Xie, Q.; Wu, L.; Luo, J. Crystal facet effect induced by different pretreatment of Cu2O nanowire electrode for enhanced electrochemical CO2 reduction to C2+ products. Chin. J. Catal. 2022, 43, 1066–1073. [Google Scholar] [CrossRef]
  24. Xin, Z.; Yuan, Z.; Liu, J.; Wang, X.; Shen, K.; Chen, Y.; Lan, Y.-Q. Cu cluster embedded porous nanofibers for high-performance CO2 electroreduction. Chin. Chem. Lett. 2022, 34, 107458. [Google Scholar] [CrossRef]
  25. Quan, W.; Lin, Y.; Luo, Y.; Huang, Y. Electrochemical CO2 Reduction on Cu: Synthesis-Controlled Structure Preference and Selectivity. Adv. Sci. 2021, 8, 2101597. [Google Scholar] [CrossRef]
  26. Xu, H.; Rebollar, D.; He, H.; Chong, L.; Liu, Y.; Liu, C.; Sun, C.-J.; Li, T.; Muntean, J.V.; Winans, R.E.; et al. Highly selective electrocatalytic CO2 reduction to ethanol by metallic clusters dynamically formed from atomically dispersed copper. Nat. Energy 2020, 5, 623–632. [Google Scholar] [CrossRef]
  27. Liang, H.-Q.; Zhao, S.; Hu, X.-M.; Ceccato, M.; Skrydstrup, T.; Daasbjerg, K. Hydrophobic Copper Interfaces Boost Electroreduction of Carbon Dioxide to Ethylene in Water. ACS Catal. 2021, 11, 958–966. [Google Scholar] [CrossRef]
  28. Le, T.; Salavati-Fard, T.; Wang, B. Plasmonic Energetic Electrons Drive CO2 Reduction on Defective Cu2O. ACS Catal. 2023, 13, 6328–6337. [Google Scholar] [CrossRef]
  29. Yu, W.-B.; Yi, M.; Fu, H.-H.; Pei, M.-J.; Liu, Y.; Xu, B.-M.; Li, Y.; Yan, W.; Zhang, J. Dandelion-Like Nanostructured Cu/Cu2O Heterojunctions with Fast Diffusion Channels Enabling Rapid Photocatalytic Pollutant Removal. ACS Appl. Nano Mater. 2023, 6, 2928–2941. [Google Scholar] [CrossRef]
  30. Sotiriou, G.A.; Starsich, F.; Dasargyri, A.; Wurnig, M.C.; Krumeich, F.; Boss, A.; Leroux, J.; Pratsinis, S.E. Photothermal Killing of Cancer Cells by the Controlled Plasmonic Coupling of Silica-Coated Au/Fe2O3 Nanoaggregates. Adv. Funct. Mater. 2014, 24, 2818–2827. [Google Scholar] [CrossRef]
  31. Ye, Y.; Chen, J.; Ding, Q.; Lin, D.; Dong, R.; Yang, L.; Liu, J. Sea-urchin-like Fe3O4@C@Ag particles: An efficient SERS substrate for detection of organic pollutants. Nanoscale 2013, 5, 5887–5895. [Google Scholar] [CrossRef] [PubMed]
  32. Riedel, R.; Mahr, N.; Yao, C.; Wu, A.; Yang, F.; Hampp, N. Synthesis of gold–silica core–shell nanoparticles by pulsed laser ablation in liquid and their physico-chemical properties towards photothermal cancer therapy. Nanoscale 2020, 12, 3007–3018. [Google Scholar] [CrossRef] [PubMed]
  33. Li, F.; Tang, H.; Yang, H.; Cao, Y.; Zhou, T.; Wang, G. Steering electrochemical CO2 reduction selectivity toward CH4 or C2H4 on N-doped carbon-coated Cu/Cu2O composite catalysts. ACS Catal. 2024, 14, 15088–15095. [Google Scholar] [CrossRef]
  34. Kim, J.Y.; Hong, D.; Lee, J.C.; Kim, H.G.; Lee, S.; Shin, S.; Kim, B.; Lee, H.; Kim, M.; Oh, J.; et al. Quasi-graphitic carbon shell-induced Cu confinement promotes electrocatalytic CO2 reduction toward C2+ products. Nat. Commun. 2021, 12, 3765. [Google Scholar] [CrossRef]
  35. Cardona, J.E.M.; Louaguef, D.; Gaffet, E.; Ashammakhi, N.; Alem, H. Review of core/shell nanostructures presenting good hyperthermia properties for cancer therapy. Mater. Chem. Front. 2021, 5, 6429–6443. [Google Scholar] [CrossRef]
  36. Gong, T.; Wang, X.; Zhu, H.; Wen, C.; Ma, Q.; Li, X.; Li, M.; Guo, R.; Liang, W. Folic acid–maltodextrin polymer coated magnetic graphene oxide as a NIR-responsive nano-drug delivery system for chemo-photothermal synergistic inhibition of tumor cells. RSC Adv. 2023, 13, 12609–12617. [Google Scholar] [CrossRef]
  37. Li, F.; Qian, Q.; Yan, F.; Yuan, G. Nitrogen-doped porous carbon microspherules as supports for preparing monodisperse nickel nanoparticles. Carbon 2006, 44, 128–132. [Google Scholar] [CrossRef]
  38. Zou, R.; Liu, Q.; He, G.; Yuen, M.F.; Xu, K.; Hu, J.; Parkin, I.P.; Lee, C.; Zhang, W. Nanoparticles Encapsulated in Porous Carbon Matrix Coated on Carbon Fibers: An Ultrastable Cathode for Li-Ion Batteries. Adv. Energy Mater. 2016, 7, 1601363. [Google Scholar] [CrossRef]
  39. He, X.; Peng, Z.; Shen, P.; Miao, C.; Xie, J.; Deng, C.; Kougias, P.G.; Shen, D.; Lin, R. Promoting Multi-Carbon Fatty Acids Production from Microbial Chain Elongation of CO2/H2 with Carbonaceous Materials. ACS Sustain. Chem. Eng. 2025, 13, 6720–6734. [Google Scholar] [CrossRef]
  40. Zhu, S.; Huang, X.; Yang, X.-B.; Peng, P.; Li, Z.; Jin, C. Enhanced Transformation of Cr(VI) by Heterocyclic-N within Nitrogen-Doped Biochar: Impact of Surface Modulatory Persistent Free Radicals (PFRs). Environ. Sci. Technol. 2020, 54, 8123–8132. [Google Scholar] [CrossRef] [PubMed]
  41. Zhong, D.; Jiang, Y.; Zhao, Z.; Wang, L.; Chen, J.; Ren, S.; Liu, Z.; Zhang, Y.; Tsang, D.C.W.; Crittenden, J.C. pH Dependence of Arsenic Oxidation by Rice-Husk-Derived Biochar: Roles of Redox-Active Moieties. Environ. Sci. Technol. 2019, 53, 9034–9044. [Google Scholar] [CrossRef]
  42. Guo, S.; Li, Y.; Wang, Y.; Wang, L.; Sun, Y.; Liu, L. Recent advances in biochar-based adsorbents for CO2 capture. Carbon Capture Sci. Technol. 2022, 4, 100059. [Google Scholar] [CrossRef]
  43. Khan, A.; Rashid, A.; Younas, R.; Chong, R. A chemical reduction approach to the synthesis of copper nanoparticles. Int. Nano Lett. 2015, 6, 21–26. [Google Scholar] [CrossRef]
  44. Yang, G.; Zhang, Q.; Fang, Q.; Li, W.; Wei, H.; Zhao, T.; Zhang, Y.; Huang, G.; Cui, C.; Zhang, K. Preparation of nickel nanoparticle-decorated graphene/copper composites with enhanced interfacial bonding and heat dissipation properties. J. Alloys Compd. 2025, 1028, 180696. [Google Scholar] [CrossRef]
  45. Yook, J.Y.; Jun, J.; Kwak, S. Amino functionalization of carbon nanotube surfaces with NH3 plasma treatment. Appl. Surf. Sci. 2010, 256, 6941–6944. [Google Scholar] [CrossRef]
  46. Al Mesfer, M.K.; Danish, M. Breakthrough adsorption study of activated carbons for CO2 separation from flue gas. J. Environ. Chem. Eng. 2018, 6, 4514–4524. [Google Scholar] [CrossRef]
  47. Shin, H.K.; Kim, C.; Talkner, P.; Lee, E.K. Brownian motion from molecular dynamics. Chem. Phys. 2010, 375, 316–326. [Google Scholar] [CrossRef]
  48. Chen, C.; Zhang, J.; Qi, Y.; Zhang, J.; Guo, T.; Wang, H. Locust leaves-derived biochar coupled CuxO composites for efficient electrocatalytic CO2 reduction. Fuel 2024, 372, 132245. [Google Scholar] [CrossRef]
  49. Dong, L.; Feng, D.; Zhang, Y.; Wang, Z.; Zhao, Y.; Du, Q.; Gao, J.; Sun, S. Mechanism of biochar-Cu-based catalysts construction and its electrochemical CO2 reduction performance. Carbon Capture Sci. Technol. 2024, 13, 100250. [Google Scholar] [CrossRef]
  50. Wang, X.; Hu, Y.; Zhou, Y.; Zhu, S.; Cui, J.; Song, B.; Zhu, W. High-Performance Electrocatalytic Reduction of Carbon Dioxide to Carbon Monoxide Using Biochar-Supported Gold Nanoparticles. Energy Fuels 2025, 39, 9907–9916. [Google Scholar] [CrossRef]
  51. Lei, F.; Liu, W.; Sun, Y.; Xu, J.; Liu, K.; Liang, L.; Yao, T.; Pan, B.; Wei, S.; Xie, Y. Metallic tin quantum sheets confined in graphene toward high-efficiency carbon dioxide electroreduction. Nat. Commun. 2016, 7, 12697. [Google Scholar] [CrossRef]
  52. Zhang, S.; Kang, P.; Meyer, T.J. Nanostructured tin catalysts for selective electrochemical reduction of carbon dioxide to formate. J. Am. Chem. Soc. 2014, 136, 1734–1737. [Google Scholar] [CrossRef]
  53. Yan, Z.; Wang, X.; Tan, Y.; Liu, A.; Luo, F.; Zhang, M.; Zeng, L.; Zhang, Y. The in situ growth of Cu2O with a honeycomb structure on a roughed graphite paper for the efficient electroreduction of CO2 to C2H4. Catal. Sci. Technol. 2021, 11, 6742–6749. [Google Scholar] [CrossRef]
  54. Chu, S.; Yan, X.; Choi, C.; Hong, S.; Robertson, A.W.; Masa, J.; Han, B.; Jung, Y.; Sun, Z. Stabilization of Cu+ by tuning a CuO–CeO2 interface for selective electrochemical CO2 reduction to ethylene. Green Chem. 2020, 22, 6540–6546. [Google Scholar] [CrossRef]
  55. Yang, Z.; Chen, Y.; Wen, X.; Guo, X.; Wei, R.; Gao, L.; Pan, X.; Zhang, J.; Xiao, G. Modulable Cu(0)/Cu(I)/Cu(II) sites of Cu/C catalysts derived from MOF for highly selective CO2 electroreduction to hydrocarbons. Vacuum 2023, 215, 112231. [Google Scholar] [CrossRef]
  56. Ning, H.; Mao, Q.; Wang, W.; Yang, Z.; Wang, X.; Zhao, Q.; Song, Y.; Wu, M. N-doped reduced graphene oxide supported Cu2O nanocubes as high active catalyst for CO2 electroreduction to C2H4. J. Alloys Compd. 2019, 785, 7–12. [Google Scholar] [CrossRef]
  57. Jeon, Y.E.; Na Ko, Y.; Kim, J.; Choi, H.; Lee, W.; Kim, Y.E.; Lee, D.; Kim, H.Y.; Park, K.T. Selective production of ethylene from CO2 over CuAg tandem electrocatalysts. J. Ind. Eng. Chem. 2022, 116, 191–198. [Google Scholar] [CrossRef]
  58. Cheng, Y.-S.; Chu, X.-P.; Ling, M.; Li, N.; Wu, K.-L.; Wu, F.-H.; Li, H.; Yuan, G.; Wei, X.-W. An MOF-derived copper@nitrogen-doped carbon composite: The synergistic effects of N-types and copper on selective CO2 electroreduction. Catal. Sci. Technol. 2019, 9, 5668–5675. [Google Scholar] [CrossRef]
  59. Wang, M.; Zhang, Q.; Xie, Q.; Wan, L.; Zhao, Y.; Zhang, X.; Luo, J. Selective electrochemical reduction of carbon dioxide to ethylene on a copper hydroxide nitrate nanostructure electrode. Nanoscale 2020, 12, 17013–17019. [Google Scholar] [CrossRef]
  60. Chen, H.; Wang, Z.; Wei, X.; Liu, S.; Guo, P.; Han, P.; Wang, H.; Zhang, J.; Lu, X.; Wei, B. Promotion of electrochemical CO2 reduction to ethylene on phosphorus-doped copper nanocrystals with stable Cuδ+ sites. Appl. Surf. Sci. 2021, 544, 148965. [Google Scholar] [CrossRef]
  61. Wang, Z.; Shang, Y.; Chen, H.; Cao, S.; Zhu, Q.; Liu, S.; Wei, S.; Lu, X. Toward highly active electrochemical CO2 reduction to C2H4 by copper hydroxyphosphate. J. Solid State Electrochem. 2023, 27, 1279–1287. [Google Scholar] [CrossRef]
  62. Chang, Z.; Huo, S.-J.; Zhang, W.; Fang, J.; Wang, H. The Tunable and Highly Selective Reduction Products on Ag@Cu Bimetallic Catalysts Toward CO2 Electrochemical Reduction Reaction. J. Phys. Chem. C 2017, 121, 11368–11379. [Google Scholar] [CrossRef]
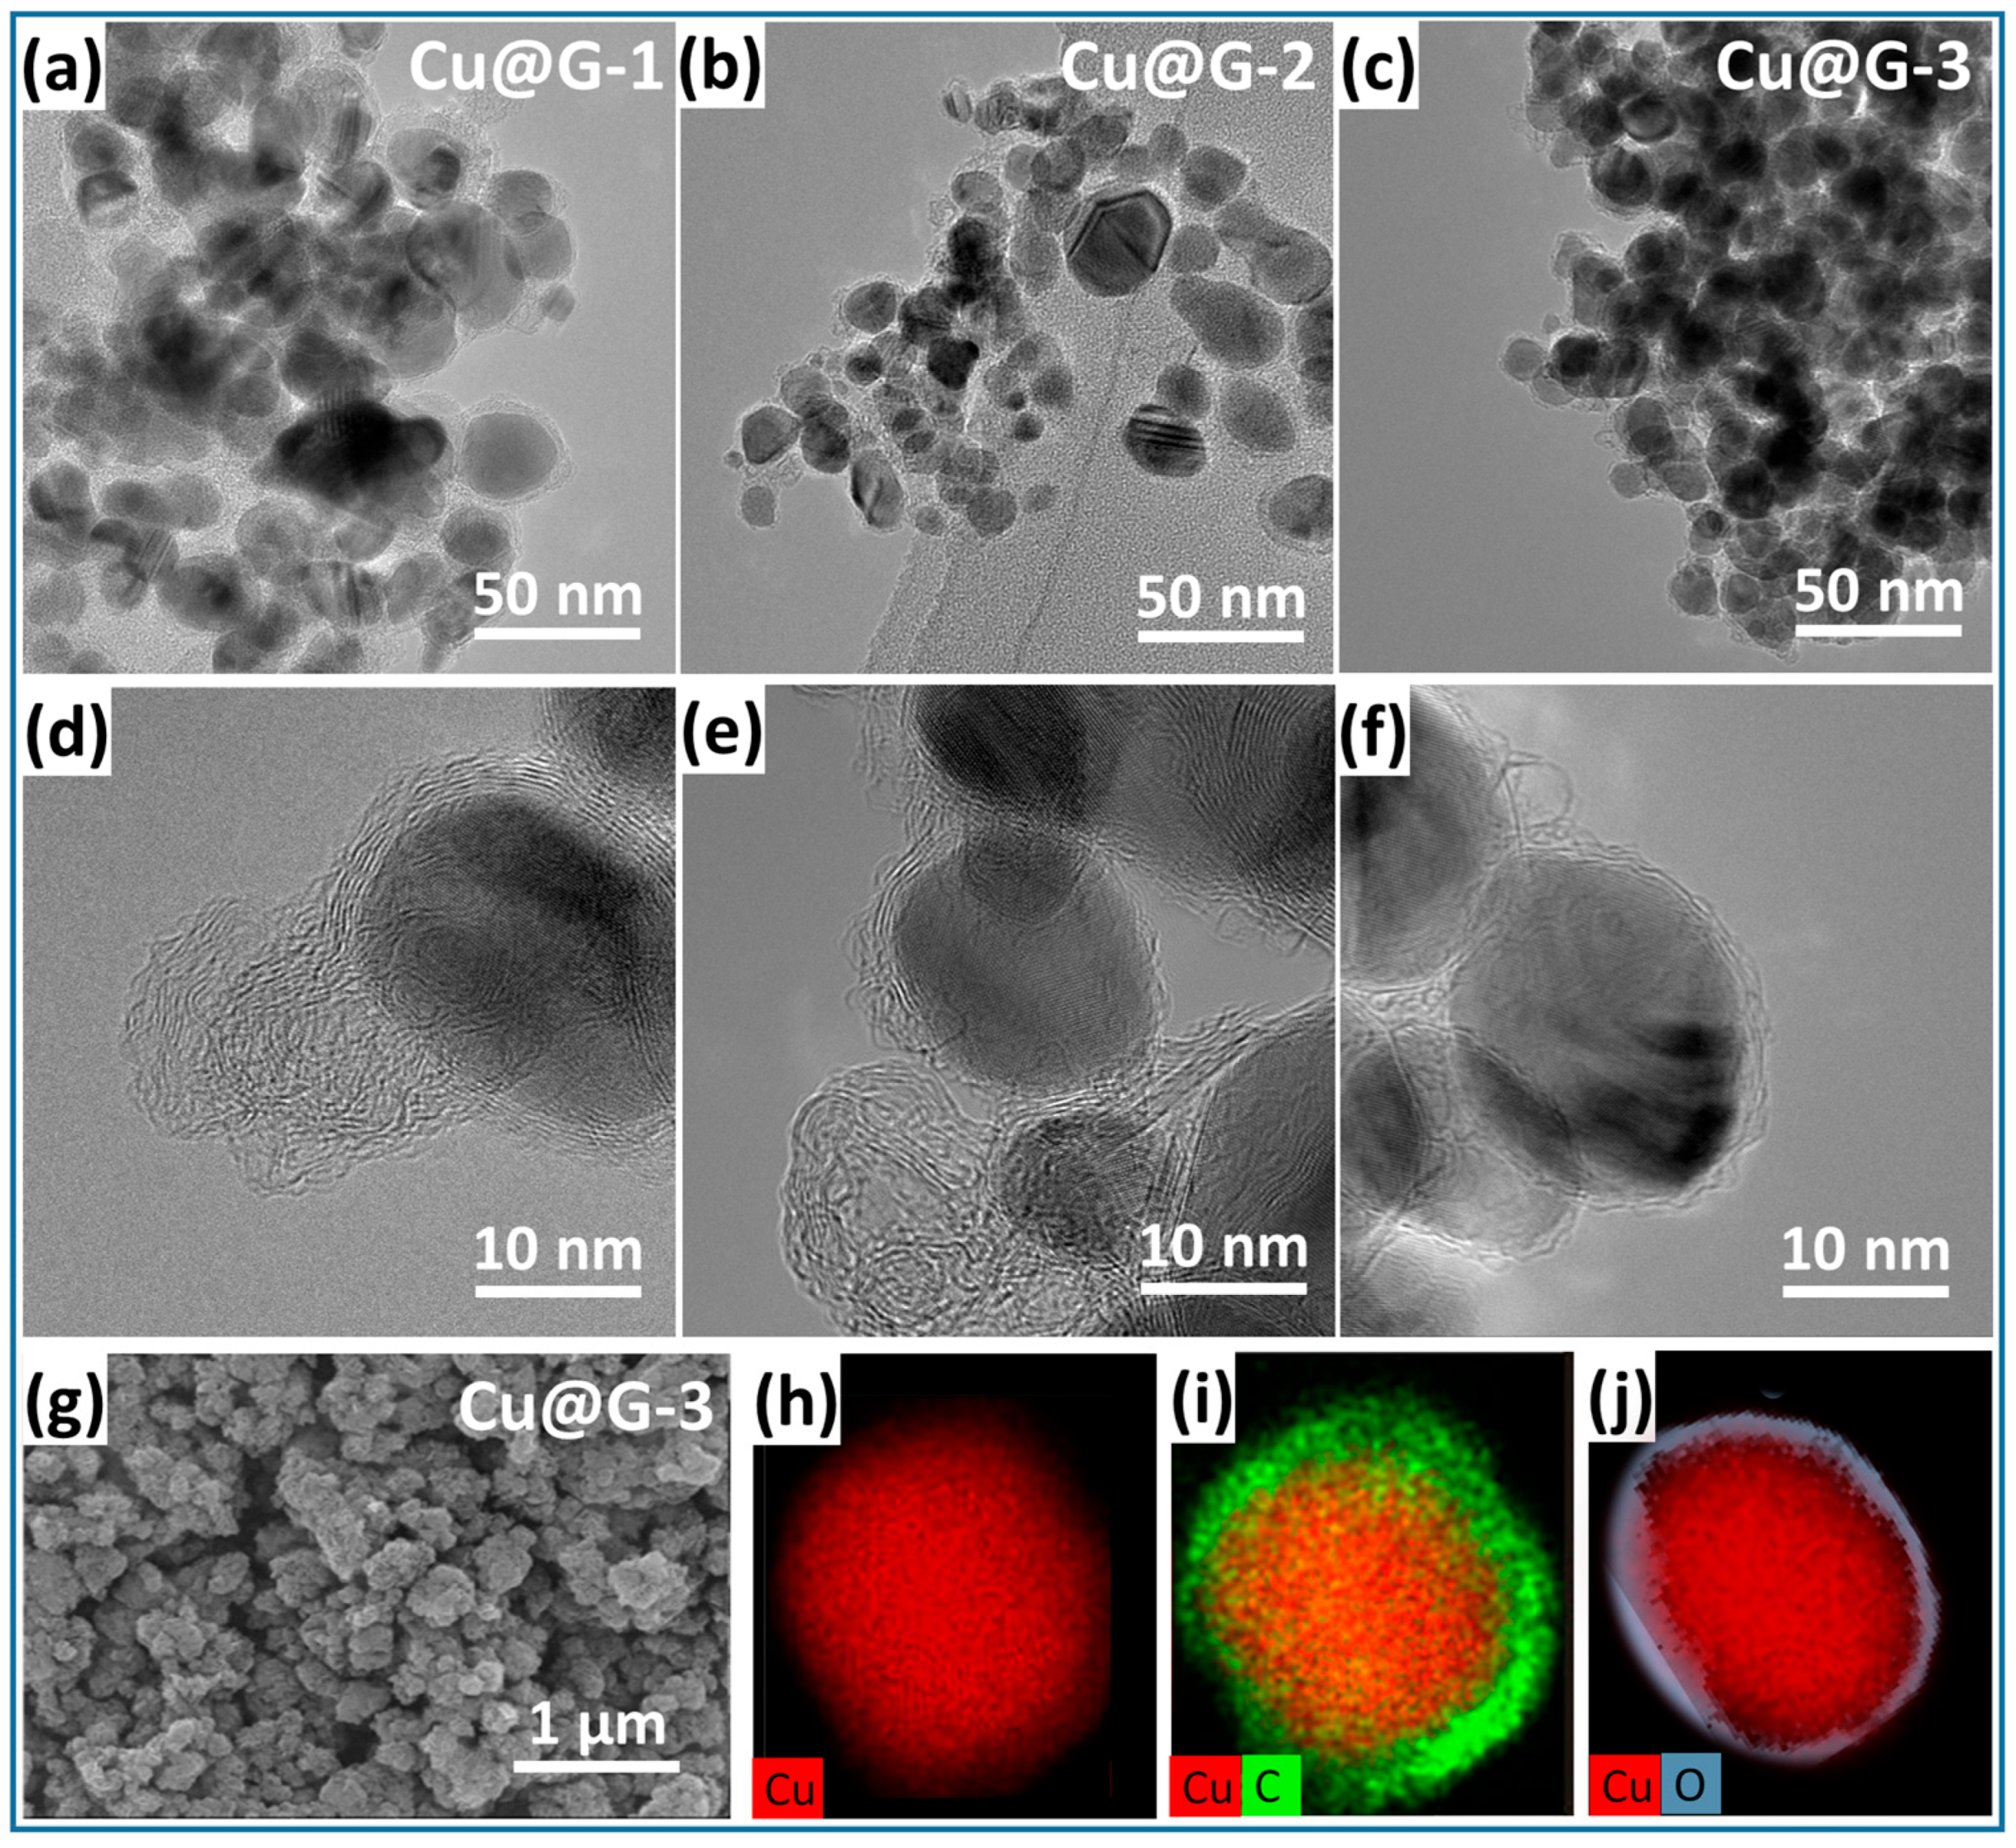
Figure 1. TEM images of Cu@G-1 (a,d), Cu@G-2 (b,e), and Cu@G-3 (c,f). Scanning electron microscopy (SEM) image of Cu@G-3 (g). EDS mapping images of Cu@G-3 (hj).
Catalysts 15 00767 g001
Figure 2. Distribution of coating shell thickness (a) and Cu core diameter (b) of Cu@G NPs. X-ray diffraction (XRD) pattern (c), Raman spectrum (d), N2 adsorption–desorption (e), and Cu LMM spectrum (f) of Cu@G-3 NPs.
Catalysts 15 00767 g002
Figure 3. SEM images of B300 (a,b), Cu@G/B300 (c,d), B450 (e,f), Cu@G/B450 (g,h), B600 (i,j), and Cu@G/B600 (k,l).
Catalysts 15 00767 g003
Figure 4. TEM image of Cu@G/B600 (a). XRD patterns (b), N2 adsorption/desorption isotherms (c), and XPS survey spectra (d) of Cu@G/Bs.
Catalysts 15 00767 g004
Figure 5. Kinetics for the sorption of CO2 on Cu@G/Bs at 25 °C (a). Effect of circumstance temperature on the sorption of CO2 (b). Sorption isotherm of CO2 on Cu@G/Bs at 0 °C (c); the solid line is the Langmuir fitting, and the dashed line is the Freundlich fitting. Desorption and recycling usage of Cu@G/Bs for the capture of CO2 at 25 °C (d).
Catalysts 15 00767 g005
Figure 6. Linear sweep voltammogram (a). FEs for C2H4 (b). Partial current density for C2H4 at various potentials (c). Charging current density at various scanning rates (d). EIS Nyquist plots (e). Single oxidative scanning curves (f).
Catalysts 15 00767 g006
Figure 7. Stability of electrocatalytic reduction of Cu@G/B450 at the potential of −1.08 V vs. RHE (a). XRD pattern (b) and SEM image (c) of Cu@G/B450 after the electrocatalytic reduction of CO2.
Catalysts 15 00767 g007
Figure 8. Schematic diagram of fabricating Cu@G/Bs. (a) Preparation of Cu@G NPs; (b) Preparation of Bs; (c) Preparation of Cu@G/Bs.
Catalysts 15 00767 g008
Table 1. Porosity parameters of Cu@G/Bs.
SamplesTotal SA (m2/g)Micropore SA (m2/g)Average Pore DiameterTotal Pore Volume (cm3/g)Micropore Volume (cm3/g)
B3004.1016.80.01970
B45067.415.912.50.10840.0361
B600165.383.29.40.30160.1437
Cu@G/B30031.8014.20.04280
Cu@G/B45075.216.410.70.09830.0331
Cu@G/B600155.971.27.80.28960.1364
Table 2. Isotherm parameters of CO2 sorption (T = 0 °C).
SamplesLangmuirFreundlich
qmax (mg/g)kL (L/mg)R2n (mg/L)KF (L/mg)R2
Cu@G/B30061.110.04670.9892.28627.24950.991
Cu@G/B45077.820.06020.9922.804313.75930.979
Cu@G/B600107.030.05590.9942.700517.59470.978
Disclaimer/Publisher’s Note: The statements, opinions and data contained in all publications are solely those of the individual author(s) and contributor(s) and not of MDPI and/or the editor(s). MDPI and/or the editor(s) disclaim responsibility for any injury to people or property resulting from any ideas, methods, instructions or products referred to in the content.