Article

Rhizobium’s Reductase for Chromium Detoxification, Heavy Metal Resistance, and Artificial Neural Network-Based Predictive Modeling

1
Center of Excellence in Environmental Studies, King Abdulaziz University, Jeddah 21589, Saudi Arabia
2
Department of Biological Science, Faculty of Science, King Abdulaziz University, Jeddah 21589, Saudi Arabia
3
Department of Biochemistry, College of Science, King Saud University, Riyadh 11451, Saudi Arabia
*
Author to whom correspondence should be addressed.
Catalysts 2025, 15(8), 726; https://doi.org/10.3390/catal15080726 (registering DOI)
Submission received: 4 May 2025 / Revised: 16 July 2025 / Accepted: 25 July 2025 / Published: 30 July 2025

Abstract

This study analyzed the heavy metal tolerance and chromium reduction and the potential of plant growth to promote Rhizobium sp. OS-1. By genetic makeup, the Rhizobium strain is nitrogen-fixing and phosphate-solubilizing in metal-contaminated agricultural soil. Among the Rhizobium group, bacterial strain OS-1 showed a significant tolerance to heavy metals, particularly chromium (900 µg/mL), zinc (700 µg/mL), and copper. In the initial investigation, the bacteria strains were morphologically short-rod, Gram-negative, appeared as light pink colonies on media plates, and were biochemically positive for catalase reaction and the ability to ferment glucose, sucrose, and mannitol. Further, bacterial genomic DNA was isolated and amplified with the 16SrRNA gene and sequencing; the obtained 16S rRNA sequence achieved accession no. HE663761.1 from the NCBI GenBank, and it was confirmed that the strain belongs to the Rhizobium genus by phylogenetic analysis. The strain’s performance was best for high hexavalent chromium [Cr(VI)] reduction at 7–8 pH and a temperature of 30 °C, resulting in a total decrease in 96 h. Additionally, the adsorption isotherm Freundlich and Langmuir models fit best for this study, revealing a large biosorption capacity, with Cr(VI) having the highest affinity. Further bacterial chromium reduction was confirmed by an enzymatic test of nitro reductase and chromate reductase activity in bacterial extract. Further, from the metal biosorption study, an Artificial Neural Network (ANN) model was built to assess the metal reduction capability, considering the variables of pH, temperature, incubation duration, and initial metal concentration. The model attained an excellent expected accuracy (R2 > 0.90). With these features, this bacterial strain is excellent for bioremediation and use for industrial purposes and agricultural sustainability in metal-contaminated agricultural fields.

1. Introduction

Recent environmental contamination studies have shown that heavy metal pollution is increasing significantly due to modernization and the high demand for chemical products for diverse applications. Among the heavy metals, Cr(VI) is one of the most hazardous metals responsible for carcinogenic and mutagenic impacts on humans [1]. The metal Cr(VI) has applications in various industries, including leather tanning, electroplating, and color production plants [2]. These industries release Cr-contaminated effluent and byproducts. Industrial effluents have highly contaminated Cr(VI) due to their high water solubility and rapid mobility, posing a significant risk to the water resources and soil integrity of contaminated surroundings [3]. While Cr(III) is another oxidation state of metal chromium, it is much less toxic to plants and animals due to its insoluble nature, due to conversion in a less toxic form, rendering the reduction of Cr(VI) to Cr(III) an essential objective in remediation initiatives [4]. The remediation methods, including chemical reduction and adsorption, have effectively addressed Cr(VI) pollution. These techniques have limitations, including elevated operating costs, secondary pollution, and diminished effectiveness at larger scales. Recent years have showcased the potential of bioremediation as an alternative. Leveraging the natural reduction capabilities of bacteria presents a cost-effective and sustainable solution for large-scale chromium detoxification. Several bacteria, fungi, and algae have been recognized for their capacity to convert Cr(VI) to Cr(III) [5,6,7]. Beyond nitrogen fixation, certain Rhizobium strains demonstrate significant tolerance to abiotic stresses, including heavy metal contamination [8]. These strains can actively participate in the detoxification of metals, such as Cr-VI, through biosorption and enzymatic reduction mechanisms [9]. This not only reduces heavy metal toxicity in soils but also promotes plant growth and yield, even under adverse conditions.
The application of Rhizobium as a bioinoculant has been shown to enhance crop productivity, increase nutrient availability, and support the restoration of soil health in degraded or contaminated lands [10]. Furthermore, Rhizobium produces plant growth-promoting substances and can enhance plant resilience against pathogens, which further contributes to the sustainability of ecosystems [11,12]. Integrating Rhizobium into agricultural systems thus offers a cost-effective and eco-friendly solution for improving soil quality, rehabilitating polluted environments, and supporting sustainable food production [13].
In recent years, microbial biotechnology advancements have resulted in genetically modified strains with improved reduction capabilities [14]. However, researchers have looked at the microbial consortia to improve sustainability and chromium reduction rates. These advances offer the bioremediation method as a reliable and reasonably priced way to clean different Cr(VI) contamination settings. Rhizobium species play a significant role in the transformation of the toxic Cr(VI) to the relatively non-lethal Cr(III) in contaminated soils [15]. This bio-remedial strategy involves the use of enzymes like chromate reductase in bacteria to supply the necessary electron transfer to induce the reduction of Cr(VI) [16]. These bacteria are multifunctional; the Cr(VI) is converted to Cr(III), enhancing plant growth by increasing nitrogen-fixing action and phosphate solubilization and reducing metal stress in legumes.
In this study, microbial consortia isolated from Northern India were screened for their resistance to heavy metals, ability to reduce Cr (VI), potential for phosphate solubilization, and other plant growth-promoting factors to boost soil fertility. Additionally, bacteria were genetically characterized at the species level and certified by a gene bank. The production of chromate reductase enzymes and the process of metal biosorption will also be analyzed. The findings will be integrated into a theoretical framework to develop a predictive model for future studies on chromium reduction under real conditions. Through mechanisms such as biosorption, bioaccumulation, and enzymatic reduction, these bacteria can convert toxic metals into safer forms, making the soil more conducive to plant growth. Their activities not only detoxify contaminated soils but also promote healthier crops and enhanced soil fertility. Based on these capabilities, it is expected that introducing specific microbial strains to chromium-contaminated soils will significantly improve heavy metal removal while fostering sustainable agricultural outputs.

2. Results

2.1. Screening of Potential Rhizobacteria

Isolated bacterial colonies were examined, resulting in the identification of forty colonies capable of solubilizing phosphate and twenty colonies with the ability to fix nitrogen. Among the twenty rhizobia isolates that exhibited both nitrogen-fixing and phosphate-solubilizing abilities in the presence of heavy metals, only one bacterial culture was identified at the species level. This identification was made from the nodules formed on the root systems of pea plants grown in average sandy clay soils. These rhizobia isolates belong to the genus Rhizobium. The PGPR found in the rhizosphere of bean plants is likely nitrogen-fixing bacteria called Rhizobium spp. This was determined by comparing their biochemical, morphological, and cultural traits with those listed in Bergey’s Manual of Determinative Bacteriology, biochemical test (Table 1).
In this study, the Rhizobium strain was tested using several biochemical tests:
Gelatin Liquefaction Test: The Rhizobium strain was unable to hydrolyze gelatin, indicating a negative result for gelatinase enzyme activity during bacterial growth.
Starch Breakdown: Strain OS-1 demonstrated the presence of amylase enzyme activity, as evidenced by the clear zone that appeared around the bacterial growth colony on the starch agar plate after the addition of iodine. This indicates the strain’s ability to break down starch into simple sugars.
Carbohydrate Utilization Tests: These tests assessed the strain’s ability to utilize different carbohydrates as carbon sources, typically measuring acid production detected by a pH indicator. Bacterial strain OS-1 showed positive results for efficiently utilizing glucose, sucrose, and mannitol, supporting its role as a carbon and energy source for growth and multiplication.

Heavy Metal Tolerance Capability of Strain OS-1

Augmenting YEM broth in all metals and enriching the bacterial strain for 10 consecutive days, this study investigated the metal-tolerant PGPR strains; namely, eight different PGPR strains. The bacterial growth was observed at five days of growth at 28 ± 2 °C. Out of the five strains, Rhizobium sp. OS-1 was found to exhibit a remarkably different growth profile when grown in YEM broth containing variable concentrations of Cd(II), Cr(IV), Cu(II), Ni(II), and Zn(II). The bacterial growth decreased as the incubation duration and metal concentration increased. Cd(II) was found to be the most damaging metal to both nitrogen-fixing and non-fixing species at the highest metal concentration (150 μg/mL). The toxicity of each metal to the eight different rhizobial isolates increased in the following order based on the average number of cells that survived at 150 μg/mL: Rhizobium sp.: Cd(II) > Ni(II) > Zn(II) > Cu(II) > Cr(VI), with a range of 4.3% for Rhizobium sp. OS-1 compared to the untreated control (Supplementary Information Figure S1). The isolated microbial strain Rhizobium OS-1 revealed an excellent potential for metal tolerance based on survival in the presence of high doses of metal in growing conditions. The bacterium isolate OS-1 exhibits the highest tolerance to Cr(VI) with a survival concentration nearing 900 µg/mL, followed by Zn with a survival concentration of approximately 700 µg/mL, as shown in Figure 1. Other metals like Cu(II) showed moderate tolerance with a survival concentration of around 600 µg/mL, and Ni(II) and Cd(II) showed lower tolerances near 400 and 300 µg/mL, respectively.

2.2. Optimum pH and Temperature for Heavy Metals Accumulation

The isolate Rhizobium sp. OS-1 reduced Cr(VI) at different rates depending on the pH level. The isolate Rhizobium OS-1 entirely reduced Cr(VI) after 96 h of incubation at pH 7 and pH 8. The level of residual Cr(VI) because of the growth of bacteria reduced as the incubation time extended. Furthermore, the remaining Cr(VI), which was not removed by the iron oxide-coated sand, declined gradually with increasing pH until pH 7, and then augmented progressively with increasing pH up to pH 10 (Figure 1b). The bacterial strain OS-1 was cultured in NB medium at 25, 30, 35, and 40 °C with an initial pH of 7. As identified in this study, these temperatures elicited various impacts on the Cr(VI) reduction in the solution. For each bacterial culture, the highest Cr(VI) reduction rate was attained at 30 °C, and as the temperature increased beyond this, it reduced progressively. Table S1, shows the effect of 25 °C on the reduction of Cr(VI) after 48 h of growth of Rhizobium sp. OS-1. After 12 h at 35 °C, the reduction of Cr(VI) for Rhizobium sp. OS-1 was detected, with reductions of 66%, 30%, and 19% at 25, 30, and 40 °C, respectively (Figure 1c).

2.3. The 16s rRNA Gene Sequencing and Characterization of Strain OS-1

Species-level identification of the bacterial cultures obtained from primary groups was made possible by Macrogen, Inc. of Seoul, South Korea, through the analysis of 16S rRNA gene sequences. These gene sequences underwent nucleotide sequence-based BLASTn analysis via the NCBI website to confirm their similarity to other bacterial genomes. Bacterial isolate was identified as Rhizobium sp. OS-1 and assigned GenBank accession number HE663761.1(sequence in Supplementary File). The 16S rRNA partial gene sequence was given an entry number upon submission to EMBL and NCBI’s nucleotide-based GenBank. Further, the biochemical, morphological, and cultural attributes were compared with those in Bergey’s Manual of Determinative Bacteriology. The results suggest that the PGPR identified in legume nodules are likely related to Rhizobium spp., a symbiotic nitrogen-fixing bacterium that coexists with the pea rhizosphere. All nucleotide sequences were analyzed using the NCBI online server via BLASTn analysis based on nucleotide sequences to achieve maximum similarity with the different bacterial sequences employed in the phylogenetic analysis. Subsequently, we obtained an accession number from the 16SrRNA partial gene sequences by submitting them to the nucleotide gene banks at EMBL and NCBI. The 16SrRNA sequences classified the bacterial strains into Group I, specifically Rhizobium sp. OS-1 (HE663761.1), in the GenBank database.

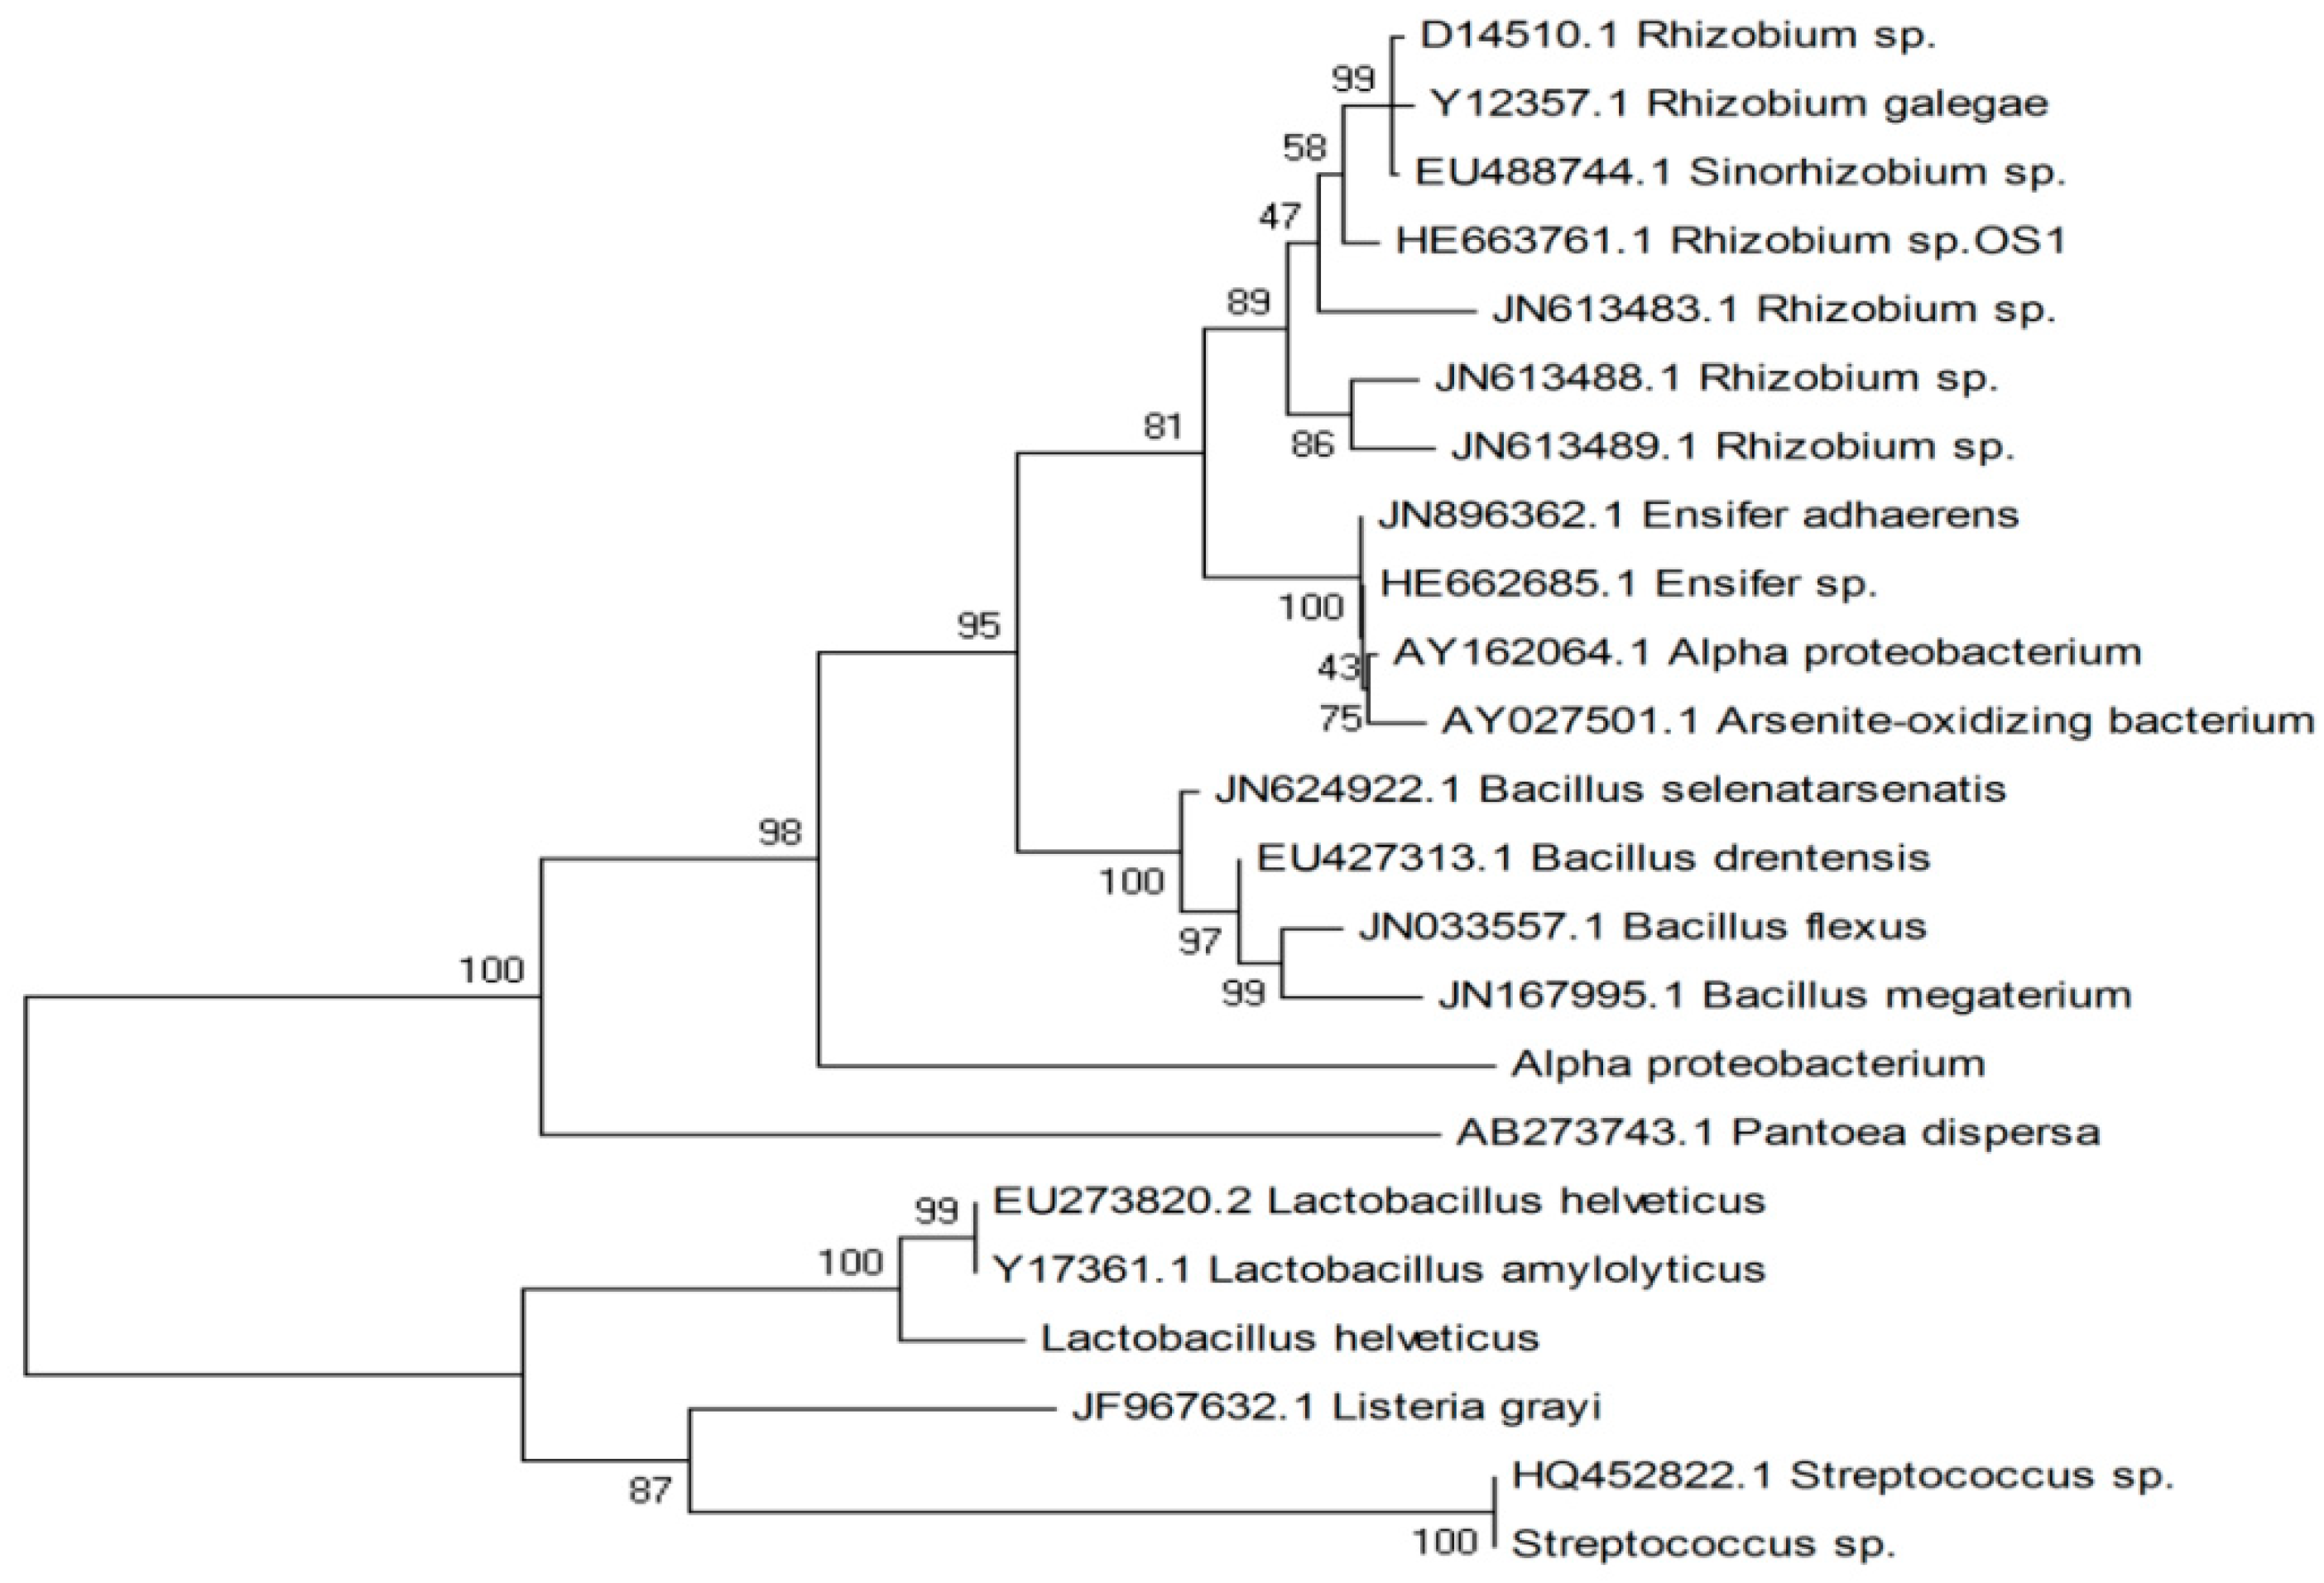
2.4. Rhizobium OS-1 Strain Phylogenetic Tree Construction

The accession number assigned to the rhizobial isolate was HE663761.1, and BLASTn analysis was performed on the 16S rRNA gene sequence. Afterward, a phylogenetic tree analysis was performed through MEGA 7 software. On this basis, the given lines of rhizobial isolates were identified to be affiliated with Rhizobium spp. In comparing the two 16S rRNA gene sequences, a simple phylogenetic consensus tree was created using reference sequences from the NCBI GenBank database. Notably, Rhizobium sp. OS-1 exhibited a distinct phylogenetic tree; in each case, the phylogenetic tree had a bootstrap value of 100 (Figure 2).

2.5. Chromium (VI) Reduction Assessment

The following text presents the in vitro analysis of the metal-tolerant PGPR isolate able to decrease Cr(VI), with one of the strains being Rhizobium sp. OS-1.

2.5.1. Chromium Initial Concentration, pH, and Temperature Effect on Cr(VI) Reduction

Rhizobium sp. OS-1 was found to reduce Cr-VI at different rates depending on the pH level, as shown in the heat map (Figure 3). A complete Cr(VI) reduction was observed after 96 h, at pH 7 and 8, by isolate OS-1. The remaining Cr(VI) concentration decreased consistently with increasing pH up to pH 7, then increased consistently up to pH 10. Different types of plant growth-promoting rhizobacteria (PGPR) changed how they broke down Cr(VI) in NB medium with a pH of 7 as the temperature changed from 25 to 30, 35, and 40 °C. The highest Cr(VI) reduction for each bacterial culture was observed at 30 °C and gradually decreased afterward. Table S1 presents the impact of 25 °C on the reduction of Cr(VI) over 48 h of growth of Rhizobium sp. OS-1. After 12 h at 35 °C, the Cr(VI) level dropped for Rhizobium sp. OS-1. At 25, 30, and 40 °C, it dropped by 66%, 30%, and 22%, respectively. This study looked at how well PGPR strains could lower Cr(VI) using NB with 25, 50, 100, and 200 μgml-1 K2Cr2O7 added. The goal was to find out how Cr(VI) affects the ability of some cultures to lower the activity. Cr(VI) reduction reached its maximum after optimal bacterial growth and continued to increase over time. After 12 h of growth, the concentration of Cr(VI) was completely reduced in this study, as shown in Figure 3 and the Supplementary File table (Table S1). Here, the heat map shows how different amounts of Cr(VI) affect the reduction by PGPR strains and Rhizobium sp. OS-1 shows the highest reduction rates at 87% and 50%, respectively.

2.5.2. Optimum pH and Temperature for Heavy Metal Accumulation

As shown in Table S1, Rhizobium sp. OS-1 reduced Cr-VI at different rates depending on the pH level. Strain OS-1 entirely reduced Cr after 96 h of incubation at pH 7 and 8. The concentration of residual Cr (VI) due to bacterial growth decreased as the incubation duration increased. Additionally, the residual Cr (VI) decreased steadily with rising pH up to pH 7, and then increased consistently up to pH 10. These bacterial strains were grown in NB medium adjusted to pH 7 at 25, 30, 35, and 40 °C. The Cr(VI) reduction was influenced differently by these temperatures. For each bacterial culture, maximum Cr(VI) reduction was also observed at 30 °C, and afterwards, the reducing power declined. The heat map in Figure 1 shows the effect of 25 °C on the decrease in Cr(VI) in 48 h of the growth of Rhizobium sp. OS-1. The reduction of Cr(VI) by Rhizobium sp. OS-1 was observed after 12 h at 35 °C; the decreases were 66%, 30%, and 19% at 25, 30, and 40 °C, respectively. This study tested the strains’ ability to reduce Cr(VI) using NB that had 25, 50, 100, and 200 μg/mL K2Cr2O7 added to it. The goal was to find out how Cr(VI) changes the ability of some cultures to reduce in vitro. After optimal bacterial growth, the Cr(VI) reduction reached its maximum and continued to rise over time. After 12 h of growth, the concentration of Cr(VI) was completely reduced in this study, as shown in the heat map in Figure 2 or Table S1. The table shows how different amounts of Cr(VI) affected the reduction by PGPR strains. Rhizobium sp. OS-1 had the biggest effect, increasing by 87% and 50%, respectively.

2.5.3. Biosorption Profile of Bacterial Isolate OS-1

The biosorption of various heavy metals by dry biomass from Rhizobium sp. OS-1 cultures cultivated for 24 h were evaluated using the Langmuir and Freundlich isotherms (Table 2)—the PGPR strains, including Rhizobium sp. OS-1, showed the best curve fit based on the values derived from the Freundlich and Langmuir isotherms (Figure 4a,b). The Freundlich and Langmuir adsorption constants were determined from the isotherms, and the correlation coefficient (r2 > 0.98) was constant for all PGPR strains. As depicted in the models, each PGPR strain showed a higher correlation coefficient (r2), suggesting that both models displayed better adsorption in most cases. The b value is related to the isotherm, sorption energy, and iso, and the more considerable b value means the metal ion has a stronger attraction. Based on Table 2, Rhizobium sp. OS-1 had the minimum value for Pb(II) and Zn(II) and the maximum value for Cr(VI). From the analysis, it has been noted that the bacterial biomass adsorption in order was Cr(VI) > Cu(II) > Ni(II) > Cd(II) > Zn(II) > Pb(II). The variation in K value was observed as K = 3.187 for Pb and K = 7.166 for chloride, while 1/n was different in both chloride, 0.549, and Pb, 0.752, which indicated that Rhizobium sp. OS-1 reached the maximum adsorption of chloride ions. Every value of Sf was positive and less than one, meaning the isotherm was favorable to the adsorption equation in this study. Table 2 shows that the Sf values of the metal ions found in Rhizobium sp. OS-1 were as follows: 0. Concentration of metal ion coverage on Rhizobium sp. OS-1 biomass was, in decreasing order, 10.04 for Cr(VI), 0.05 for Cu(II), 0.06 for Ni(II), 0.07 for Cd(II), 0.09 for Zn(II), and 0.12 for Pb(II).

2.6. Chromium Reduction Results at Variable Parameters

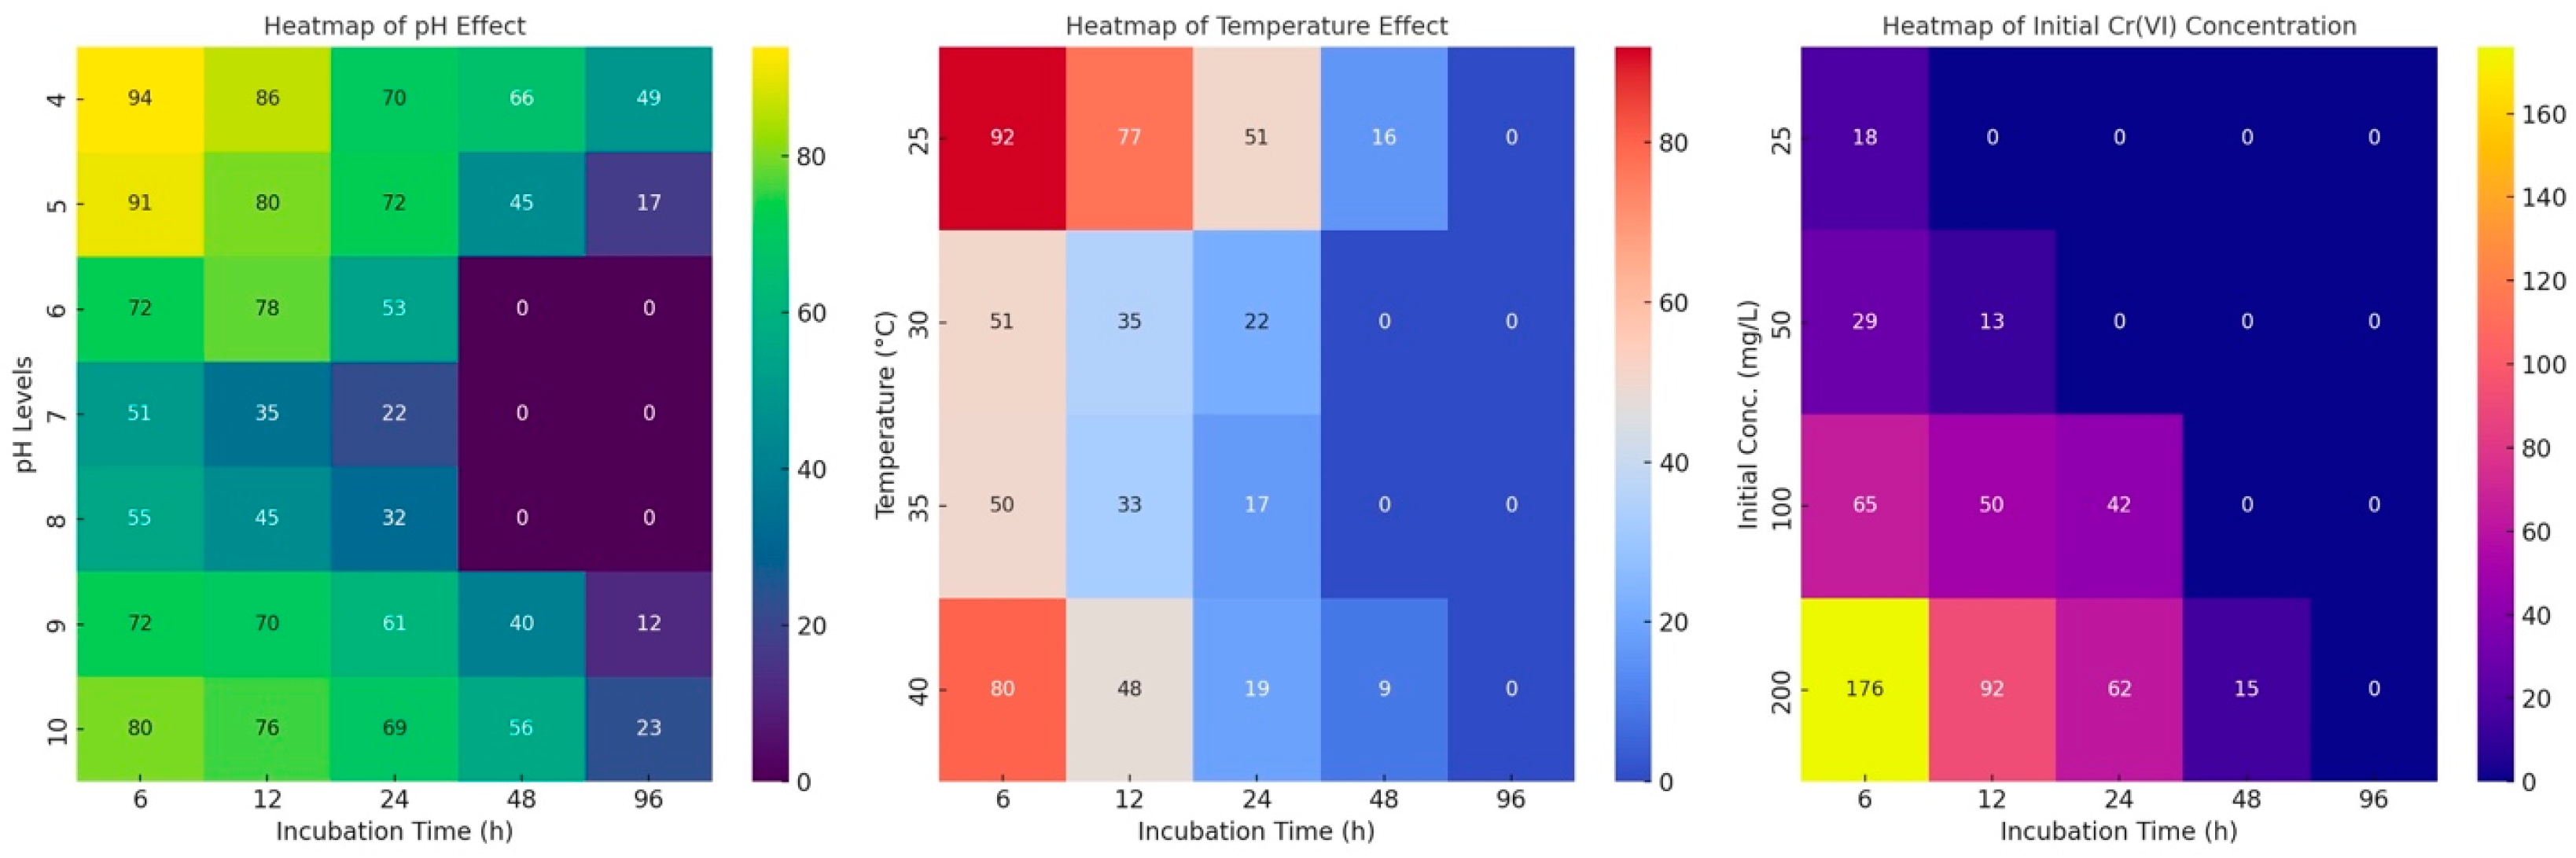
2.6.1. Effect of pH on Chromium Reduction

The reduction in Cr(VI) was most effective at acidic pH values, particularly pH 4, where the correlation coefficient was highest (0.97) and MAPE was lowest (3.2%). Efficiency dropped as pH rose; at pH 10, the correlation was 0.90 and the MAPE climbed to 5.0%. Acidic conditions favored microbial reduction, as microbial activity was highest at lower pH levels.

2.6.2. Effect of Temperature on Chromium Reduction

The optimal temperature for Cr(VI) reduction was found between 25 °C and 30 °C, where the model performed with a correlation coefficient between 0.93 and 0.95, and MAPE ranged between 3.3% and 3.8%. Efficiency slightly decreased at 40 °C; MAPE increased to 4.4% and the correlation value was 0.91. Increased temperatures undoubtedly caused microbial activity to be stressed, which reduced efficiency.

2.6.3. Effect of Contact Time on Chromium (VI) Reduction

With a MAPE of 3.0% and a correlation coefficient of 0.96 at six hours, the reduction efficiency was first rather high. Longer incubation periods, especially beyond 48 h, nevertheless saw a plateau in efficiency; the correlation coefficient dropped to 0.89 by 96 h. Indicating declining returns after prolonged exposure, MAPE also rose from 3.0% at 6 h to 4.5% at 96 h.

2.6.4. At Variable Initial Cr(VI) Concentration

At lower initial concentrations (25 mg/L), the model achieved high accuracy with a correlation coefficient of 0.96 and a MAPE of 3.1%. As the initial concentration increased to 200 mg/L, the correlation dropped to 0.91, and MAPE increased to 4.5%. Higher concentrations introduced more variability in reduction efficiency, potentially due to microbial stress at higher Cr(VI) levels.

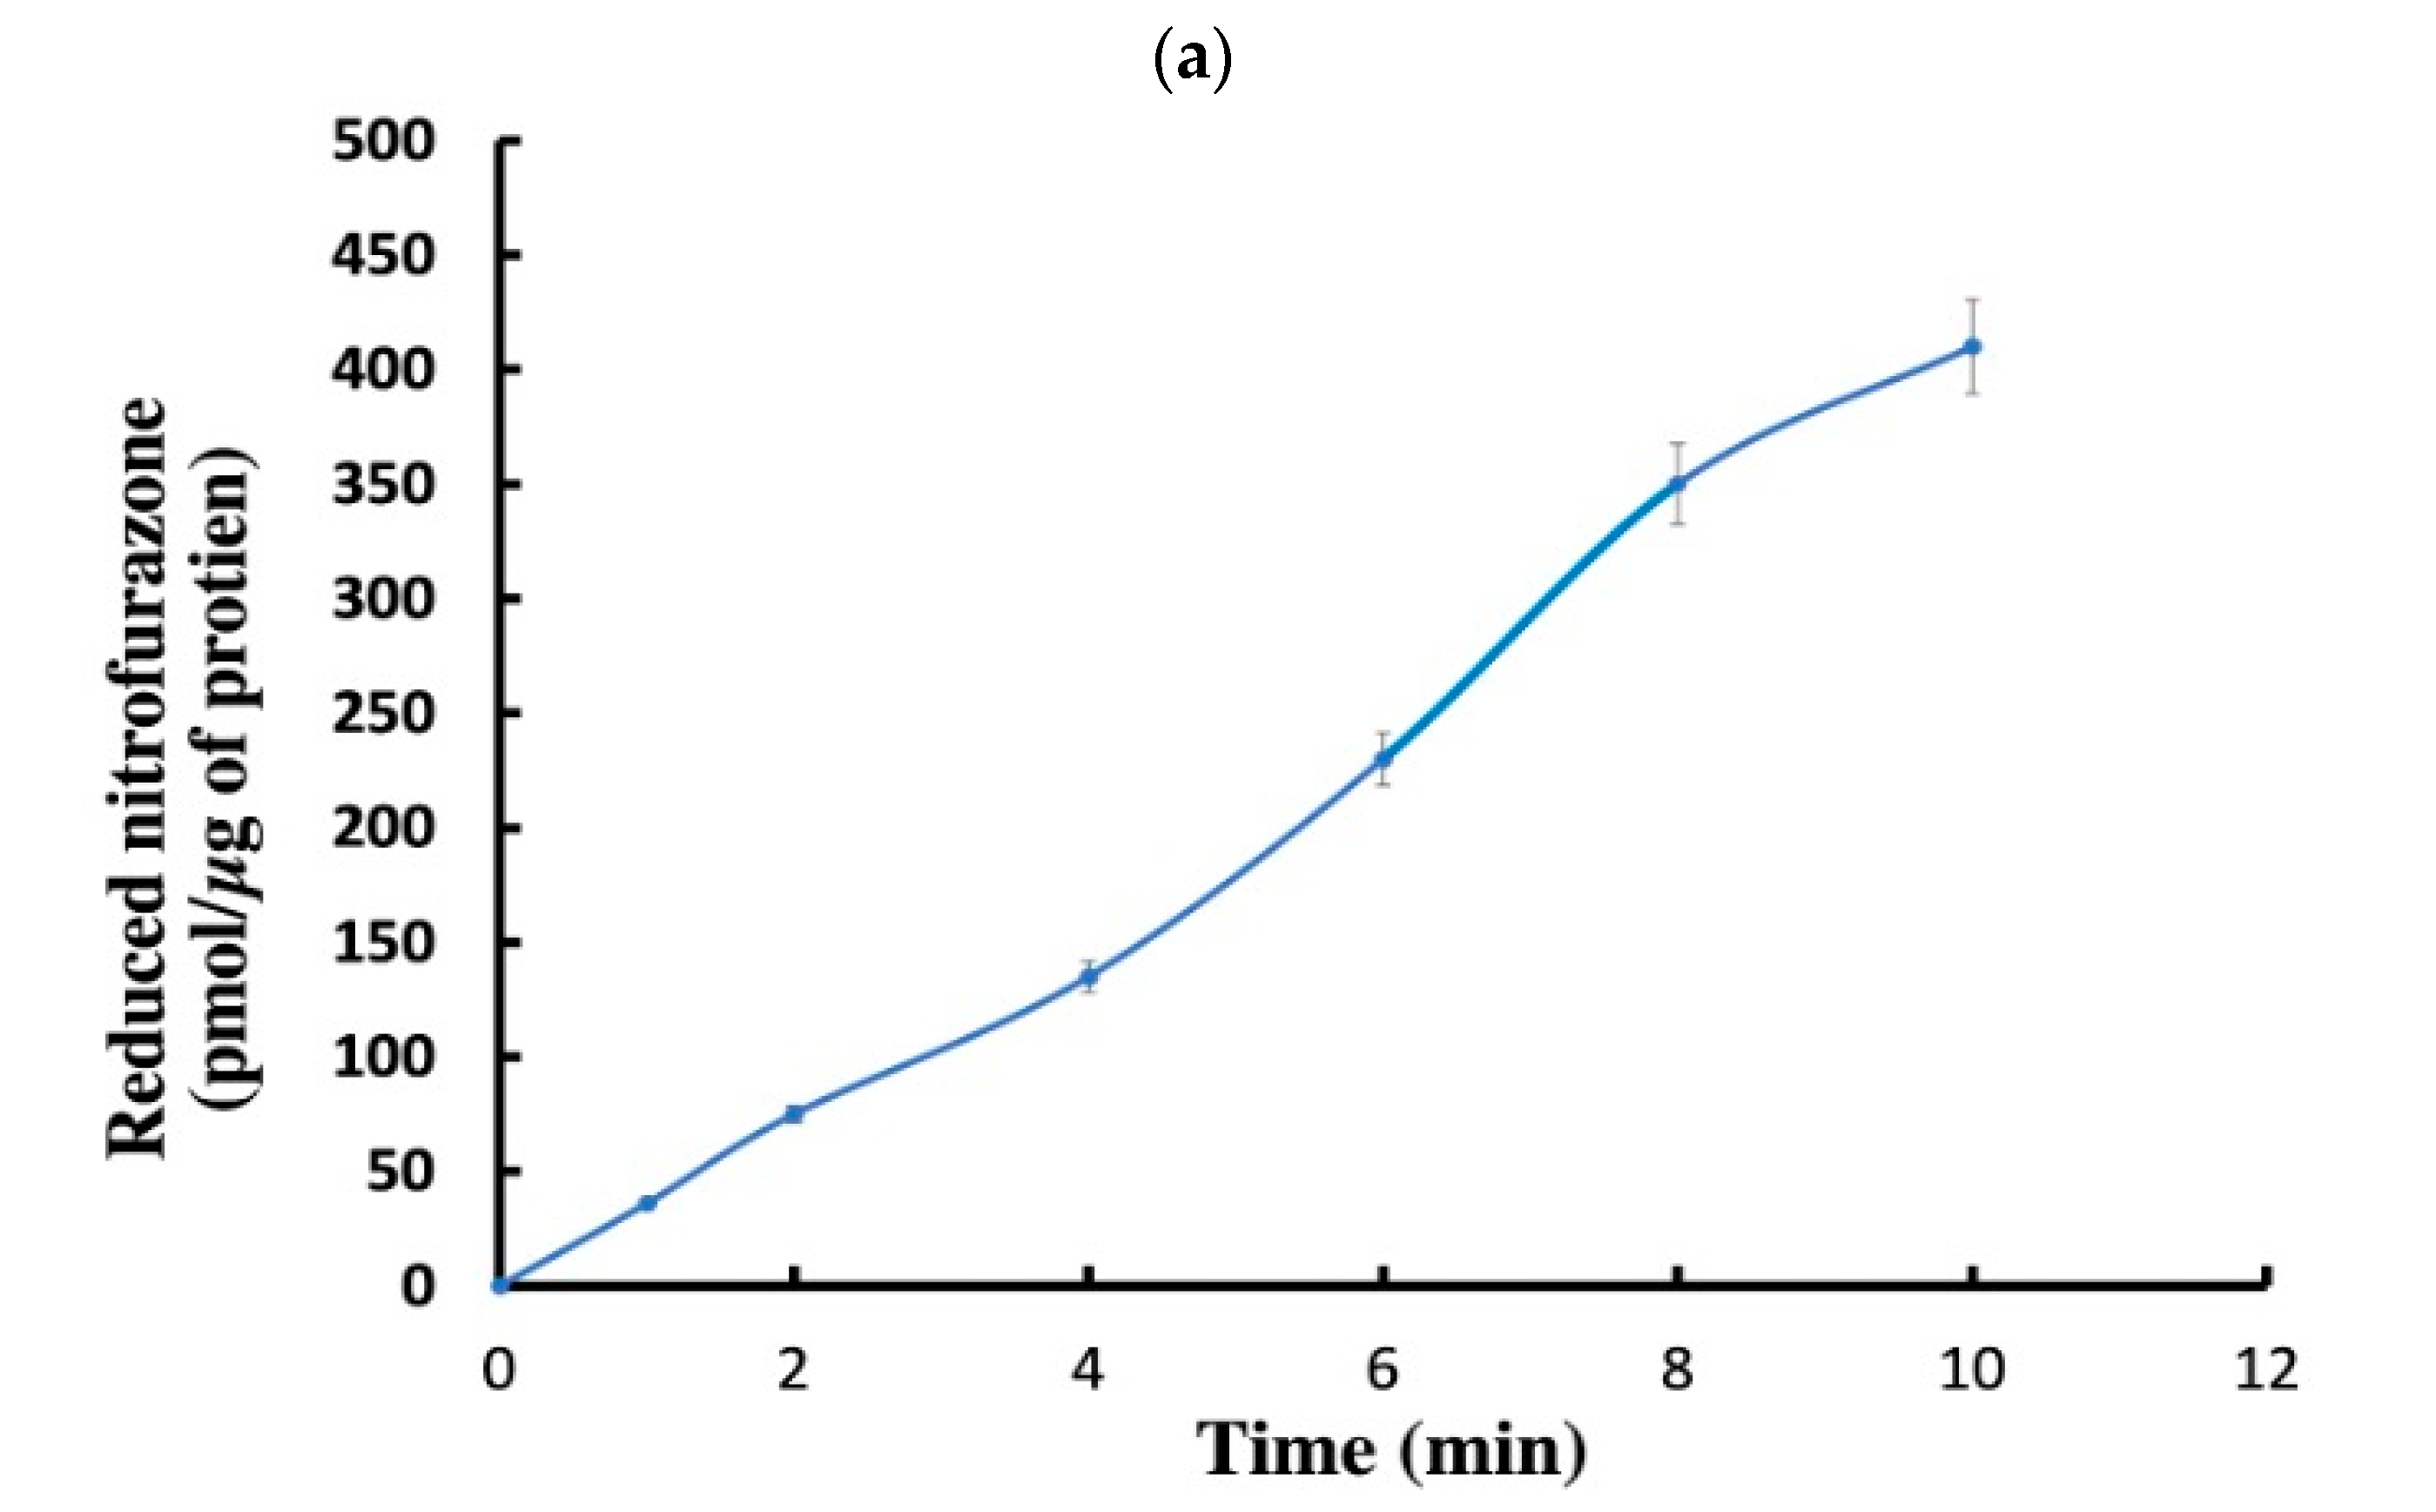
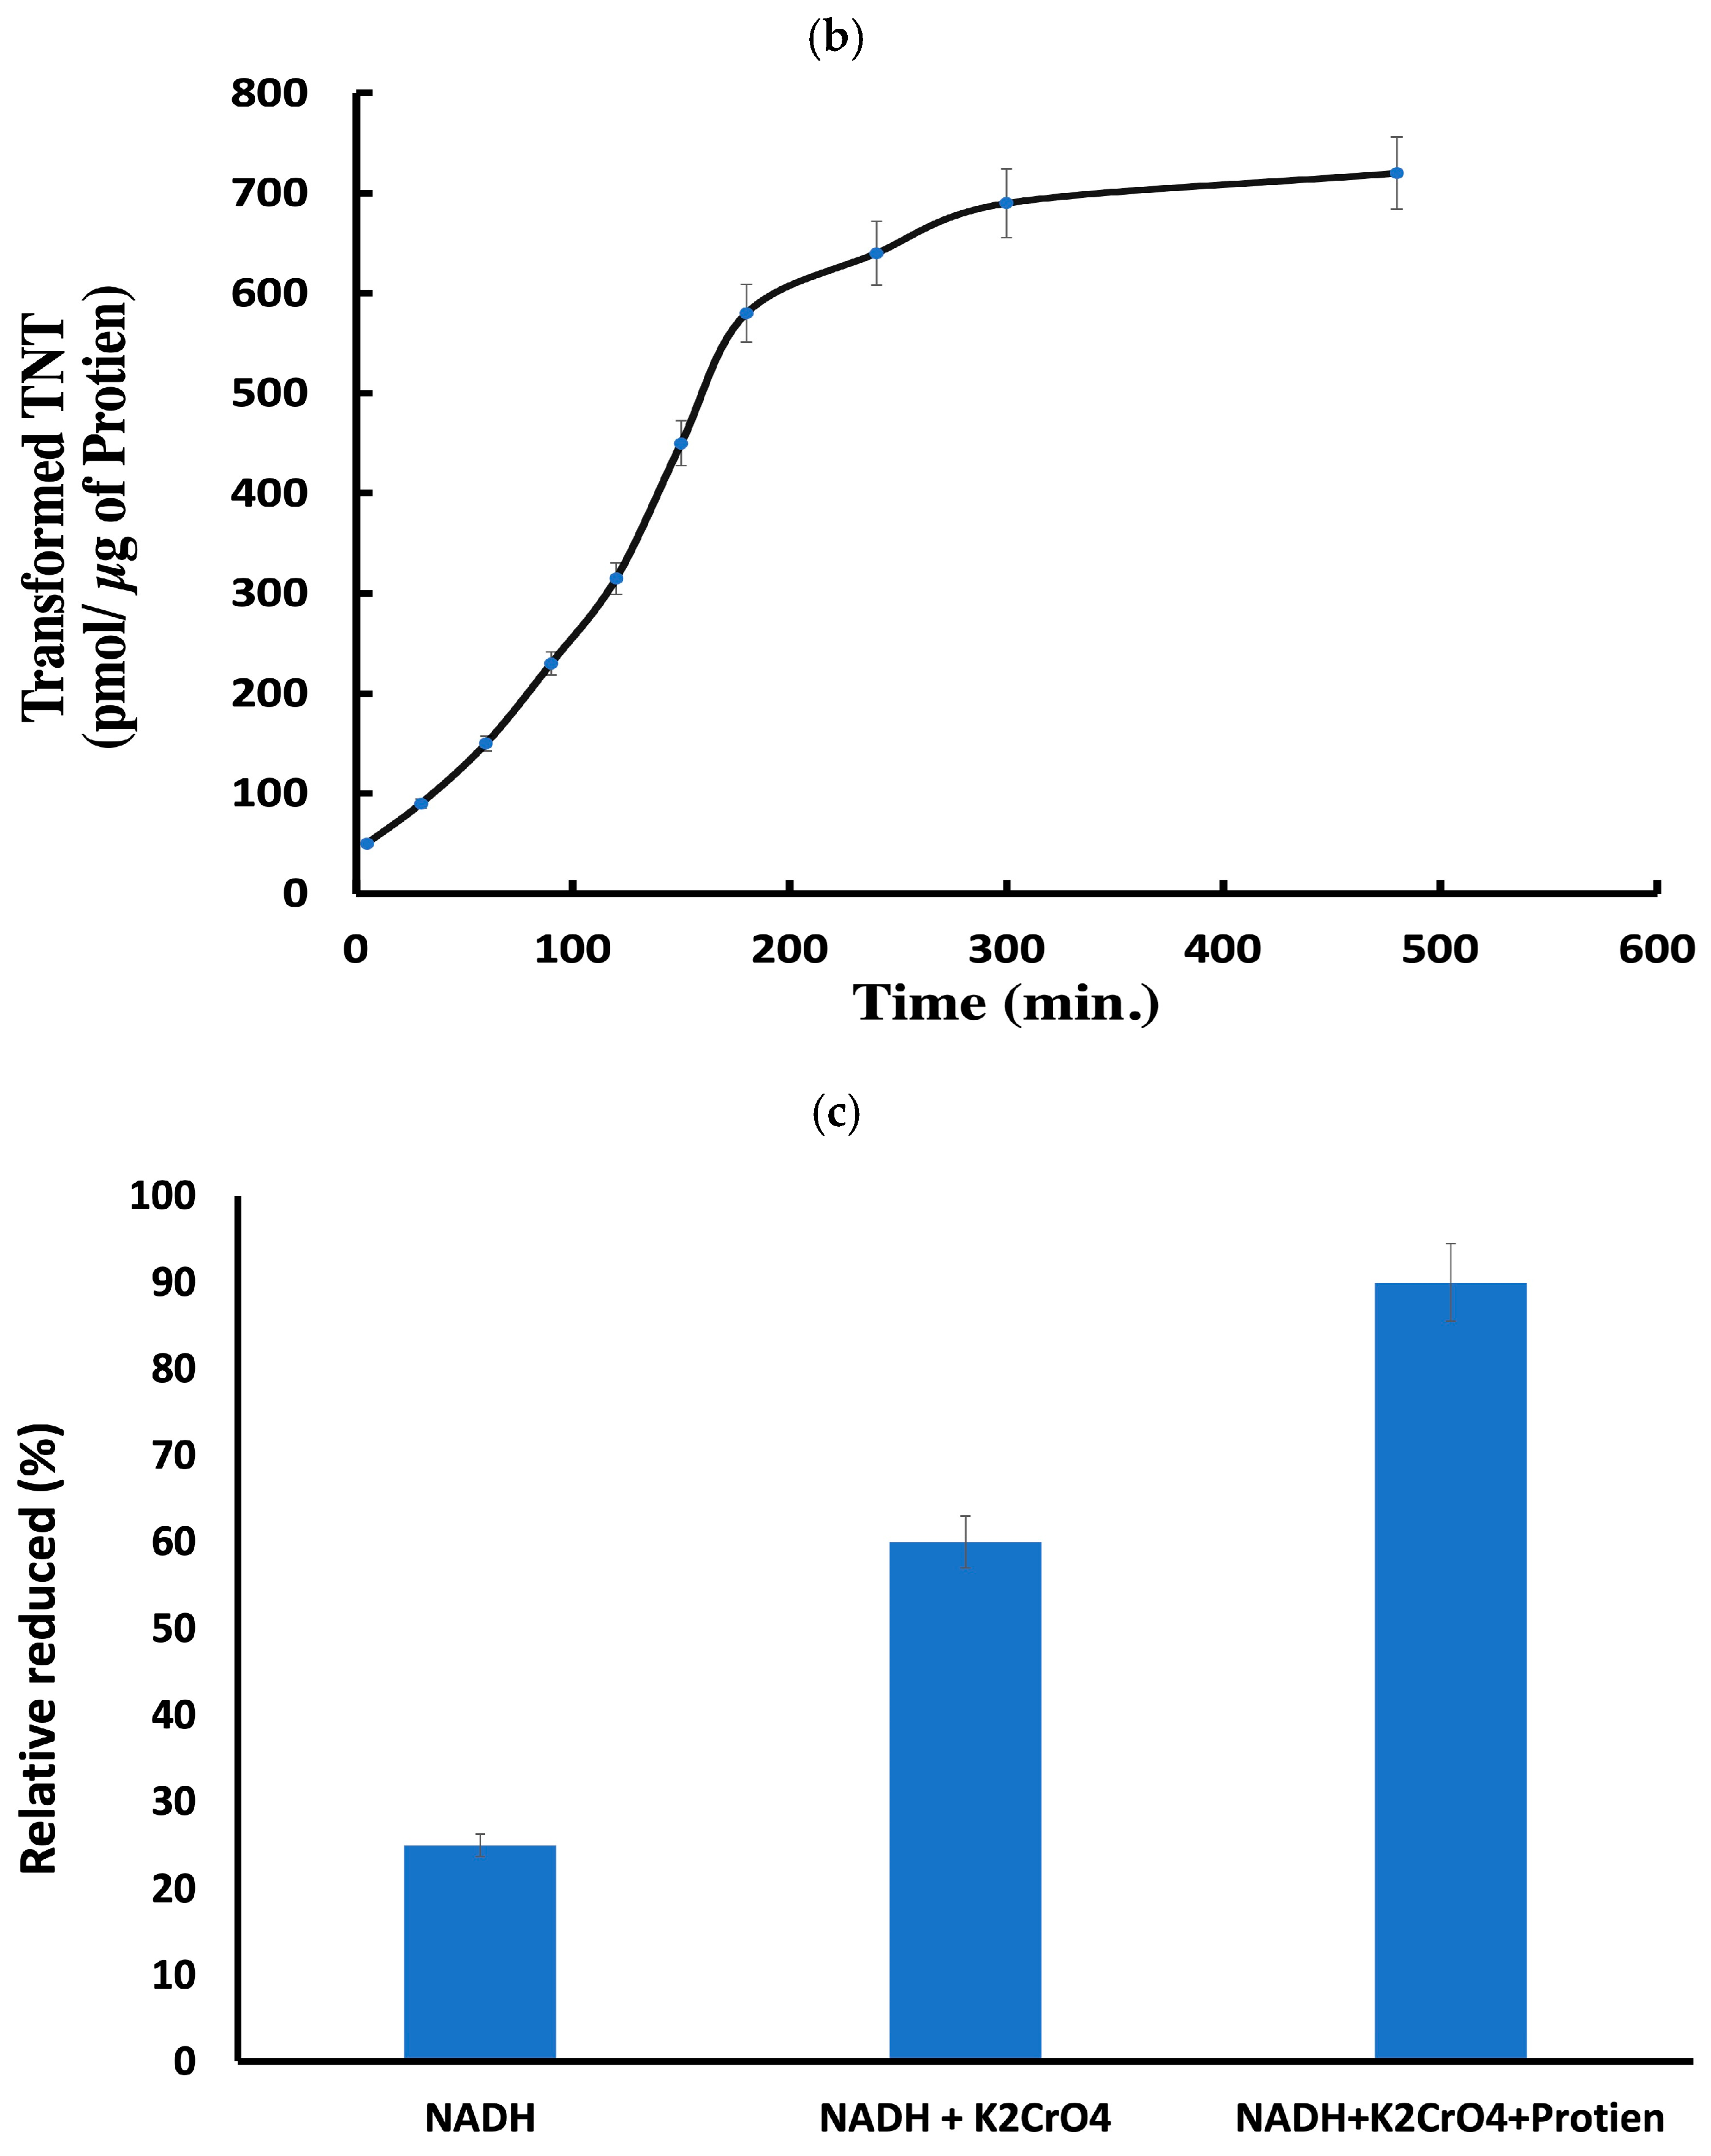
2.6.5. Analysis of Nitroreductase and Chromate Reductase Activity

Nitroreductase Activity Assay
This graph shows a time-dependent rise in the reduction of nitrofurazone, a nitroaromatic molecule, by a bacterial nitroreductase. From 0 to 10 min, nitrofurazone decreased consistently to about 450 nmol/mg protein (Figure 5a). The curve seems linear, suggesting that enzymatic activity is constant throughout the time range. There was no visible substrate depletion or product inhibition throughout this time. The extract has a stable, active nitroreductase. This implies that the bacterial extract has a functioning nitroreductase that effectively lowers nitrofurazone under specified circumstances.
The Period for TNT Biotransformation
The second panel shows TNT (2,4,6-trinitrotoluene) biotransformation over 500 min. The transformation rate rises dramatically within the first 200 min; it progressively levels toward a plateau at 700 pmol/μg protein. Main findings: Rapid TNT transformation in the first phase (0–200 min) suggests strong enzyme activity or substrate availability (Figure 5b). After 400 min, the plateau can indicate either substrate depletion, buildup of inhibitory chemicals, or enzyme activity saturation. The findings show that the bacterial extract may efficiently change TNT, stressing its possible use in environmental bioremediation of explosive substances, and this property supports hexavalent chromium reduction.
Comparison of Chromate Reductase Activity
This bar graph shows Cr(VI) decrease under three different conditions: NADH alone (negative control)—~20% reduction, probably via non-enzymatic or trace processes (Figure 5c). NADH + K2CrO4—~60% reduction, implying that chromate may take electrons from NADH even without enzyme catalysis, albeit at a lesser efficiency. NADH + K2CrO4 + protein extract = ~90% reduction, suggesting strong enzymatic Cr(VI) reduction activity driven by the bacterial protein. The outcomes show that the chromate reductase function is validated by confirming that bacterial protein extract greatly improves chromate reduction. This supports the notion that the system is NADH-dependent, in line with methods of enzymatic electron transfer.

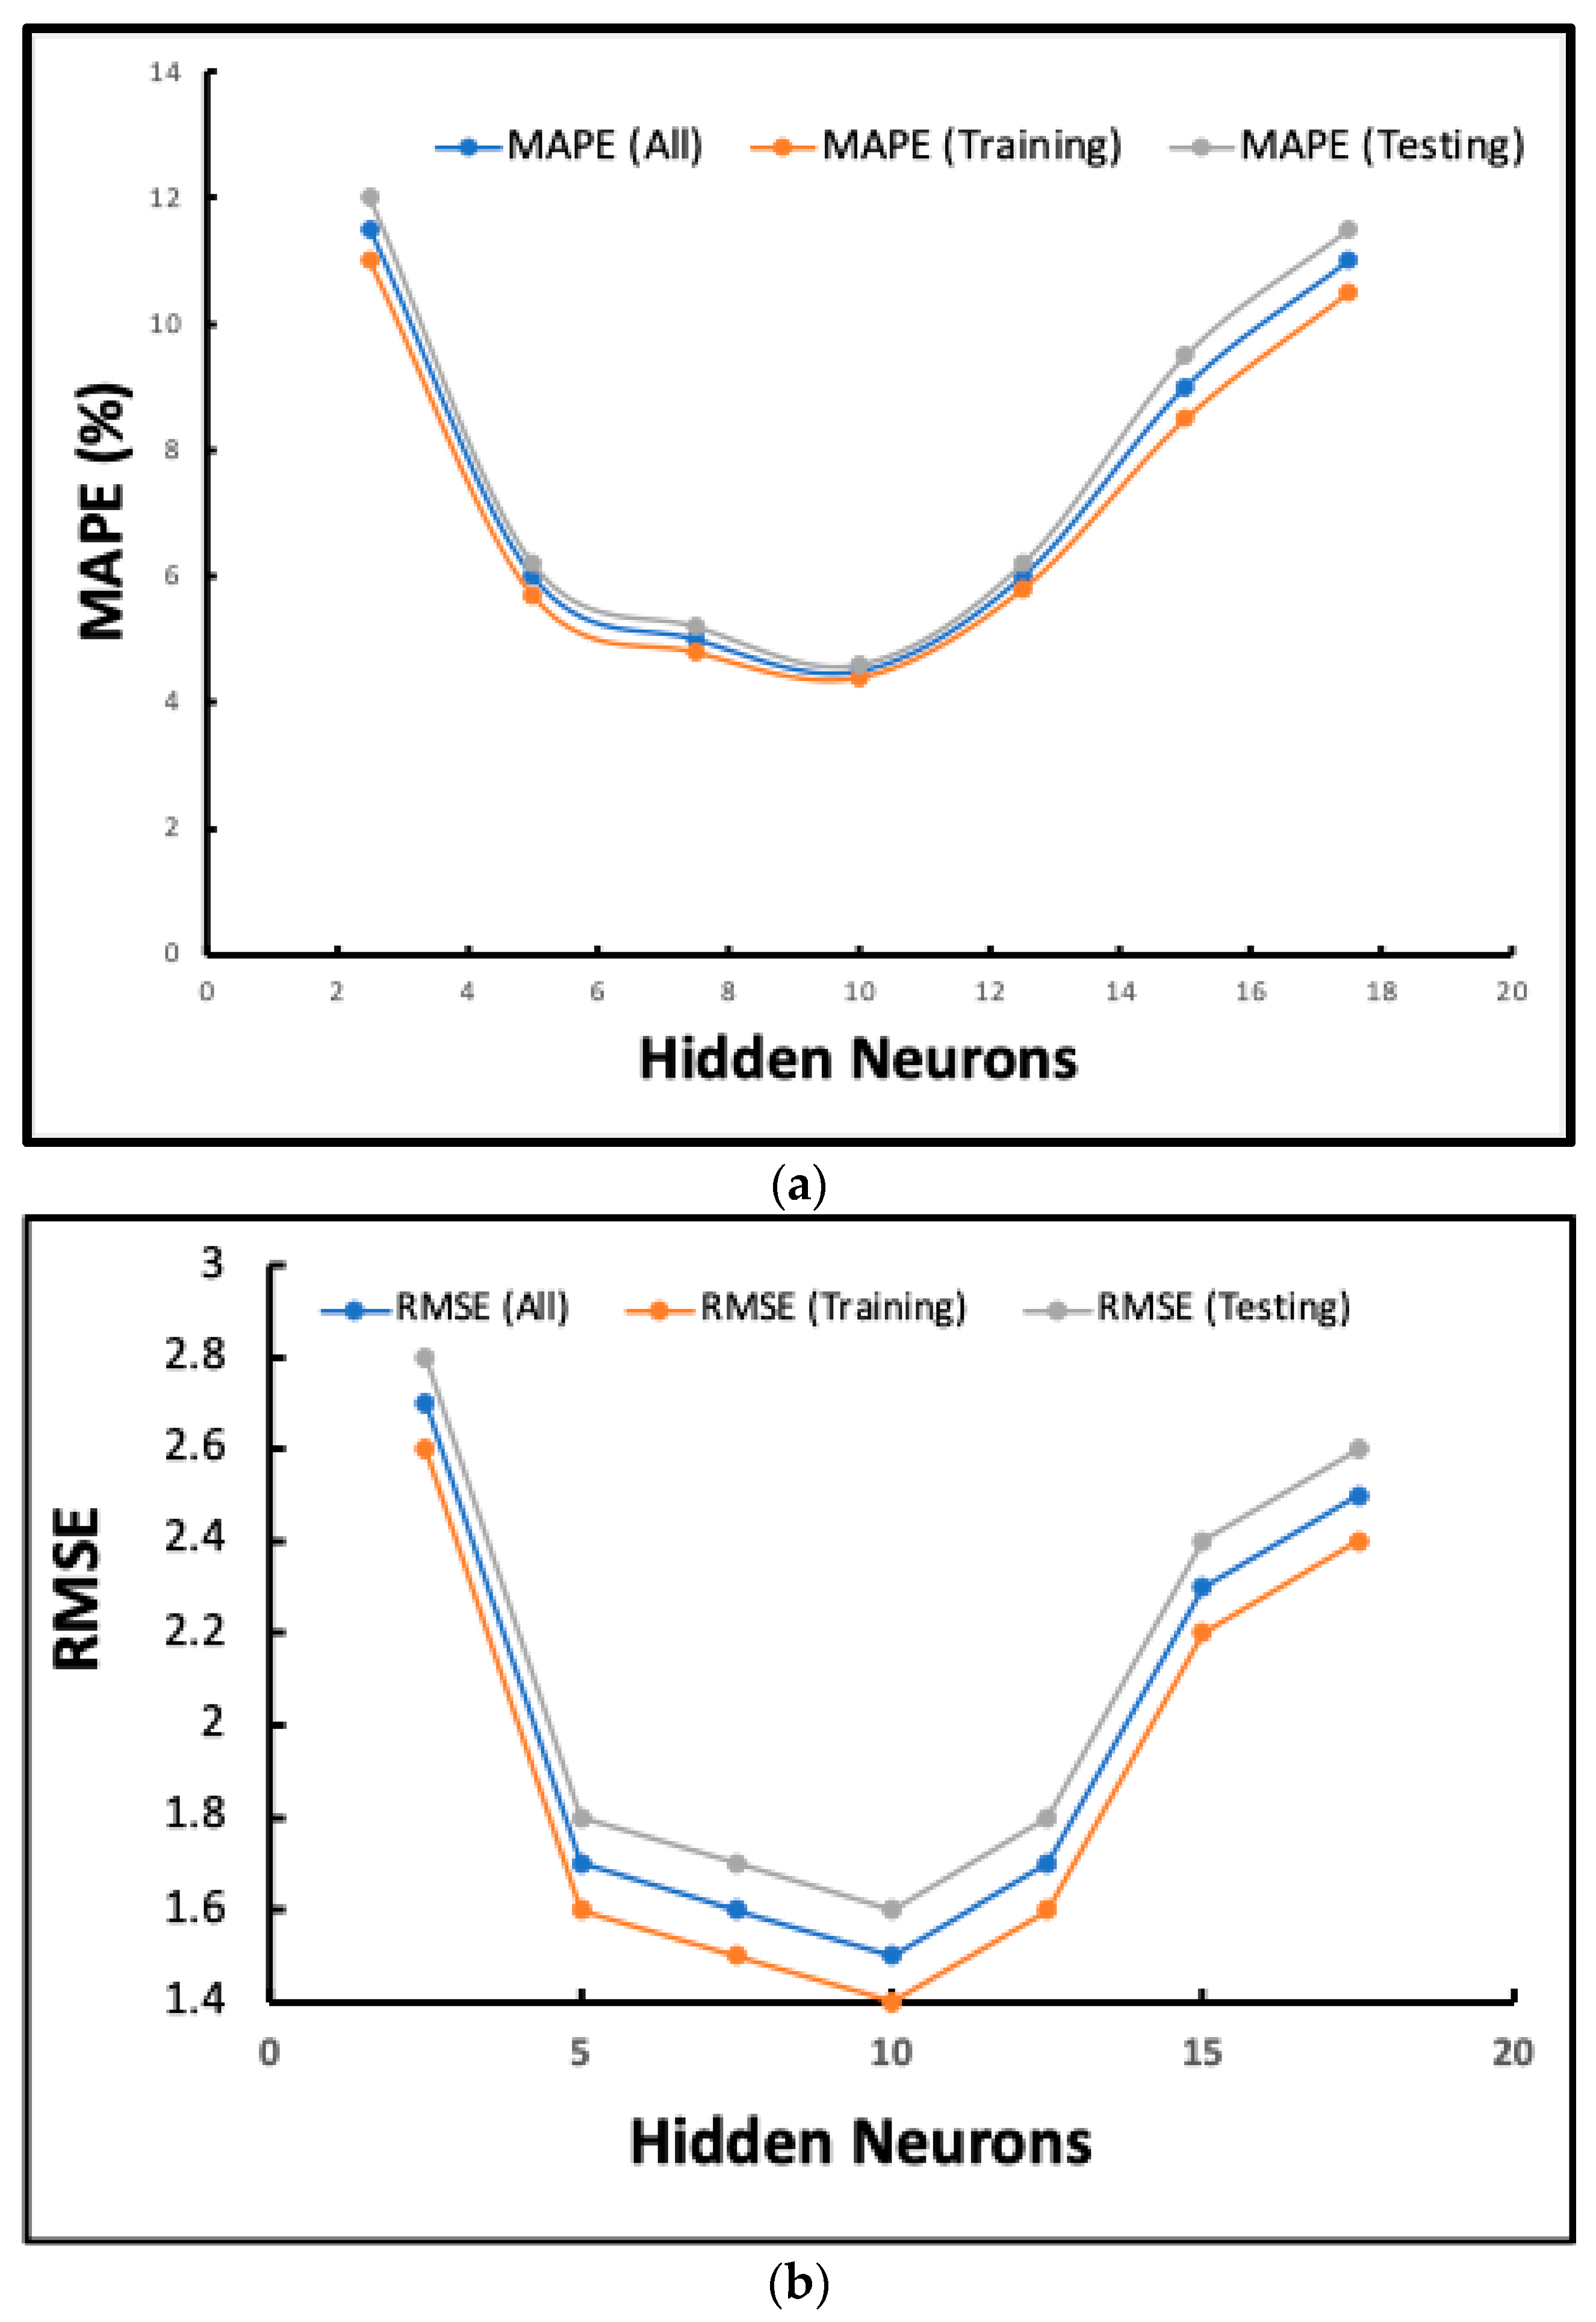
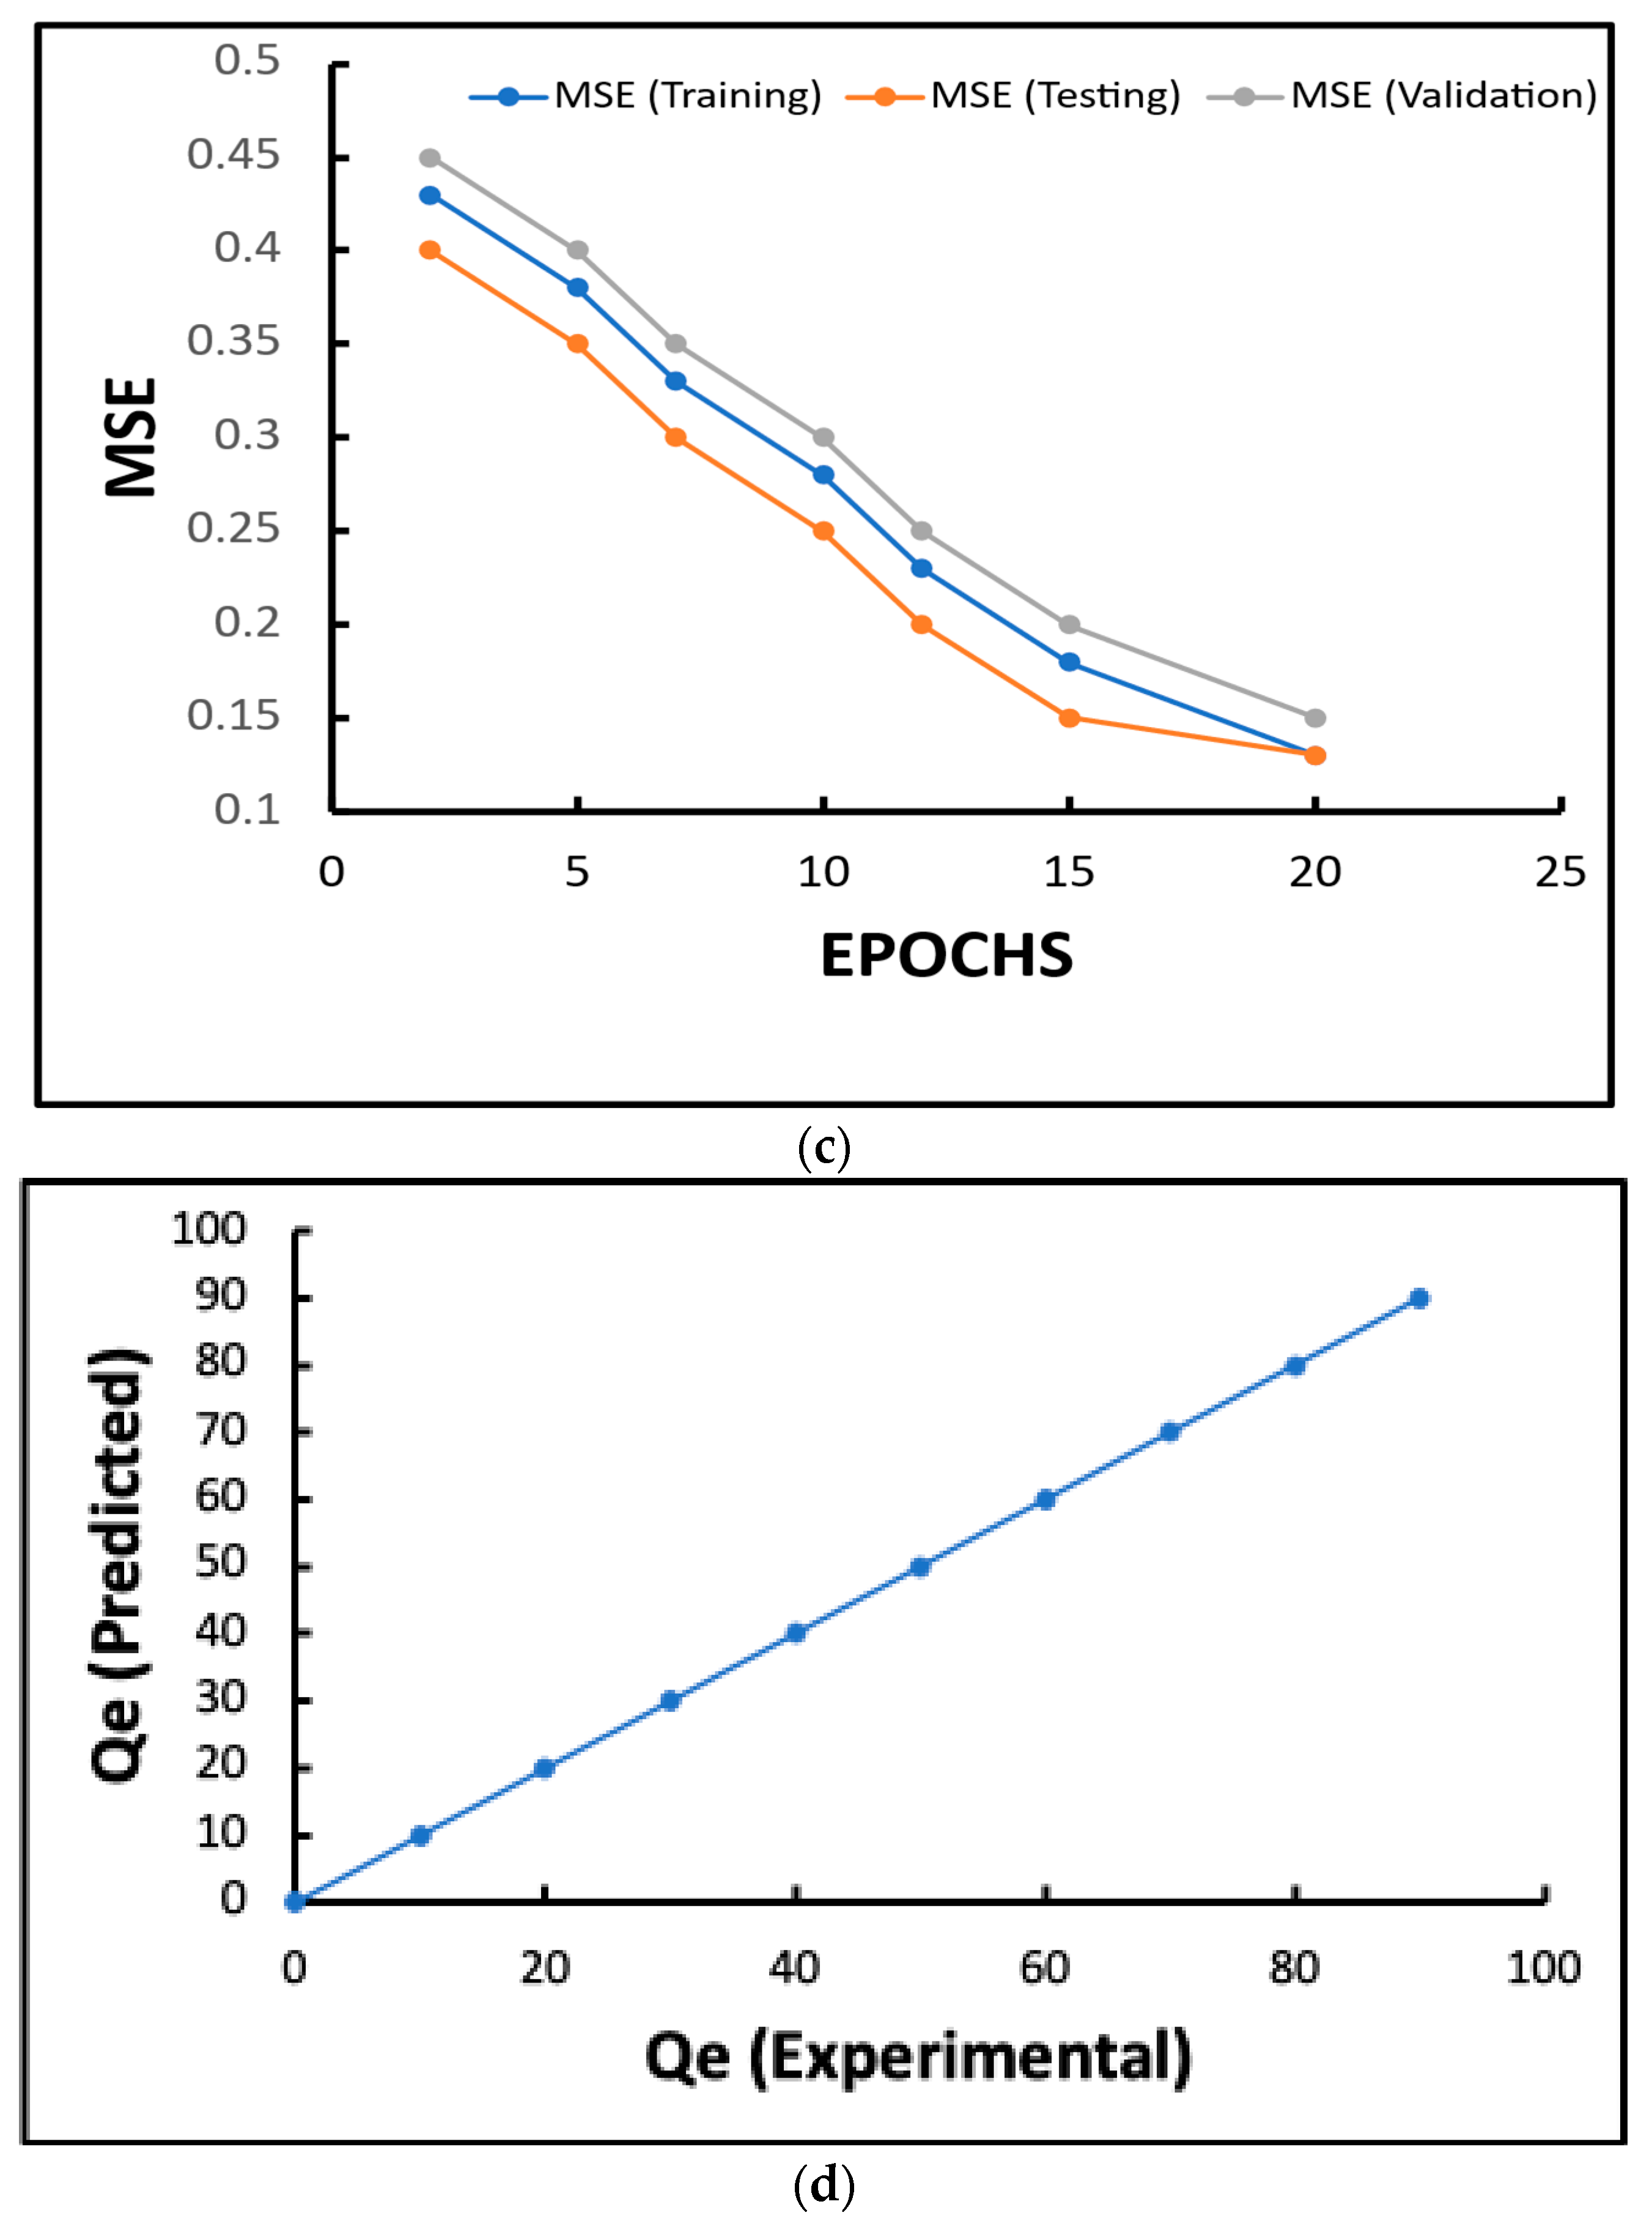
2.7. Detailed Results of Artificial Neural Network (ANN) Prediction

The ANN model with 10 neurons in the hidden layer successfully predicted Cr(VI) reduction across various environmental conditions like pH, temperature, incubation time, and initial concentration. The performance was evaluated using correlation coefficients (a), MAPE, ADD, and RMSE metrics (Figure 6).
As shown in Figure 6a, the results of the sensitivity analysis demonstrate that the MAPE (%) for all datasets, including training and testing, drops dramatically as the number of hidden neurons increases from 2 to approximately 8–10. The lowest value is reached around 10 hidden neurons. After this point, MAPE values increase again for all datasets, indicating that the model is overfitting at higher neuron counts. This distinct U-shaped curve shows that the best model performance, with the least amount of prediction error, happens when there are roughly 10 hidden neurons. The tight match between the training, testing, and overall MAPE profiles is further proof that the model can generalize well in this setup.
The sensitivity analysis of the neural network architecture in Figure 6b reveals that the root mean square error (RMSE) for all datasets, including both training and testing, decreases rapidly as the number of hidden neurons increases from 2 to 10. At around 10 hidden neurons, the RMSE values for each dataset reach their lowest point, indicating that this is the optimal level of model complexity. After 10 neurons, the RMSE values for all datasets go up again. This suggests that the model is becoming less generalizable and more likely to overfit as the network architecture becomes larger. The RMSE trends for training, testing, and all data follow a similar U-shaped pattern, highlighting the importance of selecting the optimal number of hidden neurons to achieve good prediction performance.
The results in Figure 6c illustrate how the mean squared error (MSE) changes for training, testing, and validation datasets throughout 20 training epochs. As the number of epochs increases, the MSE values for all three datasets decrease. This indicates that the model is learning and improving its performance as it trains. Throughout the epochs, the testing MSE is consistently lower than the training and validation MSEs. All three curves exhibit a consistent decreasing trend, with no signs of divergence or overfitting. At the end of the training session, which lasts 20 epochs, the model has the lowest MSE values for all datasets. This shows that it can converge and generalize well.

2.7.1. Prediction Accuracy

The ANN model routinely generated high correlation coefficients (>0.90) across all input variables, therefore demonstrating strong agreement between the expected and actual Cr(VI) decrease. At pH 4, the model showed exceptional prediction with a correlation value (Qe) of 0.97 for pH levels (Figure 6d). The performance dropped as the pH climbed; pH 10 had the lowest correlation, 0.90.

2.7.2. MAPE and Error Analysis

For pH 4 (3.2%) and a temperature of 25 °C (3.3%), the Mean Absolute Percentage Error (MAPE) was lowest (Figure 6a). MAPE values grew to 5.0% and 4.4%, correspondingly, when pH and temperature rose, respectively, implying declining prediction accuracy in more alkaline and higher-temperature situations. With the lowest errors noted at acidic pH and moderate temperature conditions (25 °C to 30 °C), the Root Mean Square Error (RMSE) went from 1.0 to 1.8 (Figure 6b).

2.7.3. The Predictions of Incubation Time and Initial Concentration

The model appropriately projected Cr(VI) reduction for shorter incubation times, with the best correlation of 0.96 at 6 h. Longer times steadily lowered the prediction accuracy; at 96 h, the correlation was 0.89. Initial concentration affected prediction accuracy. With a correlation of 0.91, higher doses (200 mg/L) somewhat reduced performance; lower concentrations (25 mg/L) showed a greater correlation (0.96).

2.7.4. Robustness of Model

Strong RMSE and ADD values confirmed the general accuracy of the model, therefore indicating consistent forecasts over several criteria. The error margins showed little variation from the experimental values and stayed within reasonable limits.
The sensitivity study examines how the neural network model’s performance (measured by MAPE (%) and RMSE) changes when the number of hidden neurons changes. The graphs provide results for the total dataset, as well as for training and testing splits. They demonstrate how the model responds to this crucial hyperparameter.
Observed Trends
Initial improvement: The MAPE and RMSE values decrease significantly for both training and testing data as the number of hidden neurons increases from 2 to approximately 10. This indicates that the model’s accuracy and ability to generalize have significantly improved within this range.
Optimum performance: The optimal model complexity is approximately 10 hidden neurons, where both MAPE and RMSE are at their lowest. Post-Optimal Degradation: After 10–12 hidden neurons, both errors begin to increase, indicating that the model is no longer functioning optimally. This is likely because the network is becoming too complex and overfitting.
Key Insights
Consistency across Metrics: The U-shaped patterns for both MAPE and RMSE are the same, which strengthens the idea that there is a distinct best point in the range of hidden neurons that were looked at.
Making Generalizations: The patterns of errors for the training and testing sets are similar. Still, the lowest values are always attained simultaneously, which indicates that the chosen design achieves balanced performance without significant overfitting or underfitting at the optimal point.

3. Discussion

In this work, bacterial strains were isolated from contaminated rhizobial soil that can reduce toxic Cr(VI), tolerate heavy metals, and promote plant growth. Out of one hundred bacterial colonies, forty percent were phosphate-solubilizing, and twenty percent were nitrogen-fixing. Of them, 20 dual strains showed both nitrogen-fixing and phosphate-solubilizing activity under the influence of heavy metals. We identified one bacterium based on its Cr potential and heavy metal tolerance, as well as its plant growth-promoting abilities (Figure 1). The identification was supported by comparing the traits of the bacterial isolates with those described in Bergey’s Manual of Determinative Bacteriology, which provides a reliable framework for accurate identification [14].
The standard biochemical testing is important to distinguish Rhizobium spp. from other bacteria in the rhizosphere, which is a basic criterion for knowing the bacterial species [15]. In this study, observed cells were short rods, a typical characteristic of nitrogen-fixing bacteria. The isolate was found to be Gram-negative, a common feature of the genus Rhizobium [16]. The staining of the culture suggests the presence of a thin peptidoglycan layer surrounded by an outer membrane. The colonies appeared transparent, circular, and mucoid when cultured on an appropriate medium. The mucoid texture indicates the production of extracellular polysaccharides, which may play a role in root adhesion and biofilm formation [17]. The colonies had a light pink color, most likely from carotenoid pigments often found in Rhizobium species [18]. The isolate’s capacity to lower nitrate to nitrite suggests its function in nitrogen cycling within the soil [19]. Important for combating oxidative stress, it also tested positive for catalase synthesis, an enzyme that breaks down hydrogen peroxide into water and oxygen [20]. Furthermore, the isolate showed that it could rely just on citrate as a sole carbon source, a feature crucial for several nitrogen-fixing bacteria [21].
A widely accepted method for species-level identification of the bacterial strain OS-1 was carried out using 16SrRNA gene sequencing [22]. The sequencing and analysis, performed by Macrogen, Inc., revealed that strain OS-1 belongs to the genus Rhizobium and is specifically identified as Rhizobium sp. with GenBank accession number HE663761. This identification was further supported by biochemical, morphological, and cultural characteristics consistent with Berge’s Manual of Determinative Bacteriology [14]. The highest similarity of the bacterial sequence was determined using a BLASTn analysis of the 16S rRNA nucleotide sequences [23]. This research confirmed the isolate’s significant similarity to other bacterial genomes and its close relationship to nitrogen-fixing Rhizobium species. The 16SrRNA sequences were obtained by EMBL and NCBI, allowing for global access to genetic information [24]. Phylogenetic analysis was performed using the MEGA 7 tool [25]. When compared to reference strains from NCBI GenBank, the phylogenetic tree constructed from 16S rRNA sequences firmly placed Rhizobium sp. OS-1 (HE6637) in Group I of Rhizobium species. With a bootstrap value of 100, the phylogenetic tree highlighted the strain’s genetic distinctiveness within its genus, as well as its analytical strength (Figure 2). These results suggest that Rhizobium sp. OS-1 is a symbiotic nitrogen-fixing bacterium with significant potential for agricultural applications, particularly in promoting leguminous crop productivity under various environmental conditions [26]. The molecular characterization and phylogenetic placement of this strain contribute to understanding its evolutionary relationships and functional roles in plant–microbe interactions [27].
The biosorption capacity of the Rhizobium sp. OS1 strain is highlighted by high correlation coefficients (r2 > 0.98) for both the Langmuir and Freundlich isotherm models [28]. This aligns well with findings from other studies on microbial and fungal biosorbents [29,30]. For instance, research on halophilic fungal melanin and plant-growth-promoting rhizobacteria (PGPR) has demonstrated effective heavy metal removal and a strong fit with these adsorption models, underscoring the reliability of isotherm-based mechanisms [31,32]. Similar to the Rhizobium strain, these biosorbents utilize functional groups on their surfaces to effectively bind metal ions, providing eco-friendly and cost-effective solutions for heavy metal detoxification in contaminated environments [33]. The consistency across various studies emphasizes the potential of microbial biosorbents for large-scale environmental remediation.
The results indicate that Rhizobium sp. OS-1 is proficient in heavy metal biosorption, therefore presenting significant new avenues for environmental applications, particularly in bioremediation. The sorption energy and the Langmuir constant (b) show diverse affinities for various metal ions. The biomass had the lowest affinity for Pb (0.043) and the highest affinity for Cr (0.233) and Zn (0.09). The results indicate that Rhizobium sp. OS-1 is highly effective in heavy metal biosorption, as evidenced by strong correlation coefficients for both the Langmuir and Freundlich isotherm models. This aligns well with several contemporary studies on microbial remediation of heavy metals. The observed biosorption sequence (Cr(VI) > Cu(II) > Ni(II) > Cd(II) > Zn(II) > Pb(II)) is consistent with findings from other researchers, who noted that various Rhizobium strains exhibit a higher capacity for heavy metal removal and greater resistance to metal ions [34,35].
This selectivity pattern resembles results from studies on plant growth-promoting rhizobacteria (PGPR), where species such as Cupriavidus necator, Sphingomonas sp., and Curtobacterium sp. demonstrated different biosorption and bioaccumulation mechanisms depending on metal concentrations. The lowest affinity for Pb (0.043) and the highest affinity for Cr (0.09) observed in bacterial isolate OS-1 are particularly noteworthy, especially in light of studies showing that heavy metals adversely affect microorganisms by influencing their growth, abundance, and genetic diversity [36].
However, the metal-tolerant characteristics of OS-1 illustrate adaptation mechanisms similar to those found in metal-contaminated areas, where leguminous species often harbor metal-tolerant rhizobia [37]. The strong correlation with both isotherm models underscores the effectiveness of rhizobacteria as biosorbents, supporting research that emphasizes the role of rhizospheric bacteria as essential components in sustainable heavy metal detoxification strategies [38]. These comparative findings validate the potential of OS-1 for practical bioremediation applications.
The Freundlich isotherm parameters provide further essential information. The Freundlich constant (K) values for Pb ranged from 3.187 to 7.166, indicating a higher biosorption capacity for chloride. Different metals yielded different 1/n values, which describe adsorption intensity; lead had a higher intensity (0.252), while chloride had a lower intensity (0.549). These variances highlight the strain’s versatility in adsorbing many metal ions with varying degrees of efficiency. Similarly, low-cost absorbents and microbial biomass have been utilized in adsorption kinetics and equilibrium tests to remove chromium from aqueous solutions [39,40,41].
The enzymatic assays and reduction graphs for Rhizobium sp. OS-1 highlight its robust nitroreductase activity and capacity for multi-contaminant detoxification. The time-dependent reduction of nitrofurazone, as shown by a linear increase to approximately 450 nmol/mg protein over 10 min, indicates stable and efficient nitroreductase function without substrate depletion or product inhibition [42]. This is further supported by the substantial transformation of TNT [43] and the enhanced reduction observed when NADH, K2CrO4, and protein are present, with the combination achieving nearly 90% [44]. These findings align with recent studies on other heavy metal-resistant bacteria, such as those of Klebsiella and Lysinibacillus species, which also demonstrate high enzymatic reduction of Cr(VI) and effective biosorption, resulting in significant contaminant removal [45,46]. The ability of OS-1 to maintain consistent enzymatic activity under varying conditions suggests it could be a valuable tool for bioremediation, similar to the use of Bacillus tequilensis for lead detoxification through enzyme-mediated mechanisms [47]. The combined biosorption and enzymatic reduction capabilities of Rhizobium sp. OS-1 positions it as a promising candidate for the sustainable remediation of soils contaminated with both organic and inorganic pollutants.
The reduction of Cr(VI) is influenced by several key factors, including pH, temperature, incubation duration, and the initial concentration of Cr(VI). Artificial Neural Networks (ANNs) for predicting and improving Cr(VI) reduction performance have proven effective in understanding the complex and non-linear interactions among these variables [48,49,50]. The pH is crucial in the microbial-mediated reduction of Cr(VI) [l]. Prior research has repeatedly demonstrated that acidic environments (pH 4–6) facilitate microbial activity, hence augmenting the reduction of Cr(VI) to Cr(III) [43].
The ANN model employed in this work effectively determined pH 4 as the best condition, attaining the highest correlation coefficient (0.97) and the lowest MAPE (3.2%). Low pH conditions enhance the bioavailability of Cr (VI) ions, hence accelerating microbial reduction [51]. Conversely, alkaline circumstances (pH 8–10) suppressed microbial activity, leading to diminished reduction efficiency, as seen by reduced correlation coefficients and elevated error values in the ANN model predictions. Temperature directly influences the metabolic rate of microorganisms engaged in Cr (VI) reduction [52]. Research indicates that moderate temperatures (25–30 °C) create ideal circumstances for microbial decrease. The model in this investigation corroborated previous findings, demonstrating the maximum decrease rates and predicted accuracy at temperatures between 25 and 30 °C. As the temperature rose to 40 °C, microbial efficiency diminished, presumably due to thermal stress, which was accurately reflected by the ANN through an elevated MAPE of 4.4% and a reduced correlation coefficient of 0.91. The performance graphs of the neural network further validate these observations, showing that the number of hidden neurons and training epochs directly impact model accuracy and error rates (Figure 6). This aligns with findings in recent machine learning applications in environmental microbiology. Overall, these results support the increasing consensus that optimizing environmental parameters and utilizing Artificial Neural Network (ANN) modeling can significantly improve the efficiency and predictability of microbial bioremediation of heavy metals, as highlighted in the current literature.
The ANN model with 10 hidden neurons demonstrated high predictive accuracy for Cr (VI) reduction under varying environmental conditions, as indicated by low MAPE and RMSE values and a strong correlation coefficient (R2 = 0.999) between the predicted and experimental results (Figure 6). The graphs indicate that both MAPE and RMSE were minimized at 10 hidden neurons, confirming this as the optimal network size for the dataset. These findings are consistent with recent research, which has shown that the careful selection of hidden neuron numbers can significantly enhance model performance. For instance, a 2024 study on dye adsorption optimization found that an ANN with eight hidden neurons yielded the highest predictive accuracy (MAPE = 0.08, RMSE = 0.11, R2 = 0.997), while another study reported optimal prediction of bioactive compound content using 11 hidden neurons [53,54,55]. Similarly, environmental monitoring and wastewater modeling studies have consistently reported that tuning the hidden layer size—typically between 7 and 15 neurons—yields the optimal balance of accuracy and generalizability [54,55,56]. The present results reinforce that selecting an appropriate number of hidden neurons is critical for minimizing error and maximizing predictive power in ANN models applied to environmental bioremediation, supporting their use for process optimization in complex biological systems [57].
The model’s performance is highly sensitive to the number of hidden neurons. Choosing around 10 hidden neurons yields the best balance between minimizing error and avoiding overfitting, as substantiated by the distinct U-shaped curves in both MAPE and RMSE across all dataset splits.
Model Sensitivity: The number of hidden neurons is a highly sensitive hyperparameter, significantly influencing model accuracy and its ability to generalize to new data.
Optimal Selection Importance: Careful hyperparameter tuning is essential; both too few and too many neurons degrade performance (Table 3).
Interpretability: The optimal region around 10 neurons provides the best trade-off between fitting the data and generalizing, making model decisions more reliable.
A comprehensive comparative table (Table S2) of the final performance metrics for both training and testing datasets, as evaluated for the Artificial Neural Network (ANN) model, is shown below. This addition is intended to enhance the clarity of the model’s generalization ability by providing a side-by-side comparison of the key error metrics, as recommended.
The metrics are presented for both training and testing datasets, highlighting any differences that may indicate overfitting or underfitting (Table 3). This clear delineation aids in thoroughly understanding the model’s predictive power and generalization capability.

4. Materials and Methods

4.1. Sample Collection

In this study, soil samples were collected from the conventional and polluted locations in Aligarh, the university farmhouse, and the Mathura roadside region at coordinates 27°53′ N, 78°05′ E.
The objective of this study was to ascertain the comprehensive range of microbial diversity and the levels of heavy metal concentrations.

4.2. Screening of Metal-Tolerant N-Fixing and P-Solubilizing Bacteria

In traditionally fixing rhizobia, legume roots have microorganism nodules. After two minutes of surface sterilization with sodium hypochlorite (2.5%) solution, each plant’s nodules were carefully removed and washed three times with sterile water and 95% ethanol (v/v). An amount of 10 mL of each nodule suspension in standard saline solution was placed on a solid yeast extract mannitol media plate. This improved isolated single colony was streaked thrice on the same medium to establish the culture’s purity. For prolonged storage, the isolated colonies were maintained in glycerol and YEM agar slopes at 4 °C. The soil suspension was diluted, and then, in order to confirm the growth of appropriate fungi, 100 µL of the serial dilution was spread onto solid Pikovskaya medium. For bacterial growth to occur, the inoculation plates were incubated at 30 ± 2 °C for three days. Phosphate-solubilizers appear as clear haloes around colonies of the isolates. This work might help to increase the current knowledge of bacterial tolerance to heavy metals, which is important for environmental health. These media plates were supplemented with variable concentrations of Cd(II), Cr(VI), Cu(II), Ni(II), and Zn(II) (0–1000 µg/mL, 0–2000 µg/mL, 0–2000 µg/mL, 0–1500 µg/mL, and 0–3500 µg/mL, respectively). Subsequently, a 10 µL bacterial inoculant was applied to each of the areas that had been treated with metal. Bacterial growth was allowed on plates for 3–5 days under an optimal temperature of 30 ± 2 °C. The maximum tolerance level (MTL) was the highest heavy metal concentration that supported bacterial growth. The experiment was performed three times per test.

Protocol for Biochemical Testing of Bacterial Isolate

This study utilized standard microbiological and biochemical methods, as outlined in Bergey’s Manual of Determinative Bacteriology, to determine the biochemical properties of the bacterial cultures. These properties included the indole reaction, citrate utilization, catalase production, hydrogen peroxide (H2O2) production, nitrate reduction, sugar fermentation, and the utilization of sugars (glucose, sucrose, and mannitol), as well as starch and gelatin hydrolysis.
For the indole test, each isolate was cultured in autoclaved nutrient broth and incubated at 30 °C ± 2 °C for 48 h. After incubation, 2 drops of Kovac’s reagent were added. The appearance of a crimson ring indicated a positive indole response.
Next, we placed each isolate into autoclaved MR-VP broth and incubated it at 30 °C ± 2 °C for 48 h. After incubation, we added methyl red solution as an indicator. A red color indicated a positive methyl red result. For the Voges-Proskauer test, Barritt’s reagent was applied after incubation, and a color change to red indicated a positive result.
For citrate utilization, we plated the test bacterial cultures on autoclaved Simmons’ citrate agar and incubated them at 30 °C ± 2 °C for 48 h. A color change from green to blue indicated that citrate was being utilized.
To test for catalase production, the isolates were incubated in nutritional broth at 30 °C ± 2 °C for 48 h. We then added 3% hydrogen peroxide and observed for bubble formation, which indicated a positive catalase reaction.
For the nitrate reduction assay, we inoculated autoclaved trypticase nitrate broth tubes with the test isolates and incubated them at 30 °C ± 2 °C for 48 h. After incubation, we added 5 drops of solution A and 2 drops of solution B. The formation of a red color indicated that nitrate reduction had occurred.
Additionally, we tested the isolated bacterial cultures for their ability to utilize carbohydrates by adding 5 g/L each of glucose, sucrose, and mannitol to autoclaved fermentation broth, along with the test isolates. This reaction mixture was then incubated at 30 °C ± 2 °C for 48 h, and the formation of acid or acid with gas was noted.
For starch hydrolysis, we spotted 10 μL of each isolate cultured in broth on autoclaved starch agar plates and incubated them at 30 °C ± 2 °C for 48 h. After incubation, we poured iodine solution over the plates. A clear area of hydrolysis around the bacterial growth indicated that starch was being broken down.
Finally, we placed the test isolates in tubes containing autoclaved nutritional broth and 12% gelatin and incubated them at 30 °C ± 2 °C for 48 h. The tubes were then refrigerated at 4 °C for 30 min. A positive test for gelatin hydrolysis was indicated if liquification occurred after refrigeration.

4.3. Sequencing of the 16S rRNA Gene and Assessment of Phylogenetic Tree

The identification of bacterial cultures that eventually led to the discovery of new species was made at the species level by using 16SrRNA gene sequence analysis. Characterization of the sample’s beneficial bacteria was performed by the 16S rRNA gene sequencing to provide taxonomic classification at the strain level. This molecular method is useful for revealing the relationships and niches of selected bacterial strains at the evolutionary level. This bacterium boosts plant growth and metal tolerance in labs. After outsourcing to Microgen (Seoul, Korea), partial 16SrRNA gene sequences from Rhizobium OS-1 were obtained for identification. Universal primers 518F and 800R were used to boost 16SrRNA gene amplification. GenBank credited this unique sequence. BLASTn was employed to find linked sequences in the NCBI database link (http://www.ncbi.nlm.nih.gov/BLAST, accessed on 1 March 2018) using known taxonomic information. This ensured accurate isolate identification and allowed comparisons with the NCBI database’s most similar sequences. Clustal W aligned these sequences to similar GenBank sequences [58]. The neighbor-joining (Nj) method created a phylogenetic tree. The bootstrap technique was used in MEGA version 4.2 to examine tree relationships [59].

4.4. Bioremediation Studies

4.4.1. Chromium Reduction

The central part of biological chromium reduction is the conversion of Cr(VI), which is very poisonous and soluble, to Cr(III), which is much less harmful and not soluble. Rhizobium OS-1 bacteria have specific enzymes that help with this reduction. They commonly use Cr(VI) as a terminal electron acceptor during anaerobic respiration. This process often occurs when natural electron donors or co-contaminants are present, making it more effective. Biological reduction not only makes chromium less poisonous, but it also makes it less mobile in the environment. This means that bioremediation is a safe and effective way to clean up polluted soils and streams.

4.4.2. Chromium Concentration and pH Effect on Reduction

This analytical research was conducted in a laboratory, and the effect of pH on the reduction of Cr(VI) was measured using Rhizobium sp. OS-1. We prepared and sterilized the YEM broth used in this experiment for nitrogen-fixing Rhizobium sp. OS-1 only. After that, 100 µg/mL of Cr(VI) was added, and 1M HCl or 1M NaOH was used to adjust the pH to the range of 4–10. To the Cr-treated medium, 100 µL of a fresh culture of P-solubilizers and N-fixers was added, and the mixture was shaken at 30 ± 2 °C for 96 h. YEM and nutritional broth were added with 0, 25,50, 100, and 200 mg/L Cr(VI) as K2Cr2O7, and, similarly, the cultures were incubated as above to study the effect of varying Cr(VI) doses. To determine the Cr(VI) reduction, 1 mL of culture was spread in an equal volume containing an equal bacterial suspension density. It was spun in a microcentrifuge at 5724× g for ten minutes at 20 °C. The obtained supernatant was then subjected to the 1,5-diphenylcarbazide procedure. After adding 50 µg/mL of 1,5-diphenylcarbazide and subsequent acidification of the samples to pH 1–2, the Cr(VI) dose was analyzed at 540 nm.

4.4.3. Temperature Effect on Reduction

Additionally, the impact of temperatures on the decrease in Cr (VI) by Rhizobium sp. OS-1 was examined. YEM broth was exposed to a dose of 100 µg/mL Cr(VI) and then infected with 100 µL of a recently cultivated culture of Rhizobium sp. OS-1. The NB and YEM broths, which had been treated with Cr(VI) and infected with culture, were incubated at 25, 30, 35, and 40 °C for 16 h. After the incubation period, the quantity of Cr reduced by microbes at different temperatures was evaluated quantitatively using a previously established method.

4.4.4. Biosorption Study

Development of Stock Solution and Bacterial Biosorbent
The selected metal stock solution of Cd(II), Cr(VI), Cu(II), Ni(II), Pb(II), and Zn(II) was developed from the cadmium chloride, potassium dichromate, copper sulphate (CuSO4), nickel chloride (NiCl2), lead chloride (PbCl2), and zinc sulphate (ZnSO4) American salt dissolved in ultrapure water and the pH of the solutions was normalized before the addition of the bacterial biosorbent. The amounts of metals in the solutions before and after the treatment were determined with the help of the Atomic Absorption Spectrophotometer (GBC 932 Plus). The Rhizobium OS-1 strain was sub-cultured in a 500 mL conical flask containing 100 mL of LB broth for one day at a temperature of 30± 2 °C. In the late logarithmic phase of growth, the cells were collected by centrifugation at 5742× g for 20 min at 5 °C. The cell pellet obtained was washed 3 times with ultrapure water and then re-suspended in slurry.
Biosorption by Rhizobium Biomass
In this investigation, the dry biomass of the strain OS-1 was used to assess its adsorption capacity for Cd(II), Cr(VI), Cu(II), Ni(II), Pb(II), and Zn(II) with the help of the batch equilibrium method, which was explained earlier by researchers Khodaverdiloo and Samadi [60]. For the experiment, 250 mL conical flasks were charged with 100 mL of metal ion solutions. The bacterial biomass was shaken with these solutions at 160 rpm on an orbital shaker in 50 mL tubes for 24 h. After the incubation, the biomass was pelleted by centrifugation at 5724× g for 15 min. Metal in the supernatant was measured with a flame atomic absorption spectrophotometer. Biosorption experiments for each metal ion were performed in triplicate. The following formula was used to determine how much metal was bonded to the biosorbent:
  Q =   V C i C f M
In this case, Q is the dose of the metal ions that can be adsorbed by the metal ion solution in mg/g and C i is the concentration of the metal in the solution before adsorption in mg/g. Cf refers to the final concentration of the metal in the solution after removal by sorption in mg/g. M stands for the biosorbent’s dry weight in grams and V is the volume of the solution in liters. The amount of metal adsorbed on the biosorbent was calculated by performing a difference between the initial and final concentration of the metal ions [61].
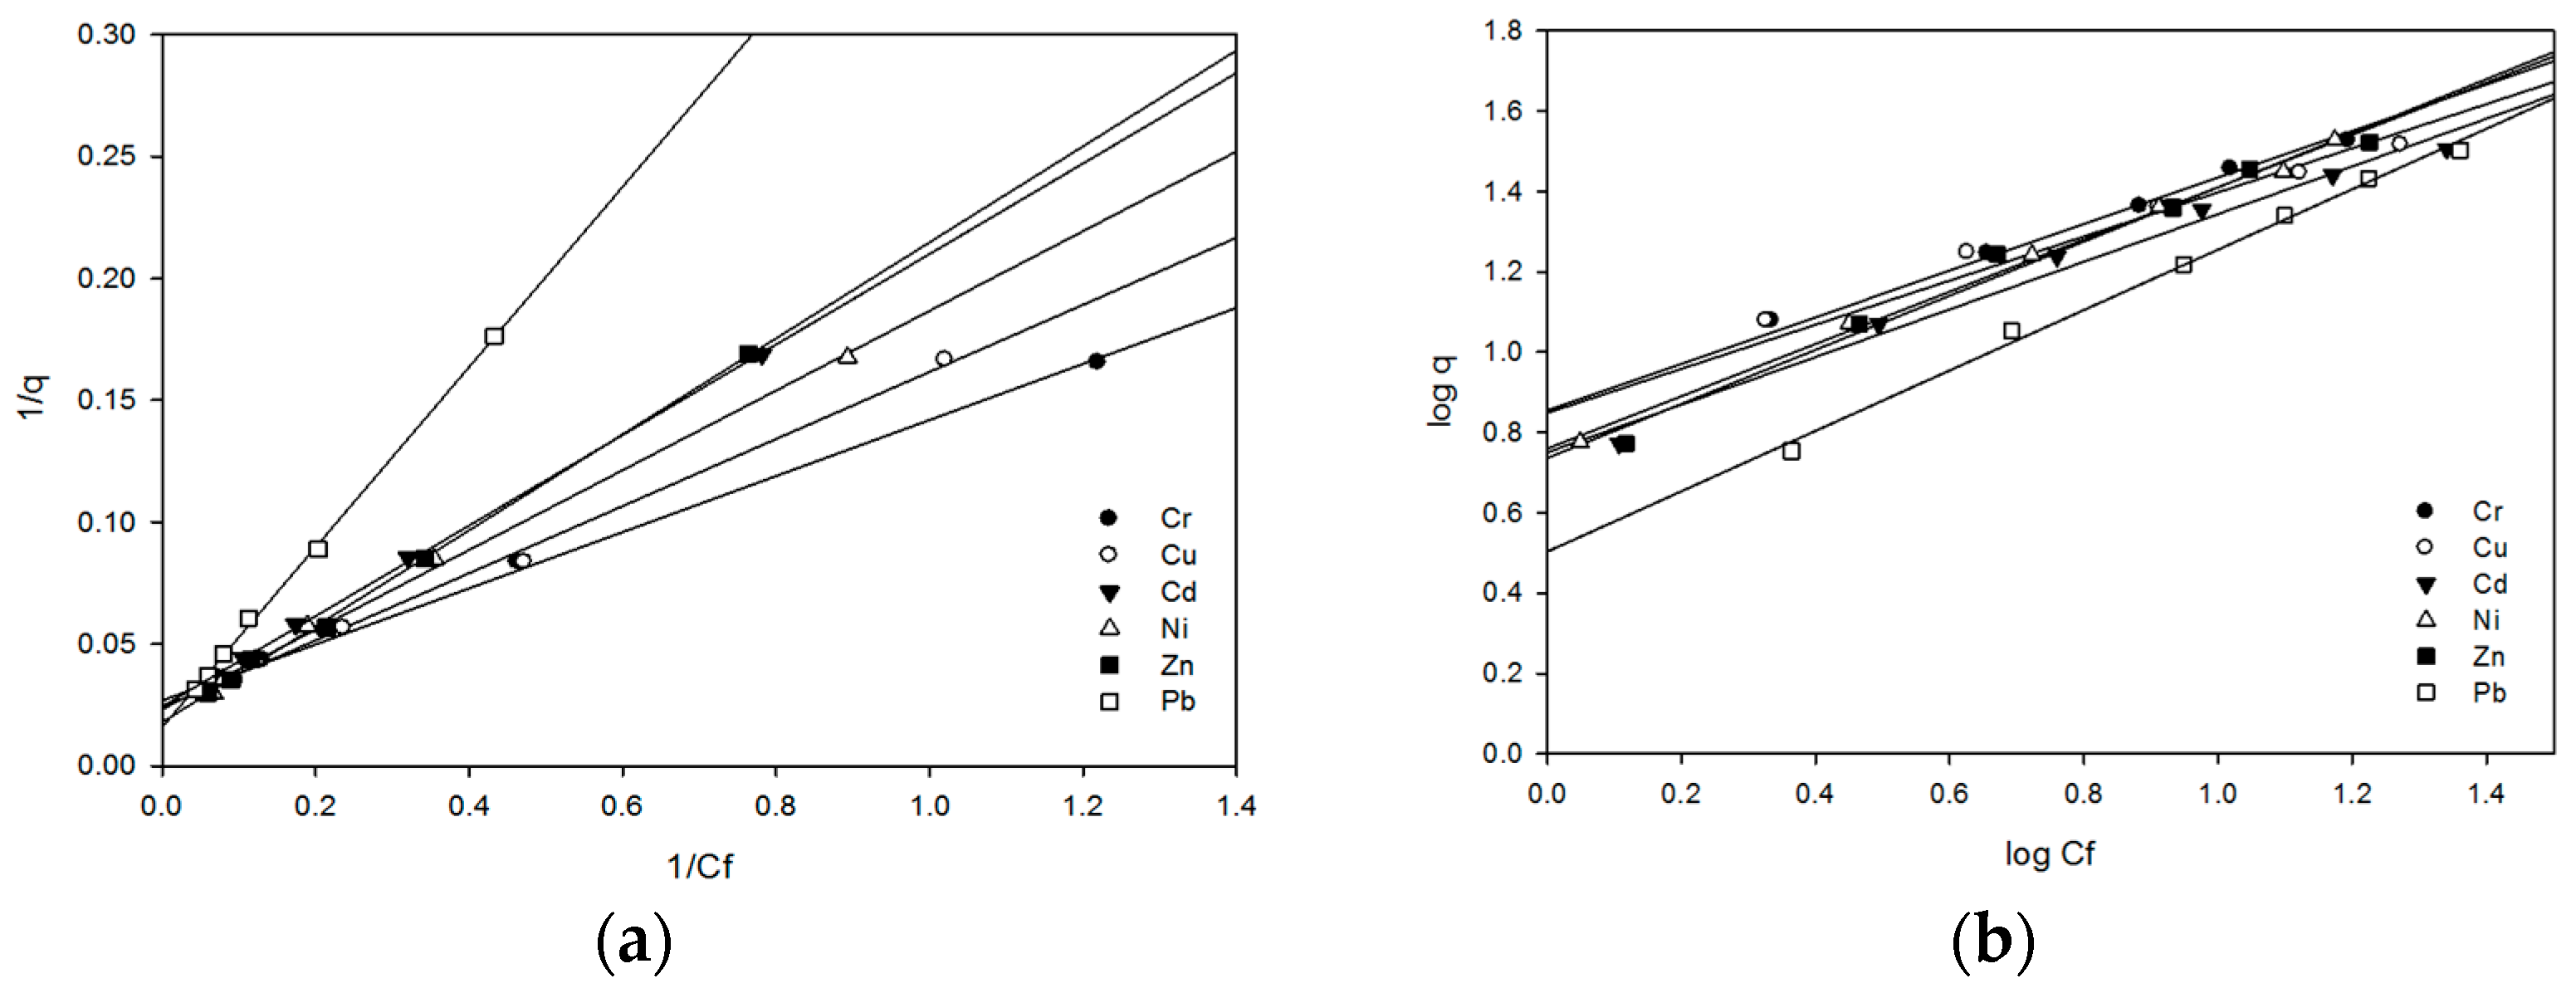
Isotherm Freundlich and Langmuir
To explain the biosorption isotherms, the Freundlich and Langmuir models were employed [62]. An expression for the Langmuir isotherm was given as Q = Q m a x b C f / 1 + b C f .
This equation can be linearized as:
1 Q = 1 Q m a x + 1 b . Q m a x C f
in which the Langmuir constants, Qmax and b, are defined. The adsorption isotherm Freundlich equation is expressed as:
Q = K C f 1 n
Its linearized form:
l o g   Q = l o g K + ( 1 / n ) log C f
The equilibrium concentration (Cf) and the concentration adsorbed (Q) per unit mass of adsorbent (M) are defined in these equations. By analyzing the slope and intercept of the straight line obtained by plotting log Q versus log Cf, we may find the constants K and n.
Metal Ions Separation Factor (Sf) and Surface Coverage (Ø)
In the context of isotherms, the assignment of a given system as favorable or non-favorable in the batch adsorption process is informed by the form of this curve. In order to depict the Langmuir isotherm, a dimensionless constant called the separation factor [63] can be calculated as:
S f = 1 1 + b C i
The ideals or the ratio of the number of adsorbed species to the number of sites of accessible surface highly determine the surface coverage (Ø). The following formula has been found to fit the data by which the adsorption of metal ions takes place in biomass: bCi=Ø1−Ø. From the above equation, surface coverage (Ø) can be determined as [64]:
  = b C i 1 + b C i
Fifty milligrams of different bacterial biomasses were used for the biosorption experiments, with fifty milliliters of each metal solution at doses of 50–400 mg/L. In order to allow the attainment of adsorption equilibrium, the solutions were shaken for 180 min at a speed of 120 rpm [65]. Thus, in order to know the final concentrations of metal ions in the solution, aliquots were taken at fixed time intervals.

4.4.5. Analysis of Nitroreductase and Chromate Reductase Activity

To evaluate nitroreductase (NTR) activity in bacterial extracts, prepare a reaction mixture containing the following components: 50 mM phosphate buffer (pH 7.4); 0.1 mM NADPH (or NADH as a cofactor, Sigma, St Louis, MO 63118, USA); 0.1 mM of a nitroaromatic substrate (for example, nitrofurazone or CB1954). Start the procedure by adding a suitable volume (100 L) of freshly generated bacterial lysate and crude extract to the reaction mixture. The total reaction volume was adjusted to 1 mL. Incubate the reaction at 37 °C for a 10–30 min time period. Using a spectrophotometer, monitor the decline in absorbance of the substrate at its specific wavelength (e.g., 420 nm for nitrofurazone) [66]. Prepare a blank sample without the extract to account for the non-enzymatic reduction. To determine enzyme activity, apply the molar extinction coefficient of the substrate to calculate the change in absorbance over time. Express nitroreductase activity as U/mg or μmol of substrate reduced per minute per mg of protein.
Prepare the procedure using a 10 mM Tris-HCl buffer at pH 7.0, adding 1 mM NADH and 1 mM potassium chromate (K2CrO4) to evaluate chromate reductase activity. Include 1 mL of the bacterial extract, which contains the enzyme, and allow the mixture to incubate at 30 °C for one hour. This incubation facilitates the enzymatic reduction of Cr(VI) to Cr(III).
To acidify the sample, add 10 mL of 0.1M H2So4, followed by 15 mL of a 0.5% (v/v) solution of 1,5-diphenylcarbazide, to conclude the incubation. This reagent selectively forms a pink-colored complex with unreacted Cr(VI) but not with Cr(III). The intensity of the pink hue corresponds to the remaining Cr(VI) in the sample. Measure the absorbance using a spectrophotometer at 540 nm wavelength. To quantify the residual Cr(VI), refer to a standard curve of Cr(VI) reacted with diphenylcarbazide and calculate the amount that has decreased throughout the test. The activity is expressed as micromoles of Cr(VI) reduced per minute per milligram of protein [67].

4.5. A Neural Network Model for Predicting Chromium Reduction

When a system’s historical set of process data is obtained, an input pattern into the neural network may be mapped onto a corresponding output pattern. Moreover, it is not mandatory to model structural information about the process to achieve the learning of nonlinear functional relationships by the neural networks. The feed-forward back-propagation network model received our particular focus among various ANN types.
The experiment used three pH, time, and initial metal ion concentration process variables that resulted in three neurons at the input layer followed by ten hidden layer neurons and one single output layer feed-forward back-propagation network neuron (Qe). This is so because using many neurons can make the network memorize the training data, erasing one of the primary goals of the learning process—generalization—due to the large number of parameters, which may require a change. In particular, the given event was rated as close as possible by the neural network, and it was trained using the experimental data in MATLAB 7.1 (Mathworks Inc., Natick, Boston, MA, USA).
The error function that was employed was the root mean square error (RMSE), represented as follows: RMSE = V m V p N   , where the number of samples (N), Vm, is a measured value and Vp is the corresponding predicted value.
To identify and rank the degree of importance of each independent variable (input neurons) on the removal efficiency of the ANN model (output), sensitivity tests were conducted. In sensitivity analysis, the weights of each input neuron in the model were gradually turned off, one by one. In the current study, 100 data points were used to develop the multivariate biosorption ANN model for predicting qe (Supplementary Materials—Excel sheet). The evaluation of Qe prediction with removal efficiency included Coefficient of Determination (R2), Absolute Percentage Error (APE), and Mean Absolute Percentage Error (MAPE), along with Average Absolute Deviation (ADD) and Root Mean Square Error (RMSE) [68,69].

4.5.1. Model Sensitivity Analysis

The sensitivity analysis was performed to analyze the impact of each input variable on the model’s predicted accuracy of results. To evaluate the model’s performance, systematically, each specific variable of pH, temperature, incubation time, initial metal concentration, and remaining metal concentration was kept constant. Through the documentation and analysis of the resultant performance metrics, we identified the critical parameters that substantially affect the decrease in metal concentration.

4.5.2. Statistical Analysis

Experimental data and model predictions were statistically analyzed by utilizing MATLAB or Python 3.10. The performance metrics—correlation coefficients, MAPE, and RMSE—were computed, and the results were visually shown using Matplotlib 3.10. to elucidate the impact of each variable on Cr(VI) reduction efficiency. The neural network model optimized the parameters for optimal performance, and this comprehensive approach yielded a thorough understanding of the chromium reduction process.

5. Conclusions

This study presents a novel approach to sustainable agriculture by isolating and characterizing a highly efficient Rhizobium strain (NCBI accession number HE663761.1) that can effectively manage heavy metals and contribute to environmental cleanup. The notable feature of this bacterial strain is that it can perform two functions simultaneously: biosorb heavy metals and reduce numerous pollutants, including chromium and TNT. This study is distinct because it employs advanced Artificial Neural Network (ANN) modeling to forecast and enhance the ability of Cr(VI) to be reduced under various environmental conditions. This provides farmers and agricultural professionals with a precise tool for soil remediation to improve production. The strain’s ability to produce a large amount of biomass while removing hazardous heavy metals is a significant step forward for sustainable farming. It provides farmers with a cost-effective and environmentally friendly method for cleaning up polluted agricultural land. This biological method eliminates the need for costly chemical treatments, has a less detrimental impact on the environment, and enhances soil health simultaneously. This makes it especially useful in areas where concerns about heavy metal pollution affect food security and agricultural production.
The key novel concepts for sustainable agriculture presented here include a dual-purpose bioremediation method that combines heavy metal tolerance with active detoxification, as well as a predictive modelling utilizing ANN-based optimisation tailored to field applications. This strategy is more cost-effective than chemical remediation methods and enhances soil health by preserving beneficial microbes while eliminating contaminants. It is also a scalable technique that may be used in a wide range of agricultural systems and levels of contamination.

Recommendation for Future Research

Future studies should investigate how effectively the identified Rhizobium strain can remediate pollution in the field under various farming conditions. It is a good idea to examine how its use affects soil health, crop productivity, and the broader soil microbiome over time. Furthermore, integrating the ANN prediction model with real-time environmental monitoring could enhance its accuracy and utility in real-world applications. Investigating genetic and metabolic engineering methods may further enhance the strain’s ability to remove heavy metals. To find the best ways to utilize sustainable agriculture and ensure food safety, agronomists and environmental scientists will need to collaborate on research.

Supplementary Materials

The following supporting information can be downloaded at: https://www.mdpi.com/article/10.3390/catal15080726/s1, Figure S1: Impact of varying concentrations of- (a) Cd (b) Cr (c) Cu (d) Ni and (e) Zn on survivability of Rhizobium sp. OS1; Table S1: Effect of pH, temperatures and initial concentration of Cr (VI) on hexavalent chromium reduction by Rhizobium sp. OS1; Table S2: Input variable and the output values of MAPE, RMSE, Correlation coefficient and average absolute deviation, absolute percentage error.

Author Contributions

Conceptualization, M.O. and H.A.Q.; methodology, M.O.; software, M.A.A.-S.; validation, M.S.K., H.A.Q. and M.A.A.-S.; formal analysis, M.S.K.; investigation, M.O.; resources, H.A.Q.; data curation, M.O.; writing—original draft preparation, M.O.; writing—review and editing, M.O.; visualization, M.O.; supervision, M.S.K.; project administration, M.S.K.; funding acquisition, M.A.A.-S. All authors have read and agreed to the published version of the manuscript.

Funding

This research was funded by King Saud University, Ongoing Research Funding Program (ORF-2025-352), and the APC was funded by M.S.K.

Data Availability Statement

Data available as per request and most of the data in Supplementary File.

Acknowledgments

Mohd Shahnawaz Khan extends his appreciation to the ongoing research funding program (ORF-2025-352), King Saud University, Riyadh, Saudi Arabia, for funding this research.

Conflicts of Interest

The authors declare no conflicts of interest.

References

  1. Sharma, N.; Sodhi, K.K.; Kumar, M.; Singh, D.K. Heavy metal pollution: Insights into chromium eco-toxicity and recent advancement in its remediation. Environ. Nanotechnol. Monit. Manag. 2021, 15, 100388. [Google Scholar] [CrossRef]
  2. Kolopajlo, L. A review of sustainable leather tanning. Green Chem. Process. Dev. Sci. Math Eng. Technol. 2024, 11, 67. [Google Scholar]
  3. Xia, S.; Song, Z.; Jeyakumar, P.; Shaheen, S.M.; Rinklebe, J.; Ok, Y.S.; Bolan, N.; Wang, H. A critical review on bioremediation technologies for Cr(VI)-contaminated soils and wastewater. Crit. Rev. Environ. Sci. Technol. 2019, 49, 1027–1078. [Google Scholar] [CrossRef]
  4. Staszak, K.; Kruszelnicka, I.; Ginter-Kramarczyk, D.; Góra, W.; Baraniak, M.; Lota, G.; Regel-Rosocka, M. Advances in the removal of Cr(III) from spent industrial effluents—A review. Materials 2022, 16, 378. [Google Scholar] [CrossRef] [PubMed]
  5. Oves, M.; Khan, M.S.; Zaidi, A. Chromium reducing and plant growth promoting novel strain Pseudomonas aeruginosa OSG41 enhance chickpea growth in chromium amended soils. Eur. J. Soil Biol. 2013, 56, 72–83. [Google Scholar] [CrossRef]
  6. Karthik, C.; Elangovan, N.; Kumar, T.S.; Govindharaju, S.; Barathi, S.; Oves, M.; Arulselvi, P.I. Characterization of multifarious plant growth promoting traits of rhizobacterial strain AR6 under Chromium (VI) stress. Microbiol. Res. 2017, 204, 65–71. [Google Scholar] [CrossRef]
  7. Jaiswal, S. Bioremediation of Chromium contamination by Aspergillus and Rhizopus. Res. J. Sci. Technol. 2024, 16, 270–273. [Google Scholar] [CrossRef]
  8. Valentine, A.J.; Benedito, V.A.; Kang, Y. Legume nitrogen fixation and soil abiotic stress: From physiology to genomics and beyond. In Nitrogen Metabolism in Plants in the Post-Genomic Era; Foyer, C., Zhang, H., Eds.; Wiley-Blackwell Publishing Ltd.: West Sussex, UK, 2010; Volume 42. [Google Scholar]
  9. Liu, Y.; He, G.; He, T.; Saleem, M. Signaling and detoxification strategies in plant-microbes symbiosis under heavy metal stress: A mechanistic understanding. Microorganisms 2022, 11, 69. [Google Scholar] [CrossRef] [PubMed]
  10. Upadhyay, S.K.; Rajput, V.D.; Kumari, A.; Espinosa-Saiz, D.; Menendez, E.; Minkina, T.; Dwivedi, P.; Mandzhieva, S. Plant growth-promoting rhizobacteria: A potential bio-asset for restoration of degraded soil and crop productivity with sustainable emerging techniques. Environ. Geochem. Health 2023, 45, 9321–9344. [Google Scholar] [CrossRef]
  11. Palai, J.B.; Malik, G.C.; Maitra, S.; Banerjee, M. Role of Rhizobium on growth and development of groundnut: A review. Int. J. Agric. Environ. Biotechnol. 2021, 14, 63–73. [Google Scholar] [CrossRef]
  12. Fahde, S.; Boughribil, S.; Sijilmassi, B.; Amri, A. Rhizobia: A promising source of plant growth-promoting molecules and their non-legume interactions: Examining applications and mechanisms. Agriculture 2023, 13, 1279. [Google Scholar] [CrossRef]
  13. Ahirwar, N.K.; Singh, R.; Chaurasia, S.; Chandra, R.; Ramana, S. Effective role of beneficial microbes in achieving the sustainable agriculture and eco-friendly environment development goals: A review. Front. Microbiol 2020, 5, 111–123. [Google Scholar] [CrossRef]
  14. Bergey, D.H. Bergey’s Manual of Determinative Bacteriology; Lippincott Williams & Wilkins: Philadelphia, PA, USA, 1994. [Google Scholar]
  15. Sahgal, M.; Jaggi, V. Rhizobia: Culture Collections, Identification, and Methods of Preservation. In Microbial Resource Conservation: Conventional to Modern Approaches; Springer International Publishing: Cham, Switzerland, 2018; pp. 175–197. [Google Scholar]
  16. Alves, L.C.; De Souza, J.A.M.; de Mello Varani, A.; de Macedo Lemos, E.G. The Family Rhizobiaceae; Rosenberg, E., DeLong, E.F., Lory, S., Stackebrandt, E., Thompson, F., Eds.; Springer: Berlin/Heidelberg, Germany, 2014; pp. 419–437. [Google Scholar]
  17. Abdian, P.L.; Zorreguieta, A. Extracellular factors involved in biofilm matrix formation by Rhizobium leguminosarum. In The Perfect Slime–Microbial Extracellular Polymeric Substances (EPS); IWA Publishing Group: London, UK, 2016; pp. 227–247. [Google Scholar]
  18. O’Brian, M.R. Heme synthesis in the rhizobium-legume symbiosis: A palette for bacterial and eukaryotic pigments. J. Bacteriol. 1996, 178, 2471–2478. [Google Scholar] [CrossRef] [PubMed]
  19. Kuypers, M.M.; Marchant, H.K.; Kartal, B. The microbial nitrogen-cycling network. Nat. Rev. Microbiol. 2018, 16, 263–276. [Google Scholar] [CrossRef]
  20. Ransy, C.; Vaz, C.; Lombès, A.; Bouillaud, F. Use of H2O2 to cause oxidative stress, the catalase issue. Int. J. Mol. Sci. 2020, 21, 9149. [Google Scholar] [CrossRef]
  21. Alleman, A.B.; Peters, J.W. Mechanisms for generating low potential electrons across the metabolic diversity of nitrogen-fixing bacteria. Appl. Environ. Microbiol. 2023, 89, e00378-23. [Google Scholar] [CrossRef]
  22. Johnson, J.S.; Spakowicz, D.J.; Hong, B.Y.; Petersen, L.M.; Demkowicz, P.; Chen, L.; Leopold, S.R.; Hanson, B.M.; Agresta, H.O.; Gerstein, M.; et al. Evaluation of 16S rRNA gene sequencing for species and strain-level microbiome analysis. Nat. Commun. 2019, 10, 5029. [Google Scholar] [CrossRef]
  23. Mitra, S.; Stärk, M.; Huson, D.H. Analysis of 16S rRNA environmental sequences using MEGAN. In BMC Genomics; BioMed Central: New York, NY, USA, 2011; Volume 12, pp. 1–7. [Google Scholar]
  24. Faniyan, O.; Akpe, V.; Cock, I.E. Analyzing bacterial species from different environments using direct 16S rRNA gene sequencing methods. Pharmacogn. Commun. 2023, 13, 24–33. [Google Scholar] [CrossRef]
  25. Keklik, G. Understanding evolutionary relationships and analysis methods through mega software. Int. J. New Horiz. Sci. 2023, 1, 83–90. [Google Scholar]
  26. Egamberdieva, D.; Shurigin, V.; Gopalakrishnan, S.; Sharma, R. Microbial strategies for the improvement of legume production in hostile environments. In Legumes Under Environmental Stress: Yield, Improvement and Adaptations; John Wiley & Sons: Hoboken, NJ, USA, 2015; pp. 133–144. [Google Scholar]
  27. Rosier, A.; Medeiros, F.H.; Bais, H.P. Defining plant growth promoting rhizobacteria molecular and biochemical networks in beneficial plant-microbe interactions. Plant Soil 2018, 428, 35–55. [Google Scholar] [CrossRef]
  28. Szewczuk-Karpisz, K.; Tomczyk, A.; Grygorczuk-Płaneta, K.; Naveed, S. Rhizobium leguminosarum bv. trifolii exopolysaccharide and sunflower husk biochar as factors affecting immobilization of both tetracycline and Cd2+ ions on soil solid phase. J. Soils Sediments 2022, 22, 2620–2639. [Google Scholar] [CrossRef]
  29. Jobby, R.; Jha, P.; Gupta, A.; Gupte, A.; Desai, N. Biotransformation of chromium by root nodule bacteria Sinorhizobium sp. SAR1. PLoS ONE 2019, 14, e0219387. [Google Scholar] [CrossRef]
  30. Luka, Y.; Highina, B.K.; Zubairu, A.; Adeleke, A.J.; Hamadou, M.; Musti, Y.A.; Abubakar, A.M.; Yunus, M.U. Biosorption as technique for remediation of heavy metals from wastewater using microbial biosorbent. Biol. Sci. 2024, 4, 564–574. [Google Scholar] [CrossRef]
  31. Micheal, H.S.R.; Thyagarajan, D.; Govindaraj, M.; Saravanakumar, V.K.; Mohammed, N.B.; Murugasamy Maheswari, K. Biosorption of halophilic fungal melanized membrane–PUR/melanin polymer for heavy metal detoxification with electrospinning technology. Environ. Technol. 2024, 45, 5865–5877. [Google Scholar] [CrossRef]
  32. Qin, H.; Wang, Z.; Sha, W.; Song, S.; Qin, F.; Zhang, W. Role of plant-growth-promoting rhizobacteria in plant machinery for soil heavy metal detoxification. Microorganisms 2024, 12, 700. [Google Scholar] [CrossRef]
  33. Xie, S. Biosorption of heavy metal ions from contaminated wastewater: An eco-friendly approach. Green Chem. Lett. Rev. 2024, 17, 2357213. [Google Scholar] [CrossRef]
  34. Alfadaly, R.A.; Elsayed, A.; Hassan, R.Y.; Noureldeen, A.; Darwish, H.; Gebreil, A.S. Microbial sensing and removal of heavy metals: Bioelectrochemical detection and removal of chromium (VI) and cadmium (II). Molecules 2021, 26, 2549. [Google Scholar] [CrossRef] [PubMed]
  35. Vasilica, S.T.A.N.; Gament, E.; Cornea, C.P.; Voaideş, C.; Mirela, D.U.Ş.A.; Plopeanu, G. Effects of heavy metal from polluted soils on the Rhizobium diversity. Not. Bot. Horti Agrobot. Cluj-Napoca 2011, 39, 88–95. [Google Scholar] [CrossRef]
  36. Fagorzi, C.; Checcucci, A.; DiCenzo, G.C.; Debiec-Andrzejewska, K.; Dziewit, L.; Pini, F.; Mengoni, A. Harnessing rhizobia to improve heavy-metal phytoremediation by legumes. Genes 2018, 9, 542. [Google Scholar] [CrossRef]
  37. Joshi, S.; Gangola, S.; Bhandari, G.; Bhandari, N.S.; Nainwal, D.; Rani, A.; Malik, S.; Slama, P. Rhizospheric bacteria: The key to sustainable heavy metal detoxification strategies. Front. Microbiol. 2023, 14, 1229828. [Google Scholar] [CrossRef] [PubMed]
  38. Khosravi, R.; Moussavi, G.; Ghaneian, M.T.; Ehrampoush, M.H.; Barikbin, B.; Ebrahimi, A.A.; Sharifzadeh, G. Chromium adsorption from aqueous solution using novel green nanocomposite: Adsorbent characterization, isotherm, kinetic and thermodynamic investigation. J. Mol. Liq. 2018, 256, 163–174. [Google Scholar] [CrossRef]
  39. Chidambaram, R. Isotherm modelling, kinetic study and optimization of batch parameters using response surface methodology for effective removal of Cr(VI) using fungal biomass. PLoS ONE 2015, 10, e0116884. [Google Scholar]
  40. Basnet, P.; Gyawali, D.; Ghimire, K.N.; Paudyal, H. An assessment of the lignocellulose-based biosorbents in removing Cr(VI) from contaminated water: A critical review. Results Chem. 2022, 4, 100406. [Google Scholar] [CrossRef]
  41. Yan, G.; Gao, Y.; Xue, K.; Qi, Y.; Fan, Y.; Tian, X.; Wang, J.; Zhao, R.; Zhang, P.; Liu, Y.; et al. Toxicity mechanisms and remediation strategies for chromium exposure in the environment. Front. Environ. Sci. 2023, 11, 1131204. [Google Scholar] [CrossRef]
  42. Serrano-González, M.Y.; Chandra, R.; Castillo-Zacarias, C.; Robledo-Padilla, F.; Rostro-Alanis, M.D.J.; Parra-Saldivar, R. Biotransformation and degradation of 2, 4, 6-trinitrotoluene by microbial metabolism and their interaction. Def. Technol. 2018, 14, 151–164. [Google Scholar] [CrossRef]
  43. Ryberg, D.; Alexander, J. Inhibitory action of hexavalent chromium (Cr(VI)) on the mitochondrial respiration and a possible coupling to the reduction of Cr(VI). Biochem. Pharmacol. 1984, 33, 2461–2466. [Google Scholar] [CrossRef]
  44. Rahman, Z.; Thomas, L.; Chetri, S.P.; Bodhankar, S.; Kumar, V.; Naidu, R. A comprehensive review on chromium (Cr) contamination and Cr(VI)-resistant extremophiles in diverse extreme environments. Environ. Sci. Pollut. Res. 2023, 30, 59163–59193. [Google Scholar] [CrossRef]
  45. Firincă, C.; Zamfir, L.G.; Constantin, M.; Răut, I.; Capră, L.; Popa, D.; Jinga, M.-L.; Baroi, A.M.; Fierăscu, R.C.; Corneli, N.O.; et al. Microbial removal of heavy metals from contaminated environments using metal-resistant indigenous strains. J. Xenobiot. 2023, 14, 51–78. [Google Scholar] [CrossRef]
  46. Alotaibi, B.S.; Khan, M.; Shamim, S. Unraveling the underlying heavy metal detoxification mechanisms of Bacillus species. Microorganisms 2021, 9, 1628. [Google Scholar] [CrossRef] [PubMed]
  47. Maamoun, I.; Rushdi, M.A.; Falyouna, O.; Eljamal, R.; Eljamal, O. Insights into machine-learning modeling for Cr(VI) removal from contaminated water using nano-nickel hydroxide. Sep. Purif. Technol. 2023, 308, 122863. [Google Scholar] [CrossRef]
  48. Wang, X.; Zhang, Y.; He, B.; Li, J.; Yang, T.; Sun, H.; Shao, Q.; Xu, C. Deep learning algorithms in predicting Cr(VI) removal performance of S-ZVI: Models building and optimal parameters prediction. Sep. Purif. Technol. 2024, 330, 125487. [Google Scholar] [CrossRef]
  49. Huang, Y.; Tang, J.; Zhang, B.; Long, Z.E.; Ni, H.; Fu, X.; Zou, L. Influencing factors and mechanism of Cr(VI) reduction by facultative anaerobic Exiguobacterium sp. PY14. Front. Microbiol. 2023, 14, 1242410. [Google Scholar] [CrossRef] [PubMed]
  50. Gu, B.; Chen, J. Enhanced microbial reduction of Cr(VI) and U(VI) by different natural organic matter fractions. Geochim. Cosmochim. Acta 2003, 67, 3575–3582. [Google Scholar] [CrossRef]
  51. Chen, G.; Bai, Y.; Zeng, R.J.; Qin, L. Effects of different metabolic pathways and environmental parameters on Cr isotope fractionation during Cr(VI) reduction by extremely thermophilic bacteria. Geochim. Cosmochim. Acta 2019, 256, 135–146. [Google Scholar] [CrossRef]
  52. Padhiari, B.M.; Ray, A.; Champati, B.B.; Jena, S.; Sahoo, A.; Kuanar, A.; Halder, T.; Ghosh, B.; Naik, P.K.; Patnaik, J.; et al. Artificial neural network (ANN) model for prediction and optimization of bacoside A content in Bacopa monnieri: A statistical approach and experimental validation. Plant Biosyst.-Int. J. Deal. All Asp. Plant Biol. 2022, 156, 1346–1357. [Google Scholar] [CrossRef]
  53. Tariq, R.; Abatal, M.; Bassam, A. Computational intelligence for empirical modeling and optimization of methylene blue adsorption phenomena using available local zeolites and clay of Morocco. J. Clean. Prod. 2022, 370, 133517. [Google Scholar] [CrossRef]
  54. Mijwel, A.A.S.; Ahmed, A.N.; Afan, H.A.; Alayan, H.M.; Sherif, M.; Elshafie, A. Artificial intelligence models for methylene blue removal using functionalized carbon nanotubes. Sci. Rep. 2023, 13, 18260. [Google Scholar] [CrossRef]
  55. Marimuthu, S.; Rajendran, K. Artificial neural network modeling and statistical optimization of medium components to enhance production of exopolysaccharide by Bacillus sp. EPS003. Prep. Biochem. Biotechnol. 2023, 53, 136–147. [Google Scholar] [CrossRef] [PubMed]
  56. Yin, C.; Rosendahl, L.; Luo, Z. Methods to improve prediction performance of ANN models. Simul. Model. Pract. Theory 2003, 11, 211–222. [Google Scholar] [CrossRef]
  57. Garrity, G.M.; Holt, J.G. The road map to the manual. In Bergey’s Manual® of Systematic Bacteriology; Springer: New York, NY, USA, 2001; pp. 119–166. [Google Scholar]
  58. Poole, P.; Allaway, D. Carbon and nitrogen metabolism in Rhizobium. Adv. Microb. Physiol. 2000, 43, 117–163. [Google Scholar] [PubMed]
  59. Khodaverdiloo, H.; Samadi, A. Batch equilibrium study on sorption, desorption, and immobilisation of cadmium in some semi-arid zone soils as affected by soil properties. Soil Res. 2011, 49, 444–454. [Google Scholar] [CrossRef]
  60. Murphy, O.P.; Vashishtha, M.; Palanisamy, P.; Kumar, K.V. A review on the adsorption isotherms and design calculations for the optimization of adsorbent mass and contact time. ACS Omega 2023, 8, 17407–17430. [Google Scholar] [CrossRef]
  61. Musah, M.; Azeh, Y.; Mathew, J.T.; Umar, M.T.; Abdulhamid, Z.; Muhammad, A.I. Adsorption kinetics and isotherm models: A review. CaJoST 2022, 4, 20–26. [Google Scholar] [CrossRef]
  62. Ashraf, M.A.; Mahmood, K.; Wajid, A.; Maah, M.J.; Yusoff, I. Study of low cost biosorbent for biosorption of heavy metals. In Proceedings of the International Conference on Food Engineering and Biotechnology, Bangkok, Thailand, 7–9 May 2011; IPCBEE: Singapore, 2011; Volume 9, pp. 60–68. [Google Scholar]
  63. Maind, S.D.; Sharma, A.S.; Poojari, A.C.; Jadav, J.N.; Bhalerao, S.A. Utility of Plant Based Waste Materials as Potential Biosorbent for Sequestering Chromium (VI) from Aqueous Solutions. Int. J. Extensive Res. 2015, 9, 12–15. [Google Scholar]
  64. Oves, M.; Khan, M.S.; Qari, H.A. Ensifer adhaerens for heavy metal bioaccumulation, biosorption, and phosphate solubilization under metal stress condition. J. Taiwan Inst. Chem. Eng. 2017, 80, 540–552. [Google Scholar] [CrossRef]
  65. Liu, T.; Wang, Y.; Feng, L.; Tian, X.; Cui, J.; Yu, Z.; Wang, C.; Zhang, B.; James, T.D.; Ma, X. 2D strategy for the construction of an enzyme-activated NIR fluorophore suitable for the visual sensing and profiling of homologous nitroreductases from various bacterial species. ACS Sens. 2021, 6, 3348–3356. [Google Scholar] [CrossRef] [PubMed]
  66. Sanjay, M.S.; Sudarsanam, D.; Raj, G.A.; Baskar, K. Isolation and identification of chromium reducing bacteria from tannery effluent. J. King Saud Univ.-Sci. 2020, 32, 265–271. [Google Scholar] [CrossRef]
  67. Witek-Krowiak, A.; Chojnacka, K.; Podstawczyk, D.; Dawiec, A.; Bubała, K. Application of response surface methodology and artificial neural network methods in modelling and optimization of biosorption process. Bioresour. Technol. 2014, 160, 150–160. [Google Scholar] [CrossRef]
  68. Massaoudi, A.; Echouchene, F.; Ben Ayed, M.; Berguiga, A.; Harchay, A.; Al-Ghamdi, S.; Belmabrouk, H. Machine learning models for modeling the biosorption of Fe(III) ions by activated carbon from olive stone. Neural Comput. Appl. 2024, 36, 13357–13372. [Google Scholar] [CrossRef]
  69. Kardam, A. Simulation and optimization of artificial neural network modeling for prediction of sorption efficiency of nanocellulose fibers for removal of Cd(II) ions from aqueous system. Walailak J. Sci. Technol. 2013, 11, 497–508. [Google Scholar]
Figure 1. The microbe is differently sensitive to metal in the biomass (a) Rhizobium sp. OS-1. Error bars signifying the variability of tolerance in measurements were identical to each of the following: (b) the effect of cellular growth (Catalysts 15 00726 i001) and the removal of both (Catalysts 15 00726 i002) heavy metals and Cr(VI) at variable pH; (c) the cellular growth (Catalysts 15 00726 i003) and removal of (Catalysts 15 00726 i004) heavy metals by Rhizobium sp. OS1 grown in NB medium with 100 mg/L at different temperatures for 24 h at pH 7.
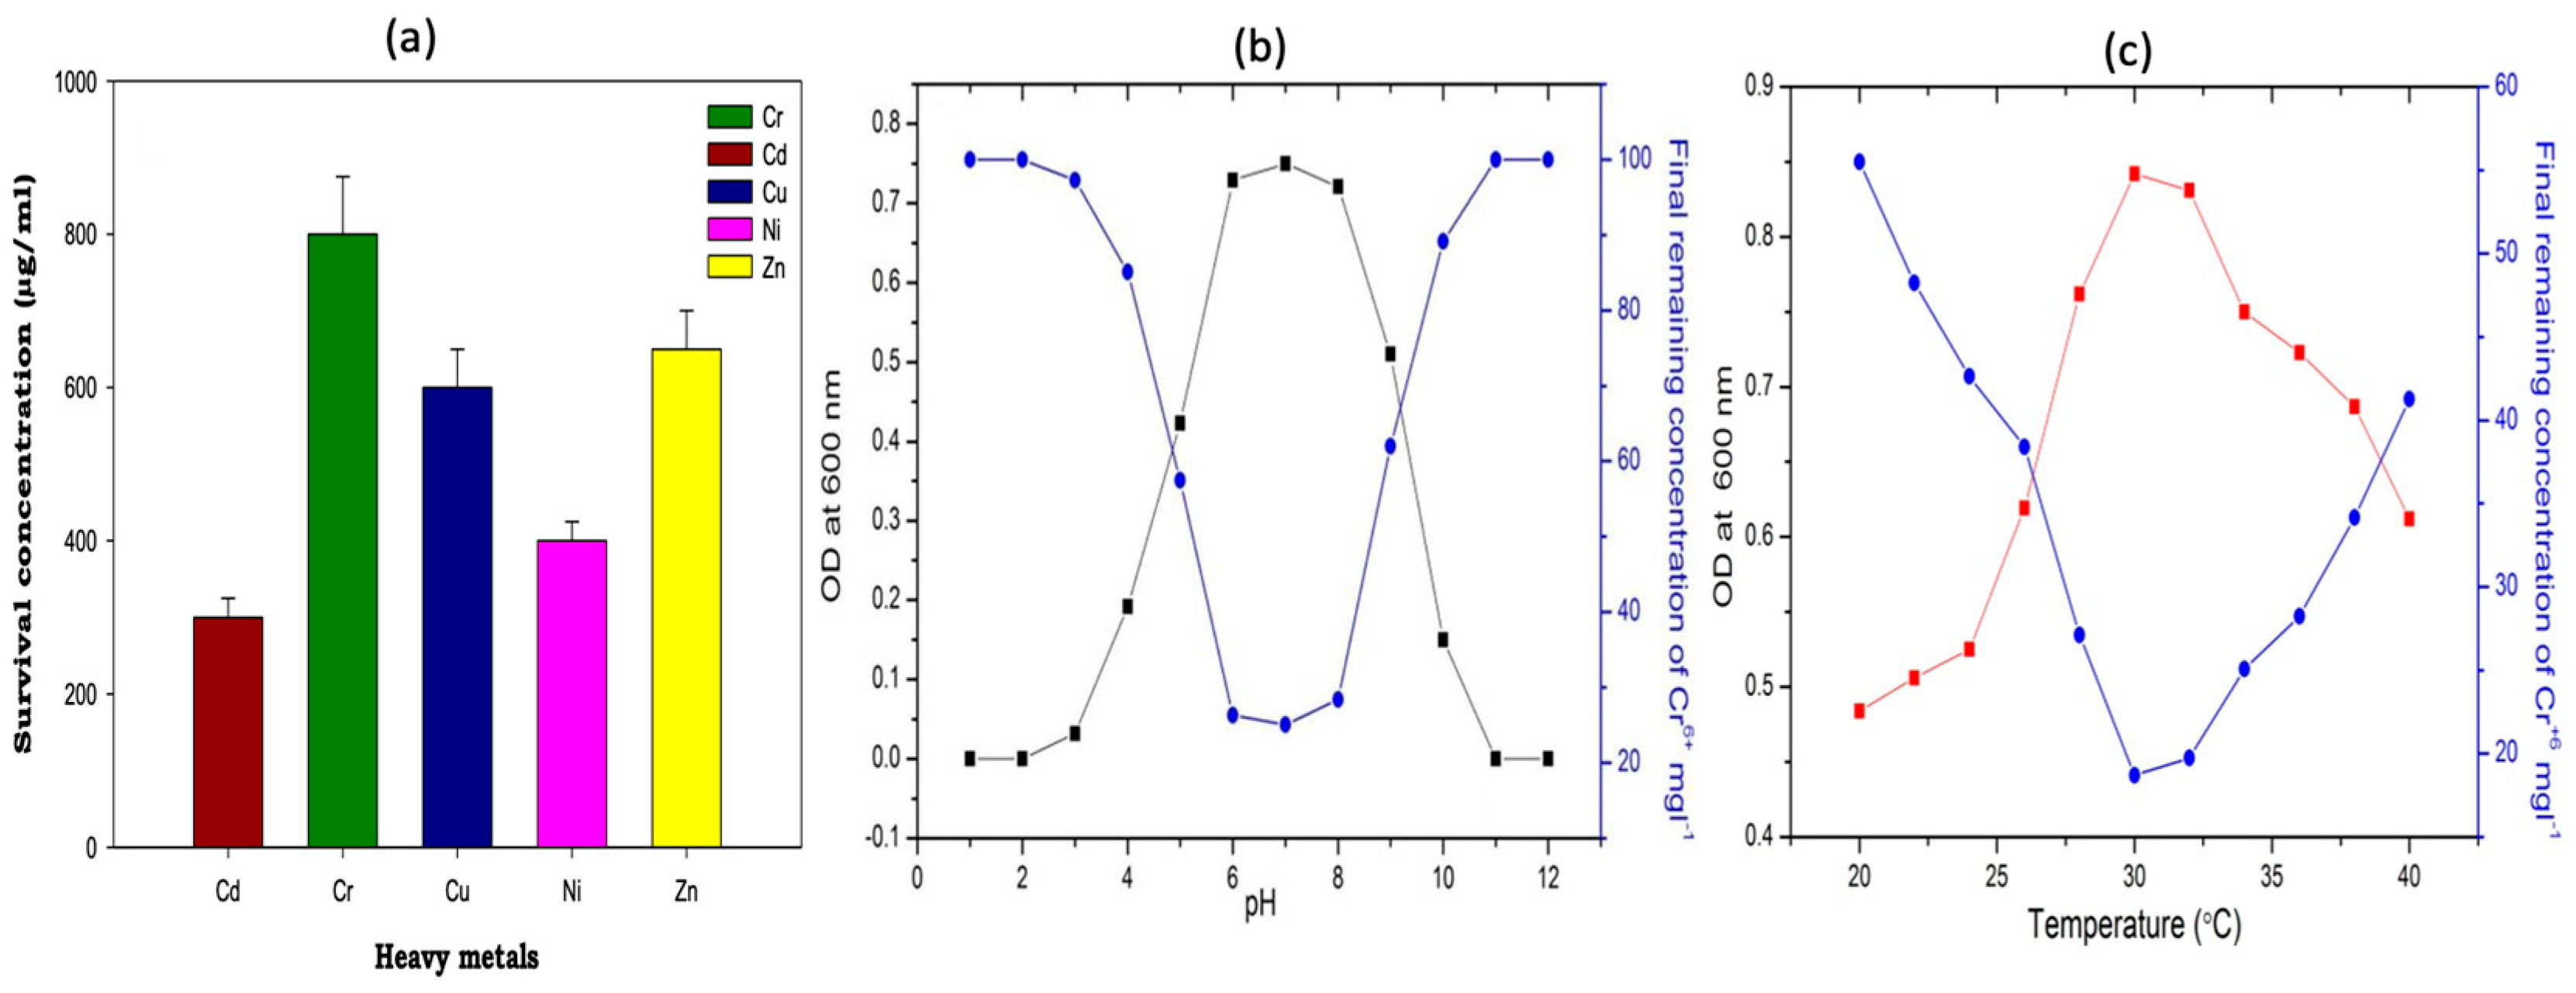
Catalysts 15 00726 g001
Figure 2. To elucidate the phylogenetic tree of the Rhizobium sp. isolate analyzed in this study, a phylogenetic tree was constructed using its 16SrRNA gene sequence (GenBank accession: HE663761.1). It represents the closely related bacteria identified through NCBI BLASTn analysis and the tree generated using the neighbor-joining (Nj) algorithm.
Catalysts 15 00726 g002
Figure 3. The heat map illustrates the patterns of chromium reduction, highlighting threshold effects. The graphs demonstrate how pH, temperature, and the initial Cr(VI) concentration influence the levels of residual Cr(VI) over time.
Catalysts 15 00726 g003
Figure 4. A best-fit curve of (a) Langmuir and (b) Freundlich adsorption isotherms of metal ions on the biosorbent biomass of Rhizobium sp. OS-1.
Catalysts 15 00726 g004
Figure 5. (a) Kinetics of nitroreductase activity evaluated by time-dependent production of reduced nitrofurazone. Indicating active nitroreductase-mediated reduction, this graph depicts a time-dependent rise in the concentration of reduced nitrofurazone (measured in nmol/mg protein) during the enzymatic activity. With data points reflecting mean values ± standard deviation from replicate tests, the linear trend indicates a steady-state reaction rate during a 10 min period. (b) Time-course of TNT biotransformation by bacterial protein extract. Over a 500 min period, the graph shows how a bacterial extract converts TNT (trinitrotoluene) into its reduced forms. The curve shows a quick early transformation phase followed by a plateau as the reaction approaches saturation. The y-axis indicates the quantity of converted TNT (pmol/µg protein), implying enzyme-catalyzed reduction kinetics toward an ultimate equilibrium condition. (c) Relative chromate (Cr(VI)) decreases under various laboratory conditions. The bar graph shows the percentage drop of Cr(VI) in the presence of (1) NADH only, (2) NADH + potassium chromate (K2CrO4), and (3) NADH + K2CrO4 + bacterial protein extract. NADH by itself shows little reduction; the NADH and chromate combination somewhat increases reduction. Adding the bacterial protein greatly lowers it to about 90%, hence verifying Cr(VI) reductase activity.
Catalysts 15 00726 g005aCatalysts 15 00726 g005b
Figure 6. (a) How the number of neurons in the hidden layers affects the MAPE; (b,d) the effect of the number of neurons in the hidden layer on the RMSE; (c) the variation in the squared error concerning the epoch; (d) the comparison of the experimental results obtained from the test set and the finding of the neural network modeling.
Catalysts 15 00726 g006aCatalysts 15 00726 g006b
Table 1. The biochemical characteristics of Cr(VI)-reducing bacterial isolate OS1.
CharacteristicsRhizobia Groups
Gram reactionG-ve
Cell size and shapeShort rods
Colony morphologyTransparent, circular, and mucoid
Pigment colorpink
Nitrate+
Methyl®
Catalase+
Citrate+
Voges Proskauer
Indole
Gelatin
Starch+
Glucose+
Sucrose+
Mannitol+
Presumptive identificationRhizobium sp.
Final identificationHE663761.1
Note: here in the table used symbol “+” means positive and “−“means negative.
Table 2. (A) Impact of initial metal dose on biosorption by dry biomass of Rhizobium sp. OS-1. (B) Based on the Langmuir and Freundlich models concerned with biosorption by dry biomass of Rhizobium sp. OS-1.
(A)
Metal Concentration (mg/L)Percent Removal
Cr(VI)Cu(II)Cd(II)Ni(II)Zn(II)Pb(II)
2596.7096.1094.9095.5094.8090.80
5095.6895.7693.7694.3694.1690.16
7593.9694.3692.3392.9693.7688.16
10092.3591.8490.5491.8491.4487.44
12591.6489.4188.1589.9991.0886.6
15089.5887.5285.3790.0588.7884.72
(B)
MetalAdsorption Isotherm
LangmuirFreundlich
Qmaxbr2SfØk1/nr2
Cr(VI)37.170.2340.9950.0410.9597.1660.5800.994
Cu(II)41.660.1740.9960.0540.9457.0590.5490.960
Cd(II)41.150.1310.9990.0710.9295.6340.5930.983
Ni(II)43.100.1420.9960.0650.9345.7570.6510.996
Zn(II)55.860.0900.9980.0990.9015.4450.6740.981
Pb(II)62.890.0430.9980.1220.9773.1870.7520.994
In the above tables, Qmax and b = Langmuir constant; Sf = separation factor; Ø = surface coverage; k and n = Freundlich constant; and r2 = correlation coefficient.
Table 3. A comprehensive comparative table of the final performance metrics for both training and testing datasets, as evaluated for the Artificial Neural Network (ANN) model.
MetricTraining DatasetTesting Dataset
MAPE (%)Lowest (at 10 hidden neurons)Lowest (at 10 hidden neurons)
RMSELowest (at 10 hidden neurons)Lowest (at 10 hidden neurons)
MSELowest (at 10 hidden neurons)Lowest (at 10 hidden neurons)
R2High (close to 1, at optimal neurons)High (close to 1, at optimal neurons)
Disclaimer/Publisher’s Note: The statements, opinions and data contained in all publications are solely those of the individual author(s) and contributor(s) and not of MDPI and/or the editor(s). MDPI and/or the editor(s) disclaim responsibility for any injury to people or property resulting from any ideas, methods, instructions or products referred to in the content.

