Article

The Impact of Sm Promoter on the Catalytic Performance of Ni/Al2O3-SiO2 in Methane Partial Oxidation for Enhanced H2 Production

by
Salwa B. Alreshaidan
1,
Rasha S. A. Alanazi
1,
Omalsad H. Odhah
2,
Ahmed A. Ibrahim
3,*,
Fekri Abdulraqeb Ahmed Ali
4,
Naif Alarifi
5,
Khaled M. Banabdwin
3,
Sivalingam Ramesh
6 and
Ahmed S. Al-Fatesh
3,*
1
Department of Chemistry, College of Science, King Saud University, P.O. Box 2455, Riyadh 11451, Saudi Arabia
2
Department of Mathematical Sciences, College of Science, Princess Nourah bint Abdulrahman University, P.O. Box 84428, Riyadh 11671, Saudi Arabia
3
Chemical Engineering Department, College of Engineering, King Saud University, P.O. Box 800, Riyadh 11421, Saudi Arabia
4
Chemical Engineering Department, College of Engineering, Imam Mohammad Ibn Saud Islamic University (IMSIU), P.O. Box 5701, Riyadh 11432, Saudi Arabia
5
Institute of Refining and Petrochemicals Technologies, King Abdulaziz City for Science and Technology (KACST), P.O. Box 6086, Riyadh 11442, Saudi Arabia
6
Department of Energy and Materials Engineering, Dongguk University-Seoul, Seoul 04620, Republic of Korea
*
Authors to whom correspondence should be addressed.
Catalysts 2025, 15(8), 721; https://doi.org/10.3390/catal15080721 (registering DOI)
Submission received: 26 June 2025 / Revised: 17 July 2025 / Accepted: 25 July 2025 / Published: 29 July 2025
(This article belongs to the Section Industrial Catalysis)

Abstract

This study investigates the effects of samarium (Sm) promotion on the catalytic activity of 5 weight percent Ni catalysts for partial oxidation of methane (POM)-based hydrogen production supported on a Si-Al mixed oxide (10SiO2+90Al2O3) system. Several 5% Ni-based catalysts supported on silica–alumina was used to test the POM at 600 °C. Sm additions ranged from 0 to 2 wt.%. Impregnation was used to create these catalysts, which were then calcined at 500 °C and examined using BET, H2-TPR, XRD, FTIR, TEM, Raman spectroscopy, and TGA methods. Methane conversion (57.85%) and hydrogen yield (56.89%) were greatly increased with an ideal Sm loading of 1 wt.%, indicating increased catalytic activity and stability. According to catalytic tests, 1 wt.% Sm produced high CH4 conversion and H2 production, as well as enhanced stability and resistance to carbon deposition. Nitrogen physisorption demonstrated a progressive decrease in pore volume and surface area with the addition of Sm, while maintaining mesoporosity. At moderate Sm loadings, H2-TPR and XRD analyses showed changes in crystallinity and increased NiO reducibility. Sm incorporation into the support and its impact on the ordering of carbon species were indicated by FTIR and Raman spectra. The optimal conditions to maximize H2 yield were successfully identified through optimization of the best catalyst, and there was good agreement between the theoretical predictions (87.563%) and actual results (88.39%). This displays how successfully the optimization approach achieves the intended outcome. Overall, this study demonstrates that the performance and durability of Ni-based catalysts for generating syngas through POM are greatly enhanced by the addition of a moderate amount of Sm, particularly 1 wt.%.

1. Introduction

Hydrogen is a clean, promising, and non-polluting energy source that is used in engines, electricity generation, and many other industrial applications [1,2]. It is produced using a range of renewable and non-renewable feedstocks, including water electrolysis, biomass, natural gas, coal, and gasoline [3]. However, fossil fuels currently provide about 85% of the world’s energy. The use of fossil fuels produces greenhouse gases (GHGs), which lead to unacceptable air pollution [4]. Water vapor accounts for 36–70% of the greenhouse effect (excluding clouds); CO2 for 9–26%; methane for 4–9%; and ozone for 3–7%. These are the main greenhouse gases. Because GHGs can be converted into syngas—a mixture of hydrogen and carbon monoxide—by a process known as dry reforming of methane, there is a lot of interest in using them. Synthesis gas is helpful as a raw material for the construction of hydrocarbons and other valuable products, like oxygenated chemicals, in addition to providing hydrogen, which is thought to be a clean energy source for fuel cells. Syngas can be produced from methane in three primary ways: partial oxidation of methane (POM), dry reforming of methane (DRM), and steam reforming of methane (SRM) (Equations (1)–(3)) [5].
C H 4 + 1 2 O 2 C O + 2 H 2
C H 4 + C O 2 2 H 2 + 2 C O
C H 4 + H 2 O C O + 3 H 2
One of the most interesting techniques for creating syngas from methane-rich gas streams is the catalytic POM. A few benefits of the POM process include (i) being a mildly exothermic reaction; (ii) having high conversion and selectivity at lower process temperatures; (iii) producing syngas with an H2/CO molar ratio of roughly 2, which is suitable for downstream processes like methanol synthesis and Fischer–Tropsch; and (iv) operating under high gas hourly space velocity (GHSV), which requires less production scale and capital to achieve the same capacity [6]. POM is a cost-effective syngas generation method and an energy-efficient process because of these features [5]. The most popular process for creating syngas from CH4 is partial oxidation of methane (POM) [Equation (1)] [7]. Catalytic partial oxidation of methane to syngas is challenging because it requires controlling the reaction selectivity toward complete combustion. The “direct mechanism,” in which CH4 and O2 react on the catalyst surface to produce CO and H2, and the “combustion-reforming mechanism,” in which CH4 and O2 first react to form H2O and CO2, and then the excess methane is further oxidized into syngas by CO2 [through DRM; Equation (2)] or by H2O (through SRM [Equation (3)]), are the two reaction mechanisms that have been proposed in the literature to describe the reaction mechanism involved in the CPOM [8,9].
Two kinds of catalyst formulations are commonly employed for the catalytic partial oxidation of methane to obtain high syngas selectivity and high methane conversion. These consist of (i) noble metal-based supported catalysts (Rh, Ru, Ir, Pt, and Pd) and (ii) first-row transition metal-based supported catalysts (Ni, Co, and Cu). Green et al. demonstrated that for stoichiometric partial oxidation with air, high syngas output (H2 ≈ 99%, CO ≈ 97%) and high methane conversion (≈94%) can be achieved at 1050 K and 1 bar over nearly all noble metal catalysts, including rare-earth ruthenium pyrochlores. POM over Rh and Pt–Pd catalysts was investigated by Hickman et al. [9]. Transition metal-based catalysts, especially those supported by Ni and Co, are among the most extensively researched catalysts for catalytic POM due to their effectiveness, wider availability, and lower cost compared to noble metal catalysts. Nickle catalysts often exhibit higher initial catalytic activity for methane conversion and better selectivity towards syngas when compared to cobalt catalysts. Despite its potential for activity, cobalt can occasionally favor full combustion to CO2 and H2O if it is not adequately supported or encouraged. Ni is preferred over Co. The impact of support on the functionality of Ni-based catalysts has been the subject of numerous investigations in the literature. The high dispersion capacity of Ni nanoparticles (NPs) and thermal stability of non-reducible oxides make them one of the most researched oxides as supports for Ni catalysts.
A composite made of silicon oxide and aluminum can be formed, with silicon oxide serving as reinforcement and aluminum serving as the matrix. Silicon oxide and aluminum can react to produce silicon and Al2O3 at high temperatures. The volume percentage of silicon oxide reinforcement in the composite can affect its mechanical characteristics, including tensile strength and elongation. Catalysts and other materials with particular mechanical and thermal requirements are among the many uses for these composites [10]. Mo, Mg, Ti, and Y oxides were used to dope the alumina support. According to the characterization results, Ni interacts strongly with the support. Shah et al. investigated the use of a Ni-based catalyst in dry reforming and combined it with support [11]. Kai et al. also demonstrated the importance of the metal–support interaction in controlling catalyst sintering and carbon deposition. Consequently, the distribution of Ni on the catalyst surface and the support’s structure seem to be the main factors in resolving the deactivation issue [12]. The ability of samarium to interact with the active ingredients of the catalyst and change their chemical behavior, resulting in increased activity, stability, and selectivity, is frequently the basis for its use as a promoter. In the steam reforming of methane (SRM) process, promoted Ni/SBA-15 catalysts were created and employed at varying Sm promoter concentrations (0.5, 1.5, 3, and 6 weight percent). The catalytic results demonstrated that when the Sm promoter was added, the catalytic activity rose from 31% in the unprompted catalyst to 70% in the 3-weight-percent-Sm-promoted catalyst. Additionally, at about 66%, the catalyst with 3 weight percent Sm produced the most H2 [13]. This study aims to determine the optimal Sm promoter loading for the Ni catalyst supported on a combined silica–alumina support in order to maximize stability and activity while reducing the formation of carbon at 600 °C. The impact of varying Sm promoter loadings on stability and activity was examined. To gain a better understanding of the catalytic performance, a variety of characterization techniques were employed, including BET, H2-TPR, XRD, FTIR, TEM, Raman spectroscopy, and TGA [14].

2. Results

2.1. Brunauer–Emmett–Teller (BET) Investigations
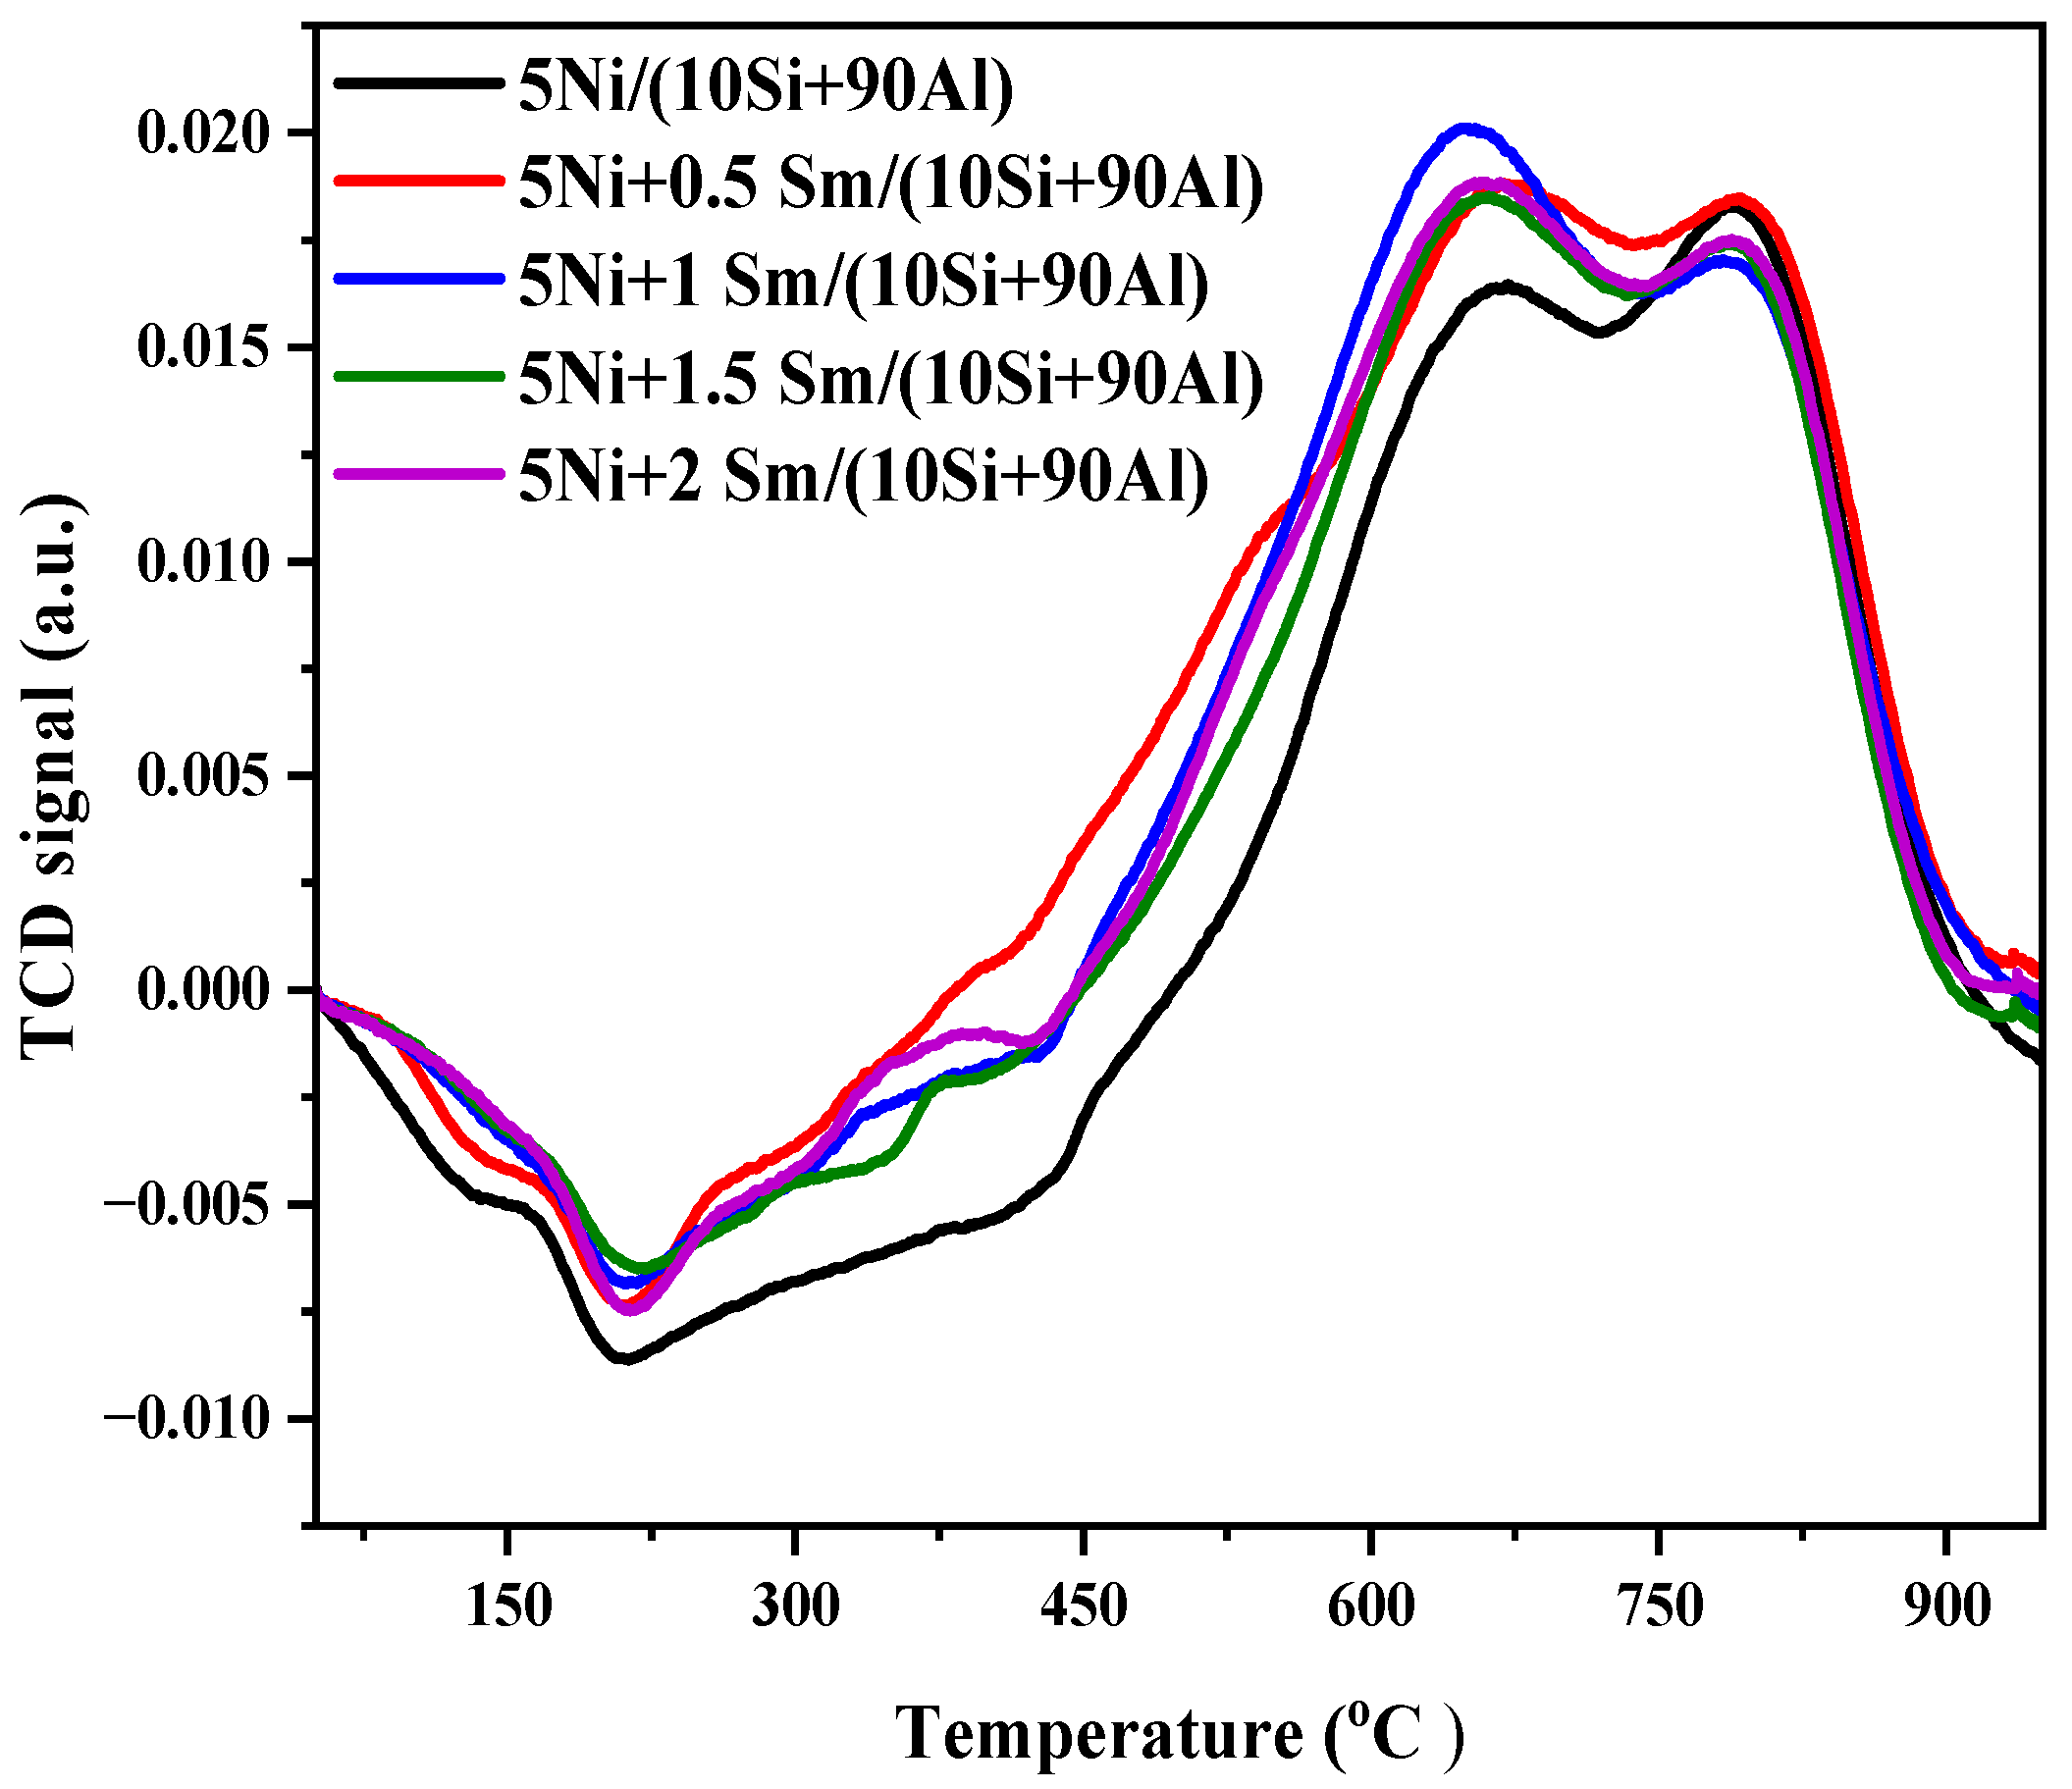
The small changes in texture are important because they influence how easily reactants and products can reach the active sites during partial oxidation of methane (POM). Because the average pore size stayed constant across all samples (10.91–11.41 nm) despite the decrease in surface area, the mesoporous structure was maintained.
Figure 1 displays the nitrogen adsorption–desorption isotherms of the Ni-based catalysts with varying Sm promoter contents. Since all of the samples exhibit type IV isotherms with H3-type hysteresis loops, they all have mesoporous structures. The largest BET surface area (192 m2/g) and good nitrogen adsorption capabilities were exhibited by the promoter-free catalyst, 5Ni/(10Si+90Al) (Table 1). Both surface area and nitrogen uptake gradually decreased as the Sm loading increased from 0.5 to 2 weight percent; the sample with the lowest BET surface area (177 m2/g) was 5Ni+2Sm/(10Si+90Al). This decrease can be ascribed to Sm species’ partial pore blockage or surface coverage, which may marginally impair the pore network’s accessibility. All Sm-containing samples, however, retained a mesoporous structure with comparable average pore sizes (~11 nm), suggesting that the basic porous framework was largely unaltered.

2.2. H2-TPR

The temperature-programmed reduction (H2-TPR) profiles of the catalysts calcined at 500 °C are shown in Figure 2. The presence of Ni species with varying degrees of interaction with the support is reflected in the profiles’ multiple reduction peaks. The mild and strong interaction of NiO with the support is responsible for the significant reduction peak that is seen between 650 °C and 800 °C. The reduction peaks progressively move toward lower temperatures with the addition of the Sm promoter. This behavior implies that Sm encourages the production of NiO species that are easier to reduce.
Up to the 5Ni/10Si+90Al catalyst, the high-temperature reduction peak’s intensity is comparatively greater than the low-temperature reduction peaks. Up until the 5Ni/10Si+90Al catalyst, the strong NiO interaction was stronger than the weak one. However, in the Sm-promoted catalyst, the low-temperature peak intensifies more than the high-temperature peak. It implies that under mild interaction, the NiO concentration of the promoted catalyst is also rising. In summary, the addition of Sm increases the number of active sites and facilitates the reduction of the promoted catalyst. At 1 wt.% Sm, these active sites are most prevalent, which affects how nickel interacts with them and increases the catalyst’s catalytic activity and reduction capacity. The concentration of this activity peaks at 1 wt. % Sm, which affects the interaction between nickel and it and, in turn, the catalytic activity and reducibility of the catalyst [15].
The quantitative H2 consumption information obtained from the TPR analysis is shown in Table 2. With the highest uptake (19.3 cm3/g STP) and a reduction degree (DR) of 101%, the reference catalyst (5Ni/(10Si+90Al)) suggested that NiO had been reduced almost entirely to metallic Ni. Total consumption and DR values gradually decline as the Sm content rises. The lowest consumption (17.1 cm3/g STP) and DR (90%) were observed in the catalyst with 1.5 weight percent Sm, whereas a slight increase was observed at 2 weight percent Sm (17.3 cm3/g STP; DR 90.8%).

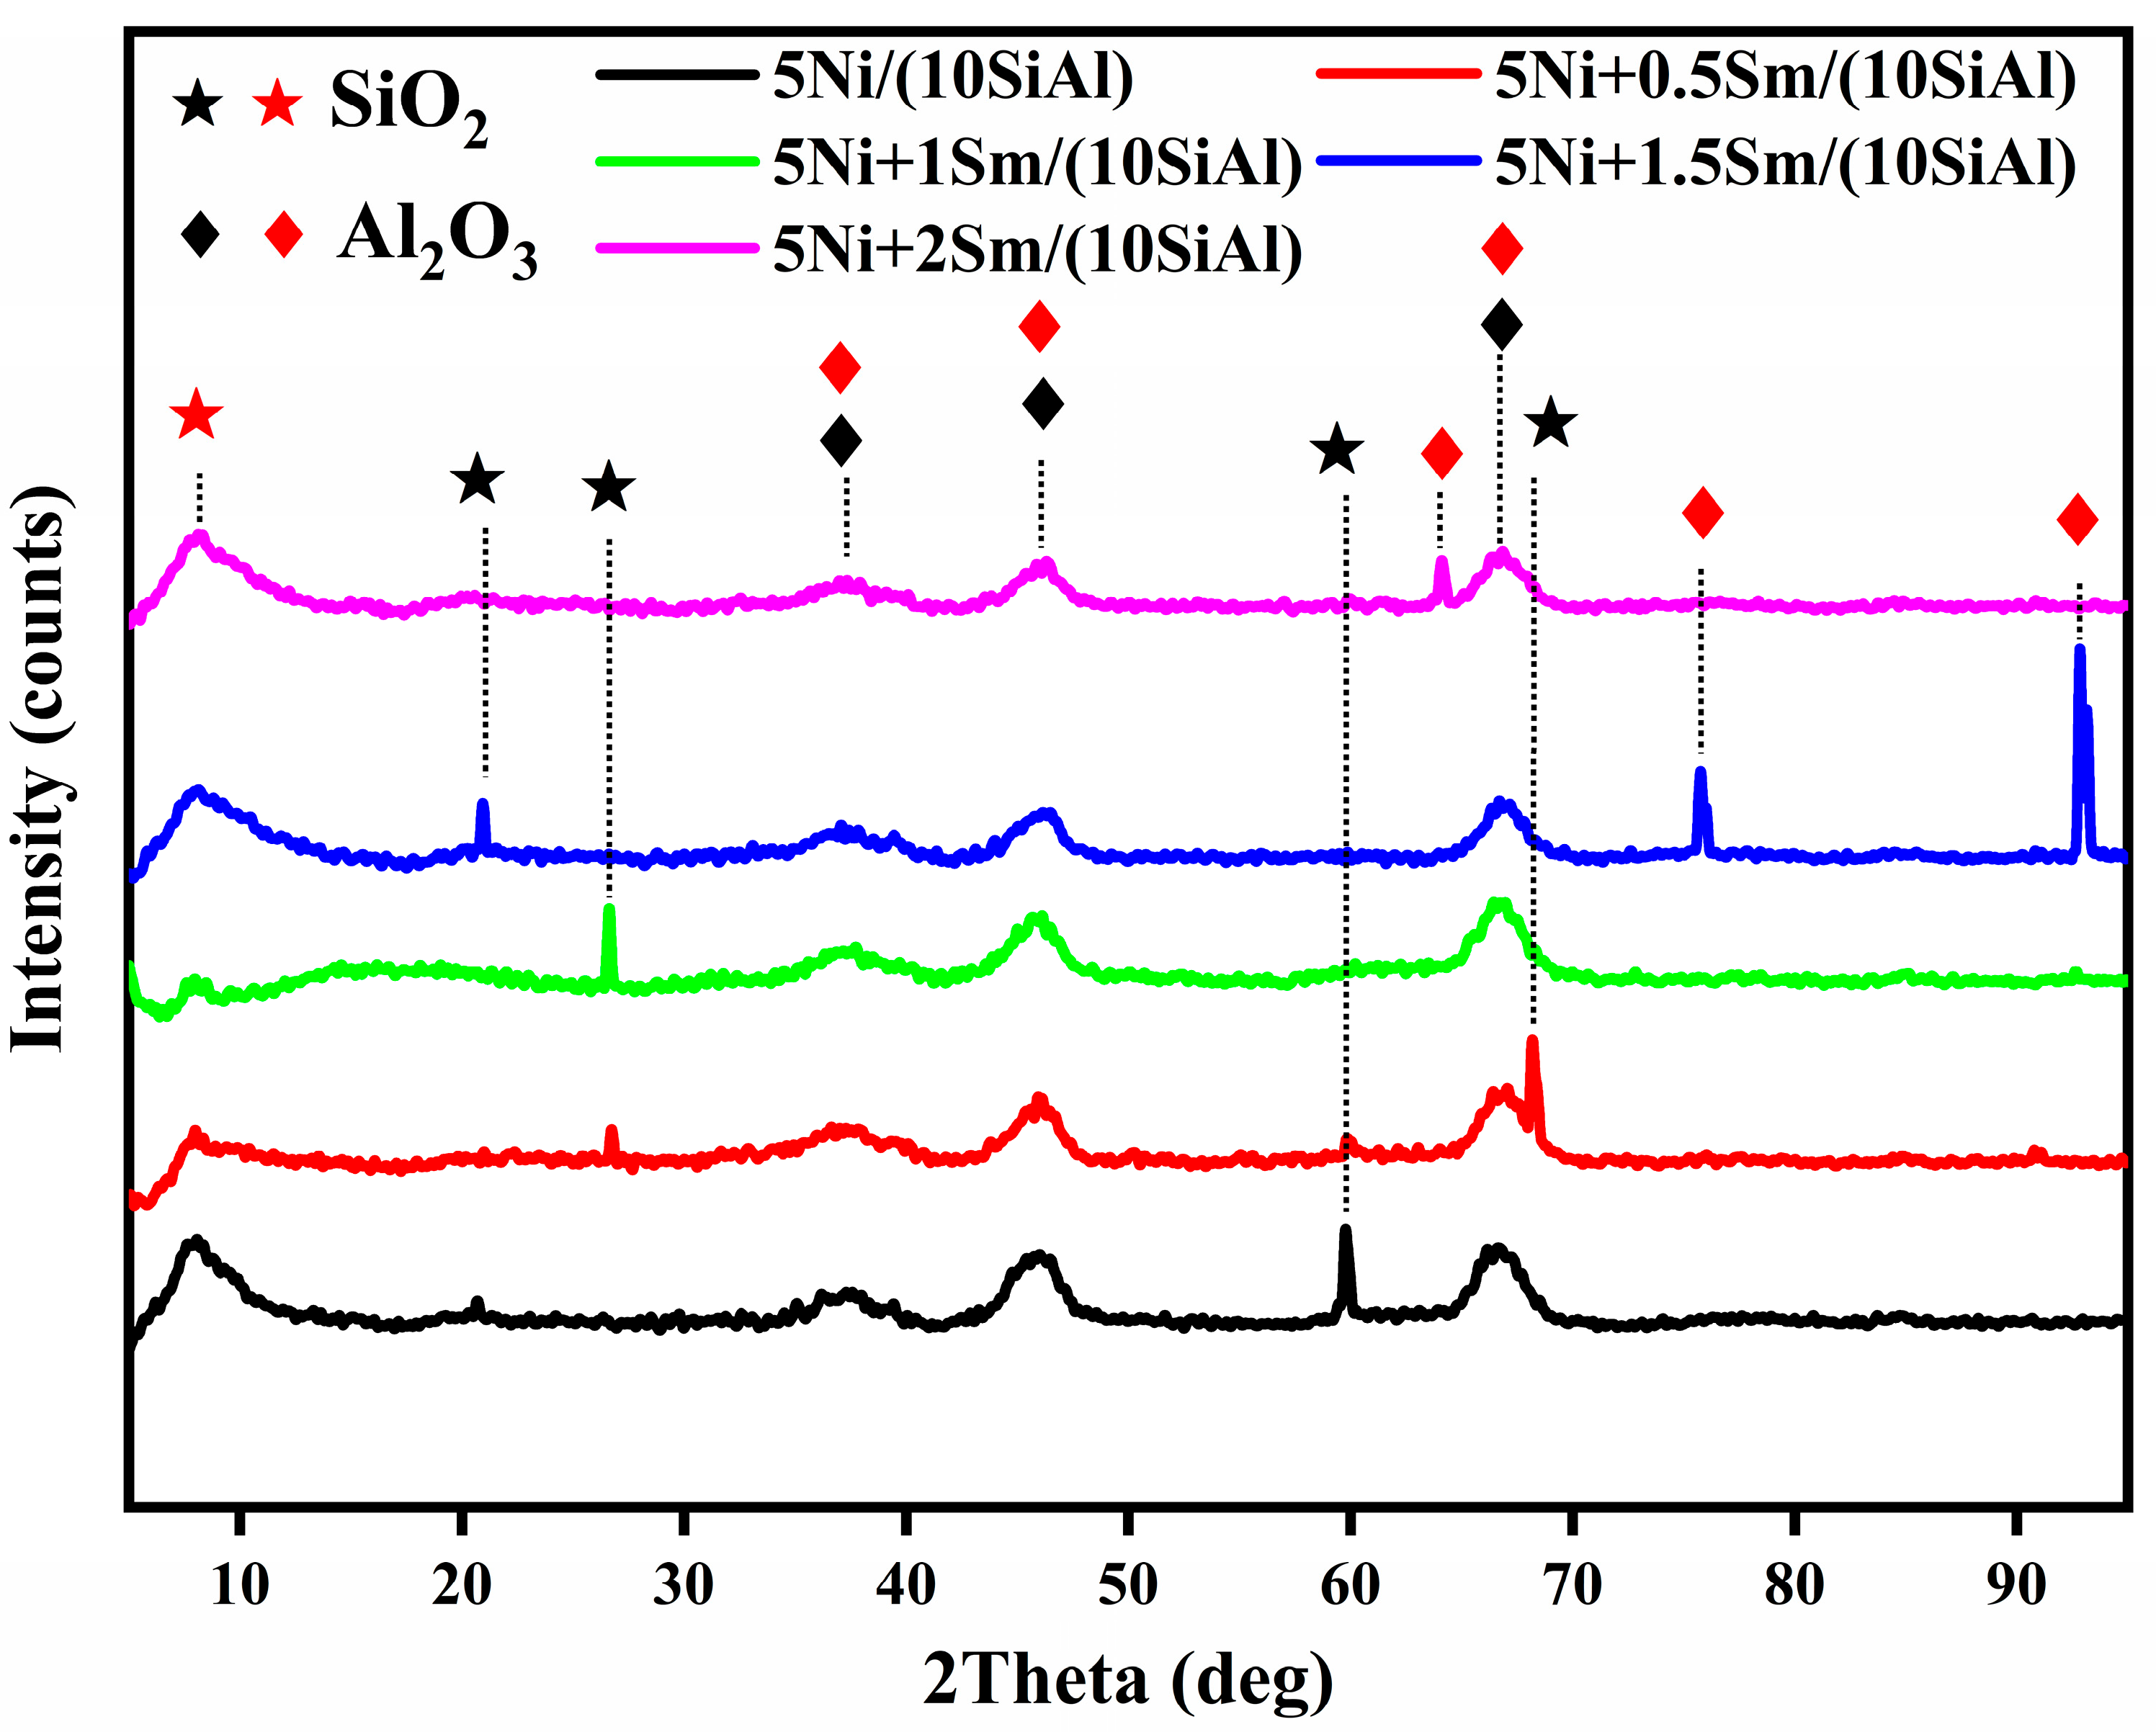
2.3. X-Ray Diffraction (XRD) Analysis

The XRD patterns of the calcined catalysts with different samarium (Sm) contents are shown in Figure 3. Sm loading ranges from 0 to 2 wt.%, and all samples have 5 wt.%. Ni supported on a Si-Al oxide matrix (10Si+90Al). Broad peaks that are indicative of amorphous or poorly crystalline aluminosilicate supports can be seen in the diffraction patterns. There are several known polymorphic forms of silica and alumina. All catalysts exhibit the diffraction patterns for cubic Al2O3 at Bragg’s angles 37.4°, 46.0°, and 66.3° (Card# 00Card #303) and at Bragg’s angles 37.4° 63.9°, 65.9°, 75.2°, and 92.7° (JCPDS Card #00-003-0915). All catalysts exhibit the diffraction patterns for hexagonal SiO2 phases at Bragg’s angles of 8.0° (JCPDS Card #96-412-4060) and 21.0°, 26.6°, 59.6°, and 68.4° (JCPDS Card #96-901-1494). The reference sample (5Ni/(10Si+90Al)) hardly exhibits weak diffraction peaks corresponding to NiO, indicating the presence of microscopic NiO crystallites. The intensity of the NiO-related peaks increases with Sm content, especially for samples containing 1.5 and 2 wt.% Sm, indicating increased particle growth or crystallinity. This pattern can be explained by the fact that increased Sm loading reduces metal–support interaction, allowing for NiO particles to grow during calcination. Furthermore, the absence of distinct peaks for Sm-containing phases may indicate that the Sm is either mixed into the non-crystal support structure or widely distributed. According to the data, the catalysts’ structure is altered by the moderate addition of Sm, which modifies the crystalline and dispersed nature of NiO.

2.4. Fourier-Transform Infrared Spectroscopy (FTIR)

The FTIR spectra of the catalysts that were calcined at 500 °C and had varying samarium (Sm) contents are shown in Figure 4. The characteristic vibrational bands observed in all samples are caused by the support structure, which is primarily composed of Si–O–Si and Al–O bonds. The broad absorption bands centered around 1000–1100 represent the asymmetric stretching of Si–O–Si groups, while the bands in the 500–700 region are associated with Al–O bending vibrations. As the amount of Sm increases, the bands progressively get stronger, which may mean that Sm is interacting more or partially forming the aluminosilicate structure. Furthermore, weak broad bands around 3400–3600 are linked to surface hydroxyl groups (-OH); changes in these bands imply that the addition of Sm affects surface hydroxylation or hydration. The NH3-TPD (Figure S1) and the XPS measurements are inserted in the support information.

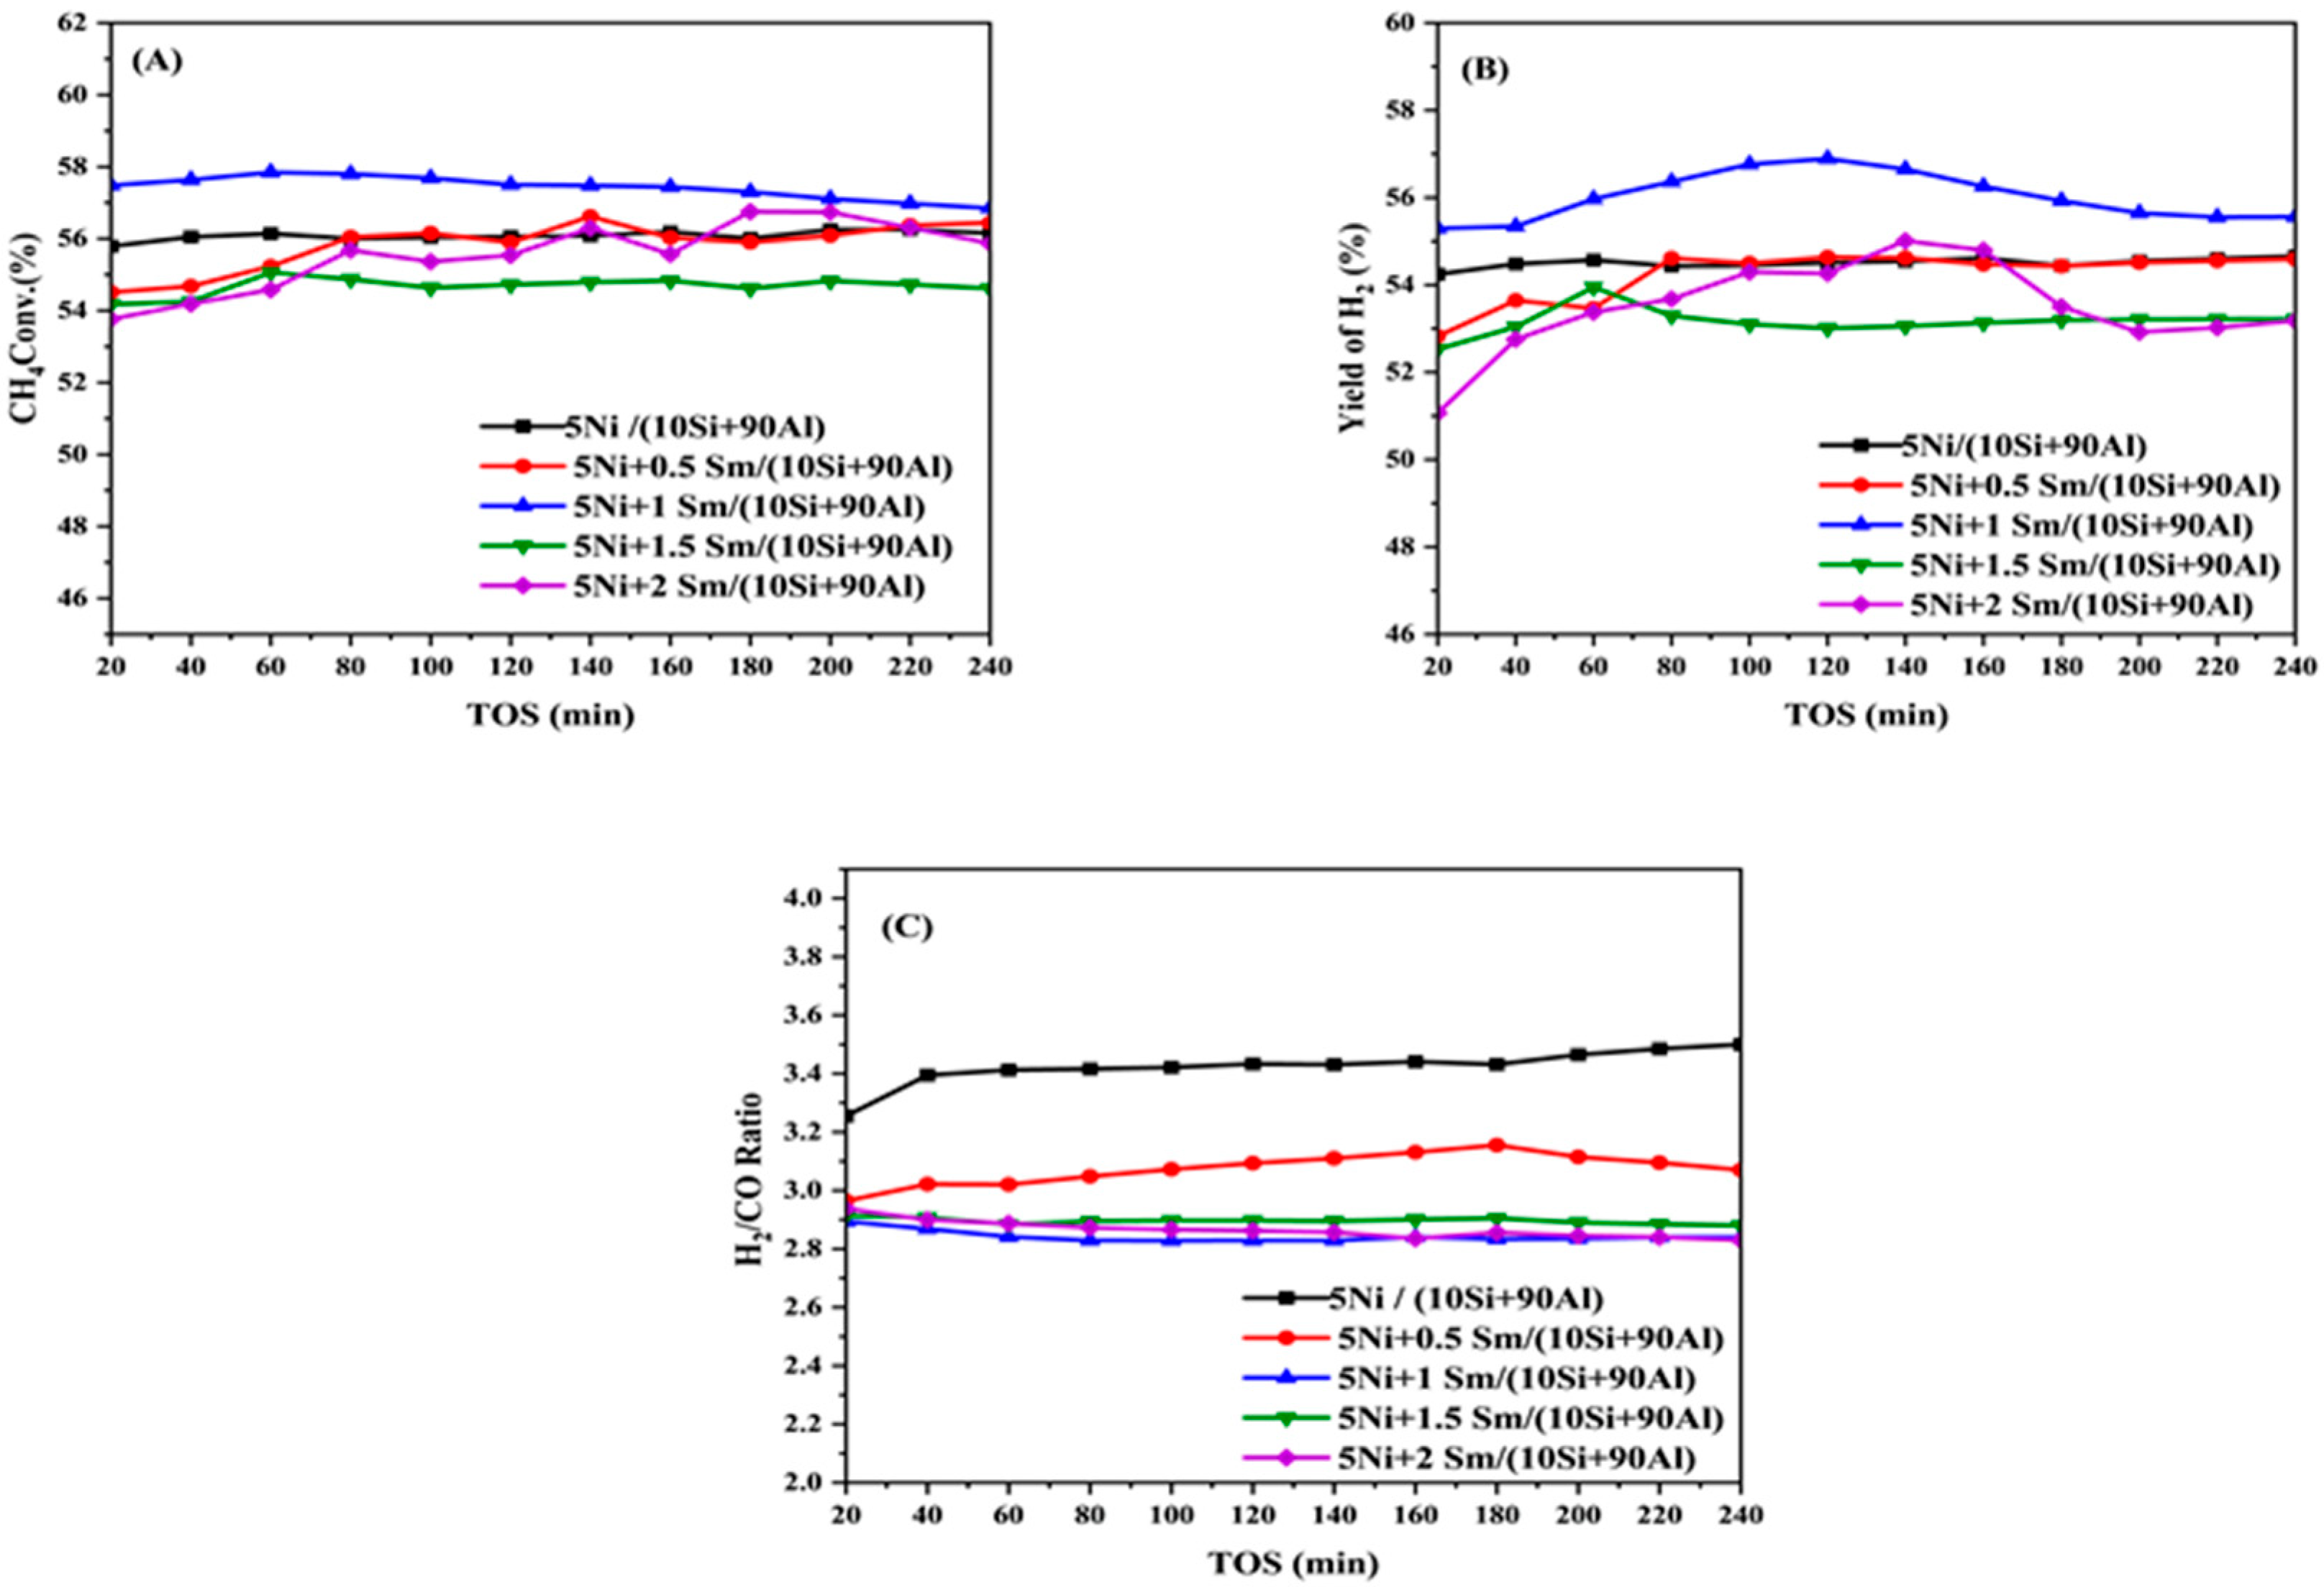
2.5. The Catalytic Activity Evaluation

Figure 5A displays the methane conversion performance of 5Ni/(10Si+90Al) catalysts modified with varying samarium (Sm) concentrations over a 240 min time on stream (TOS). The catalytic reaction was conducted at 600 °C under identical conditions to evaluate stability and activity. The unaltered catalyst’s initial CH4 conversion was comparatively high (~56%), but it remained mostly constant over time. Following the addition of Sm, various trends emerged. Throughout the reaction, the catalyst containing 1wt% Sm demonstrated the highest and most stable CH4 conversion (~57%), suggesting less carbon deposition and better active site stability. On the other hand, the catalyst containing 1.5 wt.% Sm performed marginally worse (about 54%). It continuously stayed below the others, presumably because of less effective Ni dispersion at that loading or surface blocking brought on by Sm. During the whole time on stream (TOS), the catalysts with 0.5 and 2 wt.% Sm performed similarly, attaining moderate conversion rates of roughly 55 to 56%. The hydrogen yield over time during the catalytic performance test of different Ni+xSm/(10Si+90Al) (x = 0, 0.5, 1, 1.5, 2) catalysts calcined at 500 °C is shown in Figure 5B. During the 240 min test period, the catalyst with 5Ni + 1Sm/(10Si + 90Al) shows the highest and most consistent hydrogen yield among all samples, indicating optimal catalytic performance and good resistance to deactivation. Favorable metal–support interactions and improved nickel dispersion at this Sm content are probably the causes of this improvement. Reduced hydrogen yields are seen in samples with either a lower concentration of Sm (0.5%) or a higher concentration (1.5–2%). This finding suggests that too much Sm could make active sites more difficult to reach or negatively alter the catalyst’s surface chemistry. The hypothesis that an optimal concentration of Sm can stimulate the formation of H2 is supported by the 5Ni/(10Si+90Al) catalyst’s moderate performance.
The evolution of the H2/CO molar ratio for the 5Ni+xSm/(10Si+90Al) catalysts heated to 500 °C is shown in Figure 5C (x = 0, 0.5, 1, 1.5, 2). When assessing the effectiveness and selectivity of catalysts for reforming reactions, the CO ratio is a crucial metric. Strong hydrogen production and CO suppression are demonstrated by the unpromoted catalyst (5Ni/10Si+90Al), which exhibits the highest and most stable H2/CO ratio, ranging from 3.3 to 3.8. The CO ratio generally decreases when Sm is added, indicating that Sm modifies the reaction pathways and influences the catalyst’s redox behavior. Outperforming higher Sm loadings, the sample containing 0.5 weight percent Sm has the highest H2/CO ratio (~3.0) among the Sm-modified catalysts. This implies that a low Sm content could either more efficiently suppress the formation of carbon monoxide or slightly improve the water–gas shift reaction. However, catalysts with higher Sm contents (1.5 and 2%) exhibit nearly constant and lower H2/CO ratios (~2.5). This could be because of an over-stabilization of oxygen vacancies or a decrease in active Ni sites, which can impede CO conversion. The long-term stream of the best catalyst is donated (Figure S3) in the Supplementary Materials.

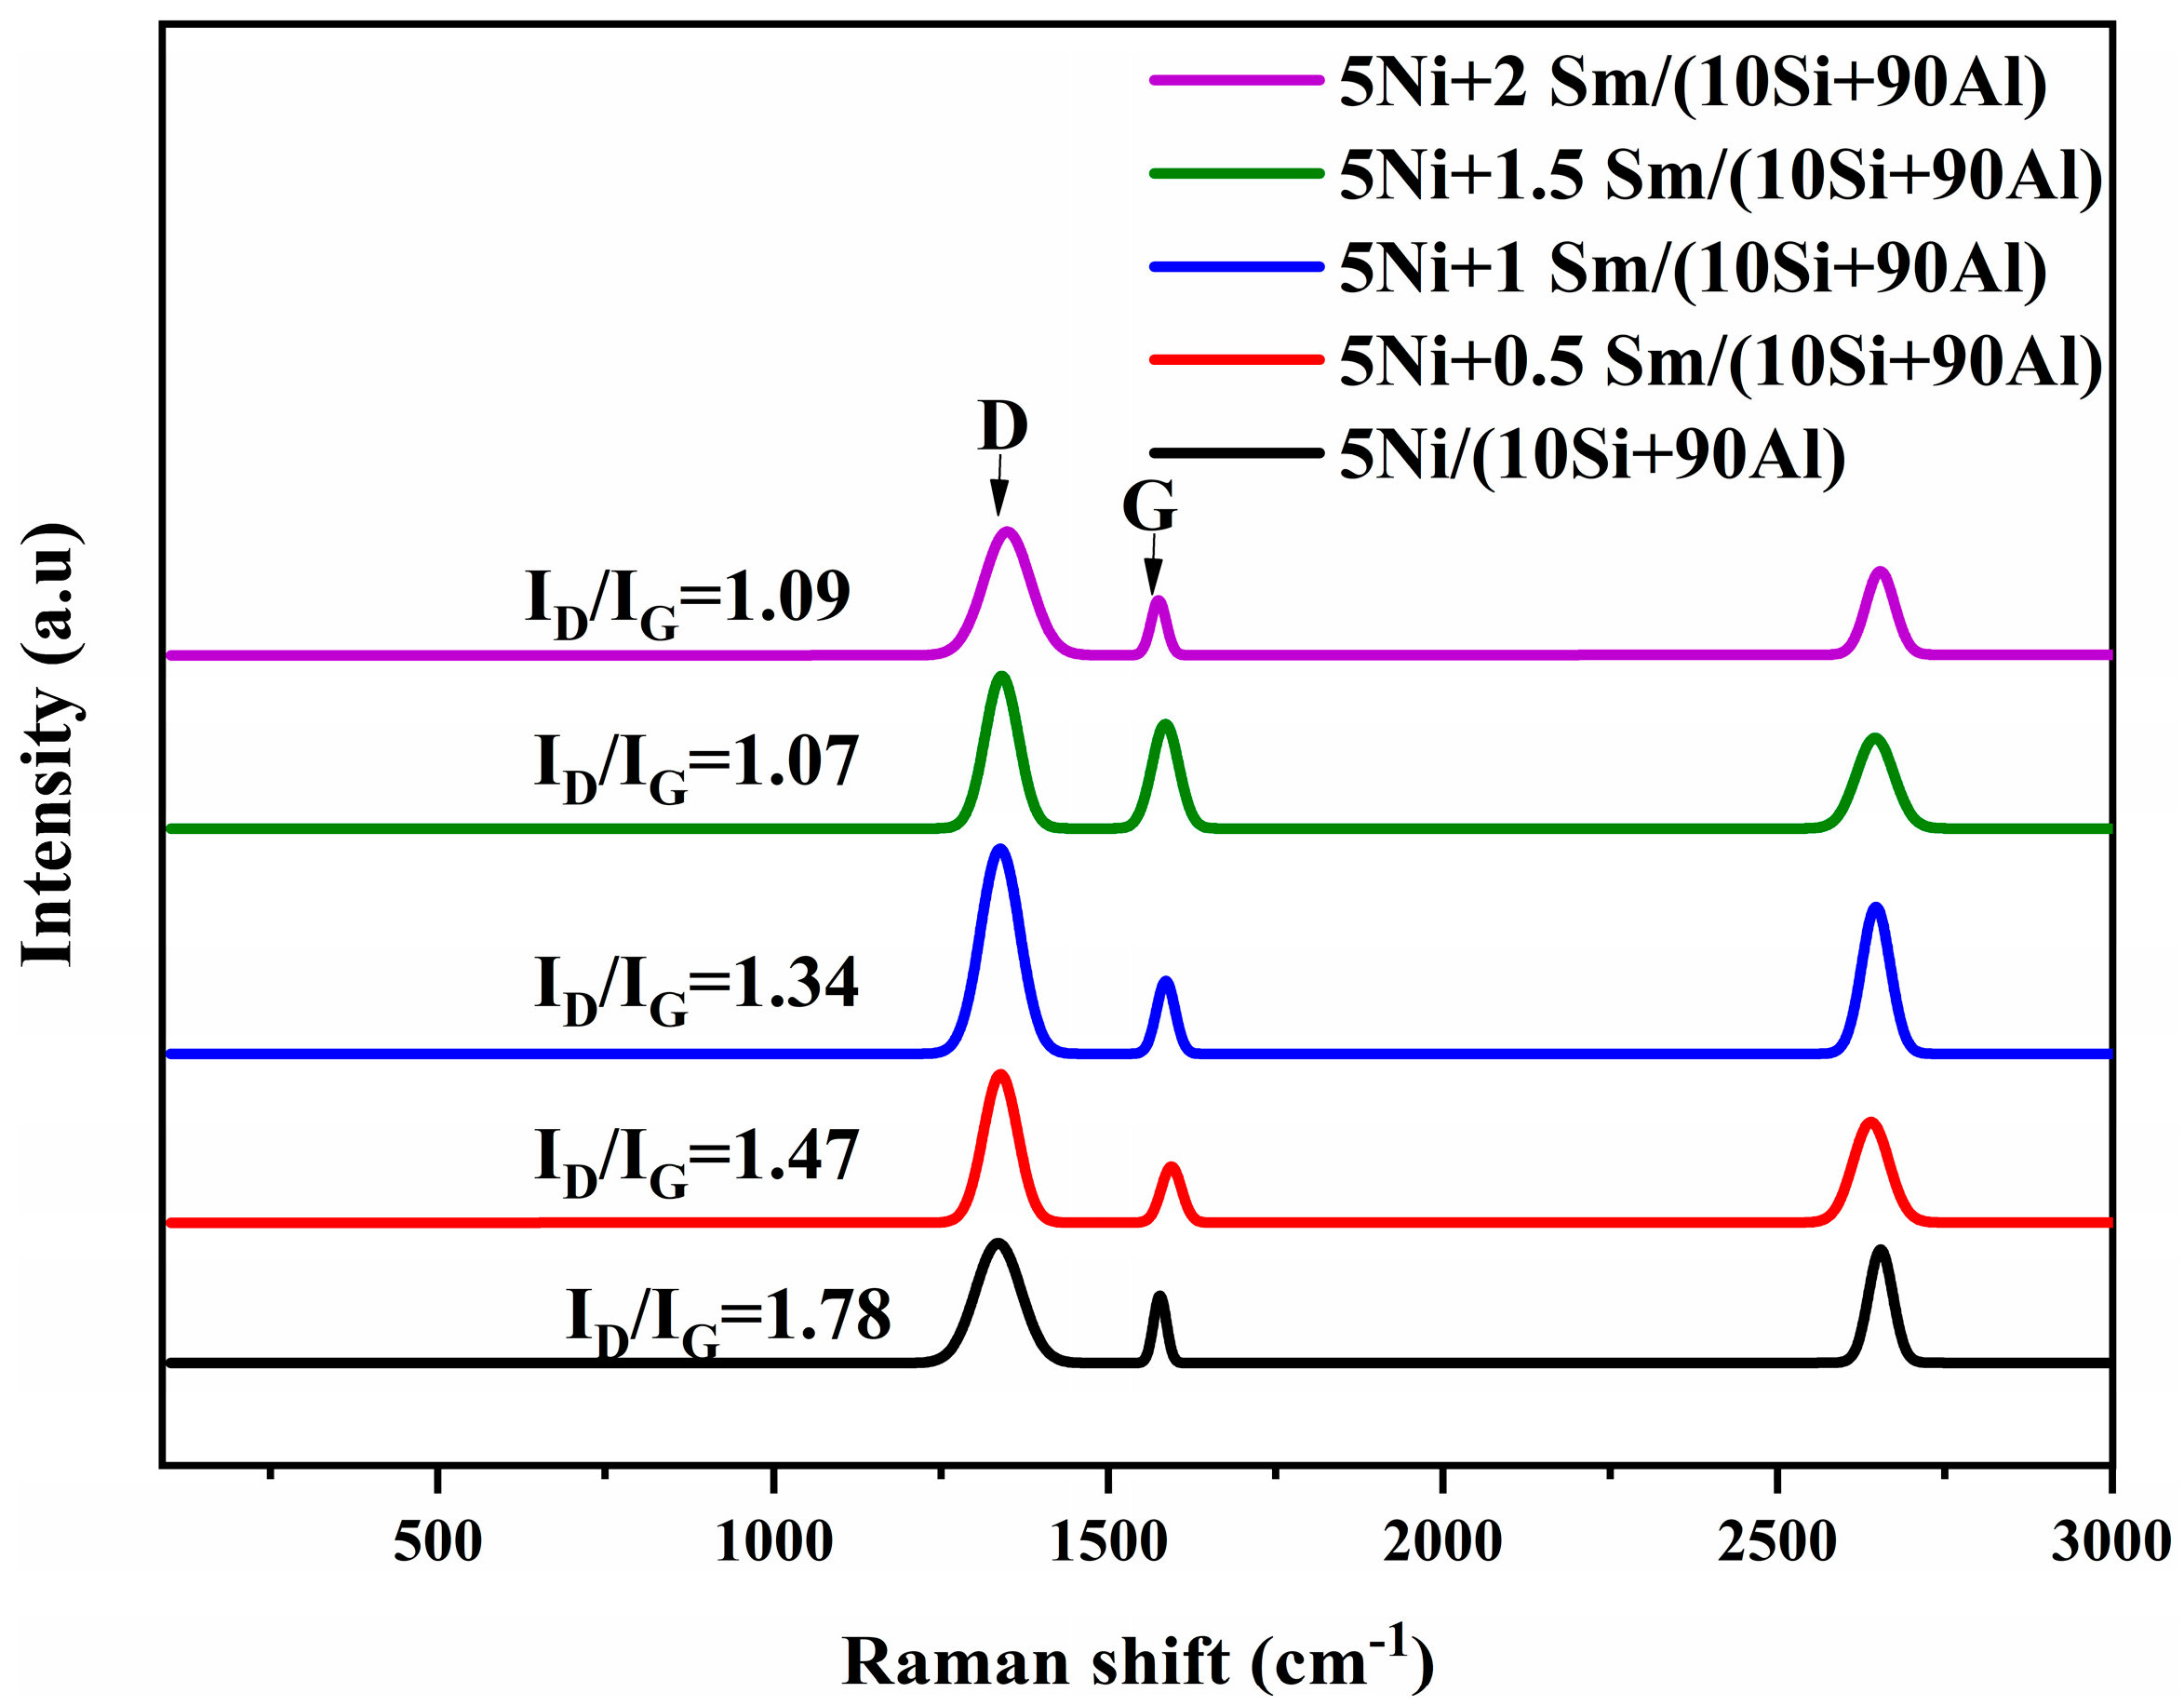
2.6. Spectra of Used Catalysts in Raman

The Raman spectra of the 5Ni+xSm/(10Si+90Al) (x = 0, 0.5, 1, 1.5, 2) catalysts that underwent 500 °C calcination is displayed in Figure 6. Two distinct peaks that are indicative of disordered (D) and graphitic (G) carbon structures, respectively, are visible in all spectra (three bands) at roughly 1350 (D band) and 1580 (G band). The G band is associated with the E2g vibrational mode of ordered sp2-bonded carbon atoms found in graphitic materials, whereas the D band is derived from the breathing modes of sp2 carbon atoms in rings, which are generally linked to defects or disordered structures. These bands indicate the persistence of certain carbonaceous species that may have been derived from organic precursors, even after the reaction at 600 °C. Additionally, we could use the intensity ratio of the D to G bands (ID/IG) to assess the level of disorder in carbon species. The figure quantitatively illustrates how the ID/IG ratio slightly decreases as Sm loading increases up to 1.5 wt.%. This pattern points to the creation of more ordered carbon structures and a decrease in disorder. Together, these findings demonstrate that samarium modification affects the metal–support interaction and contributes to the regulation of surface carbon’s composition and structure.

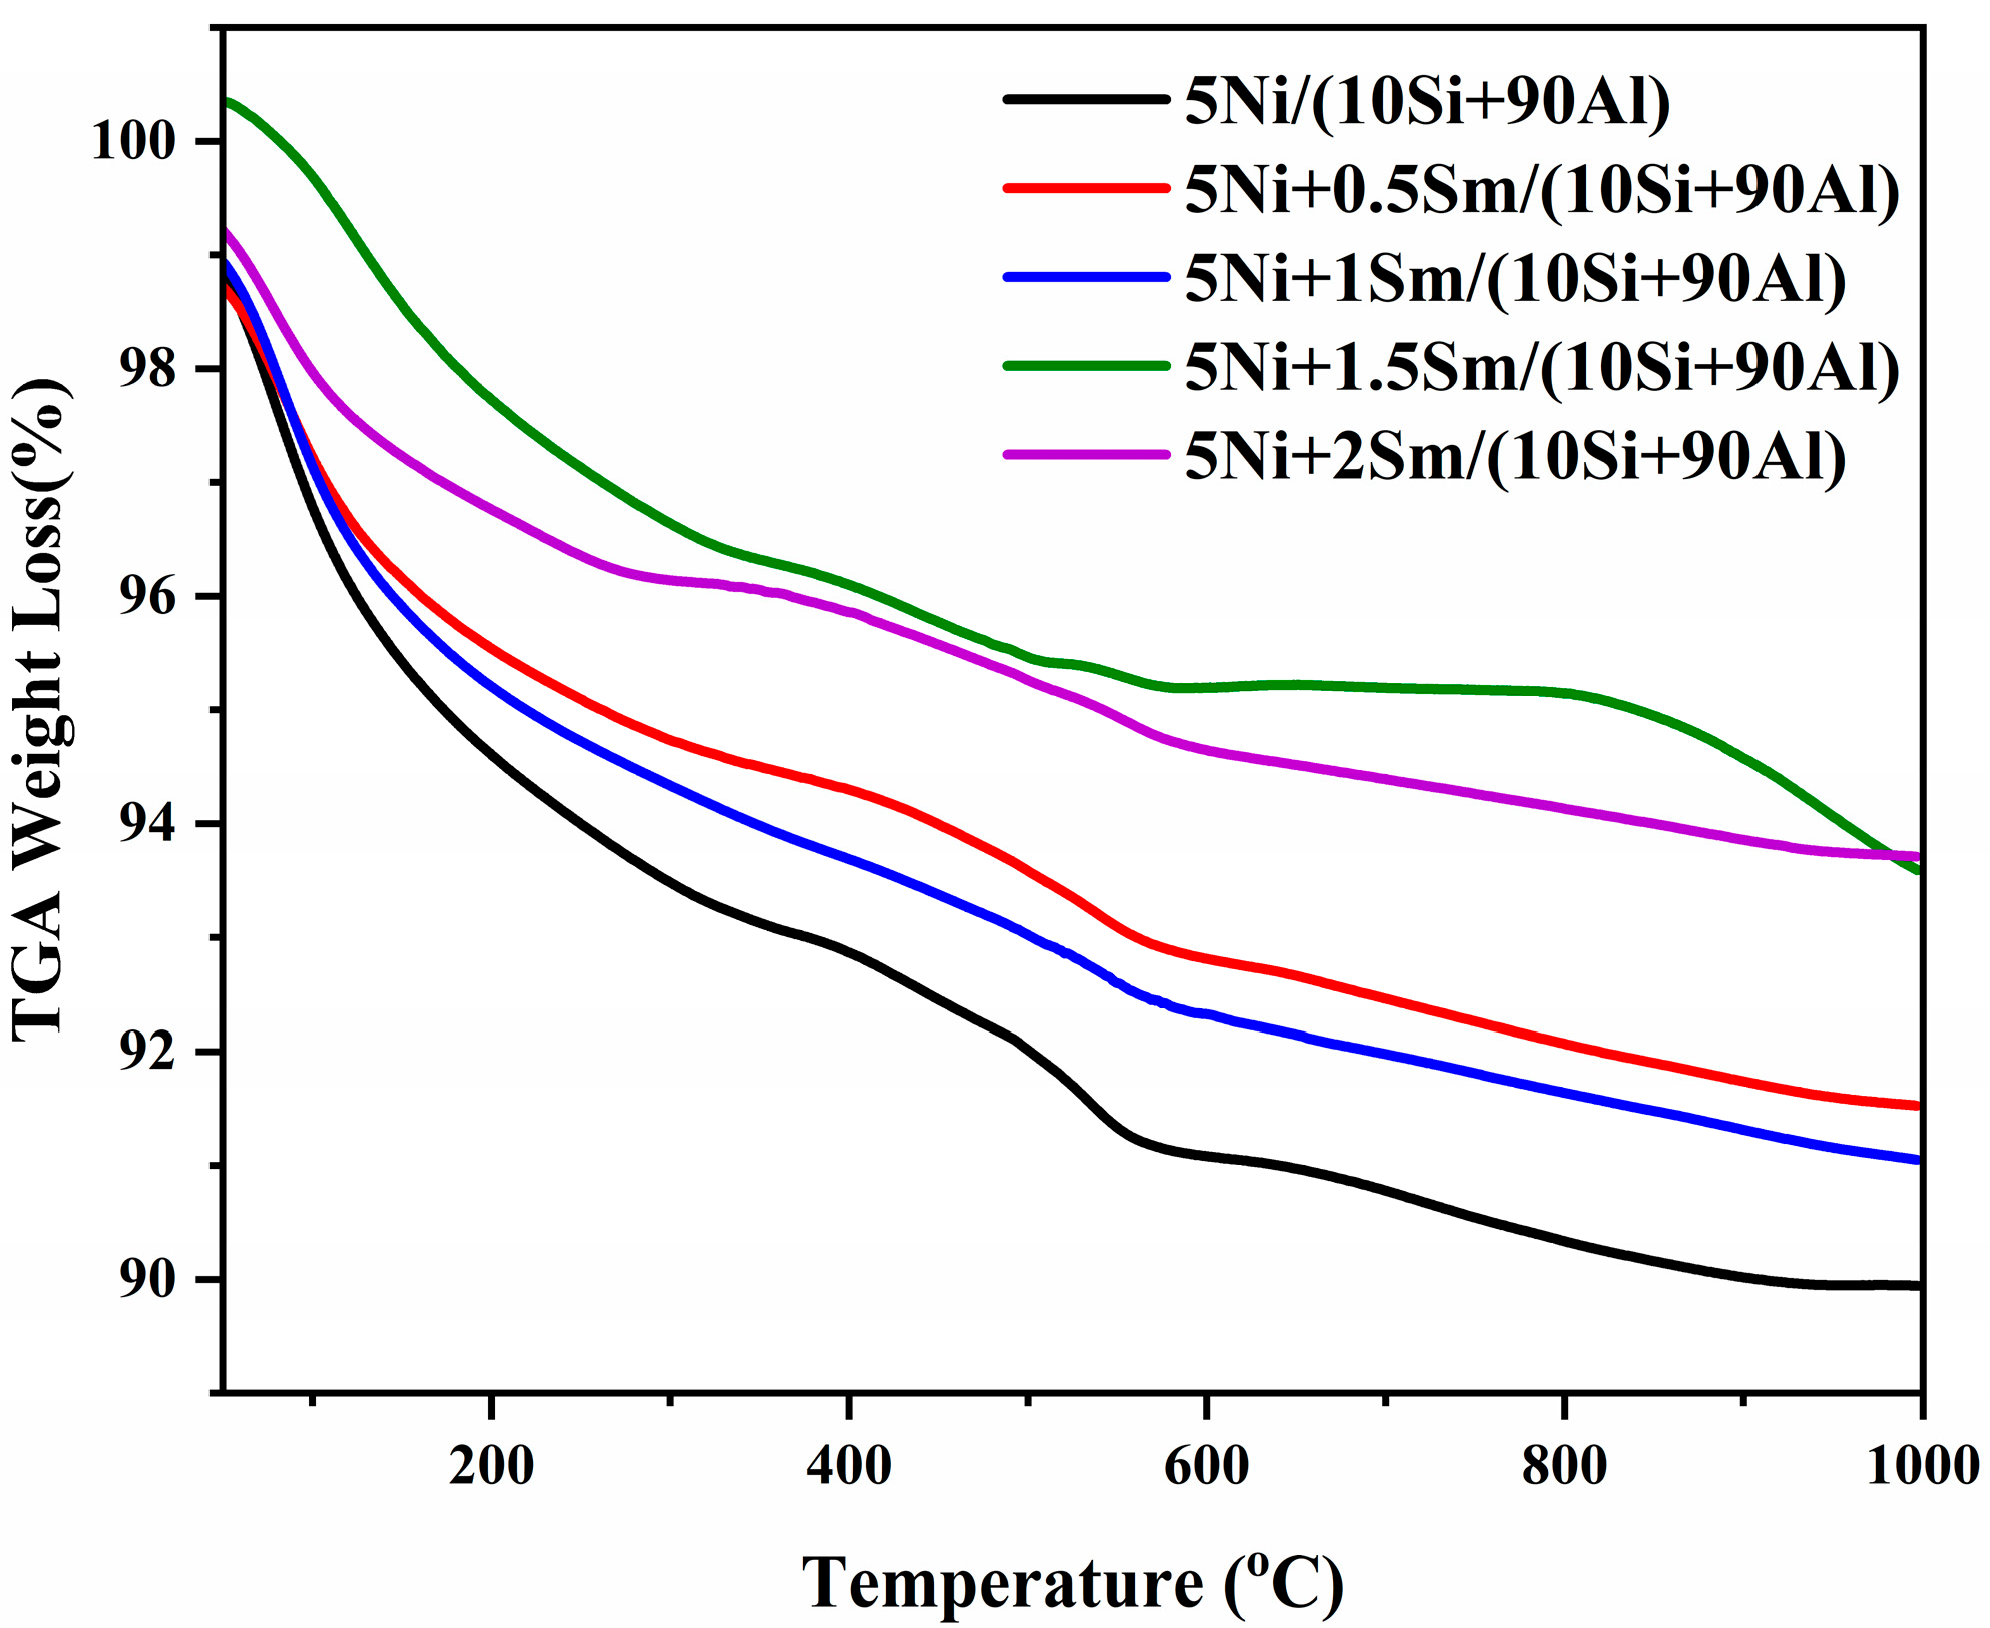
2.7. Thermogravimetric Analysis (TGA)

The TGA curves of 5Ni+xSm/(10Si+90Al) catalysts (x = 0.5, 1.0, 1.5, 2.0) are shown in Figure 7, which illustrates the weight loss percentage as a purpose of temperature up to 1000 °C. The removal of physically adsorbed water, the dehydration of hydroxyl groups, and the breakdown of nitrate or organic residues left over from the synthesis process are the main causes of the noticeable weight loss that all samples experience in the temperature range between room temperature and 500 °C. Each sample loses weight differently, but the Sm-promoted catalysts typically lose less weight than the unpromoted 5Ni/(10Si+90Al) catalysts, indicating that Sm might contribute to the material’s stability. Interestingly, compared to the others, the 1.5–2 wt.% Sm catalyst exhibits somewhat less weight loss. The weight loss rate dramatically decreases above 500 °C, indicating that the material has become dehydrated and that the majority of the volatile components have been removed.

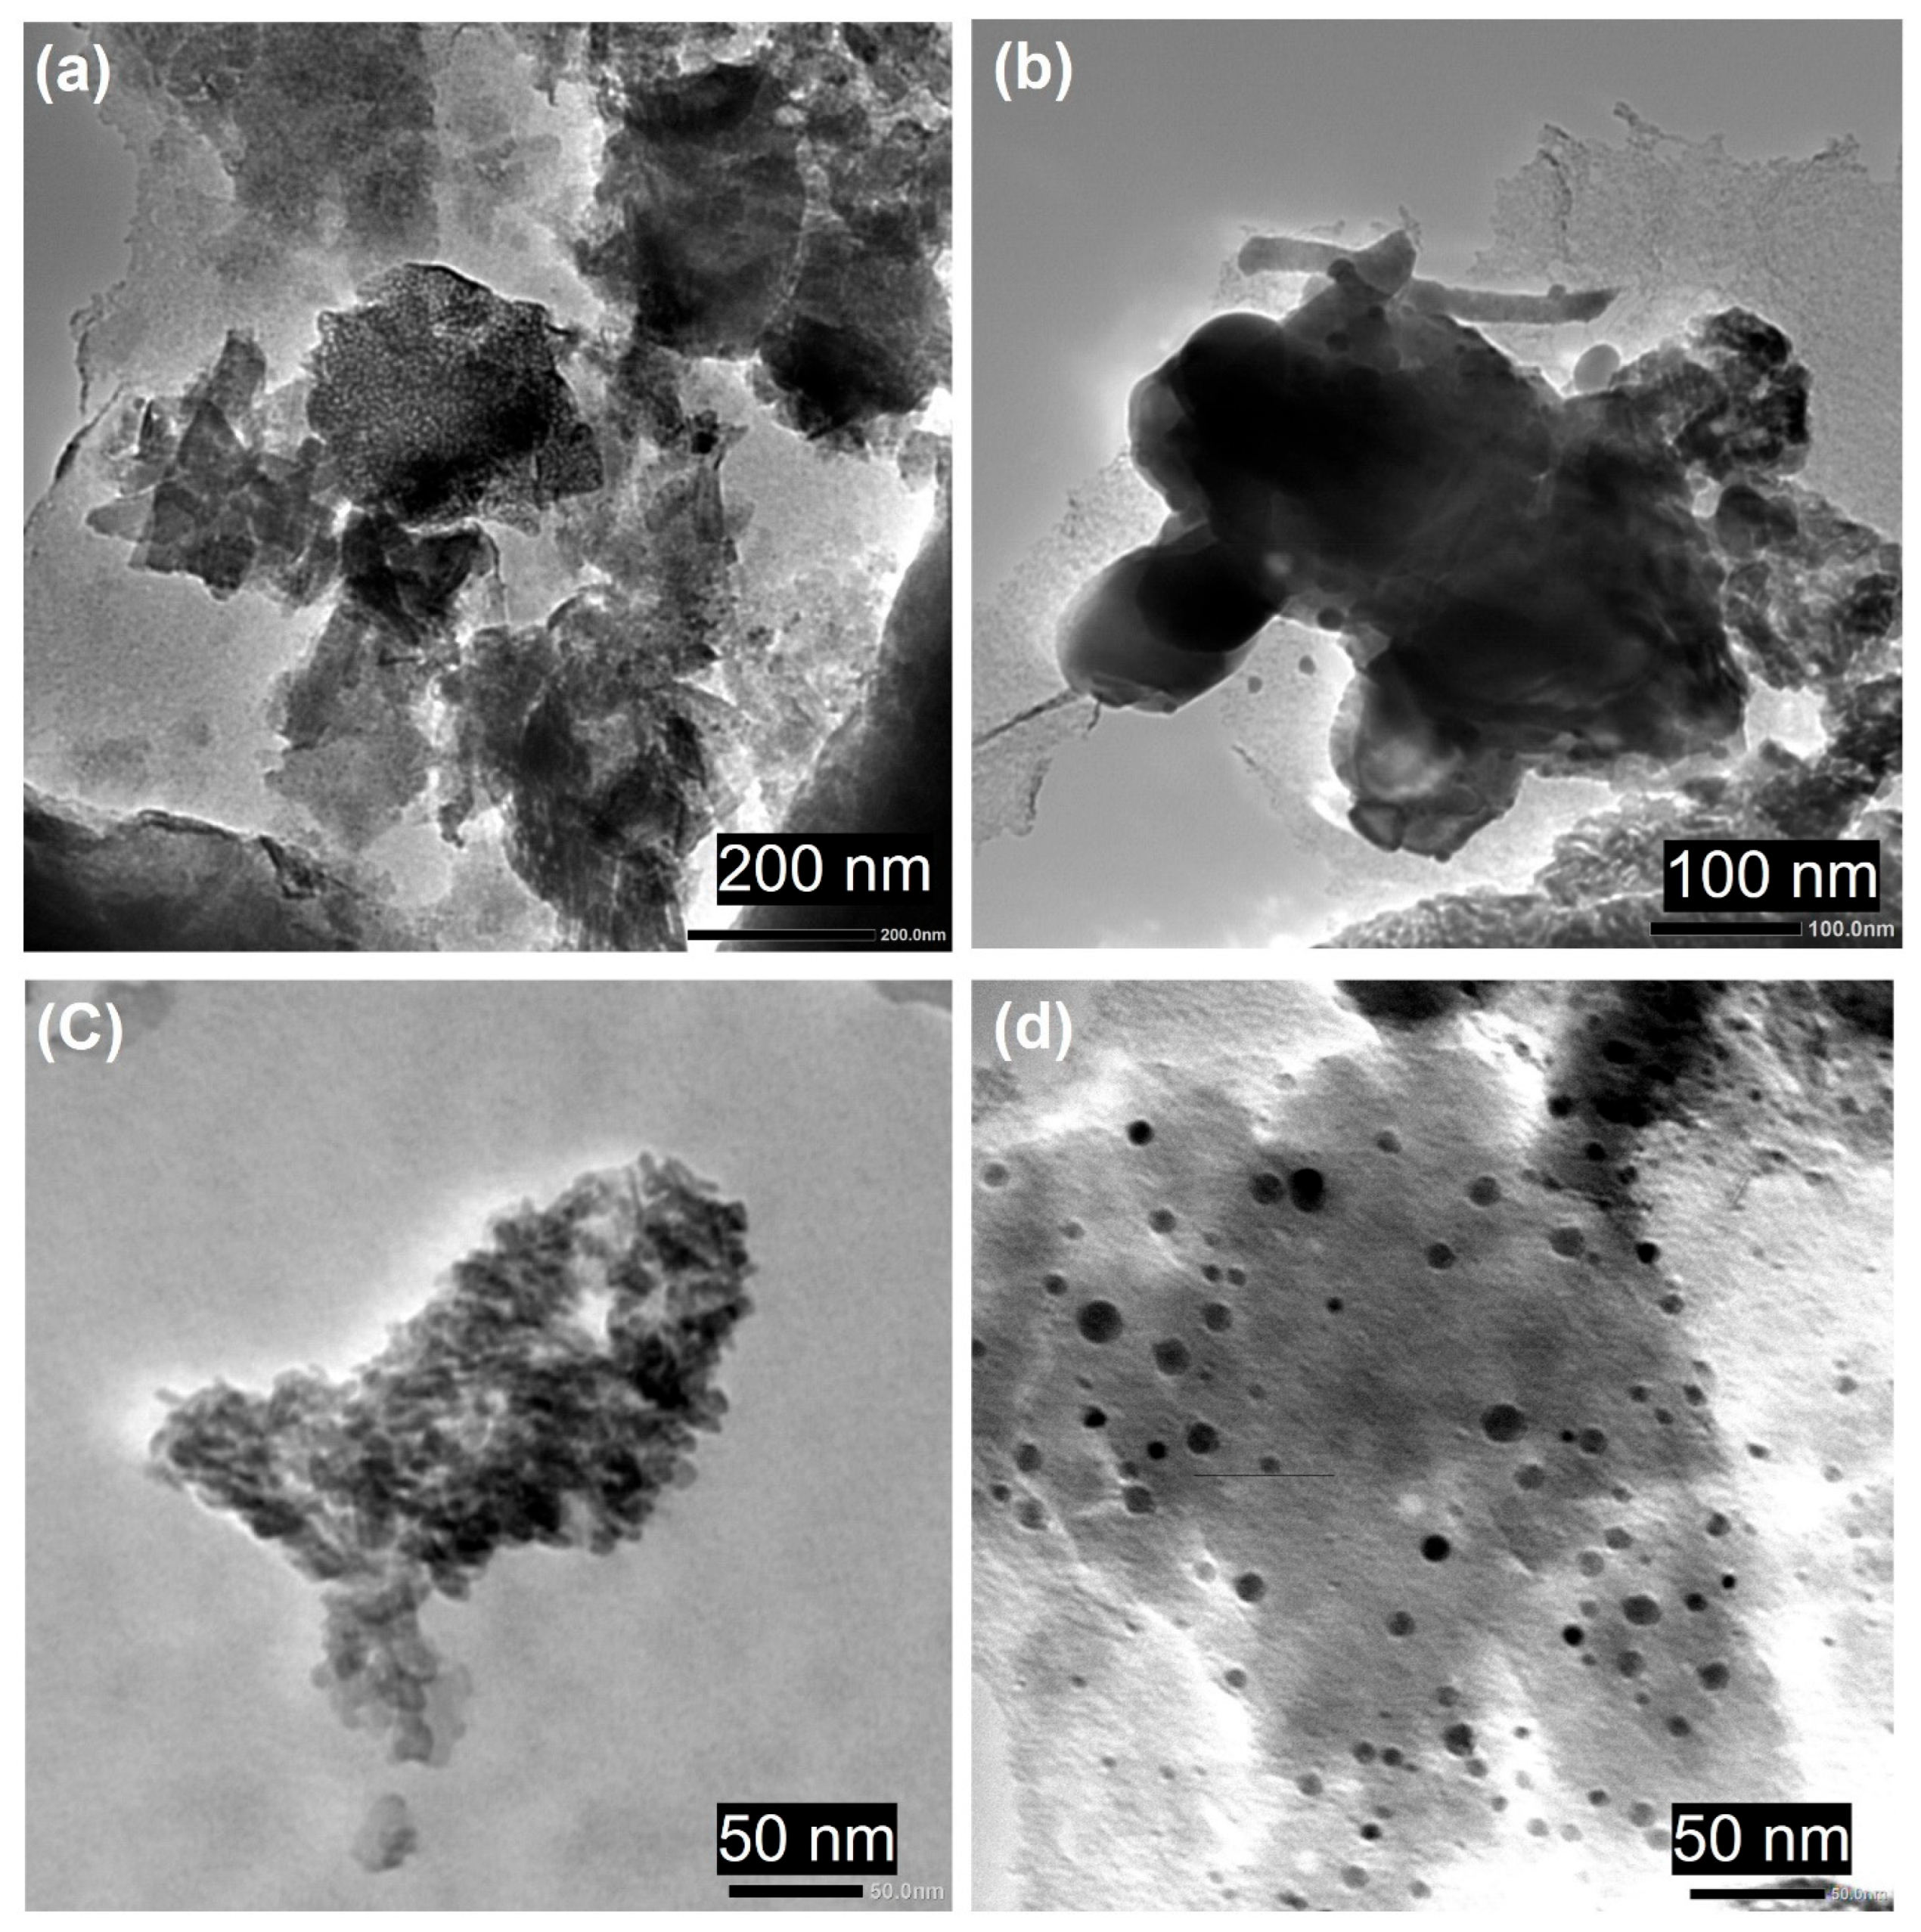
2.8. Analysis of TEM Morphology

The TEM images of the best catalyst, 5Ni+1Sm/(10Si+90Al), are displayed in Figure 8a,b. On the silica–alumina support, the Ni and Sm nanoparticles are evenly distributed. The picture indicates that the active metal components are distributed fairly evenly across the support, which is frequently advantageous for catalytic activity. The used 5Ni+1Sm/(10Si+90Al) catalyst TEM image is displayed in Figure 8b. Comparing the active components to the fresh catalyst, we see a noticeable change in appearance. The image shows a big, asymmetrical aggregate rather than evenly distributed nanoparticles. This implies that during the reaction process, the Ni and Sm species underwent significant agglomeration or sintering. A much larger, less homogeneous structure has formed from the smaller, distinct nanoparticles that were present in the fresh catalyst. One of the main causes of catalyst deactivation is the decrease in the active metals’ surface area brought on by this agglomeration. Because there are fewer active sites available for the reaction to occur, there may be gradual decreases in the stream’s methane conversion and hydrogen output. Furthermore, although the aggregated metallic phase partially encapsulates some of the support material, the image does not demonstrate uniform coke deposition across the support. The TEM of the fresh, unpromoted catalyst 5Ni/(10Si+90Al) is shown in Figure 8c. The picture implies that the nanoparticles are distributed fairly evenly. These are probably the scattered Ni particles on the support. In terms of size and shape, the Ni nanoparticles seem to be small and fairly consistent. The TEM of the used unpromoted catalyst 5Ni/(10Si+90Al) is displayed in Figure 8d. It exhibits a notable particle agglomeration, creating larger, asymmetrical shapes.

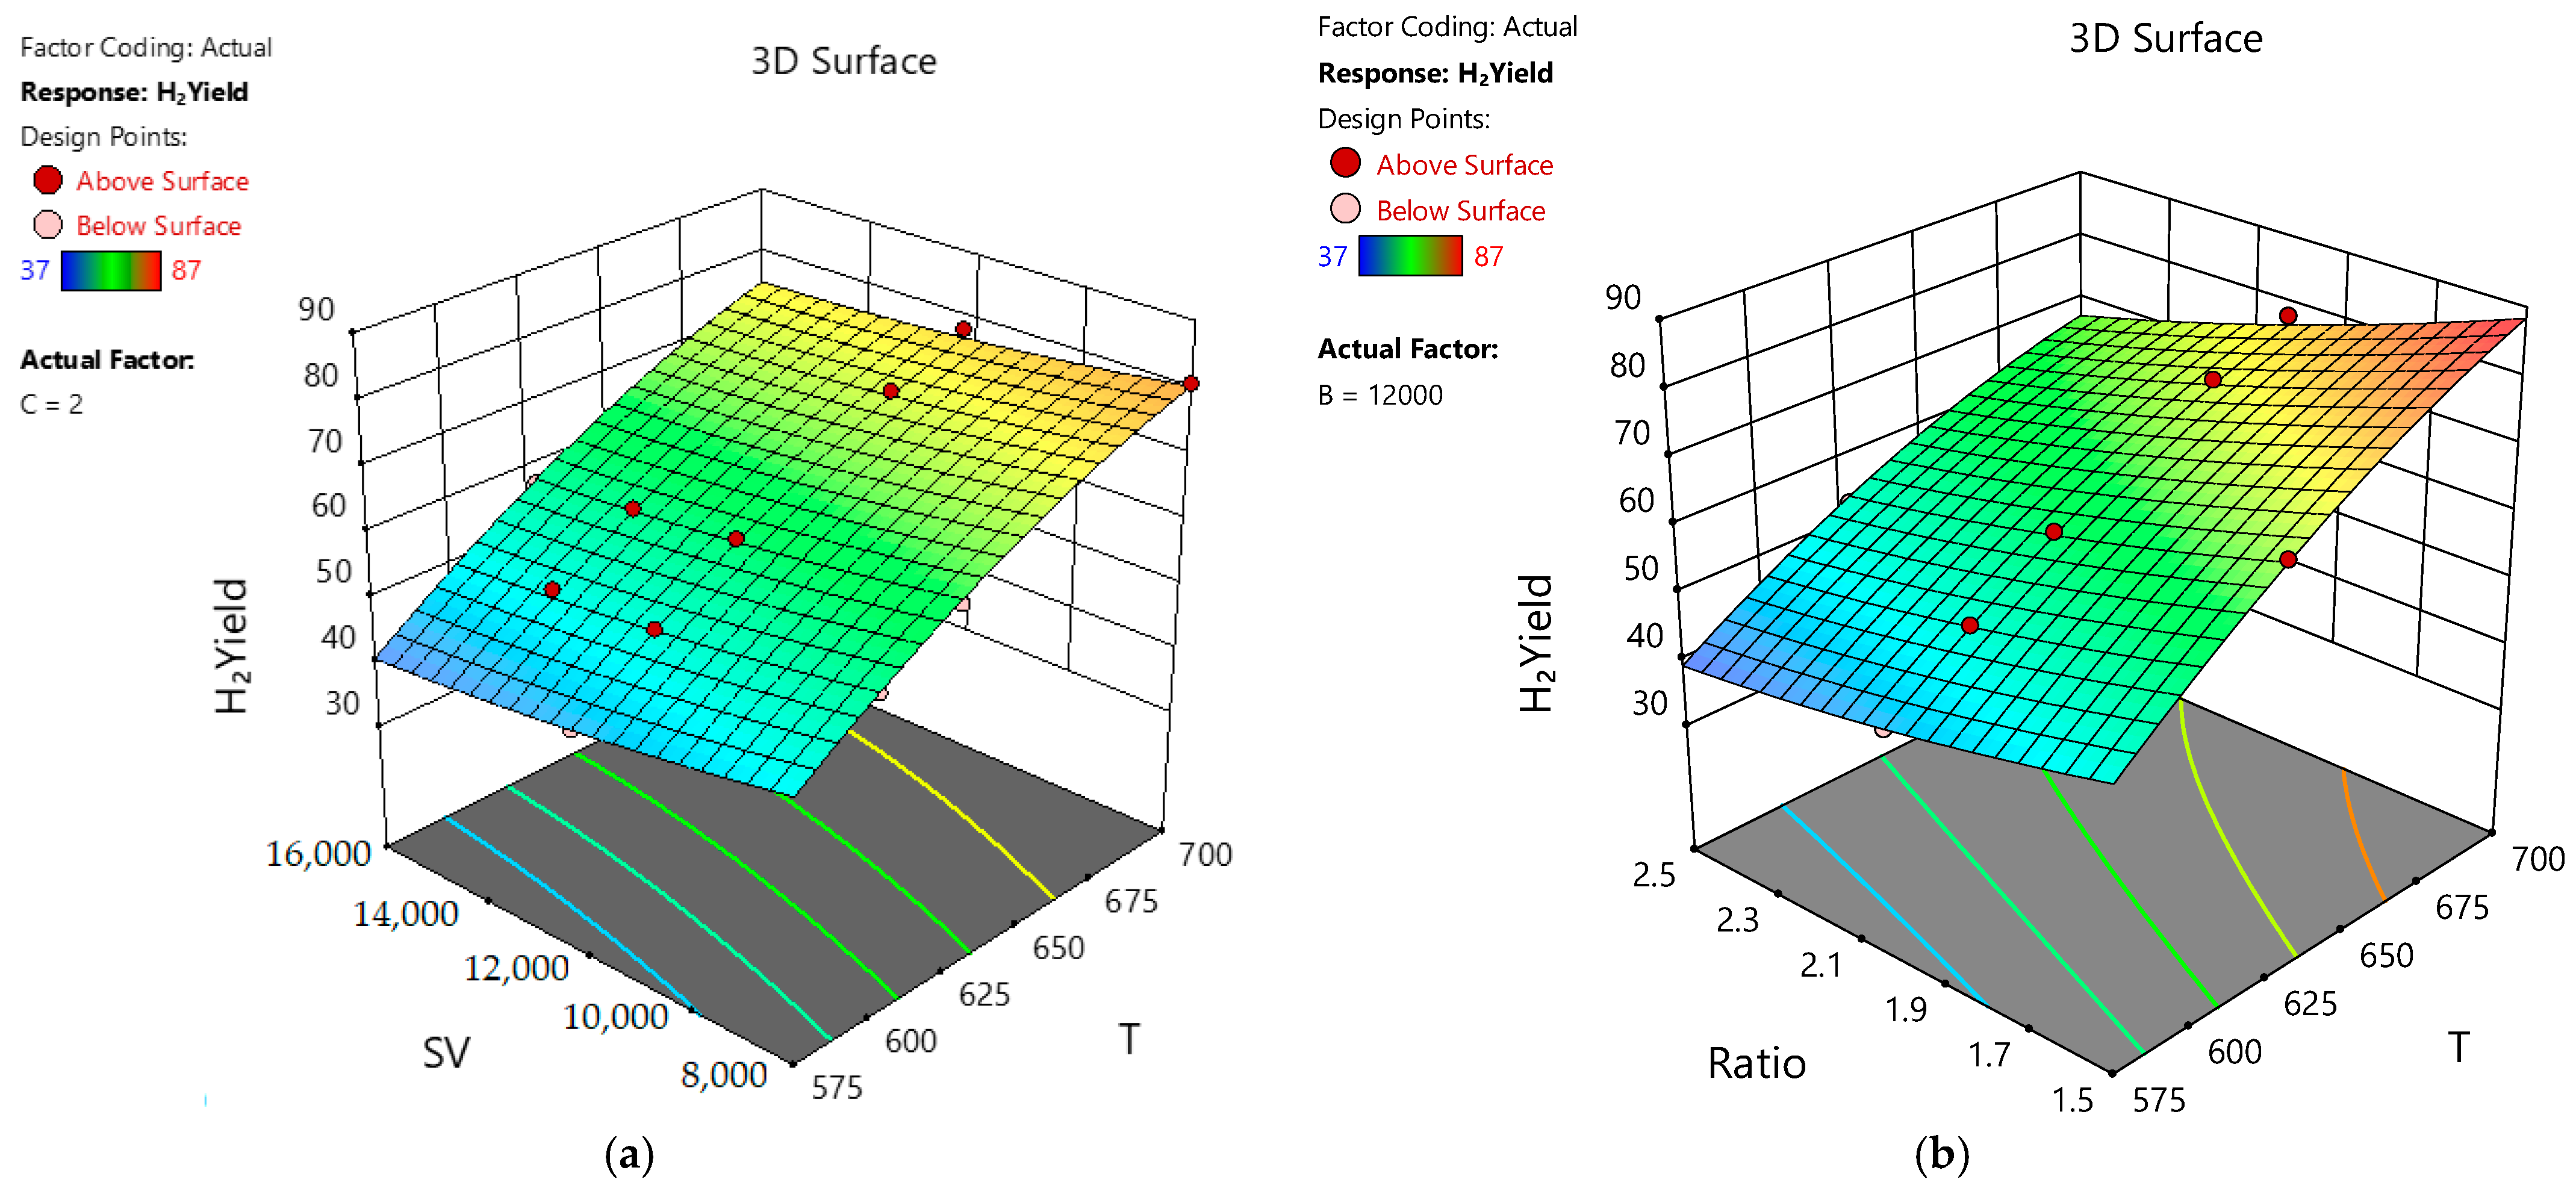
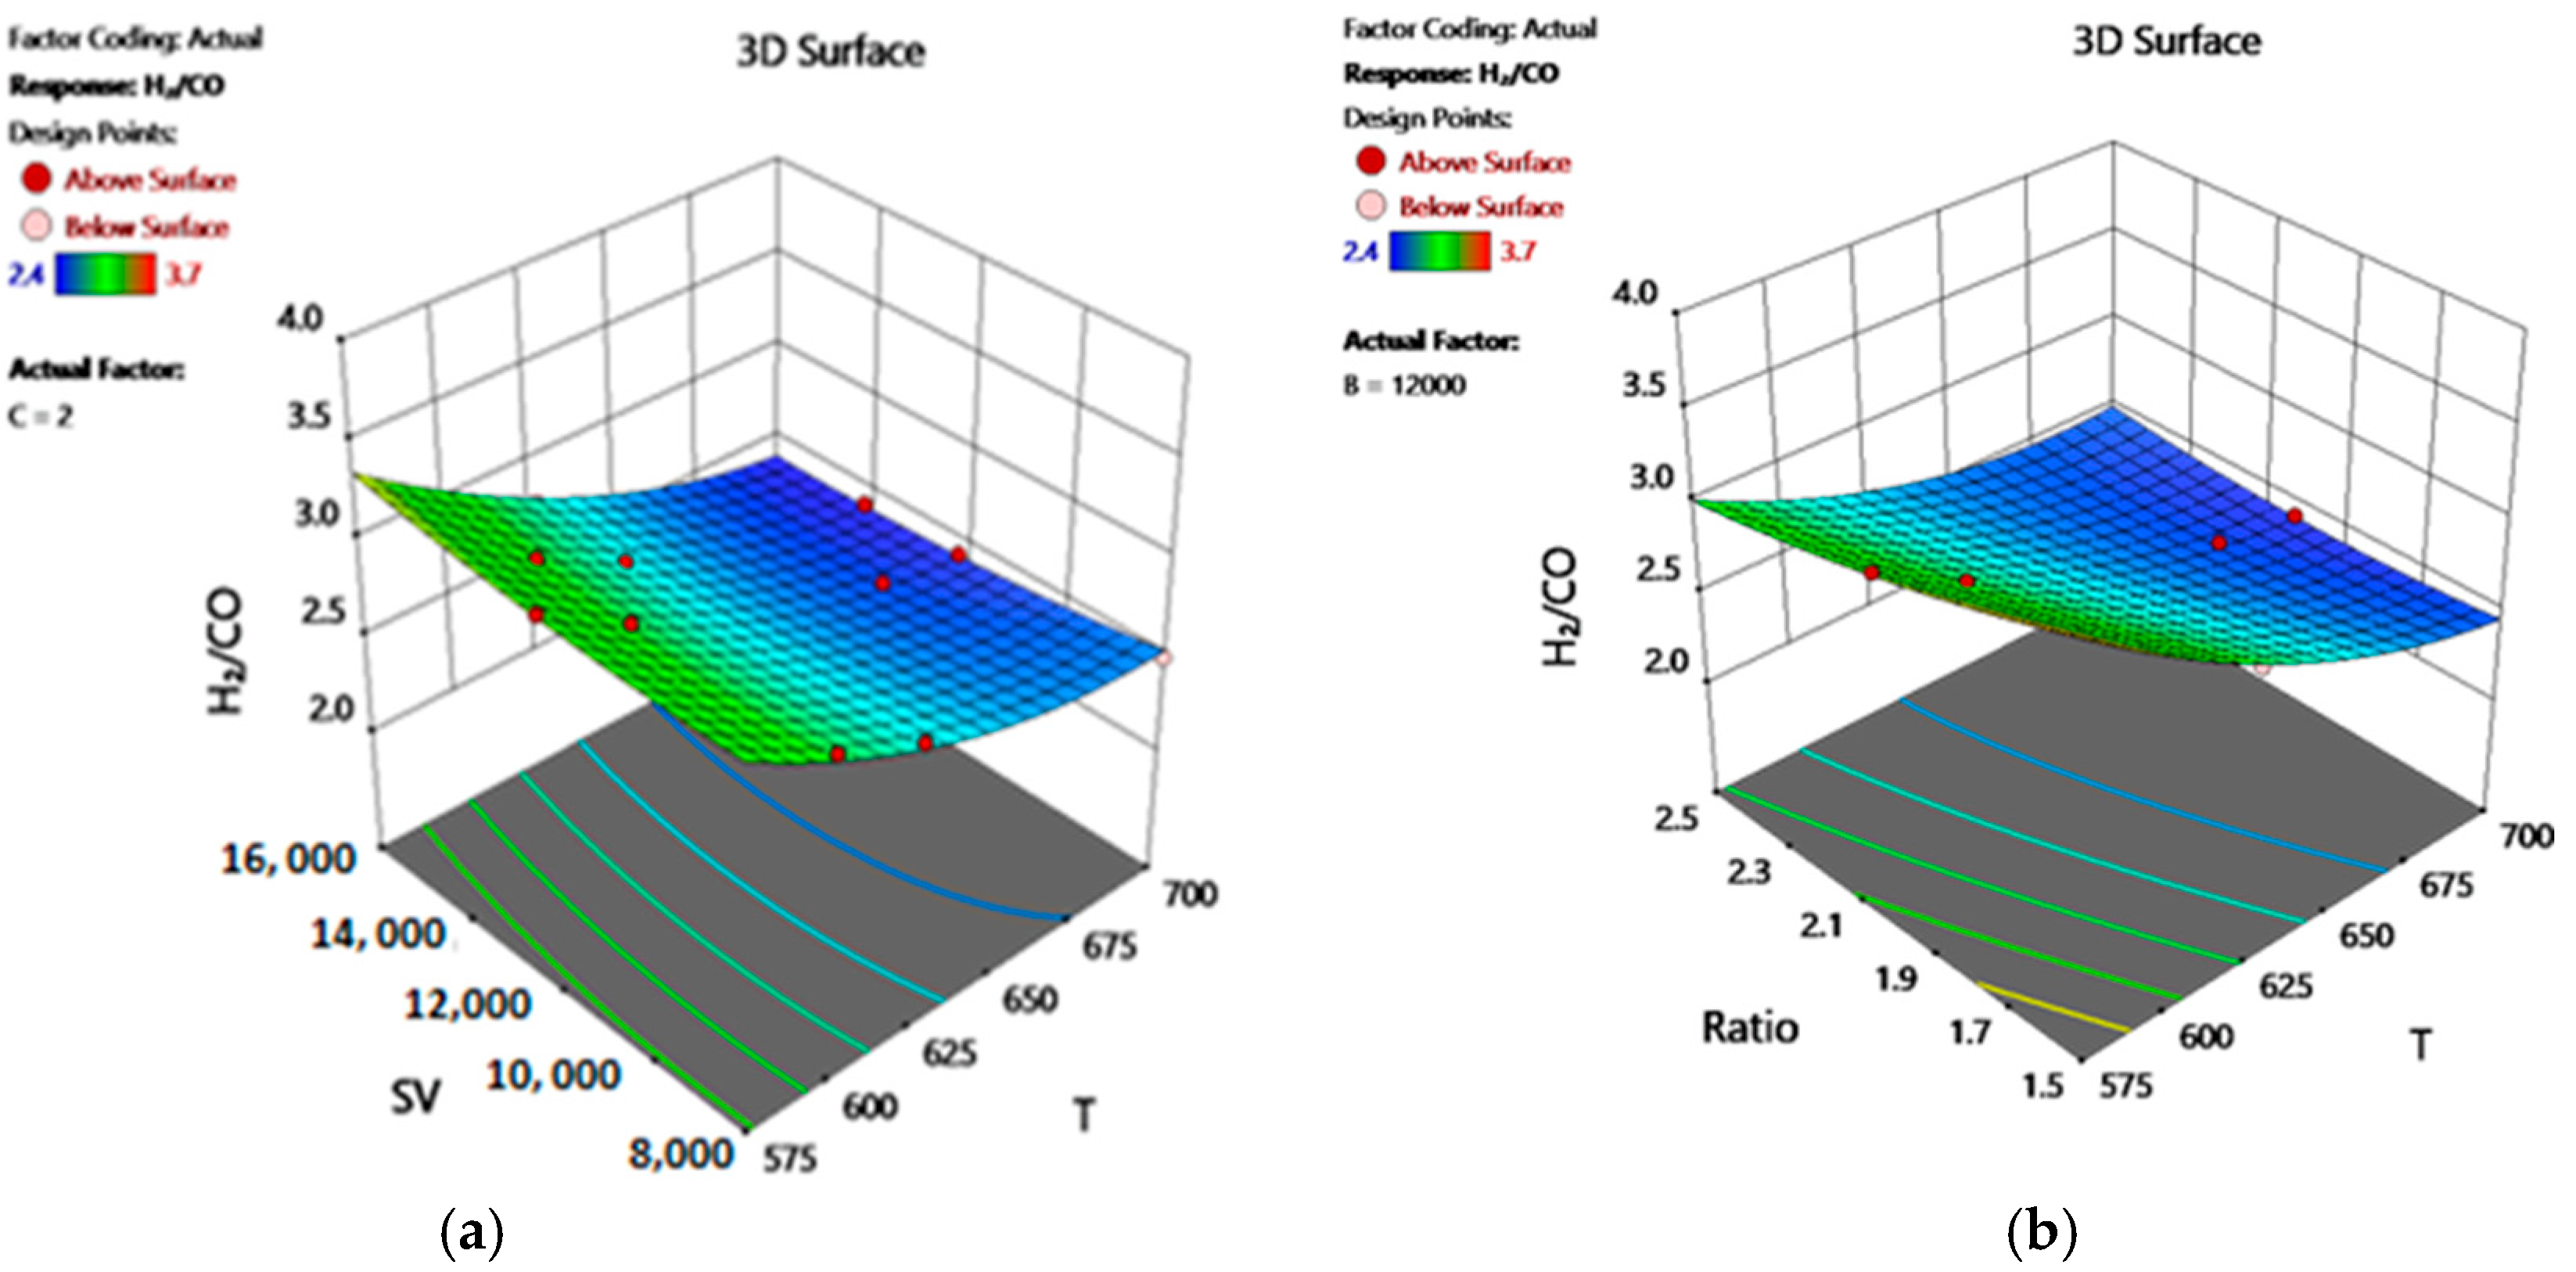
2.9. Modeling and Simulation

2.9.1. Response Surface Methodology Approach (RSM)

The factors were converted into standardized, dimensionless variables with a range of −1 to +1 using the Central Composite Design (CCD) methodology. Space velocity, temperature, and the CH4/O2 mole ratio—all of which fall within a particular range—are the experimental variables that are investigated in this work. The midpoint of each range represents the central value of each factor, and the deviation from this midpoint quantifies the variation limits. This transformation guarantees consistency in response surface evaluation and statistical modeling. A crucial reference for identifying curvature in the response surface is the central point, which is determined by the average values of all the components. This approach enables a more precise understanding of the relationships between the response variable and the experimental factors. Because it is simpler to understand and effectively illustrates the significant nonlinear relationships and interactions between factors, we opted for a quadratic model in this study rather than a more complex one. Despite being more adaptable, higher-order models would require more experimental data to ensure dependability and might introduce unnecessary complexity, thereby increasing the risk of overfitting without significantly improving predictive accuracy.
Y ^ = β 0 + i = 1 3 β i X i + i = 1 3 β i i X i 2 + i = 1 2 j = i + 1 3 β i j X i X j + ε  
The input factors that are represented by either coded or actual values determine the estimated response variable. The regression model is a second-order polynomial equation with multiple effect types: quadratic terms, which capture the curvature or nonlinear effects; interaction terms, which account for the combined effect of two variables acting simultaneously and represent the residual variability not explained by the model; and the intercept, which describes the main effect of each factor [16]. ANOVA is used to assess the accuracy of the model [17]. The actual and coded values of the factors under study are shown in Table 3.

2.9.2. Process Modelling and Analysis of Variance

The response variance was stabilized, its distribution was normalized, and model data fitting was improved. The Central Composite Design (CCD) approach was used to determine the proper power transformation for normalizing or equalizing variance in the response data [17]. ANOVA and the prediction statistics in Table S1 were used to assess the model’s fitness. At the 95% confidence level, significant models for every term in the polynomial equation are indicated by high F-values and low p-values. The experimental results’ good fit to the models is confirmed by high R2 values. As indicated in Table S2, the accuracy of the model was further confirmed by contrasting expected responses with experimental findings. Figure S4, which displays a strong correlation between actual and predicted values for CH4 conversion, H2 yield, and H2/CO ratio [18,19,20,21], further supports the reliability of the model.

2.9.3. Final Formula About Real Factors

Using the Stat-Ease package and an ANOVA with a significance level of α = 0.05,
We examine the experimental data and suggest the following models:
C H 4 ^   C o n v e r s i o n % =   474.79228 +   1.60382 × T   0.004401 × S V 3.25767   C H 4 O 2 +   0.00000315968 × T × S V 0.063832 × T C H 4 O 2 + 6.29509 × S V   C H 4 O 2 0.000985 × T 2 + 0.0000000453206 × S V 2 3.87838 × C H 4 O 2 2
H 2 ^   Y i e l d   % = 449.55163 + 1.51256 × T 0.005357 × S V + 3.33896 * C H 4 O 2   0.00000395193 × T × S V 0.065862 × T × C H 4 O 2 + 0.00018 × S V × C H 4 O 2   0.000917 × T 2 + 0.0000000656615 × S V 2 + 4.91811 × C H 4 O 2 2
H 2 C O ^   r a t i o = 31.50178 0.07265 × T + 0.000123 × S V 4.08687 × C H 4 O 2 0.000000271923 × T × S V + 0.004682 × T × C H 4 O 2 0.0000098532 × S V × C H 4 O 2 0.000047 × T 2 + 0.00000000294434 × S V 2 + 0.240595 × C H 4 O 2 2
Intercept terms (β0’s), which display the response variable’s expected value when all factors are zero, are one component of Models (5)–(7). Main effects show how much the response variable changes when one unit of a factor is increased while the other factors remain the same; interaction terms show how two factors together affect the response variable; and quadratic terms consider complex relationships between the factors and the response variable.
The first fitted model explains about 99.41% of the variation in CH4 conversion, the second model explains about 99.47% of the variation in H2 yield, and the third model explains about 99.22% of the variation in the H2/CO ratio, based on Table S1 and the coefficient of determination values. Factors outside the purview of this experiment are responsible for the remaining variations in the response variable in each case.

2.9.4. Simulation Using Design-Expert Software

Three-dimensional response surface plots of the effects of temperature, SV, and CH4/O2 ratio on CCH4 conversion are shown in Figure 9. Keeping CH4/O2 constant at 2, Figure 9a displays the relationship between CCH4 conversion and temperature along with the gas hourly space velocity (SV). The response surface shows that when SV falls and temperature rises, CCH4 conversion rises. While gas hourly space velocity (SV) remains constant at 12,000 ccg−1h−1, Figure 9b demonstrates that CCH4 conversion is greatly enhanced by rising temperatures and falling O2 ratios. Temperature has the biggest impact on CH4 conversion variation, improving it from 39.72% at 575 °C to 89.21% at 700 °C in both situations.
Figure 10 shows how temperature, GHSV, and the CH4/O2 ratio affect the amount of H2 produced using three-dimensional response surface plots. The H2 yield in Figure 10a rises from 37% at 575 °C to 87% at 700 °C while keeping the CH4/O2 ratio at 2 by raising the temperature and lowering the SV. Similarly, as the temperature rises and the CH4/O2 ratio falls, Figure 10b shows that the H2 yield also rises while keeping the SV constant at 12,000 cc g−1 h−1. Finally, Figure 11 displays 3D response surface plots that highlight the significant effects of temperature, GHSV, and CH4/O2 ratio on H2/CO. In Figure 11a, where CH4/O2 is fixed at 2 and temperature and gas hourly space velocity (GHSV) decrease, H2/CO increases from 2.4 at 700 °C to a maximum of 3.72 at 575 °C. As illustrated in Figure 11b, at SV = 12,000 cc g−1 h−1, decreasing both temperature and CH4/O2 leads to a higher H2/CO, following the same range of increase.
All these relations are also presented in a 2D representation in Figures S5–S7. Northerly, all factor is used in their original units.

2.9.5. Optimization Performance

Finding the ideal set of circumstances that effectively accomplishes the desired goal is the goal of this section. Using the Stat-Ease package, which integrated the optimization targets and produced several solutions satisfying the predetermined criteria, the optimization process entailed optimizing the response variable (H2 yield). The solution with the highest desirability value was used to determine the ideal conditions. Table 4 displays the process parameters, such as temperature, GHSV, and CH4/O2 ratios. Additionally, the theoretical conditions were put into practice experimentally, and the results of the experiments and the theoretical predictions showed a high degree of agreement.

3. Materials and Methods

3.1. Materials

Nickel nitrate hexahydrate N i ( N O 3 ) . 6 H 2 O , 98% was purchased from Alfa Aesar (Haverhill, MA, USA). Samarium nitrate hexahydrate S m ( N O 3 ) 3 . 6 H 2 O , 99.9% was provided by Winlab (UK) and used as the promoter precursor in the catalyst formulation. Alumina ( A l 2 O 3 , 97.7%) was obtained from BDH (Leicestershire, UK) provided silicon dioxide (SiO2, 99.5%), whereas Norton Chemical Process Products Corp. (Tallmadge, OH, USA) supplied the silicon dioxide. High-purity chemicals were used as received without further purification.

3.2. Preparation of Promoted Catalysts

Using the incipient wetness impregnation technique, we created several samarium-promoted catalysts. To attain a 5 wt.% loading of Ni, an appropriate amount of N i ( N O 3 ) . 6 H 2 O was first dissolved in 30 milliliters of distilled water. Then, a 95% support, which constitutes 10% SiO2 and 90% Al2O3, was added to the solution. The mixture was heated to 85 °C, while being continuously stirred. To obtain different Sm loadings (0.5, 1.0, 1.5, and 2.0 wt.%), varying amounts of S m ( N O 3 ) 3 . 6 H 2 O were then added. After an overnight drying process at 120 °C, the resultant mixture was calcined for 5 h at 500 °C. Depending on the Sm content, we assigned the catalysts the designation 5Ni+xSm/(10Si+90Al), where x = 0.5, 1.0, 1.5, or 2.0.

4. Conclusions

The results of this investigation demonstrate that the structure, reducibility, and catalytic performance of Ni-based catalysts supported on a Si–Al mixed oxide system for methane partial oxidation at 600 °C are significantly impacted by the addition of samarium (Sm) as an aid. The high surface area of the unpromoted catalyst (5Ni/(10Si+90Al)) is advantageous for catalytic reactions. But while maintaining the catalyst’s mesoporous structure, adding a moderate amount of Sm, specifically, 1 wt.% improved its performance significantly. Catalytic performance tests at 600 °C showed that the 5Ni+1Sm/(10Si+90Al) catalyst produced the highest and most stable methane conversion (57.845%) and hydrogen yield over time (56.89%). Better metal dispersion, a stronger metal–support interaction, and less coke formation are the reasons for this improvement. As the Sm content rose, the BET surface area and pore volume slightly decreased, most likely as a result of the Sm species covering or partially blocking the pores. The mesoporous structure was maintained despite these textural alterations, guaranteeing the active sites’ favorable diffusion and accessibility. The reduction of NiO to metallic Ni, which is necessary for catalytic activity, was made easier by Sm promotion, according to H2-TPR analysis, especially at lower Sm contents (0.5–1 wt.%). While higher loadings resulted in increased crystallinity and potential sintering, moderate Sm loadings helped maintain small NiO crystallites, indicating excellent dispersion, according to XRD results. Structural and surface changes were explained by FTIR and Raman spectroscopy, which also showed enhanced resistance to carbon deposition and stronger interactions between Sm and the support matrix. By demonstrating reduced weight loss and thermal breakdown in those with Sm, TGA further demonstrated that Sm contributes to the stability of the catalysts. But too much Sm (1.5–2 weight percent) damaged the catalyst’s performance by covering too many active Ni sites or changing the surface chemistry, which reduced the efficiency of the reactions. Additionally, the catalyst without Sm had the highest H2/CO ratio, but as more Sm was added, it decreased, indicating changes in the catalyst’s reaction and the composition of the syngas.
The results of this investigation demonstrate that the structure, reducibility, and catalytic performance of Ni-based catalysts supported on a Si–Al mixed oxide system for methane partial oxidation at 600 °C are significantly impacted by the addition of samarium (Sm) as an aid. The high surface area of the unpromoted catalyst (5Ni/(10Si+90Al)) is advantageous for catalytic reactions. But while maintaining the catalyst’s mesoporous structure, adding a moderate amount of Sm, specifically, 1 wt.%, improved its performance significantly. The 5Ni+1Sm/(10Si+90Al) catalyst generated the best and most stable methane conversion (57.85%) and hydrogen yield over time (56.89%), according to catalytic performance tests conducted at 600 °C. Better metal dispersion, a stronger metal–support interaction, and less coke formation are the reasons for this improvement. As the Sm content rose, the BET surface area and pore volume slightly decreased, most likely as a result of the Sm species covering or partially blocking the pores. The mesoporous structure was maintained despite these textural alterations, guaranteeing the active sites’ favorable diffusion and accessibility. The reduction of NiO to metallic Ni, which is necessary for catalytic activity, was made easier by Sm promotion, according to H2-TPR analysis, especially at lower Sm contents (0.5–1 wt.%). While higher loadings resulted in increased crystallinity and potential sintering, moderate Sm loadings helped maintain small NiO crystallites, indicating excellent dispersion, according to XRD results. Structural and surface changes were explained by FTIR and Raman spectroscopy, which also showed enhanced resistance to carbon deposition and stronger interactions between Sm and the support matrix. By demonstrating reduced weight loss and thermal breakdown in those with Sm, TGA further demonstrated that Sm contributes to the stability of the catalysts. But too much Sm (1.5–2 wt.%) damaged the catalyst’s performance by covering too many active Ni sites or changing the surface chemistry, which reduced the efficiency of the reactions. Additionally, the catalyst without Sm had the highest H2/CO ratio, but as more Sm was added, it decreased, indicating changes in the catalyst’s reaction and the composition of the syngas. The optimization of the best catalyst 5Ni+1Sm/(10Si+90Al) was successful in determining the best conditions to maximize H2 yield, and the experimental findings (88.39%) and theoretical predictions (87.563%) agreed well. This indicates how well the optimization strategy works to accomplish the desired result.

Supplementary Materials

The following supporting information can be downloaded at: https://www.mdpi.com/article/10.3390/catal15080721/s1, Catalyst characterization S1; Catalyst activity evaluation S2; Models accuracy S3; Table S1: Analysis of variance (ANOVA) for the quadratic models of the three response; Table S2: Experimental (Exp.) and predicted (Pred.) values for various components of the reaction system; Table S3: Comparison of methane oxidation catalyst performance [22,23,24,25,26,27,28,29,30,31,32,33,34,35]; Figure S1 NH3-TPD for 5Ni + xSm/(10Si + 90Al) (x = 0.0,1.0,1.5) catalysts; Figure S2: XPS measurement of samples; Figure S3: Long-time activity measurement; Figure S4: Comparison between the actual and predicted data for the tree responses variables; Figure S5: Two-dimensional relationship between factors (temperature (T), space velocity (SV), and C H 4 / C O 2 ) and CH4 conversion; Figure S6: Two-dimensional relationship between factors (temperature (T), space velocity (SV), and H 2 / C O ) and H2 yield; Figure S7: Two-dimensional relationship between factors (temperature (T), space velocity (SV), and C H 4 / C O 2 ) and H2/CO.

Author Contributions

S.B.A., A.A.I., and A.S.A.-F.; Methodology, data curation, conceptualization, investigation, data curation, writing—review and editing; R.S.A.A., K.M.B., and N.A.: Original draft preparation, formal analysis, resources, investigation; S.R. and F.A.A.A.: Formal analysis, resources, software, validation. O.H.O.: Resources, software. All authors have read and agreed to the published version of the manuscript.

Funding

Ongoing Research Funding program (ORF-2025-779), King Saud University, Riyadh, Saudi Arabia, also Princess Nourah bint Abdulrahman University Researchers Supporting Project number (PNURSP2025R743), Princess Nourah bint Abdulrahman University, Riyadh, Saudi Arabia.

Data Availability Statement

The data used in this study are available in this paper.

Acknowledgments

The authors would like to extend their sincere appreciation to the Ongoing Research Funding program (ORF-2025-779), King Saud University, Riyadh, Saudi Arabia). Also, authors express their gratitude to the Princess Nourah bint Abdulrahman University Researchers Supporting Project number (PNURSP2025R743), Princess Nourah bint Abdulrahman University, Riyadh, Saudi Arabia.

Conflicts of Interest

The authors declare no conflicts of interest.

References

  1. Fakeeha, A.H.; Al-Fatesh, A.S.; Srivastava, V.K.; Ibrahim, A.A.; Abahussain, A.A.M.; Abu-Dahrieh, J.K.; Alotibi, M.F.; Kumar, R. Hydrogen Production from Gadolinium-Promoted Yttrium-Zirconium-Supported Ni Catalysts through Dry Methane Reforming. ACS Omega 2023, 8, 22108–22120. [Google Scholar] [CrossRef] [PubMed]
  2. Kurdi, A.N.; Ibrahim, A.A.; Al-Fatesh, A.S.; Alquraini, A.A.; Abasaeed, A.E.; Fakeeha, A.H. Hydrogen Production from CO2 Reforming of Methane Using Zirconia Supported Nickel Catalyst. RSC Adv. 2022, 12, 10846–10854. [Google Scholar] [CrossRef] [PubMed]
  3. Therdthianwong, S.; Siangchin, C.; Therdthianwong, A. Improvement of Coke Resistance of Ni/Al2O3 Catalyst in CH4/CO2 Reforming by ZrO2 Addition. Fuel Process. Technol. 2008, 89, 160–168. [Google Scholar] [CrossRef]
  4. Teh, L.P.; Setiabudi, H.D.; Timmiati, S.N.; Aziz, M.A.A.; Annuar, N.H.R.; Ruslan, N.N. Recent Progress in Ceria-Based Catalysts for the Dry Reforming of Methane: A Review. Chem. Eng. Sci. 2021, 242, 116606. [Google Scholar] [CrossRef]
  5. Fazlikeshteli, S.; Vendrell, X.; Llorca, J. Low-Temperature Methane Partial Oxidation over Pd Supported on CeO2: Effect of the Preparation Method and Precursors. Reactions 2021, 2, 30–42. [Google Scholar] [CrossRef]
  6. Fazlikeshteli, S.; Vendrell, X.; Llorca, J. Bimetallic Ru–Pd Supported on CeO2 for the Catalytic Partial Oxidation of Methane into Syngas. Fuel 2023, 334, 126799. [Google Scholar] [CrossRef]
  7. Hasanat, A.U.; Khoja, A.H.; Naeem, N.; Al-Anazi, A.; Liaquat, R.; Khan, B.A.; Din, I.U. Thermocatalytic Partial Oxidation of Methane to Syngas (H2, CO) Production Using Ni/La2O3 Modified Biomass Fly Ash Supported Catalyst. Results Eng. 2023, 19, 101333. [Google Scholar] [CrossRef]
  8. Dissanayake, D.; Rosynek, M.P.; Kharas, K.C.C.; Lunsford, J.H. Partial Oxidation of Methane to Carbon Monoxide and Hydrogen over a Ni/Al2O3 Catalyst. J. Catal. 1991, 132, 117–127. [Google Scholar] [CrossRef]
  9. Hickman, D.A.; Schmidt, L.D. The Role of Boundary Layer Mass Transfer in Partial Oxidation Selectivity. J. Catal. 1992, 136, 300–308. [Google Scholar] [CrossRef]
  10. Zhu, H.; Dong, K.; Huang, J.; Li, J.; Wang, G.; Xie, Z. Reaction Mechanism and Mechanical Properties of an Aluminum-Based Composite Fabricated in-Situ from Al-SiO2 System. Mater. Chem. Phys. 2014, 145, 334–341. [Google Scholar] [CrossRef]
  11. Shah, M.; Al Mesfer, M.K.; Danish, M.; Mondal, P.; Goyal, H.; Das, S. Study on the Effect of Promotors in CO2 Utilization for Syngas Production via Dry Reforming of Methane over Co-MOX/TiO2-Al2O3 (MOX = La, Ce, Mg, and K) Catalysts. Fuel Process. Technol. 2024, 257, 108089. [Google Scholar] [CrossRef]
  12. Sun, K.; Jiang, J.; Liu, Z.; Geng, S.; Liu, Z.; Yang, J.; Li, S. Research Progress on Metal-Support Interactions over Ni-Based Catalysts for CH4-CO2 Reforming Reaction. Ranliao Huaxue Xuebao/J. Fuel Chem. Technol. 2025, 53, 434–451. [Google Scholar] [CrossRef]
  13. Vahid Shahed, G.; Taherian, Z.; Khataee, A.; Meshkani, F.; Orooji, Y. Samarium-Impregnated Nickel Catalysts over SBA-15 in Steam Reforming of CH4 Process. J. Ind. Eng. Chem. 2020, 86, 73–80. [Google Scholar] [CrossRef]
  14. Jing, Z.; Zhang, T.; Shang, J.; Zhai, M.; Yang, H.; Qiao, C.; Ma, X. Influence of Cu and Mo Components of γ-Al2O3 Supported Nickel Catalysts on Hydrodeoxygenation of Fatty Acid Methyl Esters to Fuel-like Hydrocarbons. J. Fuel Chem. Technol. 2018, 46, 427–440. [Google Scholar] [CrossRef]
  15. Alanazi, R.S.A.; Alreshaidan, S.B.; Ibrahim, A.A.; Wazeer, I.; Alarifi, N.; Bellahwel, O.A.; Abasaeed, A.E.; Al-Fatesh, A.S. Influence of Alumina and Silica Supports on the Performance of Nickel Catalysts for Methane Partial Oxidation. Catalysts 2025, 15, 102. [Google Scholar] [CrossRef]
  16. Mageed, A.K.; Ayodele, B.V.; Mustapa, S.I. Response Surface Optimization of Hydrogen-Rich Syngas Production by Greenhouse Gases Reforming. Chem. Eng. Technol. 2020, 43, 742–751. [Google Scholar] [CrossRef]
  17. Nelson, B.L.; Pei, L. Experiment Design and Analysis. Int. Ser. Oper. Res. Manag. Sci. 2021, 316, 199–229. [Google Scholar] [CrossRef]
  18. Hossain, M.A.; Ayodele, B.V.; Cheng, C.K.; Khan, M.R. Optimization of Renewable Hydrogen-Rich Syngas Production from Catalytic Reforming of Greenhouse Gases (CH4 and CO2) over Calcium Iron Oxide Supported Nickel Catalyst. J. Energy Inst. 2019, 92, 177–194. [Google Scholar] [CrossRef]
  19. Whitman, W. Section 1. In Song Myself; University of Iowa Press: Iowa City, IA, USA, 2018; pp. 7–9. [Google Scholar] [CrossRef]
  20. Yang, L.; Yin, P.; Fan, H.; Xue, Q.; Li, K.; Li, X.; Sun, L.; Liu, Y. Response Surface Methodology Optimization of Ultrasonic-Assisted Extraction of Acer Truncatum Leaves for Maximal Phenolic Yield and Antioxidant Activity. Molecules 2017, 22, 232. [Google Scholar] [CrossRef]
  21. Ahmadi Azqhandi, M.H.; Ghaedi, M.; Yousefi, F.; Jamshidi, M. Application of Random Forest, Radial Basis Function Neural Networks and Central Composite Design for Modeling and/or Optimization of the Ultrasonic Assisted Adsorption of Brilliant Green on ZnS-NP-AC. J. Colloid Interface Sci. 2017, 505, 278–292. [Google Scholar] [CrossRef]
  22. Dong, W.S.; Jun, K.W.; Roh, H.S.; Liu, Z.W.; Park, S.E. Comparative Study on Partial Oxidation of Methane over Ni/ZrO2, Ni/CeO2 and Ni/Ce-ZrO2 Catalysts. Catal. Letters 2002, 78, 215–222. [Google Scholar] [CrossRef]
  23. Wang, H.Y.; Ruckenstein, E. Partial Oxidation of Methane to Synthesis Gas over MgO- and SiO2-Supported Rhodium Catalysts. J. Catal. 1999, 186, 181–187. [Google Scholar] [CrossRef]
  24. Zhu, J.; Van Ommen, J.G.; Lefferts, L. Reaction Scheme of Partial Oxidation of Methane to Synthesis Gas over Yttrium-Stabilized Zirconia. J. Catal. 2004, 225, 388–397. [Google Scholar] [CrossRef]
  25. Costa, D.S.; Gomes, R.S.; Rodella, C.B.; da Silva, R.B.; Fréty, R.; Teixeira Neto, É.; Brandão, S.T. Study of Nickel, Lanthanum and Niobium-Based Catalysts Applied in the Partial Oxidation of Methane. Catal. Today 2020, 344, 15–23. [Google Scholar] [CrossRef]
  26. Cheephat, C.; Daorattanachai, P.; Devahastin, S.; Laosiripojana, N. Partial Oxidation of Methane over Monometallic and Bimetallic Ni-, Rh-, Re-Based Catalysts: Effects of Re Addition, Co-Fed Reactants and Catalyst Support. Appl. Catal. A Gen. 2018, 563, 1–8. [Google Scholar] [CrossRef]
  27. Ma, Y.; Ma, Y.; Chen, Y.; Ma, S.; Li, Q.; Hu, X.; Wang, Z.; Buckley, C.E.; Dong, D. Highly Stable Nanofibrous La2NiZrO6 Catalysts for Fast Methane Partial Oxidation. Fuel 2020, 265, 116861. [Google Scholar] [CrossRef]
  28. Wu, T.; Yan, Q.; Wan, H. Partial Oxidation of Methane to Hydrogen and Carbon Monoxide over a Ni/TiO2 Catalyst. J. Mol. Catal. A Chem. 2005, 226, 41–48. [Google Scholar] [CrossRef]
  29. Singha, R.K.; Shukla, A.; Yadav, A.; Sivakumar Konathala, L.N.; Bal, R. Effect of Metal-Support Interaction on Activity and Stability of Ni-CeO2 Catalyst for Partial Oxidation of Methane. Appl. Catal. B Environ. 2017, 202, 473–488. [Google Scholar] [CrossRef]
  30. Chu, Y.; Li, S.; Lin, J.; Gu, J.; Yang, Y. Partial Oxidation of Methane to Carbon Monoxide and Hydrogen over NiO/La2O3/γ-Al2O3 Catalyst. Appl. Catal. A Gen. 1996, 134, 67–80. [Google Scholar] [CrossRef]
  31. Morioka, H.; Shimizu, Y.; Sukenobu, M.; Ito, K.; Tanabe, E.; Shishido, T.; Takehira, K. Partial Oxidation of Methane to Synthesis Gas over Supported Ni Catalysts Prepared from Ni-Ca/Al-Layered Double Hydroxide. Appl. Catal. A Gen. 2001, 215, 11–19. [Google Scholar] [CrossRef]
  32. Yan, Q.G.; Wu, T.H.; Weng, W.Z.; Toghiani, H.; Toghiani, R.K.; Wan, H.L.; Pittman, C.U. Partial Oxidation of Methane to H2 and CO over Rh/SiO2 and Ru/SiO2 Catalysts. J. Catal. 2004, 226, 247–259. [Google Scholar] [CrossRef]
  33. Cesar, D.V.; Baldanza, M.A.S.; Henriques, C.A.; Pompeo, F.; Santori, G.; Múnera, J.; Lombardo, E.; Schmal, M.; Cornaglia, L.; Nichio, N. Stability of Ni and Rh-Ni Catalysts Derived from Hydrotalcite-like Precursors for the Partial Oxidation of Methane. Int. J. Hydrog. Energy 2013, 38, 5616–5626. [Google Scholar] [CrossRef]
  34. Pompeo, F.; Nichio, N.N.; Ferretti, O.A.; Resasco, D. Study of Ni Catalysts on Different Supports to Obtain Synthesis Gas. Int. J. Hydrog. Energy 2005, 30, 1399–1405. [Google Scholar] [CrossRef]
  35. Shishido, T.; Sukenobu, M.; Morioka, H.; Kondo, M.; Wang, Y.; Takaki, K.; Takehira, K. Partial Oxidation of Methane over Ni/Mg-Al Oxide Catalysts Prepared by Solid Phase Crystallization Method from Mg-Al Hydrotalcite-like Precursors. Appl. Catal. A Gen. 2002, 223, 35–42. [Google Scholar] [CrossRef]
Figure 1. Nitrogen adsorption–desorption isotherms at 500 °C for 5Ni+xSm/(10Si+90Al) (x = 0.5, 1.0, 1.5, 2.0) catalysts.
Catalysts 15 00721 g001
Figure 2. H 2 temperature-programmed reduction (H2-TPR) profiles of 5Ni+xSm/(10Si+90Al) (x = 0.5, 1.0, 1.5, 2.0) catalysts calcined at 500 °C.
Catalysts 15 00721 g002
Figure 3. XRD patterns of calcined 5Ni+xSm/(10Si+90Al) (x = 0.5,1.0,1.5,2.0) catalysts.
Catalysts 15 00721 g003
Figure 4. FTIR spectra of 5Ni+xSm/(10Si+90Al) (x = 0.5, 1.0, 1.5, 2.0) catalysts calcined at 500 °C.
Catalysts 15 00721 g004
Figure 5. Catalytic activity about TOS of catalysts calcined at 500 °C (A) CH4. conversion (%), (B) H2-yield (%), and (C) H2/CO ratio.
Catalysts 15 00721 g005
Figure 6. Raman spectra of 5Ni+xSm/(10Si+90Al) (x = 0.5, 1.0, 1.5, 2.0) catalysts operated at 600 °C.
Catalysts 15 00721 g006
Figure 7. Thermogravimetric analysis (TGA) of 5Ni+xSm/(10Si+90Al) catalysts (x = 0, 1, 1.5, 2) after 600 °C reaction.
Catalysts 15 00721 g007
Figure 8. (a,b) for fresh and spent TEM images of 5Ni+1Sm/(10Si+90Al), respectively, and (c,d) for fresh and spent TEM images of 5Ni/(10Si+90Al) catalysts, respectively.
Catalysts 15 00721 g008
Figure 9. Relationship between (a) temperature (T), space velocity (SV), and CH4 conversion at CH4/O2 =2; (b) temperature (T), ratio, and CH4 conversion (%) at SV = 12,000 cc g−1 h−1.
Catalysts 15 00721 g009
Figure 10. Relationship between (a) temperature (T), space velocity (SV), and H2 yield at CH4/O2 =2; (b) temperature (T), ratio, and H2 yield at SV = 12,000 cc g−1 h−1.
Catalysts 15 00721 g010
Figure 11. Relationship between (a) temperature (T), space velocity (SV), and H2/CO at CH4/O2 = 2; (b) temperature (T), ratio, and H2/CO at SV = 12,000 cc g−1 h−1.
Catalysts 15 00721 g011
Table 1. Textural characteristics of 5Ni+xSm/(10Si+90Al) catalysts calcined at 500 °C (x = 0.5, 1.0, 1.5, 2.0).
SampleBET Surface
Area (m2/g)
Pore Volume
(cm3/g)
Pore Size
(nm)
5Ni/(10Si+90Al)1920.5811.41
5Ni+0.5Sm/(10Si+90Al)1870.5511.00
5Ni+1Sm/(10Si+90Al)1860.5611.01
5Ni+1.5Sm/(10Si+90Al)1860.5510.91
5Ni+2Sm/(10Si+90Al)1770.5311.14
Table 2. Hydrogen consumption during H2-TPR analysis and corresponding degree of % reduction (DR).
SampleQuantity (cm3/g STP)DR a
(%)
5Ni/(10Si+90Al)19.3101
5Ni+0.5Sm/(10Si+90Al)18.597
5Ni+1Sm/(10Si+90Al)18.095
5Ni+1.5Sm/(10Si+90Al)17.190
5Ni+2Sm/(10Si+90Al)17.391
DR a (%) = (hydrogen quantity consumed experimentally/theoretical consumption of H2) × 100.
Table 3. Actual and coded values for the process parameters.
Process ParameterLevels
−1 (Low)+1 (High)
SV: Gas Hour Space velocity (ccg−1h−1) 800016,000
T: Temperature (°C)575700
C H 4 / O 2   ratio1. 52.5
Table 4. Optimization objectives and resulting optimal parameters.
VariablesGoals Function
TSVCH4/O2H2 Yield
Criteria575–7008000–16,0001.5–2.5Max.
Theoretical conditions696.2258090.5051.66387.563
Experimental conditions69680911.66388.39
Disclaimer/Publisher’s Note: The statements, opinions and data contained in all publications are solely those of the individual author(s) and contributor(s) and not of MDPI and/or the editor(s). MDPI and/or the editor(s) disclaim responsibility for any injury to people or property resulting from any ideas, methods, instructions or products referred to in the content.

