Article

Experimental and Kinetic Modelling Study of the Heterogeneous Catalytic Conversion of Bioethanol into n-Butanol Using MgO–Al2O3 Mixed Oxide Catalyst

1
Institute of Materials and Environmental Chemistry, HUN-REN Research Centre for Natural Sciences, H-1117 Budapest, Hungary
2
Hevesy György Doctoral School of Chemistry, ELTE Eötvös Loránd University, H-1117 Budapest, Hungary
3
Department of Natural Sciences, College of Science and Technical Education, Mbeya University of Science and Technology, Mbeya P.O. Box 131, Tanzania
*
Authors to whom correspondence should be addressed.
Current address: Hungarian Intellectual Property Office, H-1081 Budapest, Hungary.
Catalysts 2025, 15(8), 709; https://doi.org/10.3390/catal15080709
Submission received: 18 May 2025 / Revised: 18 July 2025 / Accepted: 21 July 2025 / Published: 25 July 2025
(This article belongs to the Special Issue Biomass Catalytic Conversion to Value-Added Chemicals)

Abstract

Ethanol upgrading via catalytic C–C coupling, commonly known as the Guerbet reaction, offers a sustainable route to produce 1-butanol, a high-performance biofuel. To address gaps in the mechanistic understanding of the catalytic reaction, we investigated the process involving a fixed-bed reactor, operated at 275–325 °C, 21 bar, and weight hourly space velocities of 0.25–2.5 gEtOH/(gcat·h), using helium as a carrier gas, with a 5:1 He/EtOH molar ratio. The catalyst was a MgO–Al2O3 mixed oxide (Mg/Al = 2:1), derived from a hydrotalcite precursor. A detailed kinetic model was developed, encompassing 15 species and 27 reversible steps (10 sorption and 17 reaction steps), within a 1+1D sorption–reaction–transport framework. Four C4-forming pathways were included: aldol condensation to form crotonaldehyde, semi-direct coupling to form butyraldehyde and crotyl alcohol, and direct coupling to form 1-butanol. To avoid overfitting, Arrhenius parameters were grouped by reaction type, resulting in sixty rate parameters and one active site-specific density parameter. The optimized model achieved high accuracy, with an average prediction error of 1.44 times the experimental standard deviation. The mechanistic analysis revealed aldol condensation as the dominant pathway below 335 °C, with semi-direct coupling to crotyl alcohol prevailing above 340 °C. The resulting model provides a robust framework for understanding and predicting complex reaction networks in ethanol upgrading systems.

Graphical Abstract

1. Introduction

Bioethanol, produced through the fermentation of various biomass sources, including waste lignocellulose materials [1], has become one of the most widely used fuel additives worldwide, often blended with gasoline at a concentration of up to 10 vol.%, as required by the E10 standard, or used as a standalone fuel. It also serves as a key feedstock for the chemical industry [2]. Despite its sustainability benefits, ethanol presents some limitations when compared to gasoline. These include its lower energy content and hygroscopic nature, which causes it to absorb water, leading to potential corrosion issues in regard to engine components and fuel delivery systems [3,4,5]. Therefore, blending ethanol with gasoline is limited to volume fractions below 20% to avoid affecting the fuel quality and damaging internal combustion engines [6,7].
To address these issues, higher alcohols, such as 1-butanol, have emerged as potential alternatives. Moreover, 1-butanol, a versatile platform molecule, is gaining attention as a promising substitute for ethanol, due to its significant industrial applications and its favorable physicochemical properties for fuel use [8,9,10]. In addition, 1-butanol is extensively used as an industrial solvent in producing plastics, polymers, synthetic rubber, brake fluids, lubricants, paints, coatings, inks, and other chemical products. It also acts as a precursor for key chemicals, such as acetates, acrylate esters, amines, and amino resins [6,11,12]. Its superior physicochemical properties make it an attractive alternative to ethanol as a blending component in transportation fuels. With a higher energy density than ethanol (29.2 MJ/L vs. 24.0 MJ/L) and poor miscibility with water, 1-butanol has an energy density closer to gasoline, a non-corrosive nature, a higher allowable blend ratio, and research octane numbers and properties similar to those of gasoline [13,14,15,16,17].
The most common methods for producing 1-butanol are the hydroformylation of fossil-based propylene (OXO process) and a bio-based method involving acetone–butanol–ethanol fermentation (ABE fermentation) [18], but both methods have drawbacks. ABE fermentation produces a mixture of oxygenates at low concentrations (~2 wt.% total, including 0.5–0.6 wt.% butanol), requiring expensive and complex butanol separation [19,20]. In contrast, the OXO process uses toxic carbon monoxide and highly flammable propylene to produce butanol via hydroformylation and, subsequent, hydrogenation. Furthermore, this process involves the use of an expensive and complex catalytic system. It is energy intensive and relies on fossil feedstock [21,22,23]. Consequently, researchers have been exploring alternative methods for the sustainable and efficient production of 1-butanol that can overcome these limitations and provide a more environmentally friendly solution.
Bioethanol conversion into butanol via catalytic C–C coupling, the so-called Guerbet coupling reaction, has emerged as an efficient and sustainable pathway for butanol production [24]. The coupling reaction requires basic catalysts or catalysts with both base and acid sites, the mechanism of which is not fully understood. Three main mechanisms are commonly considered for the conversion of ethanol into 1-butanol [25,26]: (i) the direct coupling of two ethanol molecules to form 1-butanol, (ii) a semi-direct pathway involving the coupling of acetaldehyde intermediates with ethanol, and (iii) the most common coupling mechanism involving the aldol condensation pathway, which proceeds via a series of reaction steps (Scheme 1). This latter mechanism involves the following steps: (i) ethanol is dehydrogenated to produce acetaldehyde, (ii) acetaldehyde undergoes aldol addition to form acetaldol, (iii) acetaldol is dehydrated to form crotonaldehyde, and (iv) crotonaldehyde is hydrogenated (in two steps) to produce 1-butanol [6,16]. Note that no molecular hydrogen is present in the catalytic system, thus the only hydrogen source is the ethanol reactant for the hydrogenation of the intermediates, as shown in Scheme 1.
Various homogeneous and heterogeneous catalysts have facilitated the ethanol coupling reaction. Although homogeneous catalytic systems can achieve high conversion rates and selectivity, they can also present challenges, such as product purification, catalyst recovery, waste management, and the environmental impact. Due to their enhanced stability and reproducibility, heterogeneous catalysts, such as zeolites, metal oxides, mixed metal oxides (MMOs), and hydroxyapatite (HAP) [27,28,29,30,31], have emerged as a preferred alternative. In particular, Mg/Al mixed oxides derived from a hydrotalcite precursor through calcination at temperatures between 400 and 600 °C have demonstrated promising catalytic properties, due to their chemical and thermal stability, abundance of active sites, favorable acid-base properties, and cost effectiveness [32,33]. Under optimized reaction conditions, they demonstrate high selectivity for the desired butanol product, while minimizing undesirable side reactions, such as the production of ethers and esters and the dehydration of alcohols to olefins.
Extensive studies have investigated the formation of butanol and byproduct compounds. These studies have contributed to developing more elaborate mechanisms for these complex reaction pathways. However, despite multiple mechanisms proposed in the literature, there is still a noticeable lack of comprehensive kinetic analysis and validation that would allow for the optimization of the butanol production mechanism.
This study examined the coupling reaction of ethanol into butanol using a MgO–Al2O3 mixed oxide catalyst, derived from hydrotalcite, involving a fixed-bed flow-through reactor system, under various experimental conditions. The main purpose of the present study is to decompose the production of 1-butanol into contributions from different C–C coupling channels using a kinetic model, developed based on experimental results, and to determine, based on this analysis, which mechanisms dominate in various temperature ranges.

2. Results

2.1. Experimental Results

The main characteristics of the MgO–Al2O3 catalyst used in the present study have been detailed elsewhere [34]. In brief, calcining the hydrotalcite precursor at 550 °C produced a MgO–Al2O3 mixed oxide, with a specific surface area of 218 m2·g−1, containing slit-like pores (Figure S1). The XRD measurements revealed the transformation of the hydrotalcite precursor into the corresponding mixed oxide, which shows only the characteristic reflections of the cubic periclase form of MgO (Figure S2). The absence of an aluminum oxide phase indicated that Al was finely dispersed in the MgO structure, possibly resulting in the formation of Al–O–Mg linkages. The TEM image of the sample (Figure S3) shows irregular, agglomerated particles, typical of mixed oxide samples. Characterization of the acid-base properties revealed that calcination at 550 °C produced a MgO–Al2O3 mixed oxide catalyst with optimal concentrations of strong basic sites and medium-strong Lewis acid sites, which are necessary to achieve high butanol selectivity during the ethanol coupling reaction.
The MgO–Al2O3 catalyst (2 g) was loaded between quartz wool plugs into a vertically oriented fixed-bed reactor, with its design parameters outlined in Figure 1 and Table 1. The ethanol reactant was introduced at 7–8 different feeding rates between 0.5–5.0 g/h, corresponding to a weight hourly space velocity (WHSV) of 0.25–2.5gEtOH/(gcat·h). Helium was used as the carrier gas, with a 5:1 helium-to-ethanol molar ratio. Based on the previously measured temperature dependence of the reaction at a WHSV of 1.0 gEtOH/(gcat·h) [34], the reactor was thermostated at three selected temperatures: 275, 300, and 325 °C (conversion range: 10–30%). This was done to avoid extremely low or high conversions at high or low WHSV values, respectively. The total pressure was 21 bar. According to our numerical estimations, the heat produced by the chemical reactions, even at the highest conversion rate, was small and the pressure drop along the reactor was negligible, thus the reactor could be considered as isobaric and isothermal. After cooling the product mixture to room temperature, the liquid products were collected and analyzed using gas chromatography (GC). The ethanol conversion and mass fractions of the liquid products were then calculated. Although the thermal conductivity detector (TCD) revealed a significant amount of water in the liquid-phase products, it did not allow for its accurate quantification. Thus, we could not use those data for parameterizing the kinetic model. Gas-phase products, other than the permanent gases CO2 and CO, and CH4 (which appeared only in trace amounts under the applied reaction conditions), could not be accurately analyzed via the GC column used. However, the formation of hydrogen during the initial step in the dehydrogenation of ethanol, as well as the formation of olefins (ethylene; but-1-ene; but-1,3-diene) as a result of the dehydration side reactions of ethanol and other coupling products, were expected and were considered during the construction of the kinetic model.
Measurements were conducted until the product distribution became stationary. Then, under steady-state conditions, parallel measurements were taken every hour. A total of 59 measurements were taken in regard to 23 conditions (3 temperatures and 7–8 WHSVs), resulting in 434 product yield data points, including 59 for ethanol. The ethanol conversion and product yields (in mass%) for five species are shown in Figure 2 (vide infra) and, in Figure S4, for three additional minor products (crotonaldehyde, crotyl alcohol, and butyraldehyde), as well as in tabulated form in Table S2. The yields show monotonic trends in regard to the WHSV and temperature for all species, except for 1-butanol and 1-hexanol at high temperatures and low WHSV values, where the data exhibit low reproducibility (i.e., large error bars) and non-monotonic, noise-like variations in regard to the WHSV, suggesting the presence of potential experimental issues.

2.2. Coupled Sorption–Reaction Kinetics Model

A kinetic reaction mechanism was constructed using the 15 species detailed in Table 2. In addition to their names, the table contains their short notation, group formula, and the product phase that contains them at room temperature. Table 2 also presents species class formulas for alcohols, aldehydes, ethers, and alkenes, which are used for defining the mechanism in terms of the reaction classes. The model includes species involved in the aldol condensation pathway (EtOH, H2, AA, CrA, H2O, CrOH, BA, nBuOH), including further identified components of the liquid product mixture (Et2O, nBuOEt, and HexOH) and further expected gas-phase products (alkenes: C2H4, B1E, BDIE). The species properties needed for estimating their transport properties are shown in Table S3.
Although it was not possible to accurately measure the amount of water produced, a significant quantity was generated as a byproduct of the condensation reactions that form C4 species (1 H2O: CrA, CrOH, BA, nBuOH, Et2O) and C6 species (2 H2O: HexOH, nBuOEt), as well as from the dehydration of alcohols forming olefins (1 H2O: C2H4, B1E, 2 H2O: BDIE). The formation of aldehydes (AA, BA, CrA) can be accompanied by the formation of hydrogen gas (H2). By summing up the mass fractions of all the identified liquid-phase products, along with the formed water, it was found that 1–10 mass% of the products remained unaccounted for, depending on the reaction conditions. This missing fraction likely consists of gas-phase alkenes, various unidentified minor liquid-phase products, and the corresponding water formed during their production.
The sorption–reaction mechanism (see Table 3) was constructed based on the following assumptions:
  • No gas-phase chemistry is considered under the investigated relatively low-temperature conditions (T ≤ 325 °C), as justified by the simulations provided in the Supplementary Materials.
  • Only one type of active site is assumed (denoted as *).
  • All of the sorption and chemical reaction steps are reversible.
  • The oxygenated species can adsorb and desorb (i.e., X + * X*, e.g., S1–10).
  • Adsorbing species (Ai) react from and are produced in their adsorbed form (denoted with *). Consequently, reactions between adsorbing species follow the Langmuir–Hinshelwood mechanism (i.e., A1* + A2* …, e.g., R14–17, R21–27).
  • Helium, hydrogen, and alkenes are considered non-adsorbing species.
  • Non-adsorbing species (Ni) are produced in the gas phase (desorbed form) and can react only with adsorbed species via the Eley–Rideal mechanism (i.e., … Ni + Aj*, e.g., R11–13, R18–20).
  • Alcohols can undergo dehydrogenation on the surface to produce aldehydes during a unimolecular step, which produces hydrogen gas (R11–13), or can react with acetaldehyde (R14–15rev). This reversible reaction was omitted for 1-hexanol, as hexanal was not identified among the products.
  • Alcohols can dehydrate on the surface to form alkenes (R18–20). This reaction was also omitted for 1-hexanol, as hex-1-ene was not detected among the products.
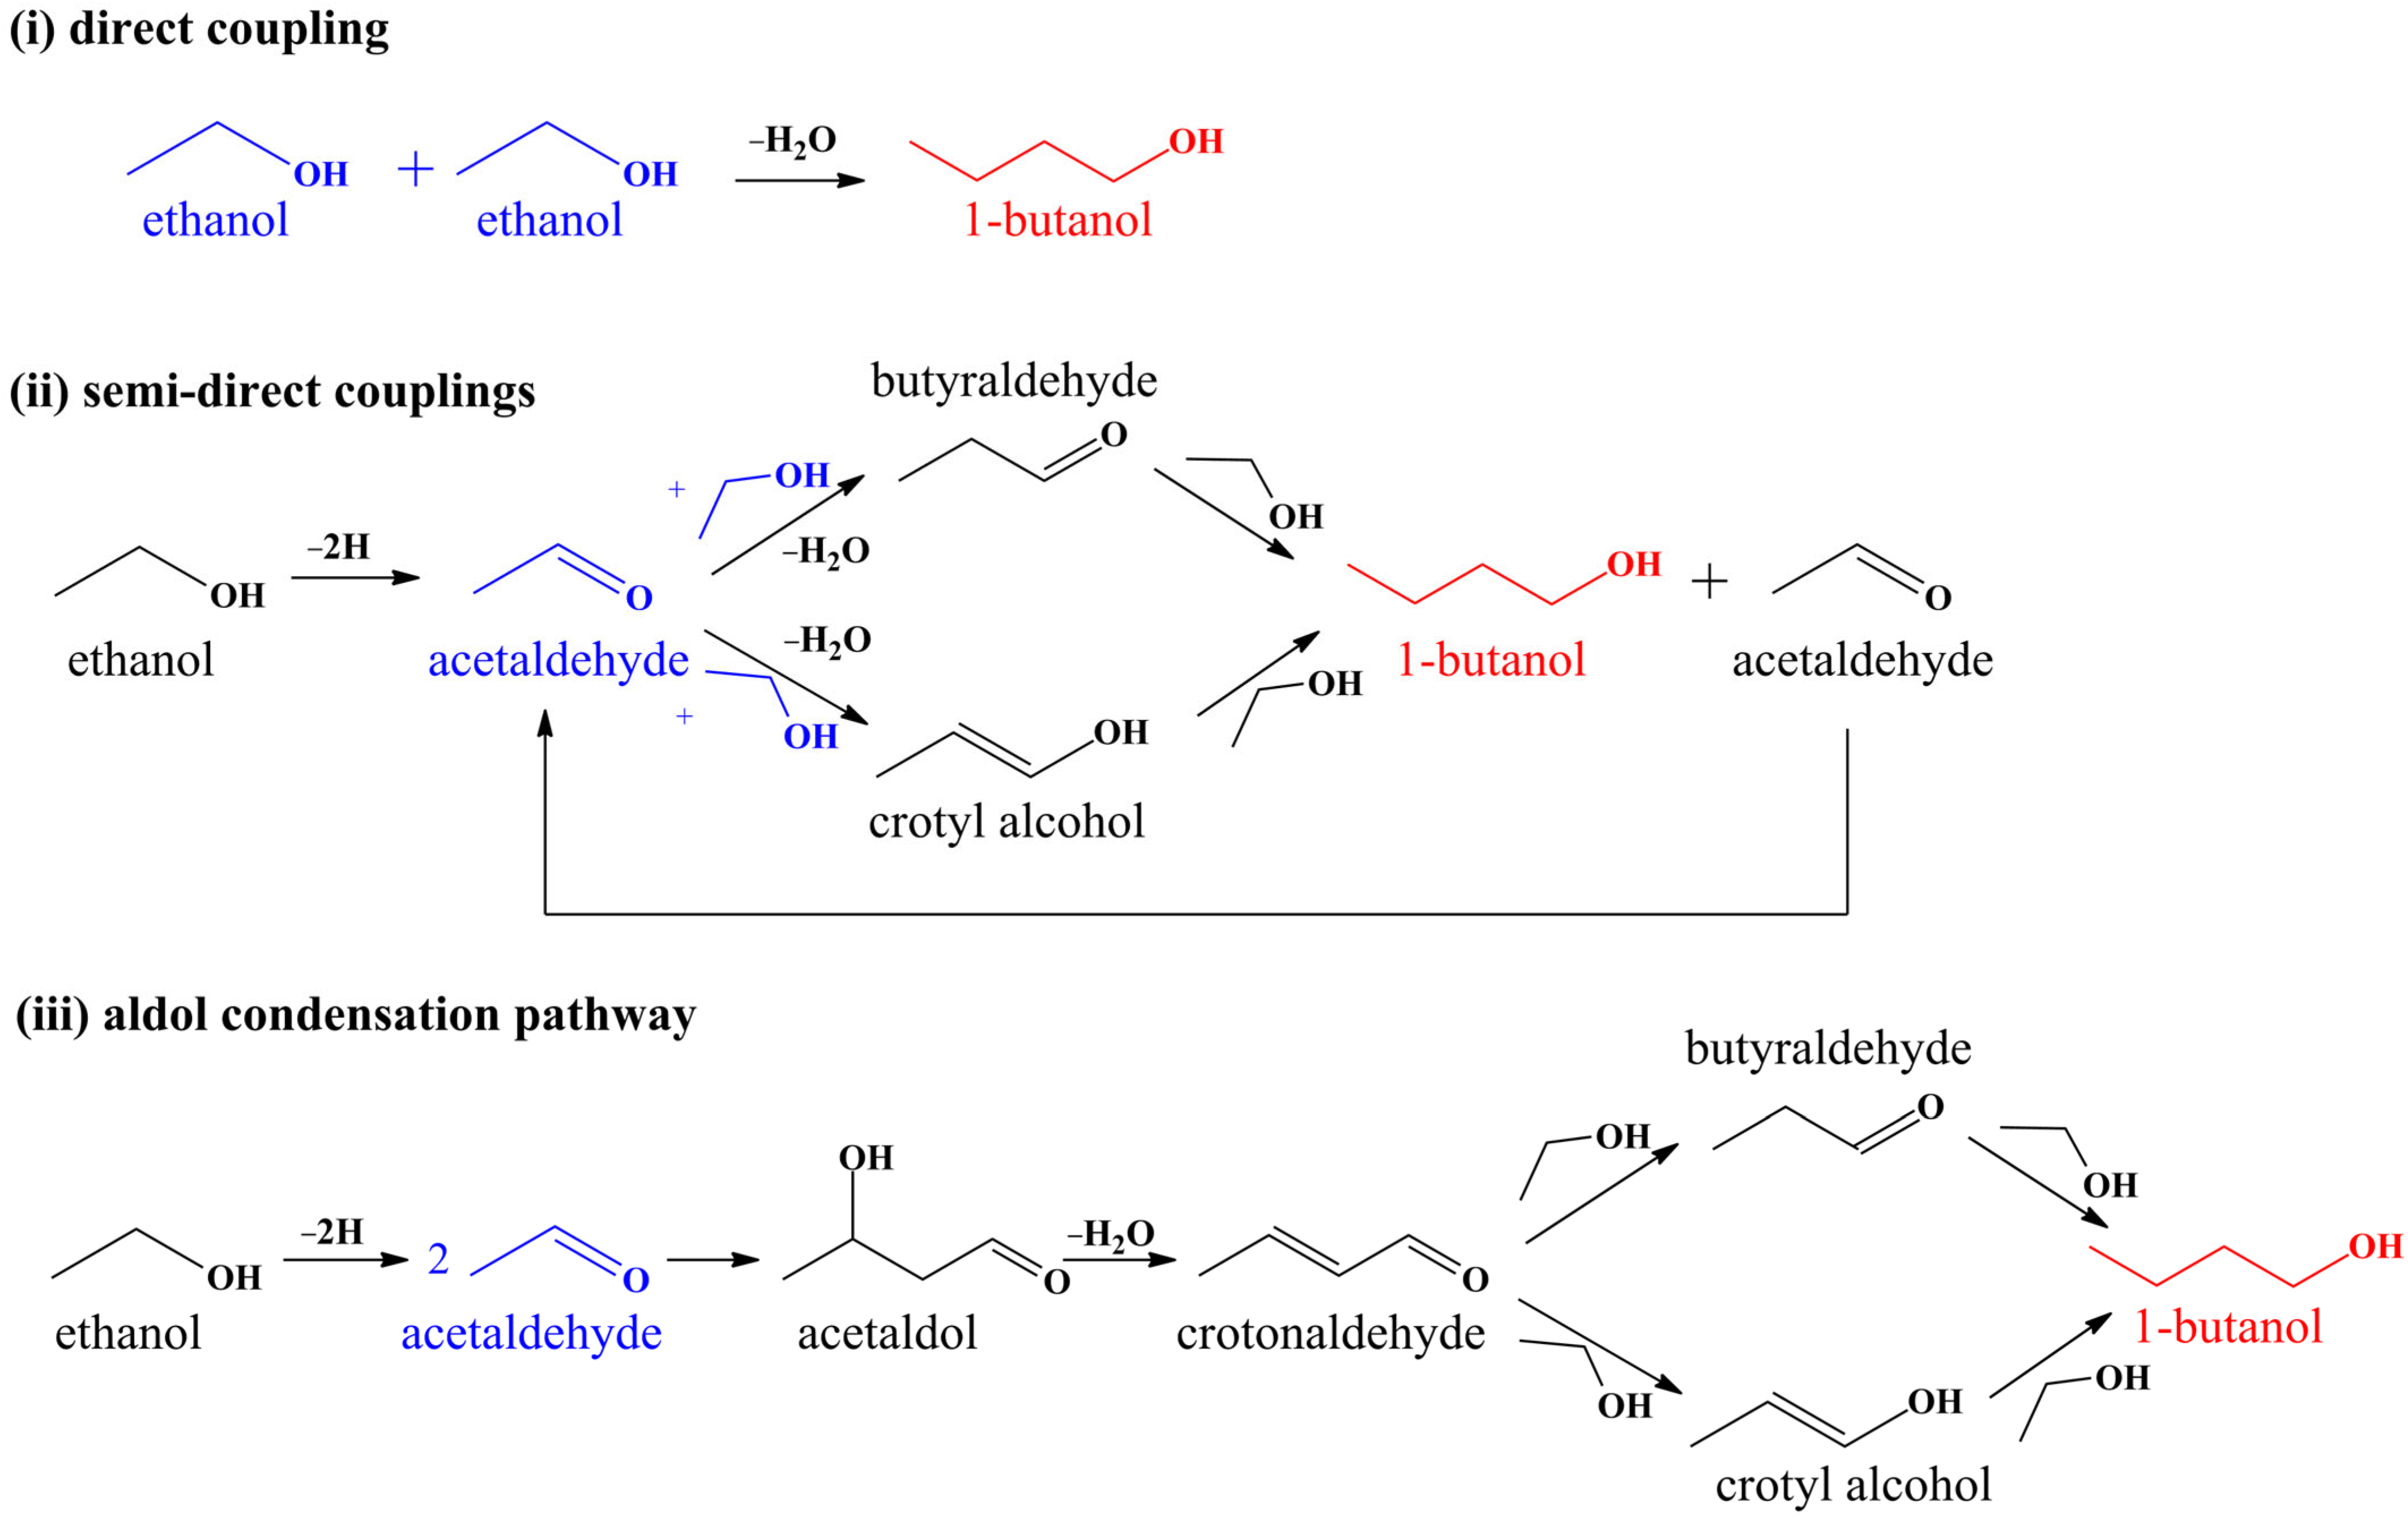
  • The aldol route in terms of Guerbet coupling: the aldol addition of acetaldehyde produces acetaldol (CH3-CH(OH)-CH2-CHO), which, however, was not detected among the products and was, therefore, assumed to undergo rapid dehydration. Consequently, these two steps were lumped into a single aldol condensation reaction, in which crotonaldehyde was formed directly from two acetaldehyde molecules (R21).
  • The semi-direct Guerbet coupling mechanism I: the condensation of acetaldehyde with ethanol to form crotyl alcohol (R22).
  • The semi-direct Guerbet coupling mechanism II: the condensation of ethanol with acetaldehyde to form butyraldehyde (R23).
  • The direct Guerbet coupling of alcohols: the condensation of ethanol with ethanol and 1-butanol to form higher alcohols (R24–25).
  • The etherification of ethanol with ethanol and 1-butanol (R26–27).
As neither C6 alkenes (hex-1-ene), aldehydes (hexanal), unsaturated (but-2-en-1-ol) or branched alcohols (e.g., 2-ethyl butan-1-ol), nor unsaturated C6 ethers (n-butenyl ethyl ether), nor C8 species (e.g., 1-octanol, di(n-butyl) ether) were identified among the products, condensation reactions among other pairs of species were not considered in the model.
In our model, the sorption and chemical processes were described using mass-action kinetics. The temperature dependence of the rate coefficient of chemical reactions and sorption processes is usually described using the extended Arrhenius expression:
k T = A T n exp E A R T
However, as our experiments span a narrow temperature range, the curvature of the temperature dependence, which is proportional to n in an Arrhenius plot (lnk vs. 1/T), can have only a minor effect on the relevant rates. Furthermore, the measurements were conducted at three temperatures only, so the two-parameter Arrhenius expression (i.e., n = 0) is appropriate to retain sufficient degrees of freedom for parameter fitting. However, it is known that the adsorption rate coefficient is proportional to the collision frequency of the molecules with the surface, which scales with the square root of the temperature. Therefore, for the adsorption coefficient, we fixed the temperature exponent n to a constant value of 0.5, whereas for all other processes, we used the standard Arrhenius expression (i.e., n = 0).
In regard to the Langmuir–Hinshelwood kinetic model of surface-catalyzed reactions, it is often assumed that either the adsorption of the reactants, or the desorption of the products, or the surface reaction itself, is the rate-determining step. However, we have no such a priori information for this system; therefore, the model used for parameterization is kept as general as possible. The assembled model contains 27 reversible steps (i.e., 27 forward and 27 reverse steps), which, in regard to a general case, would require a total of 108 Arrhenius parameters (A and E) to be optimized. However, in this case, as many of these parameters would not be constrained by the experimental data, fitting all of them would likely lead to serious overfitting issues and yield unphysical values. To avoid this issue, we assumed identical rate parameter values for the following similar types of processes, in order to significantly reduce the number of parameters in the model and ensure that even the non-influential parameters remained within physically realistic ranges during optimization (see Table 3):
  • Rate coefficients for the adsorption and desorption of alcohols (S2–5), aldehydes (S6–8), and ethers (S9–10).
  • Rate coefficients for the dehydrogenation of alcohols to form aldehydes and H2 by the catalyst, and for the corresponding reverse reactions (R11–13).
  • Rate coefficients for the hydrogenation of aldehydes by ethanol, and for the corresponding reverse reactions (R14–15).
  • Rate coefficients for the hydrogenation of C=C bonds by ethanol and their reverse reactions (R16–17).
  • Rate coefficients for the dehydration of alcohols and their reverse reactions (R18–20).
  • These constraints reduced the number of independent Arrhenius parameters to 60.

2.3. Sorption–Reaction–Transport Model

The model of the packed-bed reactor system accounts for transport phenomenon, sorption, and chemical transformations. At the temperature of the investigation (≥275 °C), ethanol is in the gas phase (above the critical temperature), and the behavior of the gas mixture in the reactor can be estimated using ideal gas equations. As the catalyst is uniformly distributed along the cross section of the reactor, molar concentrations (mol/cm3) can also be assigned to free active sites and adsorbed species, allowing the entire system to be modelled as a gas kinetics system in an isothermal–isobaric plug flow reactor. The following (1 + 1)D partial differential equation was derived to describe the concentration change in terms of the i-th gas-phase species (i = 1, …, 15) in the model:
c i t = v z t c i z + D a x , i z , t z c i z + D a x , i z , t 2 c i z 2 + Q i s o r p z , t + Q i r e a c z , t
where c i ( z , t ) is the molar concentration of the i-th species at the axial (downstream, vertical) coordinate position z in the catalyst bed and at time t, v z t the axial velocity, and D a x , i ( z , t ) is the axial dispersion coefficient, which is the sum of the mechanical dispersion and the substance-dependent molecular diffusion coefficients. The first term describes mass transport due to convection, the second and third accounts for dispersion, while Q i s o r p and Q i r e a c z , t are the source terms for sorption and chemical reactions, respectively. For the concentration of free active sites (one type) and the adsorbed species (ten in total), only the sorption and reaction terms were included in their respective differential equations, as they do not participate in transportation. The volume concentration of the active sites ( c 0 ) with respect to the void volume (interstitial space between catalyst grains) can be calculated using the grain density ( ρ g r a i n ), the void fraction ( ε ), and the specific density of the active sites ( n s p e c , mol/g):
c 0 = n s p e c ρ g r a i n 1 ε ε .
The measured product yields can be predicted as the outlet concentrations of the stationary solution in regard to the differential equation system.

2.4. Optimization of Model Parameters

The goodness of the model predictions was characterized by the experimental uncertainty ( σ w e x p –one standard deviation) normalized root-mean-square deviation (RMSD) of the simulations results ( w s i m -product mass fractions w), based on the experimental data ( w e x p ).
R M S D ( p ) = χ ν 2 ( p ) = 1 N d a t a N p a r e : e x p e r . N e s : s p e c i e s N s e w e s s i m ( p ) w e s e x p σ ( w e s e x p ) 2
N d a t a , N p a r , N e , N s e , and p denote the total number of data points (434), the number of parameters (61), the number of experiments (59 under 23 different conditions), the number of species concentrations measured during the e-th experiment (species index: s = 1, …, N s e ), and the vector of the parameters, respectively. This function served as the objective function of the optimization, which was minimized with respect to the parameters. Its value is the square root of the reduced chi-square ( χ ν 2 ), which is a standard metric for assessing the quality of a model fit. In the case of an ideal model, its value is one, whereas for very good models it is 2 or less, which means that the model can describe the experimental data within two standard deviations of the experimental uncertainty, on average. The experimental uncertainty was determined from the standard deviation of the yields from replicate measurements.
While no a priori knowledge was available on the parameter values of the model, we set some reasonable constraints, namely the E/R parameter cannot be negative and it should not be larger than 30,000 K, which correspond to possible activation energies of 0–250 kJ/mol. The optimal values of the 60 kinetic parameters (k (325 °C) and E/R) and the specific density of the active sites ( n s p e c ) were determined through the combined application of the robust FOCTOPUS global optimization method [35] and the Nelder–Mead simplex algorithm. The optimization reduced the χ ν 2 error function value to 1.33 · 434 / ( 434 61 ) = 1.44, which means that the experimental data is reproduced with an average of 1.44 σ experimental uncertainty, which implies that it is a very accurate model. The optimized values of the kinetic parameters are shown in Table 3, while the optimized value of n s p e c was 17.6 µmol/g.

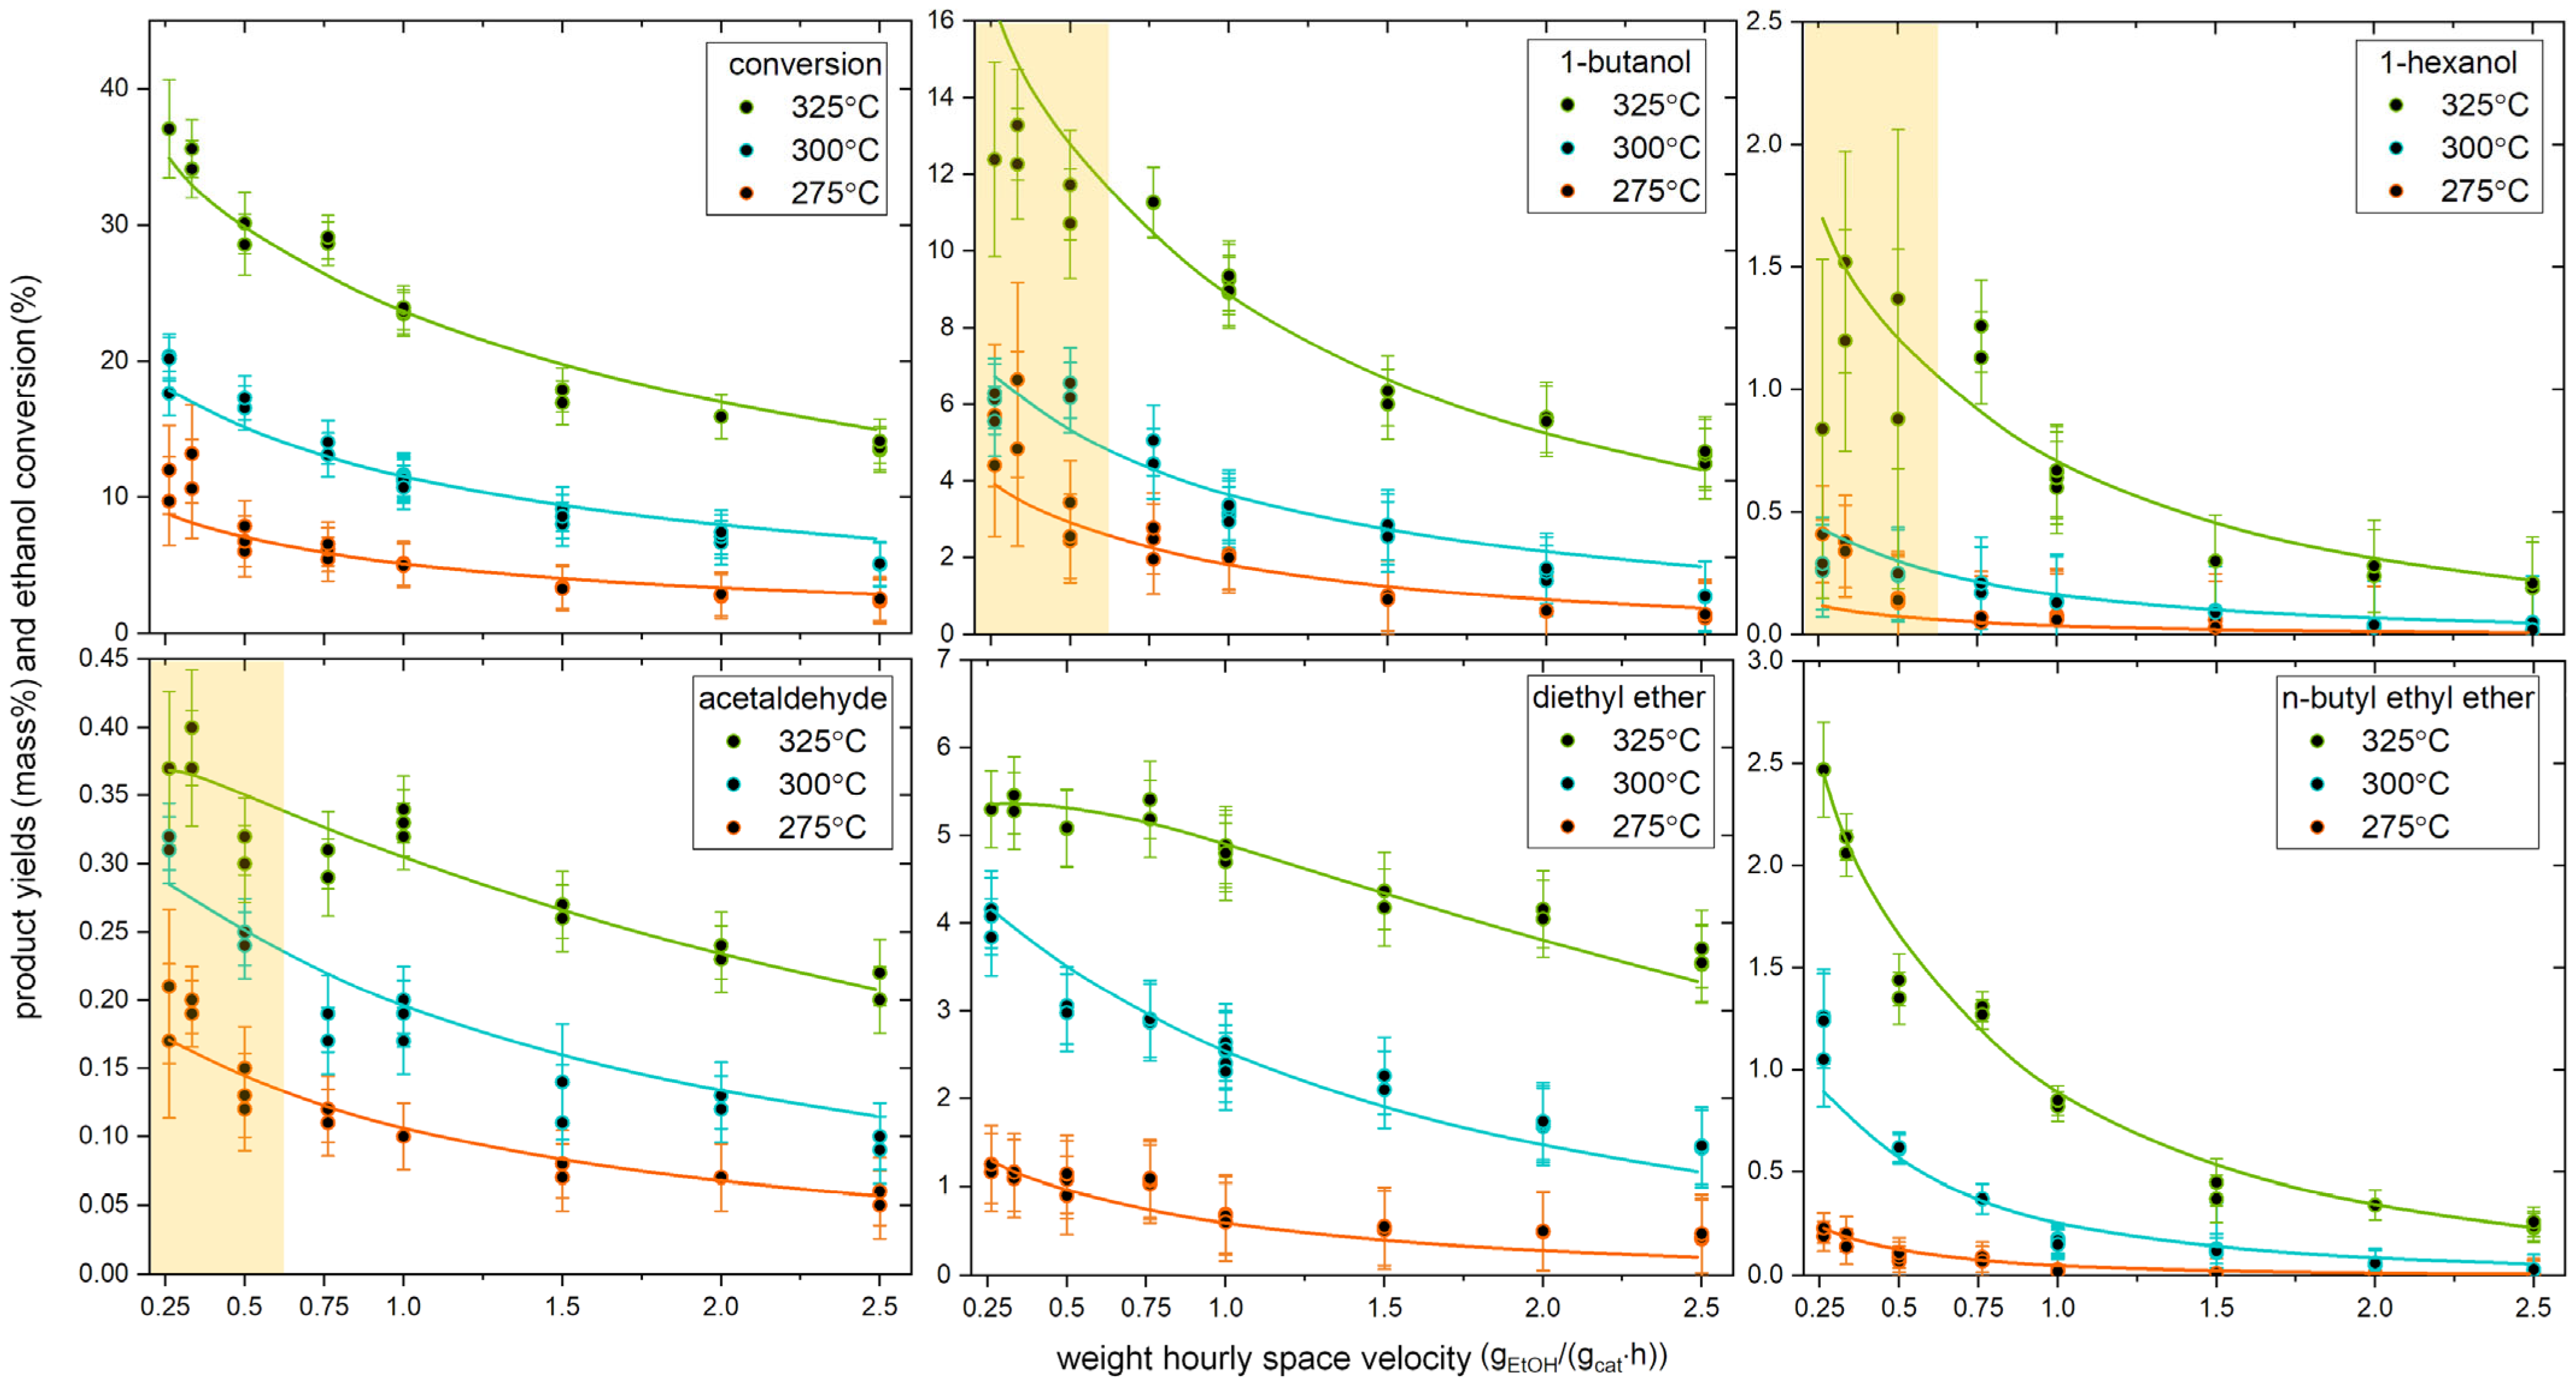
2.5. Conversion and Liquid Product Yields

Figure 2 shows a comparison of the stationary simulation results obtained using the optimized model and the experimentally measured steady-state conversion and product yields for the five major liquid-phase products. The ethanol conversion and the yield of liquid-phase products increase significantly with the increase in temperature and space time (i.e., 1/WHSV). The selectivities are up to 40 mass% for 1-butanol, ~10–20 mass% for diethyl ether, ~3–6 mass% for n-butyl ethyl ether, ~2–3 mass% for 1-hexanol, and ~0.5–1 mass% for acetaldehyde. The developed model shows generally very good predictive performance for all of the species, with the simulated results closely matching the experimental data. At 325 °C, the yields of 1-butanol and 1-hexanol increase steeply with decreasing WHSV values; however, at very low WHSV values (0.25–0.75 gEtOH/(gcat·h)), this trends stops and they display stagnation, which is not captured by the model, as the simulation results follow the same increasing trend and overpredict the data. A possible explanation for this is that at higher temperatures and longer contact times, several competing and subsequent reactions become fast, leading to the formation of multiple minor products that could not be identified and quantified by gas chromatography and, thus, were not included in the model. The experimental yields of diethyl ether, n-butyl ethyl ether, and acetaldehyde are well predicted by the model in regard to the whole WHSV range at all three temperatures. The additional three identified species with a C4 carbon chain, namely crotyl alcohol, crotonaldehyde, and butyraldehyde, were produced in even smaller yields than acetaldehyde: crotyl alcohol with 0.5–1 mass%, butyraldehyde and crotonaldehyde with 0.3–0.5 mass%. Their corresponding plots can be found in the Supplementary Materials (Figure S4), which show that they were generally well predicted by the model. It implies that almost all (90–99 mass%) of the oxygenated products with a C4 carbon chain (not Et2O) were eventually hydrogenated to form 1-butanol before leaving the reactor, regardless of which of the four C–C coupling reactions (R21–24) produced them.

2.6. Gas-Phase Concentrations Along the Reactor

While the experiments allowed for the measurement of the outlet concentrations only, the fitted model provided insight into the details of the sorption and chemical processes along the reactor. Figure 3 shows the mass fraction of the species during the gas phase along the reactor at the lowest and highest values of the investigated temperature and WHSV ranges. The chemical activity observed under intermediate conditions lies between the observations made in regard to the four extreme cases.
Ethanol is continuously consumed along the reactor, with the reaction rate gradually decreasing downstream. Additionally, the concentrations of all the product species increase monotonically along the reactor, with a similar slowdown occurring by the fourth quarter of the catalyst bed. This slowdown is more pronounced at higher temperatures and lower WHSVs, wherein accelerated processes and longer contact times enable the system to approach equilibrium. The profiles of organic species at the lowest temperature (275 °C) and highest WHSV (2.50 gEtOH/(gcat·h)) are clustered into C2 species (C2H4, EtOH), C4 species (nBuOH, Et2O, CrA, CA, BA, B1E), and C6 species (HexOH, nBuOEt), which shows that the product distribution is largely kinetically controlled, as the later generation of products is produced with delays.
The use of model simulations enable the investigation of experimentally unmeasured products like hydrogen, water, and alkenes. Figure 3 shows that ethylene is produced in 1 and 3 mass% at the lowest and the highest temperature, respectively. Its yield is the same for the lowest and highest WHSV, which suggests its reactions achieve a thermodynamic equilibrium, even at the highest flow rate. Moreover, 1-butene is produced in much smaller amounts, and its yield increases by an order of magnitude when the temperature rises from 275 °C to 325 °C. The production of buta-1,3-diene is even smaller, reaching only 0.01 mass%, at the highest temperature and at the lowest WHSV only. A significant amount of water (0.75–3.5 mass%) is produced from the condensation reactions and from the dehydration of alcohols. The yield of hydrogen (H2), a byproduct of the ethanol dehydrogenation step required to initiate aldol condensation (R21), is consistently below 0.01 mass%. However, due to its low molecular weight, its molar amount is actually considerable.
As discussed earlier, at the highest temperature and lowest WHSV, the formation of additional liquid organic compounds is expected, which is partially responsible for the incomplete mass balance. Note that, since our model is limited to a predefined list of species, it accounts for the missing, non-quantified 1–10 mass% exclusively due to the production of hydrogen, water, and alkenes.

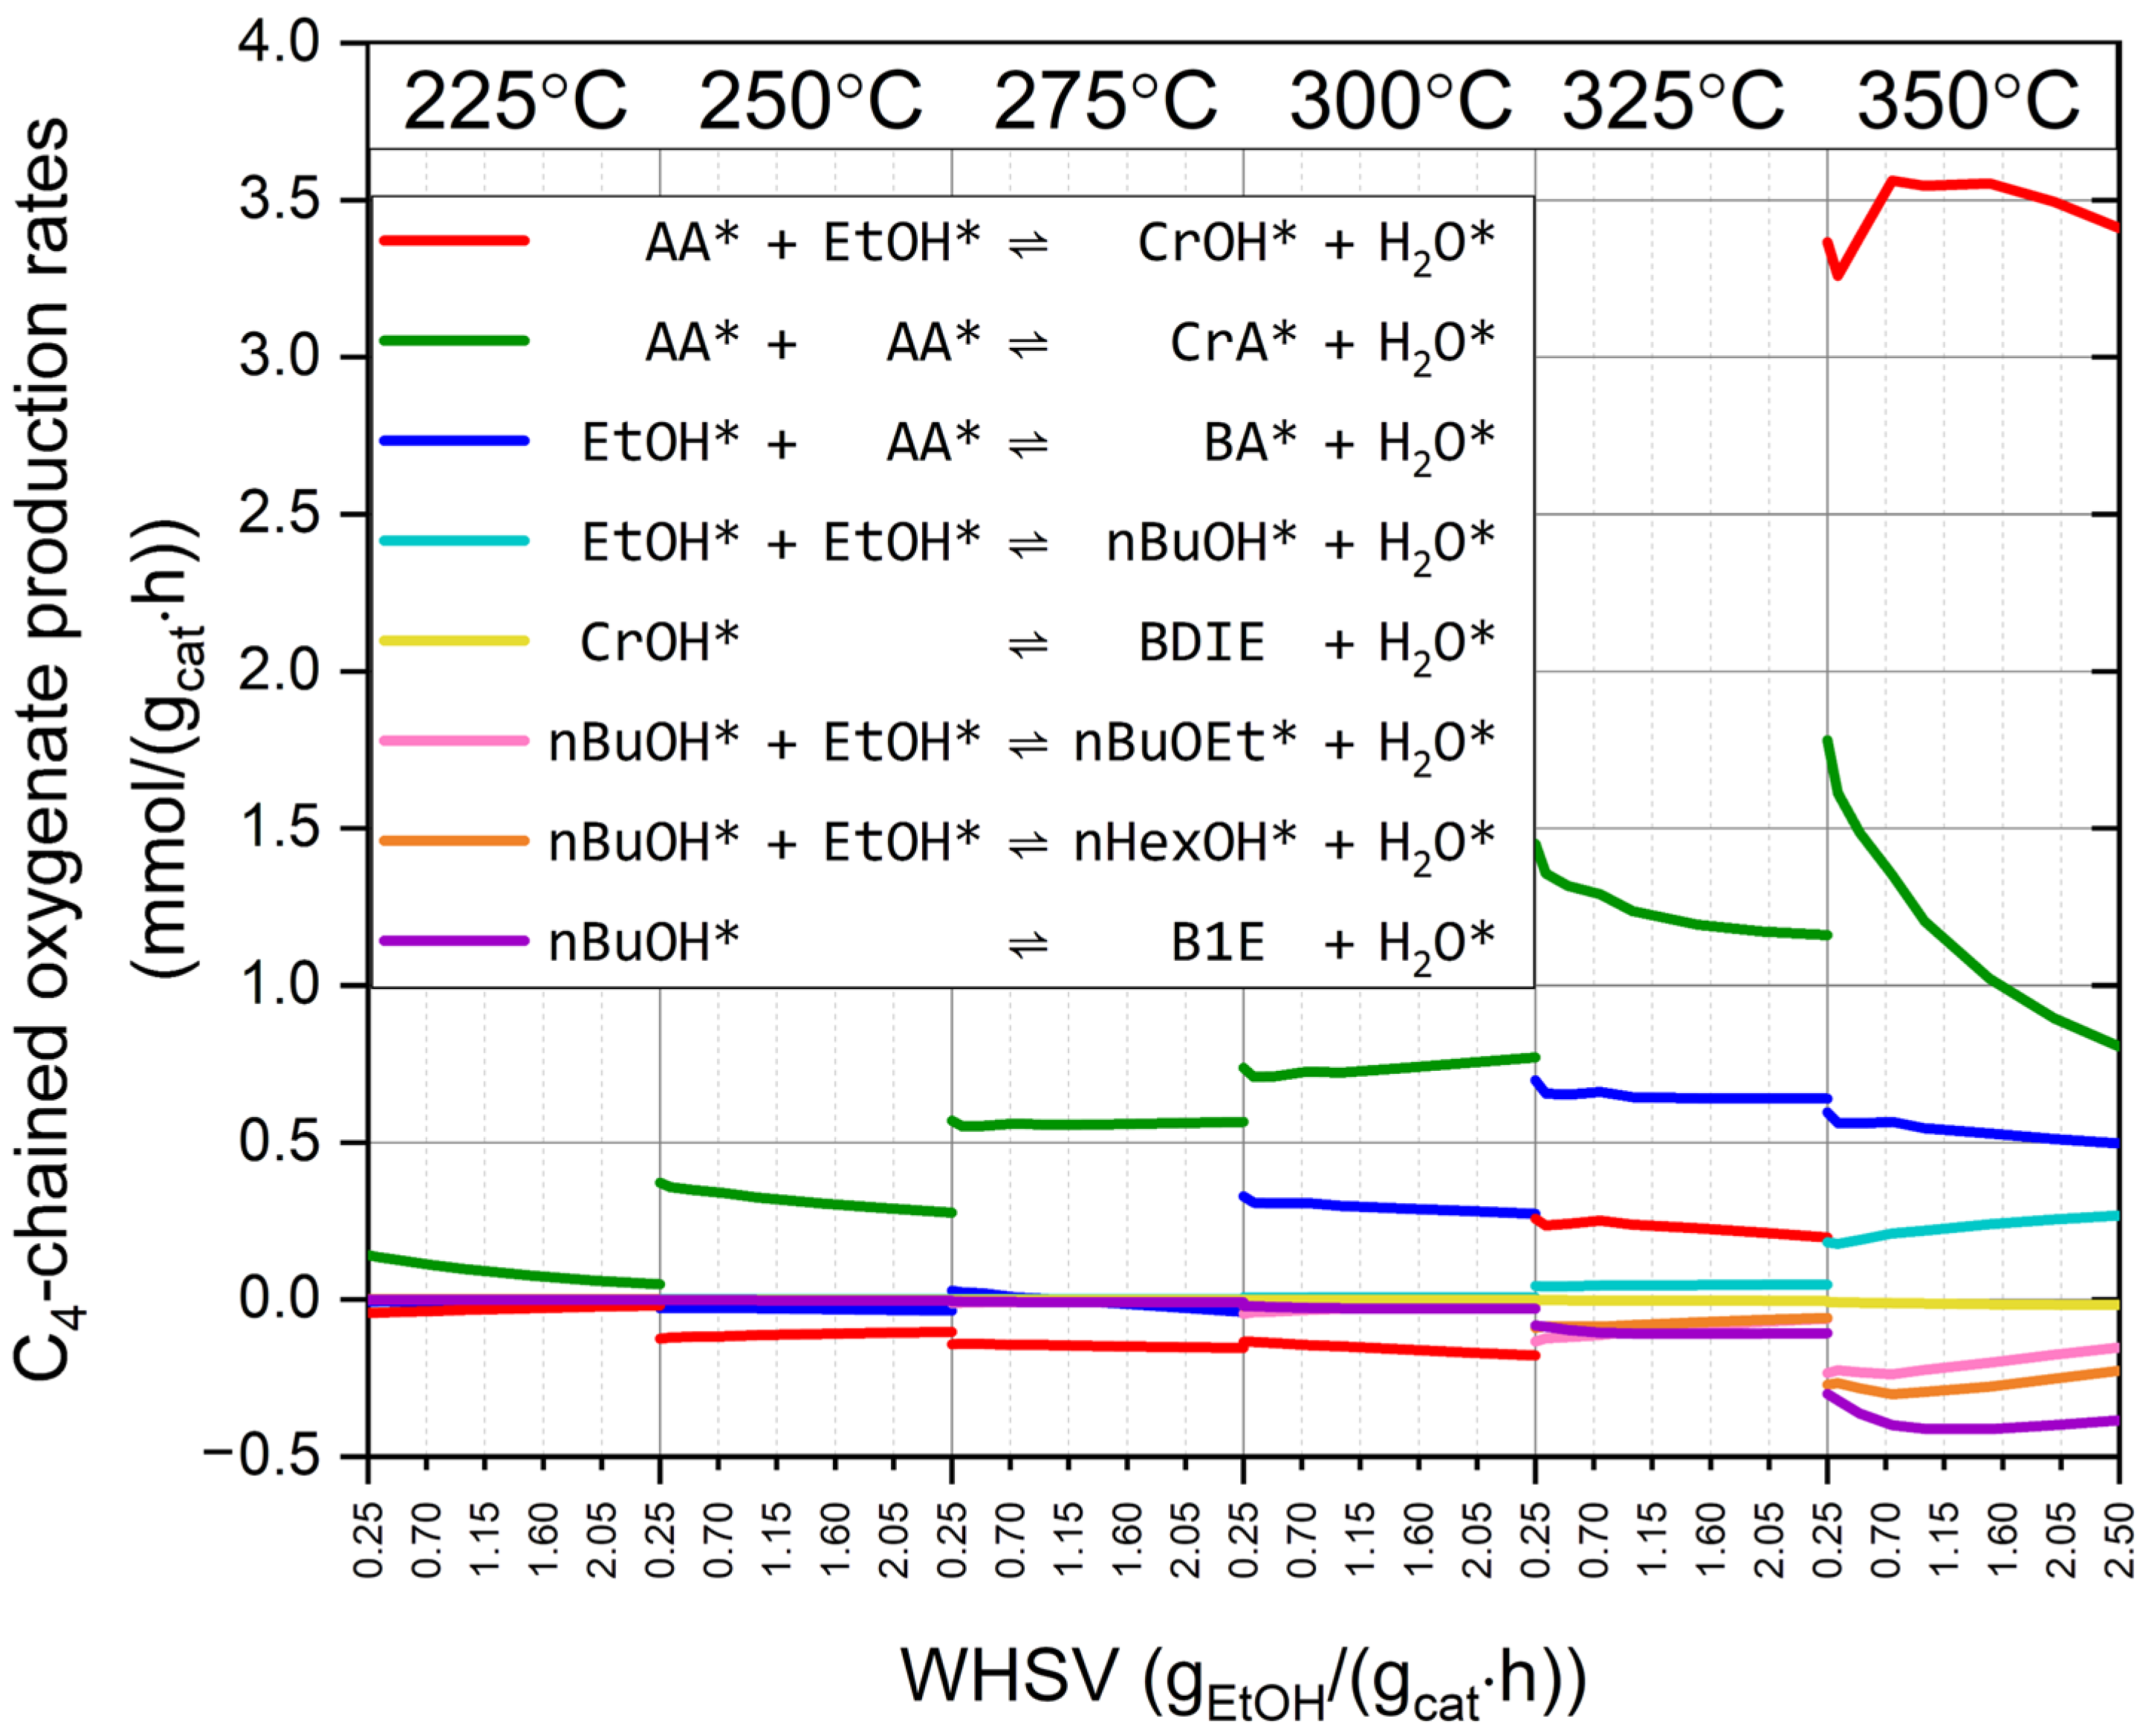
2.7. Mechanism of the Guerbet Reaction for 1-Butanol Formation

The developed model includes four different C–C coupling mechanisms of the Guerbet reaction to form C4 species from ethanol and acetaldehyde: (i) the aldol condensation pathway to form crotonaldehyde (R21: 2AA* ⇌ CrA* + H2O*), (ii) semi-direct coupling to form crotyl alcohol (R22: AA* + EtOH* ⇌ CrOH* + H2O*), (iii) semi-direct coupling to form butyraldehyde (R23: EtOH* + AA* ⇌ BA* + H2O*), and (iv) direct coupling to form 1-butanol (R24: 2EtOH* ⇌ nBuOH* + H2O*).
The main purpose of the present study was to decompose the production of C4 alcohols and aldehydes into the contribution from different channels with the help of the developed model and to determine which mechanisms dominate the production of these products as a function of temperature. These C4-chained oxygenated compounds are partially decomposed via water elimination (R19: nBuOH* ⇌ B1E + H2O*, R20: CrOH* ⇌ BDIE + H2O*) or further react via subsequent condensation reactions to form C6 products (R27: nBuOH* + EtOH* ⇌ nBuOEt* + H2O*, R25: nBuOH* + EtOH* ⇌ nHexOH* + H2O*). Furthermore, decomposition can also occur through the reverse reactions of C4-chain forming reactions (e.g., R22rev, R23rev). These C4 compounds can interconvert into each other through hydrogenation and dehydrogenation reactions (R12–13, R14–15, R16–17), and they eventually leave the reactor mainly (in 90–99 mass%) as 1-butanol. Therefore, analyzing the formation and depletion pathways of C4 alcohols and aldehydes provides direct insight into the dominant reaction mechanisms leading to 1-butanol production.
As our model showed excellent fit to the experimental data measured in the 275–325 °C temperature range, it can be used for extrapolation to lower temperatures, where the chemistry gets even simpler, and also to slightly higher temperatures, for e.g., +25 °C, wherein more side reactions occur. Figure 4 shows how the production rates and consumption rates of C4 alcohols and aldehydes via the discussed 4 + 4 channels vary in regard to the extended, 225–350 °C temperature range, as a function of the WHSV. The aldol condensation pathway is dominant in the range of 225–325 °C. The reverse reaction of the semi-direct coupling to form crotyl alcohol (R22rev: CrOH* + H2O* ⇌ AA* + EtOH*) is the main decomposition channel at temperatures of 225–300 °C. At 300 °C, the semi-direct coupling to form butyraldehyde also becomes important, alongside aldol condensation. At 325 °C, the semi-direct coupling to form crotyl alcohol starts contributing to C4 alcohol/aldehyde production at approximately 15% of the volume produced, while aldol condensation continues to dominate (accounting for 55% of production), followed by semi-direct coupling to form butyraldehyde at 30% of the volume produced. At 325 °C, the consumption reactions producing nBuOEt, nHexOH, and B1E become significant. At 350 °C, the semi-direct condensation forming crotyl alcohol becomes significantly faster than the aldol condensation and the other two coupling mechanisms. Detailed calculations in the investigated WHSV range indicate a crossover temperature of around 335–340 °C, above which semi-direct condensation leading to crotyl alcohol overtakes the aldol condensation pathway. Although direct condensation to form 1-butanol also accelerates at higher temperatures, it remains a minor pathway compared to the others.

3. Materials and Methods

3.1. Materials and Experimental Methods

3.1.1. Synthesis of MgO–Al2O3 Mixed Oxide Catalyst

The hydrotalcite (HT) precursor for the mixed oxide catalyst, with a Mg to Al molar ratio of 2:1, was synthesized using a controlled co-precipitation method [7,12,36]. An aqueous solution (400 mL) containing Mg2+ and Al3+ ions at concentrations of 1 M and 0.5 M, respectively, was prepared using Mg(NO3)2·6H2O and Al(NO3)3·9H2O (Sigma-Aldrich, Merck KGaA, Darmstadt, Germany). The solution was slowly added to 150 mL of NaOH buffer solution at a pH of 11.5, with continuous stirring, at room temperature. Simultaneously, 2 M NaOH was added dropwise to maintain the pH at about 10. The suspension was stirred at 60 °C for one hour and then left to rest overnight. The resulting solid was separated by centrifugation and washed several times with distilled water until the pH of the washing water fell below 9. The sample was dried at 70 °C for three days, and ground into a fine powder. The formation of the hydrotalcite structure and the absence of other impurity phases were confirmed using X-ray powder diffraction (XRD) analysis. The dried hydrotalcite was then heated up in an oven at a heating rate of 10 °C/min to 550 °C and then calcined at this temperature for 3 h to produce the MgO–Al2O3 mixed oxide catalyst.

3.1.2. Catalyst Characterization

The specific surface area (SSA or Aspec) of the MgO–Al2O3 catalyst samples was determined by measuring the nitrogen adsorption isotherms of the dehydrated sample (pretreated at 250 °C in high vacuum conditions at 10−6 mbar for 4h) at −196 °C, using an automatic, volumetric adsorption analyzer (The “Surfer”, Thermo-Fisher Scientific, Waltham, MA, USA). The specific surface areas of the samples were calculated from the N2 adsorption isotherms, using the Brunauer–Emmett–Teller (BET) method.
The X-ray powder diffraction (XRPD) measurements were performed using a Philips PW 1810/3710 diffractometer (Amsterdam, The Netherlands) equipped with a graphite monochromator (Cu Kα radiation, λ = 1.5418 Å) and a Anton Paar HT1200 high-temperature chamber (Graz, Austria). The XRD patterns were measured in steps of 0.02° in 2Θ and a scan time of 5 s per step. The X-ray tube was set at 40 kV and 35 mA.
The morphology of the sample was studied (TEM), using a JEOL JEM 1011 transmission electron microscope (Tokyo, Japan) equipped with a side-mounted Morada 11-megapixel camera (Olympus Soft Imaging Solutions, Münster, Germany). The sample was suspended in distilled water and drop-cast onto a 300-mesh copper grid coated with a Formvar and lacey carbon support film. The TEM image was obtained at an accelerating voltage of 80 kV.

3.1.3. Catalytic Reaction

Two grams of the catalyst sample, with a 0.5–0.8 mm size sieve fraction, was loaded into the reactor. Before the catalytic reaction, the catalyst was pretreated in situ in a helium flow (200 mL/min) at atmospheric pressure and 500 °C for 2 h to remove possible contaminants from the catalyst surface. The catalytic reaction was initiated by introducing absolute ethanol (99.95% purity) at a feeding rate of 0.5–5.0 g/h into the reactor, using a high-precision Gilson Verity 3011 HPLC pump (Middleton, WI, USA), which corresponds to a weight hourly space velocity of 0.25–2.5 gEtOH/(gcat·h). The catalytic reaction was carried out in He carrier gas. The flow rate of the He was changed to between 22.5 to 225 mL·min−1 to maintain the molar ratio of the carrier gas to ethanol at 5:1 in the feed. The experiments were carried out at a total pressure of 21 bar and in a temperature range of 275–325 °C in order to run the reaction above the critical point of ethanol (241 °C, 63 bar) and to ensure that the reaction occurred during the vapor phase. The detailed schematic and key geometric parameters of the stainless-steel tubular reactor are shown in Figure 1. The liquid products were collected and analyzed using a Shimadzu GC-2010 gas chromatograph (Shimadzu Corporation, Kyoto, Japan), equipped with a Thermal Conductivity Detector (TCD) and a Flame Ionization Detector (FID), connected in series, and a Zebron ZB-WAXplus capillary column (L 30.0 m × ID 0.32 mm × df 0.25 µm; Phenomenex, Torrance, CA, USA), every hour once the system reached a steady state (usually after 3–6 h time on stream). Note that the components in the product mixture were identified using a Shimadzu GCMS-QP-2010SE GC–MS system (Shimadzu Corporation, Kyoto, Japan), equipped with the same type of column used for the quantitative analysis. The gaseous products, including CO2, CO, and CH4, were analyzed using an HP 5890 Series II online gas chromatograph (Hewlett-Packard, Palo Alto, CA, USA), equipped with a TCD and a Carboxen® 1006 PLOT capillary column (L 30 m × ID 0.32 mm; Supelco, Bellefonte, PA, USA).
The catalytic performance was assessed based on the ethanol conversion, product yield, and selectivity of the liquid-phase product mixture, according to the respective equations ( m E t O H 0 , m E t O H : EtOH mass entering and leaving the reactor, m i : product mass):
Ethanol   conversion   =   m E t O H 0 m E t O H m E t O H 0   ×   100%
Yield   of   the   i - th   product =   m i m E t O H 0   ×   100%
Selectivity   of   the   i - th   product =   m i m E t O H 0 m E t O H   ×   100%

3.2. Reactive Sorption–Transport Model of the Flow-Through Packed-Bed Reactor

The gas flow through a fixed-bed catalytic reactor involves complex physical and chemical processes, typically modeled using conservation equations for the mass, energy, and momentum. Solving these equations in full is not needed, as significant simplifications can be made in regard to our system.

3.2.1. Energy and Momentum Balance

A description of the energy balance is not required, as the system’s temperature is externally controlled, and temperature homogeneity is only negligibly affected by minimal heat generation from viscous and turbulent flow, as well as from chemical transformations, especially considering the high dilution ratio involved (EtOH/He = 1:5) and the moderate conversions (up to 35%).
Flow takes place through the interstitial spaces between the catalyst particles, with the void fraction (ε = 0.618) denoting the fraction of the catalyst bed volume accessible to the gas flow, while the remainder is occupied by the porous catalyst. When determining the momentum balance, gravitational forces and pressure contributions become negligible in comparison to the 21-bar pressure. Frictional effects, including kinetic and viscous energy dissipation, cause a pressure drop along the packed-bed reactor, which can be estimated by the Ergun [36] equation:
d p d z = 150 η v 0 d 2 1 ε 2 ε 3 7 4 ρ v 0 2 d 1 ε ε 3
where p   represents pressure (21 bar), ρ   denotes fluid density ( ~ 5 kg/m3), v 0 is the linear flow velocity (~0.5–5 cm/s, resulting in 1–10 s contact times) of the fluid in the tube without packing (i.e., superficial gas velocity), ε is the void fraction, η is the dynamic viscosity of the fluid (~3·10−5 Pa·s), and d is the particle diameter (0.5–0.8 mm). The highest estimated pressure gradient in the reactor is –162 Pa/m, which, even if the reactor was entirely filled with the catalyst, would result in a negligible pressure drop of approximately 15 Pa over the reactor length (l = 9.1 cm). Consequently, a description of the momentum balance is not required either, and the system can be approximated as isothermal–isobaric. Given the small catalyst particle size relative to the reactor diameter (9 mm), a large number of evenly distributed channels are formed, allowing the flow field to be approximated as a plug flow, with a nearly uniform velocity profile. The gas viscosity formulas used for assessing the pressure drop along the reactor and the flow turbulence are provided in the Supplementary Materials.

3.2.2. Material Balance

The flow field is influenced by catalyst particles, causing vortices and backward fluid flow in certain areas. As fluid passes through varying gaps, it displays different speeds and path lengths, leading to the residence time distribution, called mechanical dispersion. This phenomenon occurs even in tubes without a bed under laminar flow [37], as, due to the parabolic velocity profile in the channels, the central parts of the fluid move faster than those adjacent to the catalyst particles. In the presence of an axial concentration gradient ( c i / z 0 ), this phenomenon creates a radial gradient ( c i / r 0 ), causing radial diffusion. Mechanical dispersion is described as molecular diffusion with an axial dispersion constant ( D a x , i ). In regard to turbulent flow, this constant is independent of its chemical nature, but, in regard to laminar flow, which is characteristic for our system, it depends on the substance involved and can be calculated using G. I. Taylor’s formula [37]:
D a x , i = v 2 d 2 192 D i
Here d is the characteristic diameter of the interstitial channels, as approximated according to the effective particle diameter. Mechanical dispersion and molecular diffusion can be combined into a unified axial dispersion coefficient ( D a x , i ) for each material:
D a x , i = D a x , i + D i / τ
Tortuosity ( τ ) considers the curved flow of the fluid through the catalyst bed as it moves around the particles. It quantifies the length of the fluid’s path compared to the straight-line distance along the reactor’s axis. In the case of tightly packed spherical particles, tortuosity is calculated as the ratio of half of the circumference to the diameter of the reactor’s cross-section (i.e., τ = πr/dgrain = π/2). Assuming that plug flow occurs, the (1+1)D partial differential equation in Equation (2) can be derived for the gas-phase concentration of the species. The mixture-averaged molecular diffusion coefficients, required for the simulations, were calculated using the formulas provided in the Supplementary Materials.

4. Conclusions

This study presents a comprehensive kinetic and mechanistic analysis of ethanol upgrading via catalytic C–C coupling, commonly known as the Guerbet reaction, a promising and sustainable route to produce 1-butanol, a next-generation biofuel. Despite broad interest, the microscopic mechanisms involved remain only partially understood, with multiple proposed pathways lacking clear experimental and theoretical validation. To address this, a combined experimental–kinetic modeling study was conducted. Experiments were performed in a fixed-bed reactor at 275–325 °C and 21 bar, using a MgO–Al2O3 (Mg/Al = 2) catalyst, derived from a hydrotalcite precursor. Ethanol was diluted in helium (EtOH/He = 1:5), and the WHSVs ranged from 0.25 to 2.5 gEtOH/(gcat·h).
A detailed kinetic model, developed within a one-dimensional sorption–reaction–transport framework, demonstrated strong predictive capabilities. At the highest temperature and at lower WHSVs (0.25–0.75 gEtOH/(gcat·h)), however, the experimental yields of 1-butanol and 1-hexanol stagnated, an effect not captured by the model, which overpredicted product formation. This likely results from unaccounted side reactions at high temperatures and long contact times, leading to minor products being undetected by gas chromatography. The mechanistic analysis identified the aldol condensation pathway as the dominant route in the Guerbet reaction below 335–340 °C (i.e., within the investigated WHSV range), while crotyl alcohol formation via semi-direct coupling became predominant at higher temperatures. Other proposed mechanisms, such as direct coupling and butyraldehyde formation, played only minor roles.
To further refine the understanding of these processes and optimize their performance, future research should focus on mechanistic elucidation using advanced techniques, such as operando spectroscopy and GC–MS to detect transient or minor species. Adding known intermediates to the feed could help clarify the occurrence of competing pathways. Expanding the model to include secondary reactions would improve its accuracy, especially under non-ideal conditions. Catalyst optimization, via tuning acid–base properties or adding promoters, may further enhance C4 product selectivity.
Overall, the kinetic model developed provides a robust tool for understanding and predicting Guerbet chemistry under diverse operating conditions. This work significantly advances the mechanistic insight into and modeling of ethanol upgrading and lays the groundwork for future innovations in sustainable biofuel production.

Supplementary Materials

The following supporting information can be downloaded at: https://www.mdpi.com/article/10.3390/catal15080709/s1, Table S1: A comparison of the catalysts in the literature, Table S2: Experimental data, Table S3: Properties of species, Table S4: Simulation results, Figure S1: N2 adsorption/desorption isotherm, Figure S2: XRPD patterns of hydrotalcite and the catalyst, Figure S3: TEM image of the catalyst, Figure S4: Yields of minor products. Gas-kinetic simulations. Calculation of transport properties. Methods for solving the partial differential equations. Refs. [38,39,40,41,42,43,44,45,46,47,48,49,50,51,52,53,54,55,56,57,58,59] are cited in the Supplementary Materials.

Author Contributions

Conceptualization: F.L. and T.N.; methodology: A.V., F.L. and T.N.; software: T.N.; investigation: A.M., A.V., A.B.N. and T.N.; formal analysis: A.M., A.V., A.B.N., R.B., F.L. and T.N.; writing—original draft preparation: A.M. and T.N.; writing—review and editing: A.V., A.B.N., J.V., F.L. and T.N.; visualization: A.M., A.B.N. and T.N.; supervision: A.V., F.L. and T.N.; project administration: F.L. and T.N.; funding acquisition: F.L. and T.N. All authors have read and agreed to the published version of the manuscript.

Funding

This research was co-financed by the Ministry of Innovation and Technology of Hungary from the National Research, Development and Innovation Fund under the 2019-2.1.13-TÉT_IN funding scheme (Project No. 2019-2.1.13-TÉT_IN-2020-00043), and the National Research, Development and Innovation Office, grant number FK20 134332.

Data Availability Statement

The original contributions presented in this study are included in the article/Supplementary Materials. Further inquiries can be directed to the corresponding authors.

Conflicts of Interest

The authors declare that there are no conflicts of interest.

References

  1. Schutyser, W.; Renders, T.; Van den Bosch, S.; Koelewijn, S.-F.; Beckham, G.; Sels, B.F. Chemicals from lignin: An interplay of lignocellulose fractionation, depolymerisation, and upgrading. Chem. Soc. Rev. 2018, 47, 852–908. [Google Scholar] [CrossRef]
  2. Wang, S.; Dai, G.; Yang, H.; Luo, Z. Lignocellulosic biomass pyrolysis mechanism: A state-of-the-art review. Prog. Energy Combust. Sci. 2017, 62, 33–86. [Google Scholar] [CrossRef]
  3. Jin, C.; Yao, M.; Liu, H.; Chia-fon, F.L.; Ji, J. Progress in the production and application of n-butanol as a biofuel. Renew. Sustain. Energy Rev. 2011, 15, 4080–4106. [Google Scholar] [CrossRef]
  4. Harvey, B.G.; Meylemans, H.A. The role of butanol in the development of sustainable fuel technologies. J. Chem. Technol. Biotechnol. 2011, 86, 2–9. [Google Scholar] [CrossRef]
  5. Hileman, J.I.; Stratton, R.W.; Donohoo, P.E. Energy content and alternative jet fuel viability. J. Propuls. Power 2010, 26, 1184–1196. [Google Scholar] [CrossRef]
  6. Siqueira, M.R.; Perrone, O.M.; Metzker, G.; de Oliveira Lisboa, D.C.; Thomeo, J.C.; Boscolo, M. Highly selective 1-butanol obtained from ethanol catalyzed by mixed metal oxides: Reaction optimization and catalyst structure behavior. Mol. Catal. 2019, 476, 110516. [Google Scholar] [CrossRef]
  7. Mück, J.; Kocík, J.; Hájek, M.; Tišler, Z.; Frolich, K.; Kašpárek, A. Transition metals promoting Mg-Al mixed oxides for conversion of ethanol to butanol and other valuable products: Reaction pathways. Appl. Catal. A Gen. 2021, 626, 118380. [Google Scholar] [CrossRef]
  8. Ramasamy, K.K.; Gray, M.; Job, H.; Smith, C.; Wang, Y. Tunable catalytic properties of bi-functional mixed oxides in ethanol conversion to high value compounds. Catal. Today 2016, 269, 82–87. [Google Scholar] [CrossRef]
  9. Lapuerta, M.; Rodríguez-Fernández, J.; Fernández-Rodríguez, D.; Patiño-Camino, R. Modeling viscosity of butanol and ethanol blends with diesel and biodiesel fuels. Fuel 2017, 199, 332–338. [Google Scholar] [CrossRef]
  10. Altun, S.; Oner, C.; Yasar, F.; Adin, H. Effect of n-butanol blending with a blend of diesel and biodiesel on performance and exhaust emissions of a diesel engine. Ind. Eng. Chem. Res. 2011, 50, 9425–9430. [Google Scholar] [CrossRef]
  11. Valihura, K.V.; Larina, O.V.; Kyriienko, P.I.; Yaremov, P.S.; Khalakhan, I.; Trachevskiy, V.V.; Soloviev, S.O.; Orlyk, S.M. Fast synthesis of MgO-Al2O3 systems: Effect on physicochemical characteristics and catalytic properties in Guerbet condensation of ethanol. Appl. Nanosci. 2023, 13, 6905–6918. [Google Scholar] [CrossRef]
  12. Bepari, S.; Basu, S.; Pradhan, N.C.; Dalai, A.K. Steam reforming of ethanol over cerium-promoted Ni-Mg-Al hydrotalcite catalysts. Catal. Today 2017, 291, 47–57. [Google Scholar] [CrossRef]
  13. Rubio-Rueda, J.A.; Quevedo-Hernandez, J.P.; López, M.B.; Galindo, J.F.; Hincapié-Triviño, G. Mg/Al and Cu-Mg/Al mixed oxides derived from hydrotalcites as catalysts to produce 1-butanol from ethanol. Mol. Catal. 2024, 569, 114528. [Google Scholar] [CrossRef]
  14. Palla, V.C.S.; Shee, D.; Maity, S.K. Conversion of n-butanol to gasoline range hydrocarbons, butylenes and aromatics. Appl. Catal. A Gen. 2016, 526, 28–36. [Google Scholar] [CrossRef]
  15. da Silva Trindade, W.R.; dos Santos, R.G. Review on the characteristics of butanol, its production and use as fuel in internal combustion engines. Renew. Sustain. Energy Rev. 2017, 69, 642–651. [Google Scholar] [CrossRef]
  16. Chakraborty, S.; Piszel, P.E.; Hayes, C.E.; Baker, R.T.; Jones, W.D. Highly selective formation of n-butanol from ethanol through the Guerbet process: A tandem catalytic approach. J. Am. Chem. Soc. 2015, 137, 14264–14267. [Google Scholar] [CrossRef]
  17. Nair, P.; Meenakshi, H. Review on the synthesis, performance and trends of butanol: A cleaner fuel additive for gasoline. Int. J. Ambient. Energy 2022, 43, 4207–4223. [Google Scholar] [CrossRef]
  18. García, V.; Päkkilä, J.; Ojamo, H.; Muurinen, E.; Keiski, R.L. Challenges in biobutanol production: How to improve the efficiency? Renew. Sustain. Energy Rev. 2011, 15, 964–980. [Google Scholar] [CrossRef]
  19. Veza, I.; Said, M.F.M.; Latiff, Z.A. Recent advances in butanol production by acetone-butanol-ethanol (ABE) fermentation. Biomass Bioenergy 2021, 144, 105919. [Google Scholar] [CrossRef]
  20. Xue, C.; Cheng, C. Butanol production by Clostridium. Adv. Bioenergy 2019, 4, 35–77. [Google Scholar] [CrossRef]
  21. Tian, W.; Herrera, J.E. Catalytic Relevance of Mg-Al-O Basic Centers in the Upgrade of Ethanol to n-Butanol. ChemCatChem 2024, 16, e202400225. [Google Scholar] [CrossRef]
  22. Wu, Y.; Wang, Z.; Xin, X.; Bai, F.; Xue, C. Synergetic engineering of central carbon, energy, and redox metabolisms for high butanol production and productivity by Clostridium acetobutylicum. Ind. Eng. Chem. Res. 2020, 59, 17137–17146. [Google Scholar] [CrossRef]
  23. Chistyakov, A.; Nikolaev, S.; Zharova, P.; Tsodikov, M.; Manenti, F. Linear α-alcohols production from supercritical ethanol over Cu/Al2O3 catalyst. Energy 2019, 166, 569–576. [Google Scholar] [CrossRef]
  24. Zhang, Q.; Dong, J.; Liu, Y.; Wang, Y.; Cao, Y. Towards a green bulk-scale biobutanol from bioethanol upgrading. J. Energy Chem. 2016, 25, 907–910. [Google Scholar] [CrossRef]
  25. Kozlowski, J.T.; Davis, R.J. Heterogeneous catalysts for the Guerbet coupling of alcohols. ACS Catal. 2013, 3, 1588–1600. [Google Scholar] [CrossRef]
  26. Wu, X.; Fang, G.; Tong, Y.; Jiang, D.; Liang, Z.; Leng, W.; Liu, L.; Tu, P.; Wang, H.; Ni, J. Catalytic upgrading of ethanol to n-butanol: Progress in catalyst development. Chem. Sus. Chem 2018, 11, 71–85. [Google Scholar] [CrossRef]
  27. Lovón-Quintana, J.J.; Rodriguez-Guerrero, J.K.; Valença, P.G. Carbonate hydroxyapatite as a catalyst for ethanol conversion to hydrocarbon fuels. Appl. Catal. A Gen. 2017, 542, 136–145. [Google Scholar] [CrossRef]
  28. Galadima, A.; Muraza, O. Zeolite catalysts in upgrading of bioethanol to fuels range hydrocarbons: A review. J. Ind. Eng. Chem. 2015, 31, 1–14. [Google Scholar] [CrossRef]
  29. Birky, T.W.; Kozlowski, J.T.; Davis, R.J. Isotopic transient analysis of the ethanol coupling reaction over magnesia. J. Catal. 2013, 298, 130–137. [Google Scholar] [CrossRef]
  30. León, M.; Díaz, E.; Ordóñez, S. Ethanol catalytic condensation over Mg–Al mixed oxides derived from hydrotalcites. Catal. Today 2011, 164, 436–442. [Google Scholar] [CrossRef]
  31. Marcu, I.-C.; Tanchoux, N.; Fajula, F.; Tichit, D. Catalytic conversion of ethanol into butanol over M-Mg-Al mixed oxide catalysts (M = Pd, Ag, Mn, Fe, Cu, Sm, Yb) obtained from LDH precursors. Catal. Lett. 2013, 143, 23–30. [Google Scholar] [CrossRef]
  32. Pavel, O.D.; Tichit, D.; Marcu, I.-C. Acido-basic and catalytic properties of transition-metal containing Mg–Al hydrotalcites and their corresponding mixed oxides. Appl. Clay Sci. 2012, 61, 52–58. [Google Scholar] [CrossRef]
  33. Scheid, A.J.; Barbosa-Coutinho, E.; Schwaab, M.; Salau, N.P. Mechanism and kinetic modeling of ethanol conversion to 1-butanol over Mg and Al oxide derived from hydrotalcites. Ind. Eng. Chem. Res. 2019, 58, 12981–12995. [Google Scholar] [CrossRef]
  34. Vikár, A.; Lónyi, F.; Makoye, A.; Nagy, T.; Novodárszki, G.; Barthos, R.; Szabó, B.; Valyon, J.; Mihályi, M.R.; Deka, D. Ethanol Coupling Reactions over MgO–Al2O3 Mixed Oxide-Based Catalysts for Producing Biofuel Additives. Molecules 2023, 28, 3788. [Google Scholar] [CrossRef]
  35. Goitom, S.K.; Papp, M.; Kovács, M.; Nagy, T.; Zsély, I.G.; Turányi, T.; Pál, L. Efficient numerical methods for the optimisation of large kinetic reaction mechanisms. Combust. Theory Model. 2022, 26, 1071–1097. [Google Scholar] [CrossRef]
  36. Ergun, S. Fluid flow through packed columns. Chem. Eng. Prog. 1952, 48, 89. [Google Scholar]
  37. Taylor, G.I. Dispersion of soluble matter in solvent flowing slowly through a tube. Proc. R. Soc. London Ser. A. Math. Phys. Sci. 1953, 219, 186–203. [Google Scholar] [CrossRef]
  38. Ramasamy, K.K.; Gray, M.; Job, H.; Santosa, D.; Li, X.S.; Devaraj, A.; Karkamkar, A.; Wang, Y. Role of Calcination Temperature on the Hydrotalcite Derived MgO-Al2O3 in Converting Ethanol to Butanol. Top. Catal. 2016, 59, 46–54. [Google Scholar] [CrossRef]
  39. Quesada, J.; Faba, L.; Díaz, E.; Ordóñez, S. Role of the surface intermediates in the stability of basic mixed oxides as catalyst for ethanol condensation. Appl. Catal. A Gen. 2017, 542, 271–281. [Google Scholar] [CrossRef]
  40. Scalbert, J.; Thibault-Starzyk, F.; Jacquot, R.; Morvan, D.; Meunier, F. Ethanol condensation to butanol at high temperatures over a basic heterogeneous catalyst: How relevant is acetaldehyde self-aldolization? J. Catal. 2014, 311, 28–32. [Google Scholar] [CrossRef]
  41. Ndou, A.S.; Plint, N.; Coville, N.J. Dimerisation of ethanol to butanol over solid-base catalysts. Appl. Catal. A Gen. 2003, 251, 337–345. [Google Scholar] [CrossRef]
  42. Vlasenko, N.V.; Kyriienko, P.I.; Yanushevska, O.I.; Valihura, K.V.; Soloviev, S.O.; Strizhak, P.E. The Effect of Ceria Content on the Acid–Base and Catalytic Characteristics of ZrO2–CeO2 Oxide Compositions in the Process of Ethanol to n-Butanol Condensation. Catal. Lett. 2020, 150, 234–242. [Google Scholar] [CrossRef]
  43. Tsuchida, T.; Kubo, J.; Yoshioka, T.; Sakuma, S.; Takeguchi, T.; Ueda, W. Reaction of ethanol over hydroxyapatite affected by Ca/P ratio of catalyst. J. Catal. 2008, 259, 183–189. [Google Scholar] [CrossRef]
  44. Tsuchida, T.; Sakuma, S.; Takeguchi, T.; Ueda, W. Direct synthesis of n-butanol from ethanol over nonstoichiometric hydroxyapatite. Ind. Eng. Chem. Res. 2006, 45, 8634–8642. [Google Scholar] [CrossRef]
  45. Hucal, A.M.; Tian, W.; Ascherl, P.C.; Herrera, J.E. Tuning of Acid/Base Functionalities in the MgAlO System for Ethanol Upgrade to n-Butanol. Catalysts 2024, 14, 868. [Google Scholar] [CrossRef]
  46. Portillo Crespo, M.A.; Vidal-Barrero, F.; Azancot, L.; Reina, T.R.; Campoy, M. Insights on Guerbet Reaction: Production of Biobutanol From Bioethanol Over a Mg–Al Spinel Catalyst. Front. Chem. 2022, 10, 945596. [Google Scholar] [CrossRef] [PubMed]
  47. Fuller, E.N.; Schettler, P.D.; Giddings, J.C. A new method for prediction of binary gas-phase diffusion coefficients. Ind. Eng. Chem. 1966, 58, 18–27. [Google Scholar] [CrossRef]
  48. Cox, K.R.; Chapman, W.G. The Properties of Gases and Liquids, 5th Edition By Bruce E. Poling (University of Toledo), John M. Prausnitz (University of California at Berkeley), and John P. O’Connell (University of Virginia). McGraw-Hill: New York. 2001. 768 pp. $115.00. ISBN 0-07-011682-2. J. Am. Chem. Soc. 2001, 123, 6745. [Google Scholar] [CrossRef]
  49. Stiel, L.I.; Thodos, G. The viscosity of nonpolar gases at normal pressures. AIChE J. 1961, 7, 611–615. [Google Scholar] [CrossRef]
  50. Chung, T.-H.; Ajlan, M.; Lee, L.L.; Starling, K.E.; Ajlan, M. Generalized Multiparameter Correlation for Nonpolar and Polar Fluid Transport Properties. Ind. Eng. Chem. Res. 1988, 27, 671–679. [Google Scholar] [CrossRef]
  51. Neufeld, P.D.; Janzen, A.R.; Aziz, R.A. Empirical equations to calculate 16 of the transport collision integrals Ω(l,8)* for the lennard-jones (12-6) potential. J. Chem. Phys. 1972, 57, 1100–1102. [Google Scholar] [CrossRef]
  52. Pitzer, K.S. The Volumetric and Thermodynamic Properties of Fluids. I. Theoretical Basis and Virial Coefficients. J. Am. Chem. Soc. 1955, 77, 3427–3433. [Google Scholar] [CrossRef]
  53. Pitzer, K.S.; Lippmann, D.Z.; Curl, R.F.; Huggins, C.M.; Petersen, D.E. The Volumetric and Thermodynamic Properties of Fluids. II. Compressibility Factor, Vapor Pressure and Entropy of Vaporization. J. Am. Chem. Soc. 1955, 77, 3433–3440. [Google Scholar] [CrossRef]
  54. Joback, K.G.; Reid, R.C. Estimation of Pure-Component Properties from Group-Contributions. Chem. Eng. Commun. 1987, 57, 233–243. [Google Scholar] [CrossRef]
  55. Wilke, C.R.; Chang, P. Correlation of diffusion coefficients in dilute solutions. AIChE J. 1955, 1, 264–270. [Google Scholar] [CrossRef]
  56. Abdulla, T.J.; Cash, J.R.; Diamantakis, M.T. An MEBDF package for the numerical solution of large sparse systems of stiff initial value problems. Comput. Math. Appl. 2001, 42, 121–129. [Google Scholar] [CrossRef]
  57. Sarathy, S.M.; Oßwald, P.; Hansen, N.; Kohse-Höinghaus, K. Alcohol combustion chemistry. Prog. Energy Combust. Sci. 2014, 44, 40–102. [Google Scholar] [CrossRef]
  58. Sakai, Y.; Herzler, J.; Werler, M.; Schulz, C.; Fikri, M. A quantum chemical and kinetics modeling study on the autoignition mechanism of diethyl ether. Proc. Combust. Inst. 2017, 36, 195–202. [Google Scholar] [CrossRef]
  59. Goodwin, D.G.; Moffat, H.K.; Schoegl, I.; Speth, R.L.; Weber, B.W. Cantera: An Object-oriented Software Toolkit for Chemical Kinetics, Thermodynamics, and Transport Processes 2022. Available online: https://zenodo.org/records/6387882 (accessed on 20 July 2025).
Scheme 1. Alternative mechanisms proposed in the literature for the Guerbet reaction, converting ethanol into 1-butanol. When ethanol acts as the hydrogenating agent, it forms acetaldehyde.
Catalysts 15 00709 sch001
Figure 1. Schematic diagram of the fixed-bed reactor.
Catalysts 15 00709 g001
Figure 2. Experimental data (symbols with ±2σ error bars) and model simulation results (curves) for ethanol conversion and product yields for major liquid products as a function of the weight hourly space velocity (WHSV) at three different temperatures. The yellow-shaded regions at low WHSVs highlight the largest discrepancies between the model predictions and the experimental data, where the measurements also show significant uncertainties and non-systematic variations in regard to the WHSV, suggesting potential experimental issues.
Catalysts 15 00709 g002
Figure 3. Steady-state mass fraction of species during the gas phase along the 4.74 cm long catalyst bed at the extremes of the investigated temperatures and WHSVs. C2, C4, and C6 species are plotted with solid, dashed, and dotted lines, respectively. Alcohols (red), aldehydes (blue), ethers (purple), alkenes (green), hydrogen and water (orange) are shown with different colors. Note, the mass fractions of the product yields are shown according to the logarithmic scale, whereas there is a scale break between 20 and 60 mass% and above that the conversion of ethanol is presented according to a linear scale.
Catalysts 15 00709 g003
Figure 4. Model predicted reactor-averaged production and consumption rates of C4-chained oxygenated species by four C2–C2 coupling reaction and four decomposition channels. Note the model was fitted to experimental data measured in the 275–325 °C temperature range.
Catalysts 15 00709 g004
Table 1. Properties of the reactor and the catalyst.
PropertyValuePropertyValue
Reactor length (l)9.1 cmSpecific pore volume (Vspec)0.25 cm3/g
Catalyst bed length (lbed)4.74 cmSpecific surface area (Aspec)218 m2/g
Reactor diameter (d)9.00 mmCrystal density (ρcryst)3.3 g/cm3
Thermocouple diameter (dTC)2.40 mmVolume density (ρvol)0.69 g/cm3
Reduced eff. diameter (dred)8.67 mmGrain density (ρgrain)1.81 g/cm3
Catalyst bed cross-section (A)0.590 cm2Crystal volume (Vcryst)0.606 cm3
Catalyst volume (V)2.91 cm3Pore volume (Vpore)0.506 cm3
Catalyst mass (mcat)2.00 gVoid volume (Vvoid)1.798 cm3
Grain diameter (dgrain)0.5–0.8 mmVoid fraction ( ε )0.618
Table 2. Species involved in the proposed reaction mechanism.
#Short
Notation
Product
Phase 1
NameGroup FormulaClass
Formula
1HeGheliumHe
2H2GhydrogenH2
3H2OLwaterH2O
4EtOHLethanolC2H5OHROH
5nBuOHL1-butanolnC4H9OH
6nHexOHL1-hexanolnC6H13OH
7CrOHLcrotyl alcoholCH3CH=CHCH2OH
8AALacetaldehydeCH3CHORCHO
9CrALcrotonaldehydeCH3CH=CHCHO
10BALbutyraldehydeCH3CH2CH2CHO
11Et2OLdiethyl etherC2H5OC2H5R1OR2
12nBuOEtLn-butyl ethyl ethernC4H9OC2H5
13C2H4GethyleneCH2=CH2RC2H3
14B1EGbut-1-eneCH2=CHCH2CH3
15BDIEGbut-1,3-dieneCH2=CHCH=CH2
1 Product phase that contains the species at room temperature (G: gas, L: liquid).
Table 3. Coupled sorption–reaction kinetics model, with optimized Arrhenius parameters. Please pay attention to the table footnotes, which helps to interpret the reactions.
#Reactionslog10 kfor
(cm,s,mol)
nfor4
(z)
Efor/R (K)log10 krev
(cm,s,mol)
Erev/R (K)
S1H2O+* H2O * −0.1830.510,6870.38421,483
S2–5ROH+* ROH * 5.00799272.65710,984
S6–8RCHO+* RCHO * 3.84726,9802.2468511
S9–10R1OR2+* R1OR2 * 4.15717,6462.53117,426
1 R11–13RCH2OH * RCHO *+H20.044029.6856
2 R14–15RCHO *+C2H5OH * RCH2OH *+CH3CHO *10.31629,9956.8261070
3 R16–17nC3H5X *+C2H5OH * nC3H7X *+CH3CHO *9.67598575.75224,926
1 R18–20RC2H4OH * RC2H3+H2O *2.37518427.4336359
R21AA *+AA * CrA *+H2O *12.453257.4342398
R22AA *+EtOH * CrOH *+H2O *9.94430,0009.41023,775
R23EtOH *+AA * BA *+H2O *9.38448.35773
R24EtOH *+EtOH * nBuOH *+H2O *5.38029,8224.02320,025
R25nBuOH *+EtOH * nHexOH *+H2O *7.38012,9648.06216,396
R26EtOH *+EtOH Et2O *+H2O *8.18925469.77810,303
R27nBuOH *+EtOH * nBuOEt *+H2O *7.59918.76611,444
1 Considered only for EtOH, nBuOH, and CrOH, as no hexanal product was observed. 2 Considered only for CrA and BA, as there was no effective chemical change in regard to AA. 3 Considered only for CrOH (X=CH2OH) and CrA (X=CHO), as they were the only two to have a double bond. 4 Temperature exponents (n) were not optimized: its value was 0.5 for adsorption, and 0 for other steps. * Adsorbed species.
Disclaimer/Publisher’s Note: The statements, opinions and data contained in all publications are solely those of the individual author(s) and contributor(s) and not of MDPI and/or the editor(s). MDPI and/or the editor(s) disclaim responsibility for any injury to people or property resulting from any ideas, methods, instructions or products referred to in the content.

