Article

Efficiency of the Electrocatalytic Nitrate Reduction to Ammonia: Do the Surface Nanostructures Play an Essential Role?

1
Department of Chemistry, Lomonosov Moscow State University, Moscow 119991, Russia
2
N.D. Zelinsky Institute of Organic Chemistry, Russian Academy of Sciences, Leninsky Prospect 47, Moscow 119991, Russia
*
Authors to whom correspondence should be addressed.
Catalysts 2025, 15(7), 666; https://doi.org/10.3390/catal15070666
Submission received: 18 May 2025 / Revised: 28 June 2025 / Accepted: 4 July 2025 / Published: 8 July 2025

Abstract

The degradation of electrochemical materials during energy conversion and storage, in particular the electrocatalyst materials, is becoming increasingly important. The selection and design of sustainable materials is an important task. This work examines the synthesis, characterization, and application of an electrocatalyst (based on an amorphous alloy Co75Si15Fe5Cr4.5) having a structured surface in the form of nanocells for a “green” nitrate reduction reaction (NO3RR), which can serve as an alternative to the well-known Haber-Bosch process for the synthesis of ammonia. The material for the electrocatalyst was obtained by anodizing the alloy in the ionic liquid BmimNTf2 and characterized by using a combination of modern physicochemical and electrochemical methods. The Faradaic efficiency (FE) for the nanocell catalyst exceeds by more than three-fold and seven-fold catalyst with a polished surface and the initial catalyst having a natural oxide on the surface, respectively. A mechanism of this reaction on the studied electrocatalysts with structured and non-structured surfaces is proposed. It is mentioned that the nanocell electrocatalyst is an extremely stable material that passes all tests without visible changes. The authors consider their work as a starting point for the application of a nanostructured Co-electrocatalyst in NO3RR.

Graphical Abstract

1. Introduction

The conversion of nitrate ions (NO3) contained in groundwater or industrial wastewater to NH3 in an electrocatalytic system is very attractive from both environmental and sustainable development points of view [1,2,3]. There are two possible ways to utilize ammonia as an energy source: catalytic cracking or its direct use in fuel cells [4]. The second method has obvious advantages because the electrocatalytic system is not only energy consuming but also energy producing at the same time [5]. Zn-NO2 and Zn-NO3 batteries operating as electrocatalytic systems can produce NH3 by renewable energy resources while reducing NO2 and NO3 and simultaneously generating electricity [5,6,7,8]. Optimization is mainly related to the development and engineering of low-cost electrocatalysts, such as nanoparticle-assembled carbon-doped cobalt oxide (C/Co3O4) hollow nanotubes [5], Fe@C-900 cathodes [6], metal Cu, Ni alloy-functionalized 3D-printed electrodes [7], and IrNiCu@Cu nanostructures [8].
The electrocatalyst plays one of the key roles in improving the efficiency of nitrate-ion electroreduction (NO3RR) and should meet the following criteria: provide high selectivity, yield rate, and Faradaic efficiency (FE) for ammonia, stability, and long-term performance. The influence of the side hydrogen evolution reaction (HER) can be effectively reduced by using Cu, Co, Ti, and single-atom catalysts [1,2,8,9,10,11]. The diminution of the yield of NO3RR intermediates (NO2, NO, N2O, N2O, NH2OH, N2) and improvement of energy efficiency are achieved by rational design of catalysts in the form of alloys [3,8,12] and amorphous metals [13], with selection of different crystallographic facets [8,10,11]. The formation of various nanostructures, nanoclusters [1,11,13], molecular catalysts [14], and single-atom catalysts [10,15,16] on the surface has a significant effect. Good results have been achieved using metal oxides due to the variety of oxidation states of transition metals [17] and the selection of a carrier (substrate) [6,7,16,18,19]. It should be noted that native oxide on the electrode surface can prevent the efficient performance of NO3RR [10]. In bimetallic catalysts, doping with another metal can change the electronic structure of the catalyst and create more active centers to improve the catalytic activity [15,20,21,22,23].
All of the above approaches, to some extent, establish a connection between the properties of electrocatalysts and the structure. Various strategies of structure control and surface modification are used to improve catalytic properties. Nanostructures on the surface of solids can significantly modify the physical properties of the surface and increase its durability, strength, and corrosion resistance [24]. Electrochemical methods of surface modification can be realized both in the cathodic version (bimetallic catalysts [20,21,23]) and by anodization [24]. Various oxide nanostructures, including nanorolls [25] and others [26], are obtained by anodization of the transition metal surface. Nanostructures (cells) are formed on the catalyst surface in the presence of native oxide [24]. It is reasonable to use ionic liquids (ILs) as electrolytes for anodization because they avoid the use of environmentally unsafe fluorine-containing solutions [24,25]. Two-dimensional (2D) materials and hexagonal nanocells with a large aspect ratio due to rational control of physical and chemical properties attract more and more attention from researchers [3,24,27].
Cobalt-based electrocatalysts show high yield and conversion rate of nitrate to ammonia. Cobalt-copper (Co1-xCux) nanoparticles supported on a three-dimensional substrate show high FE of about 95% at −0.03 V [2]. To evaluate the influence of the electronic structure on NO3RR catalytic activity, MSn (M = Fe, Co, Ni) alloys were investigated. The introduction of tin can regulate the charge distribution and thus influence the catalytic activity [23]. The highest ammonia yield and FE of 81.5% at −0.6 V compared to other alloys was obtained for CoSn-CNF (carbon nanofiber). The bimetallic Fe(5 min)@Co(30 min)/C catalyst [21] showed an FE of 58.2% for E = −0.785 V, which is higher than that of Fe(5 min)/C and Co(30 min)/C. A high FE of 95.5% at −0.85 V was demonstrated by the tandem of single atom Fe sites (FeSA) with Fe nanoparticles (FeNP) [16]. The authors explain this effect by the different roles of the catalyst components.
Single-atom Fe sites are responsible for the adsorption of nitrate ions, and Fe-NPs enhance water adsorption. The activity of catalyst electrodes is associated with the presence of oxidized forms of metals on the surface; in particular, it is Co3O4 for cobalt materials [21,28]. For this reason, much attention is paid to the study of the catalytic properties of oxides. Thus, the activity of Co3O4 in NO3RR depends largely on the type of cobalt centers (octahedral or tetrahedral) and the presence of O-vacancies. The octahedral centers are preferred [29]. The activity of Bi12.24Co30.8O40 oxide is 1.5~7.8 times higher than that of commercial Bi2O3 and Co3O4 [22]. The authors suggest that BiO, oxygen vacancies, and amorphous Co3O4 play a key role in the electroreduction of nitrate. A Bifunctional Co/CoO catalyst deposited on nickel foil (Co@CoO/NF) adsorbs water on Co and NO3 on CoO, providing enough protons for NO3 hydrogenation and suppressing competitive hydrogen evolution [30].
A tandem of Fe2O3 iron oxide nanoparticles deposited on an atomically dispersed metal-nitrogen-carbon (Fe-N-C) support demonstrated FE ≈ 100% in a wide range of potentials (−0.4–−1.2 V) at current densities up to 2 A cm−2 [18]. The authors attribute the high activity to pretreatment at E = −1.5 V for 90 s, which leads to partial reduction of Fe3+ to Fe0.
For the reduction of nitrogen to ammonia in a neutral medium, the amorphous PdCoM alloys (M = Cu, Ag, Fe, Mo) in the form of nanosheets (NS) with an ultrathin porous structure were synthesized [31]. PdCoCu NSs exhibit excellent activity at low overpotentials with an NH3 yield of 60.68 µg h−1 mgcat−1 and a corresponding Faradaic efficiency of 42.93% at −0.05 V.
Progress in the use of amorphous catalyst electrodes is due to their advantages over crystalline ones: the absence of a long-range order, as well as the ability to easily vary the composition by introducing heteroatoms. This leads to an increase in the catalytic activity due to an increase in the number of the active sites. The amorphous alloys have a greater corrosion resistance due to the absence of grain boundaries and crystal lattice defects. Finally, less expensive and more common precursors, combined with numerous production methods, provide a lower cost of amorphous alloys [32]. The factors of the electronic structure and surface acid-base properties that affect the catalytic reactions of amorphous catalysts can be controlled by surface modification [31,33].
In addition to rational catalyst design, a magnetic field was used to increase the efficiency of electroreduction [34], which led to a twofold increase in the reaction rate. The FE and ammonia yield rate on RuIn3/C increased by 1.5–2 times depending on the applied potential by the pulse electrolysis method, in which the applied potential/current is periodically changed [35].
The aim of this work was to identify as well as determine and show the effect of a nanostructure in the form of “hexagonal” nanocells obtained on the surface of amorphous Co75Si15Fe5Cr4.5 alloy by anodization in IL 1-butyl-3-methylimidazolium bis(trifluoromethylsulfonyl)imide on the electrocatalytic activity in the NO3RR reaction in neutral media using a dilute nitrate ion solution.

2. Results and Discussion

2.1. Samples and SEM Characterization

Three types of electrocatalysts were used in the work, which are based on an amorphous alloy, Co75Si15Fe5Cr4.5: an initial sample coated with natural oxide, a polished sample with the oxide removed by mechanical treatment, and an anodized sample containing “hexagonal” structures in the form of nanocells on its surface (synthesis description in the Experimental section). Figure 1 shows two types of samples (there are no visually significant differences between the natural oxide-coated (Figure 1a) and the polished sample; that is why it is not shown here).
The authors synthesized this type of nanostructure by electrochemical anodizing of the surface of metals and alloys in their previous studies [24,25,26,36,37]. Not only were the production features shown, but also the properties and composition, as well as some potential applications. In this paper, for the first time, an attempt is made to use structured “hexagonal” nanocells as an integral part of an electrocatalyst in the “green” reaction of NO3RR.
Nanocells are “hexagonal” nanostructures (the shape is not always a regular hexagon) with a variable size of 60–80 nm (Figure 1b,c). The synthesis features are described in the following subsection.

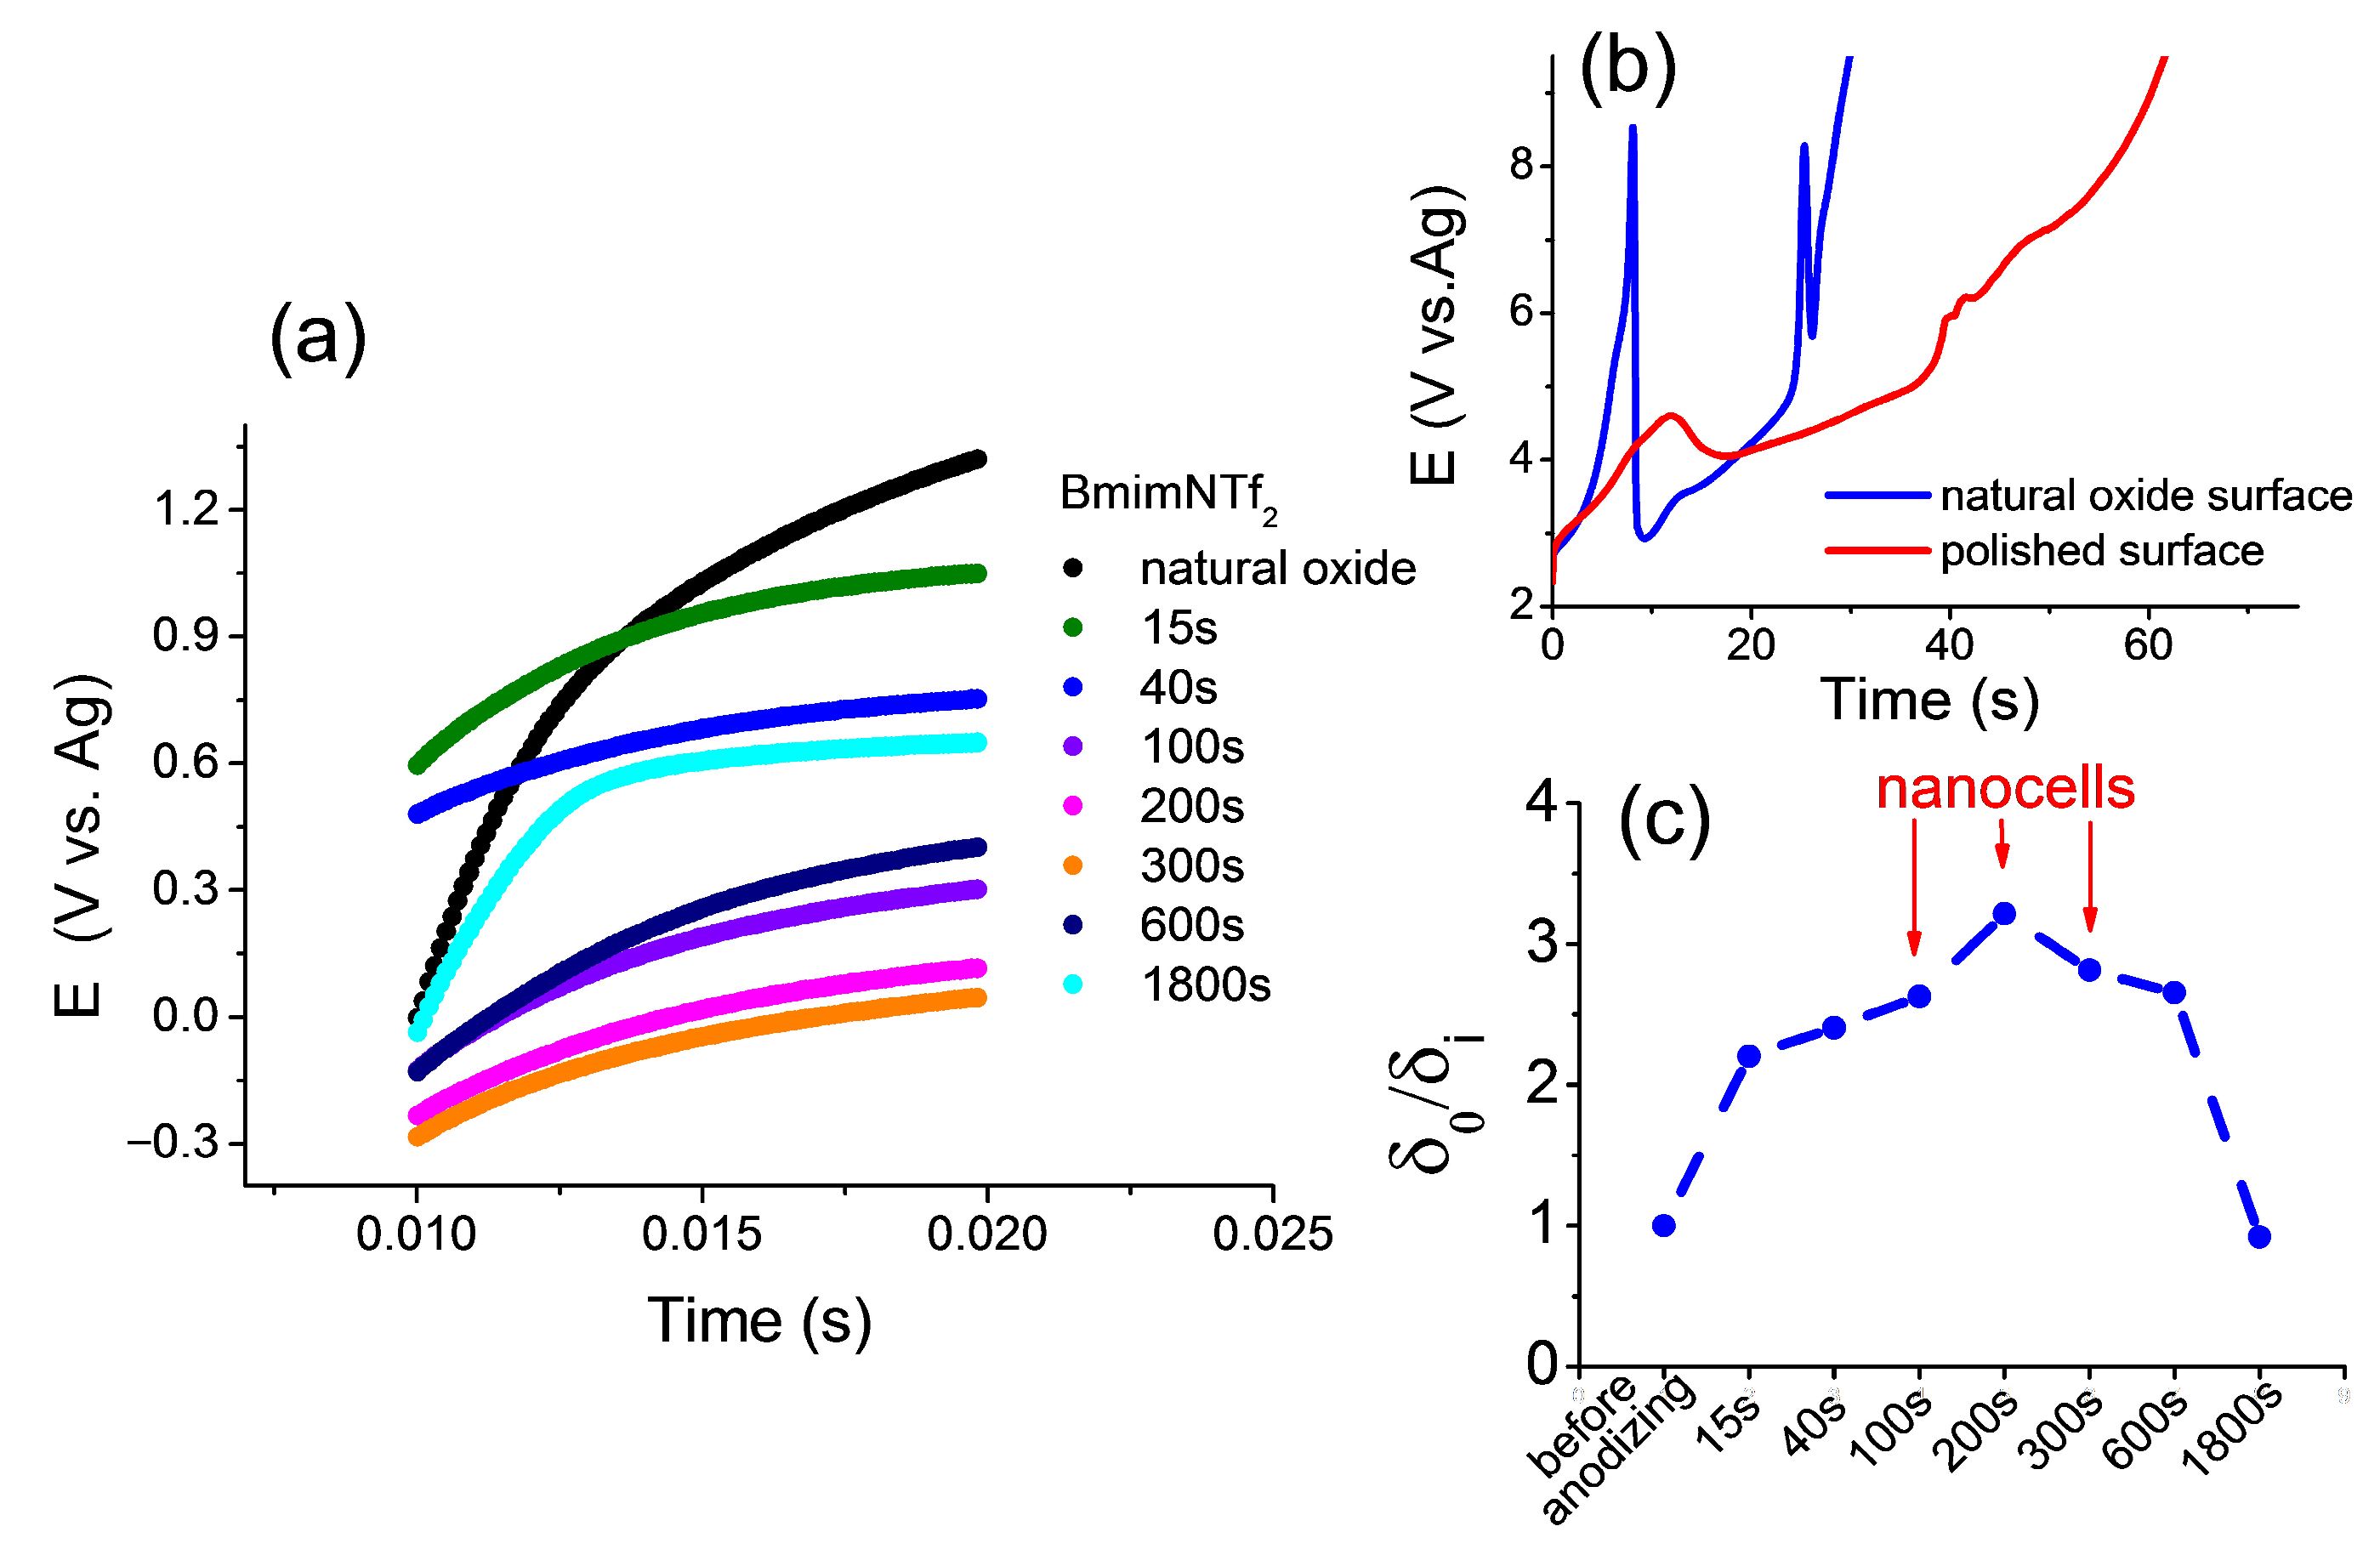
2.2. Microsecond Transients

This simple method makes it possible to determine the effect of the surface oxide thickness on the conditions for the appearance and synthesis of nanocells. Microsecond transients are obtained according to the procedure (Section 3.6, electrochemical experiments, and [25]) and presented in Figure 2a.
Slower transients (Figure 2b) demonstrate a change in the potential over time during the synthesis of nanocells for a sample with natural oxide and for a sample subjected to mechanical treatment to remove the oxide layer. The potential scale for the ground sample is clearly visible due to rapid overgrowth with phase oxide and loss of conductivity. The sample with natural oxide shows a slow growth of the potential, which creates excellent conditions for obtaining nanocells. At the same time, cells are easily synthesized on the surface of a sample with natural oxide for an interval of 100–300 s, as shown in Figure 2c. The time up to 100 s is clearly insufficient for the formation of nanocells, and after 300 s, phase oxide overgrowth also occurs, as in the case of a polished sample. In other words, optimal conditions for the synthesis of nanocells in the range of 100300 s were found.

2.3. XPS Characterization

In Figure 3, the overview spectrum (Figure 3a) is shown, indicating the presence of Co, Fe, Si, Cr, and O, as well as high-resolution spectra in the O 1s, Si 2p, Cr 2p, Fe 2p, and Co 2p regions. The high-resolution spectra were deconvoluted into components corresponding to different atomic states (Figure 3b–f).
It should be noted that in our samples, Co on the surface is present either in a metallic form (Co(0)) or in the form of Co2+ (CoO). According to a large number of literature sources (for example, modern works [38,39]), cobalt exhibits the highest catalytic activity in the oxidation state of Co3+. First of all, this is due not only to the valence state but also to the fact that Co3O4 oxide has a large number of dislocations and defects in its structure. However, the CoO present on the surface of the cell sample is almost twice as catalytically active as the initial sample. This fact is discussed in more detail below.
The concentrations of elements on the surface (at.%) for the two samples are shown in Table 1 in the first two rows. Further, the content of elements in the nanocells sample was normalized relative to the content of elements in the initial natural oxide sample (the next two middle rows). It is easy to see here that the nanocell sample is noticeably depleted after anodization, which served for the synthesis of this sample. At the same time, it should be noted that the concentration of Co has practically increased. This is clearly seen from the last row of the table, which represents normalization already relative to the Co content.
The purpose of such normalization is to help to see that, with the increased concentration of Co, the remaining components in the nanocells sample became significantly less than in the natural oxide sample. Obviously, based on the XPS analysis, it can be assumed that in the nano cells sample, these nanostructures themselves are present in the form of cobalt (II) oxide, CoO.
The FE values should not be very high, since the remaining form of Co2+ has much lower catalytic activity in NO3RR [30]. Thus, the results of electrochemical analysis, such as the polarization curves of linear voltammetry, chronoamperometry, etc., as well as X-ray spectroscopy, confirm this fact below.
It should be noted here that in this case the XPS technique is optimal. A surface-sensitive spectroscopic technique, XPS, yields the chemical and electronic states of the elements within the surface region of the sample. The XPS depth resolution is 5–10 nm, which gives a more accurate estimate and is also exhaustive in the case of studying the surface of catalysts.

2.4. Diffuse Reflectance Spectroscopy and XRD Characterization

In Figure 4a, the spectrum of diffuse reflectance of the surface of samples containing natural oxide and after anodizing in IL for 200 s is shown. For comparison, individual powders (standards) for the metal oxides composing the studied alloy are given. The closest spectrum is characteristic of Co3O4 (band at λ = 240 nm), which includes CoO. The spectra of only two samples are additionally shown separately (Figure 4b). Low intensity or their absence in the wavelength range after λ = 350 nm for a sample with nanocells may indicate depletion of other elements compared to cobalt, as has already been observed in XP spectra.
As can be seen from the X-ray diffraction image (Figure 4c), the sample with natural oxide does not contain clear reflexes, which confirms its amorphous state. On the contrary, the sample with nanocells has a blurred peak from about 17 to 23 2 Theta. Consequently, the nanocells give the sample a more crystalline character while generally maintaining the amorphous state. XRD crystallite (grain) size according to the Scherrer formula is 1.4 nm. It can be assumed that such a surface also contains defects and dislocations in the crystal lattice and, consequently a greater number of active centers that increase catalytic activity compared to a sample with a natural oxide. Confirmation of our assumption is provided in the following sections of this paper.

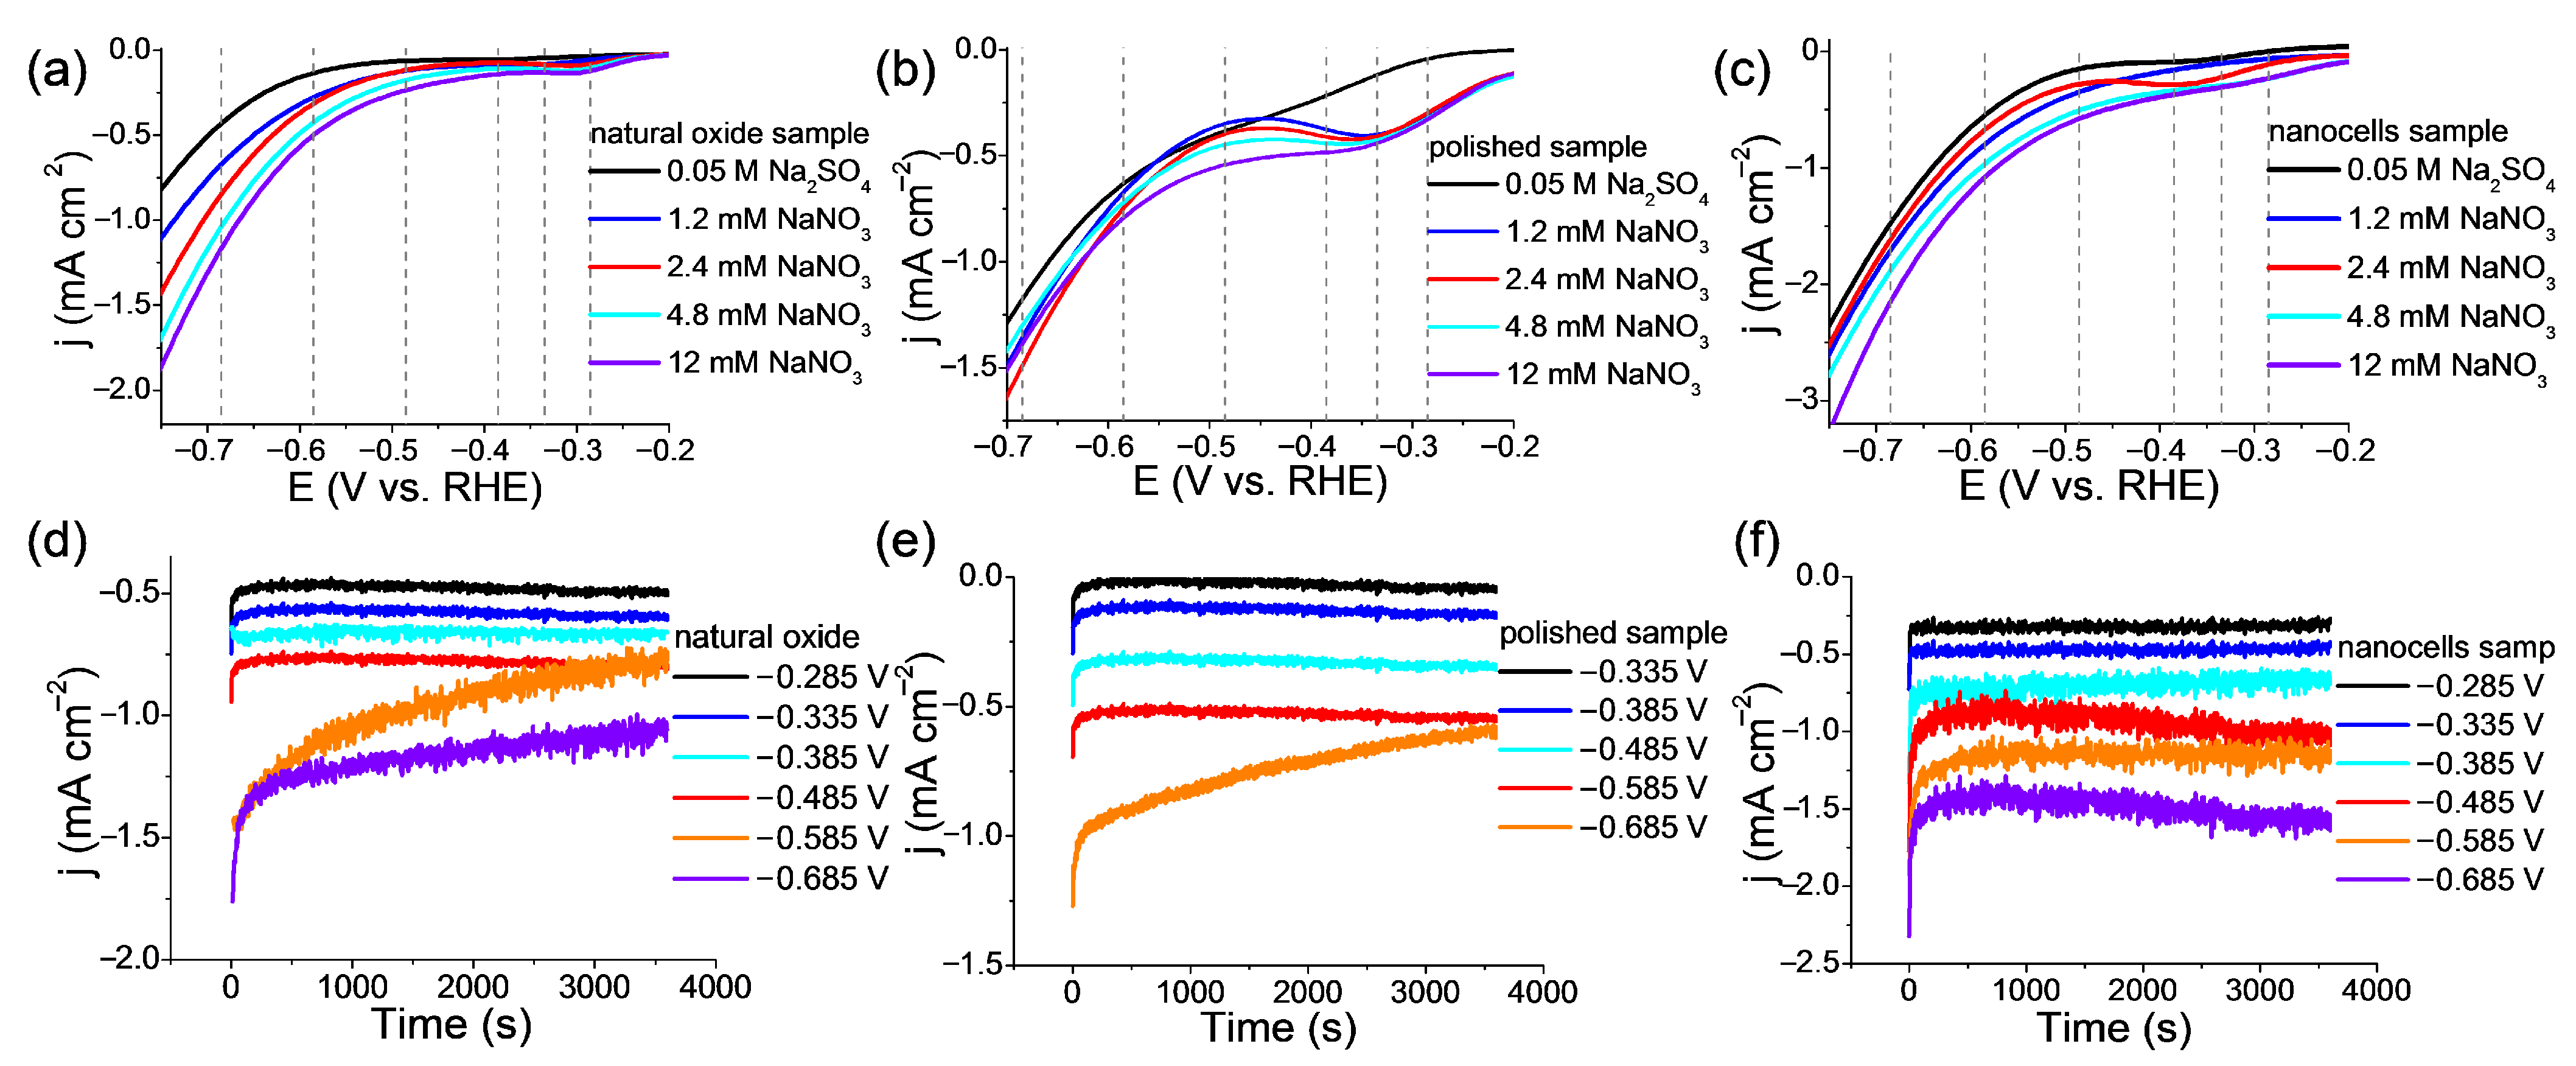
2.5. Linear Voltammograms (LVs) and Chronoamperometry (CA): Determination of Optimal Conditions of Synthesis and Carrying out NO3RR

LVs are used here to find the best potential for ammonia synthesis. Figure 5a–c demonstrates the voltammograms obtained at different nitrate concentrations, including the background curve in the absence of nitrate, for all three samples using a neutral electrolyte (0.05 M Na2SO4). For almost all concentrations and all samples, the peak (E ≈ −0.35 V) is clearly visible, which can be associated with the reduction of nitrate to ammonia. The following subsection shows that it is at this value of the reduction potential, the largest values of FE are obtained. Further to the cathode side, an increase in the current density (E ≈ −0.50 V) is observed, associated with the beginning of the hydrogen evolution reaction (HER). Obviously, in the presence of such a strong competitive reaction, the target nitrate reduction reaction may not proceed to the target product, i.e., ammonia, but end with incomplete reduction products, i.e., N2, N2H2, or NO2 [40,41]. It is clearly seen that the current density for almost the entire LVs curve, that is, at all potentials, is the highest for a sample with nanocells compared to the other two samples. Thus, a catalyst with nanocells is more efficient.
For synthesis at a constant potential of NO3RR (exposure = 1 h), a concentration of 1.2 m NaNO3 was chosen since (1) it usually does not exceed the concentration of nitrate ions contained in groundwater or industrial wastewater, and (2) the increase in the current density with the penultimate step of increasing the concentration is not too large. Figure 5d–f shows chronoamperometric curves corresponding to the values of the potentials selected in LsV studies for all three catalyst samples. The selected potential values range from the two-layer (non-Faradaic) region to the practical start of hydrogen gas evolution. The kinetics of NO3RR is close to zero at lower potential values, and at higher ones, the side reaction of hydrogen evolution (HER) begins to significantly increase. The NO3RR reaction time should be sufficient for the spectrophotometric determination of ammonia, and it was chosen in accordance with a large number of literature data, including the works of the authors [21]. The UV-vis spectra corresponding to the concentration of ammonia synthesized in the NO3RR process are discussed below; it should also be mentioned here the acceptable choice of the potential range, where the optimum is almost in the middle (E = −0.385–−0.485 V) of the studied values.

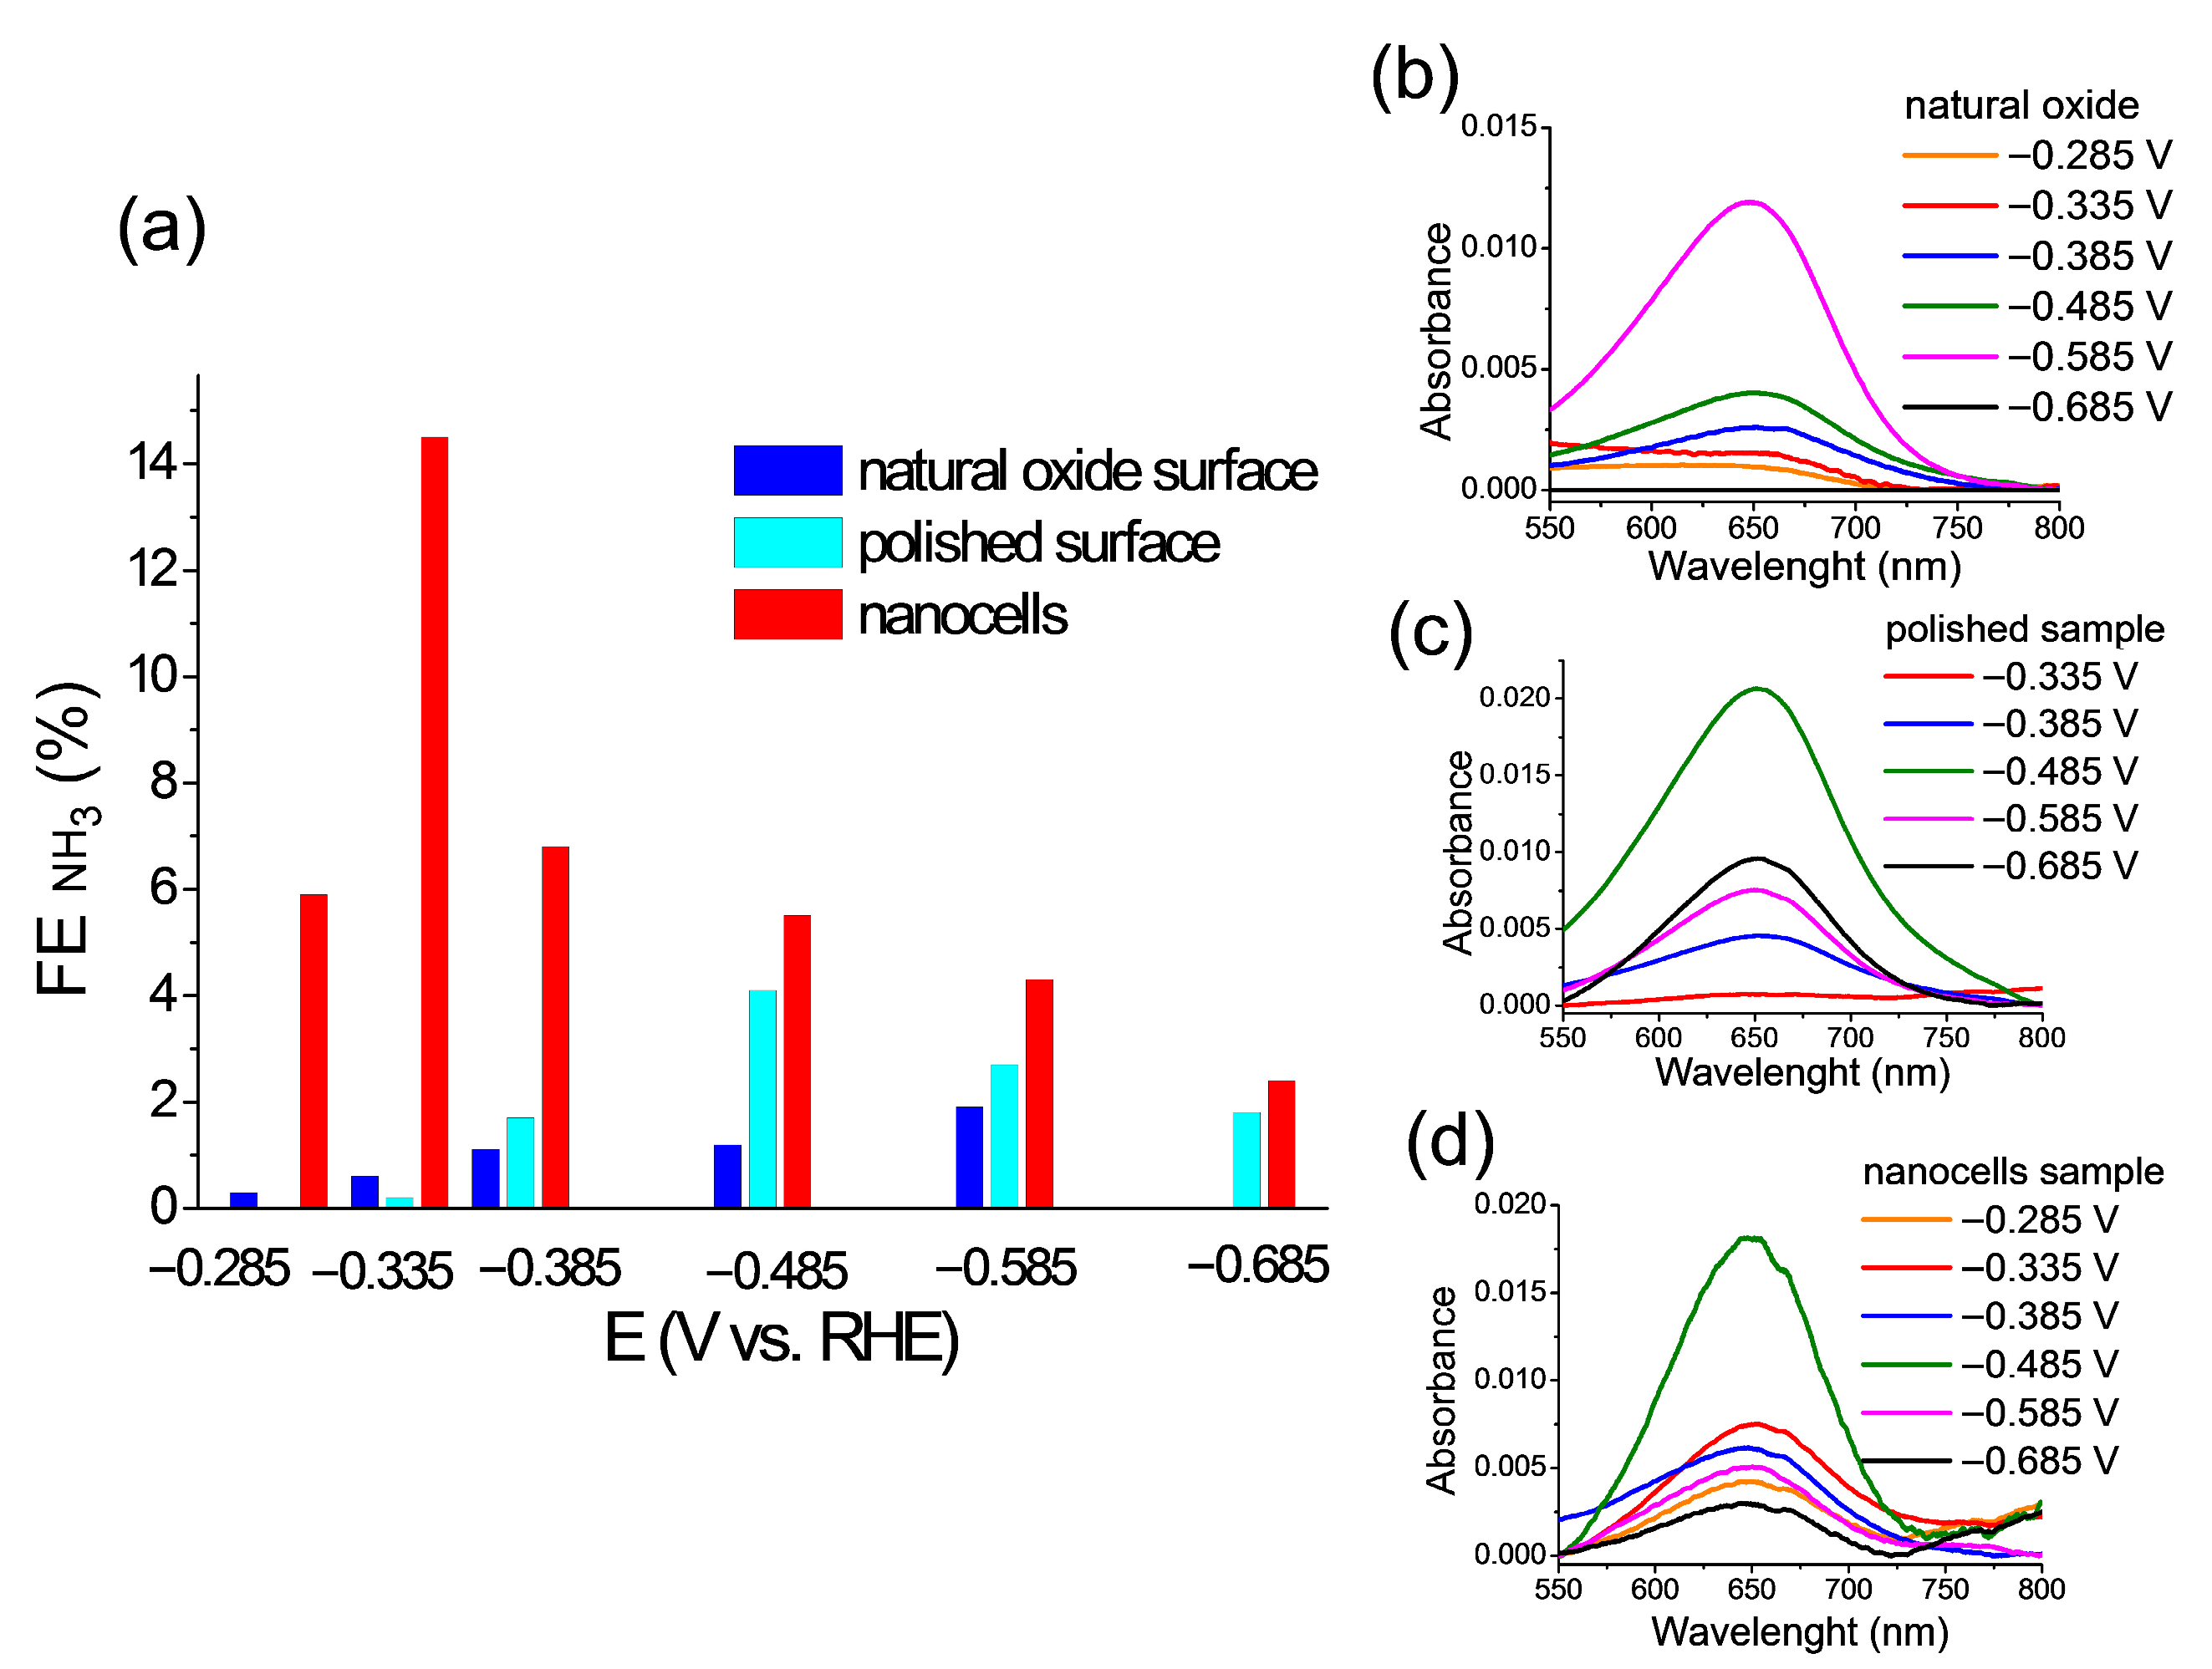
2.6. FE and NH3 Yield Rate

Figure 6a shows a Faradaic efficiency diagram for all three samples obtained by conducting NO3RR for 1 h at five potentials of working electrodes. From the previous subsections of this paper, it is established:
  • There is a depletion of the surface of all components compared to Co for the sample with nanocells compared to the original (with natural oxide) sample;
  • A significant amount of Si remains, but this is not a catalyst for NO3RR;
  • CoO is a catalyst for the stage of adsorption of NO3 ions [30], but it is not an active catalyst (such as Co3+ could be) for the entire NO3RR.
This is probably why, even at low potentials, the highest FE values are observed for the sample with nanocells. The polished sample exhibits weak catalytic activity, which initially increases at first and then, apparently due to the competition with HER, decreases rapidly. The catalyst with a natural oxide has an activity at the level of the FE measurement error.
Figure 6b–d shows experimental UV-vis spectra used to determine the amount of synthesized ammonia in NO3RR. The indophenol method (see the experimental section) makes it possible to accurately determine the content of synthesized ammonia at a low sensitivity threshold.
Table 2 shows the results of the NH3 yield rates calculated according to Equation (6). The best result was achieved at a potential of −0.485 V when using a catalyst with nanocells.
Nanostructured catalysts have attractive properties such as high surface area and conductivity for electrocatalytic NO3RR. The role of nanostructures can be ambiguous. In a recent study [40], the FE of NO3RR for Cu nanodisks increases by 1.2-fold compared to Cu-disks (81.1% and 68%, respectively). In the review [42], the Fe electrode was compared with Fe nanoparticles (NP) in NO3RR. The FE values for the massive electrode and the electrode with NP are 87 and 90%, while the selectivity is 100% and 99%. A decrease in the size of Cu-NPs from 8.3 to 2.61 nm leads to a decrease in FE from 84.5% to 73.6% [43]. Our results show a seven-fold increase in FE for the catalyst with nanostructures compared to the initial alloy.

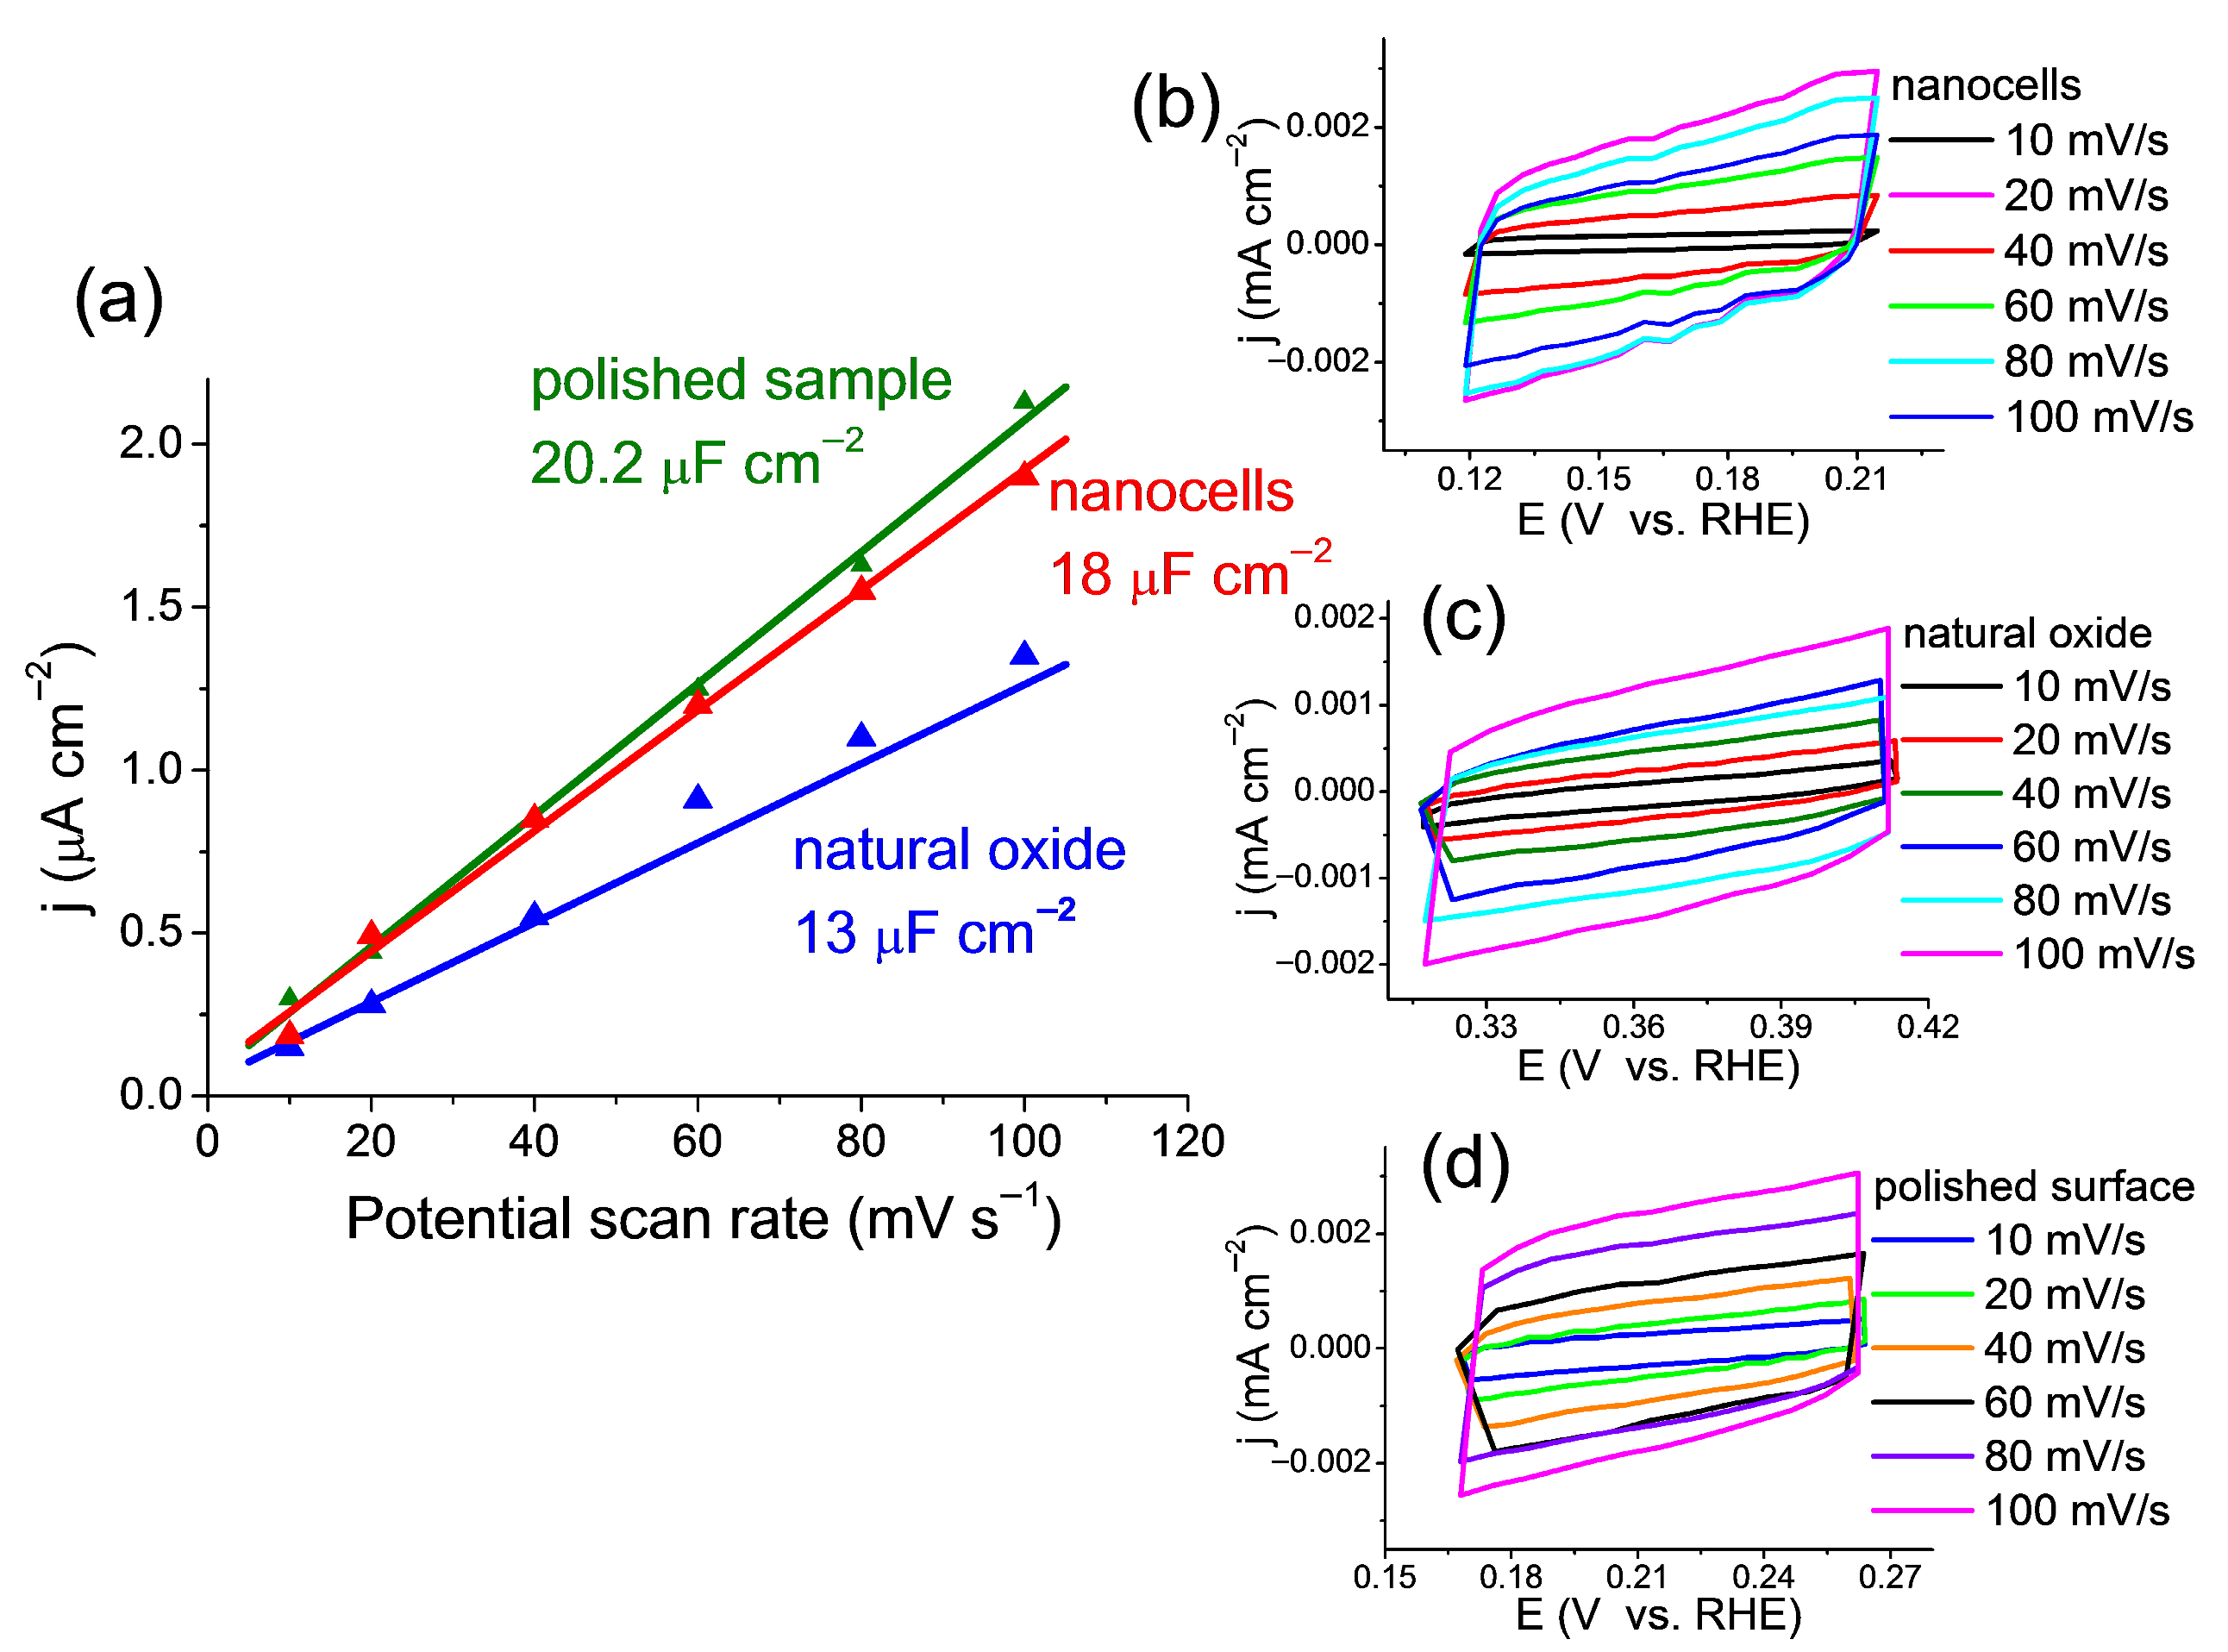
2.7. Electrochemically Active Surface Area (ECSA)

The electrochemical double layer capacitance (Cdl) is an effective tool to estimate the electrochemically active surface area (ECSA) of catalysts, as ECSA is proportional to Cdl. The results can be seen in Figure 7.
Cyclic voltammetry patterns were measured for all catalysts at scan rates from 10 to 100 mV s−1 in the non-Faradaic region, as shown in Figure 7b–d. The values of the double layer capacitance (Cdl) for all studied samples are shown in Figure 7a. To obtain Cdl values in Figure 7a, a graph of the dependence of the average current density on the scan rates was plotted.
The catalyst representing the polished sample, as expected, shows the best result for the entire series (Cdl = 20.2 μF∙cm−2). This means that this sample contains the largest number of available catalytic centers, as well as a sample containing nanocells. It can be assumed that these catalytic centers are available not only for the reagents of the reaction under study but also for other side processes (evolution of molecular nitrogen, HER, corrosion [21,44]). Consequently, despite the slightly lower Cdl = 18.0 μF∙cm−2 for a catalyst containing nanocells, its selectivity for NO3RR is several times higher. This is confirmed by the values of FE and NH3 yield rate discussed in the previous section. In the sample with the surface oxide, the catalytic centers were hidden under a thick layer of natural oxide. As expected, the resulting capacitance (Cdl = 13.0 μF∙cm−2) was the lowest.

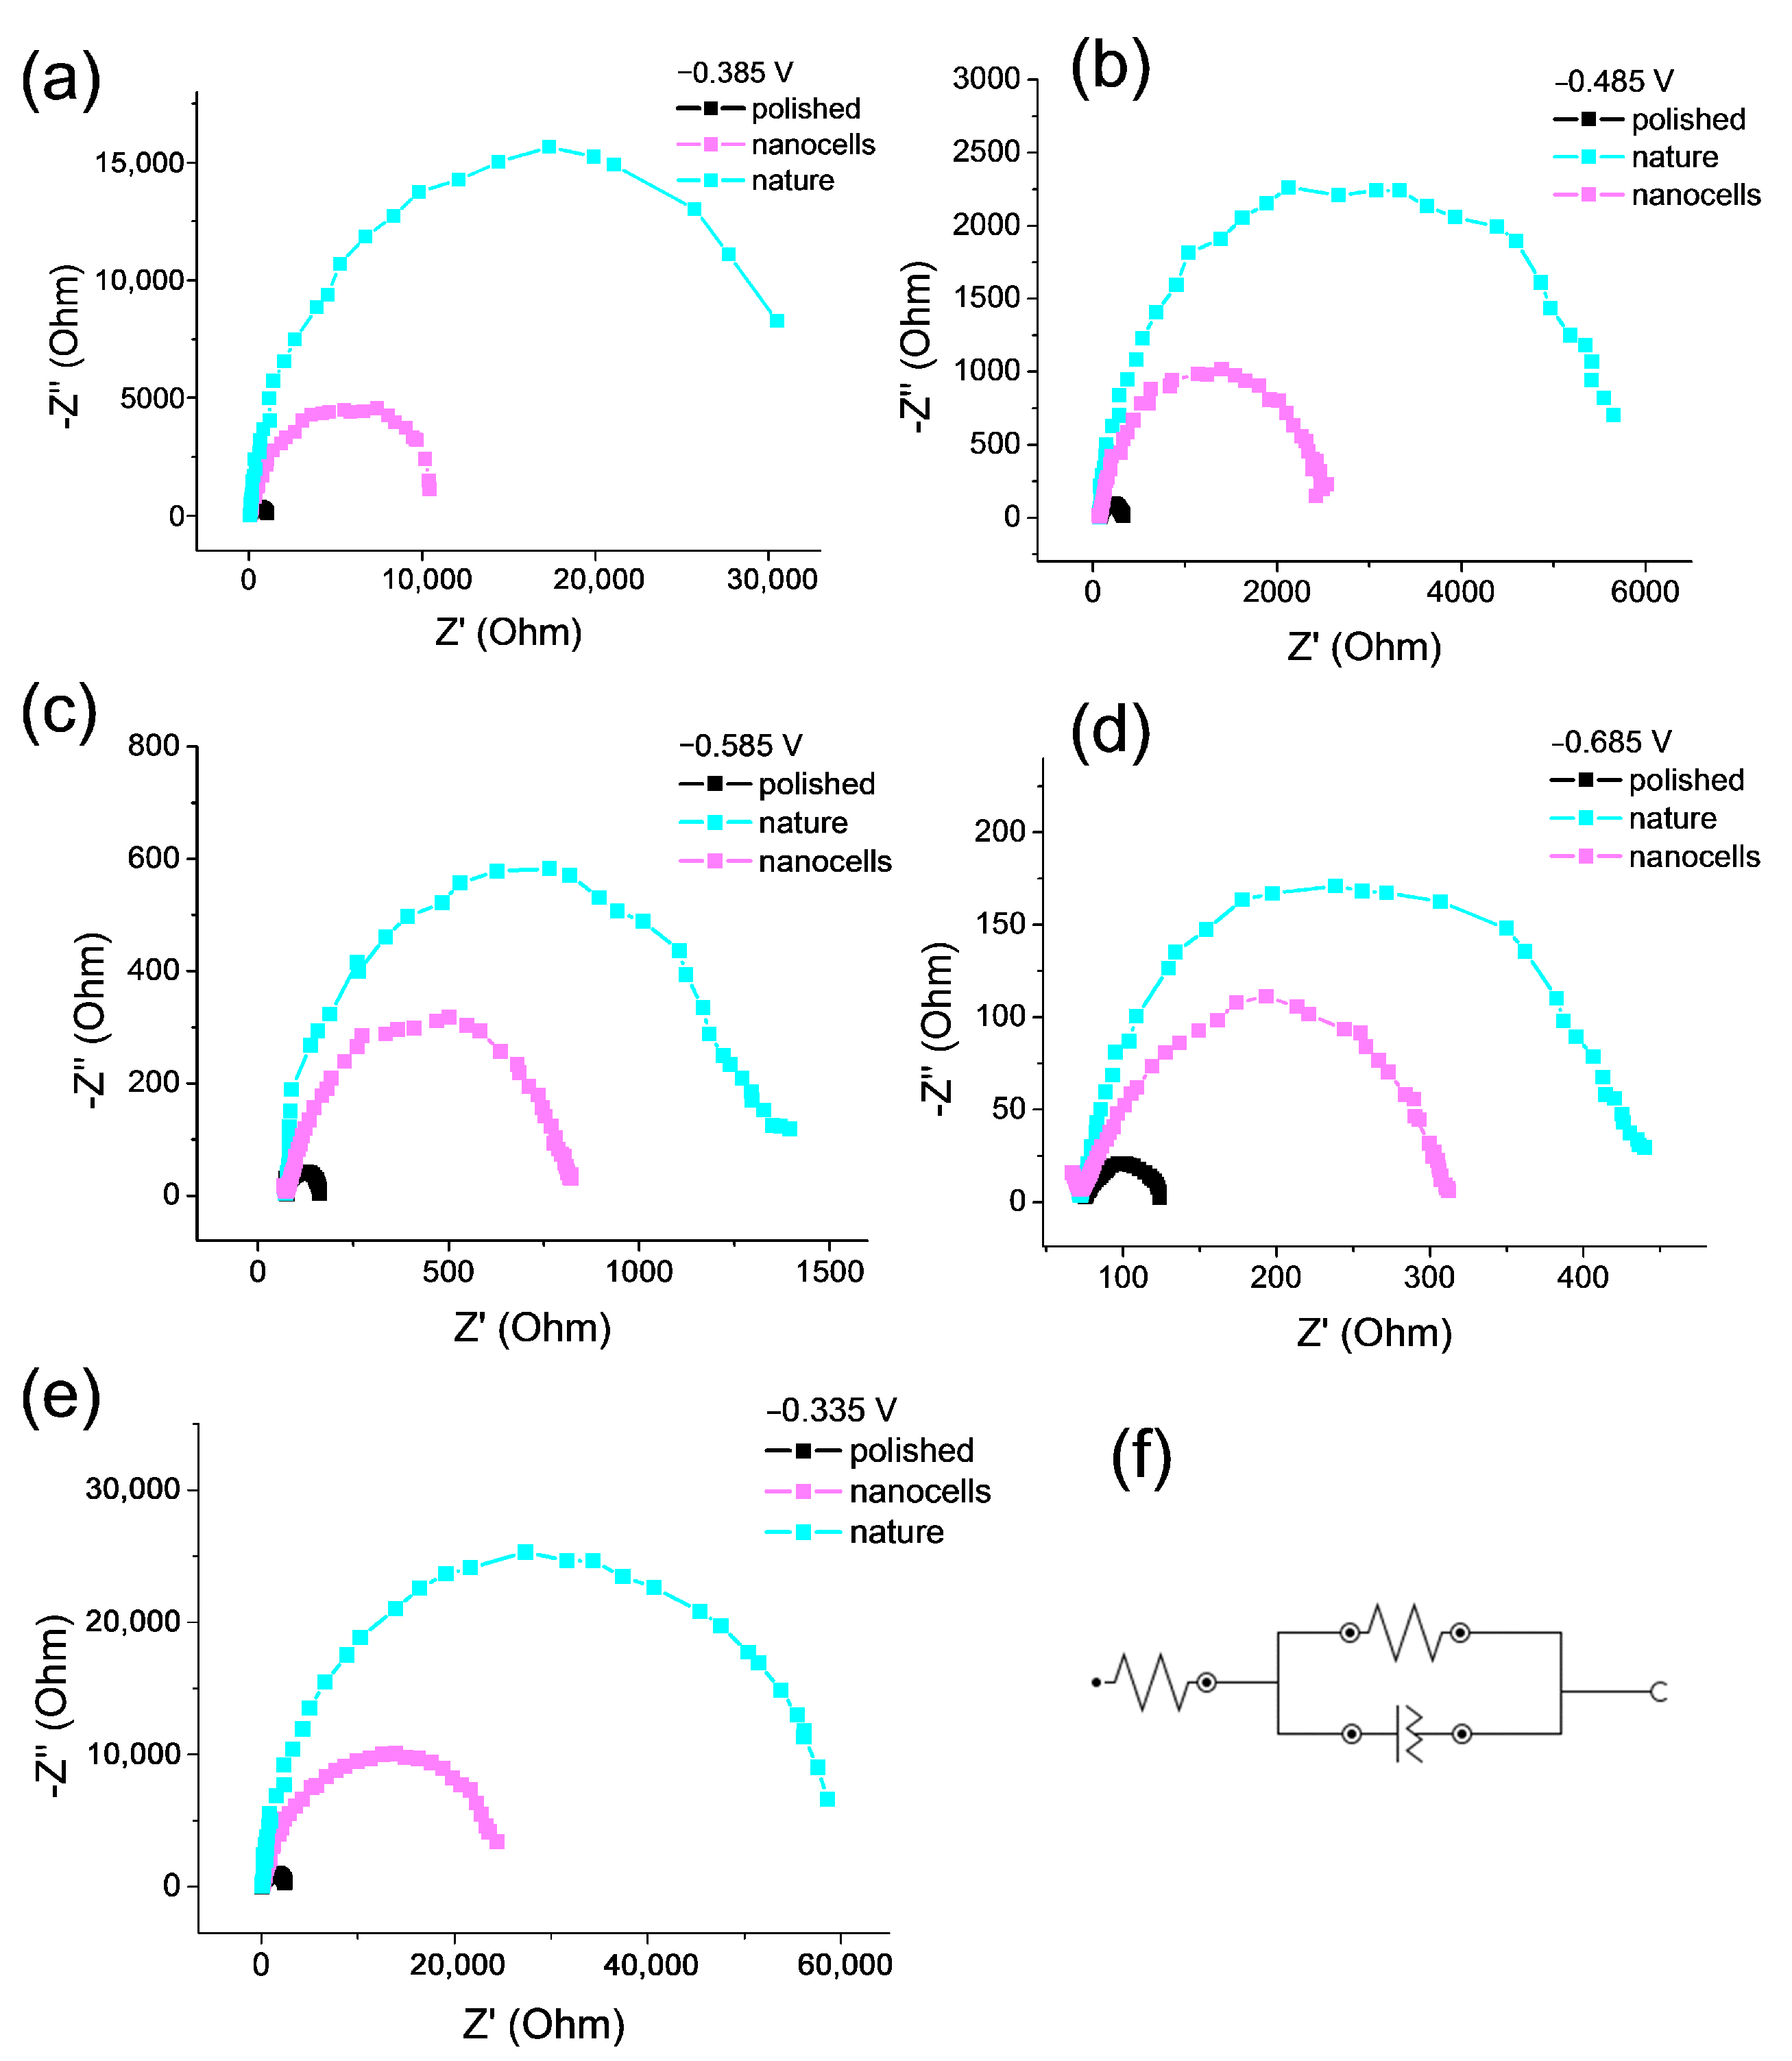
2.8. Electrochemical Impedance Spectroscopy (EIS)

The radius of the Nyquist plots is related to the charge transfer resistance, and generally, a smaller radius indicates fast and efficient charge transfer during the NO3RR catalytic process (Figure 8a–e). The Nyquist plot shows that the presence of nanocells changes the electrochemical properties of the electrodes. The catalyst coated with natural oxide has higher resistance than the catalyst with nanocells. The polished sample contains the bare metal surface, and the radius, as expected, is the smallest among the obtained catalysts, which indicates a low resistance to charge transfer. Comparison of samples with nanocells and natural oxide suggests that the appearance of nanocells promotes charge transfer at the cathode and increases the rate of the target reaction of nitrate to ammonia transformation.
It is clearly noticeable that for the EI spectra, the difference between the radius values for the nanocell sample and the natural oxide sample decreases as the cathodic potential of the spectrum measurement increases. The EIS data agree well with the FE values discussed above: at potential E = −0.335 V, Figure 8e, the largest FE values were also obtained.
An equivalent circuit for the process is shown in Figure 8f. The equivalent circuit for all samples is the same and corresponds to the presence of a kinetic-controlled Faradaic process with uniform coating (no defects) of the surface. The values of the parameters of the equivalent circuit (Rs, Rp, CPE) for the potential E = −0.335 V in a 0.05 M Na2SO4 electrolyte with 1.2 mM of nitrate ions are given in Table 3.

2.9. The Scheme of the Mechanism

Based on the conducted research, the following scheme of the NO3RR mechanism can be proposed, proceeding on the studied electrocatalysts, shown in Figure 9.
Such a significant increase in efficiency during the transition to a nanostructured electrocatalyst from a natural oxide-coated sample (more than seven-fold) and from a bare surface of a polished sample (more than three-fold) can be explained by the following conditions:
  • The influence of CoO—its enrichment is most noticeable for a sample with natural cells;
  • Crystallites, and consequently dislocations and defects in the crystal structure, increase the catalytic activity compared to an amorphous sample;
  • CoO is a weak catalyst (it works better for the nitrate ion adsorption stage), but in general, the total FE value for NO3RR remains very low compared to the best electrocatalysts in modern works;
  • The expected tandem effect based on the presence of a joint content in the composition of the Fe and Co alloy [21] does not work here;
  • An alternative explanation is the following. Magnetic domains (which are described in the work of the authors of this paper [24]) may play a role in increasing the catalytic properties of a sample with nanoparticles in NO3RR, according to a very recent study by Ghorai et al. [34] and in [24].

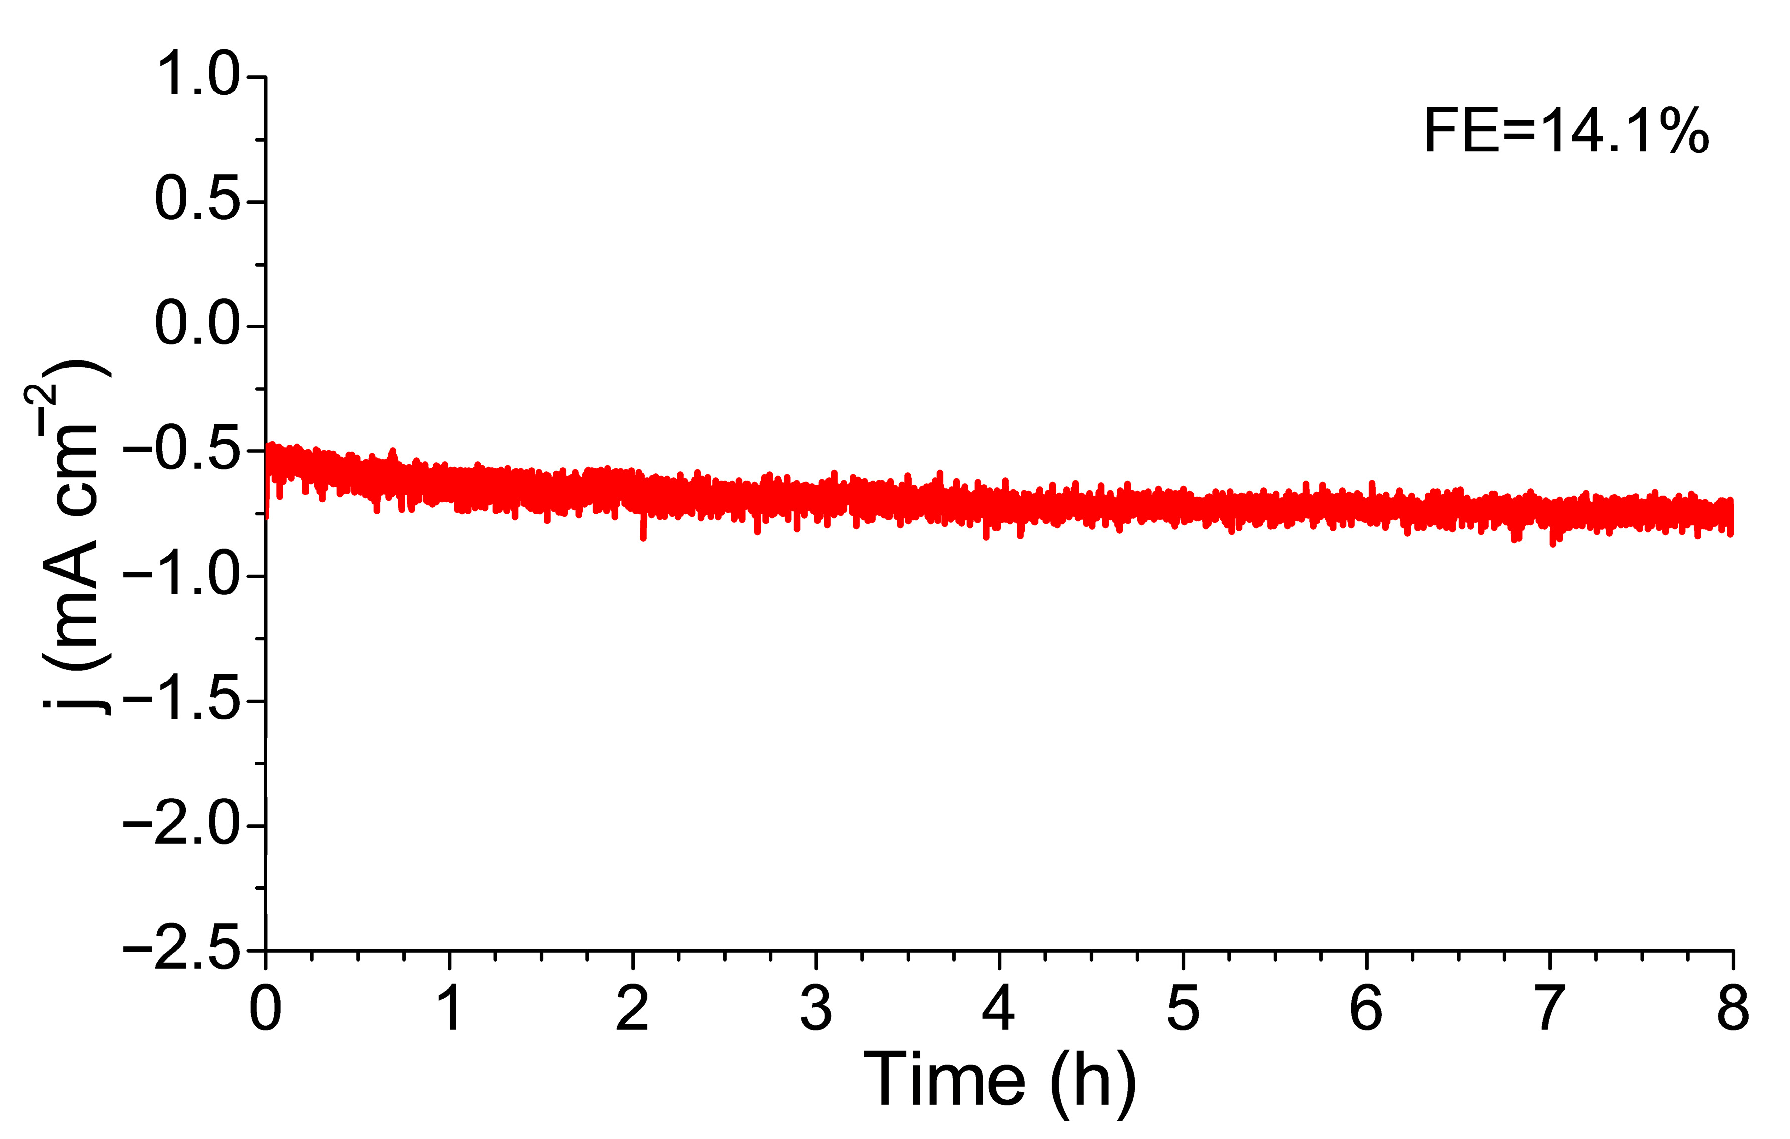
2.10. Sustainability and Stability

The stability and duration of operation of the catalyst electrodes are influenced by many factors, such as pH, temperature, electrolyte composition (for example, Cl ions), the method of catalyst preparation, strong metal-support interactions (SMSI), and morphology. Current research is aimed at increasing the stability and durability of the catalyst by modifying the surface [45], pH [46], and introducing various dopants (N, O, P, S, etc.) [47].
The analysis of the operating time of iron-based catalysts given in ref. [46] shows that the stable operating time ranges from 5 cycles to 50 h. The stable operation for 60 cycles (12 h per cycle) was achieved using an FeCo alloy coated with porous carbon nanofibers doped with nitrogen [45].
Numerous experiments in our work used nanocell samples for several months. At the same time, the samples demonstrated impressive stability, so, for example, the SEM image did not reveal any difference in the change in surface morphology. Also, during electrochemical tests, no significant changes were found in the catalytic behavior of the studied sample with nanocells. It should be noted that during the entire experiment cycle, the sample was stored under ambient conditions and in contact with the atmosphere.
At the end of this study, a stability test was performed for the catalyst with nanocells (Figure 10). The 8 h of the continuous NO3RR operation showed complete stability of the electrocatalyst without any drop in the Faradaic efficiency.

3. Materials and Methods

3.1. Catalyst Synthesis

The amorphous alloy Co75Si15Fe5Cr4.5 was prepared as described in the earlier work of the authors [24]. In general, the rotating-cylinder method has been applied for the preparation of the amorphous iron-chromium-silicon alloy in the form of a ribbon. The starting materials were Co, Si, Fe, and Cr (purity 99.95–99.99%). The preparation conditions were determined by the necessity to obtain the material in the amorphous state. The amorphous alloy was obtained as a ribbon by high-speed quenching of the melt on a fast-moving substrate. The synthesis was described in more detail in [24]. Modification of the surface of the amorphous Co75Si15Fe5Cr4.5 alloy with nanostructures was performed by anodizing in IL 1-butyl-3-methylimidazolium bis(trifluoromethylsulfonyl)imide (purity 99.5%; ABCR, Karlsruhe, Germany) in a three-electrode cell with an undivided cathode-anode space under galvanostatic conditions at a current density of 15 mA cm−2 for different times (15–1800 s) using a potentiostat PGSTAT Autolab 302N (Metrohm AG, Herisau, Switzerland). The auxiliary electrode was an amorphous alloy (Co75Si15Fe5Cr4.5) sample (S = 0.6 cm2), and the reference electrode was silver wire [24].

3.2. SEM Characterization

Surface morphology and composition of the sample were characterized using an EVO-50 Zeiss scanning electron microscope with an EDX (energy dispersive X-ray spectroscopy) analyzer (Zeiss AG, Jena, Germany).

3.3. DRS Characterization

The diffuse reflectance spectra of the samples before and after anodizing in ionic liquid were recorded using the spectrophotometer UV-3600Plus (Shimadzu, Kyoto, Japan) in the wavelength range 800–200 nm. An integrating sphere (ISR-603) attachment and three detectors were used, enabling the high-sensitivity measurement of solid samples.

3.4. XRD Characterization

X-ray powder diffraction patterns of samples were measured at room temperature using a diffractometer Empyrean (PANalytical, Almelo, The Netherlands) equipped with an X’celerator linear detector using Ni-filtered CuKα (α  =  1.5418 Å) radiation. Measurement parameters include tube voltage/current 45 kV/35 mA, 2θ range 440°, and speed 1° min− 1.

3.5. XPS Characterization

XPS characterization was performed using a Kratos Axis Ultra DLD (Kratos Analytical Limited, UK) spectrometer. The transmission energy is 160 eV (overview) and 40 eV (high-resolution spectra). AlKα mono radiation was used with a neutralizer, calibrated by the C1s—285.0 eV line. In this current work, AlKα radiation (hν = 1486.6 eV, 150 W) was used as a primary radiation source.

3.6. Electrochemical Experiments

The microsecond transients were studied at a direct current of 0.5 mA, t = 0.02 s in a three-electrode cell in an ionic liquid (BmimNTf2). The capacitance (C) is related to the thickness (δ) of the oxide film according to the equation:
δ = [εε0]/C,
where C is the capacitance of the spatial charge layer, ε and ε0 are the permittivity of the oxide film and the permittivity of the vacuum.
For the samples, the change in the thickness of the oxide film relative to the natural oxide sample (δ0i) was determined, considering ε to be the same for all samples. The C values were calculated by graphically differentiating the microsecond transients at the initial time.

3.7. Electrochemical Measurements

Electrochemical measurements were performed at room temperature using the potentiostat PGSTAT Autolab 302N (Metrohm AG, Herisau, Switzerland) with a three-electrode cell and an Ag/AgCl electrode as a reference electrode. Samples with natural oxide, nanocells, and polished samples were used as a working electrode, and platinum wire was used as an auxiliary electrode. Linear voltammetry (LV) was performed in a cell separated by a cathode-anode space with a total volume of 60 mL in the range from (–0.285 V) to (–0.685 V) compared to RHE with a potential scanning rate of 50 mV s−1. All potential values were recalculated compared to previous values on a reversible hydrogen electrode (RHE) according to the formula:
ERHE = Eapplied Ag/AgCl + 0.202 + 0.059 × pH
The ECSA value was calculated based on the value of the electrochemical capacitance of the double layer (Cdl) obtained by measuring CVs (cyclic voltammograms) in the potential range of the double layer, i.e., in the non-Faradaic region. This range was a 0.1 V window located in the center of the OCP system in NaNO3 (1.2 mM) in 0.05 M Na2SO4 at various scan rates (from 10 to 100 mV s−1):
j=│jcja│/2,
where ja is the anodic current density (mA cm−2) and jc is the cathodic current density (mA cm−2).
The average value of the current density was calculated at different scan rates, and curves of the dependence of the scan rate for each catalyst were constructed.
The dependences of the current densities on the scanning rate were obtained and, accordingly, the Cdl values. ECSA was calculated as:
ECSA = Cdl/Cs,
where Cs (= 0.4 F m−2) is the total specific capacity for an atomically smooth flat surface under homogeneous electrolytic conditions.
The electrochemical impedance spectroscopy (EIS) was recorded at −0.335 V, −0.385 V, −0.485 V, −0.585 V, and −0.685 V vs. RHE with the frequency ranging from 0.01 to 105 Hz at the AC amplitude of 5 mV using the potentiostat-galvanostat PS-20 (SmartStat, Chernogolovka, Russia).

3.8. Electrocatalytic Nitrate Reduction

The electrochemical production of ammonia in the NO3RR reaction was carried out for 1 h in a cell with a separated cathode-anode space and a total volume of 60 mL. The electrolyte was a solution of 1.2 mM NaNO3 in 0.05 M Na2SO4. Pre-degassing in an Ar flow was performed before the tests. Chronoamperometric tests were performed in the potential range from −0.285 V to −0.685 V relative to RHE for 1 h to determine the ammonia yield and Faradaic efficiency.

3.9. Quantification of Ammonia

The detection of the ammonia content after NO3RR was carried out using the indophenol method [21]. UV-vis absorption spectra were recorded using a UV-3600Plus spectrophotometer (Shimadzu, Kyoto, Japan) in a standard 1 cm quartz cuvette. Two milliliters of 5 wt% sodium salicylate in 1.0 M NaOH were added to 2 mL of the tested solution, then 1 mL of 0.05 M NaClO and Na2[Fe(NO)(CN)5] (0.2 mL, 1 wt%) were added. The solutions were kept at 40 °C for 1 h. The absorption maximum is observed at λ = 652 nm, for which a calibration graph was plotted.

3.10. Calculation of Faradaic Efficiency

The Faradaic efficiency was determined by the formula:
FE(NH3) = (8·F·n(NH3)·100%)/Q,
where n(NH3) denotes the amount (mol) of NH3; F is the Faradaic constant (96,485 C mol−1); Q is the total charge passed through the electrode; and 8 is the number of electron transfers required to form 1 mol of ammonia.
The ammonia yield rate (yield) was defined as:
Yield(NH3) = [C(NH3)·V]/[17·t·S],
where C(NH3) denotes the mass concentration (μg L−1) of NH3 calculated from the UV-Vis spectra, t is the electrolysis time (h), S is the geometric area of the working electrode (0.4 cm2 for samples with nanocells and 1.0 cm2 for natural oxide or polished samples), V is the volume of the electrolyte (L), 17 is the molar mass of NH3.

4. Conclusions

It should be noted that eco-friendly and sustainable reactions of electrocatalytic transformation in ammonia production are currently relevant and in demand to replace the environmentally unfavorable Haber–Bosch process. At the same time, the stability of the synthesized material and the simplicity of synthesis itself are of great importance. The main results of the study are given below:
  • The “hexagonal” nanocells on the surface were synthesized by single-stage anodizing in the ionic liquid BmimNTf2 for 200 s (j = 15 mA cm−2);
  • Electrocatalysts have been characterized by a complex of modern physicochemical methods such as SEM, XPS, DRS, and XRD. The morphology of the surface, the valence state of the elements on the surface, and the size of the crystallites were determined. It was found that the main substance of the nanocells is cobalt (II) oxide;
  • The optimal NH3 synthesis potential and the concentration of NO3 ions were determined by the LVs method;
  • The NO3RR reaction performed chronoamperometrically for 1 h showed a difference in FE for electrocatalysts with and without nanocells, which reaches an increase of 700%. At the same time, the total FE remains low (14.3%) even for the best (nanostructured) sample;
  • The scheme of the NO3RR mechanism has been proposed.
So, the aim of the work was achieved and consisted in the task of identifying, as well as determining and showing the effect of a nanostructure in the form of nanocells obtained on the surface of an amorphous alloy Co75Si15Fe5Cr4.5 by anodizing in IL on the electrocatalytic activity in the NO3RR reaction in a neutral medium using a dilute nitrate ion solution.
The prospects: it is logically obvious to check the effect of nanostructures on catalytic activity for electrocatalysts of medium efficiency (FE = 40–60%): how much will FE increase in this case? The optimization of the alloy composition by reducing the chromium and silica content and increasing the iron content looks promising. Undoubtedly, it is necessary to find the optimal ratio of the reaction yields and the geometric size of the nanocells. A clear advantage of this nanostructured electrocatalyst is the use of the low synthesis potentials (just −0.335 V (RHE) for maximum FE) of the NH3 reaction. Nevertheless, the contribution of the competing HER reaction is significant, and therefore it is necessary to carry out a complex of investigations to optimize the alloy composition and suppress the contribution of HER. These and other things open the way and can serve as the subject of future research.
It is also obvious that for future research, computer calculations are needed to help assess the effect of components using the DFT method.

Author Contributions

Conceptualization, D.K., I.K., O.L. and L.K.; methodology, D.K., I.K., M.Z. and A.K.; investigation, I.K., A.L., S.D. and D.K.; writing—original draft preparation, I.K., D.K. and O.L.; writing—review and editing, D.K., O.L., I.K. and L.K.; supervision, L.K. All authors have read and agreed to the published version of the manuscript.

Funding

This research was carried out with financial support from the Russian Science Foundation, grant No. 23-73-30007.

Data Availability Statement

The original contributions presented in this study are included in the article. Further inquiries can be directed to the corresponding author.

Acknowledgments

The authors are sincerely grateful to Vladimir Chernyshev for measuring, analyzing, and advising on XRD data. The authors acknowledge support from the Lomonosov Moscow State University Program of Development for providing access to the XPS facilities.

Conflicts of Interest

The authors declare no conflicts of interest.

Abbreviations

NO3RRnitrate reduction reaction
ILionic liquid
SEMscanning electron microscopy
XRDX-ray diffraction
DRSdiffuse reflectance spectroscopy
XPSX-ray photoelectron spectroscopy
LVslinear voltammograms
CAchronoamperometry
FEFaradaic efficiency
ECSAelectrochemically active surface area
Cdlelectrochemical capacity of the double layer
EISelectrochemical impedance spectroscopy

References

  1. Shi, K.; Willis, M.D.; Ren, Z.; Feng, X. Efficient Recycling of Dilute Nitrate to Ammonia Using Cu Nanowire Electrocatalyst. J. Phys. Chem. C 2023, 127, 20710–20717. [Google Scholar] [CrossRef]
  2. Jeon, T.H.; Wu, Z.-Y.; Chen, F.-Y.; Choi, W.; Alvarez, P.J.J.; Wang, H. Cobalt–Copper Nanoparticles on Three-Dimensional Substrate for Efficient Ammonia Synthesis via Electrocatalytic Nitrate Reduction. J. Phys. Chem. C 2022, 126, 6982–6989. [Google Scholar] [CrossRef]
  3. Tong, X.; Zhang, Z.; Fang, Z.; Guo, J.; Zheng, Y.; Liang, X.; Liu, R.; Zhang, L.; Chen, W. PdMoCu Trimetallenes for Nitrate Electroreduction to Ammonia. J. Phys. Chem. C 2023, 127, 5262–5270. [Google Scholar] [CrossRef]
  4. Chatterjee, S.; Parsapur, R.K.; Huang, K.-W. Limitations of Ammonia as a Hydrogen Energy Carrier for the Transportation Sector. ACS Energy Lett. 2021, 6, 4390–4394. [Google Scholar] [CrossRef]
  5. Zhang, R.; Zhang, S.; Guo, Y.; Li, C.; Liu, J.; Huang, Z.; Zhao, Y.; Li, Y.; Zhi, C. A Zn–Nitrite Battery as an Energy-Output Electrocatalytic System for High-Efficiency Ammonia Synthesis Using Carbon-Doped Cobalt Oxide Nanotubes. Energy Environ. Sci. 2022, 15, 3024–3032. [Google Scholar] [CrossRef]
  6. Liu, Y.; Cheng, R.; Ren, H.; Sun, T.; Liu, D. Ultrasmall Iron Nanoparticle-Decorated Carbon Black for High-Efficiency Nitrate-to-Ammonia Electrosynthesis and Zinc-Nitrate Batteries. ACS Sustain. Chem. Eng. 2024, 12, 3780–3789. [Google Scholar] [CrossRef]
  7. Liu, S.; Zhao, Y.; Chen, Z.; Gao, D.; Feng, F.; Rios-Studer, T.; Bansmann, J.; Biskupek, J.; Kaiser, U.; Liu, R.; et al. Metal Alloy-Functionalized 3D-Printed Electrodes for Nitrate-to-Ammonia Conversion in Zinc-Nitrate Batteries. ChemElectroChem 2024, 11, e202400291. [Google Scholar] [CrossRef]
  8. Xiong, Y.; Wang, Y.; Sun, M.; Chen, J.; Zhou, J.; Hao, F.; Liu, F.; Lu, P.; Meng, X.; Guo, L.; et al. Regulating the Electrochemical Nitrate Reduction Performance with Controllable Distribution of Unconventional Phase Copper on Alloy Nanostructures. Adv. Mater. 2024, 36, 2407889. [Google Scholar] [CrossRef]
  9. Qian, Y.; Lv, J.; Zhong, Y.; Liu, X.; Li, X.; Peng, Y.; Yan, J.; Wu, A. Efficient Electrocatalytic Nitrate Reduction Using 3D Copper Foam-Supported Co Hexagonal Nanoparticles in a Membrane Electrode Assembly. Int. J. Hydrog. Energy 2024, 64, 178–185. [Google Scholar] [CrossRef]
  10. Kim, Y.; Ko, J.; Shim, M.; Park, J.; Shin, H.-H.; Kim, Z.H.; Jung, Y.; Byon, H.R. Identifying the Active Sites and Intermediates on Copper Surfaces for Electrochemical Nitrate Reduction to Ammonia. Chem. Sci. 2024, 15, 2578–2585. [Google Scholar] [CrossRef]
  11. Li, Q.; Hou, Y.; Yin, J.; Xi, P. The Evolution of Hexagonal Cobalt Nanosheets for CO2 Electrochemical Reduction Reaction. Catalysts 2023, 13, 1384. [Google Scholar] [CrossRef]
  12. Wang, Y.; Hao, F.; Sun, M.; Liu, M.; Zhou, J.; Xiong, Y.; Ye, C.; Wang, X.; Liu, F.; Wang, J.; et al. Crystal Phase Engineering of Ultrathin Alloy Nanostructures for Highly Efficient Electroreduction of Nitrate to Ammonia. Adv. Mater. 2024, 36, 2313548. [Google Scholar] [CrossRef]
  13. Jiang, L.; Li, P.; Wang, S.; Liu, R.; Zhu, X.; Song, Y.; van Ree, T. Anodization fabrication techniques and energy-related applications for nanostructured anodic films on transition metals. Energy Mater. 2022, 2, 200038. [Google Scholar] [CrossRef]
  14. Zhou, J.; Xiong, Y.; Sun, M.; Xu, Z.; Wang, Y.; Lu, P.; Liu, F.; Hao, F.; Feng, T.; Ma, Y.; et al. Constructing Molecule-Metal Relay Catalysis over Heterophase Metallene for High-Performance Rechargeable Zinc-Nitrate/Ethanol Batteries. Proc. Natl. Acad. Sci. USA 2023, 120, e2311149120. [Google Scholar] [CrossRef] [PubMed]
  15. Wang, L.; Guo, P.; Han, Y.; Han, C.; Sun, H.; Huang, R.; Liu, X.; Huang, M.; Mao, Z.; Yan, X.; et al. Coupling Single-Atomic Iron Sites with Iron Nanoparticles for Tandem-Enhanced Ammonia Electrosynthesis from Nitrate. Chem Catal. 2024, 4, 100936. [Google Scholar] [CrossRef]
  16. Murphy, E.; Sun, B.; Rüscher, M.; Liu, Y.; Zang, W.; Guo, S.; Chen, Y.; Hejral, U.; Huang, Y.; Ly, A.; et al. Synergizing Fe2 O3 Nanoparticles on Single Atom Fe-N-C for Nitrate Reduction to Ammonia at Industrial Current Densities. Adv. Mater. 2024, 36, 2401133. [Google Scholar] [CrossRef]
  17. Peng, Q.; Xing, D.; Dong, L.; Fu, Y.; Lu, J.; Wang, X.; Wang, C.; Guo, C. Electrochemical Nitrate Reduction for Ammonia Production: Amorphous or Crystalline Oxidized Copper Catalyst? J. Mater. Chem. A 2024, 12, 8689–8693. [Google Scholar] [CrossRef]
  18. Kori, D.K.K.; Das, A.K. Engineering of Bimetallic Cu–Pt Nanostructures for the Electrochemical Ammonia Synthesis via Nitrate Reduction. ACS Appl. Eng. Mater. 2023, 1, 2386–2396. [Google Scholar] [CrossRef]
  19. Harmon, N.J.; Li, J.; Wang, B.T.; Gao, Y.; Wang, H. Influence of Carbon Nanotube Support on Electrochemical Nitrate Reduction Catalyzed by Cobalt Phthalocyanine Molecules. ACS Catal. 2024, 14, 3575–3581. [Google Scholar] [CrossRef]
  20. Especel, C.; Lafaye, G.; Epron, F. Bimetallic Catalysts for Sustainable Chemistry: Surface Redox Reactions For Tuning The Catalytic Surface Composition. ChemCatChem 2023, 15, e202201478. [Google Scholar] [CrossRef]
  21. Kuznetsova, I.; Lebedeva, O.; Kultin, D.; Mashkin, M.; Kalmykov, K.; Kustov, L. Enhancing Efficiency of Nitrate Reduction to Ammonia by Fe and Co Nanoparticle-Based Bimetallic Electrocatalyst. Int. J. Mol. Sci. 2024, 25, 7089. [Google Scholar] [CrossRef] [PubMed]
  22. Yang, L.-H.; Liao, M.-T.; Chen, J.-T.; Li, W.; Yang, C.; Wang, A.-Q.; Lv, S.-H. Insights into the Multiple Active Sites in Bi-Co Bimetallic Oxide for a Deeper Understanding of Nitrate Electroreduction to Ammonia. Sep. Purif. Technol. 2025, 354, 129425. [Google Scholar] [CrossRef]
  23. Qi, R.; Jiang, Q.; Zhong, M.; Li, W.; Ren, S.; Wang, Y.; Feng, M.; Lu, X. Manipulating D-Band Center of Bimetallic Sn-Alloy Coupling with Carbon Nanofibers for High-Performance Electrocatalytic Production of Ammonia from Nitrate. Chem. Eng. J. 2024, 496, 154094. [Google Scholar] [CrossRef]
  24. Kuznetsova, I.; Lebedeva, O.; Kultin, D.; Perova, N.; Kalmykov, K.; Chernavskii, P.; Perov, N.; Kustov, L. Is a 2D Nanostructured Surface Capable of Changing the Corrosion and Magnetic Properties of an Amorphous Alloy? Int. J. Mol. Sci. 2023, 24, 13373. [Google Scholar] [CrossRef] [PubMed]
  25. Lebedeva, O.; Kultin, D.; Kalmykov, K.; Snytko, V.; Kuznetsova, I.; Orekhov, A.; Zakharov, A.; Kustov, L. Nanorolls Decorated with Nanotubes as a Novel Type of Nanostructures: Fast Anodic Oxidation of Amorphous Fe–Cr–B Alloy in Hydrophobic Ionic Liquid. ACS Appl. Mater. Interfaces 2021, 13, 2025–2032. [Google Scholar] [CrossRef]
  26. Lebedeva, O.; Kultin, D.; Kustov, L. Electrochemical Synthesis of Unique Nanomaterials in Ionic Liquids. Nanomaterials 2021, 11, 3270. [Google Scholar] [CrossRef]
  27. Liu, F.; Fan, Z. Defect Engineering of Two-Dimensional Materials for Advanced Energy Conversion and Storage. Chem. Soc. Rev. 2023, 52, 1723–1772. [Google Scholar] [CrossRef]
  28. Ye, M.; Jiang, X.; Zhang, Y.; Liu, Y.; Liu, Y.; Zhao, L. Enhanced Electrocatalytic Nitrate Reduction to Ammonia Using Functionalized Multi-Walled Carbon Nanotube-Supported Cobalt Catalyst. Nanomaterials 2024, 14, 102. [Google Scholar] [CrossRef]
  29. Hu, Q.; Qi, S.; Huo, Q.; Zhao, Y.; Sun, J.; Chen, X.; Lv, M.; Zhou, W.; Feng, C.; Chai, X.; et al. Designing Efficient Nitrate Reduction Electrocatalysts by Identifying and Optimizing Active Sites of Co-Based Spinels. J. Am. Chem. Soc. 2024, 146, 2967–2976. [Google Scholar] [CrossRef]
  30. Ma, C.; Li, Y.; Zhao, D.; Yan, J.; Cao, D.; Zhao, J.; Xie, H.; Yao, J.; Wang, G. In Situ Derivation of Dual-Active Co/CoO Heterojunction Nanoarrays for Synergistic Catalytic NH3 Synthesis. ACS Sustain. Chem. Eng. 2024, 12, 17817–17828. [Google Scholar] [CrossRef]
  31. Dong, Z.; Sun, Q.; Xu, G.; Wu, Z.; Li, Y.; Lai, J.; Li, G.; Wang, L. Universal Synthesized Strategy for Amorphous Pd-Based Nanosheets Boosting Ambient Ammonia Electrosynthesis. Small Methods 2023, 7, 2201225. [Google Scholar] [CrossRef] [PubMed]
  32. Yu, Z.; Sun, Q.; Zhang, L.; Yang, H.; Chen, Y.; Guo, J.; Zhang, M.; Zhang, Z.; Jiang, Y. Research Progress of Amorphous Catalysts in the Field of Electrocatalysis. Microstructures 2024, 4, 2024022. [Google Scholar] [CrossRef]
  33. Cao, M.; Li, W.; Li, T.; Zhu, F.; Wang, X. Polymetallic Amorphous Materials: Research Progress in Synthetic Strategies and Electrocatalytic Applications. J. Mater. Chem. A 2024, 12, 15541–15557. [Google Scholar] [CrossRef]
  34. Adalder, A.; Mitra, K.; Barman, N.; Thapa, R.; Bhowmick, S.; Ghorai, U.K. Magneto-Electrochemical Ammonia Synthesis: Boosting Nitrite Reduction Activity by the Optimized Magnetic Field Induced Spin Polarized System. Adv. Energy Mater. 2024, 14, 2403295. [Google Scholar] [CrossRef]
  35. Huang, Y.; He, C.; Cheng, C.; Han, S.; He, M.; Wang, Y.; Meng, N.; Zhang, B.; Lu, Q.; Yu, Y. Pulsed Electroreduction of Low-Concentration Nitrate to Ammonia. Nat. Commun. 2023, 14, 7368. [Google Scholar] [CrossRef]
  36. Lebedeva, O.; Kudryavtsev, I.; Kultin, D.; Dzhungurova, G.; Kalmykov, K.; Kustov, L. Self-Organized Hexagonal Nanostructures on Nickel and Steel Formed by Anodization in 1-Butyl-3-Methylimidazolium Bis(Triflate)Imide Ionic Liquid. J. Phys. Chem. C 2014, 118, 21293–21298. [Google Scholar] [CrossRef]
  37. Lebedeva, O.; Kultin, D.; Kudryavtsev, I.; Root, N.; Kustov, L. The Role of Initial Hexagonal Self-Ordering in Anodic Nanotube Growth in Ionic Liquid. Electrochem. Commun. 2017, 75, 78–81. [Google Scholar] [CrossRef]
  38. Zhang, J.; Xu, D.; Lu, D.; Wang, H. The Synergistic Tandem Effect of Cu2+1O and Co3O4 Enhances the Activity and Selectivity of Nitrate Reduction to Ammonia in Neutral Solution. Appl. Catal. A 2024, 677, 119695. [Google Scholar] [CrossRef]
  39. Fang, L.; Lu, S.; Wang, S.; Yang, X.; Song, C.; Yin, F.; Liu, H. Defect Engineering on Electrocatalysts for Sustainable Nitrate Reduction to Ammonia: Fundamentals and Regulations. Chem.-Eur. J. 2024, 30, e202303249. [Google Scholar] [CrossRef]
  40. Zhang, K.; Liu, Y.; Pan, Z.; Xia, Q.; Huo, X.; Esan, O.C.; Zhang, X.; An, L. Cu-Based Catalysts for Electrocatalytic Nitrate Reduction to Ammonia: Fundamentals and Recent Advances. EES Catal. 2024, 2, 727–752. [Google Scholar] [CrossRef]
  41. Wei, J.; Li, Y.; Lin, H.; Lu, X.; Zhou, C.; Li, Y. Copper-Based Electro-Catalytic Nitrate Reduction to Ammonia from Water: Mechanism, Preparation, and Research Directions. Environ. Sci. Ecotechnol. 2024, 20, 100383. [Google Scholar] [CrossRef]
  42. Outaleb, H.; Kouzbour, S.; Audonnet, F.; Vial, C.; Gourich, B. Electrocatalytic Nitrate Reduction for Brackish Groundwater Treatment: From Engineering Aspects to Implementation. Appl. Sci. 2024, 14, 8986. [Google Scholar] [CrossRef]
  43. Hoekx, S.; Daems, N.; Arenas Esteban, D.; Bals, S.; Breugelmans, T. Toward the Rational Design of Cu Electrocatalysts for Improved Performance of the NO3RR. ACS Appl. Energy Mater. 2024, 7, 3761–3775. [Google Scholar] [CrossRef]
  44. Kempler, P.A.; Nielander, A.C. Reliable Reporting of Faradaic Efficiencies for Electrocatalysis Research. Nat. Commun. 2023, 14, 1158. [Google Scholar] [CrossRef]
  45. Luo, H.; Li, S.; Wu, Z.; Jiang, M.; Kuang, M.; Liu, Y.; Luo, W.; Zhang, D.; Yang, J. Relay Catalysis of Fe and Co with Multi-Active Sites for Specialized Division of Labor in Electrocatalytic Nitrate Reduction Reaction. Adv. Funct. Mater. 2024, 34, 2403838. [Google Scholar] [CrossRef]
  46. Quoie, G.D.S.; Bavumiragira, J.P.; Kromah, V. Advancements in Catalysts for Electrochemical Nitrate Reduction: A Sustainable Approach for Mitigating Nitrate Pollution: A Review. Mod. Res. Catal. 2024, 13, 1–28. [Google Scholar] [CrossRef]
  47. Chen, X.; Ji, X.; Kou, J. Rational Design of Iron Single-Atom Catalysts for Electrochemical Nitrate Reduction to Produce Ammonia. Discover Chem. Eng. 2023, 3, 21. [Google Scholar] [CrossRef]
Figure 1. SEM images of the surface: (a) natural oxide sample, (b) sample anodizing in BmimNTf2 for 200 s (j = 15 mA cm−2), and (c) the enlarged fragment of an anodized sample showing the size of the nanocells.
Catalysts 15 00666 g001
Figure 2. (a) Microsecond transients (0.02 s) for the amorphous cCo-alloy electrode: natural oxide sample; after anodizing for 15 s, 40 s, 100 s, 200 s, 300 s, 600 s, and 1800 s in BmimNTf2. (b) Chronoamperometric curves in BmimNTf2 during the synthesis of nanocells on the surface of a cCo-alloy (j = 15 mA cm−2; t = 100 s). (c) The change in the thickness of the oxide layer (δi) relative to the natural oxide layer (δ0) on the surface during anodizing in BmimNTf2 (j = 15 mA cm−2).
Catalysts 15 00666 g002
Figure 3. XPS spectra for natural oxide and nanocells (anodizing in BmimNTf2 for 200 s (j = 15 mA cm−2)) samples: (a) survey spectrum and high-resolution spectra: (b) Co 2p, (c) Fe 2p, (d) Si 2p, (e) Cr 2p, and (f) O 1s.
Catalysts 15 00666 g003
Figure 4. (a) Diffuse reflectance spectra for: natural oxide sample; sample after anodizing in IL for 200 s with nanocells; and individual powders (standards) of Fe2O3, Cr2O3, Co3O4, and Co2O3. (b) Diffuse reflectance spectra for individual investigated samples. (c) XRD for the same samples.
Catalysts 15 00666 g004
Figure 5. (ac) Linear voltammograms in 0.05 M Na2SO4 electrolyte not containing and containing different concentrations of nitrate ions from 1.2 to 12 mM at a potential scan rate of 50 mV s−1 for electrocatalyst samples: (a) natural oxide; (b) polished sample; (c) nanocells sample (the dotted lines show the potential at which the NO3RR reaction is carried out). (df) NO3RR at chronoamperometry for different potentials in the 0.05 M Na2SO4 with 1.2 mM NaNO3 electrolyte: (d) natural oxide sample; (e) polished sample; (f) nanocells sample.
Catalysts 15 00666 g005
Figure 6. (a) The values of FE at the different potentials from −0.285 V to −0.685 V (vs. RHE). UV-vis spectrum corresponds to the concentrations of the resulting product at λ = 652 nm for all three samples: (b) natural oxide surface; (c) polished sample; (d) nanocell sample.
Catalysts 15 00666 g006
Figure 7. (a) The electrochemically active surface of the electrocatalyst samples presented as a double layer capacity. (bd) Cyclic voltammograms for all three electrocatalyst samples for the scan rates of 10, 20, 40, 60, 80, and 100 mV s−1 from 0.165 to 0.265 V (RHE).
Catalysts 15 00666 g007
Figure 8. EI spectra for three samples obtained in the 0.05 M Na2SO4 with 1.2 mM NaNO3 electrolyte at different potentials: (a) −0.385 V; (b) −0.485 V; (c) −0.585 V; (d) −0.685 V; (e) −0.335 V; and (f) the equivalent circuit.
Catalysts 15 00666 g008
Figure 9. Schematic representation of the mechanism and results of the NO3RR process on the studied electrocatalyst samples, including a sample with nanostructured cells.
Catalysts 15 00666 g009
Figure 10. A chronoamperometric stability test for the nanocell sample was performed at E = −0.335 V in the 0.05 M Na2SO4 with 1.2 mM NaNO3 electrolyte.
Catalysts 15 00666 g010
Table 1. Concentrations of elements on the surface of the studied samples, calculated from XPS survey spectrum.
SampleOSiCrFeCo
atom%
Natural oxide52.033.91.45.07.8
Nanocells63.622.00.72.810.8
Normalization of elements by the initial sample (%)
Natural oxide100100100100100
Nanocells122.465.050.156.2139.5
Normalization by Co (%)
Nanocells87.746.635.940.3100
Table 2. The demonstrated values of the NH3 yield rates for all three examined samples.
Potential
(V vs. RHE)
NH3 Yield Rate (×10−9 mol h−1 cm−2)
Natural
Oxide
Polished
Surface
Nanocells
−0.2858.4-88.2
−0.33516.89.2159.7
−0.38521.737.8126.1
−0.48533.6168.1378.2
−0.585100.863.0105.0
−0.6850.079.863.0
Table 3. The values of the parameters of the equivalent circuit for the potential E = −0.335 V in a solution of 0.05 Na2SO4 with 1.2 mM nitrate ions.
SampleRs
(Ohm × cm2)
Rp (kOhm × cm2)CPE
(Ohm−1 × cm−2 × cN)
N
Natural oxide95 ± 1458,370 ± 7500(3.0 ± 0.3) × 10−60.94 ± 0.01
Nanocells71 ± 1026,200 ± 170(8.2 ± 0.08) × 10−60.82 ± 0.004
Polished67 ± 62590 ± 20(8.2 ± 0.08) × 10−50.82 ± 0.005
Disclaimer/Publisher’s Note: The statements, opinions and data contained in all publications are solely those of the individual author(s) and contributor(s) and not of MDPI and/or the editor(s). MDPI and/or the editor(s) disclaim responsibility for any injury to people or property resulting from any ideas, methods, instructions or products referred to in the content.

