Article

Production of 5-Hydroxymethylfurfural (HMF) from Sucrose in Aqueous Phase Using S, N-Doped Hydrochars

by
Katarzyna Morawa Eblagon
1,2,*,
Rafael G. Morais
1,2,
Anna Malaika
3,
Manuel Alejandro Castro Bravo
1,2,3,
Natalia Rey-Raap
4,
M. Fernando R. Pereira
1,2 and
Mieczysław Kozłowski
3
1
Laboratory of Separation and Reaction Engineering—Laboratory of Catalysis and Materials (LSRE-LCM), Department of Chemical Engineering, Faculty of Engineering, University of Porto, 4200-465 Porto, Portugal
2
ALiCE—Associate Laboratory in Chemical Engineering, Faculty of Engineering, University of Porto, Rua Dr. Roberto Frias, 4200-465 Porto, Portugal
3
Faculty of Chemistry, Adam Mickiewicz University in Poznań, Uniwersytetu Poznańskiego 8, 61-614 Poznań, Poland
4
Instituto de Ciencia y Tecnología del Carbono (INCAR-CSIC), 33011 Oviedo, Spain
*
Author to whom correspondence should be addressed.
Catalysts 2025, 15(7), 656; https://doi.org/10.3390/catal15070656
Submission received: 12 May 2025 / Revised: 27 June 2025 / Accepted: 2 July 2025 / Published: 5 July 2025
(This article belongs to the Special Issue Carbon-Based Catalysts to Address Environmental Challenges)

Abstract

5-Hydroxymethylfurfural (HMF) is a versatile platform molecule with the potential to replace many fossil fuel derivatives. It can be obtained through the dehydration of carbohydrates. In this study, we present a simple and cost-effective microwave-assisted method for producing HMF. This method involves the use of readily available sucrose as a substrate and glucose-derived bifunctional hydrochars as carbocatalysts. These catalysts were produced via hydrothermal carbonisation using thiourea and urea as nitrogen and sulphur sources, respectively, to introduce Brønsted acidic and basic sites into the materials. Using a microwave reactor, we found that the S, N-doped hydrochars were active in sucrose dehydration in water. Catalytic results showed that HMF yield depended on the balance between acidic and basic sites as well as the types of S and N species present on the surfaces of these hydrochars. The best-performing catalyst achieved an encouraging HMF yield of 37%. The potential of N, S-co-doped biochar as a green solid catalyst for various biorefinery processes was demonstrated. A simple kinetic model was developed to elucidate the kinetics of the main reaction pathways of this cascade process, showing a very good fit with the experimental results. The calculated rate constants revealed that reactions with a 5% sucrose loading exhibited significantly higher fructose dehydration rates and produced fewer side products than reactions using a more diluted substrate. No isomerisation of glucose into fructose was observed in an air atmosphere. On the contrary, a limited rate of isomerisation of glucose into fructose was recorded in an oxygen atmosphere. Therefore, efforts should focus on achieving a high glucose-to-fructose isomerisation rate (an intermediate reaction step) to improve HMF selectivity by reducing humin formation.

Graphical Abstract

1. Introduction

According to the European Environment Agency (EEA), road transport accounts for the highest proportion of overall transport-related greenhouse gas (GHG) emissions in the European Union, constituting over 70% in 2022 [1]. Thus, significant efforts are being directed towards decreasing these emissions, including via the implementation of policies that promote the use of low-carbon fuels or zero-emission technologies. In this sense, the production of biofuel precursors, such as 5-hydroxymethylfurfural (HMF) from carbohydrates locked in biomass, has attracted considerable interest in recent years.
The overall HMF market was valued at approximately USD 63.9 million in 2023, and this figure is expected to reach USD 73 million by 2030, growing at a compound annual growth rate (CAGR) of 1.9% during the forecast period [2]. The expansion of the HMF market in Europe is being driven by a number of factors. These include increased investment in renewable energy projects, government policies and incentives, and a growing trend towards carbon-neutral and sustainable products. Since 2014, HMF has been produced on a semi-commercial scale (with a total capacity of 6 metric tons per year) exclusively by AVA Biochem AG, located in Switzerland. This company utilises fructose as a substrate to produce HMF via its patented Hydro-Thermal Process (HTP) COBRIS™ [3].
The large-scale catalytic synthesis of HMF is of great importance, particularly from a chemical engineering perspective, due to the wide range of value-added products that can be derived from this platform molecule. The high chemical reactivity of HMF is attributed to its molecular structure, which contains functionalities such as C=O, C=C, and C–O, as well as a furan ring [4]. Thus, HMF can be converted into a promising drop-in biofuel, 5-ethoxymethylfurfural (EMF), via a simple acid-catalysed etherification [5]. EMF possesses properties comparable to those of conventional fuels, including an impressive energy density of 30.3 MJ/L, similar to that of gasoline and exceeding that of bioethanol. Furthermore, HMF can also be reduced to obtain 2,5-dimethylfuran (DMF), another highly promising sustainable oxygenated liquid fuel [6]. Additionally, linear alkanes suitable for diesel and jet fuel applications (C9–C15) can be derived from HMF through a cascade process involving dehydration, hydrogenation, and aldol-condensation with ketones (e.g., acetone), followed by hydrodeoxygenation [7].
The production of biofuels from biomass-derived HMF offers clear advantages in terms of sustainability and a low-carbon economy. Nevertheless, high production costs and low yields of HMF obtained from waste biomass resources limit its large-scale application as a biorefinery platform. Therefore, for HMF-derived biofuels to reach their full commercial potential and ultimately replace the existing fossil-derived alternatives, a cost-effective method for the large-scale production of HMF must first be established.
It has been demonstrated that excellent yields of HMF can be obtained through the Brønsted acid (BA)-catalysed dehydration of fructose. However, fructose is not considered a suitable feedstock for the production of commodity chemicals due to its high price, which leaves little economic margin for covering the remaining processing cost [8]. Conversely, waste biomass, such as food leftovers, sugarcane molasses [9], sugar syrups [10], and organic waste [11], represents a more desirable feedstock for large-scale HMF production. Nevertheless, these more complex substrates are considerably more difficult to process, as they must first be hydrolysed to glucose or a glucose–fructose mixture (over BA sites), depending on the substrate’s recalcitrance and the severity of the depolymerisation conditions required. For example, an equimolar glucose–fructose mixture can easily be obtained from sucrose through its thermal hydrolysis (T > 160 °C) [9], whereas lignocellulosic biomass requires significantly harsher conditions [12].
Glucose-containing polysaccharides, such as sucrose, are more difficult to convert into HMF than those containing solely fructose (i.e., inulin) because the reaction requires an additional step, namely, the isomerisation of glucose to fructose, via the 1,2-enediol or 1,2-hydride shift mechanism, before the dehydration reaction can occur [4]. This isomerisation is catalysed by Lewis acid (LA) or basic sites, and it is an equilibrium-controlled reaction typically recognised as a rate-determining step [13].
Sucrose has been considered a promising biomass feedstock for HMF production due to its wide abundance in agricultural and industrial waste as well as its low price. The production of HMF from sucrose with the aid of Brønsted acid (BA) and basic/Lewis acid (LA) sites involves a series of steps: (i) the hydrolysis of sucrose into glucose and fructose, (ii) the isomerisation of glucose into fructose, and (iii) the dehydration of fructose into HMF (Scheme 1).
However, obtaining high yields of HMF from sucrose is very challenging. This is due to the complex reaction network, which requires tailored active sites with different type and acid strength for each step of the reaction. The aim is to accelerate the main reaction pathway (indicated by the solid arrows in Scheme 1) while suppressing the undesired side reactions (indicated by the dotted arrows in Scheme 1). Furthermore, it is acknowledged that HMF is prone to instability in aqueous environments, where it is susceptible to undesirable side reactions, particularly at elevated temperatures and over extended reaction times. Consequently, low HMF yields have usually been obtained from sucrose in aqueous media. For example, Mulk et al. [14] achieved a mere 10% HMF yield from sucrose using 1M p-toluenesulfonic acid (pTSA) or 1M oxalic acid at 100 °C in ultrapure water. On the other hand, Steinbach et al. [15] used diluted H2SO4 in water as BA catalyst and obtained a 25% HMF yield from sucrose at 180 °C. In contrast, Tian et al. [16] utilised Lewis acid (6 mol% of AlCl3) as an effective catalyst for this reaction, obtaining a very promising HMF yield of 47% in a relatively short reaction time of 1 h and using a mixed solvent system containing 30% γ-valerolactone in H2O. However, given the challenges associated with homogeneous catalysts, including equipment corrosion (mineral acids), environmental toxicity (Lewis acids), and difficulties in product separation and catalyst recycling (both mineral and Lewis acids), current efforts are focused on developing heterogeneous systems for HMF production. For example, Kreissl et al. [17] studied the activity of Nb2O5 solid acid catalysts in the conversion of sucrose into HMF in water. The authors obtained HMF yields ranging from 13 to 36%, depending on the texture and acid strength of the Nb2O5 catalyst. In contrast, Tabtimtong et al. [18] utilised commercially available ion-exchange resins as catalysts to achieve a 24% yield of HMF from sucrose in a 2 h reaction at 150 °C in water.
The yield of HMF obtained from sucrose can be enhanced by adding an organic solvent to the aqueous solution. This process facilitates the extraction of HMF from the aqueous phase into the organic phase, thereby improving the yield of HMF. For instance, Tong et al. [19] utilised a biphasic solvent comprising tetrahydrofuran and H2O, in conjunction with Ge-catalysts, and achieved a 37% yield of HMF at 150 °C within a 100 min reaction time. In contrast, Tongtummachat et al. [20] tested commercial ion-exchange resins (Amberlyst-15 and Amberlyst-21) in a H2O-Methyl Isobutyl Ketone (MIBK) solvent system in a fixed-bed reactor. The authors obtained a 65% yield of HMF from sucrose in a 0.5 h reaction at 120 °C. Furthermore, Zhang et al. [21] applied tin phosphate catalysts in a 65% DMSO-35% H2O biphasic solvent and achieved a 45% yield of HMF in a 1 h reaction at 135 °C. On the other hand, Perez et al. [22] obtained a high HMF yield of 60% using novel chromium catalysts with sulfosuccinic acid ligands in a complex three-phase solvent mixture consisting of H2O, ionic liquid, and MIBK.
Notwithstanding, it is imperative to acknowledge that the utilisation of organic solvents increases the complexity of these technologies and concomitantly results in elevated costs. Moreover, it enables the incorporation of only minimal loadings of the substrate. Hence, the discovery of cheaper catalysts that can be easily prepared and exhibit high activity in water is crucial for the future wide application of HMF as a platform molecule. In this sense, catalysts derived from carbon hydrochars, which can be easily prepared via hydrothermal carbonisation (HTC) from low-cost precursors such as biomass-derived sugars, are a promising option for large-scale applications. HTC is performed under relatively mild reaction conditions, resulting in lower production costs and energy requirements than those for conventional pyrolysis methods [23]. The resulting hydrochars exhibit an amorphous structure, hydrothermal stability, and a high density of protonic active sites [24] in the form of oxygen functionalities, which are beneficial for obtaining higher selectivity for HMF in fructose dehydration [25]. Moreover, these materials can be readily functionalised in situ during HTC by adding suitable precursors. For example, it has been demonstrated that the HTC of glucose with taurine can produce multifunctional catalysts containing high concentrations of sulphur and nitrogen within their structures and displaying very good catalytic activity in the esterification of methanol and acetic acid [26]. Moreover, nitrogen-doped catalysts containing basic sites showed great activity in the isomerisation of glucose to fructose [27,28], whereas sulfonated biochars (with BA sites) were reported to exhibit high activity in the dehydration of fructose into HMF [24,29]. In our previous work, we successfully obtained sulphonated hydrochar via the HTC of starch in the presence of diluted sulphuric acid, which obtained promising results in the transformation of sugarcane molasses into HMF [9].
Microwave processing has been reported to increase the rates and selectivity of chemical processes due to its ability to induce faster and more uniform heating in comparison to conventional heating techniques [30]. For example, Gomes et al. investigated the production of HMF from fructose and sucrose and achieved high yields of HMF through the utilisation of natural deep eutectic solvents. By applying microwave heating, the authors were able to reduce the reaction time from 45 to 11 min [31]. A microwave reactor was also successfully used for the production of HMF from sugarcane molasses [9] and sugar beet molasses [32]. Due to these advantages, a microwave reactor was used for the catalytic tests in the present work.
Taking this information into account, a combined approach was explored in the present work to synthesise bifunctional hydrochars via one-step hydrothermal carbonisation (HTC), using glucose as the carbon source and urea/thiourea as functionalisation agents to introduce N and N, S- functionalities into the carbon structure. Subsequently, the bifunctional catalysts were tested in the production of HMF from sucrose in water under microwave- or conventional heating conditions. Additionally, kinetic modelling was applied to estimate the influence of the reaction conditions on the reaction pathway. The novelty of the study lies in the simplicity of obtaining sustainable bifunctional catalysts for the production of platform chemicals from inexpensive and readily available feedstocks.

2. Results

2.1. Elemental Analysis

The results of the CHNSO analysis of the samples are gathered in Table 1. According to these results, urea was successfully used to introduce N functionalities, whereas thiourea served as a precursor for both N and S groups during hydrothermal carbonisation. As evidenced by the EA results, our method facilitated control over the content of S and N introduced into the materials by varying the dosage of thiourea added. In this way, the doping level could be changed from 3.9 to 12.7 wt% for S and from 3.5 to 10.4 wt% for N. It should be noted that thiourea contains high concentrations of N (36.8 wt%) and S (42.1 wt%), resulting in a significant incorporation of high amounts of N and S functionalities into the hydrochars obtained. Furthermore, higher amounts of S functionalities than N functionalities were introduced into the hydrochars, reflecting the concentration of these heteroatoms in the precursor. Moreover, the contents of S and N introduced into the materials were proportional to the amount of thiourea used. However, tripling the amount of thiourea only led to a two-fold increase in the dopant content (see CG_TU_12h and CG_3TU_12h in Table 1). Similarly, comparison of the nitrogen content in the samples prepared with urea (i.e., CG_U_12h) and thiourea (i.e., CG_TU_12h) (as shown in Table 1), revealed that a higher amount of N was introduced using the former source. This can be attributed to the higher nitrogen content in urea (46.7 wt%) compared to that in thiourea (36.8 wt%).
The results presented in Table 1 indicate that extending the duration of the HTC with thiourea (TU) slightly increased the nitrogen content in the samples, whereas the S content remained unchanged (compare CG_TU_12h with CG_TU_24h), and the oxygen content decreased. Furthermore, the carbonisation of the CG_TU_12h to produce CG_TU_12h_carb significantly increased the content of C (from 57.1 to 83.7 wt%) and slightly increased the amount of N (from 5.2 to 5.6 wt%) but led to a substantial reduction in S (from 6.1 to 2.1 wt%), hydrogen (4.6 to 1.9 wt%), and oxygen (from 27.3 to 7.0 wt%). The decrease in S functionalities can be attributed to the significantly lower thermal stability of the S-containing groups in comparison to their N-containing counterparts. This observation is consistent with the findings of Rustamaji et al., who reported a higher content of N than S in activated carbon obtained from thiourea-functionalised biochars [33]. Interestingly, ball milling of CG_TU_12h_carb resulted in a slight decrease in both the S and N contents, accompanied by an increase in the O content. Similar trends have been previously observed for ball-milled carbon xerogels [34]. Some authors have suggested that the mechanical energy generated by collisions between the milling balls and the material not only reduces particle size but can also facilitates the breaking or formation of chemical bonds. Consequently, the oxygen present in the vial may bond to the carbonaceous sample during ball milling, or the sample surface may oxidise spontaneously after the process due to mechanically induced structural defects [35].

2.2. X-Ray Photoelectron Spectroscopy

XPS analysis was performed to determine the chemical compositions and electronic states of the elements on the surfaces of the catalysts, and the results are presented in Table 2. In agreement with the findings from the EA, the XPS survey spectra revealed the presence of carbon, oxygen, nitrogen, and sulphur species on the surface, depending on the doping agent used during the HTC of glucose. By comparing the results obtained from both analyses (i.e., XPS and EA, as presented in Table 1 and Table 2), the distribution of elements in the samples could be established. Although the surfaces of the prepared materials were rich in oxygen (with an O content ranging from 11% to 21% (see Table 2)), higher oxygen concentrations were observed in the bulk of the samples (Table 1). For instance, CG_12h exhibited a 28.0 wt% of oxygen in the bulk but only 20.3 wt% on the surface. Similarly, after in situ treatment with urea or thiourea, nitrogen functionalities predominantly appeared in the bulk of these materials, as evidenced by the higher concentrations of this element determined from EA in comparison to the XPS. Moreover, CG_U_12h, functionalised with urea, exhibited a higher concentration of N on the surface in comparison to CG_TU_12h, obtained using thiourea (6.1 vs. 4.2 wt% (see Table 2)), in line with the findings from EA. On the contrary, sulphur species (in the TU-modified hydrochars) were concentrated predominantly on the surface, except for the carbonised sample (see CG_TU_12h_carb_BM in Table 2), which showed the opposite trend.
The XPS results also demonstrated that both carbonisation and ball milling strongly influenced the surface compositions of the materials, leading to a significant decrease in the concentrations of S and N in the hydrochars compared to those in the parent CG_TU_12h. Moreover, the results for CG_TU_12h_carb_BM exhibit a significant increase in the surface oxygen content, in agreement with our previous findings [34].
High-resolution N1s, S2p, and O1s XPS spectra were analysed to characterise the chemical nature of the heteroatom doping present in the near-surface regions of the selected samples. The atomic percentages of N, S, and O species determined by fitting the corresponding core-level spectra are presented in Table S1 in the Supplementary Materials.
The representative N1s spectra of the samples are presented in Figure 1, while the corresponding O1s and S2p spectra are gathered in Figure S1 in the Supplementary Materials. The XPS N1s spectrum of CG_U_12h (see Figure 1a) was deconvoluted into three peaks situated at binding energies (BE) of 398.7 eV (26.1 at%), 400.1 eV (46.4 at%), and 401.5 eV (27.4 at%), corresponding to pyridinic-N (N-6) groups, pyrrolic-N (N-5), NH2, and quaternary (graphitic) N (NQ) or N-O groups, respectively [34,36,37,38]. The presence of N-6 and NQ groups in the hydrochars produced at 180 °C (see Experimental) may appear surprising, as these moieties are typically associated with N-doped carbons obtained via high-temperature pyrolysis [37,39]. However, as reported by Falco et al. [40], during the HTC of monosaccharides in the presence of N-containing precursors (i.e., urea, melamine, or amino acids), the carbonyl functional groups present in sugars and their derivatives (e.g., HMF) can react with the amino groups of the dopant via Maillard-type cascade reactions, leading to the formation of stable N-containing heterocycles (e.g., N-5, N-6, or NQ species). Thus, it appears that the in situ functionalisation of hydrochar with urea favoured the formation of N-5 or pyridone, followed by NQ and N-6 in comparable concentrations (see Table S1). This composition is consistent with the findings of Florent et al. [33,41], who prepared urea-doped carbons. Moreover, the identification of NQ in our hydrochars is further supported by the results of Guo et al. [11], who reported NQ species in hydrochars prepared from urea and Camellia sinensis waste via HTC at T > 160 °C.
The deconvolution of the XPS N1s spectra of the thiourea-functionalised samples (Figure 1b,d) revealed a nitrogen chemistry similar to that of CG_U_12h described above. However, an additional peak was found in these samples at a higher binding energy (i.e., BE = 403.1–403.4 eV). According to the literature, these species represent certain forms of oxidised nitrogen, such as pyridine N-oxide groups (i.e., O=N-C denoted as N-X) [36,38]. It should be noted that the presence of N-X significantly improves the wettability of carbon materials, as reported by Li et al. [42], which is particularly relevant for our application. Accordingly, the deconvolution of the N1s XPS spectrum of CG_TU_12h (see Figure 1b) distinguished four nitrogen species, namely, N-6 (398.3 eV, 9.4 at%), N-5 (400.2 eV, 25.2 at%), NQ (402.6 eV, 40.4 at%), and N-X (403.1 eV, 25.0 at%). A similar composition of the N-species has previously been reported for carbon materials doped with thiourea [33,36].
In contrast to the material functionalised with urea, doping the hydrochar with thiourea promoted the introduction of N in the form of NQ species instead of N-5 groups. Interestingly, the distribution of different N-species was independent of the amount of thiourea used in the synthesis, as the CG_0.5TU_12h, CG_TU_12h, and CG_3TU_12h samples exhibited similar relative concentrations of the different N species (see Table S1 and compare Figure 1b,d). However, a slight decrease in N-5 and NQ and an increase in N-X were noted with the extended HTC time (compare CG_TU_12h and CG_TU_24h in Table S1). Moreover, the carbonisation at 700 °C followed by ball milling (sample CG_TU_12h_carb_BM) led to a significant increase in NQ content and a reduction in N-5 and N-X as evidenced from the comparison of Figure 1b,d. These observations are consistent with other reports [27].
The deconvoluted high-resolution XPS S2p spectra of selected samples (CG_TU_12h and CG_TU_12h_carb_BM) are shown in Figure 2. The broad signals in this region were deconvoluted into three distinct doublets with 1.2 eV splitting and an area ratio of 1/2 arising from spin-orbit coupling, respectively. The first doublet, centred at BE ≈ 163.0–164.9 eV, was assigned to the characteristic low-oxidised covalently bonded sulphur in thiophene-S (C–S–C) and thioethers [6] or the S-S configuration [36]. The second doublet, positioned at BE = 165.1–166.7 eV, was identified as R2-S=O in sulphoxides or sulphones [13]. The remaining peaks at the highest BE (169.5–170.7 eV) were attributed to oxidised sulphur in the form of –SO3H groups [32,33].
Analysis of the deconvoluted XPS S2p spectra of CG_TU_12h and CG_TU_12h_carb_BM (Figure 2a,b) revealed that most of the oxidised sulphur species were decomposed during the thermal treatment and subsequent ball milling of CG_TU_12h. The remaining sulphur was primarily present in the form of thiophene-type C-S-C structures (see also Table S1), which are generally attached to the edges and defects of the carbon matrix.
It should be noted that fitting the XPS O1s spectrum of carbon materials can be challenging due to the variety of overlapping components and the narrow BE range for each O-species. A comparison of the XPS O1s spectra for CG_TU_12h and CG_TU_12h_carb_BM is shown in Figure 2c,d. The fittings of the XPS O1s spectra of the remaining samples can be found in Figure S1 in the Supplementary Materials. As seen in Figure 2c,d, the peak at the lowest BE (530.7–531.3 eV) was attributed to C=O in carbonyls and quinone-like structures. The subsequent peak at BE = 532.5–533.1 eV was assigned to the combined effects of oxygen in phenols and ethers (C-O-C), C-O/N, and -SO3H groups (only in hydrochars with TU). The peak with the highest BE (534.3–534.6 eV) was attributed to –COOH functionalities [9,43,44].
The overall composition of the oxygen species on the surfaces of the prepared carbon materials was similar to that of typical hydrochars, which are generally rich in hydroxyl, carbonyl, and carboxyl groups [45]. The respective concentrations of different O-functionalities are listed in Table S1 in the Supplementary Materials. According to the data, single-bonded oxygen was present in the highest concentrations, followed by the carboxylic groups and double-bonded oxygen. Interestingly, CG_TU_carb_BM displayed the lowest ratio of (-O-)/COOH, indicating the introduction of carboxylic groups during the ball-milling process. Moreover, as evidenced by Table S1, the quantity of carbonyls increased with the increase in the dosage of thiourea from 3.5 at% in CG_0.5TU_12h to 7.4 at% in CG_3TU_12h. A careful inspection of the data also revealed a higher concentration of carbonyls in CG_U_12h functionalised with urea (11.9 at%) as compared to CG_TU_12h modified with thiourea (4.8 at%). Moreover, CG_TU_12h exhibited the highest quantities of lactonic and phenolic groups (71.1 at%) among all the catalysts investigated in the present study.

2.3. Total Acidity Measurement

The total acid site density (Atot) values were measured via potentiometric back titration, and the results are shown in Table 2. The highest total acidity was observed for the unmodified hydrochar (CG_12h), with an Atot of 2.32 mmol H+/g, which is comparable to values reported in the literature for sugar-derived hydrochars. For instance, in our previous work, we obtained an Atot = 1.78 mmol H+/g for hydrochar produced from starch [9] and an Atot = 1.45 mmol H+/g for hydrochar derived from sugarcane molasses [46]. The high acidity of these hydrochars is linked with the abundance of oxygen (see Table 1 and Table 2), primarily in the form of surface O-containing functionalities (i.e., weakly acidic groups such as hydroxyl (-OH) and carboxylic (-COOH) groups), which originate from incomplete carbonisation of sugars (see XPS results in Table S1). The addition of thiourea to the HTC process slightly reduced the Atot (to ≈1.6 mmol H+/g) in CG_TU_12h compared to that in CG_12h. The incorporation of S and N into the carbon matrix likely altered the surface chemistry of hydrochar by introducing newly formed acidic and basic groups (in varying proportions) or by modifying or blocking the pre-existing O-containing species. Moreover, extending the HTC time to 24 h resulted in an increased Atot in comparison to CG_TU_12h, reaching an Atot of 2.26 mmol H+/g. This value was comparable to that obtained for CG_12h. The increase in the acidity of CG_TU_24h compared to CG_TU_12h is a consequence of the incorporation of larger quantities of more-acidic groups during the extended HTC, which is in line with the higher content of oxygen measured for CG_TU_24h as compared to that for CG_TU_12h (see the XPS results in Table 2). Notably, increasing the thiourea content significantly reduced the sample’s acidity (to 0.29 mmol H+/g), suggesting that excessive N and S incorporation may hinder the formation of acidic O-functionalities (see also the oxygen content for CG_3TU_12h in Table 2). Additionally, the formation of basic nitrogen-containing groups (e.g., pyridinic-N (N-6) and pyrrolic-N (N-5) (see Figure 1b,d)) may have contributed to the apparent decrease in acidity, either by neutralising acidic sites or by influencing the acid–base titration measurements. The most pronounced decrease in acidity was observed for CG_TU_12h_carb_BM, which was subjected to carbonisation at 700 °C, resulting in a total acidity of 0.03 mmol H+/g. This result confirms that high-temperature treatment effectively removed surface acidic groups, thereby significantly enhancing the basicity of CG_TU_12h. These findings are in good agreement with the XPS results in Figure 2b,d.

2.4. Scanning Electron Microscopy (SEM-EDX)

Scanning electron microscopy was performed to compare the morphologies of the hydrochars. Selected SEM images demonstrating the overall morphology and particle size distributions are gathered in Figure 3. During the hydrothermal carbonisation, glucose underwent a series of reactions, including dehydration, condensation, polymerisation, and aromatisation, forming carbon particles with a typical spherical morphology, as previously reported [23,45]. A similar morphology was observed for hydrochars obtained from other carbohydrates, including starch [9], fructose, and xylose [47,48].
A high-magnification image of CG_TU_12h, along with the EDS analyses of different regions of the sample, is shown in Figure S2 in the Supplementary Materials. As evidenced in this figure, the micro-spheres appeared to have smooth surfaces, and no porosity was observed, which explains the absence of a measurable surface area for these hydrochars. The SEM images showed mostly regular, fused spherical particles with sizes between 1.0 and 8.5 µm. The smallest micro-spheres were obtained in CG_12h, prepared solely from glucose, with an average particle size of approximately 1 µm (see Figure 3a). A similar morphology has been previously reported for this type of material and was attributed to the rapid dehydration, polymerisation, and aromatisation of glucose during HTC [49]. Interestingly, adding urea or thiourea to glucose during the HTC increased the average particle size of the resulting hydrochars (compare Figure 3a,b,e).
Moreover, a clear relationship was observed between the amount of thiourea used and the average particle size—i.e., the more thiourea added, the larger the particle size of the hydrochar. Interestingly, a comparison of the morphologies of CG_TU_12h and CG_U_12h in Figure 3b,e reveals that a smaller average particle size and narrower size distribution were achieved in the presence of urea (5.9 µm for CG_U_12h vs. 7.3 µm for CG_TU_12h, respectively). Furthermore, considering the influence of the duration of the HTC on microsphere size, similar average particle sizes were obtained after 12 and 24 h of treatment (compare Figure 3b,d).
A higher-resolution SEM image of CG_TU_12h (Figure S2 in the Supplementary Materials) showed a mixture of large and much smaller particles. The EDS analysis performed on the larger particles (Z1 in Figure S2) and the smaller ones (Z2 in Figure S2) indicated that the distribution of S and N was not homogeneous in this sample. As shown by the EDS results (see insert in Figure S2), the zone containing larger particles was richer in sulphur, whereas the smaller particles in the Z2 region contained more nitrogen.

2.5. Raman Spectroscopy

The effect of the synthesis method employed on the defect structures of the samples was investigated using Raman spectroscopy, and the obtained spectra are shown in Figure 4. All the samples displayed five peaks: (i) the D1 band associated with glucose (ca. 1080 cm−1) [50]; (ii) the D2 band (ca. 1200 cm−1), corresponding to disorder-induced modes in carbon; (iii) the D band (ca. 1350 cm−1), representative of the structural defects in the carbon structure; (iv) the D4 band (ca. 1500 cm−1) linked to functional groups and amorphous structures in the material; and (v) the G band (ca. 1580 cm−1) characteristic of graphitic carbon [51]. The intensity ratio of the D-to-G peak (AD/AG) is typically applied to assess the degree of structural disorder in carbon materials. The larger the AD/AG value, the greater the number of defects found in the carbon. Calculation of the AD/AG ratio, as shown in Figure 4, revealed that the addition of urea (U) into the synthesis (sample CG_U_12h) led to an increase in the sample’s disorder relative to CG_12h (1.11 vs. 0.86, respectively). Regarding the samples prepared using TU, increasing the HTC time from 12 h to 24 h (see samples CG_TU_12h and CG_TU_24h in Figure 4) resulted in a decreased degree of structure ordering (AD/AG = 0.56 vs. 0.84, with both values being lower than that obtained for CG_12h). Regarding the impact of TU dosage, CG_0.5TU_12h (prepared with 0.5 g of TU) showed more defects than the CG_12h sample (AD/AG = 0.97 vs. 0.86). Conversely, increasing the TU amount to 1 g (CG_TU_12h) led to the highest degree of graphitisation among all the samples (AD/AG = 0.56), while further increasing the TU content (CG_3TU_12h) led to an increase in the number of defects (AD/AG = 0.80). On the other hand, the highest degree of defects (AD/AG ≈ 1.50) was found in the carbonised sample (CG_TU_12h_carb). These findings are consistent with reports in the literature that attributed the increase in the AD/AG after thermal activation at T > 700 °C to the greater formation of defects in the carbon structure [46]. Surprisingly, no significant further changes were observed after the ball milling of CG_TU_12h_carb (see CG_TU_12h_carb_BM in Figure 4).

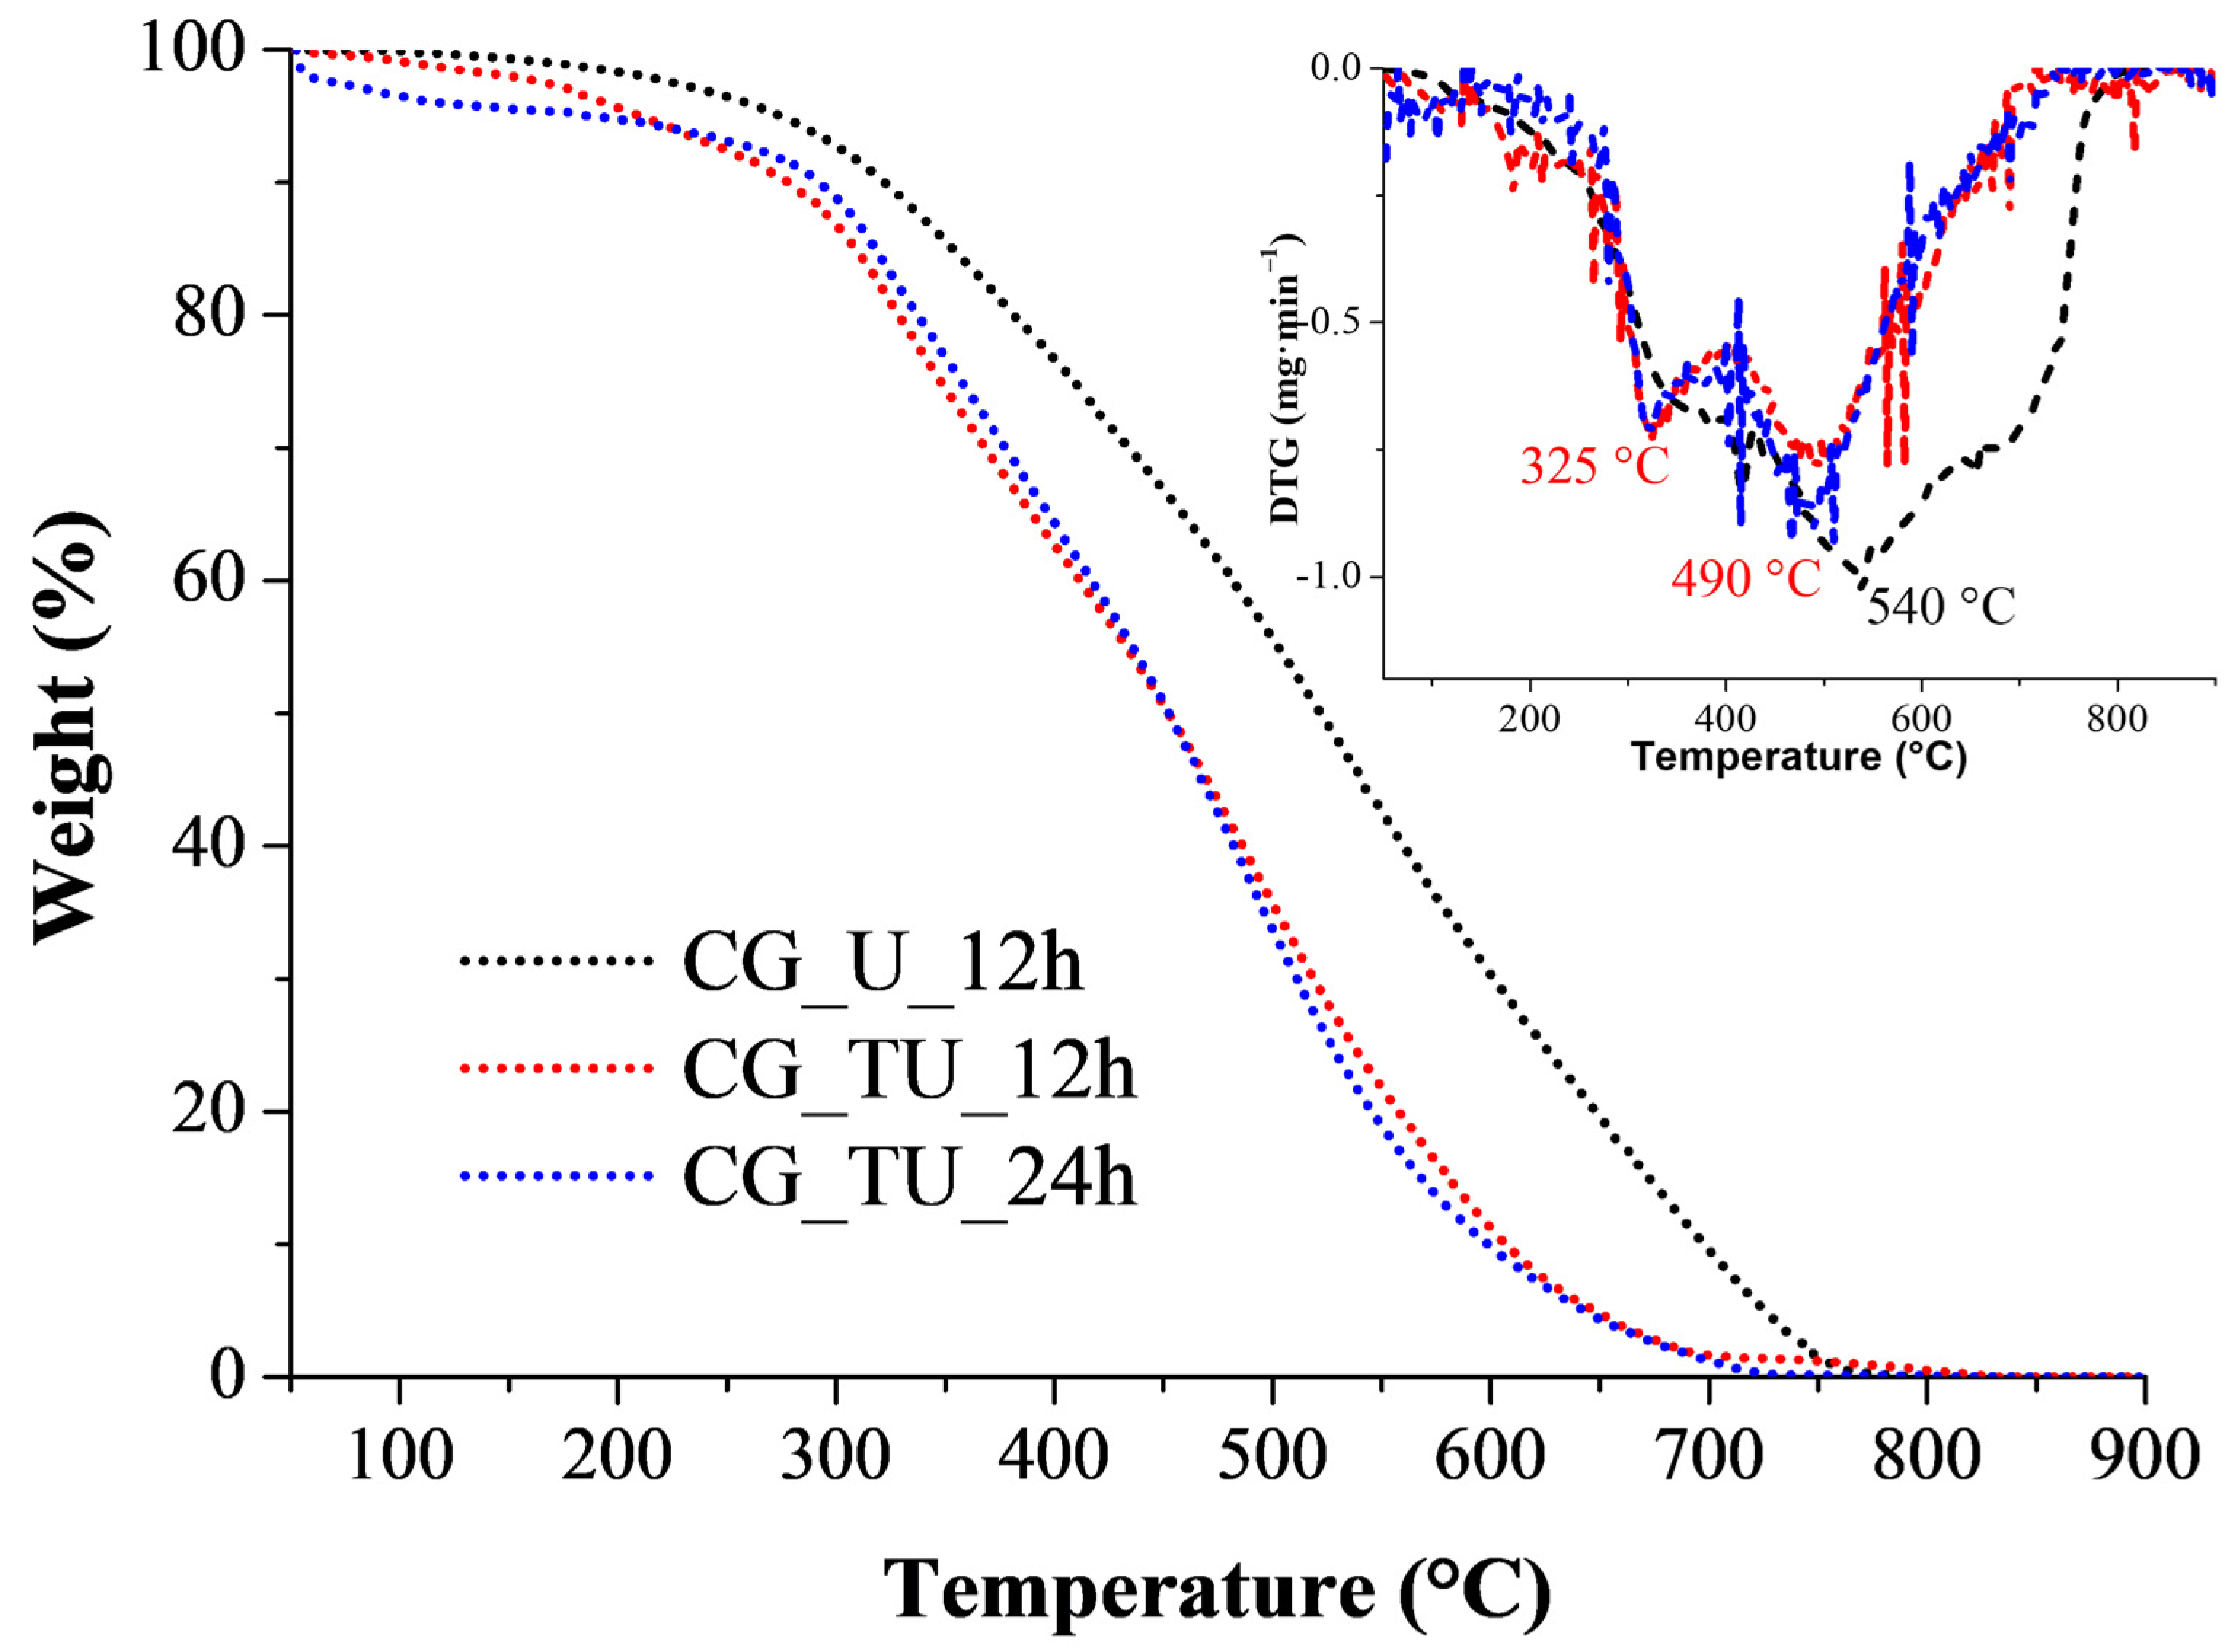
2.6. Thermogravimetric (TG) and Differential Thermogravimetric (DTG) Analysis

Thermal analysis provides insights into the bulk chemistry of materials rather than their surfaces. It is well established that the more stable the carbon structure, the higher the temperature required for its gasification under oxidising conditions. Thus, TG analysis under an air atmosphere was performed to study the oxidative stability of the selected samples doped with urea and thiourea. As shown in Figure 5, the CG_TU_12h and CG_TU_24h samples, both containing S and N, exhibited similar weight loss profiles, reflecting their comparable compositions (see also EA in Table 1). These samples showed nearly 99% weight loss at T = 700 °C. On the contrary, the weight loss profile of the hydrochar prepared with urea, i.e., CG_U_12h, was significantly different.
Notable weight loss was observed starting from approximately 300 °C, with complete oxidation (100% weight loss) registered at T = 770 °C. This implies that the CG_U_12h sample showed higher oxidative stability than its counterparts prepared with thiourea. Upon comparing the elemental compositions of these samples in Table 1 and the XPS results in Table S1, it can be surmised that the higher thermo-oxidative stability of CG_U_12h compared to that of CG_TU_12h and CG_TU_24h may stem from a higher content of thermally robust N functional groups (e.g., pyrrole and pyridine) [52] and the absence of sulphur functionalities. Increased carbon stability after doping with N has previously been reported for other carbon materials [53]. On the other hand, the sulfonated carbons exhibit a weakened structure in cross-linkage, resulting in reduced onset temperatures for oxidative degradation [54].
The literature data indicate that thiourea mixed with carbon decomposes at 200 °C [55], whereas urea decomposes at around 300 °C [55]. However, the DTG profiles of the urea- and -thiourea doped hydrochars (depicted in the inset in Figure 5) exhibited signals at higher temperatures, which indicated that all the urea and thiourea reacted with glucose during HTC, leading to the incorporation of S and N heteroatoms into the hydrochar structure. As evidenced in this figure, three major peaks were distinguished in all cases: (i) a minor moisture-related peak at 100–150 °C, followed by (ii) an intense broad band containing two overlapping peaks at Tmax = 325 °C and 490 °C with a broad shoulder extending up to T = 700 °C. Similarly, three peaks were observed in the DTG profile of CG_U_12h, yet the minima of the peaks were shifted towards higher temperatures (i.e., Tmax = 400 °C and 540 °C, with the shoulder extended to 790 °C). The peaks observed at T < 400 °C can be associated with cracking organic compounds present in the hydrochar and removal of thermally unstable oxygen functionalities such as carboxylic acids, anhydrides, or S-containing functionalities (in TU modified hydrochars). In fact, the release of SO2 attributed to sulfonic groups was reported at T = 250–366 °C in the pyrolysis of sulfonated solvothermal carbons, along with signals from sulfoxides and sulfonates decomposing at slightly higher temperatures [48]. On the other hand, sulphur in thiophenic configurations is considered the most resistant to thermal decomposition [32]. The XPS analysis revealed the presence of all these S-species in CG_TU_12h and CG_TU_24h (see Table S1 in the Supplementary Materials). The drastic weight loss at T > 600 °C observed for both types of hydrochar involved the release of more thermally stable nitrogen and oxygen functionalities, including aromatic C-N, followed by the final collapse of the carbon skeleton due to combustion in air [56]. It is important to note that the DTG results demonstrate that the urea- and thiourea-doped hydrochars prepared in the present work exhibited significant thermo-oxidative stability up to approximately 250 °C.

2.7. Catalytic Results

As previously stated in the Introduction, the cascade synthesis of HMF from sucrose typically involves three steps: (i) hydrolysis of sucrose into equimolar glucose and fructose, followed by (ii) the isomerisation of glucose into fructose and finally (iii) the dehydration of fructose into HMF (see Scheme 1 in the Introduction). The main challenge in the aforementioned reaction is to suppress the side processes, which, based on the literature reports, involve the rehydration of HMF into levulinic and formic acids as well as the polymerisation of sugars and HMF to form water-soluble monomers or insoluble humin [43,49,57]. Thus, the role of the quantity, type, and combination of catalytically active sites (N-basic sites and S, O- functionalities) on the cascade conversion of sucrose into HMF was investigated in the present study. Green, inexpensive, and easy-to-prepare hydrochars were used as catalysts in a microwave reactor, with water selected as the environmentally friendly solvent. It has been noted that the dehydration of sugars has been scarcely studied in water, mainly because water can promote the further conversion of HMF into organic acids or undesirable humin, ultimately reducing HMF yields [58].

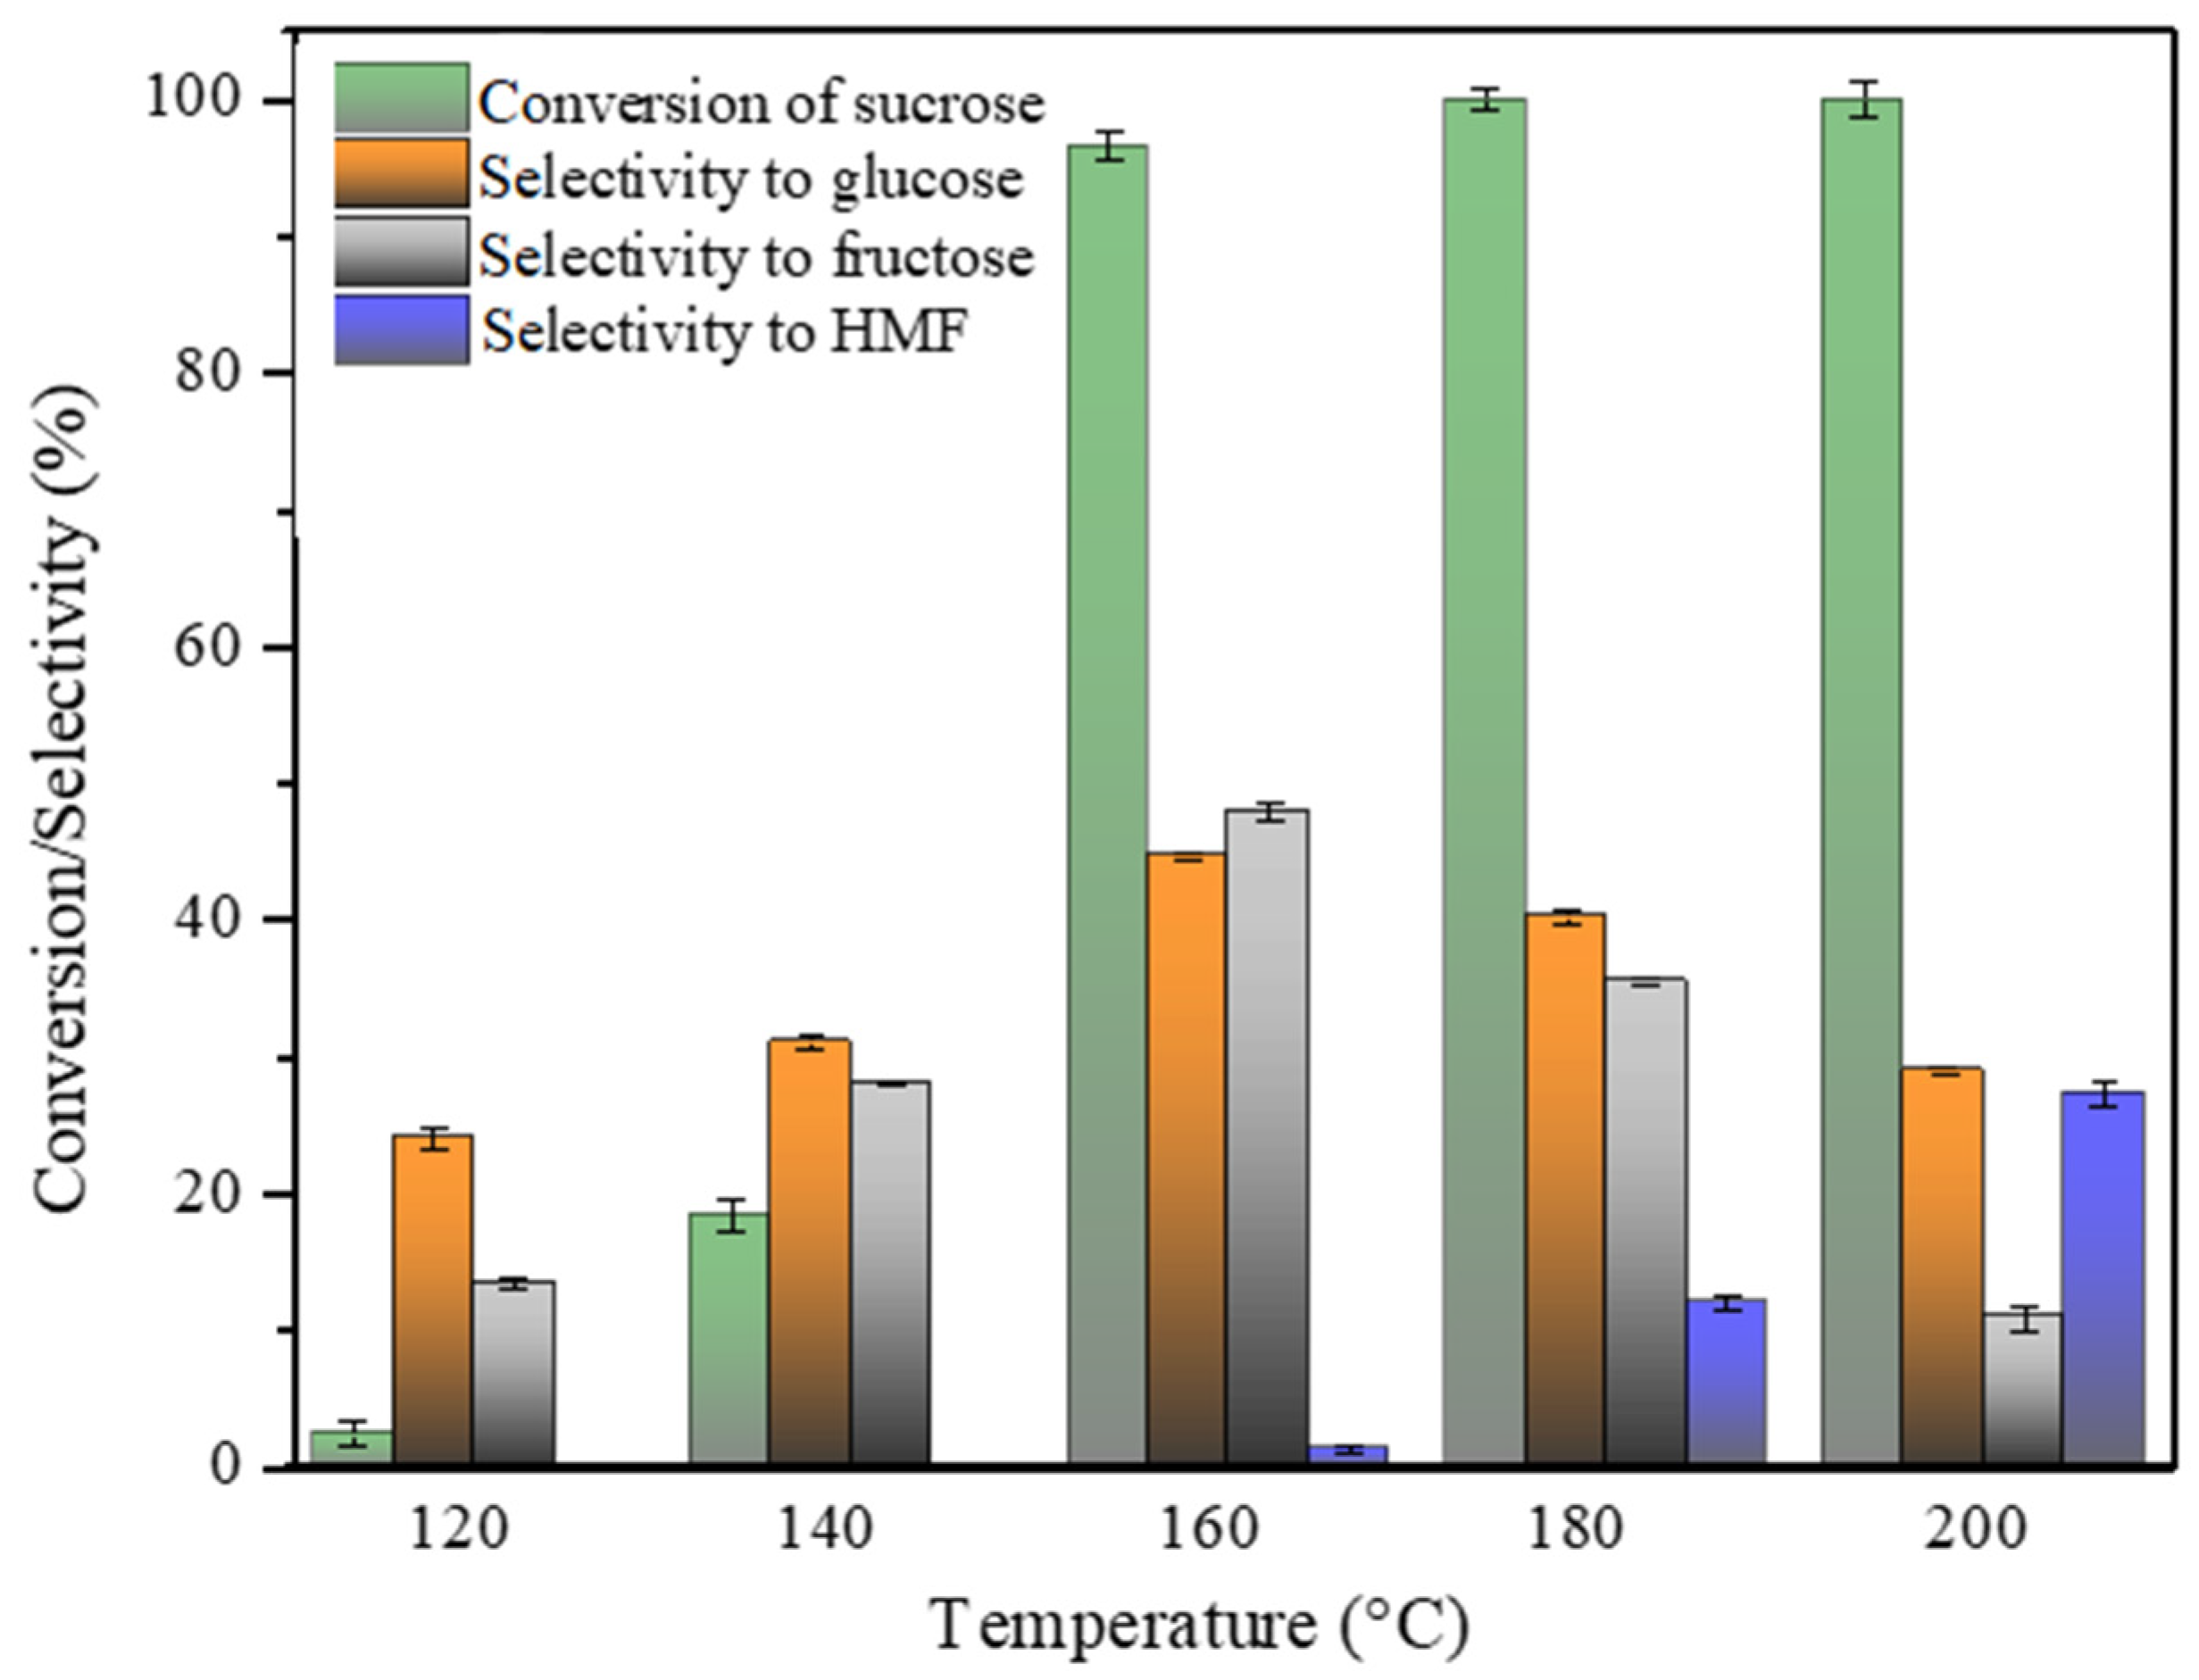
2.7.1. Impact of the Reaction Temperature on the Reaction

It has been previously reported that the dehydration of sugars into HMF strongly depends on the reaction’s temperature and duration [57]. Microwave irradiation is widely recognised as a green heating method that enables much shorter reaction times and higher selectivity than conventional heating [59]. Thus, preliminary studies including reactions without a catalyst (blank tests) were performed using microwave heating at various temperatures (T = 120–200 °C) in a 30 min reaction to determine the optimal conditions. The results are shown in Figure 6. The short reaction time was selected based on reports that underscored fast reaction kinetics usually achieved using microwave reactors [31,49,59].
As demonstrated in Figure 6, significant amounts of HMF were only obtained at T > 160 °C. Conversely, temperatures below 160 °C were insufficient for the promotion of sucrose conversion, which remained at less than 20%. Moreover, the dehydration of fructose into HMF did not occur at T < 160 °C, possibly due to inadequate activation energy. Interestingly, the isomerisation of glucose into fructose appears to require more moderate temperatures than fructose dehydration, as evidenced by the rapid increase in the fructose concentration compared to that of glucose with the increase in the reaction temperature from 120 to 140 °C. This is because the dehydration of hexoses is a slightly endothermic process [27]. The dehydration of fructose in water without a catalyst is facilitated by the hydronium ions (i.e., H3O+) produced reversibly from water at high temperatures and pressures. These ions act as proton donors, promoting acid-catalysed reactions [60], such as the removal of water from sugars. Moreover, higher temperatures increase molecular motion and collision rates, thereby enhancing the reaction rates. With a further temperature increase from 160 °C to 200 °C, the selectivity to HMF rose significantly from 1.3% to 27.0%. At the same time, the conversion of sucrose reached 100% at 180 °C. This suggests that the hydrolysis of sucrose in water is an autocatalytic process that occurs spontaneously after heating the substrate to a temperature greater than 160 °C. Importantly, at T > 160 °C, a drop in the concentrations of hexoses (i.e., glucose and fructose) was observed, indicating that the conversion of these sugars is favoured at higher temperatures. The highest selectivity for HMF, 27.2%, which was equal to the yield in this case, was obtained when the temperature and duration of the reaction were 200 °C and 30 min, respectively. These reaction conditions were therefore selected for the further screening of the prepared catalyst.
Subsequently, the determination of the activation energy (Ea) of the transformation of sucrose into HMF via hydrolysis was conducted in a microwave reactor, with water as the sole solvent and without the use of a catalyst. A series of reactions was thus carried out, employing 0.5% solutions of sucrose in water as a substrate at temperatures ranging from 120 to 160 °C for periods of between 45 and 90 min. The rate of sucrose decomposition was assumed to be first-order, consistent with the linear fit of the obtained data, which yielded an R2 value greater than 0.90 in the studied temperature range The respective rate constants (kT, where T is the reaction temperature) were derived for each temperature. The values of the rate constants were found to increase with temperature in the following order: k120 = 6.51 × 10⁻⁵ s−1 < k140 = 27 × 10−5 s−1 < k150 = 78 × 10−5 s−1 < k160 = 85 × 10−5 s−1. This observation indicated that the hydrolysis of sucrose was a highly temperature-sensitive reaction. Consequently, an Arrhenius plot was constructed (see the Supplementary Materials, Figure S3), allowing the determination of the Ea of sucrose hydrolysis as 97.2 kJ/mol. The obtained Ea falls within the range of values reported in the literature for this reaction. For instance, Pinheiro Torres and Oliveira obtained Ea of 98 ± 3 kJ/mol [61], whereas Tombari et al. reported Ea of 109.2 kJ/mol [62] for acid hydrolysis of sucrose. It is acknowledged that the variations in the reported values of Ea for sucrose hydrolysis are influenced by the specific experimental setup and conditions employed in each study.

2.7.2. Catalysts Screening

The prepared catalysts were tested in relation to the production of HMF in water under microwave irradiation, and the results are listed in Table 3. The HPLC analyses did not reveal any traces of levulinic or formic acids (i.e., typical products of HMF rehydration) as byproducts, indicating that the main side-reaction under the selected conditions was humin formation via the condensation of sugars, aldol addition, or the oligomerisation of HMF [9]. Consequently, a brown residue, resembling humin, was observed on the walls of the glass vial used for catalytic testing in a microwave reactor. As shown in Table 3, complete sucrose conversion was achieved for all of the catalysts except for CG_U_12h and CG_TU_12h_carb, a difference we attributed to the lower number of surface acidic functionalities on these catalysts (-COOH -SO3H) in these samples, as shown by the EA and XPS results (see also Table 2). Notably, as demonstrated in Table 3, the pristine hydrochar (i.e., CG_12h) exhibited a significant decrease in selectivity to fructose, falling from 10.8% (blank experiment) to 1.3%, suggesting high catalyst activity in the final step of the tandem reaction, i.e., the dehydration of fructose to HMF (catalysed by BA). In fact, CG_12h contained high quantities of oxygen functionalities, as shown via EA (28.0 wt%) and XPS (20.3 wt%) (see Table 1 and Table 2). Moreover, the high total acidity (Atot) of this catalyst (as listed in Table 2) suggested the presence of weakly acidic oxygen functionalities such as –COOH and –OH, which have previously been reported to promote the dehydration of fructose into HMF [25]. However, the increased fructose conversion did not result in the expected proportional increase in the selectivity to HMF, with this selectivity being only slightly higher than that obtained in the blank experiment (28.8% vs. 27.4%). Therefore, it seems that the CG_12h not only facilitated the dehydration of fructose to HMF but also promoted side reactions of fructose, including fragmentation, incomplete dehydration to form carbocations, retro-aldol reactions, and/or polymerisations into humin. These unwanted reactions can also be catalysed by BA sites. Interestingly, the selectivity to glucose obtained with CG_12h was similar to that observed in the blank reaction, indicating that the isomerisation of glucose into fructose was most likely a rate-determining step, possibly due to a lack of appropriate active sites on CG_12h.
The HMF yield was significantly improved by doping the hydrochar with thiourea, which introduced nitrogen and sulphur functionalities (see Table S1 in the Supplementary Materials). The best-performing CG_TU_12h catalyst reached 100% sucrose conversion with a selectivity to HMF (and thus yield of HMF) of 33.8%. Slightly worse catalytic performance was observed for CG_TU_24h, which exhibited an HMF yield of 30.3%. Interestingly, even though CG_TU_12h and CG_TU_24h had similar compositions as shown by EA (see Table 1), the respective concentrations of different S, N, and O-functionalities on the surface of these catalysts were slightly different (see Table S1). For example, CG_TU_12h had the highest relative quantity of pyrrolic functionalities, which are considered weakly basic sites. Due to the N atoms exhibiting high electronegativity, doping creates electron-deficient intrinsic carbon atoms, which form Lewis acid sites [63] that can facilitate the isomerisation of glucose into fructose. In addition, these catalysts also contained the highest amounts of phenolic functionalities (see Table S1), which, as shown in our previous work [25], can increase selectivity to HMF. Moreover, CG_TU_12h showed a higher degree of graphitisation (see the Raman spectroscopy results in Figure 4) and a lower Atot than the CG_TU_24h (Table 2). A higher Atot and the more disordered structure of CG_TU_24h can promote side reactions, such as humin formation, which are catalysed by BA sites, ultimately limiting the yields of HMF obtained.
Interestingly, the variation in the amount of thiourea used during the synthesis of the catalyst had a detrimental effect on the yield of HMF, and both CG_0.5TU_12h and CG_3TU_12h showed lower HMF yields than CG_TU_12h, as shown in Table 3. However, it was found that the selectivity to fructose obtained increased with the amount of thiourea used in the following order: CG_0.5TU_12h > CG_TU_12h > CG_3TU_12h. This trend can be correlated with the Atot of the catalysts, which decreased with the increase in the amount of thiourea added during the HTC of glucose. As shown in Table 3, both the carbonisation and ball milling of CG_TU_12h negatively impacted its catalytic performance, primarily due to the removal of most of the acidic functionalities. This is evidenced by the very low Atot of CG_TU_12h_carb_BM (see Table 2) and the absence of –SO3H groups on its surface (see Figure 2b and Table S1). It should be noted that the -SO3H groups, which were removed from CG_TU_12h at temperatures of between 250 and 350 °C (see TG results in Figure 5), provided strong Brønsted acidity. These BA sites are crucial for the dehydration of sugars by protonating hydroxyl groups and facilitating the elimination of water from fructose. CG_TU_12h_carb_BM also showed much lower amounts of the Pyridine N-oxide species, than CG_TU_12h. These species are a weak base that can facilitate the isomerisation of glucose to fructose [23]. Interestingly, CG_TU_12h_carb_BM contained sulphur in a thiophenic configuration, a form in which sulphur is slightly basic [31] and can enhance the adsorption of sugars and intermediates, leading to lower concentrations of glucose detected in the reaction catalysed by this material. Moreover, the presence of the carboxylic groups, introduced via ball milling, appeared to reduce the selectivity to fructose and HMF in comparison to CG_TU_12h_carb. These results can be related to the increased rate of side reactions on this catalyst.

2.7.3. The Influence of Different Variables on the Reaction Kinetics

The impact of different reaction parameters, such as time, reaction atmosphere, and substrate loading, on the reaction kinetics was studied using the best-performing catalyst, CG_TU_12h. Further catalytic tests were carried out using a conventionally heated batch-type reactor equipped with a sampling port and designed to conduct experiments under different atmospheres. However, the initial tests in the batch reactor revealed that the reaction temperature applied during catalyst screening using a microwave reactor (T = 200 °C) was too severe for use in a conventional batch reactor. Heavy production of polymer byproducts (i.e., humin) was observed during the heating of the reactor to the desired temperature, leading to the plugging of the sampling line. Consequently, the reaction temperature was reduced to 180 °C, and the time was extended to 120 min. According to the literature, the probability of forming high-molecular-weight side products generally increases upon increasing the temperature and the concentrations of HMF, sugars, and intermediates, as these condensation reactions are of a higher reaction order [9,63]. Under these milder reaction conditions, humin production was easier to control, while significant HMF yields could still be obtained.
The development of a kinetic model for describing the stepwise transitions involved in a cascade reaction, such as the conversion of sucrose into HMF, offers a unique way to evaluate the relative rates of conversions of different species under varied reaction conditions [60]. Sucrose was not detected after reaching the reaction temperature (T = 180 °C) in any of the catalytic tests carried out in the batch reactor because it was quickly hydrolysed during heating, and only glucose and fructose were present at the beginning of the reaction (t = 0). Thus, the first step of the tandem reaction, the hydrolysis of sucrose into glucose and fructose, was not considered during the development of the simplified kinetic model. Considering the experimentally observed changes in the concentration profiles of C6 sugars and HMF over time and the reaction models developed by Steinbach et al. [15] and Rocha et al. [32] for the conversion of sucrose into HMF, a simplified kinetic model was proposed, as shown in Figure 7. The reaction order for all intermediate and side reactions was set to one, in accordance with the literature [15]. Based on the developed reaction model, the rate constants (listed in Figure 7) were calculated for the intermediate reactions of the tandem process. In the proposed model, sucrose was assumed to hydrolyse spontaneously upon reaching the reaction temperature; therefore, the reaction is initiated with a mixture of glucose and fructose. Subsequently, glucose can isomerise into fructose (k1), which is followed by the dehydration of fructose, forming HMF (k2). Simultaneously, glucose can be directly converted into HMF without the desorption of fructose (k4). Finally, in our model, HMF, glucose, and fructose can react to form side-products such as xylose, furfural, soluble polymers, and/or insoluble humin through reactions such as the aldol condensation of the product and intermediates, among others [15,63]. The side products were lumped together, and the unwanted reactions were characterised by the following rate constants: k3, k5, and k6.
In contrast to previous studies on the conversion of sucrose into HMF using sulphuric acid as a catalyst [15], no traces of formic and levulinic acids were detected in our system, despite the aqueous environment. Therefore, the rehydration of HMF into organic acids was not included in our kinetic model. As mentioned before, the absence of these organic acids in the reaction mixtures strongly suggested that the low HMF yields obtained here were mainly due to the polymerisation side reactions.
Conversion into HMF was carried out by varying the reaction atmosphere (air or oxygen) and the substrate concentration (0.5% or 5%). The investigation of the effect of an oxygen atmosphere on sucrose dehydration is particularly relevant in light of potential further valorisation of HMF via oxidation into 2,5-furandicarboxylic acid (FDCA), a key polymer precursor.
Figure 8a shows the changes in the yields of C6 sugars and HMF in the dehydration of sucrose into HMF carried out under different atmospheres using 0.5% sucrose. This figure shows that the variations in the yields of sugars and HMF displayed similar trends independently of the reaction atmosphere. Specifically, the yield of both C6 sugars decreased over time; however, the rate of fructose consumption was much higher than that of glucose, regardless of the atmosphere. Simultaneously, the yield of HMF slowly increased, reaching a maximum value of 33.4% in air and 27.5% in oxygen.
Analysis of the calculated kinetic constants presented in Figure 7 revealed that the reaction mechanism differs slightly under both atmospheres. Namely, in air, the isomerisation of glucose into fructose (k1) did not occur; instead, glucose was primarily converted directly into HMF (k4). On the contrary, in oxygen, the isomerisation of glucose into fructose (k1) appeared to run parallel to the conversion of glucose into HMF, but at a significantly lower rate. Concerning the side products, fructose (k6) degradation was facilitated in air, whereas degradation of HMF (k3) was favoured in an oxygen atmosphere. Moreover, a comparison of the rate constants obtained for LL_sucrose_air and LL_sucrose_O2 showed that the dehydration of fructose into HMF (k2) was by far the fastest reaction in the network, followed by the direct conversion of glucose into HMF (k4), regardless of the reaction atmosphere.
Higher sugar loadings are generally desirable for commercial applications in order to minimise the downstream separation cost. However, higher substrate concentrations can also facilitate the polymerisation of the reaction intermediates and products into undesired humin. Thus, the impact of the starting concentration of sucrose was studied, and the results were described as tests of HL, i.e., a high loading of sucrose (5%), and LL, that is, a low loading (0.5%), in an air atmosphere. The changes in the concentration of intermediates and products are shown in Figure 8b,c. Good agreement was obtained between the concentrations predicted by the model (solid line) and those recorded experimentally (markers). A careful comparison of the concentration profiles revealed that in the HL reaction, the concentration of HMF reached a plateau after 90 min, showing that at this stage, a balance is achieved between the rate of HMF production and HMF’s degradation into humin and byproducts. On the contrary, when a diluted substrate was used, the concentration of HMF continued to rise slowly until the end of the testing time. A comparison of the yields of HMF and side products obtained using HLs and LLs of sucrose is shown in Figure 8d. The results reveal that a higher HMF yield (37.0%) was obtained with a HL in comparison to that with a LL (33%). The higher selectivity of the reaction at higher sucrose concentrations could be due to a higher reaction rate. The difference between the sum of carbon detected and 100% was attributed to non-quantified side products. Interestingly, as evidenced in Figure 8d, higher yields of side products were obtained under LL conditions. On the other hand, an increased yield of HMF was obtained with HLs in comparison to LLs, regardless of the reaction time. The results from the reaction modelling revealed that under a HL of sucrose, there was a much higher rate of fructose dehydration (k2) and no degradation of glucose into side products (k5). In addition, the rates of the conversion of glucose into HMF (k4) were similar, regardless of the substrate loading used. When comparing the HMF yields obtained using CG_TU_12h in a conventional batch reactor (37.0% at 180 °C in 120 min) to the 35.3% obtained in only 30 min at 200 °C in a microwave reactor, it is clear that microwave radiation improves heat transfer efficiency and significantly reduces the reaction time needed to achieve product yields similar to those of the conventional technologies.

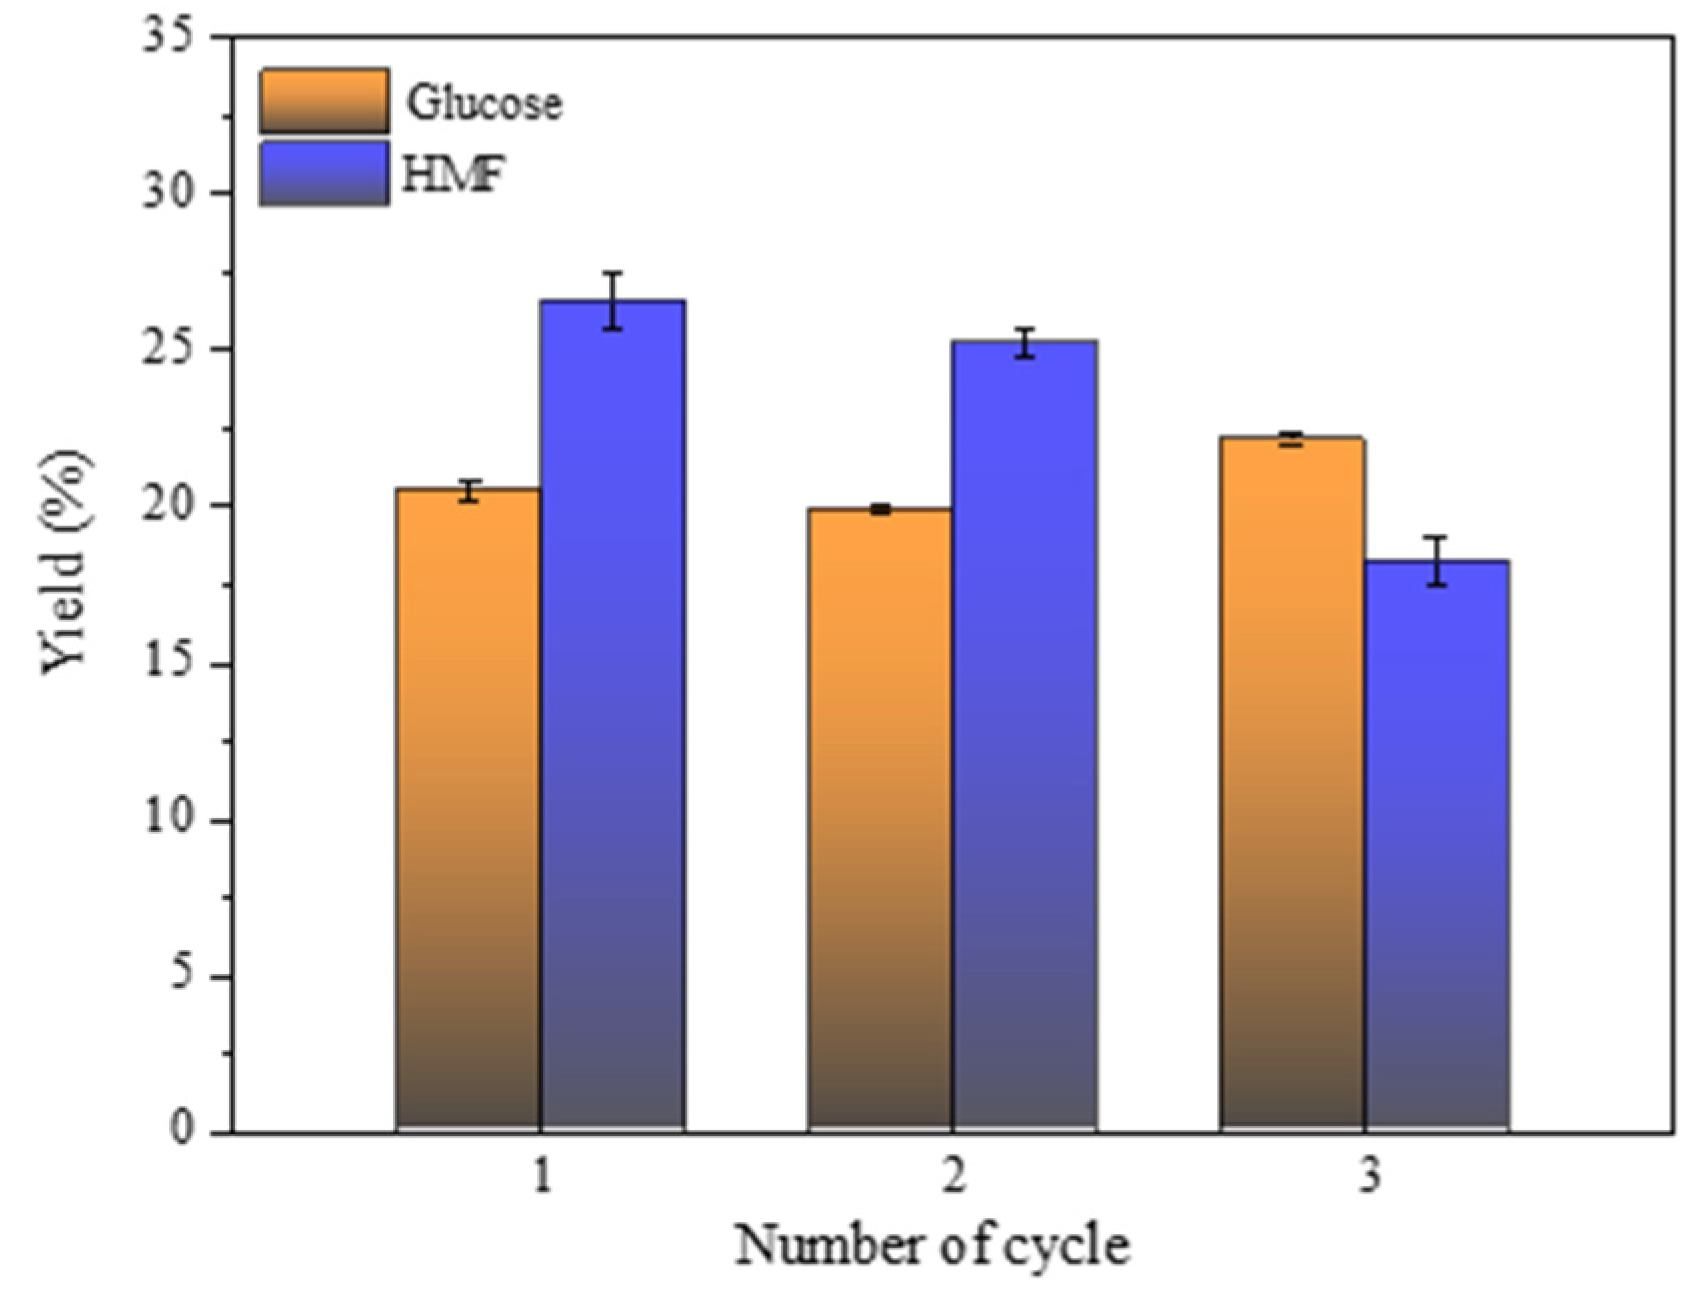
2.7.4. Recyclability of the Catalyst

From a commercial standpoint, the effective recovery and reuse of catalysts are of significant importance, as they lead to a reduction in costs and limit waste production. In this sense, the reusability tests for the catalyst that demonstrated the highest level of performance (CG_TU_12h) were carried out by recovering the spent catalyst and applying it in three consecutive reaction runs. The results shown in Figure 9 demonstrate a complete conversion of sucrose, with no traces of fructose detected in any of the reaction mixtures. Glucose and HMF were the only desired products detected in all the runs. It is noteworthy that the yield of glucose remained stable during the initial two cycles, remaining at approximately 20%, and exhibited a modest increase to around 22% following the third consecutive run. This observation indicated that glucose was more stable than fructose, and its conversion occurred at a slower rate than that of fructose, independently of the number of consecutive cycles. Conversely, fructose was rapidly consumed through dehydration, resulting in the formation of HMF. As demonstrated in Figure 9, the yield of HMF exhibited moderate variation across the runs, following a trend comparable to that of glucose, maintaining a constant level in the first and second cycles (approximately 26%). However, a significant decrease in the HMF yield to 18% was observed after the third run, concurrent with an increase in glucose yield from 20% to 22%. The detected accumulation of glucose in the reaction mixture, in conjunction with a decrease in HMF yield, suggests that CG_TU_12h displays relatively brief stability.
It is of great importance to understand the reasons behind the catalyst’s deactivation. Based on our previous studies focused on HMF production from various substrates [25,41], the following possible causes for the deactivation were identified: (i) leaching of the catalyst’s active sites or (ii) blocking of the active sites by adsorption of humin on the catalyst’s surface. Considering the former case, it is well documented in the literature that some S-functionalities, particularly sulphonic groups (-SO3H), can be thermally unstable, especially under hydrothermal conditions [64]. These groups were present in our catalysts (see S2p XPS results in Figure 2) and served as Brønsted acid sites facilitating the dehydration of fructose into HMF (see Scheme 1 in the Introduction).
Direct S determination in the spent catalyst (e.g., via EA) could be affected by the accumulation of carbon (via humin deposition), potentially interfering with accurate quantification. Thus, instead, we conducted Inductively Coupled Plasma (ICP) analyses of the reaction mixtures after the first and third runs by using the CG_TU_12h catalyst to determine the presence of S. The ICP results revealed the presence of 0.9 ppm of S after the first use and 0.3 ppm after the third consecutive use. In contrast, no traces of S were detected in the reaction mixture obtained in the blank experiments (in which the catalyst was not included). In view of these findings, it was established that the loss of activity of CG_TU_12h was most likely due to the adsorption of humin onto the catalyst. In fact, a significant quantity (around 30%) of unidentified products, such as dark-brown residues, were observed in each of the reactions. The humin produced was taken into account in the model as a side product (see Figure 7 and Figure 8). During the study of the catalyst’s stability, we also observed that the weight of the recovered catalyst increased after each run, indicating that humin deposition was likely the cause of the decrease in catalytic performance.
Given the evidence gathered, we believe that the formation of humin and its adsorption on the catalyst seem to be the primary reason for its deactivation, with leaching of sulphonic groups being a less significant contributing factor. The catalytic activity of CG_TU_12h could be partially restored by removing the adsorbed humin using appropriate polar solvents for this particular application. Examples of such solvents include diethyl ether, as has been previously reported [65]. This aspect will be analysed in our future work.

3. Materials and Methods

3.1. Catalyst Preparation

The catalysts were prepared via a facile one-step hydrothermal carbonisation (HTC) of anhydrous D(+) glucose (G, HiMedia, Modautal, Germany, >99%, CAS: 50-99-7) in DI water, using thiourea (TU, Thermo Scientific, Waltham, MA, USA 99%, CAS: 62-56-6) as the sole doping source of nitrogen (i.e., basic sites) and sulphur (i.e., acidic sites). Some weakly acidic oxygen functionalities were also introduced into the carbon materials during the synthesis. In a typical procedure, 9 g of glucose and 1 g of thiourea were dissolved in 56.7 g of deionised (DI) water, resulting in a ratio of 15 wt% of solids to 85 wt% of DI water. Subsequently, the mixture was placed in a 100 mL stainless-steel autoclave (Parr, Moline, IL, USA) equipped with a Teflon liner (Parr, Moline, IL, USA) and subjected to HTC inside a muffle furnace at 180 °C for 12 or 24 h, yielding hydrochars. Subsequently, the obtained solids were filtered out under a vacuum using Whatman filter paper (Maidstone, UK, with a medium filtration rate), washed with DI water (until the filtrate became colourless), and finally dried in air at 100 °C for 12 h in a laboratory drier (VWR, Radnor, PA, USA). The hydrochars prepared with thiourea were denoted as CG_TU_t, where CG- stands for carbon derived from glucose, TU- is thiourea, and t- represents the hydrothermal treatment time (12 or 24 h). To study the influence of the TU dosage on the physicochemical properties of the resulting hydrochars, two additional materials were prepared using 0.5 g (abbr. CG_0.5TU_12h) and 3 g of TU (abbr. CG_3TU_12h), following the procedure described above for CG_TU_12h and maintaining the aforementioned 15/85 weight ratio.
In order to modify the quantity and type of active sites on the surface of the CG_TU_12h, the material was carbonised and ball-milled, resulting in the samples denoted as CG_TU_12h_carb and CG_TU_12h_carb_BM. The carbonisation was carried out in a vertical furnace using quartz reactors (SentroTech, Strongsville, OH, USA). In short, 1 g of CG_TU_12h was placed inside the quartz reactor inside the furnace and heated to 700 °C (with a heating rate of 10 °C/min) under a nitrogen flow (Air Liquid, 99.999%) of 150 cm3/min for 2 h. The ball milling of CG_TU_12h_carb was performed using zirconia balls in a Retsch (Haan, Germany) MM200 mixer mill at a frequency of 15 Hz for 4 h. A reference catalyst (abbreviated as CG_U_12h), which contained only nitrogen functionalities, was prepared by replacing 1g of TU with 1g of urea (U, Sigma-Aldrich, ≥99%, CAS: 57-13-6) and using 9 g of glucose and 56.7 g of DI water, a process followed by HTC for 12 h, filtering, and washing with DI, as described above. For comparison, hydrochar from pure glucose was also produced via a similar procedure, using 9 g of glucose and 51.0 g of DI water. The resulting hydrochar was filtered and washed with deionised (DI) water as previously described, yielding a sample designated as CG_12h.

3.2. Catalyst Characterisation

The contents of C, H, N, and S were determined via elemental analysis using a Vario Micro Cube analyser produced by Elementar (Langenselbold, Germany). In each experiment, 1.5 mg of each sample was combusted at 1050 °C. The oxygen content was determined in a separate measurement, using Oxy cube produced by Elementar (Langenselbold, Germany), by pyrolysing 1.9 mg of each sample at 1450 °C. The results were expressed as an average from three separate experiments. Prior to each measurement, each piece of equipment was calibrated using sulfanilamide (CHNS standard) or benzoic acid (Oxy standard). The total acidities (Atot; in mmol H+/g) of the catalysts were measured via potentiometric back titration using a Cerko Lab microtitration unit, following our previously published procedure [9]. In short, around 0.1 g of material was mixed with a 0.01 M solution of NaOH and shaken for 20 h at room temperature. Finally, the solid was filtered out, and the remaining solution was titrated with a 0.05 M solution of HCl. Thermogravimetric Analysis (TGA) and differential thermogravimetric (DTG) analyses of the samples were performed by heating around 10 mg of each of the samples under air flow from 50 to 800 °C at 25 °C/min using an STA 490 PC/4/H Luxx Netzsch (Selb, Germany) thermal analyser.
The morphologies of the selected catalysts were characterised via scanning electron microscopy using an FEI Quanta 400 FEG ESEM/EDAX Genesis X4M (15 keV) instrument. SEM images were obtained in both secondary electron (SE) and backscattered electron (BSE) detection modes, operating at 25 kV. The surface morphologies were observed at different magnifications (from 1000 for overview and size assessment to 10,000 times for a more detailed study). ImageJ software (Version 1.54p)was used to estimate the diameters of the carbon spheres (at least 100 counts from different areas of the sample were performed for each material). The compositions of different areas of the samples were acquired via EDS (Energy Dispersive X-ray Spectroscopy). Raman spectra were recorded at room temperature using a Raman spectrometer (Alpha 300 apparatus, WITec, Abingdon, UK) equipped with a 532 nm monochromatic laser. Each spectrum was obtained through 60 individual measurements using an integration time of 1 s and a laser power of 5 mW. The electronic state and surface composition of the representative samples were analysed using X-Ray Photoelectron Spectroscopy (XPS). The equipment was operated at a power of 100 W and in a residual vacuum of 10−7 Pa. An analyser with 50 eV pass energy collected the broad scan spectra (0–1100 eV). The binding energy (BE) was corrected by setting the C1s signal to 284.5 eV. Spectra deconvolutions were performed using Casa XPS (Version 2.3.18.PR1.0) software. In the first step, a Shirley background was subtracted, and subsequently the peaks were fitted by applying mixed Gaussian–Lorentzian or asymmetric Lorentzian functions.

3.3. Catalyst Testing

The initial screening of the catalysts in the dehydration of sucrose to HMF was carried out using an Anton Paar (Graz, Austria) Monowave 200 microwave synthesis reactor, which ensured rapid and uniform heating of the reaction mixture. In a typical experiment, 0.03 g of a catalyst was placed inside a 30 mL glass vial, followed by adding 10 mL of the 5% sucrose solution in ultrapure (UP) water and a magnetic stirrer. When the desired temperature was reached (T = 120–200 °C), stirring was initiated (600 rpm), and the reaction was started. After 30 min of the reaction, stirring was stopped, and the reaction mixture was rapidly cooled to 55 °C. All the testing in a microwave reactor was carried out under initial atmospheric pressure. A subset of experiments was repeated, and no significant deviation from the results was recorded.
The influence of the sucrose loading (0.5% vs. 5%), reaction time, and type of atmosphere (air or oxygen) on the process was studied using the best-performing catalyst in a Parr-type reactor (Parr, Moline, IL, USA) equipped with a pressure gauge, a magnetic stirrer, and a heating mantle. Before heating was initiated, the reactor was flushed several times with the selected gas. The testing was conducted at 180 °C, using 40 mL of substrate solution (0.5% or 5%) and 0.12 g of catalyst, with a set reaction time of 120 min. After the desired reaction temperature was reached, the first sample was taken (at t = 0), and stirring was immediately started. When the reaction time was completed, stirring was stopped, and the reactor was cooled down to room temperature using an ice bath. Aliquots of the reaction mixtures were taken during the reaction and analysed via High Performance Liquid Chromatography (HPLC), using an Altech OA-1000 organic acid column (Alltech, Nicholasville, Ky, USA) coupled with a Refractive index (RI) detector (Hitachi Europe, Ltd., Berkshire, UK) to separate sugars and a Hydrosphere C18 column (YMC Europe GmbH, Germany) coupled with a Hitachi L-2400 UV detector (Hitachi Europe, Ltd., Berkshire, UK) (absorbance set at 254 nm) to quantify HMF. Details of the HPLC analysis are described elsewhere [9]. The molar concentrations of sucrose, glucose, fructose, and HMF were calculated based on the calibration curves obtained using standards. The conversion of sucrose and the selectivity to glucose, fructose, and HMF were calculated according to the equations presented below:
C o n v e r s i o n   o f   s u c r o s e = m o l e s   o f   s u c r o s e   c o n v e r t e d i n i t i a l   m o l e s   o f   s u c r o s e   × 100 %
S e l e c t i v i t y = m o l e s   o f   t h e   p r o d u c t m o l e s   o f   s u c r o s e   c o n v e r t e d × 100 %

3.4. Reusability Tests

The reusability test was performed using the spent CG_TU_12h recovered from the catalytic mixture via filtering with a Whatman (Maidstone, UK) Filter (grade 6, slow filtration rate). Prior to each run, the spent catalyst was meticulously washed with 10 mL of ultrapure water and subsequently dried at 110 °C for a minimum of 3 h. Ultimately, the catalyst was administered for the subsequent batch reactions conducted in a Monowave 200 microwave reactor (Anton Paar, Graz, Austria), using 10 mL of a 5% sucrose solution in ultra-pure water and 0.03 g of the catalyst. The temperature was set to 180 °C, and the duration of each reaction was 30 min. The experiments were carried out in an air atmosphere.

3.5. Kinetic Modelling

A simple kinetic model of the reaction was proposed based on the catalytic results and models proposed in the literature [15,32]. The rate constants of the intermediate reactions were calculated to evaluate the impact of the following discrete variables on the reaction mechanism: (i) substrate loading and (ii) the reaction atmosphere. It was experimentally shown that sucrose is rapidly hydrolysed and inverted to a 1:1 molar mixture of fructose and glucose when the temperature of the reaction is increased to 160 °C. Thus, this step was not taken into account in the kinetic model. The experimentally obtained concentration data versus time were fitted into a developed model. The mismatch between experimental and modelled values was calculated, minimising the root mean square difference between the iteratively fitted model and the experimental data. The ordinary differential equations (ODES) were iteratively solved using the R deSolve package from RStudio IDE (version 24.12.1). Our previous work provides a more detailed description of the step-by-step procedure applied here [60].

4. Conclusions

Active catalysts containing nitrogen and sulphur functionalities were prepared from glucose using thiourea as a modifying agent via an eco-friendly and simple hydrothermal carbonisation (HTC) method. It was demonstrated that the surface chemistry, acidity, and graphitisation degree of the resulting materials could be tuned by the amount of doping agent used during HTC as well as by the post-synthesis carbonisation and/or ball-milling treatments. The modification of carbon hydrochar with thiourea led to a decrease in the total acidity of the material, which positively affected the HMF yield by suppressing the side reactions involving fructose and HMF. The XPS results confirmed that the catalyst’s performance was dependent not only on the amount but also on the type of surface N, S, and O species as well as on the degree of defects present on the catalyst. The highest HMF yield (37.0%) was achieved using a catalyst with an optimal balance between acidic and basic sites and the highest degree of graphitisation.
A simple kinetic model was developed to uncover the reaction pathways under different reaction conditions, including oxygen or air atmospheres, and varying sucrose loadings. Within this model, the dehydration of fructose into HMF exhibited the fastest reaction rate, and no isomerisation of glucose into fructose was observed under an air atmosphere. It was demonstrated that the reaction carried out with a higher loading of sucrose showed a higher rate of the dehydration of fructose into HMF and no observable glucose degradation in comparison to the reaction performed with a diluted substrate.
Overall, the present study reveals that sucrose or industrial wastes containing sucrose (e.g., sugarcane molasses, expired carbonated drinks, etc.) can serve as a promising feedstock for the large-scale production of value-added chemicals such as HMF because, unlike fructose, they are widely available, cheap, and easier to process than lignocellulosic biomass.

Supplementary Materials

The following supporting information can be downloaded at: https://www.mdpi.com/article/10.3390/catal15070656/s1, Figure S1: Fitting of the high-resolution XPS spectra of N1S, S2p and O1S. The names of the samples are provided in the figure. Figure S2: SEM of CG_TU_12h together with EDS analysis of Z1 and Z2. Figure S3: Arrhenius plot and activation energy (Ea) for the aqueous phase sucrose transformation to HMF via hydrolysis. The reactions were run in a microwave reactor, using 10 mL of 0.5%, t = 90 min, without catalyst, stirring = 600 rpm. Table S1: Surface compositions (in at%) derived from high-resolution XPS spectra of N1s, O1s and S2p of the samples.

Author Contributions

All the authors contributed to this work. The specific contributions of each of the authors are listed as follows: conceptualisation, K.M.E.; methodology, K.M.E.; formal analysis, K.M.E., A.M. and R.G.M.; investigation, K.M.E., R.G.M., A.M., M.A.C.B. and N.R.-R.; data curation, K.M.E., R.G.M. and A.M.; writing—original draft, K.M.E. and R.G.M.; writing—review and editing, K.M.E., R.G.M., A.M., M.K. and M.F.R.P. supervision, K.M.E., M.F.R.P. and M.K.; funding acquisition, K.M.E., N.R.-R. and M.F.R.P. All authors have read and agreed to the published version of the manuscript.

Funding

This work was financially supported by (1) Fundação para a Ciência e a Tecnologia I.P./MCTES through national funds, namely, LSRE-LCM, UID/50020, and ALiCE, LA/P/0045/2020 (DOI: 10.54499/LA/P/0045/2020), and a Junior Researcher grant (# 2021.00535.CEECIND); (2) the Calouste Gulbenkian Foundation under the research project GREENSHIP_E–Electrification of Ships Using Green Fuels and Advanced Technologies; and (3) MCIN/AEI/10.13039/501100011033 and the European Union NextGeneration EU/PRTR, grant # RyC2021-031456-I, and CNS2023-144627.

Data Availability Statement

The data that support the findings of this study are available from the corresponding author, KME, upon request.

Acknowledgments

This work was financially supported by Fundação para a Ciência e a Tecnologia I.P./MCTES through national funds: LSRE-LCM, UID/50020, and ALiCE, LA/P/0045/2020 (DOI: 10.54499/LA/P/0045/2020). KE is grateful to FCT for her Junior Researcher grant (# 2021.00535.CEECIND). R.G.M. acknowledges funding from the Calouste Gulbenkian Foundation under the research project GREENSHIP_E–Electrification of Ships Using Green Fuels and Advanced Technologies. N.R.R. acknowledges the financial support from RyC2021-031456-I and CNS2023-144627 grants funded by MCIN/AEI/10.13039/501100011033 and the European Union NextGeneration EU/PRTR.

Conflicts of Interest

The authors declare no conflicts of interest.

References

  1. Agency, E.E. Greenhouse Gas Emissions from Transport in Europe. 2024. Available online: https://www.eea.europa.eu/en/analysis/indicators/greenhouse-gas-emissions-from-transport (accessed on 5 May 2025).
  2. Dataintelo. Industrial 5-Hydroxymethylfurfural (5-HMF) Market Research Report 2033. Dataintelo Consulting Pvt. Ltd.: Pune, India, 2024. [Google Scholar]
  3. AVA Biochem. Available online: https://ava-biochem.com/ (accessed on 1 April 2025).
  4. Hu, L.; Wu, Z.; Jiang, Y.; Wang, X.; He, A.; Song, J.; Xu, J.; Zhou, S.; Zhao, Y.; Xu, J. Recent advances in catalytic and autocatalytic production of biomass-derived 5-hydroxymethylfurfural. Renew. Sustain. Energy Rev. 2020, 134, 110317. [Google Scholar] [CrossRef]
  5. Zuo, M.; Lin, L.; Zeng, X. The synthesis of potential biofuel 5-ethoxymethylfurfural: A review. Fuel 2023, 343, 127863. [Google Scholar] [CrossRef]
  6. Hoang, A.T.; Nižetić, S.; Ölçer, A.I. 2,5-Dimethylfuran (DMF) as a promising biofuel for the spark ignition engine application: A comparative analysis and review. Fuel 2021, 285, 119140. [Google Scholar] [CrossRef]
  7. Serrano-Ruiz, J.C.; Luque, R.; Sepúlveda-Escribano, A. Transformations of biomass-derived platform molecules: From high added-value chemicals to fuels via aqueous-phase processing. Chem. Soc. Rev. 2011, 40, 5266–5281. [Google Scholar] [CrossRef]
  8. Toftgaard Pedersen, A.; Ringborg, R.; Grotkjær, T.; Pedersen, S.; Woodley, J.M. Synthesis of 5-hydroxymethylfurfural (HMF) by acid catalyzed dehydration of glucose–fructose mixtures. Chem. Eng. J. 2015, 273, 455–464. [Google Scholar] [CrossRef]
  9. Eblagon, K.M.; Figueiredo, J.L.; Fernando, R.; Pereira, M. Catalytic valorization of industrial grade sugarcane molasses to 5-hydroxymethylfurfural in water. Catal. Today 2024, 441, 114898. [Google Scholar] [CrossRef]
  10. Souzanchi, S.; Nazari, L.; Rao, K.T.V.; Yuan, Z.; Tan, Z.; Xu, C. 5-HMF production from industrial grade sugar syrups derived from corn and wood using niobium phosphate catalyst in a biphasic continuous-flow tubular reactor. Catal. Today 2023, 407, 274–280. [Google Scholar] [CrossRef]
  11. Tao, J.; Pan, Y.; Zhou, H.; Tang, Y.; Ren, G.; Yu, Z.; Li, J.; Zhang, R.; Li, X.; Qiao, Y.; et al. Catalytic Systems for 5-Hydroxymethylfurfural Preparation from Different Biomass Feedstocks: A Review. Catalysts 2024, 14, 30. [Google Scholar] [CrossRef]
  12. Baruah, J.; Nath, B.K.; Sharma, R.; Kumar, S.; Chandra Deka, R.; Chandra Baruah, D.; Kalita, E. Recent Trends in the Pretreatment of Lignocellulosic Biomass for Value-Added Products. Front. Energy Res. 2018, 6, 141. [Google Scholar] [CrossRef]
  13. Souzanchi, S.; Nazari, L.; Rao, K.T.V.; Yuan, Z.; Tan, Z.; Xu, C. Catalytic isomerization of glucose to fructose using heterogeneous solid Base catalysts in a continuous-flow tubular reactor: Catalyst screening study. Catal. Today 2019, 319, 76–83. [Google Scholar] [CrossRef]
  14. Mulk, S.; Sajid, M.; Wang, L.; Liu, F.; Pan, G. Catalytic conversion of sucrose to 5-hydroxymethylfurfural in green aqueous and organic medium. J. Environ. Chem. Eng. 2022, 10, 106613. [Google Scholar] [CrossRef]
  15. Steinbach, D.; Kruse, A.; Sauer, J.; Vetter, P. Sucrose Is a Promising Feedstock for the Synthesis of the Platform Chemical Hydroxymethylfurfural. Energies 2018, 11, 645. [Google Scholar] [CrossRef]
  16. Tian, X.; Qi, B.; Zhang, S.; Luo, J.; Wan, Y. Catalytic production of 5-hydroxymethylfurfural from sucrose and molasses by aluminum chloride in green aqueous γ-valerolactone system. Biomass Convers. Biorefinery 2021, 11, 1931–1941. [Google Scholar] [CrossRef]
  17. Kreissl, H.T.; Nakagawa, K.; Peng, Y.-K.; Koito, Y.; Zheng, J.; Tsang, S.C.E. Niobium oxides: Correlation of acidity with structure and catalytic performance in sucrose conversion to 5-hydroxymethylfurfural. J. Catal. 2016, 338, 329–339. [Google Scholar] [CrossRef]
  18. Tabtimtong, N.; Padungwat, A.; Lertna, N.; Athikaphan, P.; Neramittagapong, A.; Minato, T.; Neramittagapong, S. Sucrose conversion to 5-hydroxymethylfurfural over commercial ion-exchange resin. Biomass Bioenergy 2025, 199, 107940. [Google Scholar] [CrossRef]
  19. Tong, X.; Wang, Y.; Nie, G.; Yan, Y. Selective dehydration of fructose and sucrose to 5-hydroxymethyl-2-furfural with heterogeneous ge (IV) catalysts. Environ. Prog. Sustain. Energy 2015, 34, 207–210. [Google Scholar] [CrossRef]
  20. Tongtummachat, T.; Akkarawatkhoosith, N.; Jaree, A. Process intensification for 5-hydroxymethylfurfural production from sucrose in a continuous fixed-bed reactor. Chem. Eng. Res. Des. 2022, 182, 312–323. [Google Scholar] [CrossRef]
  21. Zhang, M.; Tong, X.; Ma, R.; Li, Y. Catalytic transformation of carbohydrates into 5-hydroxymethyl furfural over tin phosphate in a water-containing system. Catal. Today 2016, 264, 131–135. [Google Scholar] [CrossRef]
  22. Perez, G.a.P.; Pandey, S.; Dumont, M.-J. Sulfosuccinic acid-based metal-center catalysts for the synthesis of HMF from carbohydrates. Catal. Today 2023, 418, 114127. [Google Scholar] [CrossRef]
  23. Morais, R.G.; Rey-Raap, N.; Figueiredo, J.L.; Pereira, M.F.R. Glucose-derived carbon materials with tailored properties as electrocatalysts for the oxygen reduction reaction. Beilstein J. Nanotechnol. 2019, 10, 1089–1102. [Google Scholar] [CrossRef]
  24. Nahavandi, M.; Kasanneni, T.; Yuan, Z.S.; Xu, C.C.; Rohani, S. Efficient Conversion of Glucose into 5-Hydroxymethylfurfural Using a Sulfonated Carbon-Based Solid Acid Catalyst: An Experimental and Numerical Study. ACS Sustain. Chem. Eng. 2019, 7, 11970–11984. [Google Scholar] [CrossRef]
  25. Eblagon, K.M.; Arenillas, A.; Malaika, A.; Pereira, M.F.R.; Figueiredo, J.L. The influence of the surface chemistry of phosphorylated carbon xerogel catalysts on the production of HMF from fructose in water. Fuel 2023, 334, 126610. [Google Scholar] [CrossRef]
  26. Johnson, R.L.; Anderson, J.M.; Shanks, B.H.; Schmidt-Rohr, K. Simple One-Step Synthesis of Aromatic-Rich Materials with High Concentrations of Hydrothermally Stable Catalytic Sites, Validated by NMR. Chem. Mater. 2014, 26, 5523–5532. [Google Scholar] [CrossRef]
  27. Chen, S.S.; Yu, I.K.M.; Cho, D.-W.; Song, H.; Tsang, D.C.W.; Tessonnier, J.-P.; Ok, Y.S.; Poon, C.S. Selective Glucose Isomerization to Fructose via a Nitrogen-doped Solid Base Catalyst Derived from Spent Coffee Grounds. ACS Sustain. Chem. Eng. 2018, 6, 16113–16120. [Google Scholar] [CrossRef]
  28. Wang, Y.; Wang, J.; Zhang, Y.; Song, F.; Xie, Y.; Wang, M.; Cui, H.; Yi, W. N-Doped Carbon Materials as Heterogeneous Catalysts for High Efficiency Isomerization Glucose to Fructose in Aqueous Media. Catal. Lett. 2020, 150, 493–504. [Google Scholar] [CrossRef]
  29. Xiong, X.; Yu, I.K.M.; Chen, S.S.; Tsang, D.C.W.; Cao, L.; Song, H.; Kwon, E.E.; Ok, Y.S.; Zhang, S.; Poon, C.S. Sulfonated biochar as acid catalyst for sugar hydrolysis and dehydration. Catal. Today 2018, 314, 52–61. [Google Scholar] [CrossRef]
  30. Palma, V.; Barba, D.; Cortese, M.; Martino, M.; Renda, S.; Meloni, E. Microwaves and Heterogeneous Catalysis: A Review on Selected Catalytic Processes. Catalysts 2020, 10, 246. [Google Scholar] [CrossRef]
  31. Gomes, G.R.; Pastre, J.C. Microwave-assisted HMF production from water-soluble sugars using betaine-based natural deep eutectic solvents (NADES). Sustain. Energy Fuels 2020, 4, 1891–1898. [Google Scholar] [CrossRef]
  32. Rocha, S.; Marzialetti, T.; Kopp, M.; Cea, M. Reaction Mechanism of the Microwave-Assisted Synthesis of 5-Hydroxymethylfurfural from Sucrose in Sugar Beet Molasses. Catalysts 2021, 11, 1458. [Google Scholar] [CrossRef]
  33. Rustamaji, H.; Prakoso, T.; Devianto, H.; Widiatmoko, P.; Febriyanto, P.; Eviani, M. Modification of hydrochar derived from palm waste with thiourea to produce N, S co-doped activated carbon for supercapacitor. Sustain. Chem. Environ. 2024, 7, 100132. [Google Scholar] [CrossRef]
  34. Morawa Eblagon, K.; Rey-Raap, N.; Figueiredo, J.L.; Pereira, M.F.R. Relationships between texture, surface chemistry and performance of N-doped carbon xerogels in the oxygen reduction reaction. Appl. Surf. Sci. 2021, 548, 149242. [Google Scholar] [CrossRef]
  35. Kiani, A.; Acocella, M.R.; Granata, V.; Mazzotta, E.; Malitesta, C.; Guerra, G. Green Oxidation of Carbon Black by Dry Ball Milling. ACS Sustain. Chem. Eng. 2022, 10, 16019–16026. [Google Scholar] [CrossRef]
  36. Sharma, R.; Rana, D.S.; Awasthi, A.; Singh, D.; Ibrahim, A.A.; Umar, A.; Baskoutas, S. Nitrogen functionalized biomass derived mesoporous carbon nanomaterials for electrochemical detection of lead (II) ions. Heliyon 2024, 10, e39090. [Google Scholar] [CrossRef]
  37. Unglaube, N.; Florent, M.; Otto, T.; Stötzer, M.; Grothe, J.; Kaskel, S.; Bandosz, T.J. Doping of porous carbons with sulfur and nitrogen markedly enhances their surface activity for formaldehyde removal. J. Colloid Interface Sci. 2024, 653, 594–605. [Google Scholar] [CrossRef]
  38. Gorgulho, H.F.; Gonçalves, F.R.; Pereira, M.F.R.; Figueiredo, J.L. Synthesis and characterization of nitrogen-doped carbon xerogels. Carbon 2009, 47, 2032–2039. [Google Scholar] [CrossRef]
  39. Pels, J.R.; Kapteijn, F.; Moulijn, J.A.; Zhu, Q.; Thomas, K.M. Evolution of nitrogen functionalities in carbonaceous materials during pyrolysis. Carbon 1995, 33, 1641–1653. [Google Scholar] [CrossRef]
  40. Falco, C.; Sevilla, M.; White, R.J.; Rothe, R.; Titirici, M.-M. Renewable Nitrogen-Doped Hydrothermal Carbons Derived from Microalgae. ChemSusChem 2012, 5, 1834–1840. [Google Scholar] [CrossRef]
  41. Eblagon, K.M.; Malaika, A.; Ptaszyńska, K.; Pereira, M.F.R.; Kozłowski, M.; Figueiredo, J.L. Niobium oxide-phosphorylated carbon xerogel composites as solid acid catalysts for cascade conversion of glucose to 5-hydroxymethylfurfural (HMF) in pure water. Catal. Today 2023, 418, 114070. [Google Scholar] [CrossRef]
  42. Feng, Y.; Jia, W.; Yan, G.; Zeng, X.; Sperry, J.; Xu, B.; Sun, Y.; Tang, X.; Lei, T.; Lin, L. Insights into the active sites and catalytic mechanism of oxidative esterification of 5-hydroxymethylfurfural by metal-organic frameworks-derived N-doped carbon. J. Catal. 2020, 381, 570–578. [Google Scholar] [CrossRef]
  43. Chhabra, T.; Bahuguna, A.; Dhankhar, S.S.; Nagaraja, C.M.; Krishnan, V. Sulfonated graphitic carbon nitride as a highly selective and efficient heterogeneous catalyst for the conversion of biomass-derived saccharides to 5-hydroxymethylfurfural in green solvents. Green Chem. 2019, 21, 6012–6026. [Google Scholar] [CrossRef]
  44. Qiu, S.; Fu, Y.; Lei, W.; Chang, J. Preparation of nitrogen and sulfur co-doped tubular porous carbon derived from Ceiba speciosa flowers for supercapacitors. J. Energy Storage 2025, 112, 115536. [Google Scholar] [CrossRef]
  45. Titirici, M.-M. Chapter 12—Hydrothermal Carbons: Synthesis, Characterization, and Applications. In Novel Carbon Adsorbents; Tascón, J.M.D., Ed.; Elsevier: Amsterdam, The Netherlands, 2012; pp. 351–399. [Google Scholar]
  46. Malaika, A.; Eblagon, K.M.; Matuszek, N.; Pereira, M.F.R.; Kozłowski, M. Towards valorization of glycerol and molasses: Carbon-based catalysts from molasses for the synthesis of acetins. Bioresour. Technol. 2025, 417, 131834. [Google Scholar] [CrossRef]
  47. Qi, Y.; Zhang, M.; Qi, L.; Qi, Y. Mechanism for the formation and growth of carbonaceous spheres from sucrose by hydrothermal carbonization. RSC Adv. 2016, 6, 20814–20823. [Google Scholar] [CrossRef]
  48. Titirici, M.-M.; Antonietti, M.; Baccile, N. Hydrothermal carbon from biomass: A comparison of the local structure from poly- to monosaccharides and pentoses/hexoses. Green Chem. 2008, 10, 1204–1212. [Google Scholar] [CrossRef]
  49. Kong, X.; Vinju Vasudevan, S.; Cao, M.; Cai, J.; Mao, H.; Bu, Q. Microwave-Assisted Efficient Fructose–HMF Conversion in Water over Sulfonated Carbon Microsphere Catalyst. ACS Sustain. Chem. Eng. 2021, 9, 15344–15356. [Google Scholar] [CrossRef]
  50. Hirsch, E.; Pataki, H.; Farkas, A.; Bata, H.; Vass, P.; Fehér, C.; Barta, Z.; Párta, L.; Csontos, I.; Ballagi, A. Raman-Based Feedback Control of the Enzymatic Hydrolysis of Lactose. Org. Process Res. Dev. 2016, 20, 1721–1727. [Google Scholar] [CrossRef]
  51. Yadav, R.; Joshi, P.; Hara, M.; Yana, T.; Hashimoto, S. Intercorrelation between physical and electrochemical behavior of nitrogen-doping in graphene for symmetric supercapacitor electrode. SN Appl. Sci. 2020, 2, 1630. [Google Scholar] [CrossRef]
  52. Straten, J.W.; Schleker, P.; Krasowska, M.; Veroutis, E.; Granwehr, J.; Auer, A.A.; Hetaba, W.; Becker, S.; Schlögl, R.; Heumann, S. Nitrogen-Functionalized Hydrothermal Carbon Materials by Using Urotropine as the Nitrogen Precursor. Chem. A Eur. J. 2018, 24, 12298–12317. [Google Scholar] [CrossRef]
  53. Chen, H.; Sun, F.; Wang, J.; Li, W.; Qiao, W.; Ling, L.; Long, D. Nitrogen Doping Effects on the Physical and Chemical Properties of Mesoporous Carbons. J. Phys. Chem. C 2013, 117, 8318–8328. [Google Scholar] [CrossRef]
  54. Kastner, J.R.; Miller, J.; Geller, D.P.; Locklin, J.; Keith, L.H.; Johnson, T. Catalytic esterification of fatty acids using solid acid catalysts generated from biochar and activated carbon. Catal. Today 2012, 190, 122–132. [Google Scholar] [CrossRef]
  55. Florent, M.; Hashmi, R.; Bandosz, T.J. The extent of carbon surface oxygen affinity and its effects on the activity of metal-free carbon catalysts in the oxygen reduction reaction: The interplay of porosity and N-, O- and S-enriched surface chemistry. Mater. Adv. 2022, 3, 8567–8578. [Google Scholar] [CrossRef]
  56. Eblagon, K.M.; Malaika, A.; Pereira, M.F.R.; Figueiredo, J.L. Cutting the Green Waste. Structure-Performance Relationship in Functionalized Carbon Xerogels for Hydrolysis of Cellobiose. ChemCatChem 2018, 10, 4934–4946. [Google Scholar] [CrossRef]
  57. Portillo Perez, G.; Mukherjee, A.; Dumont, M.-J. Insights into HMF catalysis. J. Ind. Eng. Chem. 2019, 70, 1–34. [Google Scholar] [CrossRef]
  58. Reis, G.M.; Machado, L.F.L.; Nunes, R.S.; Mandelli, D.; Carvalho, W.A. Tailored sulfonated carbons: Unraveling enhanced catalytic dynamics for fructose dehydration under conventional and microwave heating. RSC Sustain. 2024, 2, 1456–1471. [Google Scholar] [CrossRef]
  59. Mason, J.B.; Sun, Y. Microwave-Assisted Production of 5-Hydroxymethylfurfural from Glucose. Chem. Sel. 2021, 6, 10582–10586. [Google Scholar] [CrossRef]
  60. Morawa Eblagon, K.; Pereira, M.F.R.; Figueiredo, J.L. One-pot oxidation of cellobiose to gluconic acid. Unprecedented high selectivity on bifunctional gold catalysts over mesoporous carbon by integrated texture and surface chemistry optimization. Appl. Catal. B Environ. 2016, 184, 381–396. [Google Scholar] [CrossRef]
  61. Pinheiro Torres, A.; Oliveira, F.a.R. Application of the acid hydrolysis of sucrose as a temperature indicator in continuous thermal processes. J. Food Eng. 1999, 40, 181–188. [Google Scholar] [CrossRef]
  62. Tombari, E.; Salvetti, G.; Ferrari, C.; Johari, G.P. Kinetics and Thermodynamics of Sucrose Hydrolysis from Real-Time Enthalpy and Heat Capacity Measurements. J. Phys. Chem. B 2007, 111, 496–501. [Google Scholar] [CrossRef]
  63. Liu, S.; Zhu, Y.; Liao, Y.; Wang, H.; Liu, Q.; Ma, L.; Wang, C. Advances in understanding the humins: Formation, prevention and application. Appl. Energy Combust. Sci. 2022, 10, 100062. [Google Scholar] [CrossRef]
  64. Konwar, L.J.; Mäki-Arvela, P.; Mikkola, J.-P. SO3H-Containing Functional Carbon Materials: Synthesis, Structure, and Acid Catalysis. Chem. Rev. 2019, 119, 11576–11630. [Google Scholar] [CrossRef]
  65. Li, X.; Shao, Z.; Shan, H.; Liu, L. Evolution process of humins derived from cellulose by a humin extraction approach. Green Chem. 2025, 27, 5322–5331. [Google Scholar] [CrossRef]
Scheme 1. Simplified reaction network for the cascade conversion of sucrose into 5-hydroxymethylfurfural (HMF). Red arrows—reactions catalysed by Brønsted acid (BA) sites. Blue arrow—isomerisation step catalysed by Lewis acid (LA) sites or basic sites.
Catalysts 15 00656 sch001
Figure 1. High-resolution XPS N1s spectra of selected samples: (a) CG_U_12h, (b) CG_TU_12h, (c) CG_TU_12h_carb_BM, and (d) CG_0.5TU_12h. The legend shown in (b) also applies to (c,d).
Catalysts 15 00656 g001
Figure 2. High-resolution XPS spectra of (a) S2p and (c) O1s for CG_TU_12h and (b) S2p and (d) O1s for CG_TU_12h_carb_BM. The legend shown in (a,c) also applies to (b,d), respectively.
Catalysts 15 00656 g002
Figure 3. SEM images of selected materials, namely, (a) CG_12h, (b) CG_TU_12h, (c) CG_3TU_12h, (d) CG_TU_24h, and (e) CG_U_12h, together with their particle size distributions, average particle sizes, and standard deviations.
Catalysts 15 00656 g003
Figure 4. Raman spectra deconvolution of the prepared samples, together with the degree of graphitisation of the materials (AD/AG). The assignment of the Raman peaks for all of the spectra is defined in the sample CG_12h.
Catalysts 15 00656 g004
Figure 5. TG and DTG results for selected samples recorded under air flow conditions.
Catalysts 15 00656 g005
Figure 6. The impact of reaction temperature on the conversion of sucrose and selectivity to glucose, fructose, and HMF. Reaction conditions: 10 mL of 5% sucrose in water, t = 30 min, initial atmospheric pressure of air, and stirring = 650 rpm. The difference between 100% and the sum of selectivities to sugars and HMF indicates the selectivity to side products.
Catalysts 15 00656 g006
Figure 7. A simple kinetic model used to fit the experimental data and respective values of the rate constants k (min−1). LL—low loading of sucrose (0.5%) and HL—high loading of sucrose (5%).
Catalysts 15 00656 g007
Figure 8. (a) Influence of the reaction atmosphere (air or O2) on the yields of sugars and HMF vs. reaction time using 0.5% sucrose. (b) Concentrations of intermediates and products vs. time in sucrose dehydration recorded in air using 5% sucrose (HL—high sucrose loading) and (c) 0.5% sucrose (LL—low sucrose loading), including correlations between the experimental data (markers) and modelled values (solid line). (d) Yields of HMF and side products vs. reaction time recorded with HL and LL of sucrose. Reaction conditions: T = 180 °C; atmospheric pressure, air, or oxygen; 40 mL of 5% or 0.5% of sucrose in UP H2O; t = 120 min; 0.13 g of CG_TU_12h; and stirring rate = 650 rpm. The concentrations of sugars and HMF at t = 0 were recorded after the reaction mixture reached 180 °C. Dotted lines in figure (a,d) are provided as a visual guide.
Catalysts 15 00656 g008
Figure 9. Recyclability tests performed using CG_TU_12h catalyst in an Anton–Parr microwave reactor. Reaction conditions: T = 180 °C, t = 30 min, 10 mL of 5 wt% of sucrose in H2O, 0.03 g catalyst, and air atmosphere. Due to the 100% conversion of the substrate obtained in all of the runs, the measured selectivities to glucose and HMF are depicted as yields.
Catalysts 15 00656 g009
Table 1. Elemental compositions of the prepared samples.
SampleC
(wt%)
H
(wt%)
N
(wt%)
S
(wt%)
O *
(wt%)
CG_12h68.64.50.00.028.0
CG_U_12h63.75.38.10.022.9
CG_TU_12h57.14.65.26.127.3
CG_TU_24h60.14.35.76.023.9
CG_0.5TU_12h66.54.43.53.922.1
CG_3TU_12h61.54.410.412.711.5
CG_TU_12h_carb83.71.95.62.17.0
CG_TU_12h_carb_BM79.61.94.81.513.0
* Oxygen was measured in a separate experiment using Oxy Cube equipment.
Table 2. The compositions of the surfaces of selected samples (in wt%) obtained from the XPS survey spectra, together with the total acidity (Atot) of the samples measured via potentiometric titration.
SampleC (wt%)N (wt%)O (wt%)S (wt%)Atot (mmol H+/g)
CG_12h79.70.020.30.02.32
CG_U_12h78.06.115.90.0-
CG_TU_12h71.74.216.67.51.64
CG_TU_24h70.64.318.46.82.23
CG_0.5TU_12h74.52.318.64.71.62
CG_3TU_12h64.17.811.017.10.29
CG_TU_12h_carb_BM77.21.221.00.60.03 *
* Acidity was measured before ball-milling.
Table 3. The catalytic results obtained using the catalysts prepared. Reaction conditions: 10 mL of 5% sucrose in H2O, 0.03 g of catalyst, t = 30 min, T = 200 °C, stirring rate = 650 rpm, and initial atmospheric pressure of air.
CatalystSelectivity to Glucose (%)Selectivity to Fructose (%)Selectivity to HMF (%)
Blank test *29.010.827.4
CG_12h *31.21.328.8
CG_U_12h #16.525.226.1
CG_TU_12h *27.05.233.8
CG_TU_24h *29.54.630.3
CG_TU_12h_carb #23.519.225.8
CG_TU_12h_carb_BM *23.512.527.0
CG_0.5_TU *23.13.330.2
CG_3_TU *25.27.329.1
* indicates conversion of sucrose = 100%—for these samples, selectivities = yields; # indicates 93–96% conversion of sucrose.
Disclaimer/Publisher’s Note: The statements, opinions and data contained in all publications are solely those of the individual author(s) and contributor(s) and not of MDPI and/or the editor(s). MDPI and/or the editor(s) disclaim responsibility for any injury to people or property resulting from any ideas, methods, instructions or products referred to in the content.

