Article

Preparation and Screening of Ni-Based Catalysts for the Olive Oil Mill Wastewater Steam Reforming Process

by
Cláudio Rocha
1,2,*,
Miguel A. Soria
1,2,* and
Luís M. Madeira
1,2
1
LEPABE-Laboratory for Process Engineering, Environment, Biotechnology and Energy, Faculty of Engineering, University of Porto, Rua Dr. Roberto Frias, 4200-465 Porto, Portugal
2
ALiCE-Associate Laboratory in Chemical Engineering, Faculty of Engineering, University of Porto, Rua Dr. Roberto Frias, 4200-465 Porto, Portugal
*
Authors to whom correspondence should be addressed.
Catalysts 2025, 15(7), 654; https://doi.org/10.3390/catal15070654
Submission received: 10 April 2025 / Revised: 11 June 2025 / Accepted: 26 June 2025 / Published: 4 July 2025
(This article belongs to the Special Issue Green Chemistry and Catalysis)

Abstract

Olive mill wastewater (OMW) is a highly polluting effluent rich in organic pollutant compounds derived from olive oil production. In this work, the steam reforming reaction of OMW (OMWSR) was performed in a traditional reactor at 400 °C and different pressures (1–4 bar) to treat and valorize this effluent. A commercial catalyst (Rh/Al2O3) was used as a reference sample and several new catalysts were prepared (Ni-Ru/Ce-SiO2) using different preparation methods to study their effect on the activity and stability. The best-performing catalysts were also subjected to long-term operation experimental tests (24 h). It was observed that the preparation method used for the catalysts synthesis influenced the catalytic performance of the samples. In addition, temperature-programmed oxidation (TPO) analysis of the used catalyst showed the presence of carbon deposits: the results showed that periodic oxidative regeneration improved the catalyst stability and sustained H2 production. Finally, it was verified that the Ni-Ru/Ce3 catalyst stood out during the experimental tests, exhibiting high catalytic activity along the stability test at 400 °C and 1 bar: H2 yield always over 7 molH2·molOMW−1 and total organic carbon (TOC) conversion always higher than 94%. Despite these promising results, further research is needed to assess the economic feasibility of scaling up the process. Additionally, future work could explore the development of catalysts with enhanced resistance to deactivation by carbon deposition.

Graphical Abstract

1. Introduction

Worldwide, in 2023, there were approximately 900 million olive trees covering a total area of 10 million hectares [1]. The world’s olive oil production is mainly concentrated in Europe, with the Iberian Peninsula being a leader region—olive oil production in this region is estimated to reach 1485 tons in the 2024/25 crop year (there is no full report on this campaign yet) [1]. In this way, the olive oil industry is economically very important for Mediterranean countries; however, it is observed that all these producing countries are considerably affected by the high pollution resulting from the production of olive oil. The process generates large amounts of solid and liquid waste (the last one, called olive oil mill wastewater—OMW), raising serious disposal problems for the producers. This occurs because of the high values of the chemical oxygen demand (COD—60–185 g·L−1) and biochemical oxygen demand (BOD—14–75 g·L−1) present in the OMW [2]—these wide ranges are explained by the different compositions that OMW can present, which depend on many factors, like the olive species itself, the land, the local clime and the olive oil production process. Actually, the pollution from this stream was estimated to cause approximately 200 times more impact than that from urban wastewater due to its specific chemical composition [3]. The composition of OMW is highly variable and suggests that several substances can be present, depending on several factors (e.g., the surface of cultivation and the age of the olive tree) [4]. In general, the OMW effluent is composed of water (80–95 wt.% [2,5,6,7]), sugars (up to 20–30 g·L−1), polyphenols (up to 8 g·L−1) and fatty acids (5–10 g·L−1) [2]. In this way, the uncontrolled disposal of OMW represents a social, economic, and environmental problem, which must be addressed.
In recent decades, several processes have been explored to reduce the OMW pollutant load. From this perspective, the possibility of waste treatment and valorization has been considered, namely through the steam reforming reaction process of the OMW (OMWSR) [8,9,10]. This process would eliminate the pollutant load present in the effluent while simultaneously producing H2. The OMWSR reaction (Equation (1)) consists of the sum of two independent reactions: the thermal decomposition of high-molecular-weight molecules in the presence of steam (Equation (2)) and the water–gas shift (WGS–Equation (3)) reaction. The reaction enthalpy for each equation was taken from a previous work [11] and depends on the OMW composition.
Δ H r 25   ° C  (kJ·mol−1)
C x H y O z + 2 x z   H 2 O 2 x z + y 2 H 2 + xCO 2 Varies(1)
C x H y O z + x z H 2 O x z + y 2   H 2 + xCO Varies(2)
CO +   H 2 O H 2 + CO 2 −41(3)
This process can have side reactions, namely the following: Equation (4)—carbon monoxide methanation, Equation (5)—dry steam reforming of methane, Equation (6)—steam reforming of methane, and Equation (7)—cracking of the oxygenated molecules. Among the proposed reactions, Equations (4) and (7) are the most probable, as confirmed in previous studies [8,10].
Δ H r 25   ° C  (kJ·mol−1)
CO + 3 H 2 H 2 O + CH 4 −206(4)
CO 2 + CH 4 2 CO + 2 H 2 247(5)
2 H 2 O + CH 4 CO 2 + 4 H 2 165(6)
C x H y O z C n H m O k + gas H 2 , CO 2 , CO , CH 4 ,   CH n + C Varies(7)
Also, the formation of coke very often occurs in steam reforming processes (leading to pore blockage and active site coverage, thereby reducing the catalyst performance and accelerating its deactivation), particularly through the following reactions: Equation (7)—cracking of the oxygenated molecules, Equation (8)—cracking of hydrocarbons, Equation (9)—Boudouard reaction, Equation (10)—methane cracking, Equation (11)—carbon monoxide reduction, and Equation (12)—carbon dioxide reduction.
Δ H r 25   ° C  (kJ·mol−1)
CH x coke   percursors   alofins + aromatics x 2 H 2 + C Varies(8)
2 CO C + CO 2 −172(9)
CH 4 2 H 2 + C 74(10)
CO +   H 2 H 2 O + C −131(11)
CO 2 + 2 H 2 2 H 2 O + C −90(12)
Compared to conventional steam reforming feedstocks like ethanol or glycerol [12,13], OMW not only represents a low-cost and sustainable feedstock but also offers higher hydrogen yield potential per oxygenated molecule due to its rich and diverse organic composition.
The only authors who experimentally studied the OMWSR reaction were Tosti et al. [2,3,14], Casanovas et al. [15] and Alique et al. [16], apart from Rocha et al. [8,9,10]. Tosti et al. used a commercial Pt-based catalyst [2] and developed new noble-metal-based catalysts (with Pd, Rh and Pt supported on Al2O3 coated with CeO2–ZrO2) to compare them with a commercial material [14]. On the other hand, Casanovas et al. [15] prepared several catalytic honeycombs loaded with noble metals (Pt, Pd, Rh or Ru) or Ni over La-stabilized CeO2. It is important to highlight that the studies of Tosti et al. [2,3,14] were performed in a membrane reactor (MR) with the separation of H2, while the work of Casanovas et al. [2] was performed in a traditional reactor (TR) at high temperatures (≥600 °C). More recently, it was found by Rocha et al. [8,9,10] that commercial Rh-based catalysts and a prepared catalyst loaded with Ni and Ru presented high catalytic performance (in terms of the H2 yield—maximum of 9 molH2·molOMW−1), H2 selectivity, stability and total organic carbon (TOC) conversion. Nevertheless, until now, no studies have been found in the literature related to the effect of the preparation methods on the performance of the Ni-based catalysts. In particular, none of these previous studies focused on developing new Ni-based materials to improve the economic viability of the reaction under investigation. Moreover, limited attention was paid to carbon production on the catalysts, and the range of pressures explored was narrow, typically restricted to atmospheric pressure.
The present work aims to evaluate the performance of a TR at various pressures for the OMWSR process, using two types of catalysts: one commercial (material that presented the best catalytic performance in a previous scientific work [10] acting as a reference sample)—Rh/Al2O3—and five new samples prepared in the laboratory—a series of Ni-Ru/Ce-SiO2 catalysts. The prepared catalysts were also doped with Ce, since it was observed that the addition of this promoter improved the stability of the materials [17,18,19,20,21].
The main novelty of this work is the utilization of a series of Ni-Ru/Ce-SiO2 catalysts prepared with different methods (namely, with different calcination programs and different impregnation steps) that have never been applied in the OMWSR reaction, and the study of the effect of the pressure and oxidative regeneration treatments on this process. To evaluate the performance of the catalysts, the results were analyzed in terms of the H2 yield, H2 selectivity, TOC conversion and stability of the catalysts. It was expected to obtain a TOC conversion close to 100% and an H2 yield higher than 9 molH2·molOMW−1 (considering previous studies by the research group) [8,10].

2. Results and Discussion

2.1. Catalysts Characterization

2.1.1. TPR-H2 and TPD-CO2

Temperature-programmed reduction with hydrogen (TPR-H2) analyses were performed with all the prepared catalysts to determine an adequate temperature for their reduction; the results are shown in Figure 1 (see more details in Section 3.3). The results indicated that, in a general way, the materials were reduced mostly at temperatures below 400 °C (except Ni-Ru/Ce1, which was attributed to the reduction of NiO species strongly interacting with the silica support, likely in the form of nickel silicates [22]). It was also observed that the TPR profiles present several peaks and/or broad peaks related to the reduction of oxide species with different interactions with the support, evidencing the inhomogeneity of the surface of these materials (for instance, for the Ni-Ru/Ce3 catalyst, it was possible to distinguish three different temperatures peaks between 200 and 450 °C). In the profile of the Ni-Ru/Ce3 sample (catalyst with a higher content of Ce), a small peak was present at 225 °C, which, according to the literature, can be related to the interaction of NiO with CeO2 [23,24] and/or attributed to the partial reduction of the surface oxygen of the Ce species [25,26,27]. For the Ni-Ru/Ce4 and Ni-Ru/Ce5 catalysts, the consumption of H2 in the temperature range considered was very low. So, considering the results of these TPR-H2 analyses, all the materials in this work were reduced/activated at 400 °C during 2 h under a 10% H2/N2 stream—total flow rate of 100 mLNPT·min−1—before the catalytic tests. It was also verified that this temperature program allowed the complete reduction of all the samples (reduction tests were also carried out in which these materials, after undergoing this reduction program, were exposed to higher temperatures under a 10% H2/N2 stream, without showing any hydrogen consumption at that stage).
To determine and compare the basicity of the Ni-Ru/Ce2 and Ni-Ru/Ce3 samples, temperature-programmed desorption with carbon dioxide (TPD-CO2) analyses were performed—see Figure S1 in the Supporting Information (SI) and Table 1 (see more details in Section 3.3). These two specific samples were chosen to be analyzed because they were prepared with the same preparation method (but with different Ce contents). In this way, it is possible to verify only the effect of Ce addition on the basicity of the catalysts. In addition, these samples were characterized in more detail since the catalyst Ni-Ru/Ce3 presented the highest catalytic activity among all the materials tested in this work. According to the literature, the basic active sites can be classified as weak, medium, or strong: peaks in the range of 23–250 °C are attributed to weak basic sites, at 250–500 °C to medium basic sites and above 500 °C to strong basic sites [28]. The TPD results for the Ni-Ru/Ce2 show three distinct peaks very well defined, with maxima at 95, 605 and 705 °C, associated with weak and strong basic sites. In the TPR profile of the Ni-Ru/Ce3 sample, it was possible to see three different peaks related to the different types of basic sites considered in this study (at 105, 300 and 560 °C). In contrast to the other samples, this material presents very well-defined different types of basic sites. In Table 1, it is possible to see the quantities of basic sites present in these two catalysts, obtained by integration of the TPD curves; for comparison purposes, it also presents the quantities of basic sites determined for the same catalyst without the Ce impregnation, prepared in a previous study [8]. Analyzing the values presented in Table 1, one can conclude that the impregnation with Ce increases the basicity of the materials and the number of basic sites was higher for the material impregnated with higher content of Ce (Ni-Ru/Ce3); still, the increase in Ce loading led to the formation of a higher number of basic sites with weak and medium strength.

2.1.2. Metal Loading

The inductively coupled plasma–optical emission spectrometry (ICP-OES) technique was used to determine the real content of metals in the Ni-Ru/Ce catalysts (see more details in Section 3.3). It can be seen in Table 2 that the Ni loading determined in the samples was close to the nominal values, indicating a reasonable impregnation of this metal in the support. The content of Ru in the catalysts was low, probably due to the poor impregnation of the element in the SiO2 support and/or due to the calcination program used (which promotes Ru evaporation), as verified in a previous study [8]. Additionally, it was possible to verify that the Ru content was higher in the samples prepared with larger support particles, allowing a higher content of this metal. Furthermore, as expected, since the materials Ni-Ru/Ce4 and Ni-Ru/Ce5 were calcined before Ru impregnation, there was a higher amount of Ru in these samples. About the Ce content achieved for the different materials, it was concluded that the preparation method influences the impregnation—for the Ni-Ru/Ce4 and Ni-Ru/Ce5 catalysts, the real content of Ce was well below the target value, explained by the different calcination temperature used in the preparation of these materials in comparison with the three remaining samples. This loss is often due to the decomposition of cerium compounds or the volatilization of cerium species at elevated temperatures, as previously reported [29,30]. Only the real values of the metals content will be considered in the discussion of the catalytic results.

2.2. Catalytic Tests

2.2.1. Thermodynamic Simulation and Blank Tests (Exp. 0)

Before the catalytic experiments, blank experimental tests (Exp. 0) under different operation conditions were performed in the reactor packed with only SiC particles (inert). In addition, the production of H2, CO2, CO, CH4 and coke and the conversion of the OMW (in terms of the TOC conversion) in the thermodynamic equilibrium for the operation conditions defined were determined in Aspen Plus V.9® software—see details elsewhere [31]. The maximum theoretical yield of H2 for this OMW stream (considering the complete conversion of OMW and considering only the OMWSR reaction (Equation (1)) is 12.18 mol of H2 per mol of OMW fed.
As observed in a previous work [10], due to the high quantity of H2O present in the initial effluent, the thermodynamic equilibrium of the steam reforming process is shifted to the production of a high quantity of H2 and CO2; still, the methanation reaction (Equation (4)) is inhibited by the presence of such a high amount of H2O. For the same reason, the H2 yields obtained in the simulations for several pressures were nearly identical to the maximum theoretical yield of H2 (see Table 3), and the TOC conversions were complete. Despite the low formation of CH4, it is possible to verify that the CH4 yield, as expected, is higher for higher pressures (the methanation reaction is favored at higher pressures—Equation (4)).
Table 3 also shows the results obtained in the blank tests—Exp. 0. Since the process was not catalyzed in these experimental tests, the H2 and CO2 yields were very low. The quantities of CH4 and CO detected were also very low for all the pressures tested, but they were higher than those obtained in the thermodynamic simulations. The TOC conversions were low and all close to 50%, related to the absence of a catalyst and, in this way, very slow kinetics.

2.2.2. Effect of the Catalyst Mass (Exp. 1)

For the Rh catalyst, an initial experimental test (Exp. 1) was carried out with different catalyst masses (different weight hourly space velocity, WHSV) to define a proper quantity of material to be used in Exp. 2 and Exp. 3. The results related to the production of H2 and the TOC conversion are shown in Figure 2 for the catalytic tests performed at several pressures.
In this experimental run, as expected, it was possible to verify that the quantity of catalyst inside the reactor significantly affects the production of gases and the conversion of OMW: the increase in the catalyst mass allowed a higher formation of H2 and a higher TOC conversion for all the pressures studied—see Figure 2. The yields of CO and CH4 were very low in all the catalytic tests, in line with the predominance of the WGS reaction (Equation (3)) in the process—in this way, the main products were always H2 and CO2. However, the increase in the pressure leads to the formation of small quantities of CH4: the increase in the total pressure in the reaction medium leads to a shift in the equilibrium to the side with the lesser number of moles to counter the pressure rise. In this way, the methanation reaction (Equation (4)), which is favored at high pressures, is responsible for the increase in the CH4 yield [31,32]. Taking these results into consideration, the twice amount of catalyst was used in the next experimental runs (a total of 7 g of material) to increase the yields of the gas products and to attempt to achieve a TOC conversion close to 100%.
In these initial tests, the existence of catalyst deactivation was verified over the reaction time. The results indicated a decrease in the catalytic activity, mainly verified in the experimental test with 3.5 g of catalyst (green columns in Figure 2): taking into account that the formation of CH4 is very low, the high decrease in the H2 formation cannot be explained simply by favoring the methanation reaction at higher pressures; furthermore, the TOC conversion decreased along the experimental run (regardless of the catalyst mass used), indicating that the catalysts lose activity to crack the molecules of the OMW along the experimental run; finally, observing the results at the end of this experimental campaign—repetition of the catalytic test at 1 bar—it was concluded that the catalytic performance of the material was much lower at the end of the experiment. All these results strongly indicate that the catalyst undergoes several deactivation during the reaction.
After the catalytic test with 3.5 g of catalyst, a TPO analysis (see the temperature program used in Section 3.3) of the spent sample was carried out, since the decrease in the catalytic activity verified in the tests could be related to the formation of amorphous coke on the catalyst surface throughout the experimental test [33,34,35,36,37,38]. The results of this analysis confirm that the formation of carbon deposits on the catalyst occurred during OMWSR, which was oxidized up to CO2 during the oxidative regeneration—CO and CH4 were not detected in this analysis. In this manner, in the following experimental runs (Exp. 2 and Exp. 3), the utilization of an oxidative regeneration program was considered before changing the system pressure to avoid the deactivation of the materials—the oxidative regeneration promotes the gasification of the carbon deposits present on the catalysts’ surface, inhibiting the deactivation of the materials. Moreover, the quantity of coke produced at 1 bar (where a higher decline in H2 production is observed over time) was determined for each catalyst.

2.2.3. Effect of Preparation Method (Exp. 2)

As already mentioned, the mass of catalysts used in this Exp. 2 (7 g) was higher than that for Exp. 1 to reach higher catalytic performances (closer to the thermodynamic equilibrium of the process) in the catalytic tests at several pressures (1, 2, 3 and 4 bar) with the commercial and prepared catalysts. The mean of the results of these experimental tests can be seen in Figure 3 and Figure S2 in the SI. It is possible to see more detailed information about all these results over time in Figure S3.
For most catalysts used, the productions of CO and CH4 were very low in all the tests, in line with the predominance of the WGS Equation (3) in the process; still, the behavior of the production of H2 and CO2 was very similar. For all the materials, the performance at the end of the experiment campaign (repetition of the experimental test at 1 bar for comparison purposes) was lower than at the beginning of the reaction—showing catalyst deactivation phenomena—despite the utilization of an oxidative regeneration program always operating before changing the pressure system. This deactivation of the samples was verified in detail in the results over time obtained at 1 bar—the H2 yield and TOC conversion decreased in all the materials over time (see Figure S3 in the SI).
Nevertheless, the Ni-Ru/Ce3 and Ni-Ru/Ce5 catalyst samples stood out during these catalytic tests, exhibiting higher catalytic activity (Figure 3a), except in terms of H2 yield at 1 bar. Looking at the overall results, the TOC conversion using these two materials was high at all the pressures, indicating that it is possible to reduce the enormous quantity of organic load from the effluent with these catalysts. The Ni-Ru/Ce5 material was also the material that better promoted the methanation reaction (Equation (4)—higher production of CH4 in all the operating conditions). However, it is important to highlight that the TOC conversion was much higher using the Ni-Ru/Ce3 catalyst and close to 100%—see Figure 3b.
In opposition, the Rh and Ni-Ru/Ce1 catalysts presented the worst performance in this study: the H2 yield decreased drastically for higher pressures (>1 bar) using both materials and the production of CO was higher in the experiment with the Ni-Ru/Ce1 sample. However, for the Rh catalyst, the TOC conversion was high for all the pressures, in contrast with the results obtained for Ni-Ru/Ce1 (also decreased at higher pressures).
In this study, it was verified that the difference in the performance between the catalysts, namely the decrease in the H2 yield along the experimental campaign at 1 bar, is related to the coke formation on the materials’ surface (Equations (7)–(12)) [33,34,35,36,37,38]. In several previous studies [38,39,40,41,42,43], the existence of two different combustion peaks was noticed during the oxidation of spent catalysts, below and above 500/550 °C [44], related to the formation of amorphous and graphitic carbon, respectively. In this way, as already mentioned, oxidative regeneration programs with air at 400 °C and 500 °C were carried out (before modifying the pressure of the system) in all the experimental tests—see an example in Figure 4. It was possible to distinguish the oxidation of the two types of coke (amorphous and graphitic) in all the experiments, which were quantified and are reported in Table 4 for the experimental tests conducted at 1 bar with fresh catalysts (and when it was possible to see a more pronounced deactivation over time—c.f. Figure S3 in the SI).
By comparing the coke content in the spent catalysts (see Table 4), it was observed that higher amounts of amorphous carbon were formed in the Rh and Ni-Ru/Ce1 catalysts in comparison with the remaining prepared catalysts. Amorphous coke is reported to be the type of coke most detrimental to the performance of the materials [33,35,36,37,38], explaining, the highest decrease in the catalytic performance along the experimental campaign (particularly evident in the repetition of the catalytic test at 1 bar at the end of the experimental run). Despite the high production of total coke in the Ni-Ru/Ce3 and Ni-Ru/Ce5 samples, the performance of the materials was high, in contrast with the other samples, since a high percentage of the coke produced had a graphitic nature—which has been shown to have a minor effect on the catalytic activity of materials.
On the other hand, it was possible to verify that the use of a higher content of cerium (using the same preparation method—Ni-Ru/Ce2 vs. Ni-Ru/Ce3) allows a decrease in the amorphous coke production due to the good properties of the promoter for oxidizing dehydrogenated carbon species deposited on the catalyst surface in the steam reforming reaction [17,18,19,20,21,45,46,47]. In this way, the deactivation was much lower in the catalyst with a higher quantity of basic sites, which are the materials with a higher content of Ce (see Section 2.1.1).
For the stability tests, the Ni-Ru/Ce3 catalyst was selected (together with the commercial Rh catalyst, for comparison purposes), which presented a high H2 yield and TOC conversion in the range of pressures studied, presenting also the highest content of Ce among all the prepared materials. The Ni-Ru/Ce5 catalyst, although also exhibiting high catalytic activity, showed higher coke formation, possibly due to its lower Ce content in the structure (see Section 2.1.2Table 2), making it a less suitable candidate for stability tests in comparison with the Ni-Ru/Ce3 catalyst. Its higher tendency to deactivate over time is attributed to the increased formation of carbon deposits on its surface (see Table 4). As already mentioned, the Ce content specifically affects coke formation and catalyst stability, reducing coke formation by enhancing the oxygen storage capacity and redox properties, which promote the oxidation of carbon deposits and maintain metal dispersion, thus limiting the deactivation over time [48].
Finally, it was observed that the reducibility of the materials (see Section 2.1.1) did not influence the catalytic activity of the materials, since the TPR-H2 profiles are very similar, in contrast to the H2 yields obtained in the experimental results.

2.2.4. Stability Tests (Exp. 3)

The catalysts used in the stability tests (Exp. 3; time-on-stream = 24 h) were the commercial Rh-based and the Ni-Ru/Ce3 catalysts. As expected, in all the catalytic tests, the CO and CH4 yields were always very low.
The two catalysts exhibited a high-level loss of catalytic activity during the time-on-stream, as verified by the decrease in the H2 yield (drop close to 50% for the Ru catalyst and close to 33% to the Ni-Ru/Ce3 catalyst) and TOC conversion, even when the oxidative regeneration was performed over 5 h (2 h at 400 °C and 3 h at 500 °C)—see Figure 5a,b. The catalytic activity was partially recovered over a small period after oxidation of the catalyst and continued to deactivate markedly after that—this indicates, again, that the catalyst deactivation was connected to the coke formation on the materials. It was also verified for both catalysts that after 14 h, the production of H2 and TOC conversion remained constant until the end of the catalytic tests. Also, in both materials, when the oxidative regeneration was not fully executed, a significant decline in performance was observed until the end of the experimental test, with the H2 yield decreasing by approximately 90%.
It is important to take into consideration that Ni-based catalysts may suffer high deactivation by carbon accumulation [20,21]. The differences in the catalysts’ stability are related to the formation of coke on their surface throughout the experimental tests, as verified in Section 2.2.3 [33,35,36,37,38]. In this way, and to recover the catalytic activity of the Ni-Ru/Ce3 catalyst, the oxidative program was changed in the following experimental tests: the oxidation of the catalyst was only stopped when the concentrations of CO2 and CO in the outlet stream were equal to zero (at 400 °C and 500 °C) to achieve complete oxidation of the coke—in the previous tests, the time for this regeneration program was fixed and the graphitic coke was not full oxidized (c.f. Figure 4).
Stability tests at 400 °C and 1 or 4 bar, with the new oxidative regeneration step, were performed with the Ni-Ru/Ce3 catalyst; the data are shown in Figure 5c,d, respectively. The deactivation of the catalyst was much lower in comparison with the stability test with incomplete oxidation—higher and more stable H2 production was obtained, so that after the oxidative regeneration the production of H2 was similar to the initial performance with the fresh material at both pressures (not verified in the previous experiments). These results indicate that the formation of graphitic coke, despite having a lower effect on the activity of the catalyst as compared to the amorphous coke (as verified in Section 2.2.3), has also impacted the decrease in the catalyst performance. This more organized carbon also influences the stability of the material, making it necessary to completely oxidize it to fully recover the activity of the catalyst. Still, the decrease in the H2 yield was much lower at 4 bar, in line with the results obtained in Section 2.2.3—the amorphous and graphitic coke productions were much lower, inducing less inhibition of the catalyst and increasing the stability. In this way, it was possible to conclude that the formation of coke is the main route for the deactivation of the Ni-Ru/Ce3 catalyst, as verified in a previous work for a similar catalyst [8]. In addition, it was observed that the TOC conversion remained practically constant along the time-on-stream for both pressures (≈95—see Figure 5) when the oxidative regeneration step was properly/completely performed. The H2 yield observed was always between 12 and 6.5 molH2·molOMW−1 at 1 bar and always between 7 and 3.5 molH2·molOMW−1 at 4 bar. So, the lower H2 yield verified at 4 bar in Section 2.2.3, for this catalyst, was not related to the deactivation of the catalyst but explained by the fact that H2 production was not favored at this pressure.

3. Materials and Methods

3.1. Chemicals and Gases

Nitrogen (≥99.999%—used as the carrier gas in the catalytic experimental tests and the makeup gas for the gas chromatograph (GC Agilent 7820A—Santa Clara, CA, USA), respectively), reconstituted air (≥99.999%—used as the oxidant agent during the catalyst regeneration program of the catalyst), argon (≥99.999%—the makeup gas for the GC) and hydrogen (≥99.999%—for the GC and catalyst activation) were supplied by Linde (Dublin, Ireland).
All the components present in the synthetic OMW effluent (vanillic, gallic, cinnamic, 4-hydroxybenzoic and syringic acids, L-arabinose and D-galactose) were purchased from Alfa Aesar (Waltham, MA, USA), except the veratric and protocatechuic acids, obtained from Acros Organics, and tyrosol, obtained from Sigma-Aldrich (St. Louis, MO, USA). An aqueous solution of HCl (Sigma-Aldrich, ≥37 wt.%) and an aqueous solution of HNO3 (JMGS, Odivelas, Portugal, ≥65 wt.%) were used in the ICP-OES technique analyses.

3.2. Catalysts and OMW Preparation

One commercial catalyst—Rh/Al2O3 promoted with an alkaline earth metal, manufactured by Johnson Matthey (herein called by Rh)—and five prepared catalysts—Ni-Ru-based catalysts supported on SiO2 and doped with CeO2 (herein called Ni-Ru/Cex, with x varying from 1 to 5)—were used in this work. All the precursors of the metals and the support were obtained from Sigma-Aldrich.
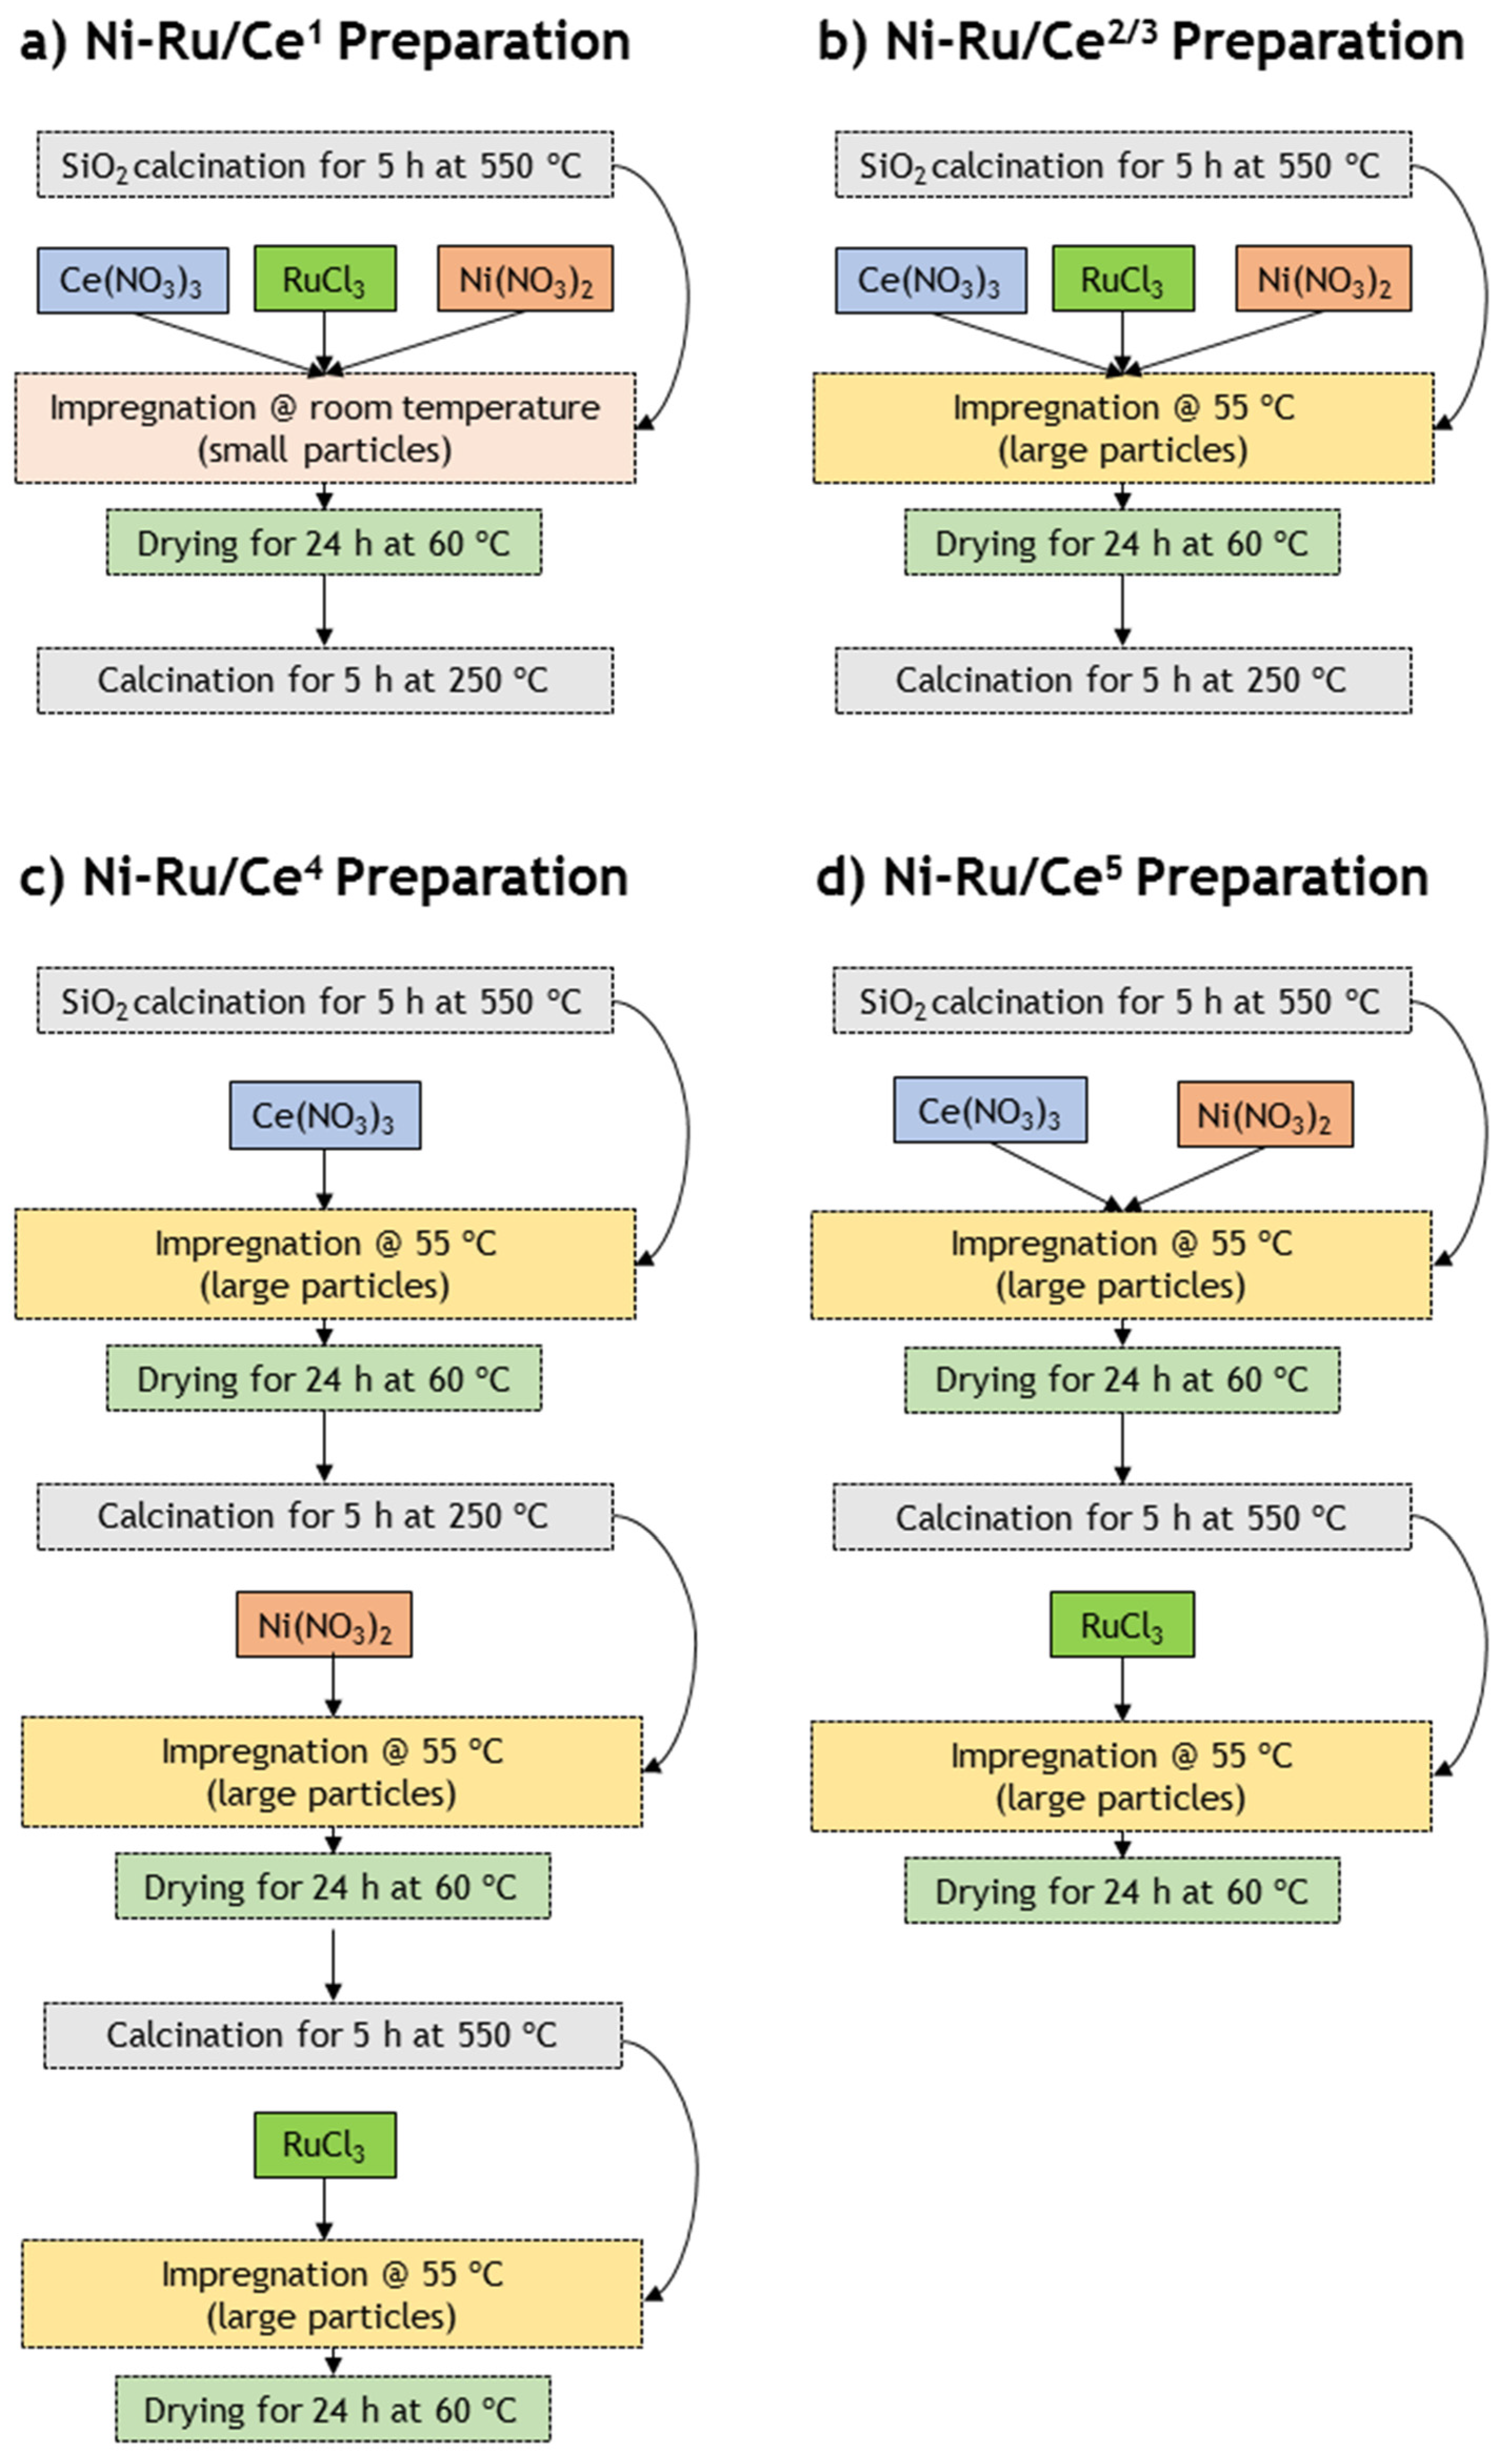
A series of Ni-Ru/Ce catalysts were synthesized using different preparation methods using SiO2 as support and CeO2 as promoter—see Table 5. First, before the metal loading, SiO2 was calcined during 5 h at 500 °C (heating rate of 5 °C·min−1) to activate the support, as mentioned in previous works [49,50]. Then, in order to prepare the Ni-Ru/Ce1 (Figure 6a) and Ni-Ru/Ce2 (Figure 6b) samples (see the methodology in Figure 6 and Table 5), the activated support was impregnated (wet impregnation) with an aqueous solution of Ni(NO3)2·6H2O, RuCl3·H2O and Ce(NO3)3·6H2O dissolved simultaneously in water, with the aim of achieving a final Ni content of 10 wt.%, Ru content of 1 wt.% and Ce content of 0.3 wt.%. The Ni-Ru/Ce3 (Figure 6b) sample was prepared using the same procedure (cf. Figure 6 and Table 5), however with the aim of achieving a final Ce content of 3 wt.%. These three catalysts were dried at 60 °C (during 24 h) and calcined at 250 °C (during 5 h—heating rate of 5 °C·min−1) in the final preparation procedures. The calcination temperature of these catalysts was chosen considering the TGA results obtained in a previous work [8]; particularly, it was possible to verify that at high temperatures (>270 °C), the catalyst decomposed due to the volatilization of Ru, as also verified in other studies [51,52,53,54,55].
The preparation of the Ni-Ru/Ce4 (Figure 6c) and Ni-Ru/Ce5 (Figure 6d) samples followed a distinct preparation method (see Figure 6 and Table 5). In the production of the Ni-Ru/Ce4 catalyst, the activated support was, firstly, impregnated (wet impregnation) only with an aqueous solution of Ce(NO3)3·6H2O dissolved in water; then, the sample was dried at 60 °C (during 24 h) and calcined at 250 °C (during 5 h—heating rate of 5 °C·min−1)—higher temperatures are not required to form CeO2 [56,57]. At that point, the sample was impregnated again (wet impregnation) with an aqueous solution of Ni(NO3)2·6H2O, dried again at 60 °C (during 24 h) and calcined at 550 °C (during 5 h, 5 °C·min−1). Lastly, the sample was impregnated (wet impregnation) with an aqueous solution of RuCl3·H2O and, finally, only dried at 60 °C (during 24 h) to avoid Ru evaporation. To produce the Ni-Ru/Ce5 catalyst, the activated support was, firstly, impregnated with an aqueous solution of Ce(NO3)3·6H2O and Ni(NO3)2·6H2O dissolved simultaneously in water, dried at 60 °C (24 h) and calcined at 550 °C (during 5 h, 5 °C·min−1). Then, the sample was impregnated with an aqueous solution of RuCl3·H2O and only dried at 60 °C (during 24 h).
In addition, the aqueous solution prepared for the production of the Ni-Ru/Ce1 catalyst was stirred at a lower temperature (room temperature) than the other aqueous solutions considered in this work (stirred at 55 °C)—see Table 5. The calcination treatments applied for all the materials were performed with the purpose of removing volatile species (e.g., H2O and NO32−) and promoting the formation of metal oxides (e.g., NiO). The calcination temperatures used in the treatment of these catalysts was similar to the ones selected for identical materials prepared in previous works [58,59,60]. The size of the support particles (SiO2—between 210 and 500 or 1410 and 3360 μm) was controlled before the impregnation of the metals, using a sieve.
The selected metal loadings were based on previous studies that employed similar compositions [8,61]. A relatively low Ru content (1 wt.%) was chosen due to its high cost, while still being sufficient to promote catalytic activity. The Ni loading of 10 wt.% is commonly used in the literature to ensure adequate active phase dispersion, and the Ce content was varied (0.3–3 wt.%) to evaluate its effect on the catalyst performance. Summing up, and considering the description of the preparation methods utilized (see Figure 6), it was possible to observe that the preparation parameters studied in this work were the particles size, temperature of the impregnation, content of Ce, order of the metal’s impregnation and calcination programs. It is important to emphasize that careful control of the stirring temperature during catalyst preparation is very important to control the morphology of the material, which in turn influences the catalyst’s efficiency and longevity in steam reforming reactions.
The synthetic OMW was composed of a mixture of six different phenolic acids and two sugars typically present in real OMW streams (see Table 6). The concentrations of the components were adjusted according to several reports in the literature, namely they were based on the compositions defined with OMW real streams [4,62,63,64,65]. The compounds were dissolved in distilled water and then the solution was submitted to ultrasound (Sonorex Super RK255H from Bandelin Electronic GmbH & Co. KG [Berlin, Germany]) for 15 min to ensure full dissolution (the steam to carbon feed ratio was equal to 694).

3.3. OMW and Catalysts Characterization

The total organic carbon (TOC) was determined by catalytic oxidation at 698 °C (method 5310 D [66]) with a TC/TOC analyzer (Shimadzu TOC-L apparatus equipped with an auto-sampler, which was operated at a maximum coefficient of variation ≤ 2%). A TOC of 972 ppm was observed for the initial effluent of OMW used in this research work.
In situ temperature-programmed reduction (TPR-H2), in a custom-built facility, of all the Ni-Ru/Ce catalysts (around 1 g) was carried out after thermal treatment at 150 °C for 1.5 h under N2 flow (100 mLN∙min−1) to remove the water. Thereafter, the sample was cooled down to room temperature and then heated up to 820 °C (10 °C∙min−1) under a flow rate of 10 mLN∙min−1 of H2 diluted with 90 mLN∙min−1 of N2 (10 vol.% H2 in N2). For the in situ temperature-programmed desorption (TPD-CO2) of the Ni-Ru/Ce samples, the fresh catalysts (around 200 mg) were first reduced (see in Section 3.4 the activation program applied in this work, based on the TPR-H2 results). Then, the methodology was analogous to the one reported elsewhere [67]: the catalysts were fully saturated with CO2 at room temperature for 1 h under CO2 flow (30 mLN∙min−1). The setup was flushed with N2 for 30 min and the catalyst was heated up to 820 °C at 10 °C∙min−1 (under a flow of 30 mLN∙min−1 of pure N2).
For the in situ temperature-programmed oxidation (TPO) analyses/oxidative regeneration of the catalysts, the samples of spent catalysts were treated with a flow of 25 mLN∙min−1 of reconstituted air (20 vol.% O2/N2 stream; similar to air composition, thus cheaper in industrial practice) diluted in 75 mLN∙min−1 of N2, first at 400 °C and then at 500 °C—the duration of this program at both temperatures was object of study in this work. Air was diluted in nitrogen during the TPO to avoid the temperature gradients observed in previous works [43]. The amount of carbon gasified in the form of CO2 and CO was measured with an online infrared-based analyzer (Servomex, model 4210). The CO and CO2 outlet concentrations obtained in the TPR-H2 runs were also monitored with this analyzer.
The metal contents of the Ni-Ru/Ce catalysts were determined by inductively coupled plasma–optical emission spectrometry (ICP-OES) using an iCAP 7000 spectrophotometer from Thermo Scientific. Prior to the analysis, the samples were digested in a mixture of HCl and HNO3 (10:1) at 250 °C using a Start D Microwave Digestion System from Milestone. Then, 10 mg of each sample was digested and then diluted with ultrapure water until reaching 50 mL. Any possible support residues remaining after digestion were eliminated by filtration.

3.4. Catalytic Experiments and Performance Indicators

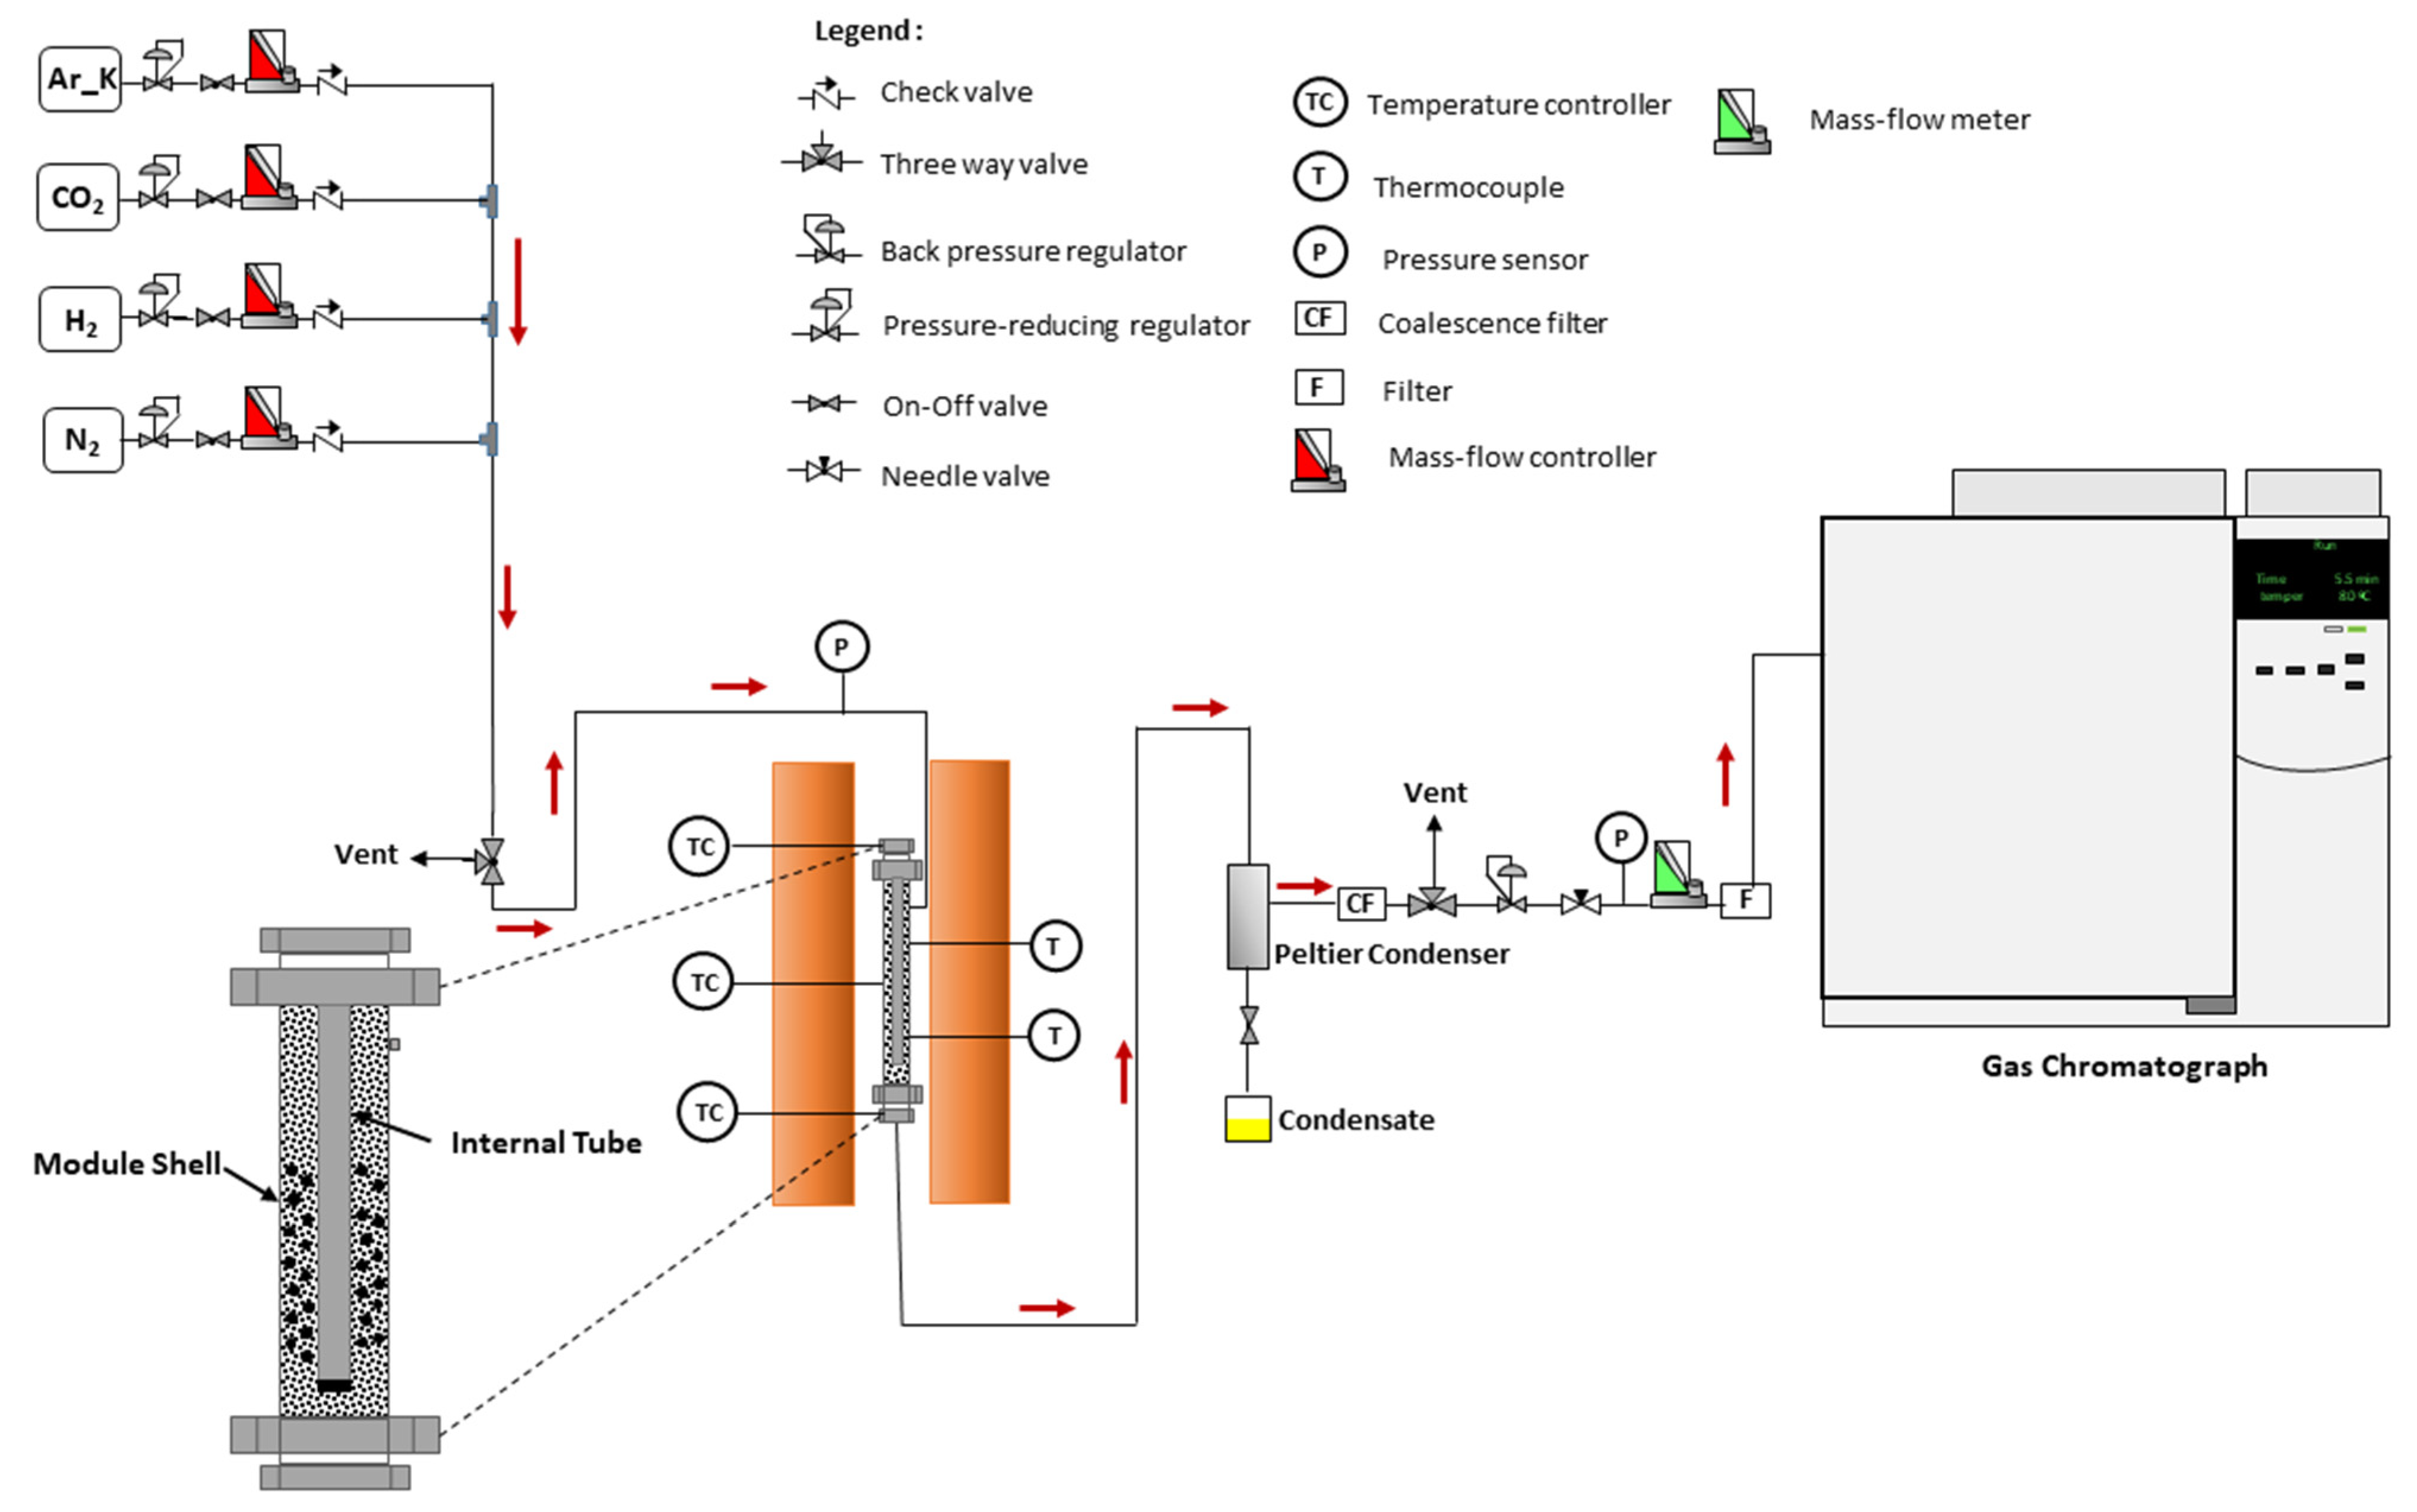
The experimental tests were performed in a custom-built stainless-steel module that consists of two concentric tubes with different diameters: a stainless-steel module shell with 32 cm of length and 4 cm i.d. and a stainless-steel tube closed at both ends with 30 cm of length and 12.7 mm o.d. The packed-bed with the catalyst and inert is localized between these 2 tubes (reaction medium with 12 cm of length) and, in this way, the feed stream flows through the annular section during the reaction (see the detail in Figure 7)—this configuration was considered since it is expected to use the best material in multifunctional reactors (namely in a membrane reactor). At the bottom and upper parts of the module, a layer of SiC smooths the flow of the reaction mixture. The module was placed inside a tubular oven (model Split from Termolab, Fornos Eléctricos, Lda., Águeda, Portugal) equipped with a 3-zone PID temperature controller (model MR13 from Shimaden, Nerima City, Japan). The thermocouples used to evaluate and control the oven temperature were placed in the same radial position in the oven and very close to the column wall. In addition, a thermocouple recorded the temperature inside the module (inside the reaction medium). N2 was fed into the reactor using a mass flow controller (model F201 from Bronkhorst-High Tech, Ruurlo, The Netherlands), while the OMW solution was fed by an HPLC pump (Eldex, 1LMP) and forced to pass through an evaporation/mixing zone at 400 °C before entering the reactor. The pressure in the system was measured by means of two pressure transducers (model PMP 4010 from Druck) placed before and after the packed-bed unit. The liquid phase produced during the course of the reaction was condensed in a home-assembled Peltier cold trap located after the reactor (cf. Figure 7). The tube and fittings between the module outlet and the first Peltier condenser were kept at 150 °C to avoid condensation. A system of two Peltier-based cold traps, a coalescence filter and a filter were used between the reactor and the analysis system to retain all the condensable species.
A gas chromatograph (GC-Agilent 7820A) equipped with a thermal conductivity detector (TCD using N2 as makeup gas) and a flame ionization detector (FID—with a methanizer and using He as makeup gas) was used to analyze the gaseous products. The chromatograph is also equipped with two columns (Plot Q (30 m × 0.32 mm) and Plot 5A (30 m × 0.32 mm)). The H2 was analyzed by TCD with Ar as a carrier gas to achieve a better response owing to the higher difference in thermal conductivity.
An oxidative regeneration program was considered in the catalytic experiments because it was previously observed that this treatment (promoting the coke deposits’ gasification) for several catalysts used in the OMWSR process allowed the recovery of the catalytic performance [9,43].
The catalysts were crushed, sieved (350–600 μm) and mixed with inert silicon carbide particles with the same particle size. Using this range of particle sizes, it is possible to neglect the gas–solid wall effects and the pressure drop in the reactor. Before the OMW steam reforming catalytic tests (also before the TPD-CO2 analyses), the catalysts were activated (@ 400 °C during 2 h under a 10% H2/N2 stream—total flow rate of 100 mLNPT·min−1), taking into account the results of the TPR-H2 analyses (see more details in Section 2.1.1).
The operating conditions used in this work are shown in Table 7. The blank tests, herein called 
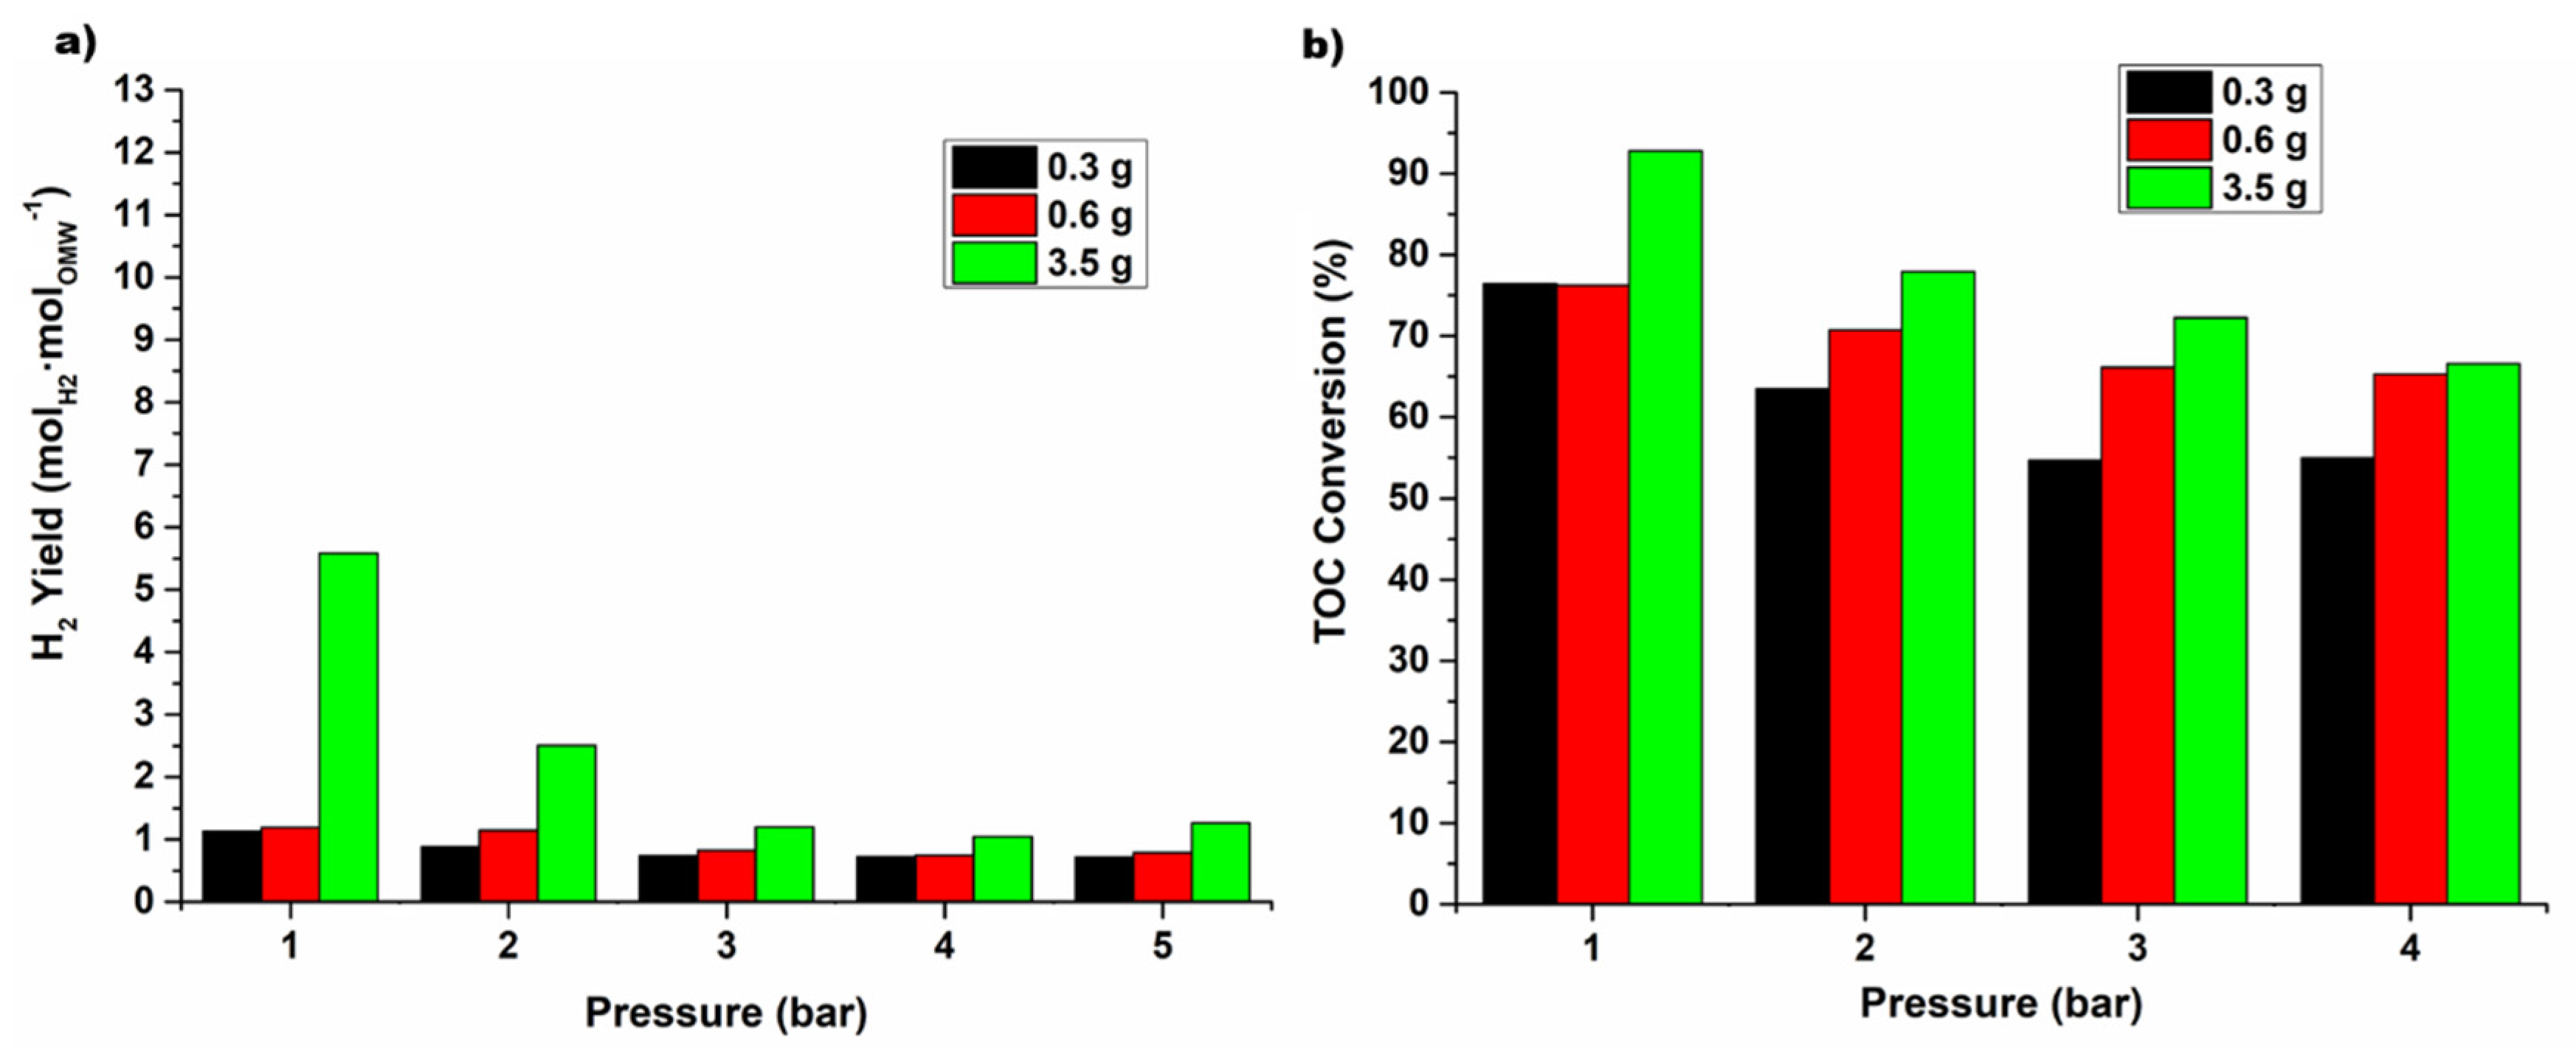
Exp. 0, in which the packed-bed reactor was filled only with inert SiC, was carried out for all the operation conditions studied in this work. In addition, two other different experimental runs were carried out. For the Rh-based catalyst, preliminary experimental tests (Exp. 1) were carried out with different catalyst masses, from 0.3 to 3.5 g, to see the effect of the quantity of catalyst on the OMW conversion and H2 production and to define the catalyst mass for the Exp. 2. In Exp. 2, a high quantity of catalysts was used (7 g) and, besides that, oxidative regeneration was always performed before changing the system pressure. Finally, in Exp. 3, stability tests were performed during 24 h with the two catalysts with better performance in Exp. 2. The catalyst oxidative regeneration was employed in Exps. 2 and 3, since it was verified in a previous work that this treatment allowed almost complete recovery of the catalytic performance [
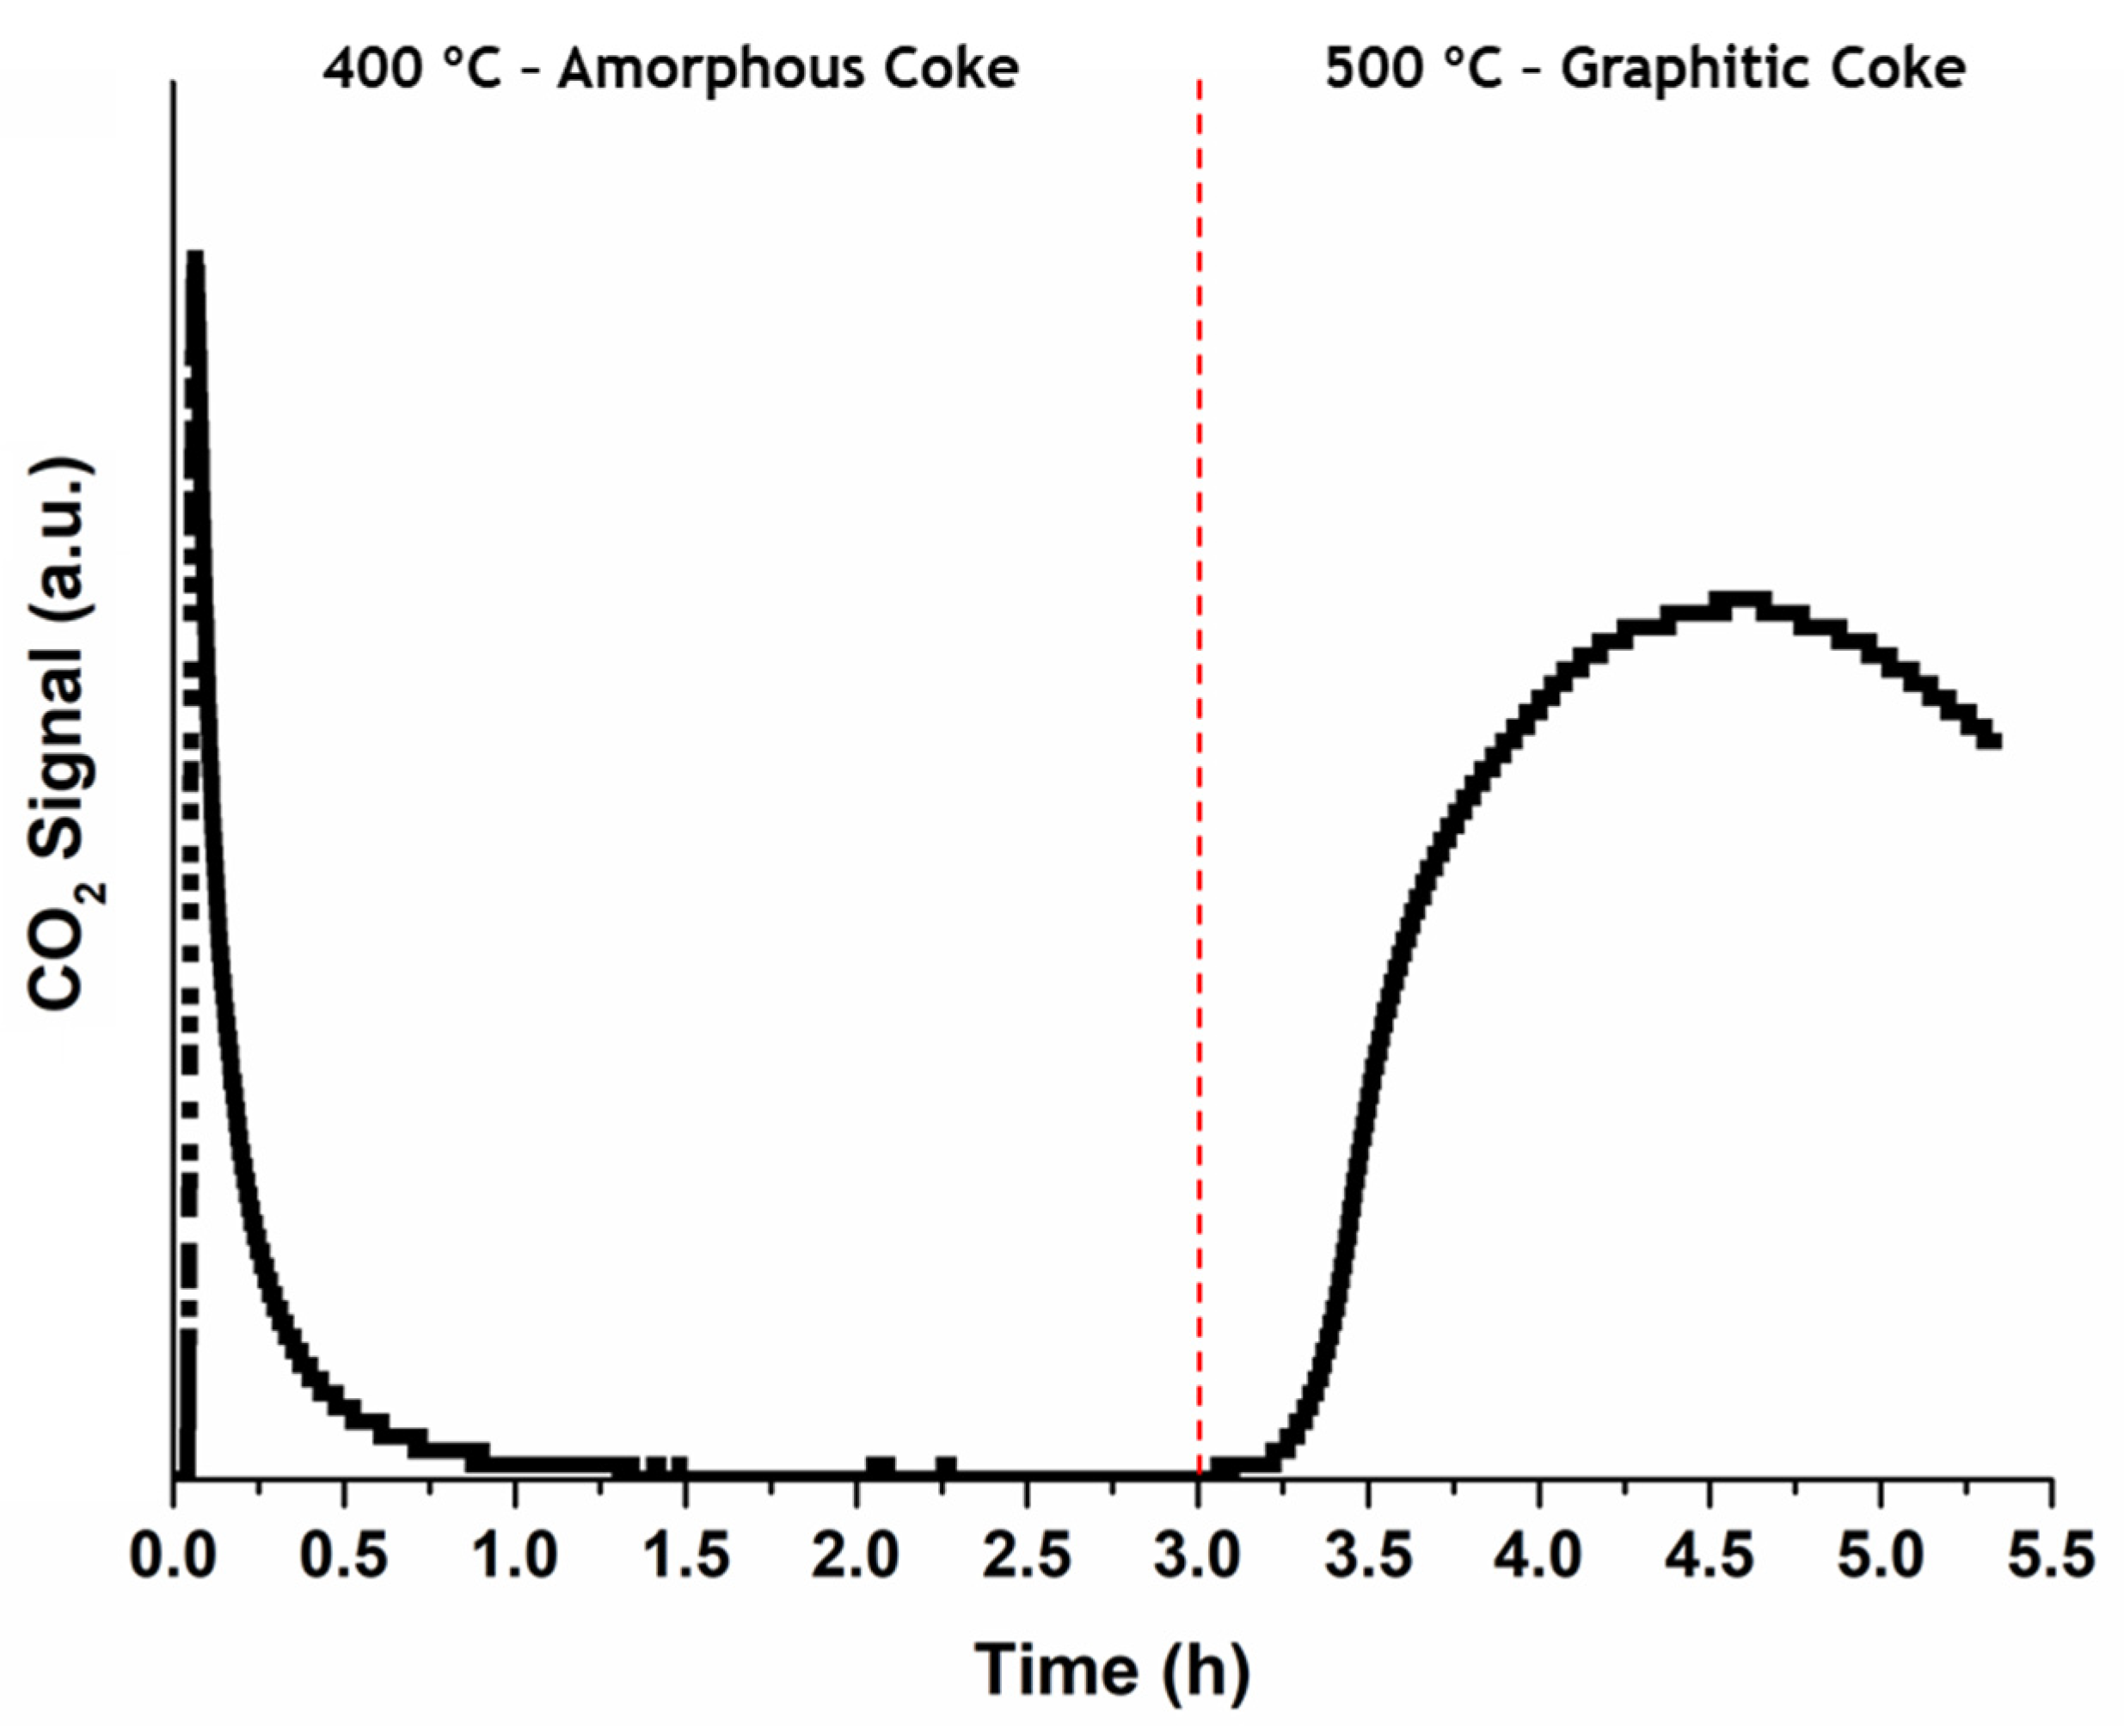
9]. In this work, the occurrence of two different combustion peaks was observed during the oxidative regeneration of the spent samples, below and above 500 °C, which were connected to the oxidation of amorphous and graphitic carbon deposits, respectively. In this work, for the in situ oxidative regeneration program used in Exps. 2 and 3, the sample of spent catalyst was treated with a flow rate of 25 mLN·min−1 of reconstituted air (20 vol.% O2 in N2) diluted with 75 mLN·min−1 of N2, first at 400 °C and then at 500 °C. The coke produced during the experimental tests of the Exp. 3 runs was fully oxidized (the concentration of CO2 measured at the reactor outlet was equal to zero at the end of the program). After this procedure, the catalyst was exposed to a reducing atmosphere (H2), as described in this section.
Samples of the condensable phase were collected during all the experimental tests and analyzed in terms of the TOC. The system was always flushed with N2 (100 mLNPT·min−1) for 20 min between the treatment programs and before and after the catalytic tests in all the experimental runs.
In all the experimental runs, the OMW was fed into the evaporation system at a constant flow rate of 0.5 mL·min−1. Then, the vaporized OMW was carried into the reactor by the carrier gas (25 mLNPT·min−1 of N2).
The conversion of OMW during the reaction was analyzed by the TOC conversion—Equation (13):
η % = 1 TOC outlet TOC inlet × 100
where the subscripts “inlet” and “outlet” stand for the feed and outlet condensate streams, respectively. The yield of the reaction products was calculated by Equation (14), where F i is the molar flow rate of component i (H2, CO2, CO and CH4) at the outlet stream and F OMW is the molar flow rate of compounds present in the OMW flowing into the system.
Yield i = F i F OMW

4. Conclusions

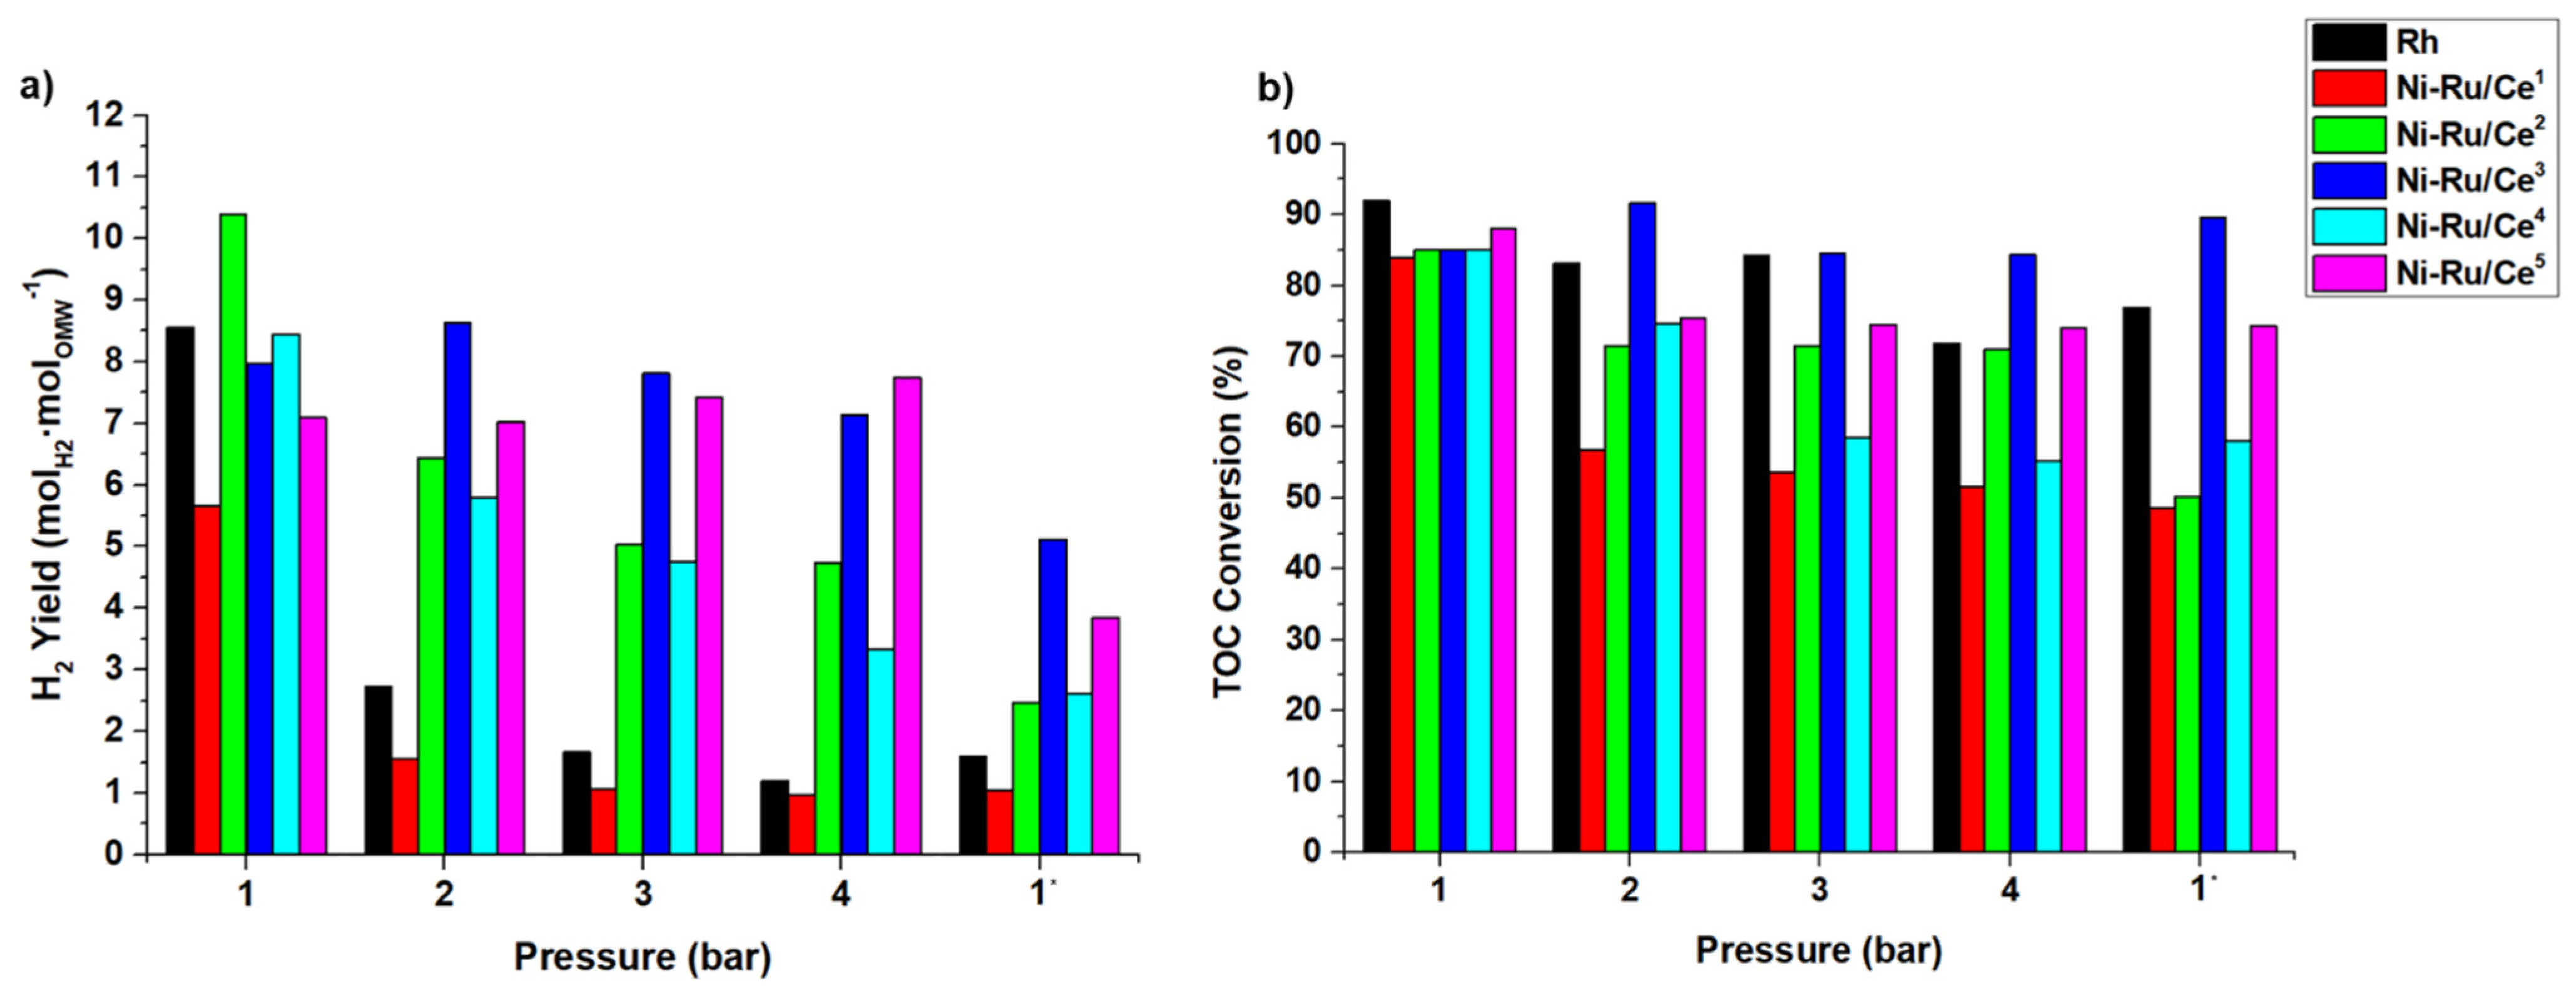
Among the synthesized catalysts, Ni-Ru/Ce3 showed the best results upon a comparison of the performance of a series of Ni-Ru/Ce-SiO2 catalysts prepared by different methods. The Ni-Ru/Ce3 was prepared through a straightforward and reproducible method. All the catalysts tested in Exp. 2 presented deactivation over the experimental campaign, especially at 1 bar.
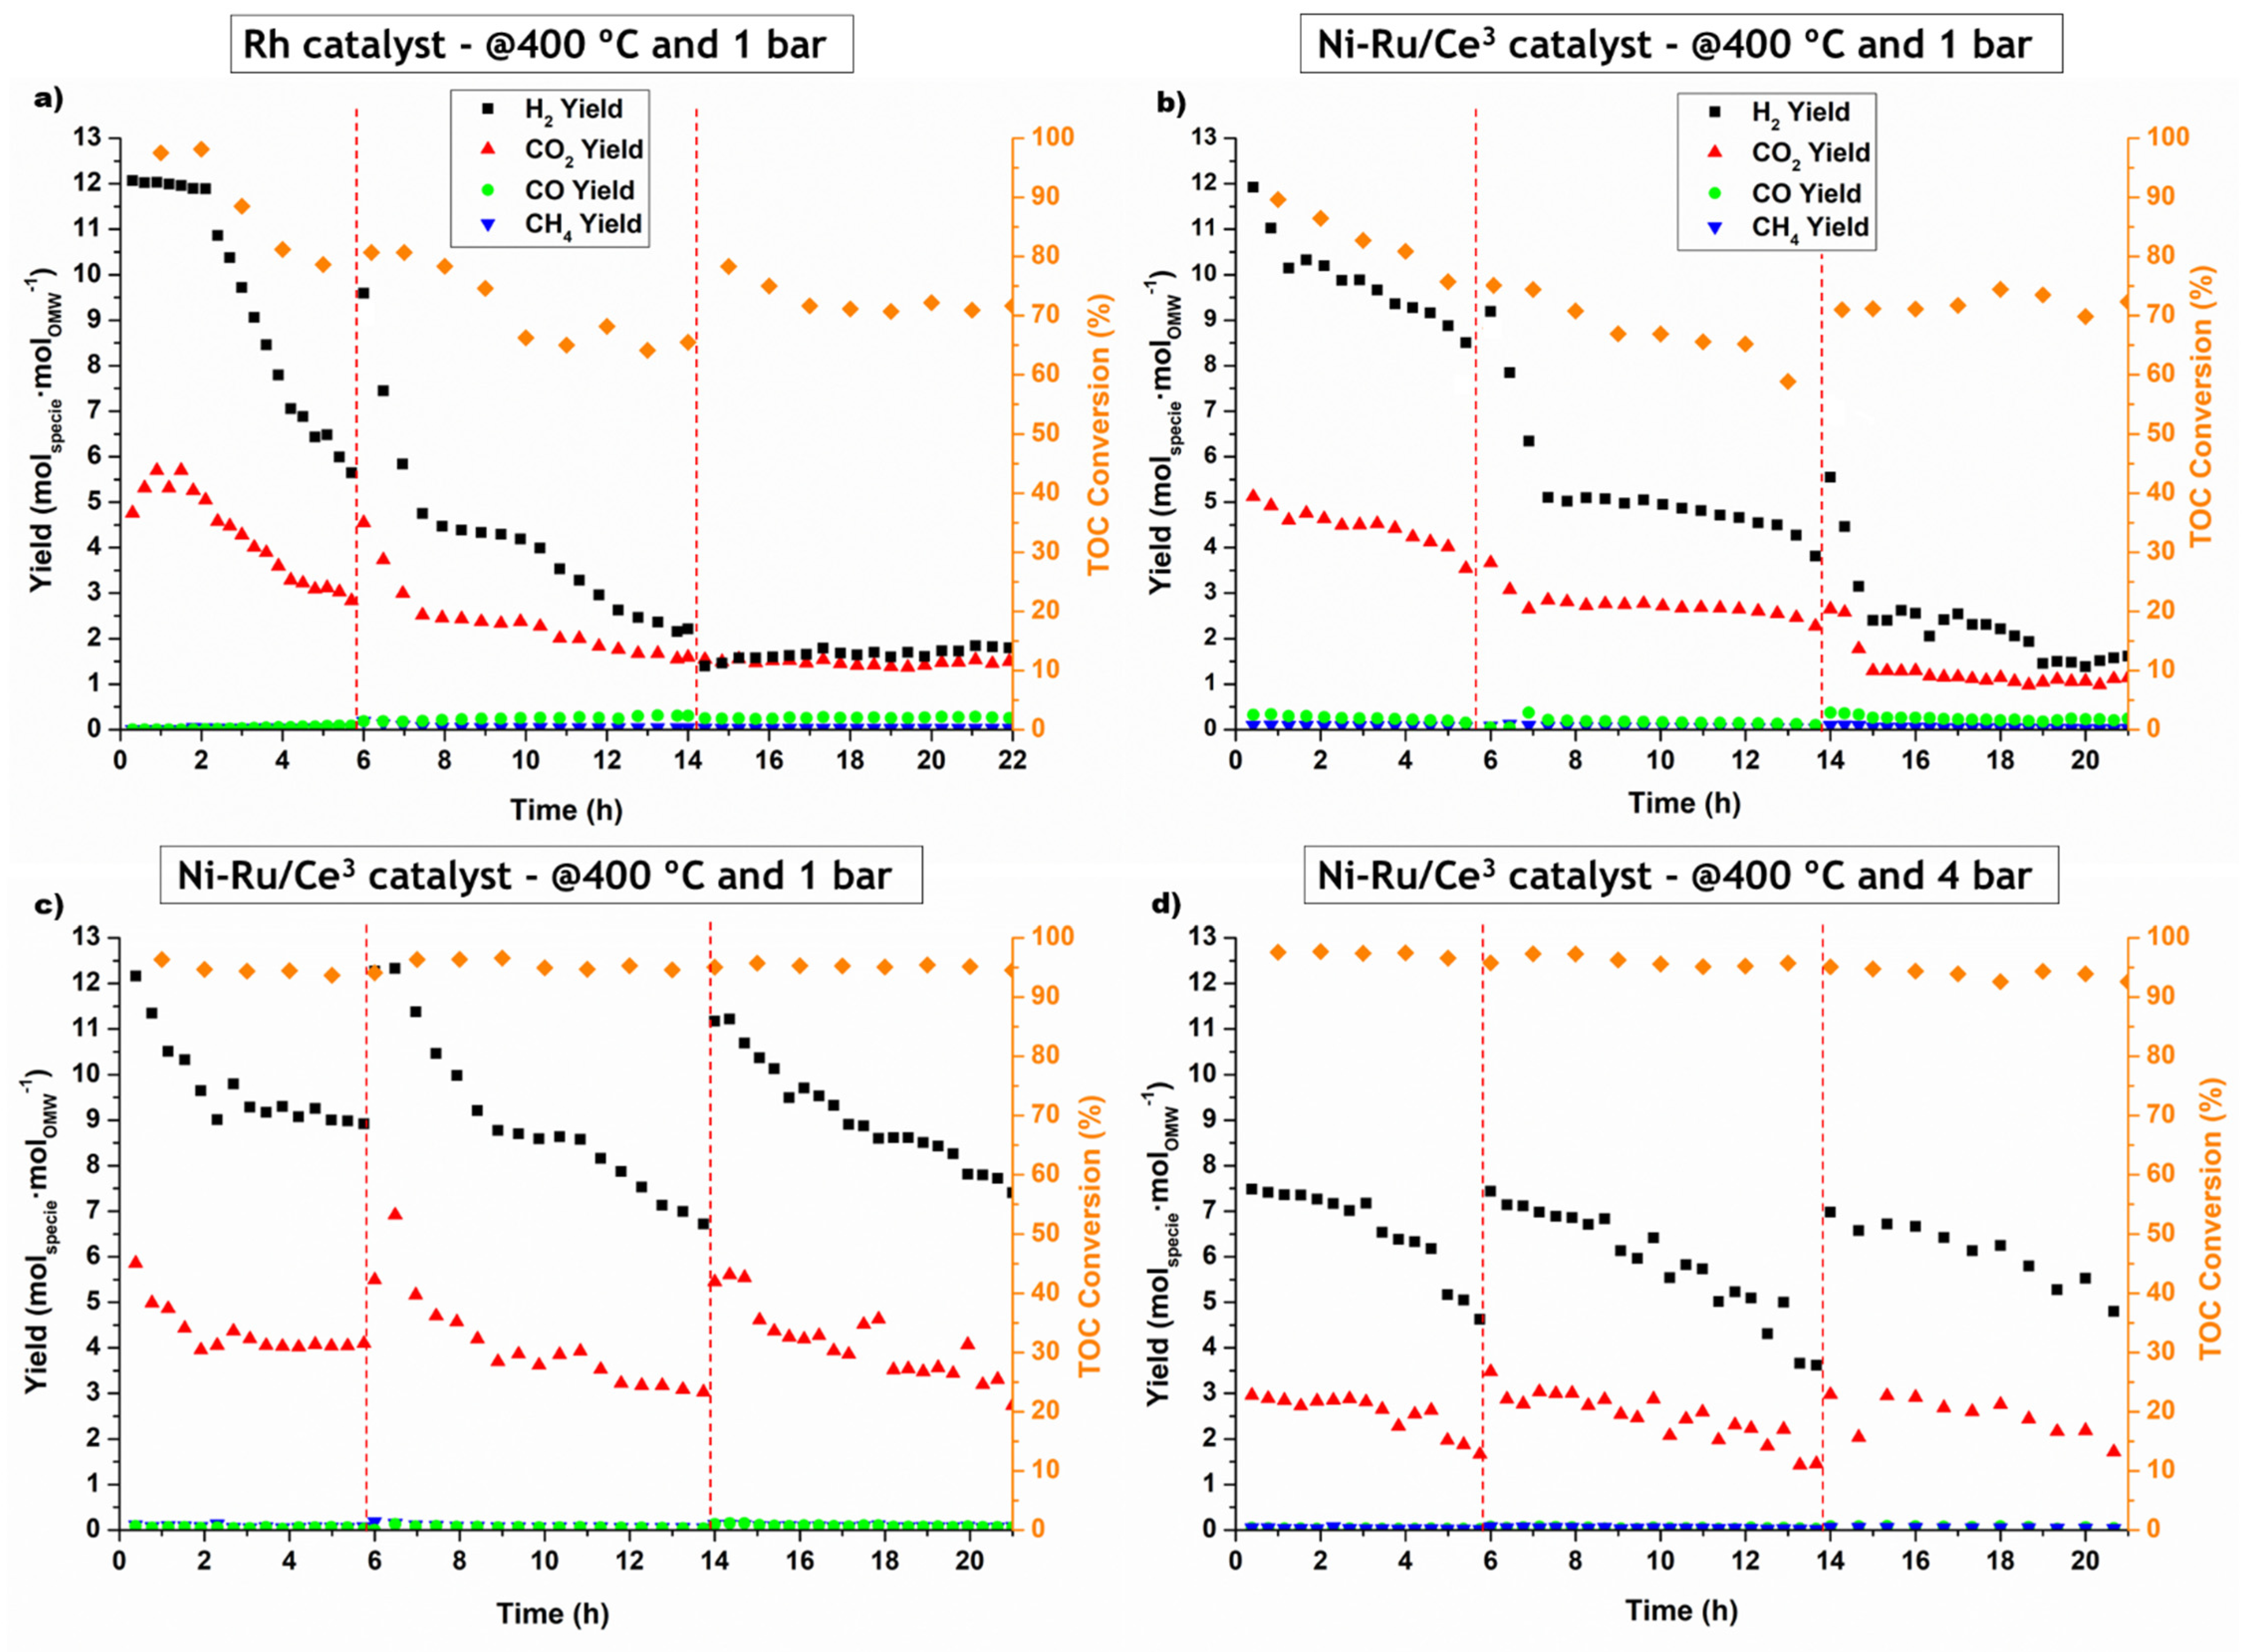
In the stability tests, it was confirmed that the catalysts suffer from pronounced deactivation at 1 bar when oxidative regeneration with a fixed time was employed. However, after total oxidative regeneration, complete recovery of the catalytic performance was observed in the stability tests at 1 and 4 bar and the stability of the catalyst increased.
Moreover, with complete oxidation of the coke, it was observed that the TOC conversion remains stable at approximately 95% over 24 h time-on-stream for both pressures and the H2 yield observed was always between 12 and 6.5 molH2·molOMW−1 and 7 and 3.5 molH2·molOMW−1 at 1 and 4 bar, respectively. With this study, it was concluded that this type of catalyst was significantly deactivated due mostly to the coke produced.
For future work, testing the best material with real OMW effluents and considering new oxidative regeneration program strategies are proposed.

Supplementary Materials

The following supporting information can be downloaded at: https://www.mdpi.com/article/10.3390/catal15070654/s1, Figure S1: TPD-CO2 profile of some selected Ni-Ru/Ce catalysts; Figure S2: Carbon gas products yields as a function of pressure, obtained in Exp.2 for all the catalysts at 400 °C (* repetition of the experimental condition for comparison purposes); Figure S3: Yields of H2, CO2, CH4 and CO and TOC conversion in Exp.2 for all the catalysts as a function of time on stream at different pressures (* repetition of the experimental condition for comparison purposes).

Author Contributions

Conceptualization, C.R.; methodology, C.R.; validation, C.R. and M.A.S.; investigation, C.R.; resources, L.M.M.; writing—original draft preparation, C.R.; writing—review and editing, M.A.S. and L.M.M.; supervision, M.A.S. and L.M.M.; funding acquisition, L.M.M. All authors have read and agreed to the published version of the manuscript.

Funding

This work was supported by national funds through FCT/MCTES (PIDDAC): LEPABE, UIDB/00511/2020 (DOI: 10.54499/UIDB/00511/2020) and UIDP/00511/2020 (DOI: 10.54499/UIDP/00511/2020), and ALiCE, LA/P/0045/2020 (DOI: 10.54499/LA/P/0045/2020). This work was also financially supported by national funds through the FCT/MCTES (PIDDAC), under the project DRI/India/0504/2020-WASTENERGY –Distillery WASTes Valorisation into renewables ENERGY, with DOI 10.54499/DRI/India/0504/2020. This work is also financially supported by the HYDROAZEITE project, funded by U. Porto Innovation through the BIP PROOF 2023 program.

Data Availability Statement

No research data available for this work.

Conflicts of Interest

The authors declare no conflicts of interest.

Notation and Glossary

List of Variables
F i Molar flow rate of component i at the reactor outlet (mol·min−1)
F O M W Molar flow rate of OMW fed to the reactor (mol·min−1)
η TOC conversion (dimensionless)
List of Acronyms
BODBiochemical oxygen demand
CODChemical oxygen demand
FIDFlame ionization detector
OMWOlive mill wastewater
OMWSROlive mill wastewater steam reforming
TCDThermal conductivity detector
TOCTotal organic carbon
TPOTemperature programmed oxidation
WGSWater–gas shift

References

  1. International Olive Council (IOC). Economic Affairs & Promotion Unit. 2025. Available online: https://www.internationaloliveoil.org/what-we-do/economic-affairs-promotion-unit/#prices (accessed on 20 May 2025).
  2. Tosti, S.; Accetta, C.; Fabbricino, M.; Sansovini, M.; Pontoni, L. Reforming of olive mill wastewater through a Pd-membrane reactor. Int. J. Hydrogen Energy 2013, 38, 10252–10259. [Google Scholar] [CrossRef]
  3. Tosti, S.; Fabbricino, M.; Pontoni, L.; Palma, V.; Ruocco, C. Catalytic reforming of olive mill wastewater and methane in a Pd-membrane reactor. Int. J. Hydrogen Energy 2016, 41, 5465–5474. [Google Scholar] [CrossRef]
  4. Aggoun, M.; Arhab, R.; Cornu, A.; Portelli, J.; Barkat, M.; Graulet, B. Olive mill wastewater microconstituents composition according to olive variety and extraction process. Food Chem. 2016, 209, 72–80. [Google Scholar] [CrossRef]
  5. Nasr, B.; Ahmed, B.; Abdellatif, G. Fenton treatment of olive oil mill wastewater-applicability of the method and parameters effects on the degradation process. J. Environ. Sci. 2004, 16, 942–944. [Google Scholar]
  6. Katsoyannos, E.; Hatzikioseyian, A.; Remoundaki, E.; Tsezos, M. Photocatalytic treatment of olive mill wastewaters (OMW) in pilot scale. In 13th International Symposium on Polluiton and Its Impact on Life in Mediterranean Region; National Technical University of Athens: Athens, Greece, 2005. [Google Scholar]
  7. Gebreyohannes, A.Y.; Mazzei, R.; Giorno, L. Trends and current practices of olive mill wastewater treatment: Application of integrated membrane process and its future perspective. Sep. Purif. Technol. 2016, 162, 45–60. [Google Scholar] [CrossRef]
  8. Rocha, C.; Soria, M.A.; Madeira, L.M. Use of Ni-containing catalysts for synthetic olive mill wastewater steam reforming. Renew. Energy 2022, 185, 1329–1342. [Google Scholar] [CrossRef]
  9. Rocha, C.; Soria, M.A.; Madeira, L.M. Olive mill wastewater valorization through steam reforming using hybrid multifunctional reactors for high-purity H2 production. Chem. Eng. J. 2022, 430, 132651. [Google Scholar] [CrossRef]
  10. Rocha, C.; Soria, M.A.; Madeira, L.M. Screening of commercial catalysts for steam reforming of olive mill wastewater. Renew. Energy 2021, 169, 765–779. [Google Scholar] [CrossRef]
  11. Leal, A.L.; Soria, M.A.; Madeira, L.M. Autothermal reforming of impure glycerol for H2 production: Thermodynamic study including in situ CO2 and/or H2 separation. Int. J. Hydrogen Energy 2016, 41, 2607–2620. [Google Scholar] [CrossRef]
  12. Macedo, M.S.; Soria, M.A.; Madeira, L.M. Glycerol steam reforming for hydrogen production: Traditional versus membrane reactor. Int. J. Hydrogen Energy 2019, 44, 24719–24732. [Google Scholar] [CrossRef]
  13. Feng, X.; Zhao, Y.; Zhao, Y.; Wang, H.; Liu, H.; Zhang, Q. A mini review on recent progress of steam reforming of ethanol. RSC Adv. 2023, 13, 23991–24002. [Google Scholar] [CrossRef]
  14. Tosti, S.; Cavezza, C.; Fabbricino, M.; Pontoni, L.; Palma, V.; Ruocco, C. Production of hydrogen in a Pd-membrane reactor via catalytic reforming of olive mill wastewater. Chem. Eng. J. 2015, 275 (Suppl. C), 366–373. [Google Scholar] [CrossRef]
  15. Casanovas, A.; Galvis, A.; Llorca, J. Catalytic steam reforming of olive mill wastewater for hydrogen production. Int. J. Hydrogen Energy 2015, 40, 7539–7545. [Google Scholar] [CrossRef]
  16. Alique, D.; Bruni, G.; Sanz, R.; Calles, J.A.; Tosti, S. Ultra-Pure Hydrogen via Co-Valorization of Olive Mill Wastewater and Bioethanol in Pd-Membrane Reactors. Processes 2020, 8, 219. [Google Scholar] [CrossRef]
  17. Pu, J.; Ikegami, F.; Nishikado, K.; Qian, E.W. Effect of ceria addition on NiRu/CeO2Al2O3 catalysts in steam reforming of acetic acid. Int. J. Hydrogen Energy 2017, 42, 19733–19743. [Google Scholar] [CrossRef]
  18. Wang, Y.; Chen, M.; Yang, J.; Liu, S.; Yang, Z.; Wang, J.; Liang, T. Hydrogen Production from Steam Reforming of Acetic Acid over Ni-Fe/Palygorskite Modified with Cerium. BioResources 2017, 12, 4830–4853. [Google Scholar] [CrossRef]
  19. Li, L.; Jiang, B.; Tang, D.; Zhang, Q.; Zheng, Z. Hydrogen generation by acetic acid steam reforming over Ni-based catalysts derived from La1−xCexNiO3 perovskite. Int. J. Hydrogen Energy 2018, 43, 6795–6803. [Google Scholar] [CrossRef]
  20. Savuto, E.; Navarro, R.M.; Mota, N.; Di Carlo, A.; Bocci, E.; Carlini, M.; Fierro, J.L.G. Steam reforming of tar model compounds over Ni/Mayenite catalysts: Effect of Ce addition. Fuel 2018, 224, 676–686. [Google Scholar] [CrossRef]
  21. Li, L.; Tang, D.; Song, Y.; Jiang, B.; Zhang, Q. Hydrogen production from ethanol steam reforming on Ni-Ce/MMT catalysts. Energy 2018, 149, 937–943. [Google Scholar] [CrossRef]
  22. Pantaleo, G.; Parola, V.L.; Testa, M.L.; Venezia, A.M. CO2 Reforming of CH4 over SiO2-Supported Ni Catalyst: Effect of Sn as Support and Metal Promoter. Ind. Eng. Chem. Res. 2021, 60, 18684–18694. [Google Scholar] [CrossRef]
  23. La Parola, V.; Pantaleo, G.; Deganello, F.; Bal, R.; Venezia, A.M. Plain and CeO2—Supported LaxNiOy catalysts for partial oxidation of CH4. Catal. Today 2018, 307, 189–196. [Google Scholar] [CrossRef]
  24. Bimbela, F.; Ábrego, J.; Puerta, R.; García, L.; Arauzo, J. Catalytic steam reforming of the aqueous fraction of bio-oil using Ni-Ce/Mg-Al catalysts. Appl. Catal. B Environ. 2017, 209, 346–357. [Google Scholar] [CrossRef]
  25. Galetti, A.E.; Gomez, M.F.; Arrúa, L.A.; Abello, M.C. Ni catalysts supported on modified ZnAl2O4 for ethanol steam reforming. Appl. Catal. A Gen. 2010, 380, 40–47. [Google Scholar] [CrossRef]
  26. Saw, E.T.; Oemar, U.; Tan, X.; Du, Y.; Borgna, A.; Hidajat, K.; Kawi, S. Bimetallic Ni–Cu catalyst supported on CeO2 for high-temperature water–gas shift reaction: Methane suppression via enhanced CO adsorption. J. Catal. 2014, 314, 32–46. [Google Scholar] [CrossRef]
  27. Yamaguchi, T.; Ikeda, N.; Hattori, H.; Tanabe, K. Surface and catalytic properties of cerium oxide. J. Catal. 1981, 67, 324–330. [Google Scholar] [CrossRef]
  28. Singha, R.K.; Yadav, A.; Agrawal, A.; Shukla, A.; Adak, S.; Sasaki, T.; Bal, R. Synthesis of highly coke resistant Ni nanoparticles supported MgO/ZnO catalyst for reforming of methane with carbon dioxide. Appl. Catal. B Environ. 2016, 191, 165–178. [Google Scholar] [CrossRef]
  29. De Almeida, L.; Grandjean, S.; Vigier, N.; Patisson, F. Insights into the Thermal Decomposition of Lanthanide(III) and Acti-nide(III) Oxalates—From Neodymium and Cerium to Plutonium. Eur. J. Inorg. Chem. 2012, 2012, 4986–4999. [Google Scholar] [CrossRef]
  30. Boupan, M.; Prompang, K.; Chompunuch, A.; Boonma, P.; Neramittagapong, A.; Theerakulpisut, S.; Neramittagapong, S. Role of Calcination Temperature on Isosorbide Production from Sorbitol Dehydration over the Catalyst Derived from Ce(IV) Sulfate. J. Renew. Mater. 2023, 11, 2985–3000. [Google Scholar] [CrossRef]
  31. Rocha, C.; Soria, M.A.; Madeira, L.M. Thermodynamic analysis of olive oil mill wastewater steam reforming. J. Energy Inst. 2019, 92, 1599–1609. [Google Scholar] [CrossRef]
  32. Rocha, C.; Soria, M.A.; Madeira, L.M. Steam reforming of olive oil mill wastewater with in situ hydrogen and carbon dioxide separation—Thermodynamic analysis. Fuel 2017, 207, 449–460. [Google Scholar] [CrossRef]
  33. Lu, P. Effect of Operating Conditions on the Coke Formation and Nickel Catalyst Performance During Cracking of Tar. Waste Biomass Valorization 2019, 10, 155–165. [Google Scholar] [CrossRef]
  34. Koo, K.Y.; Lee, S.-H.; Jung, U.H.; Roh, H.-S.; Yoon, W.L. Syngas production via combined steam and carbon dioxide reforming of methane over Ni–Ce/MgAl2O4 catalysts with enhanced coke resistance. Fuel Process. Technol. 2014, 119, 151–157. [Google Scholar] [CrossRef]
  35. Zhang, C.; Hu, X.; Yu, Z.; Zhang, Z.; Chen, G.; Li, C.; Liu, Q.; Xiang, J.; Wang, Y.; Hu, S. Steam reforming of acetic acid for hydrogen production over attapulgite and alumina supported Ni catalysts: Impacts of properties of supports on catalytic behaviors. Int. J. Hydrogen Energy 2019, 44, 5230–5244. [Google Scholar] [CrossRef]
  36. He, L.; Hu, S.; Jiang, L.; Syed-Hassan, S.S.A.; Wang, Y.; Xu, K.; Su, S.; Xiang, J.; Xiao, L.; Chi, H.; et al. Opposite effects of self-growth amorphous carbon and carbon nanotubes on the reforming of toluene with Ni/α-Al2O3 for hydrogen production. Int. J. Hydrogen Energy 2017, 42, 14439–14448. [Google Scholar] [CrossRef]
  37. Yao, D.; Yang, H.; Chen, H.; Williams, P.T. Co-precipitation, impregnation and so-gel preparation of Ni catalysts for pyrolysis-catalytic steam reforming of waste plastics. Appl. Catal. B Environ. 2018, 239, 565–577. [Google Scholar] [CrossRef]
  38. Tan, R.; Alir, A.; Mohamad, S.; Isa, K.M.; Abdullah, T.A.T. Ni-based catalysts for steam reforming of tar model derived from biomass gasification. In Proceedings of the 7th Conference on Emerging Energy and Process Technology (CONCEPT 2018), Johor Bahru, Malaysia, 27–28 November 2018. [Google Scholar]
  39. Wu, C.; Dong, L.; Huang, J.; Williams, P.T. Optimising the sustainability of crude bio-oil via reforming to hydrogen and valuable by-product carbon nanotubes. RSC Adv. 2013, 3, 19239–19242. [Google Scholar] [CrossRef]
  40. Galetti, A.E.; Gomez, M.F.; Arrúa, L.A.; Abello, M.C. Hydrogen production by ethanol reforming over NiZnAl catalysts: Influence of Ce addition on carbon deposition. Appl. Catal. A Gen. 2008, 348, 94–102. [Google Scholar] [CrossRef]
  41. Calles, J.A.; Carrero, A.; Vizcaíno, A.J.; García-Moreno, L. Hydrogen production by glycerol steam reforming over SBA-15-supported nickel catalysts: Effect of alkaline earth promoters on activity and stability. Catal. Today 2014, 227, 198–206. [Google Scholar] [CrossRef]
  42. Charisiou, N.D.; Papageridis, K.N.; Tzounis, L.; Sebastian, V.; Hinder, S.J.; Baker, M.A.; AlKetbi, M.; Polychronopoulou, K.; Goula, M.A. Ni supported on CaO-MgO-Al2O3 as a highly selective and stable catalyst for H2 production via the glycerol steam reforming reaction. Int. J. Hydrogen Energy 2019, 44, 256–273. [Google Scholar] [CrossRef]
  43. Silva, J.M.; Ribeiro, L.S.; Órfão, J.J.M.; Soria, M.A.; Madeira, L.M. Low temperature glycerol steam reforming over a Rh-based catalyst combined with oxidative regeneration. Int. J. Hydrogen Energy 2019, 44, 2461–2473. [Google Scholar] [CrossRef]
  44. Sánchez, B.; Gross, M.S.; Costa, B.D.; Querini, C.A. Coke analysis by temperature-programmed oxidation: Morphology characterization. Appl. Catal. A Gen. 2009, 364, 35–41. [Google Scholar] [CrossRef]
  45. Hoang, T.M.C.; Geerdink, B.; Sturm, J.M.; Lefferts, L.; Seshan, K. Steam reforming of acetic acid—A major component in the volatiles formed during gasification of humin. Appl. Catal. B Environ. 2015, 163 (Suppl. C), 74–82. [Google Scholar] [CrossRef]
  46. Zhao, X.; Xue, Y.; Lu, Z.; Huang, Y.; Guo, C.; Yan, C. Encapsulating Ni/CeO2-ZrO2 with SiO2 layer to improve it catalytic activity for steam reforming of toluene. Catal. Commun. 2017, 101 (Suppl. C), 138–141. [Google Scholar] [CrossRef]
  47. de Castro, T.P.; Silveira, E.B.; Rabelo-Neto, R.C.; Borges, L.E.P.; Noronha, F.B. Study of the performance of Pt/Al2O3 and Pt/CeO2/Al2O3 catalysts for steam reforming of toluene, methane and mixtures. Catal. Today 2018, 299 (Suppl. C), 251–262. [Google Scholar] [CrossRef]
  48. Smal, E.; Bespalko, Y.; Arapova, M.; Fedorova, V.; Valeev, K.; Eremeev, N.; Sadovskaya, E.; Krieger, T.; Glazneva, T.; Sadykov, V.; et al. Carbon Formation during Methane Dry Reforming over Ni-Containing Ceria-Zirconia Catalysts. Nanomaterials 2022, 12, 3676. [Google Scholar] [CrossRef]
  49. Soria, M.A.; Mateos-Pedrero, C.; Marín, P.; Ordóñez, S.; Guerrero-Ruiz, A.; Rodríguez-Ramos, I. Kinetic analysis of the Ru/SiO2-catalyzed low temperature methane steam reforming. Appl. Catal. A Gen. 2012, 413–414, 366–374. [Google Scholar] [CrossRef]
  50. West, P.B.; Haller, G.L.; Burwell, R.L. The catalytic activity of silica gel. J. Catal. 1973, 29, 486–493. [Google Scholar] [CrossRef]
  51. Ragaini, V.; Pirola, C.; Vitali, S.; Bonura, G.; Cannilla, C.; Frusteri, F. Stability of Metallic Ruthenium in Ru–Co Supported Silica Catalysts. Catal. Lett. 2012, 42, 1452–1460. [Google Scholar] [CrossRef]
  52. Zou, W.; Gonzalez, R.D. The chemical anchoring of noble metal amine precursors to silica. Catal. Today 1992, 15, 443–453. [Google Scholar] [CrossRef]
  53. Goodwin, J.G.; Goa, D.O.; Erdal, S.; Rogan, F.H. Reactive metal volatilization from Ru/Al2O3 as a result of ruthenium carbonyl formation. Appl. Catal. 1986, 24, 199–209. [Google Scholar] [CrossRef]
  54. Girardon, J.S.; Constant-Griboval, A.; Gengembre, L.; Chernavskii, P.A.; Khodakov, A.Y. Optimization of the pretreatment procedure in the design of cobalt silica supported Fischer–Tropsch catalysts. Catal. Today 2005, 106, 161–165. [Google Scholar] [CrossRef]
  55. Wang, S.; Schrunk, E.T.; Mahajan, H.; Farrauto, R.J. The Role of Ruthenium in CO2 Capture and Catalytic Conversion to Fuel by Dual Function Materials (DFM). Catalysts 2017, 7, 88. [Google Scholar] [CrossRef]
  56. Poggio, E.; Jobbágy, M.; Moreno, M.; Laborde, M.; Mariño, F.; Baronetti, G. Influence of the calcination temperature on the structure and reducibility of nanoceria obtained from crystalline Ce(OH)CO3 precursor. Int. J. Hydrogen Energy 2011, 36, 15899–15905. [Google Scholar] [CrossRef]
  57. D’Angelo, A.M.; Webster, N.A.S.; Chaffee, A.L. Characterisation of the phase-transformation behaviour of Ce2O(CO3)2·H2O clusters synthesised from Ce(NO3)3·6H2O and urea. Powder Diffr. 2014, 29, S84–S88. [Google Scholar] [CrossRef]
  58. Emamdoust, A.; Parola, V.L.; Pantaleo, G.; Testa, M.L.; Shayesteh, S.F.; Venezia, A.M. Partial oxidation of methane over SiO2 supported Ni and NiCe catalysts. J. Energy Chem. 2020, 47, 1–9. [Google Scholar] [CrossRef]
  59. Shanmuganandam, K.; Ramanan, M.V. Ni-Ce/SiO2 nanocomposite: Characterization and catalytic activity in the cracking of tar in biomass gasifiers. Energy Sources Part A Recovery Util. Environ. Eff. 2016, 38, 2418–2425. [Google Scholar] [CrossRef]
  60. Tapia-Parada, K.; Valverde-Aguilar, G.; Mantilla, A.; Valenzuela, M.A.; Hernández, E. Synthesis and characterization of Ni/Ce–SiO2 and Co/Ce–TiO2 catalysts for methane decomposition. Fuel 2013, 110, 70–75. [Google Scholar] [CrossRef]
  61. Arcotumapathy, V.; Alenazey, F.S.; Al-Otaibi, R.L.; Vo, D.-V.N.; Alotaibi, F.M.; Adesina, A.A. Mechanistic investigation of methane steam reforming over Ce-promoted Ni/SBA-15 catalyst. Appl. Petrochem. Res. 2015, 5, 393–404. [Google Scholar] [CrossRef]
  62. Allouche, N.; Fki, I.; Sayadi, S. Toward a High Yield Recovery of Antioxidants and Purified Hydroxytyrosol from Olive Mill Wastewaters. J. Agric. Food Chem. 2004, 52, 267–273. [Google Scholar] [CrossRef]
  63. El-Abbassi, A.; Kiai, H.; Hafidi, A. Phenolic profile and antioxidant activities of olive mill wastewater. Food Chem. 2012, 132, 406–412. [Google Scholar] [CrossRef]
  64. Daâssi, D.; Lozano-Sánchez, J.; Borrás-Linares, I.; Belbahri, L.; Woodward, S.; Zouari-Mechichi, H.; Mechichi, T.; Nasri, M.; Segura-Carretero, A. Olive oil mill wastewaters: Phenolic content characterization during degradation by Coriolopsis gallica. Chemosphere 2014, 113, 62–70. [Google Scholar] [CrossRef] [PubMed]
  65. Esteves, B.M.; Rodrigues, C.S.D.; Madeira, L.M. Synthetic olive mill wastewater treatment by Fenton’s process in batch and continuous reactors operation. Environ. Sci. Pollut. Res. 2018, 25, 34826–34838. [Google Scholar] [CrossRef] [PubMed]
  66. American Water Works Association (AWWA); Water Environment Federation (WEF); American Public Health Association (APHA). Standard Methods for the Examination of Water and Wastewater, 20th ed.; Greenberg, A.E., Eaton, A.D., Franson, M.A.H., Clesceri, L.S., Eds.; American Public Health Association: Washington, DC, USA, 1998. [Google Scholar]
  67. Abou Rached, J.; Cesario, M.R.; Estephane, J.; Tidahy, H.L.; Gennequin, C.; Aouad, S.; Aboukaïs, A.; Abi-Aad, E. Effects of cerium and lanthanum on Ni-based catalysts for CO2 reforming of toluene. J. Environ. Chem. Eng. 2018, 6, 4743–4754. [Google Scholar] [CrossRef]
Figure 1. TPR analyses of all the Ni-Ru/Ce catalysts.
Catalysts 15 00654 g001
Figure 2. (a) H2 yield and (b) TOC conversion as a function of the pressure, obtained in Exp. 1 for the Rh catalyst at 400 °C, using different quantities of catalyst—0.3 g of catalyst corresponded to WSHV = 100 h−1, 0.6 g to WSHV = 50 h−1 and 3.5 g to WHSV = 9 min−1.
Catalysts 15 00654 g002
Figure 3. (a) H2 yield and (b) TOC conversion as a function of the pressure, obtained in Exp. 2 for all the catalysts at 400 °C (* repetition of the experimental test at 1 bar for comparison purposes) and WHSV = 18 min−1.
Catalysts 15 00654 g003
Figure 4. TPO profile of the Ni-Ru/Ce3 catalyst after a catalytic test at 400 °C and 1 bar in Exp. 2.
Catalysts 15 00654 g004
Figure 5. Gaseous species yield and TOC conversion during Exp. 3 for the catalyst Rh and for the catalyst Ni-Ru/Ce3 (oxidative regeneration represented by the dashed red lines) with WHSV = 18 min−1. In the first experimental tests (a,b), the coke was not fully oxidized in the oxidative regeneration program; in the catalytic tests (c,d), the coke was fully oxidized. The symbols used in figures (c,d) have the same meaning as those shown in figures (a,b).
Catalysts 15 00654 g005
Figure 6. The schematic flowchart illustrates the preparation steps for the series of Ni-Ru/Ce catalysts used in this work.
Catalysts 15 00654 g006
Figure 7. Scheme of the set-up and detail of the stainless-steel module used for the experimental tests.
Catalysts 15 00654 g007
Table 1. Quantities of basic sites in some selected catalysts.
CatalystWeak Basic Sites (mmolCO2·gcatalyst−1)Medium Basic Sites (mmolCO2·gcatalyst−1)Strong Basic Sites (mmolCO2·gcatalyst−1)Total Basic Sites (mmolCO2·gcatalyst−1)
Ni-Ru (a)0.180.100.040.32
Ni-Ru/Ce20.210.070.190.47
Ni-Ru/Ce30.420.130.030.58
(a) Material prepared in a previous study using the same preparation method for the remaining catalysts (Ni-Ru/Ce2/3). Reprinted with permission from Ref. [8]. 2022, Elsevier.
Table 2. ICP-OES results of the Ni-Ru/Ce catalysts.
CatalystTheoretical Ni Loading (wt.%)Real Ni Loading (wt.%)Theoretical Ru Loading (wt.%)Real Ru Loading (wt.%)Theoretical Ce Loading (wt.%)Real Ce Loading (wt.%)
Ni-Ru/Ce1107.010.060.30.39
Ni-Ru/Ce21010.210.520.30.23
Ni-Ru/Ce3108.610.4332.2
Ni-Ru/Ce41010.410.590.30.04
Ni-Ru/Ce5108.610.5830.8
The characterization was performed by an external entity and no error margins were provided.
Table 3. Yields of gaseous products and OMW TOC conversion in the thermodynamic equilibrium (Aspen Plus simulation) and in the blank experiments (Exp. 0) at 400 °C.
Pressure (Bar)H2 YieldCO YieldCH4 YieldCO2 YieldTOC Conversion (%)
Thermodynamic Equilibrium (Simulations in Aspen Plus V.9®)
112.18(0)1.4 × 10−35.7 × 10−76.0100
212.18(0)1.4 × 10−32.3 × 10−66.0100
312.18(0)1.4 × 10−35.1 × 10−66.0100
412.18(0)1.4 × 10−39.1 × 10−66.0100
Blank Tests/Experimental results (Exp. 0)
10.710.091.6 × 10−20.7051
20.830.185.0 × 10−30.7051
30.880.127.0 × 10−30.6749
40.830.109.0 × 10−30.5648
Maximum Theoretical Yield of H212.18(2)
Table 4. Quantities of coke produced with all the catalysts at 1 bar (values between brackets represent the fraction of total carbon).
CatalystAmorphous Coke (mmolC·gcatalyst−1)
Rh0.29 (62%)
Ni-Ru/Ce10.20 (51%)
Ni-Ru/Ce20.15 (33%)
Ni-Ru/Ce30.04 (10%)
Ni-Ru/Ce40.13 (33%)
Ni-Ru/Ce50.09 (21%)
Graphitic Coke (mmolC·gcatalyst−1)
Rh0.18 (38%)
Ni-Ru/Ce10.19 (49%)
Ni-Ru/Ce20.30 (67%)
Ni-Ru/Ce30.36 (90%)
Ni-Ru/Ce40.26 (67%)
Ni-Ru/Ce50.34 (79%)
Total Coke (mmolC·gcatalyst−1)
Rh0.47
Ni-Ru/Ce10.39
Ni-Ru/Ce20.45
Ni-Ru/Ce30.40
Ni-Ru/Ce40.39
Ni-Ru/Ce50.43
Table 5. Preparation conditions considered in the production of the series of Ni-Ru/Ce catalysts.
CatalystSiO2 Particles Size (μm)Stirring Temperature (°C)Ni (wt.%)Ru (wt.%)Ce (wt.%)Calcination Temperature (°C)
Ni-Ru/Ce1210–500Room temperature1010.3250
Ni-Ru/Ce21410–336055
Ni-Ru/Ce33
Ni-Ru/Ce40.3250 and 550
Ni-Ru/Ce53550
Table 6. OMW composition.
Chemical CompoundConcentration (mg·L−1)
Vanillic acid50
Gallic acid50
Cinnamic acid50
Syringic acid50
Tyrosol100
Veratric acid100
4-hydroxybenzoic acid100
Protocatechuic acid100
L-arabinose1050
D-galactose450
Table 7. Operational conditions for the different experimental tests.
Experimental RunsCatalyst (s)Temperature (°C)Pressure (Bar)Catalyst Mass (g)Oxidative Regeneration Program
Exp. 0-4001/2/3/4--
Exp. 1Rh0.3/0.6/3.53 h at 400 °C and 2 h at 500 °C *
Exp. 2Rh and Ni-Ru/Cex73 h at 400 °C and 2 h at 500 °C
Exp. 3Rh and Ni-Ru/Ce31/4Full oxidation at 400 and 500 °C
* Only used in one particular experimental test.
Disclaimer/Publisher’s Note: The statements, opinions and data contained in all publications are solely those of the individual author(s) and contributor(s) and not of MDPI and/or the editor(s). MDPI and/or the editor(s) disclaim responsibility for any injury to people or property resulting from any ideas, methods, instructions or products referred to in the content.

