2.1. Characterization of Catalysts
The catalysts were prepared by sequential adsorption of chitosan (CS) and metal ions (Fe
3+, Cr
3+, Cu
2+) on SBA-15. The elemental contents of the catalysts identified by EDX measurements are shown in
Table 1. For comparison, the supported catalysts without polymers were prepared. The content of the active phase (metal) in Cr–CS/SBA-15 and Fe–CS/SBA-15 was close to 3% wt., while in the Cu–CS/SBA-15 the metal content was lower. For the catalysts without polymer modification, only a small amount of metal was detected on the SBA-15 surface. Thus, the polymer promotes the fixation of the active phase on the solid support.
Figure 1 presents the SEM and EDX elemental mapping images of Cr, Fe, Si and O from the Cr–CS/SBA-15 and Fe–CS/SBA-15. All elements (Cr, Si, O for Cr–CS/SBA-15 and Fe, Si, O for Fe-CS/SBA-15) are uniformly distributed, which is consistent with the SEM images and suggests that Cr and Fe are homogeneously fixed on CS/SBA-15.
Figure 2 demonstrates the IR spectra of initial components and Cr–CS/SBA-15 catalyst. The spectrum of SBA-15 shows a broad absorption peak at 3467 cm
−1, which belongs to hydroxyl (O–H and Si–OH) stretching bands (
Figure 2a) [
40]. The absorption peak at 1104 cm
−1 was ascribed to the antisymmetric stretching vibrations of Si-O-Si [
40,
41,
42]. IR spectra of chitosan displayed absorption peaks at 3442 cm
−1 (νO–H), 2929 and 2888 cm
−1 (νC–H), 1644 cm
−1 (C=O stretching in NH
2-C=O), 1562 cm
−1 (δN–H), and 1080 cm
−1 (νC–O) (absorption frequencies of β-d-pyranoside in chitosan) (
Figure 2b) [
40,
41,
43,
44]. When chitosan is dissolved in dilute HNO
3 solution, protonation of NH-groups occurs to form a positively charged water-soluble cationic polyelectrolyte [
43]. This was confirmed by shifting of the absorption bands of -NH-groups from 1562 cm
−1 to 1532 cm
−1 (
Figure 2c) [
45,
46].
IR spectra of CS/SBA-15 and Cr–CS/SBA-15 showed a presence of functional groups of both chitosan and SBA-15. Moreover, a comparison of IR spectra of CS/SBA-15 (
Figure 2d) with those of the protonated form of chitosan (chitosanium nitrate,
Figure 2c) and Cr–CS/SBA-15 (
Figure 2e) showed that chitosan interacted with both SBA-15 surface and Cr ions through its NH-groups. For instance, formation of CS/SBA-15 composite was accompanied by the absorption band of the -NH-groups shifting from 1532 cm
−1 to 1522 cm
−1. Further, after addition of Cr ions to the CS/SBA-15 composite, the absorption band is shifted to 1518 cm
−1.
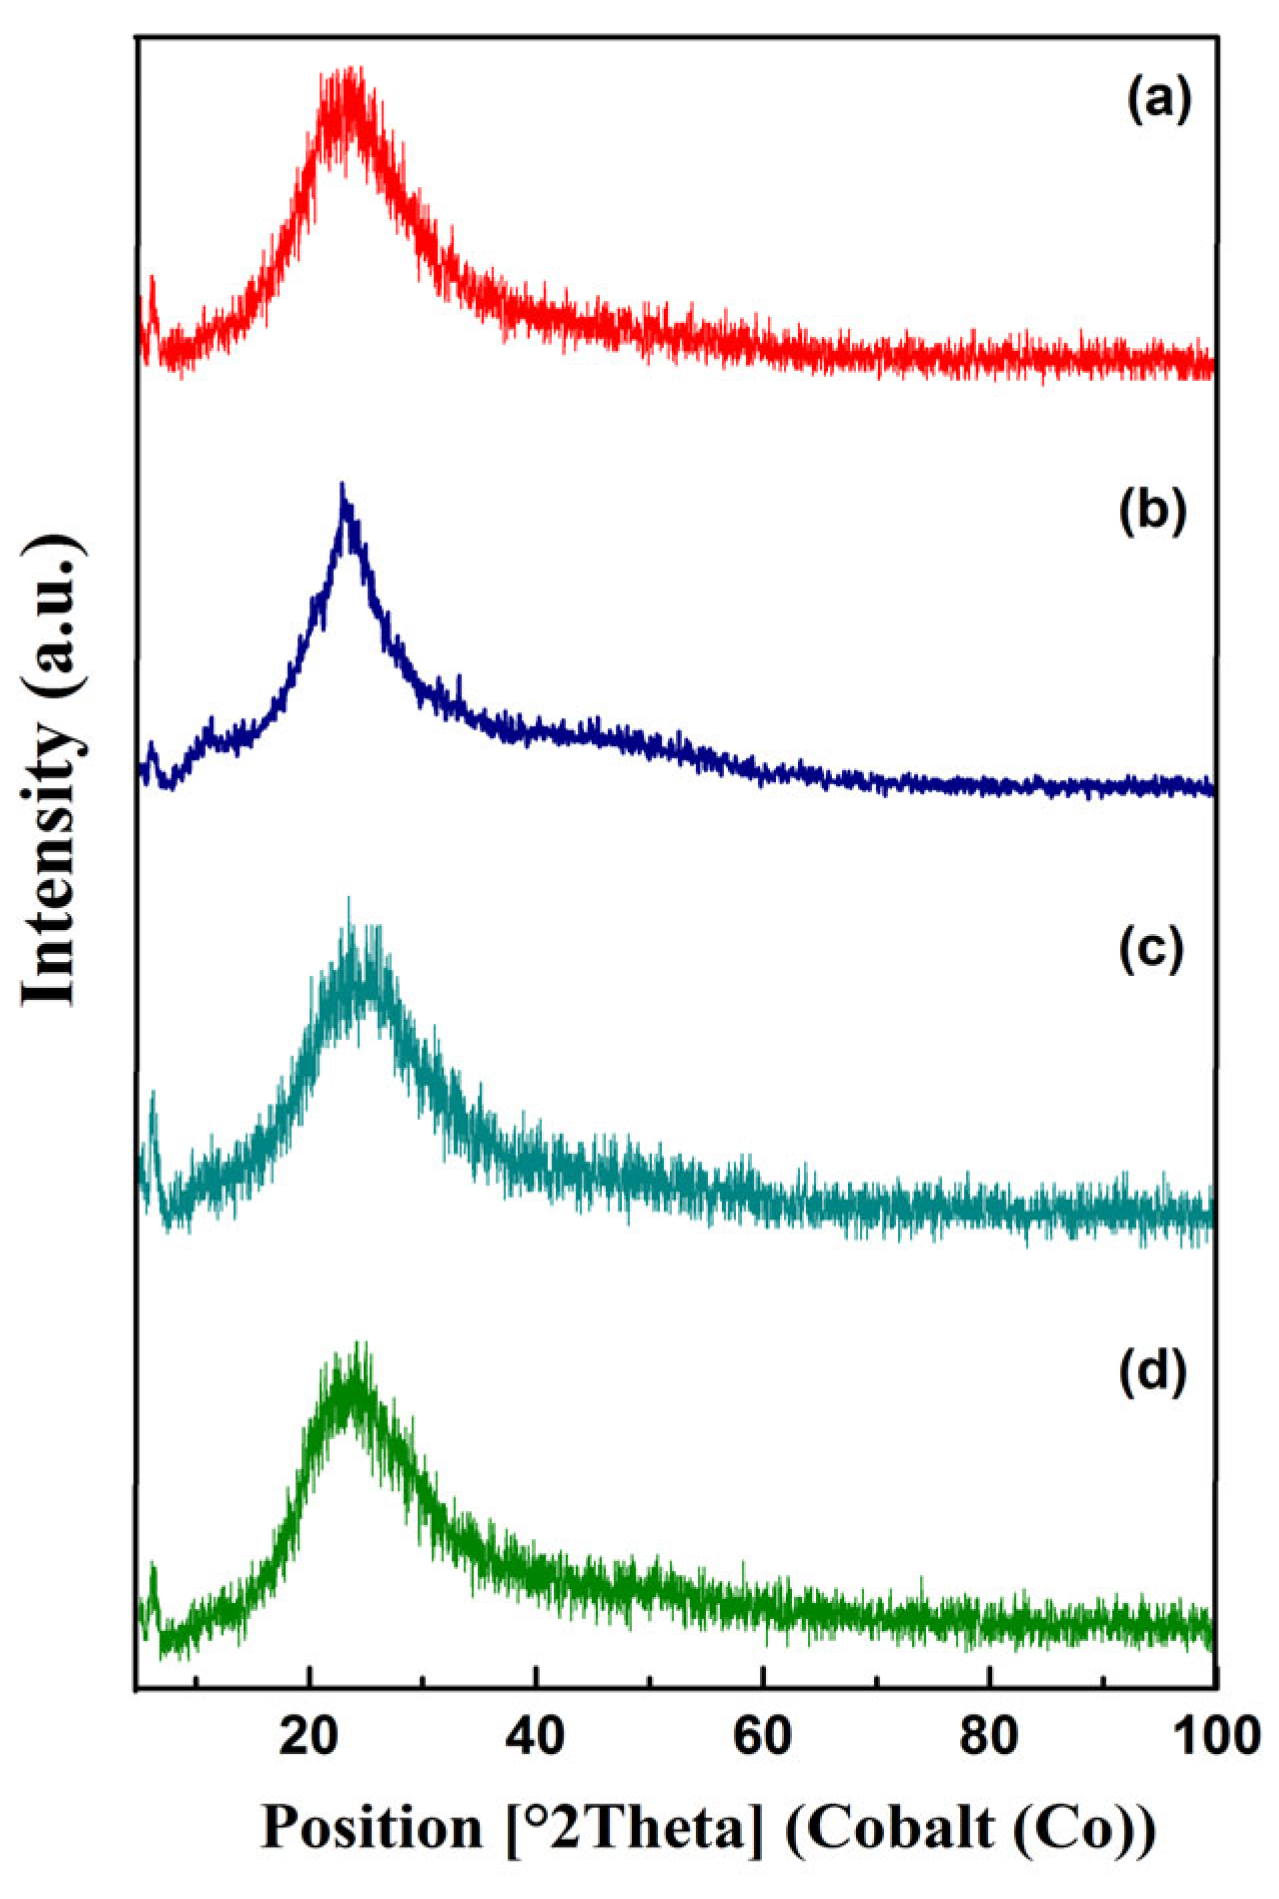
Figure 3 shows XRD patterns of CS, SBA-15 and chromium catalysts based on them. A broad peak at 10–30° presented in the XRD pattern of SBA-15 is characteristic of amorphous silica (
Figure 3a) [
47,
48,
49,
50]. Modification of SBA-15 with Cr and CS was not accompanied by the appearance of new diffraction peaks (
Figure 3c,d). No diffraction peaks associated with chromium species can be explained by low metal loading in both Cr/SBA-15 and Cr–CS/SBA-15 catalysts [
50]. In the case of Cr–CS/SBA-15, the diffraction peak of chitosan is overlapped by the broad peak of SBA-15 (
Figure 3a,b) [
43,
50].
According to BET measurements, the specific surface area of Cr–CS/SBA-15 and Fe–CS/SBA-15 catalysts was almost two times lower than that of initial SBA-15, which can indicate the filling of micropores of silica with iron and chromium particles stabilized with chitosan (
Table 2).
The initial SBA-15 and the synthesized Cr- and Fe- catalysts supported on CS-modified silica were studied by SEM (
Figure 4). In the initial silica, larger aggregates of SBA-15 with length of 50–80 μm and width of 10–12 μm, as well as smaller anisometric aggregates with size of 10–30 μm, were observed (
Figure 4a). After modification with chitosan, no large aggregates were detected. Only small aggregates of 10–30 μm size remained visible (
Figure 4b,c). This change is likely due to the addition of the polymer, which may have caused particles to adhere around the larger aggregates, rendering them no longer visible. The appearance of brighter particles in the SEM images of the catalysts can be attributed to the presence of heavier elements, such as iron and chromium [
51].
The TEM images of the catalysts clearly demonstrate the well-ordered, parallel mesoporous channels characteristic of SBA-15 structures (
Figure 5a,c) [
52,
53]. Chromium and iron particles are poorly traceable, indicating its fine dispersion in the SBA-15 porous structure. It is rather difficult to determine the size of metal particles due to insufficiently clear contrast between the metal and chitosan-modified support (
Figure 5b,d).
The lines of silicon, oxygen, carbon, nitrogen and chromium were detected in the survey X-ray photoelectron spectrum (XPS) of the Cr–CS/SBA-15 catalyst (
Figure 6a), confirming the presence of both chitosan and chromium on the silica surface. Similar results were observed in the case of CS-containing iron catalyst. The survey XPS spectrum of the Fe–CS/SBA15 showed the presence of silicon, oxygen, carbon, nitrogen and iron peaks (
Figure 6b).
The Cr 2p3/2 region of the XPS spectrum of the Cr–CS/SBA15 (
Figure 6c) is characterized by a symmetric single peak at 578.0 eV, which is attributed to Cr(III) species [
54,
55]. The Fe 2p3/2 region of the XPS spectrum of the Fe–CS/SBA15 (
Figure 6d) could be deconvoluted into three peaks at 710.6, 712.6 and 717 eV, corresponding to Fe
2O
3, FeOOH [
56] and Fe
3+ satellite peak [
57], respectively. The deconvoluted N 1s signals in the XPS spectrum of both the CS-modified catalysts (
Figure 6e,f) showed that nitrogen atoms are present on their surface in two different chemical states. According to the literature [
58], the peaks at ~400 and ~402 eV can be assigned to –NH
2 and –NH
3+ groups of chitosan, respectively. Chitosan was added to SBA15 in the form of a polyelectrolyte, containing protonated amino groups (–NH
3+). The presence of deprotonated amino groups (–NH
2) in the surface of the catalysts was probably due to the fact that the catalysts were washed with water after their preparation. The N 1s peaks were positively shifted to compare them with the reference values reported for –NH
2 (339.4 eV) and –NH
3+ (401.0 eV) groups of chitosan. These shifts can be explained by the interaction of the polysaccharide with both the metal species (Fe or Cr) and SBA-15 surface.
2.2. Oxidation of Cyclohexane
Cyclohexane (CH) is oxidized to cyclohexanol (CHOL) and cyclohexanone (CHON) via the formation of cyclohexyl hydroperoxide as an intermediate product [
59,
60] (
Scheme 1). To confirm this mechanism, the reaction products were recognized using gas chromatography (GC) before and after the adding of triphenylphosphine (PPh
3), which can react with cyclohexyl hydroperoxide (CyOOH) to form CHOL [
59,
60]. For all analyzed systems, the addition of PPh
3 led to an increase in the yield of the alcohol in the reaction products, confirming the presence of CyOOH as a reaction intermediate. It should be noted that only CHOL and CHON were detected among the reaction products, indicating that all catalysts were highly selective toward KA-oil.
The proposed route for metal-catalyzed cyclohexane oxidation using hydrogen peroxide as an oxidant is outlined by the following main steps [
6,
61,
62]:
Equations (1) and (2) illustrate the formation of oxygen-centered radicals, HOO• and HO•. The hydroxyl radical (HO•), generated through the reduction of H2O2 in the presence of the reduced form of the metal catalyst (Equation (1)), reacts with cyclohexane to produce an alkyl radical R• (Equation (3)). The interaction of the alkyl radical R• with the hydroperoxyl radical HOO• leads to the formation of alkyl hydroperoxide (C6H12OOH) (Equation (4)). In the presence of a catalyst, the alkyl hydroperoxide can subsequently decompose into cyclohexanol, cyclohexanone, and oxygen (Equations (5) and (6)).
A comparison of the activity and selectivity of the CS-containing catalysts in the oxidation of cyclohexane (CH) is shown in
Table 3. In the presence of chromium and copper catalysts, the reaction predominantly yielded cyclohexanol (CHOL). The selectivity toward CHOL over Cr–CS/SBA-15 and Cu–CS/SBA-15 catalysts was 77.3% and 62.4%, respectively. Cyclohexane conversion values reached 21.6% and 18.5% for Cr–CS/SBA-15 and Fe–CS/SBA-15 catalysts, respectively. The copper catalyst exhibited the lowest activity among the studied systems, with cyclohexane conversion not exceeding 9.3%.
Thus, Cr–CS/SBA-15 and Fe–CS/SBA-15 catalysts were more efficient for CH oxidation to KA-oil yields compared to a similar Cu(II)-based catalyst, which is consistent with previously reported data [
60,
63].
To study the effect of operational parameters on cyclohexane conversion, a series of experiments were carried out in the presence of the Cr–CS/SBA-15 catalyst. The reaction conditions such as catalyst dosage (10–50 mg), reaction duration (2–6 h), temperature (30–60 °C) and amount of H
2O
2 added (0.3–0.9 mL) were varied (
Table 4,
Table 5,
Table 6 and
Table 7).
An increase in reaction time from 2 to 4 h resulted in a twofold increase in cyclohexane conversion. However, further increasing the reaction time to 6 h did not lead to any major change in the conversion (
Table 4). Therefore, subsequent experiments were performed at a reaction time of 4 h. The observed change in the CHOL/CHON ratio over time is due to the sequential oxidation of cyclohexanol to cyclohexanone. Initially, cyclohexanol accumulates as the primary product, but as the reaction proceeds, it undergoes further oxidation to form cyclohexanone, leading to a shift in the ratio. This behavior is consistent with the proposed reaction mechanism, where the conversion of cyclohexyl hydroperoxide to cyclohexanol occurs more rapidly than its conversion to cyclohexanone [
7,
64].
Performing the reaction at different temperatures (30–60 °C) showed that the conversion of cyclohexane increased with increasing the temperature to 50 °C. However, further increasing the temperature to 60 °C was accompanied with insignificant decrease in the conversion, which can be attributed to self-decomposition of H
2O
2 at higher temperatures [
65]. In addition, increasing the temperature to 60 °C led to a significant increase in selectivity to CHON (
Table 5). This is consistent with data reported in [
65], according to which the temperature affects the product distribution in the oxidation process. Thus, a reaction temperature of 50 °C was found to be effective for cyclohexane oxidation under studied conditions.
The effect of the hydrogen peroxide amount was varied in the range of 0.3–0.9 mL corresponding to a concentration of the oxidant of 0.5–1.4 mol/L. Taking into account that the initial concentration of cyclohexane (CH) in the reaction mixture was 0.45–0.50 mol/L, the [CH]:[H
2O
2] molar ratios were approximately 1:1, 1:2 and 1:3. At the [CH]:[H
2O
2] molar ratio = 1:1, the conversion is minimal (3.7%), and the reaction favors the formation of cyclohexanol (CHOL) with a selectivity of 97.3%. Increase in the amount of hydrogen peroxide added resulted in an increase in the conversion and selectivity to CHON. The maximum yield of products was observed at the [CH]:[H
2O
2] ratio of 1:3 (
Table 6).
Increasing the catalyst dosage from 0.01 to 0.03 g resulted in an increase in the conversion of cyclohexane from 12.8% to 21.6%, and, in all cases, cyclohexanol was the main product. However, further increase in the catalyst amount was accompanied with insignificant decrease in the conversion, while the selectivity to CHOL remained almost unchanged (
Table 7). This was probably due to non-productive decomposition of H
2O
2 in excess of the catalyst [
64]. Thus, the maximum KA-oil yield was achieved under the following reaction parameters: temperature—50 °C, reaction duration—4 h, catalyst dosage—0.03 g, and [CH]:[H
2O
2] ratio = 1:3.
Stability is a key catalytic characteristic of heterogeneous catalysts. Therefore, recycling studies were conducted using the optimal Cr–CS/SBA-15 catalyst. After each reaction cycle, the catalyst was filtered and reused. Cr–CS/SBA-15 continued its activity during the oxidation of the first two substrate portions. Upon further cycles, a slight decrease in cyclohexane conversion was observed (
Figure 7). Elemental analysis of the spent catalyst indicated no chromium leaching (
Table 1). The turnover number (TON) was calculated to be 147.
A comparison of the catalytic performances of Cr–CS/SBA-15 and Fe–CS/SBA-15 under the optimal reaction conditions with other known catalysts for cyclohexane oxidation is presented in
Table 8. Despite the fact that the reaction was performed at a relatively lower temperature (50 °C), the conversion achieved with both the catalysts is comparable to that reported for several other heterogeneous catalysts.
Thus, the study of the catalytic performance of chitosan-modified catalysts showed the promising potential of using chitosan in the development of heterogeneous catalysts for selective oxidation of cyclohexane to KA-oil under mild conditions.
2.3. Photocatalytic H2 Production
The photocatalytic properties of the most effective Cr–CS/SBA-15 and Fe–CS/SBA-15 catalysts were tested in photocatalytic hydrogen evolution.
Before conducting photocatalytic H
2 evolution experiments, the optical properties of Cr–CS/SBA-15 and Fe–CS/SBA-15 were evaluated using UV-vis diffuse reflectance spectroscopy method (
Figure 8).
UV-vis absorption spectra presented in
Figure 8a show that the Cr–CS/SBA-15 and Fe–CS/SBA-15 samples possess slightly different optical properties, affecting their absorption of light.
Kubelka–Munk function of the Tauc plot method was used to calculate the bandgaps of the photocatalysts:
where hυ is photon energy (h is Planck constant; υ is vibration frequency); α is absorption coefficient; E
g is direct bandgap; A is a constant; n = ½; R is reflectance; and F(R) is proportional to the absorption coefficient (α) [
30].
Figure 8b displays the Kubelka–Munk function plots with (f(R)hν)
2 on the y-axis versus energy (hν) on the x-axis. The bandgap was determined by extending the tangent line until it intersects the hν axis. The bandgap values were found to be 2.21 eV for Cr–CS/SBA-15 and 2.23 eV for Fe–CS/SBA-15.
UV-Vis spectroscopy data confirmed the difference in the optical properties of the catalysts: there is a slight shift in absorption spectra, which is associated with a change in the band structure due to modification by chitosan and metals. The calculation of the bandgap using the Kubelka–Munck method showed values of 2.21 eV for Cr–CS/SBA-15 and 2.23 eV for Fe–CS/SBA-15, indicating their ability to absorb visible light efficiently.
The total volume of hydrogen produced within 3 h was 23.4 mL/g for Cr–CS/SBA-15 and 103 mL/g for Fe–CS/SBA-15.
The photocatalytic activities of Cr–CS/SBA-15 or Fe–CS/SBA-15 were investigated using the colloidal dispersions of Cr–CS/SBA-15 or Fe–CS/SBA-15 particles in a 0.35 mol dm
−3 Na
2S/0.25 mol dm
−3 Na
2SO
3 aqueous mixture that acted as a sacrificial electrolyte (pH = 13.0) throughout photocatalytic HER analyses in a homemade photocatalytic reactor. The dispersion was illuminated with a solar simulator with 1000 Wm
−2 (1 sun) light intensity, and the evolved hydrogen gas was recorded with respect to time (
Figure 9). The photocatalytic HER mechanism in the Na
2S/Na
2SO
3 sacrificial electrolyte is proposed in Equations (8)–(12) [
68,
69,
70]:
The catalysts exhibited varying efficiencies in the photocatalytic hydrogen evolution reaction, with Fe–CS/SBA-15 demonstrating significantly higher activity (103 mL H2/g) compared to Cr–CS/SBA-15 (23.4 mL H2/g). This enhanced performance can be attributed to the superior charge transfer capacity of iron and its favorable interaction with photogenerated electron–hole pairs. These properties are supported by differences in the bandgap energy and light absorption efficiency of the materials. X-ray photoelectron spectroscopy (XPS) analysis confirmed the presence of functional chitosan groups on the catalyst surfaces, which play a crucial role in stabilizing metal particles and modulating their electronic states. The interaction of Cr(III) with the amino groups of chitosan enhances metal dispersion, while the presence of Fe contributes to the formation of catalytically active sites. This, in turn, facilitates efficient charge separation and transfer, which are critical for photocatalytic activity.
Thus, the photocatalytic performance of Cr–CS/SBA-15 and Fe–CS/SBA-15 is governed by their physicochemical properties, including surface morphology, metal distribution, bandgap structure, and the chemical states of active sites. The superior activity of Fe–CS/SBA-15 is likely due to its optimized band structure and enhanced charge carrier dynamics, making it a promising candidate for photocatalytic hydrogen production.


 ,
, 


