Article

A Scoring Model for Catalyst Informatics Based on Real-Time High-Throughput Fluorogenic Assay for Catalyst Discovery and Kinetic Profiling

Department of Chemistry and Biomolecular Sciences, University of Ottawa, Ottawa, ON K1N 6N5, Canada
*
Author to whom correspondence should be addressed.
Catalysts 2025, 15(7), 636; https://doi.org/10.3390/catal15070636
Submission received: 30 April 2025 / Revised: 13 June 2025 / Accepted: 25 June 2025 / Published: 30 June 2025
(This article belongs to the Section Catalytic Reaction Engineering)

Abstract

In this work, we propose an automated, real-time optical scanning approach to assessing catalyst performance in the process of nitro-to-amine reduction using well-plate readers to monitor reaction progress. This approach takes advantage of a simple on–off fluorescence probe that gives a shift in absorbance and strong fluorescent signal when the non-fluorescent nitro-moiety is reduced to the amine form. The combination of an affordable probe and a low barrier-to-entry technique provides an accessible approach to high-throughput catalyst screening. Under this paradigm, we screened 114 different catalysts and compared them in terms of reaction completion times, material abundance, price, recoverability, and safety. Using a simple scoring system, we plotted the catalysts in terms of cumulative scores, along with some intentional biases, including an emphasis on preference for catalysts with potential as green catalysts, considering environmental issues and possible geopolitical preferences.

1. Introduction

Catalyst discovery is a time- and resource-intensive endeavor that involves navigating a multidimensional design space [1]. Optimal catalysts must balance multiple performance criteria—such as activity, selectivity, and stability—alongside sustainability considerations, including abundance, affordability, recoverability, and safety. The challenge lies not only in meeting these diverse requirements, but in identifying combinations of catalyst properties and reaction conditions that give rise to desirable performance. This necessitates multidimensional screening, whereby many variables—composition, structure, loading, temperature, solvent, and more—must be simultaneously explored [2,3].
In both homogeneous and heterogeneous catalysis, performance is influenced by various factors, including catalyst composition, morphology, particle size, support material, and surface characteristics. These parameters often interact non-linearly, making catalyst optimization a complex task. Additionally, catalysts are dynamic entities that can alter their behavior under reaction conditions through processes like Ostwald ripening, surface reconstruction [4], or particle disintegration [5,6]. These time-dependent changes underscore the significance of monitoring catalyst evolution throughout the reaction [7], rather than focusing solely on its performance at a single point in time.
High-throughput experimentation (HTE) combined with catalyst informatics [8,9], has emerged as a powerful strategy to address this complexity [10,11]. By enabling multidimensional screening across many experimental parameters in parallel, HTE accelerates the search for promising catalysts and uncovers performance trends that would be missed in one-variable-at-a-time approaches [12,13]. Through the use of automated liquid handling, parallel reactors, and integrated analytics [14], HTE facilitates the rapid, systematic exploration of large chemical and material spaces, and has proven transformative in fields ranging from pharmaceuticals to materials science [15], offering miniaturization, throughput, and speed.
Despite their advantages, traditional HTE methodologies often focus on endpoint analyses, capturing data only at the conclusion of reactions. This approach overlooks the kinetic and mechanistic insights that can be gleaned from time-resolved data, limiting the depth of understanding of catalyst behavior. Recent efforts have begun to incorporate kinetic measurements into HTE [16]. However, widespread adoption has been limited by the high costs associated with robotic automation. While gas chromatography (GC) and nuclear magnetic resonance (NMR) remain the gold standards for quantitative analysis in HTE, they present several drawbacks—time-consuming analysis, the need for manual sampling, and limited data throughput. In contrast, optical techniques offer a compelling alternative—they are widely accessible, sensitive, rapid, non-invasive, and capable of multiplexed, real-time detection [7,17]. Despite their clear advantages, optical methods have not yet been widely embraced as frontline tools for quantitative HTE.
In this study, we introduce a fluorogenic system designed for optical reaction monitoring in 24-well plate formats, facilitating the simultaneous monitoring of multiple reactions via the reduction of a nitronaphthalimide probe (Figure 1) [18,19,20]. This platform enables the collection of time-resolved kinetic data using standard well-plate readers, allowing for the efficient screening, optimization, and kinetic analysis of catalysts, exemplified here through the reduction of nitro compounds to amines. We assessed the reaction kinetics under consistent aging conditions across a library of catalysts (114 catalysts). By integrating environmental considerations—such as cost, abundance, and recoverability—into the evaluation process, this platform promotes the selection of sustainable catalytic materials. Catalysts were chosen largely at random, avoiding a bias based on researcher expectations, the only criterion being their availability in our laboratory; as such, some had been used in earlier publications [18,21,22,23,24,25].

2. Methodology

2.1. Assay Preparation for Data Collection

The system in Figure 1 was examined in the presence of 114 different catalysts, mostly heterogeneous, with reaction yield approximated from the relative emission detected in each reaction well, and a corresponding reference well containing the end product mixed with the catalyst. Our experimental protocol allowed the measurement of the absorption spectrum (300–650 nm) and fluorescence of the product at preselected intervals, typically 5 min, for a total time of 80 min. This data-rich experimentation enabled the collection of kinetic graphs of the starting material (absorbance), product (absorbance, and fluorescence), and isosbestic point, generating a minimum of 4 kinetic graphs per well. This approach generated 32 data points for each sample including the fluorescence and UV absorption, for a total input of over 7000 data points, illustrating the advantage of monitoring kinetics, not just end points; this large volume of data was then condensed into the simple kinetic and spectral graphs available in the Supplementary Material. In addition, each data point is associated with a complete absorption or emission spectrum. For systems that exceeded 50% conversion in 5 min, we utilized a fast kinetics protocol to examine the early part of the reaction, typically adding ~20 additional data entries for those systems. Several examples are provided in the Supplementary Material.

2.2. Well Plate Set-Up

The 24-well polystyrene plate (Falcon, Corning, Corning, NY, USA) was populated with 12 reaction wells and 12 corresponding reference wells (Figure 2). Each reaction well contained a sample consisting of 0.01 mg/mL catalyst, 30 µM NN, 1.0 M aqueous N2H4, 0.1 mM acetic acid, and H2O, resulting in a total volume of 1.0 mL. Each sample well (S) was paired with a reference (R) well containing the same mixture, except that the NN dye was replaced with the anticipated end product, the reduced amine form of the probe, AN, as illustrated in Figure 2.
We used 24-well plates because a total volume of 1 mL enabled the addition of very small amounts of catalyst (0.01 mg/mL) while still allowing for reproducible spectroscopic measurements. The presence of a standard had two purposes. First, the time profile of the standard well provided a means for testing product stability (absorbance) and emission stability (fluorescence) under the reaction conditions. Second, the standard was used to convert the absorbance and fluorescence intensities of the reaction well into nominal concentrations by taking the ratio of the standard to the reaction mixture. Once reaction was initiated, the plate was placed inside the Biotek Synergy HTX multi-mode reader (BioTek, Winooski, VT, USA). The plate reader was programmed to apply 5 s of orbital shaking at room temperate, followed by scanning the fluorescence intensity of the sample. The excitation wavelength was set at 485 nm with a band-pass of 20 nm, and the emission wavelength was at 590 nm with a band-pass of 35 nm (Figure 1). The fluorescence intensity of the reactions in the plate was read in 20 s. Subsequently, the absorption spectrum per reaction well was scanned covering the range of 300–650 nm. The data collection process (shaking, fluorescence detection, and absorption scanning) was repeated every 5 min, for a total time of 80 min, to obtain the reaction profile. Catalyst #12 was inserted in several plates to test reproducibility; these tests were satisfactory, allowing for small variations in the amount of catalyst used, given the small mass involved (0.01 mg/mL).

2.3. Initial Processing of Spectroscopic Data

The original data from a microplate reader were converted to CSV files. In our case, the files were transferred to a MySQL database. For the purpose of visualization and data sharing, the information on the performance of each catalyst was converted into a basic graphic file. An example for catalyst #31, Cu@charcoal, is shown in Figure 3; these graphs comprise an important part of the Supplementary Material that includes 115 pages, one for each catalyst and a control experiment, with the basic graph and other relevant information, including fast kinetic data when available. Catalyst #31 was selected for illustration purposes, as its performance is not extreme (not the best, not the worst), and also we had experience from earlier work with this material [25,26].
Each catalyst profile consists of 4 graphs. Figure 3A shows the evolution of absorption, with the decaying peak at 350 nm corresponding to the nitro form and the growing peak at 430 nm for the amine product. The respective absorbance values are measured every 5 min, and shown in Figure 3B, along with the absorbance measured at the isosbestic point, 385 nm. In our example, the isosbestic point data show a flat line, consistent with a simple chemical conversion without significant complications related to side reactions.
In some examples, a change in the isosbestic point over time implies a change in the reaction, for example in pH, or that a more complicated mechanism is at play. This is exemplified by the zeolite NaY (catalyst #11) material screened. Zeolite Y had the highest reactivity compared to all other “catalyst supports” screened, reaching a 33% yield within 80 min reaction time, while the rest of the support materials screened had yields lower than 20% (see Supplementary Material). Despite its moderate performance, Zeolite Y did not have a stable isosbestic point throughout the reaction, which excluded it from further catalyst design. In other cases, the time-evolution of the reaction shows the development of significant amounts of the 550 nm absorbing intermediate (Figure 3A), which we attribute to the azo/azoxy form of the dye. Samples that exhibit high levels of these compounds are subsequently given a low “selectivity” score, on the basis that in many applications of catalysis, having long-lived reactive intermediates or biproducts could compromise synthesis and complicate product isolation. Our platform is ideal for monitoring biproducts and isosbestic points, as it includes the global dynamic behavior of all species present within the catalytic system, offering a deeper understanding of the reaction’s progression than in systems that only monitor reaction end-points. Figure 3D shows the evolution of fluorescence data, with kinetics that are fully consistent with the absorption data (compare to the green squares in Figure 3B). Finally, Figure 3C shows a radar plot, wherein our experimental data are reflected in the Kinetic Yield and Selectivity entries, with the later evaluated visually, as indicated above. We also scored our materials on four other key parameters that we consider important when selecting catalysts, as discussed in the next section.

2.4. Parameter Database

After developing a system with data-rich experimental capabilities, chemical properties related to (1) material abundance and risk of depletion, (2) price, (3) recoverability, and (4) safety were incorporated from data collected from the literature to the end of discovering sustainable, efficient, and green catalysts for reduction reactions.
  • Material abundance was evaluated based on the available supply of the material. The information was adapted from the American Chemical Society—“the periodic table’s endangered elements” [27];
  • The affordability of the material was evaluated based on the material price per gram, which was obtained from Sigma Aldrich on 10 September 2021 (St. Louis, MO, USA), or estimated for material prepared in our laboratories. This estimate was usually four times the cost of precursors;
  • Recoverability is the first step towards re-useability. Recoverability was ranked based on the material’s solubility in the reaction solvent (H2O), with heterogenous catalysts scoring higher on our scale, and unrecoverable soluble catalysts scoring low;
  • Safety was measured as the inverse of each material’s relative hazard score. The National Fire Protection Association (NFPA) evaluates materials’ hazard levels based on health, flammability, and instability. Each hazard factor was ranked from 0 to 4 based on severity, where a higher ranking indicated a greater hazard level. Overall, the hazard levels were added up and the inverse value was used to guide the level of relative safety.
Table 1 highlights the evaluation levels that were adopted related to every chemical property; higher-ranking levels indicate a more sustainable catalyst. This multidimensional dataset was then imported into the MySQL Workbench. Note that while 5 scores are available (1 to 5) for some parameters, only 3 or 4 possible values were adopted.

2.5. Materials Tested

Drawing from our laboratory’s existing chemical stocks, we initially randomly selected 105 materials to investigate their performance in catalyzing the model reaction depicted in Figure 1. No selection bias was applied other than the material’s availability in the laboratory; several of these materials have been reported in earlier publications [21,22,23,24,25,28]. This random approach resulted in a diverse range of chemical compositions, spanning a wide chemical space. Subsequently, the original set was expanded to 114 materials by adding 9 additional Cerium-containing catalysts, as Cerium materials are frequently good catalysts [29]. This decision was made based on the initial observation that CeO2 demonstrated promising catalytic activity and a high green score (vide infra).

3. Results and Discussion

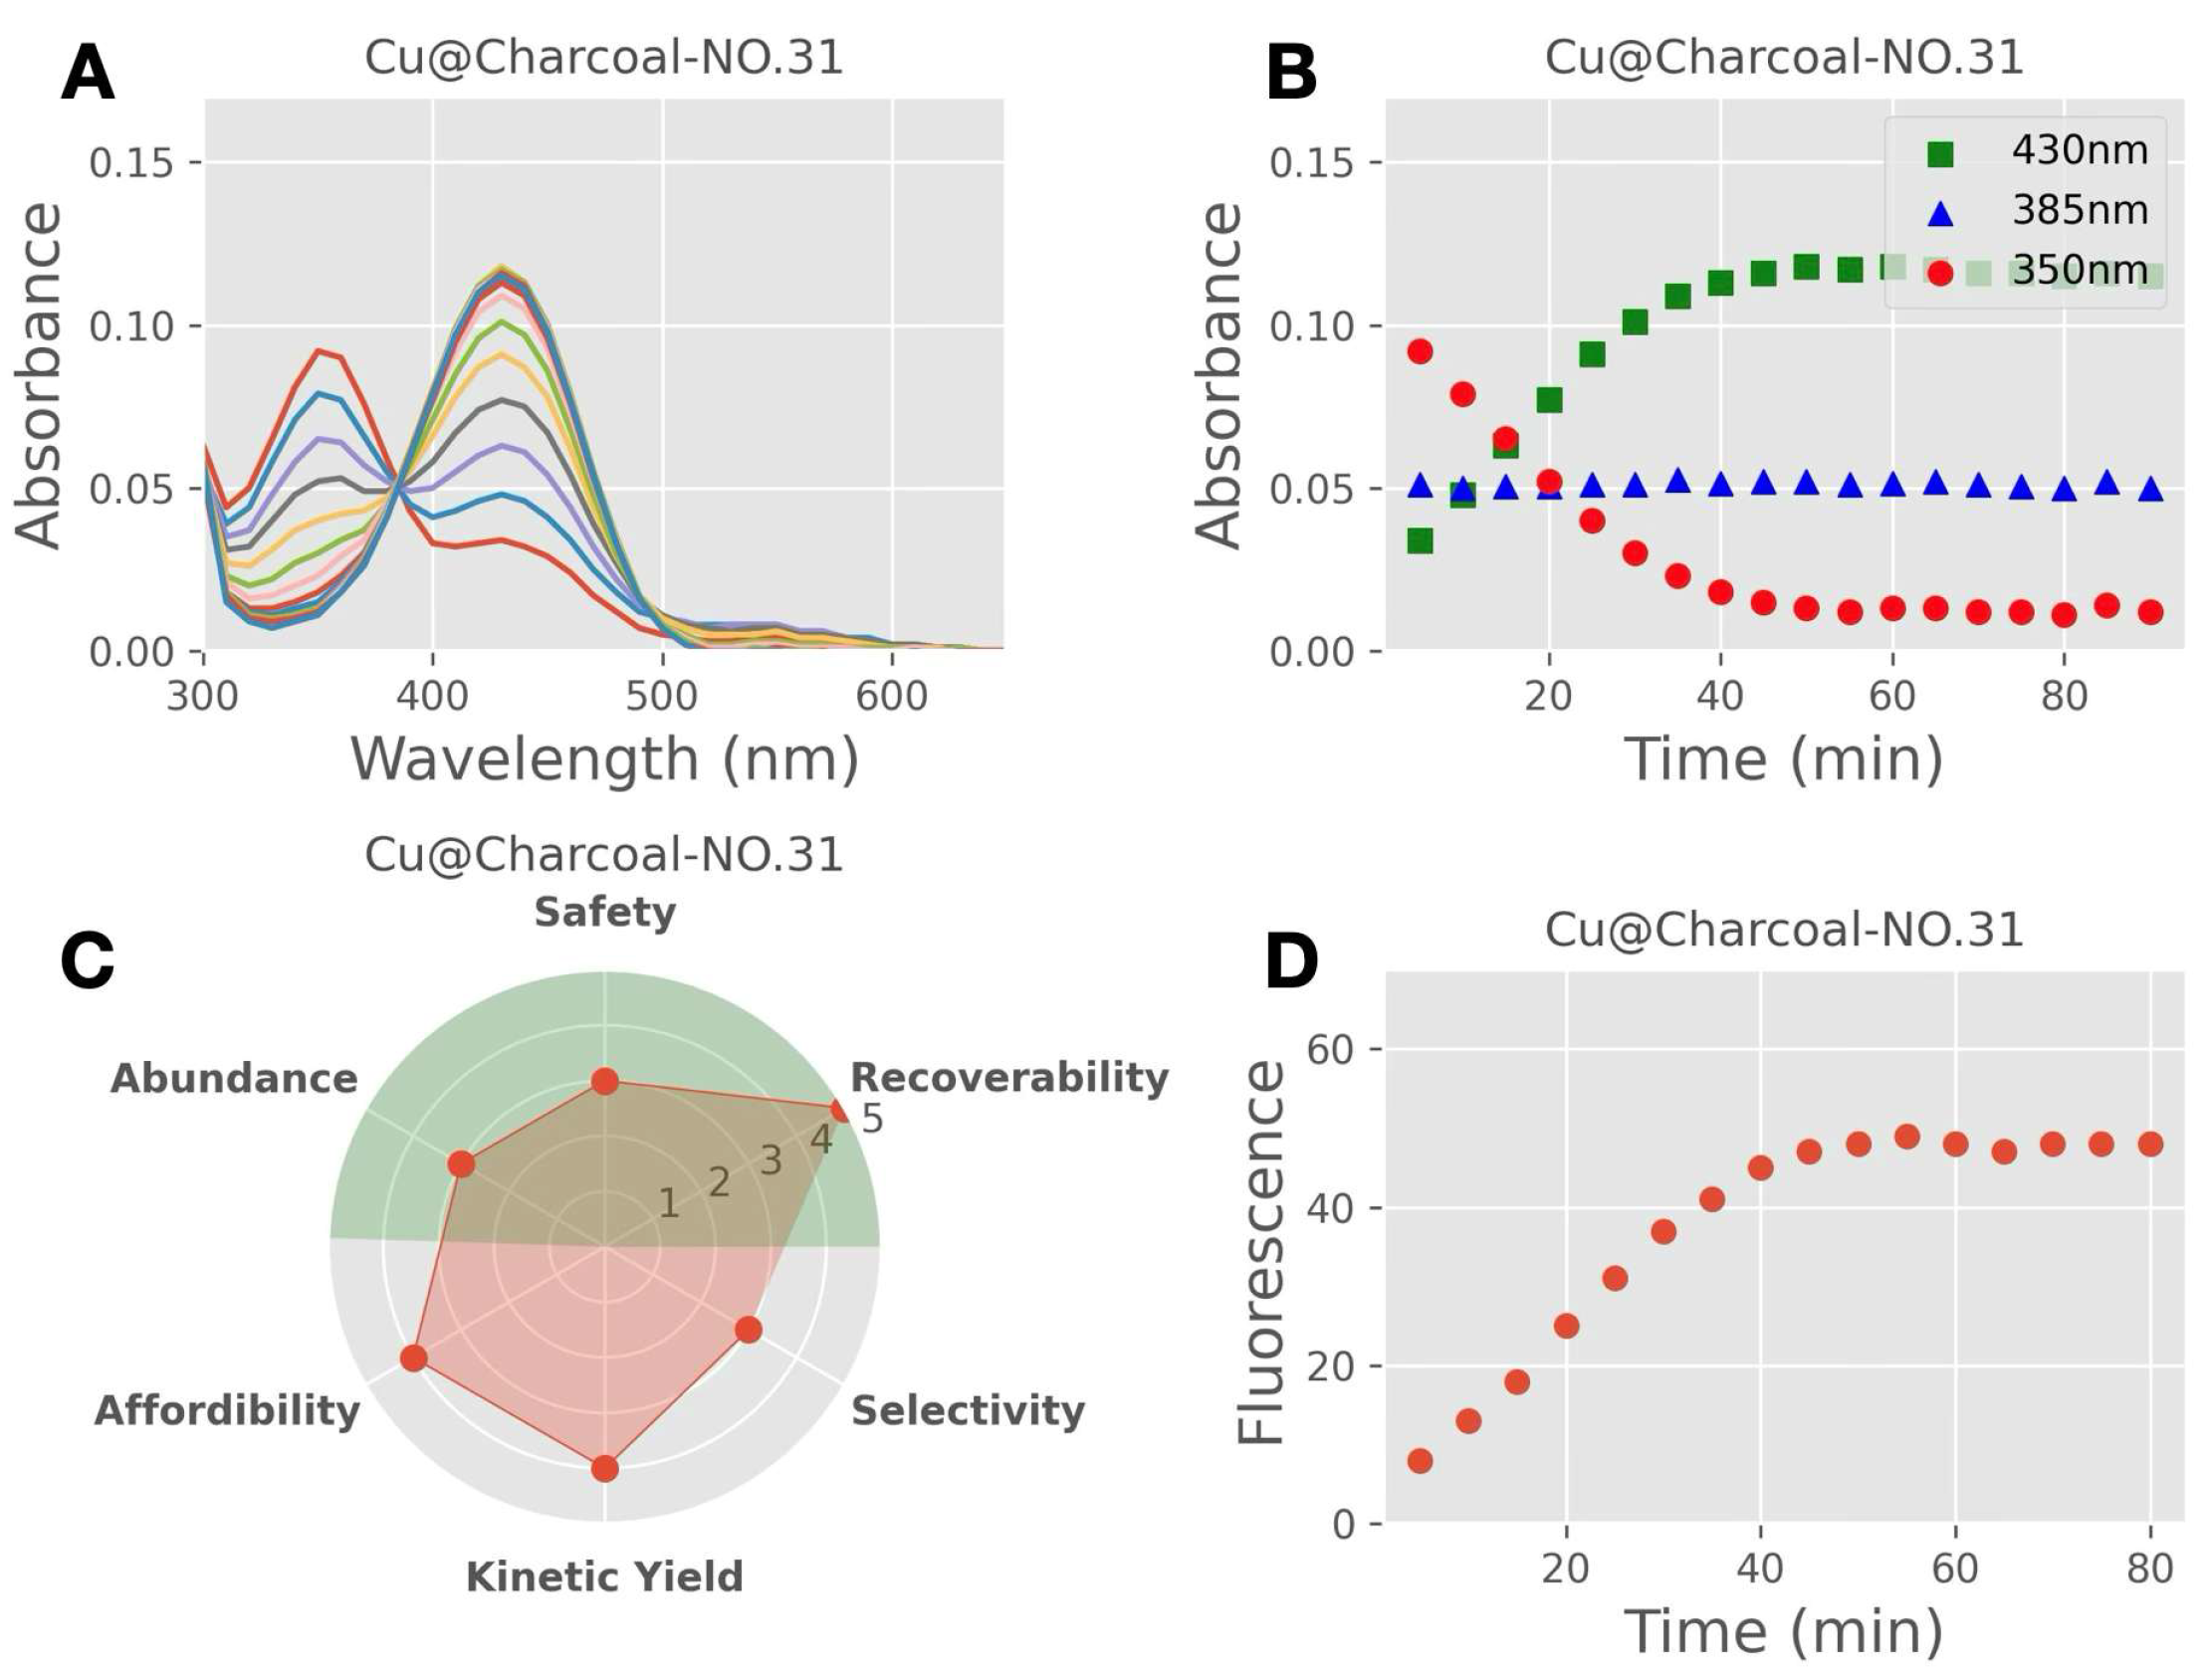
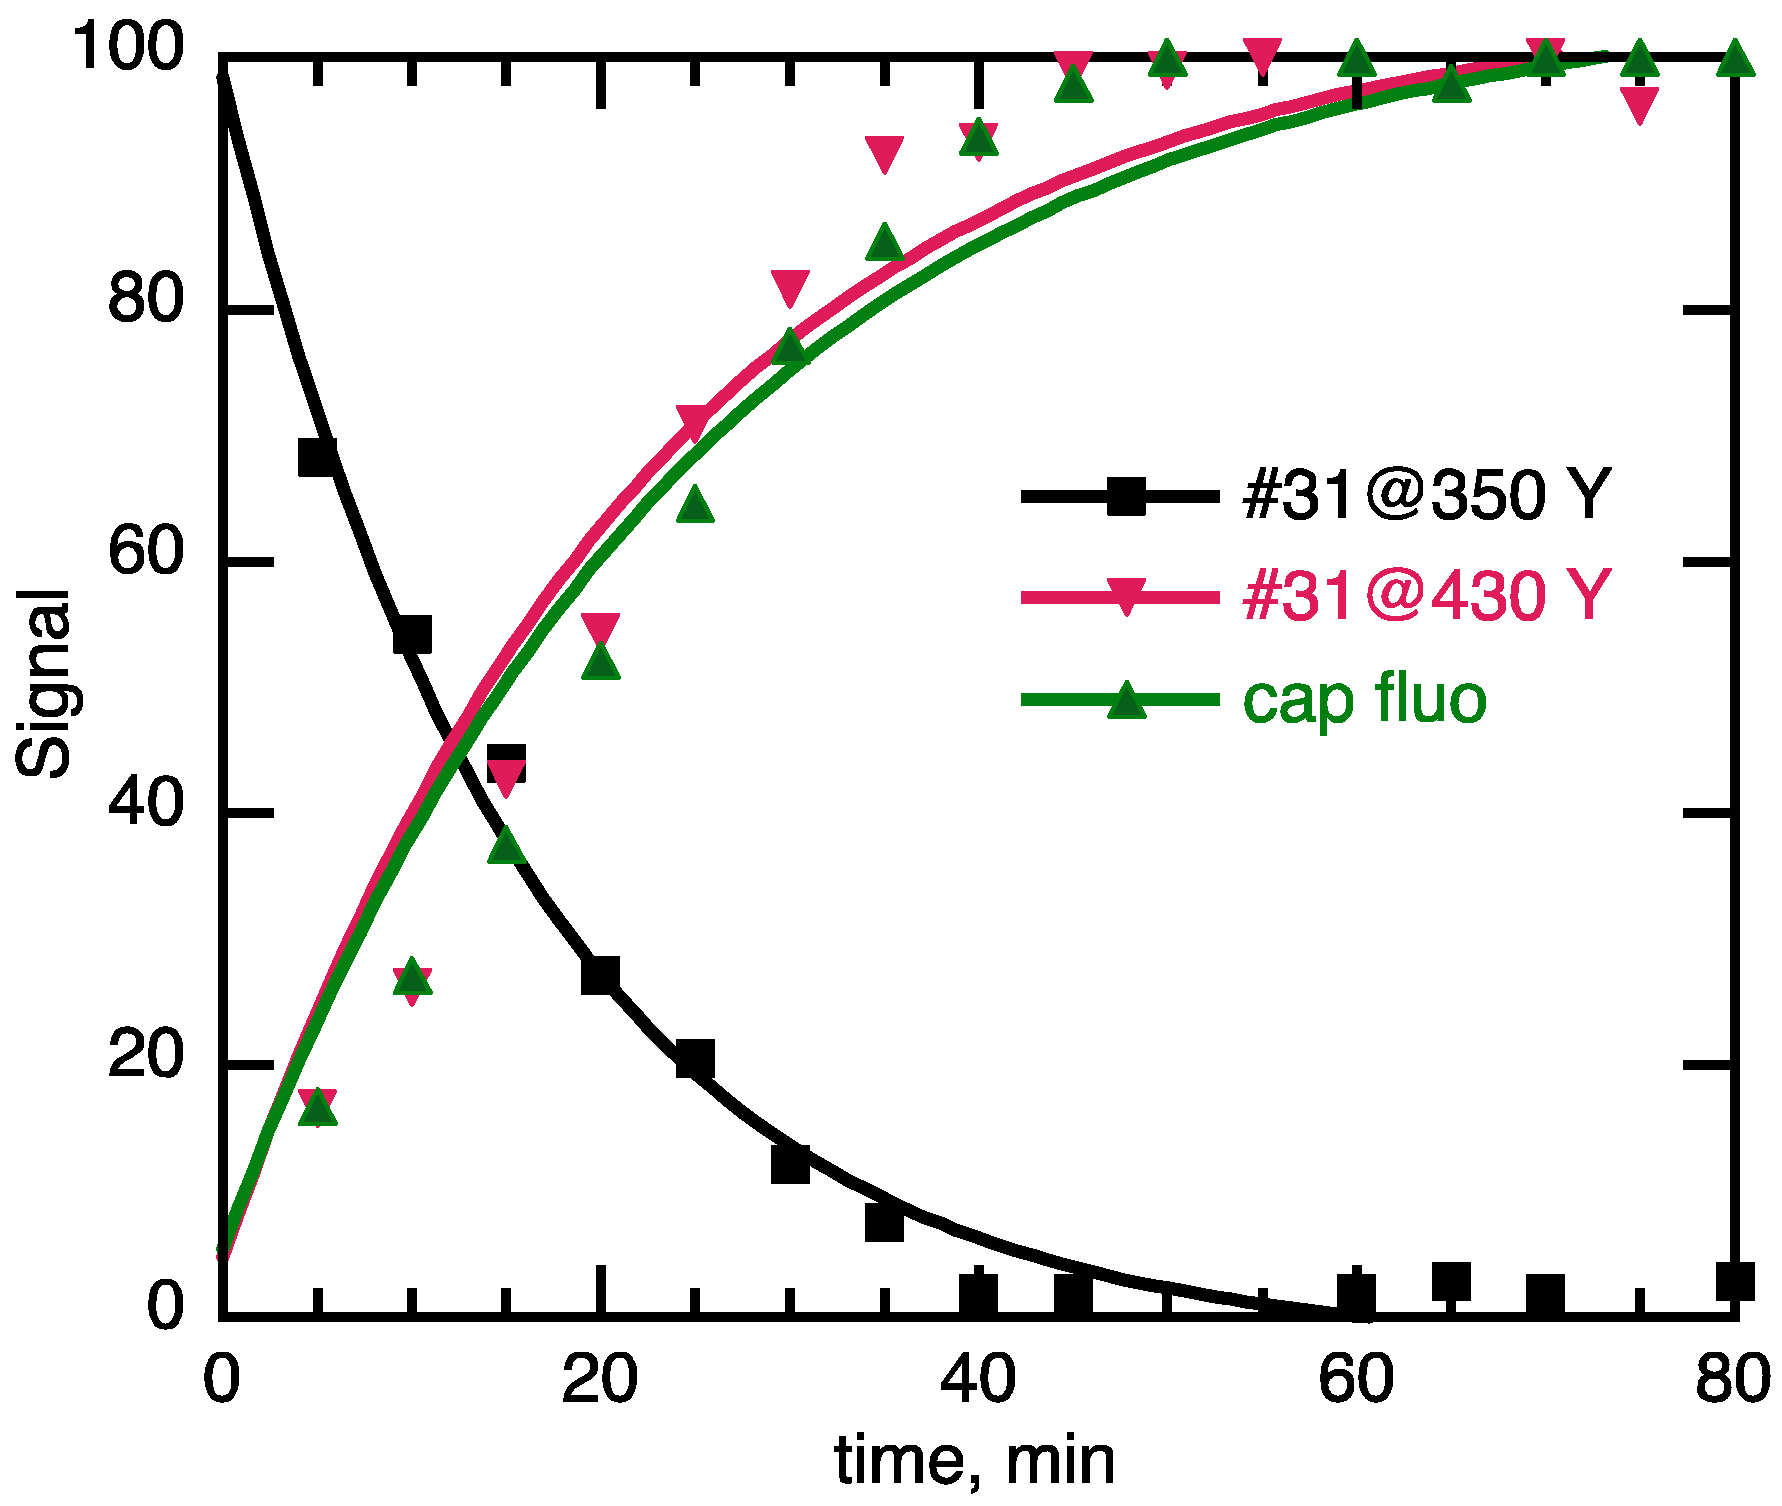
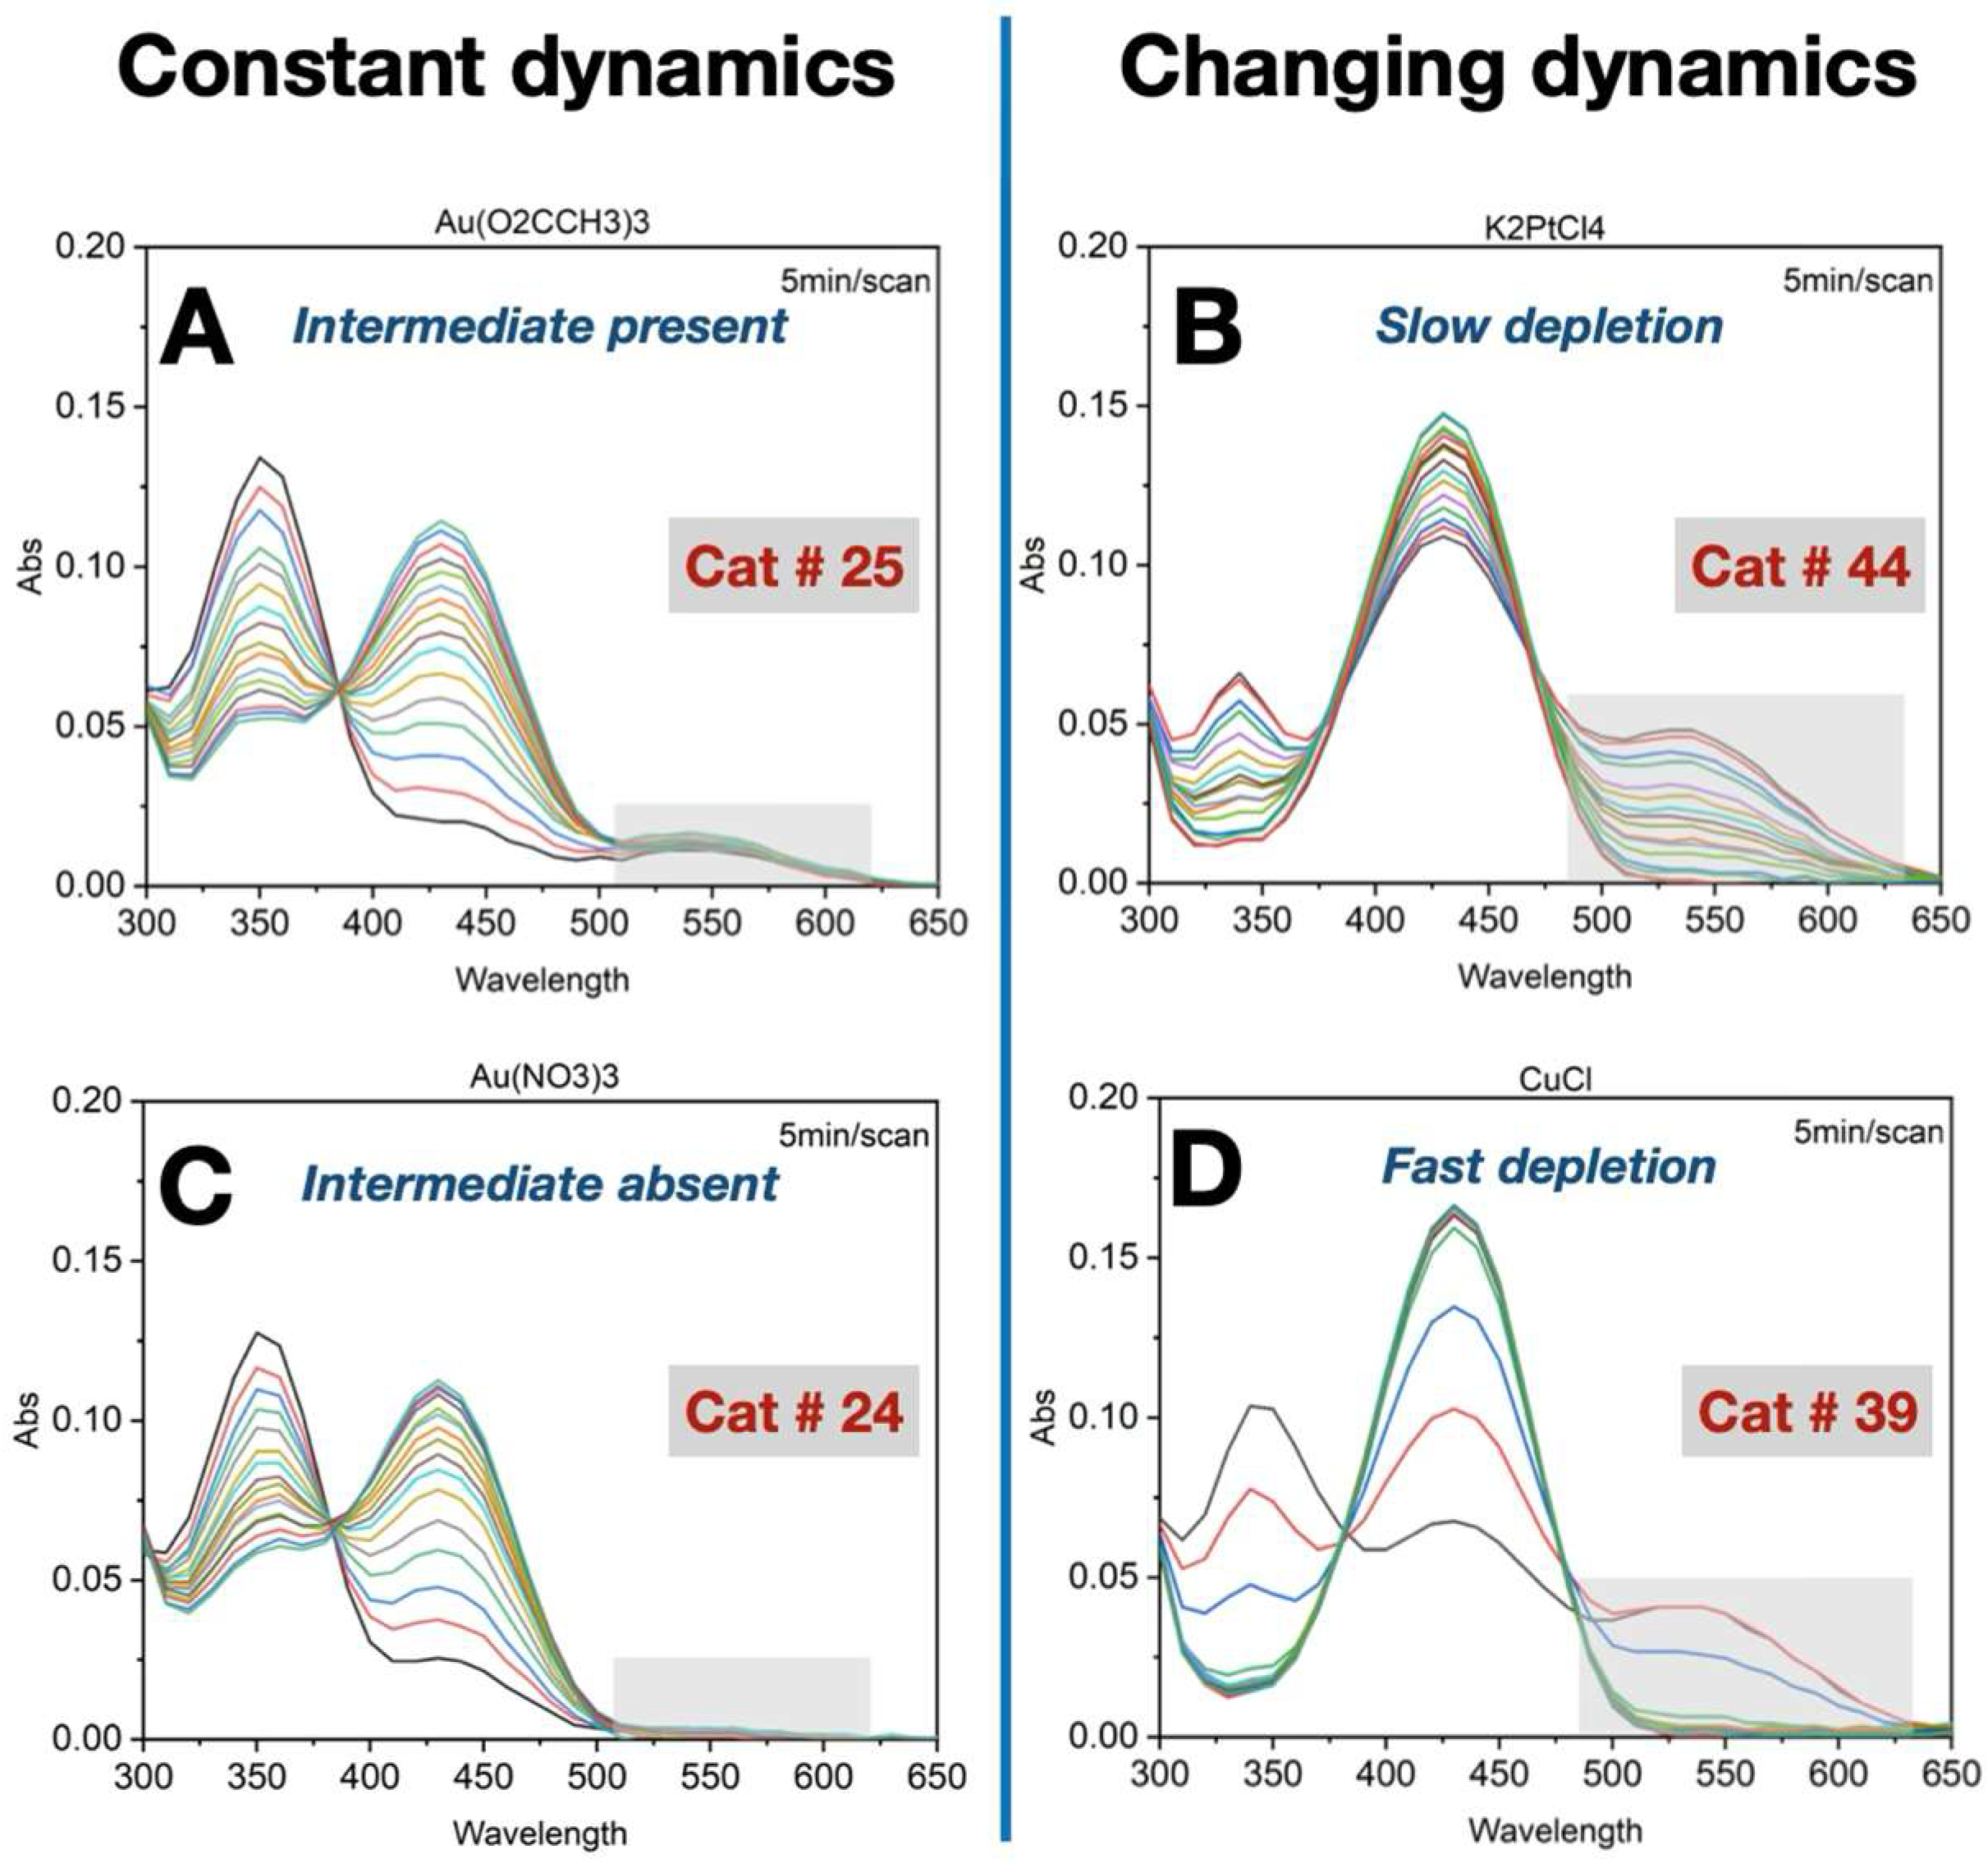
3.1. Importance of Time-Course Analysis in Catalyst Discovery

There are a number of parameters that are used to quantify catalyst performance, such as turn-over-number (TON). Quite frequently, performance is evaluated at fixed end points, optimized either for a specific system, or just based on experimental convenience, such as “overnight” reactions. Kinetics is intrinsically linked to catalysis, and proper kinetic analysis will allow us not only to select the best catalyst, but also to select reaction times that optimize yields and selectivity, as well as energy use and the utilization of equipment. For example, for catalyst #31 (See Figure 3), we monitored the reaction for over 80 min, but it is clear that 40 min would have been sufficient for the reaction to complete. Beyond this type of visual analysis, the data acquired are suitable for more detailed kinetic analysis, which we approximate with growth and decay monoexponential analyses, as illustrated in Figure 4. Other types of analysis are justified in some cases, and are discussed later; for example, in Figure 4, it is clear that for the growth analysis, a monoexponential may be a convenient analysis, but other models may fit the data better.
Another crucial parameter, already included in Figure 3C, is reaction selectivity. A careful examination (Figure 3A) reveals an absorbance in the 550 nm region. This is because an intermediate, either an azo or azoxy compound, is formed, which may or may not be reduced to the final product, depending on the catalyst employed. These data underscore the significance of holistic kinetic profiling in investigating reaction mechanisms by quantifying intermediate formation. For instance, for catalyst #31, the selectivity score is 3 (as shown in Table 1). This indicates that the biproduct that absorbs at 550 nm is formed, but the corresponding band disappears (and is converted to the product) after 80 min.
Among the 114 catalysts screened, we observed four distinct kinetic behaviors of the intermediate at 550 nm (Figure 5, see Supplementary Material).
  • A constant amount of intermediate was maintained throughout the reaction.
  • In some cases, the intermediate was undetectable.
  • A significant accumulation of the intermediate occurred at the beginning of the reaction, followed by a slow depletion rate.
  • In other cases, the intermediate also accumulated early, but was followed by a rapid depletion rate.
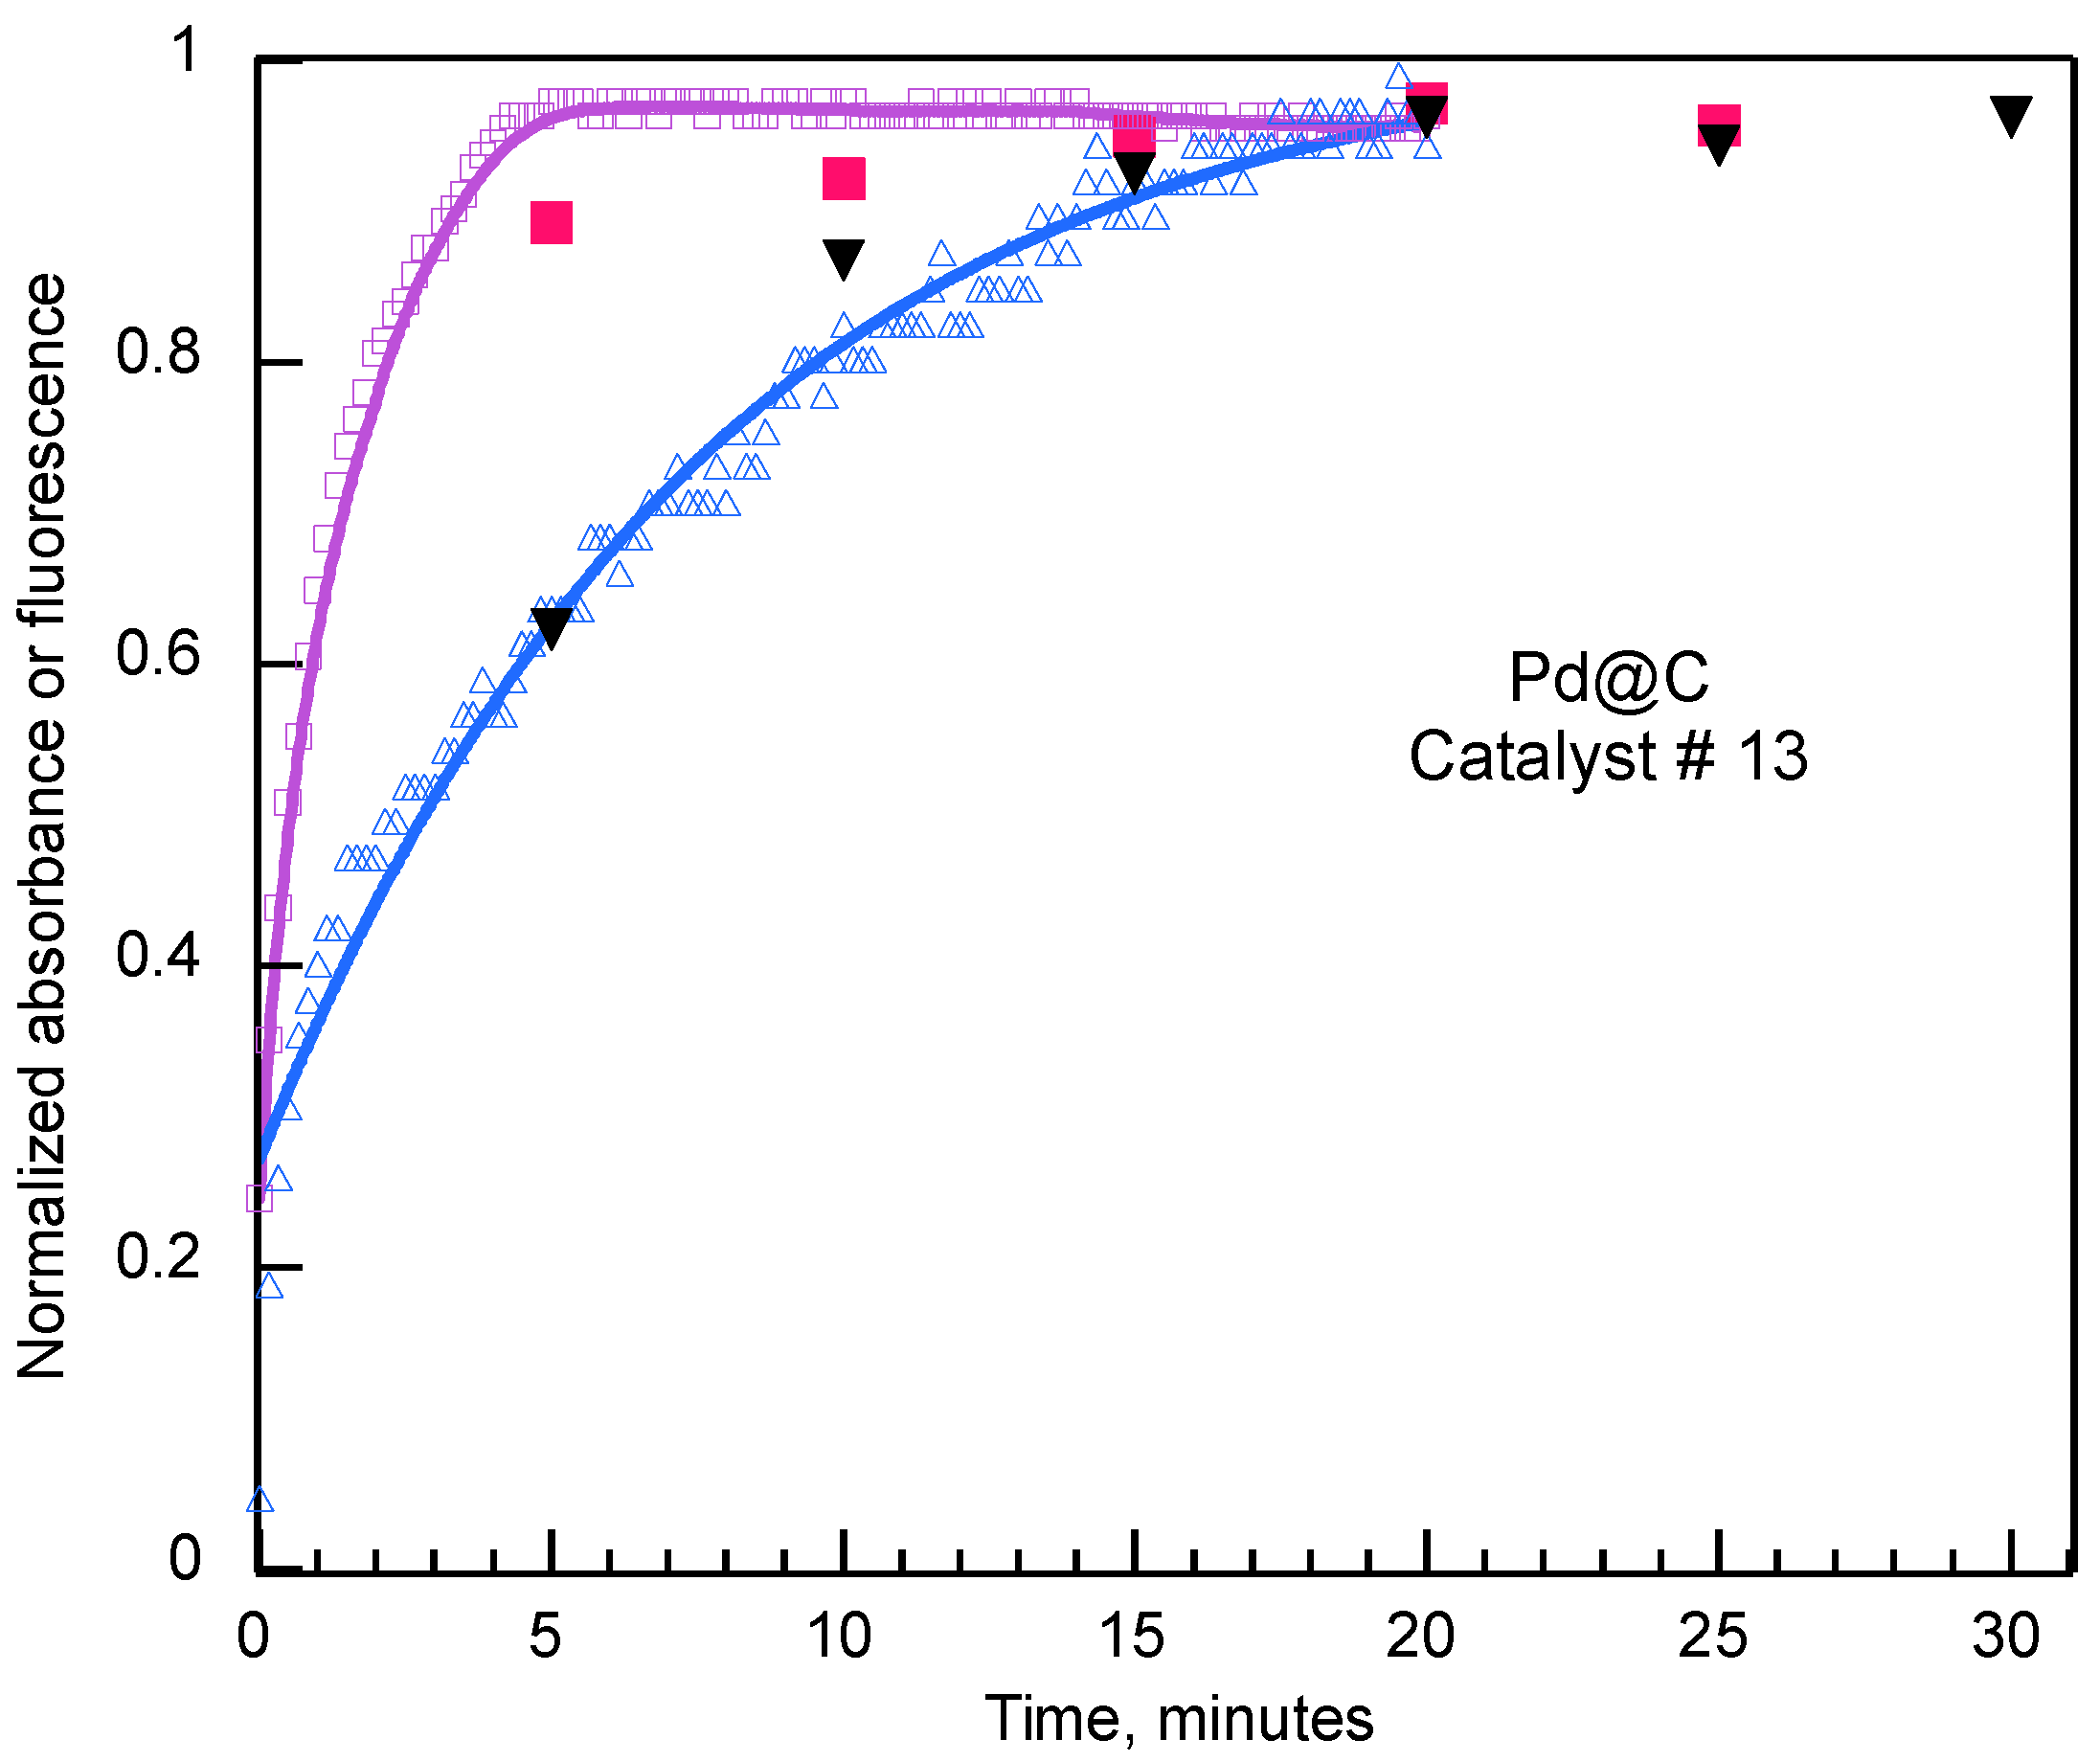
3.2. Fast Kinetics

Seven of the high-performing catalysts had fast reaction rates whereby the first data point collected at 5 min corresponded to over 50% conversion (Supplementary Material plots for catalysts #13, 15, 16, 18 and 43–45). For these high-performing catalysts, we adopted a fast-kinetic approach that scans fluorescence or absorbance intensities as fast as in 10 s intervals.
The fast kinetics approach allowed us to zoom in and examine the reactivity of high-performing catalysts. Many of the fast-performing catalysts were Pd and Pt-based materials. Overall, most of the fast-performing catalysts were recoverable (heterogenous), but may struggle to be sustainable due to a lack of global material abundance, safety concerns, and affordability, as shown in the scores scheme of Table 1 and the radar graphs included in the Supplementary Material. Hence, while these catalysts out-performed many other materials in pure reaction times, the design of more sustainable catalysts with good performance is still preferred for the reduction reactions.
As an example of a system showing fast kinetic behavior, we selected catalyst #13, Pd@carbon (Figure 6). Here, the data were collected in two different ways—first using our standard approach with measurements taken every 5 min (with an early segment shown with solid squares and triangles for absorbance and fluorescence, respectively), alongside the fast kinetic scans, where measurements were taken every 10 s (shown with hollow squares and triangles for absorbance and fluorescence, respectively), as the standard acquisition showed that the reaction was mostly complete by the time the first point (5 min) was acquired. The data were normalized to display absorbance and fluorescence results in the same graph. Only the first 30 min are shown in Figure 6, with the complete 80 min acquisition being available in the Supplementary Material, and they are essentially flat after the first 20 min. This switching in kinetic scanning time ensured the cross-validation of the fast and slow kinetics monitoring techniques from the same reaction.
Note that in Figure 6, the absorbance changes faster than the fluorescence, with half lives of 0.74 and 3.2 min, respectively. A tentative interpretation of these data is that while absorbance changes are immediate, the fluorescence is delayed because it requires the amine product to be released from the catalyst or its support. Given that carbon has excellent adsorption properties, it is perhaps not surprising that it retains the amine, AN, for a relatively long time. In longer time scales (>20 min), the kinetic difference shown in Figure 6 is not detectable. This observation is enabled because of the real-time nature of the measurements, and would not be available with techniques based on sampling, off-line analysis and reaction end-point studies.

3.3. Kinetic Models for Heterogeneous Catalysts
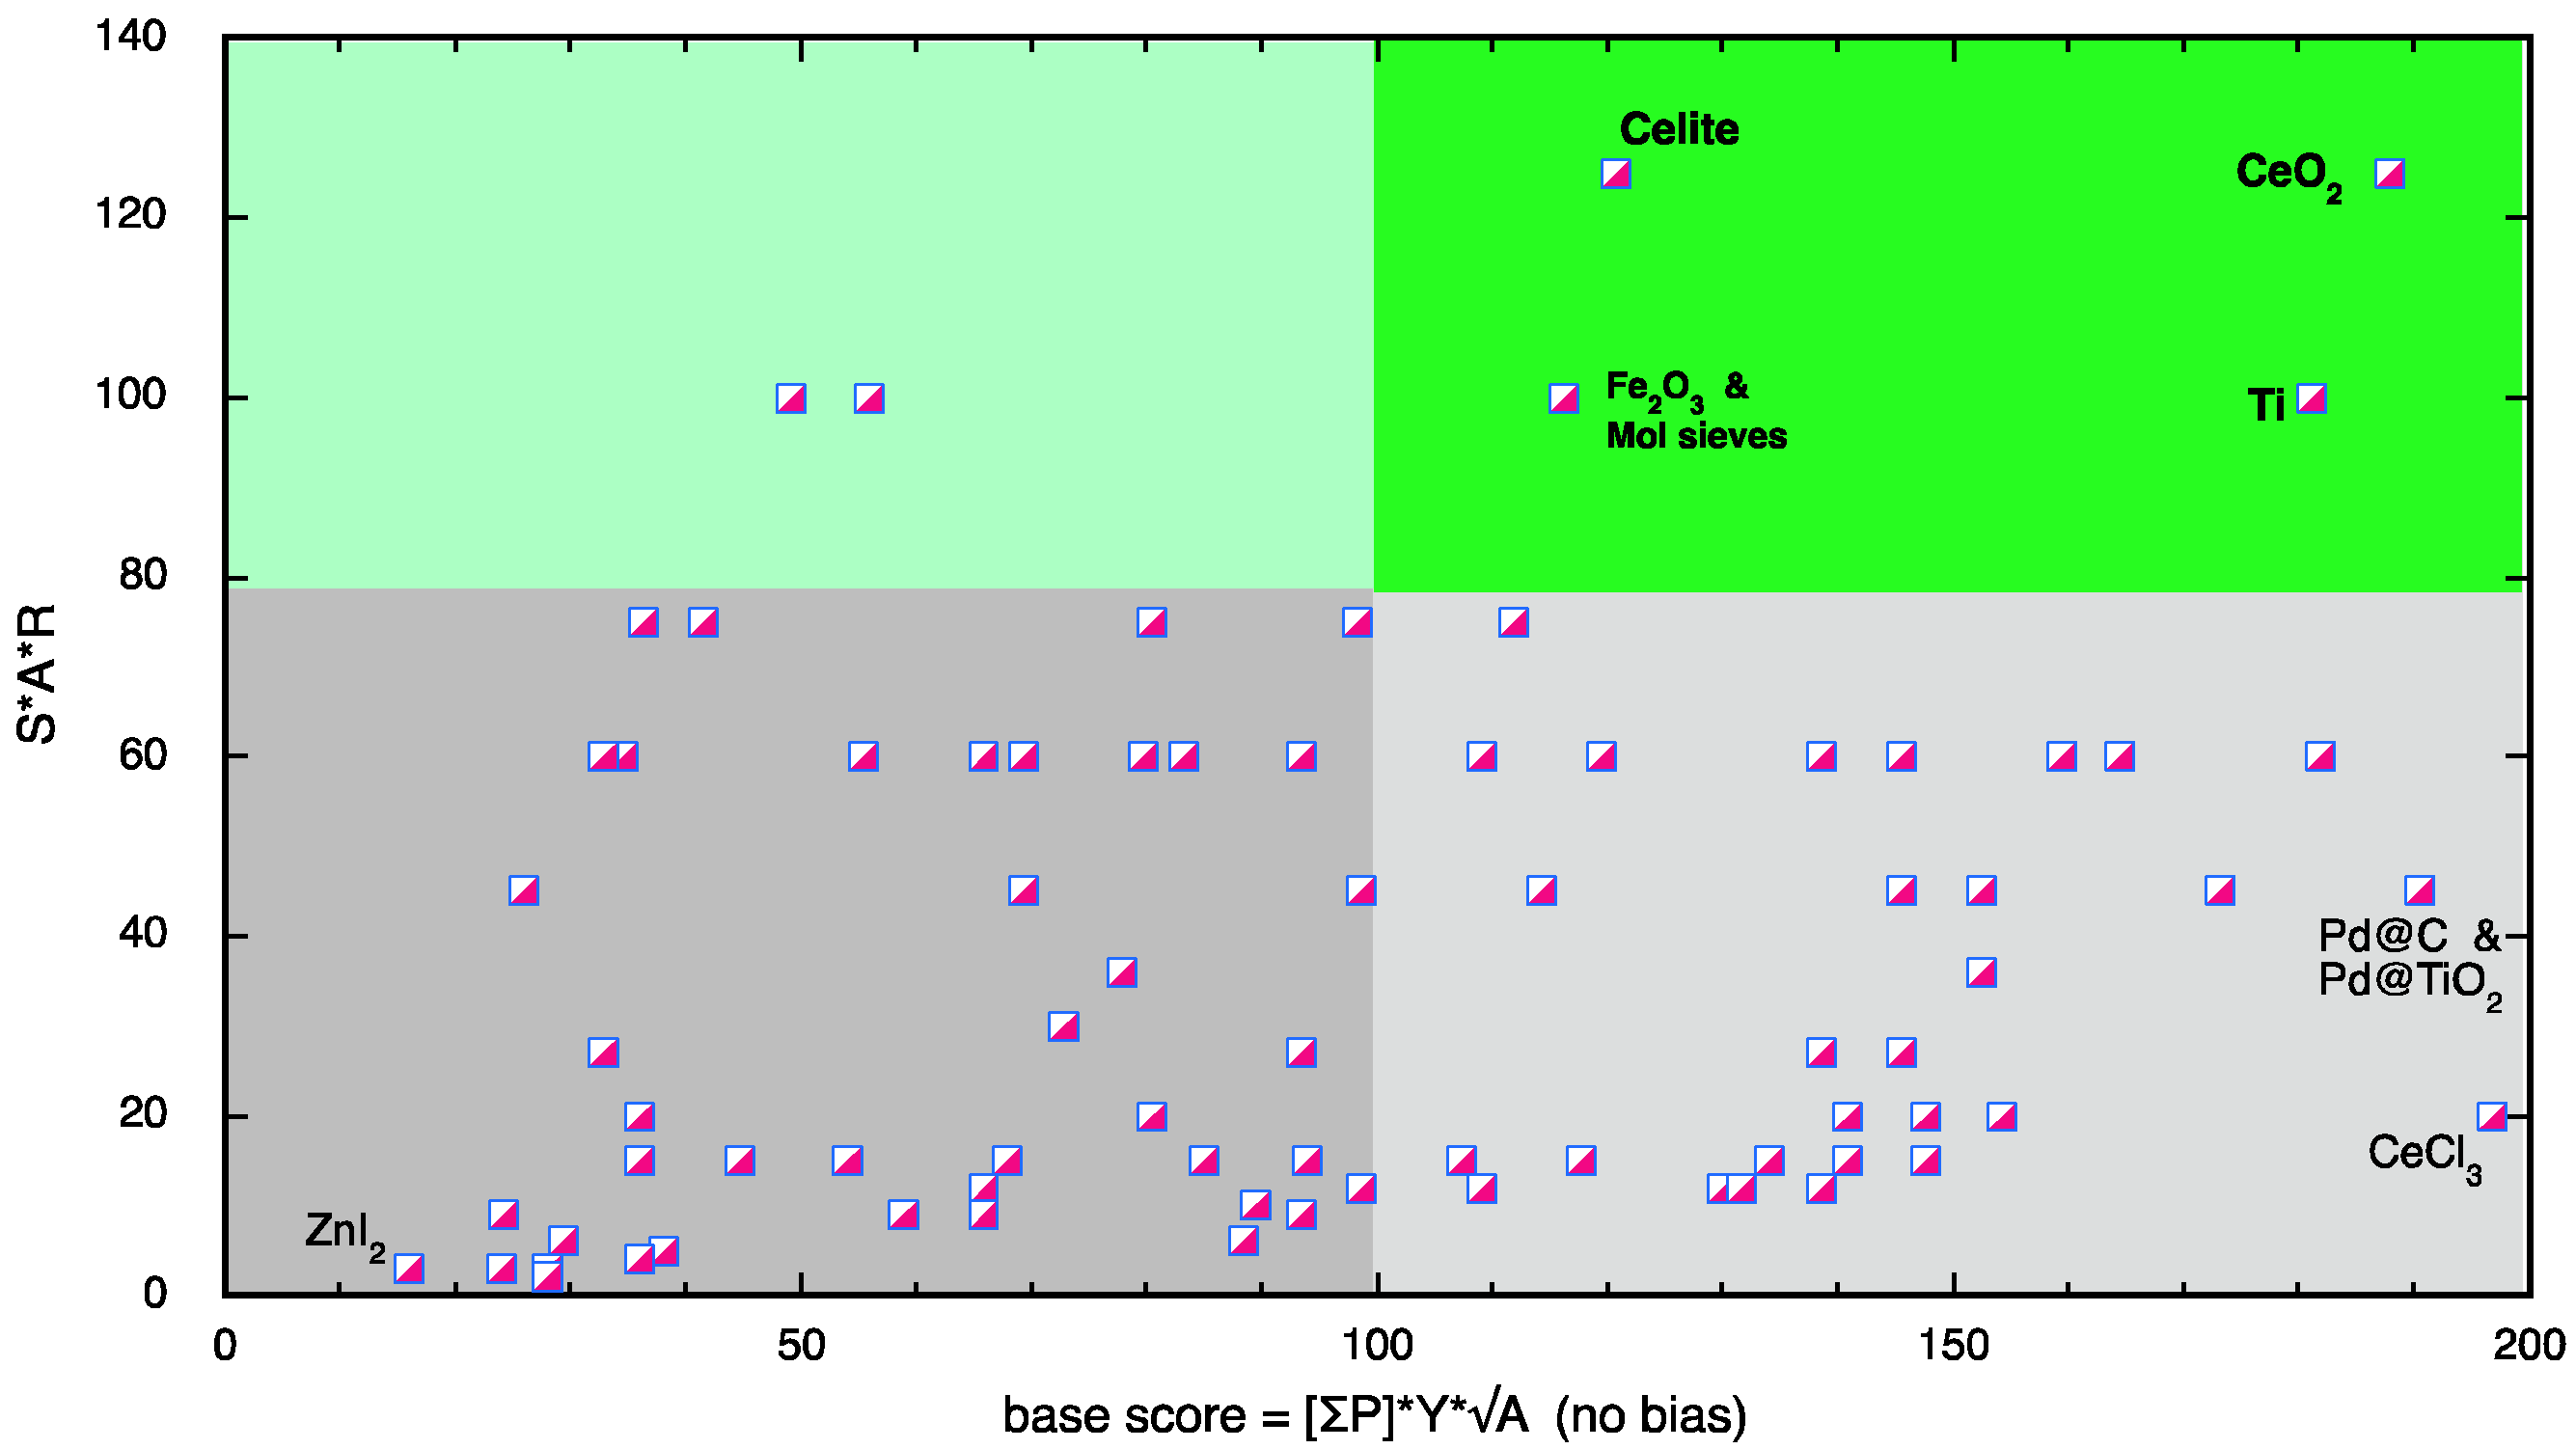
While our scoring system concentrates on overall performance, many of the high-performing catalysts are amenable to kinetic modeling. Heterogeneous catalysts showed three different kinetic models, as illustrated in Figure 7. Some catalysts were modeled by a linear plot (i.e., reaction order of zero), indicating that the reaction rate is independent of the concentration of the starting material, and hence the concentration of the active site of the catalytic surface determines the rate of the reaction, as manifested by CuFe2O4. Other catalysts were modeled by a smooth growth plot—Michaelis Menten-type kinetics—suggesting that the reaction rate is of the first order in the reagent, as illustrated by the (Au + Pd)@TiO2 catalyst. Interestingly, some catalysts demonstrated a combination of fast near-linear growth plots, as exemplified by the PdCl2 catalyst in Figure 6. A tentative interpretation is that early in the reaction, the reaction rate is limited by the concentration of the catalytic active site (quasi-linear plot). As the product is formed, slow product dissociation from the catalytic surface becomes the limiting factor, which changes the kinetic behavior into a growth model, ultimately reaching full reaction conversion but over a much longer time (~70 min).
The complexity of the catalytic behavior associated with the fact that catalysis is a time-dependent event is seamlessly revealed in our real-time high-throughput platform. These intrinsic kinetic behaviors would have been lost if only traditional approaches of high-throughput techniques with end-point analysis were implemented.

3.4. Scoring System

A traditional evaluation system may look at just yield and cost. In our case, “yield” takes into account rate as well, with scores ranging from 1 to 5, where 5 means not just high yield, but also fast, according to Table 1. Figure 8 shows the product of the yield*price scores, where the maximum possible value is 25. They are simply plotted against catalyst number, this representing the order in which catalysts for this work were initially located. This plot would suggest that copper catalysts or CeCl3 should be preferred; such a conclusion would ignore the other four parameters (see Figure 3C) that we also consider important, particularly as they generally account for safety and environmental considerations. A scoring criterion has recently been utilized for asymmetric catalysis [30].
Instead of the simple approach employed in Figure 8, we have implemented a biased score that takes other parameters into account. For all 114 catalysts, a scoring formula was implemented to plot the materials in terms of their yields and potential as green catalysts. There are of course many ways in which the scores could be manipulated based on preference, but we chose this to demonstrate how a standardized scoring system can be used to assess catalysts at large. The ones illustrated below reflect our preferences, which of course may be different from those of the reader. Suitable data are provided in the Supplementary Material so that interested readers can design a scoring algorithm that reflects their interests and biases. Some parameters such as abundance and cost may also be sensitive to geopolitical considerations.
A green score is defined (SAR or S*A*R) as the product of scores for safety, abundance and recoverability, as defined in Table 1.
S A R = S × A × R
Initially, we thought of defining the green score as the sum of S, A and R; however, this approach is too forgiving for systems that may have one very bad score. In contrast, Equation (1) penalizes more systems with a single low (or unacceptable) score. Thus scores of 1, 5 and 5 will give a SAR of 25 or 20% of the maximum score (125); in contrast, in an additive criterion, the score will be 11 of 25, or 73%. We simply wanted to ensure that one unacceptable score (i.e., 1) would heavily affect the SAR value. Clearly, other practitioners of the scoring strategy may have other preferred algorithms.
For each reaction, a score based on the efficiency of the process can be defined, as shown in Equation (2).
S c o r e = i P + B a × f P n × f P m × B x
where individual scores (P) are the 6 parameters (individual scores) defined in Table 1, Pn is a user-selected parameter and Pm is another user selection, providing additional weight to selected parameters. Typically, one of these parameters would be the yield (in our case Pn). In our case, Pm is the abundance, but with a square root function, so that yield (Y) is weighted more heavily than abundance (A). Further, Ba and Bx are bias parameters of an additive or multiplier type, respectively. We anticipate that parameter choice may reflect environmental issues and likely geopolitical preferences. Equation (3) illustrates the case wherein no biases are included (i.e., Ba = 0 and Bx = 1).
B a s e   S c o r e = i P × Y × A
As indicated above, adopting a scoring strategy does not require that our algorithms be adopted; our preferences and biases, as expressed in Equations (1)–(3), need not be the only such scoring system, rather they are a demonstration of how a simple system can be used to identify appealing catalysts for specific projects. In fact, we expect that financial, technical, environmental or geopolitical factors will lead to equations that may not resemble those used for illustration in this contribution.
An example using the “Base Score” is shown in Figure 9, where the catalysts are categorized into four quadrants as follows: high yield and high green potential, high yield and low green potential, low yield and low green potential, and low yield and high green potential. As already mentioned, CeO2 stands out as a material that boasts impressive potential as an effective green catalyst.
As an exercise, we decided to add bias to our plots, allowing us to select for materials that have particular benefits for specific communities. As an exercise, we prepared many plots, for example emphasizing only yields or financial aspects. The one shown in Figure 10 reflects our affiliations, assigning Bx values of 1.5 to catalysts incorporating Pt, Pd or Co, all elements for which Canada is one of the top five producers in the world, thus applying a geographic bias to our data interpretation.

4. Conclusions

Our studies highlight the importance of conducting consistent studies to start work on experimental catalysis informatics [8]. These data must be obtained under strictly controlled conditions, and must include all negative results or failed attempts with the same weight as successful experiments. Unfortunately, this is not a common practice in published work or work originating from different laboratories. Beyond end point yields, understanding the kinetics of the process is critical if reaction times are to be optimized. We believe that beyond yield and price, other parameters must be evaluated, as they relate to environmental, health or sustainability issues. To this end, we have created a scoring system that takes into account a total of six parameters, visually illustrated with radar plots. The top half of Figure 3C is displayed with a green background to show graphically the importance that we assign to green sustainable practices. As a general rule, the larger the enclosed area in these radar plots, the better the catalyst; however, not all the parameters in these plots will have the same relevance to those adopting a scoring strategy, and ultimately, the algorithms used to rank catalysts (as in Equations (1)–(3)) will not be the same for all users or all geographical locations. Thus, we regard flexibility as one of the key advantages of the model proposed.
The scoring system proposed is readily adaptable to different types of bias; these may reflect environmental or sustainability issues, or could reflect trade practices, supply availability or geopolitical preferences. Given our affiliations, we demonstrate an example in which scores are biased to reflect Canadian preferences. We hope that our scoring ideas will not only be adopted in catalysis informatics, but also in other fields, particularly when the acquisition of experimental data limits the practical volume of data sets.
Finally, kinetics, not just end point analysis, offers crucial information when deciding which catalyst should be preferred.

Supplementary Materials

The following Supplementary Material can be downloaded at: https://www.mdpi.com/article/10.3390/catal15070636/s1, a flile with 126 pages including, Sources of data used for scores, Scores selected for individual catalysts, Exploratory studies of selected metal salts in the reaction environment, Fast kinetics details and a Summary results for the 114 catalysts tested.

Author Contributions

Conceptualization, J.C.S. and B.W.; methodology, R.E.-k., B.W. and C.R.B.; formal analysis, J.C.S., B.W., R.E.-k. and C.R.B.; writing—original draft preparation, J.C.S.; writing—review and editing, J.C.S., B.W., R.E.-k. and C.R.B.; supervision, J.C.S.; funding acquisition, J.C.S. All authors have read and agreed to the published version of the manuscript.

Funding

This work was supported by the Natural Sciences and Engineering Research Council of Canada, the Canada Foundation for Innovation and the Canada Research Chairs Program.

Data Availability Statement

The original contributions presented in this study are included in the article/Supplementary Material. Further inquiries can be directed to the corresponding author.

Conflicts of Interest

The authors declare no conflicts of interest.

References

  1. Trunschke, A. Prospects and challenges for autonomous catalyst discovery viewed from an experimental perspective. Catal. Sci. Technol. 2022, 12, 3650–3669. [Google Scholar] [CrossRef]
  2. Kearnes, S.M.; Maser, M.R.; Wleklinski, M.; Kast, A.; Doyle, A.G.; Dreher, S.D.; Hawkins, J.M.; Jensen, K.F.; Coley, C.W. The Open Reaction Database. J. Am. Chem. Soc. 2021, 143, 18820–18826. [Google Scholar] [CrossRef]
  3. Melián-Cabrera, I. Catalytic Materials: Concepts to Understand the Pathway to Implementation. Ind. Eng. Chem. Res. 2021, 60, 18545–18559. [Google Scholar] [CrossRef]
  4. Tang, M.; Yuan, W.; Ou, Y.; Li, G.; You, R.; Li, S.; Yang, H.; Zhang, Z.; Wang, Y. Recent Progresses on Structural Reconstruction of Nanosized Metal Catalysts via Controlled-Atmosphere Transmission Electron Microscopy: A Review. ACS Catal. 2020, 10, 14419–14450. [Google Scholar] [CrossRef]
  5. Costa, P.; Sandrin, D.; Scaiano, J.C. Real-time fluorescence imaging of a heterogeneously catalysed Suzuki–Miyaura reaction. Nat. Catal. 2020, 3, 427–437. [Google Scholar] [CrossRef]
  6. Ouyang, R.; Liu, J.-X.; Li, W.-X. Atomistic Theory of Ostwald Ripening and Disintegration of Supported Metal Particles under Reaction Conditions. J. Am. Chem. Soc. 2013, 135, 1760–1771. [Google Scholar] [CrossRef]
  7. Moulijn, J.A.; Pérez-Ramírez, J.; Berger, R.J.; Hamminga, G.; Mul, G.; Kapteijn, F. High-throughput experimentation in catalyst testing and in kinetic studies for heterogeneous catalysis. Catal. Today 2003, 81, 457–471. [Google Scholar] [CrossRef]
  8. Takahashi, K.; Takahashi, L.; Nishimura, S.; Fujima, J.; Ohyama, J. The Rise of Catalysts Informatics. In Crystalline Metal Oxide Catalysts; Ueda, W., Ed.; Springer Nature Singapore: Singapore, 2022; pp. 349–371. [Google Scholar]
  9. Murbach, G.; Biyani, S.A.; Thompson, D.H. High Throughput Experimentation as a Tool to Guide the Microwave Assisted Catalytic Amidation of Aryl Amines with Aryl Acids. Eur. J. Org. Chem. 2025, 28, e202400764. [Google Scholar] [CrossRef]
  10. Mennen, S.M.; Alhambra, C.; Allen, C.L.; Barberis, M.; Berritt, S.; Brandt, T.A.; Campbell, A.D.; Castañón, J.; Cherney, A.H.; Christensen, M.; et al. The Evolution of High-Throughput Experimentation in Pharmaceutical Development and Perspectives on the Future. Org. Proc. Res. Dev. 2019, 23, 1213–1242. [Google Scholar] [CrossRef]
  11. Isbrandt, E.S.; Sullivan, R.J.; Newman, S.G. High Throughput Strategies for the Discovery and Optimization of Catalytic Reactions. Angew. Chem. Int. Ed. 2019, 58, 7180–7191. [Google Scholar] [CrossRef]
  12. Benavides-Hernández, J.; Dumeignil, F. From Characterization to Discovery: Artificial Intelligence, Machine Learning and High-Throughput Experiments for Heterogeneous Catalyst Design. ACS Catal. 2024, 14, 11749–11779. [Google Scholar] [CrossRef]
  13. Suh, C.; Sieg, S.C.; Heying, M.J.; Oliver, J.H.; Maier, W.F.; Rajan, K. Visualization of High-Dimensional Combinatorial Catalysis Data. J. Comb. Chem. 2009, 11, 385–392. [Google Scholar] [CrossRef]
  14. Shevlin, M. Practical High-Throughput Experimentation for Chemists. ACS Med. Chem. Lett. 2017, 8, 601–607. [Google Scholar] [CrossRef]
  15. Christensen, M.; Yunker, L.P.E.; Adedeji, F.; Häse, F.; Roch, L.M.; Gensch, T.; dos Passos Gomes, G.; Zepel, T.; Sigman, M.S.; Aspuru-Guzik, A.; et al. Data-science driven autonomous process optimization. Commun. Chem. 2021, 4, 112. [Google Scholar] [CrossRef] [PubMed]
  16. Shevlin, M.; Friedfeld, M.R.; Sheng, H.; Pierson, N.A.; Hoyt, J.M.; Campeau, L.-C.; Chirik, P.J. Nickel-Catalyzed Asymmetric Alkene Hydrogenation of α,β-Unsaturated Esters: High-Throughput Experimentation-Enabled Reaction Discovery, Optimization, and Mechanistic Elucidation. J. Am. Chem. Soc. 2016, 138, 3562–3569. [Google Scholar] [CrossRef] [PubMed]
  17. Herrera, B.T.; Pilicer, S.L.; Anslyn, E.V.; Joyce, L.A.; Wolf, C. Optical Analysis of Reaction Yield and Enantiomeric Excess: A New Paradigm Ready for Prime Time. J. Am. Chem. Soc. 2018, 140, 10385–10401. [Google Scholar] [CrossRef]
  18. Wang, B.; Bourgonje, C.R.; Scaiano, J.C. Fiber-glass supported catalysis: Real-time, high-resolution visualization of active palladium catalytic centers during the reduction of nitro compounds. Catal. Sci. Technol. 2023, 13, 1021–1031. [Google Scholar] [CrossRef]
  19. Kumari, R.; Sunil, D.; Ningthoujam, R.S.; Pandey, B.N.; Kulkarni, S.D.; Varadavenkatesan, T.; Venkatachalam, G.; V, A.K.N. A Nitronaphthalimide Probe for Fluorescence Imaging of Hypoxia in Cancer Cells. J. Fluores. 2021, 31, 1665–1673. [Google Scholar] [CrossRef]
  20. Carrillo, A.I.; Stamplecoskie, K.G.; Marin, M.L.; Scaiano, J.C. ‘From the mole to the molecule’: Ruthenium catalyzed nitroarene reduction studied with ‘bench’, high-throughput and single molecule fluorescence techniques. Catal. Sci. Technol. 2014, 4, 1989–1996. [Google Scholar] [CrossRef]
  21. Wang, B.; Lanterna, A.E.; Scaiano, J.C. Mechanistic Insights on the Semihydrogenation of Alkynes over Different Nanostructured Photocatalysts. ACS Catal. 2021, 11, 4230–4238. [Google Scholar] [CrossRef]
  22. Gawargy, T.A.; Costa, P.; Lanterna, A.E.; Scaiano, J.C. Photochemical benzylic radical arylation promoted by supported Pd nanostructures. Org. Biomol. Chem. 2020, 18, 6047–6052. [Google Scholar] [CrossRef] [PubMed]
  23. Elhage, A.; Lanterna, A.E.; Scaiano, J.C. Catalytic farming: Reaction rotation extends catalyst performance. Chem. Sci. 2019, 10, 1419–1425. [Google Scholar] [CrossRef] [PubMed]
  24. Hainer, A.S.; Hodgins, J.S.; Sandre, V.; Vallieres, M.; Lanterna, A.E.; Scaiano, J.C. Photocatalytic Hydrogen Generation Using Metal-Decorated TiO2: Sacrificial Donors vs. True Water Splitting. ACS Energy Lett. 2018, 3, 542–545. [Google Scholar] [CrossRef]
  25. Wang, B.; Durantini, J.; Nie, J.; Lanterna, A.E.; Scaiano, J.C. Heterogeneous Photocatalytic Click Chemistry. J. Am. Chem. Soc. 2016, 138, 13127–13130. [Google Scholar] [CrossRef]
  26. Cely-Pinto, M.; Wang, B.; Scaiano, J.C. Photocatalytic Semi-Hydrogenation of Alkynes: A Game of Kinetics, Selectivity and Critical Timing. Nanomaterials 2023, 13, 2390. [Google Scholar] [CrossRef]
  27. American Chemical Society. Green Chemistry: Endangered Elements. Available online: https://www.acs.org/green-chemistry-sustainability/research-innovation/endangered-elements.html (accessed on 28 June 2025).
  28. da Silva, D.R.C.; Mapukata, S.; Currie, S.; Kitos, A.A.; Lanterna, A.E.; Nyokong, T.; Scaiano, J.C. Fibrous TiO2 Alternatives for Semiconductor-Based Catalysts for Photocatalytic Water Remediation Involving Organic Contaminants. ACS Omega 2023, 8, 21585–21593. [Google Scholar] [CrossRef]
  29. Vivier, L.; Duprez, D. Ceria-Based Solid Catalysts for Organic Chemistry. ChemSusChem 2010, 3, 654–678. [Google Scholar] [CrossRef]
  30. Yan, B.; Cho, K. CatScore: A High-Efficiency Evaluation Metric for Asymmetric Catalyst Design. ChemRxiv 2023. [Google Scholar] [CrossRef]
Figure 1. The UV-Vis absorbance and fluorescence shifts of our fluorogenic probe for the optical detection of nitro-to-amine reductions. The system consists of a non-fluorescent nitronaphthalimide (NN)-based precursor, which becomes highly fluorescent (AN) upon reduction [18]. The nomenclature for these dyes is the same as utilized before in our laboratory [20].
Catalysts 15 00636 g001
Figure 2. 24-well plate set-up design (c). Wells labeled “S” (red labels) contain NN to AN reaction mixtures, while wells labeled “R” (black labels) contain the corresponding control system, containing the end product AN, rather than the nitro-containing NN precursor. Absorbance and fluorescence intensities were scanned at pre-selected intervals of 5 min, for a total of 80 min reaction time. (a) The absorption spectra obtained from the reaction well of the Cu@charcoal catalyst (catalyst # 31). (b) The absorption spectra obtained from the standard well of the Cu@charcoal catalyst. Fluorescence data were also recorded for both reaction and standard wells.
Catalysts 15 00636 g002
Figure 3. Catalyst profile for catalyst #31, Cu@charcoal. (A) UV-Vis absorbance spectra of NN reduction, and (B) corresponding wavelengths-of-interest values over time. (C) Radar plot scores for the catalyst. (D) Fluorescence intensity, corresponding to AN-1 yield, over time.
Catalysts 15 00636 g003
Figure 4. Absorption (■ 350 nm, ▼ 430 nm) and fluorescence (▲) data for catalyst #31, Cu@charcoal. The data have been slightly adjusted (<10%), such that the range is 0–100%, assuming complete conversion applies to fluorescence, as observed in the absorption measurements. Note that the exponential growth fit does not match the data very well. Different kinetic models will be discussed later. The rate constants in min−1 are 0.060 (350 nm), 0.043 (430 nm) and 0.040 (fluorescence).
Catalysts 15 00636 g004
Figure 5. Four models describing the dynamic behavior of the intermediate detected at 540 nm from the HT fluorogenic assay. (A) A consistent amount of intermediate detected throughout the reaction. (B) Undetectable intermediate behavior. (C) A significant amount of intermediate formation with a low depletion rate. (D) A significant amount of intermediate formation with a fast depletion rate.
Catalysts 15 00636 g005
Figure 6. Normal acquisition and fast kinetic data using Pd@Carbon as a catalyst (#13). Absorbance data in red and purple and fluorescence in black and blue. Filled data points correspond to normal acquisition that extends over 80 min, while hollow points represent fast kinetic scans, taken every 10 s.
Catalysts 15 00636 g006
Figure 7. Kinetic models for three representative heterogenous catalysts used, showing three distinct kinetic behaviors: (A) linear growth, (B) monoexponential growth, and (C) a hybrid growth consisting of a linear jump followed by monoexponential growth.
Catalysts 15 00636 g007
Figure 8. Product of the yield*cost scores against catalyst number. Individual scores can be found in the Supplementary Material.
Catalysts 15 00636 g008
Figure 9. Comparison of green scores and base scores (Equation (2)) for all 114 catalysts. The top right quadrant highlights green catalysts with good overall scores. The colors of the quadrants emphasize the desirable green chemistry areas, with bright green as the preferred region.
Catalysts 15 00636 g009
Figure 10. Comparison of green scores and base scores (Equation (2)) for all 114 catalysts. The top right quadrant highlights green catalysts (high S*A*R) with good scores. The base score has been modified with what we describe as a Canadian bias (see text). The colors of the quadrants emphasize the desirable green chemistry areas, with bright green as the preferred region.
Catalysts 15 00636 g010
Table 1. Ranking categories associated with chemical properties. For each parameter, more favourable characteristics are awarded a higher standardized score, ranging from 1 to 5 (row 1, “score/parameter”).
Score
Parameter ↓
1
(Least Favourable)
2345
(Most Favourable)
(S) Safety (NFPA score)8–76–54–32–10
SelectivityIntermediate persists at reaction endpoint (550 nm band remain at 80 min)NAIntermediate formed then disappeared by reaction end point; 550 nm band gone at 80 minNAIntermediate does not form across the reaction profile; no 550 nm signal
Reaction rateLess than 25% yield in 80 min25 ≤ % yield ≤ 60 in 80 min60 ≤ % yield ≤ 100 in 80 minPlateaus to completion in 80 minPlateaus to completion in <20 min
AffordabilityUSD > 10060 ≤ USD ≤ 10030 ≤ USD ≤ 6030 ≤ USD ≤ 10USD < 10
(A) Supply and Abundance0 scoreNA1, 2 scoreNA3 score
(R) Recoverability0 scoreNA1 scoreNA2 and 3 scores
The details of the scoring system can be found in the ESI. Not all score numeric values are used for all properties in some cases (e.g., for selectivity, only values 1, 3 and 5 are used).
Disclaimer/Publisher’s Note: The statements, opinions and data contained in all publications are solely those of the individual author(s) and contributor(s) and not of MDPI and/or the editor(s). MDPI and/or the editor(s) disclaim responsibility for any injury to people or property resulting from any ideas, methods, instructions or products referred to in the content.

