Article

First Principles Evaluation of Platinum Cluster Metal–Support Interactions on Nitrogen-Doped Carbon Supports

1
Department of Pharmaceutical Sciences, Skaggs School of Pharmacy and Pharmaceutical Sciences, University of Colorado Anschutz Medical Campus, Aurora, CO 80045, USA
2
Department of Chemistry, Colorado School of Mines, Golden, CO 80401, USA
*
Author to whom correspondence should be addressed.
Catalysts 2025, 15(7), 635; https://doi.org/10.3390/catal15070635
Submission received: 21 March 2025 / Revised: 28 May 2025 / Accepted: 30 May 2025 / Published: 29 June 2025
(This article belongs to the Special Issue Single-Atom Catalysts: Current Trends, Challenges, and Prospects)

Abstract

The fundamental chemistries and electronic structures of platinum catalysts over nitrogen-doped carbon supports were examined to determine the subtle yet important roles graphitic defect-based and pyridinic defect-based nitrogen defects have in stabilizing platinum. These roles address and extend previously gathered incomplete knowledge of how combinations of graphitic defect and pyridinic defect affect the local electronic structure, leading to a greater unified understanding of platinum stability. A theoretical study was designed where different atomically sized platinum clusters were investigated over seven different nitrogen defect combinations on graphene carbon support. Differently sized platinum clusters offered parametric insights into the differences in metal–support interactions.

Graphical Abstract

1. Introduction

Heterogeneous catalysis is responsible for catalyzing a significant amount of reactions necessary for consumer products [1]. High-surface area solid phases, or materials used as supports, have been implemented to assist the metal catalysts. Supports enhance catalytic reactivity and longevity by immobilizing the metal catalyst to a surface. Some metals, especially Pt, generally are great catalysts and have been integrated into widespread commercial applications. Furthermore, these metals have been investigated as single-atom catalysts (SACs) for various different reactions [2]. However, many of these versatile metals are scarce and expensive. It has been realized that atomic-scale active sites, rather than entire surfaces, perform catalysis, which means lesser amounts of metals provide equivalent or greater reactivity if metal–support structures are specifically tuned for an optimal catalytic system [3].
These late transition metals (TMs) have been supported on different materials, of which carbon is one of the most investigated among notable standouts, such as A l 2 O 3 and S i O 2 . When compared to other support materials, carbon is highly modifiable, inert to operable conditions, and inexpensive [4,5]. Even with carbon supports, the metal catalysts still lack the stability and durability needed for practical use [6,7,8]. The introduction of various distinct nitrogen moieties (also referred to as defects) into the carbon materials has remedied the instability by lessening dissolution, promoting nucleation, and increasing the dispersion of metal nanoparticles. Metal–nitrogen–carbon (MNC) materials are known to improve catalytic stability through specific active sites, often including atomic vacancies [2,9,10,11,12,13]. In practice, MNC materials retained greater current density after electrochemical cycling and were shown to stabilize SACs [10,14,15,16,17,18]. These improvements do not, however, completely eliminate all challenges. Surface morphological changes can occur under relatively mild reaction conditions and current materials can be heterogeneous with multitudes of defects. Characterization methods still require assistance in confidently drawing structure–property relationships as in some cases, “averaged” experimental signatures are reported from heterogeneous materials or bulk defects are included with surface characterization [19,20]. These relationships can be validated through elucidating fundamental chemical knowledge about the metal–support interactions (MSIs).
MSIs have been examined with atomic-scale molecular modeling, including microkinetic models and coarse-grained simulations, but density functional theory (DFT) has been particularly and heavily utilized for probing MSIs of MNC over different defect types with varying metals [21,22,23]. However, a gap within that literature exists, as studies often probe a single defect system at a time for a selective investigation. Differently designed models are also often employed between studies, making direct comparisons of MSI speculative. Some systematic approaches have been conducted for direct comparison of various MSI parameters such as defect type, supported metal, or metal size.
Pyridinic and graphitic defects are two of the most commonly studied nitrogen-doped defects in their MSI [24]. Some studies have presented pyridinic defects’ interactions over various metals, although mostly focusing on their binding to adsorbates [25,26,27]. A systematic study involving graphitic defect and its MSI over the late TMs has also been presented [28]. Furthermore, multiple defects, including nitrogen-based defects, have been contrasted with each other within the same study [8,24]. A study examined just Pt with a graphitic defect or with a site of three pyridinic defects, to offer firsthand comparison between the two common defects. A study even examined a mixture of pyridinic and pyrrolic defects with Pt, which has not been performed for graphitic and pyridinic defects, as multiple defect types can be found across a N-doped support [29]. Distinctions between N-defects and their MSI over different TMs exceeding just Pt should also be resolved to gain deeper insights into the different N-defects. Investigations into combinations of graphitic and pyridinic defects are lacking but are still paramount in understanding these heterogeneous materials.
Another varying aspect of MSI is the size proportions of catalysts, from atomically dispersed to nanoparticles, as it is essential to their catalytic properties [5,30,31,32]. MSI is affected by the metal’s size, which is another varied parameter in DFT approaches [33]. In theoretical investigations, nanoclusters of various sizes have been optimized, ranging from 3 to 58 atoms, and have also been examined for their interactions with adsorbates [31,34,35,36]. In introducing an N-doped carbon support to nanoclusters, nanoclusters of four atoms have been examined along with other nanoclusters consisting of more and different elemental atoms in other metrics and evaluations that are not considered for SACs [16,24,37,38]. Comprehensive analysis among SACs, four-atom nanoclusters, and larger nanoclusters is not available in terms of considering computational frameworks and parameterization.
This study uses electronic structure calculations to elucidate fundamental interactions between the Pt catalysts and the N-doped support. Electronic descriptors were evaluated as predictors for Pt’s adsorption and dissolution to the support. Different defect sites encompassing graphitic and pyridinic functionalities were designed to examine the impact of subtle structural changes on the local electronic structures, which would eventually impact the catalytic stability. Pt SACs were compared to Pt clusters to investigate the effect of a “bulk phase” on the support.
The detailed analyses outlined below cover the generally accepted notion that nitrogen functionalities in the carbon support enhance the stability parameters of the Pt catalyst. However, the presence of graphitic defects near the pyridinic defects inadvertently affects the adsorption energies. Furthermore, when comparing the Pt as an SAC relative to P t 4 and P t 13 clusters, it was found that the fundamental MSIs were preserved as long as Pt’s orientation was retained by the pyridinic defects, although the defects did slightly alter the clusters’ geometric composition. To our knowledge, this is one of the first studies comparing Pt and Pt nanoclusters over diverse N-doped supports, which not only improves the understanding of MSIs but also impacts practical design and the balance of defects in the carbon supports to improve the stability of the Pt catalyst.

2. Materials and Methods

Non-polarized quantum mechanical calculations utilizing density functional theory (DFT) were performed using periodic boundary conditions with a plane-wave basis set through Quantum Espresso 6.5 package [39,40]. The carbon material in which the calculations were conducted and studied upon is a single layer of carbon atoms, resembling graphene. All chosen convergence criteria were evaluated with a P t 4 nanocluster on an undoped graphene layer (vide infra). Electron wavefunctions were expanded within that plane-wave basis set to a cutoff of 55 Ry using projector-augmented wave pseudopotentials coupled with the Perdew–Burke–Ernzerhof exchange-correlation functional [28,41,42]. The increase in kinetic energy cutoff from 55 Ry to 60 Ry had less than a total electronic energy change from all contributions of 10 4 Ry/atom. Methfessel–Paxton first order spreading was used with a width of 0.05 Ry to assist in electronic convergence through fractional occupations and chosen when the energy change was less than 10 3 Ry/atom [43]. Energy was sampled on a 2 × 2 × 1   Γ -point Monkhorst–Pack-based k-point grid as the energy change to a 4 × 4 × 1 grid was less than 10 7 Ry/atom [44]. A dipole correction was applied perpendicular to the graphene plane as there was 23 Å of vacuum space between periodic graphene surfaces [45].
For calculations to obtain [partial] density of states ([p]DOS), a finer 6 × 6 × 1   Γ -point Monkhorst–Pack-based k-point grid was used. The computational supercell of the undoped support contained 98 carbon atoms in which carbon atoms were replaced with nitrogen atoms or excluded, depending on the studied combination of graphitic or pyridinic nitrogen functionalities or defect[s] [46]. Pt clusters comprising of 1, 4, or 13 atom[s] were placed over (in the z-direction with respects to the support plane) and relaxed with those various defects within the carbon support studied (Figure 1).
Adsorption energy of the Pt clusters to the support was calculated by (Equation (1)):
E A d s = E M S E S E M
where E A d s is the adsorption energy, E M S is the energy of the Pt cluster on the support, E S is the energy of the support, and E M is the energy of the Pt cluster. It should also be noted that E A d s is negative by definition and a greater value magnitude will measure greater adsorption between the cluster and support (the study refers to this as an increase in E A d s ). Dissolution energy was also calculated by (Equation (2)):
E D i s = E P t x 1 S + E P t E P t x S
where E D i s is the dissolution energy, E P t x S is the energy of a x-Pt atom cluster on the support, E P t x 1 S is the energy of a x 1 -Pt atom cluster on the support, and E P t is the energy of a Pt atom (the Pt atom farthest from the support is removed). These energies, by definition, are positive and a greater value measures a larger resistance to dissolution, indicating that it is energetically more disfavored for the Pt atom to be removed from the cluster.
All values for ϵ f discussed vide infra are in reference to the difference from the corresponding ∅’s ϵ f . The d-band center ϵ d of Pt clusters was found by (Equations (3) and (4)):
E d = ϵ f E ρ ( E ) d E ϵ f ρ ( E ) d E
ϵ d = E d ϵ f
where E d is the d-band centroid, ϵ f is the Fermi energy, E is the energy, and ρ ( E ) is the pDOS of the Pt d-orbitals [8]. The d-band width ϵ w was also calculated by (Equation (5)),
ϵ w = ( E E d ) 2 ρ ( E ) d E ρ ( E ) d E
based on the obtained pDOS [47,48]. Charge difference density plots and Bader charge analysis obtained using the software from Henkelman group were utilized for further electronic analysis [38,49].

3. Results

3.1. Systems with Single Pt Atom Catalyst

3.1.1. Adsorption

The E A d s was measured for the Pt atom over the seven different carbon supports, as shown in Figure 1. The mode of adsorption (MOA) was also accounted [28]. These MOAs have been seen with structurally identical or similar defect sites as the C C M O A and V M O A can be potential minima if there is a graphitic defect or vacancy, respectively. The defect structures here are based on the studied graphitic and pyridinic defect[s] with informative but missing variations to showcase specific electronic effects [8,24,28,50,51,52,53]. The study provides direct comparison across this range of unique graphitic- and pyridinic-based active sites supporting Pt.
Table 1 presents both the observed E A d s and MOA of the Pt atom over the seven different carbon supports. The ∅ is the represents the undoped support, serving as the control. The G, G 2 , and G 2 contain graphitic defect[s] where the effect of having more than one graphitic defect in two different locations has been investigated. Alternatively, P 3 , P 3 G , and P 4 have pyridinic defects where P 3 and P 4 are pyridinic defect groupings around an atomic vacancy within the support, formed by removing carbon atom[s]. The difference between P 3 and P 4 is that the P 4 has an extra pyridinic defect due to its larger size vacancy (two carbon atoms in P 4 versus one carbon atom in P 3 ). The P 3 G has a neighboring graphitic defect to study the effect of a close-by graphitic defect on P 3 . The study extends a deeper exploration between the intricacies of previously studied defects [8,53].
From Table 1, it is evident that the nitrogen doping increases E A d s . A distinction is seen with that general increase between the graphitic-based defect group of G, G 2 , and G 2 ( G G ) and pyridinic-based defect group of P 3 , P 3 G , and P 4 ( G P ). Firstly, the shared MOA is C C M O A in G G and V M O A for G P . This shared MOA presents that graphitic defects enhanced the E A d s through MOA retention, when compared to the ∅. The vacancy introduced by the pyridinic defects becomes the Pt’s MOA in G P .
For G G , the E A d s from the addition of one graphitic defect at the C C M O A from ∅ is increased by 0.41 eV, as supported by the literature [28,52,53]. However, the studied G 2 and G 2 provide further insights into graphitic defects. There are multitudes of graphitic defects within a carbon support, similar to what is observed with pyridinic defects [54,55]. The study examines graphitic defects in plurality, rather than simply in isolation.
Herein, G 2 is designed such that there are two graphitic defects that both promote interactions between the Pt atom and the support at the same C C M O A . The E A d s of G 2 is 0.55 eV greater than G, implying that there are synergistic interactions from both defects as they are strategically placed. G 2 was designed to examine the extent that placement matters on the E A d s . The graphitic defects in G 2 are a “carbon atom spacing” further separated. The E A d s is lower than G 2 by 0.30 eV but still greater than G by 0.25 eV. The synergistic effect is still present but to a lesser extent. This synergistic effect is derived from the additional electrons, from graphitic defects, in the conduction band that decreases over distance. While graphitic defect concentration is shown to be important for stability, the distribution of that graphitic defect concentration is also important.
For G P , the E A d s increased by over 1 eV in all cases, when compared to the ∅, as compared to G G , where the largest increase was about 1 eV. P 3 , P 3 G , and P 4 all have V M O A as the Pt atom relaxes slightly above or in the same plane as the vacancy created by the pyridinic defects. The pyridinic defects have a filled dangling s p 2 orbital directed into the vacancy that can be donated to the Pt. G P contain three or four pyridinic defects and, thus, the vacancy would have three or four s p 2 orbitals to interact with the Pt atom. There is not a linear correlation between the number of pyridinic defects and E A d s as P 3 has an increase of 1.3 eV while P 4 has an increase of 6.21 eV. This larger difference with P 4 is most likely from the Pt relaxing into the same plane into the larger-sized vacancy, whereas in the P 3 , the Pt is still over the support (Figure 2). P 3 G has the introduction of a graphitic defect neighboring the pyridinic defects. The E A d s is 0.43 eV less than P 3 , entailing that the graphitic defect negatively affects the P 3 electronic structure in reducing Pt’s E A d s . As shown in Figure 2, the Pt spatially relaxes away from the pyridinic defect that is closest to the graphitic defect. The E A d s from Table 1 imply that different types of defects from N-doping can have both synergistic and uncooperative effects on Pt stability. Current synthetic methods can biased for a certain N-defect but heterogeneity still does exist. These data support that it would be worthwhile to examine a higher concentration of graphitic defects for catalytic stability or attempt to control for pyridinic defects without graphitic defects for even greater stability. At the atomic level, the E A d s is dictated by the MOA.
The study elucidates the nature of the increased E A d s through hypothesizing that the Pt interacts with the nitrogen-doped support largely through charge transfer or electronic rearrangement, although they might not be mutually exclusive. To this end, Bader charge analysis along with difference density plots and pDOS were obtained to examine the extent of charge transfer and electronic rearrangement.

3.1.2. Charge Transfer

For the Pt atom over the supports under investigation, a charge difference density plot was created by subtracting the electronic density of the Pt and the support in absence of each other from the relaxed combined electronic density (Figure 2). The electron density in ∅ around the Pt increases except away from the support. The electron density increases directly between the Pt and the support as the carbons of the C C M O A lose their electronic density. G G ’s electronic density is largely similar to ∅.
In P 3 , it is observed that both the Pt, surrounding C, and N atom[s] gain electronic density except away from the support, as in G G . This is due to the nitrogens’ induction effect and their lone pairs interacting with the Pt, which also affects the surrounding C atoms and the π -network. P 3 G shows the Pt spatially moving away and losing electronic density from the pyridinic defect that is closest to the graphitic defect. This deficit can be clearly attributed to the graphitic defect where its extra electron is interfering with the pyridinic electronic structure. P 4 shares a fairly similar electronic composition as the other G P members but the Pt is in the same plane as the support.
Table 2 presents the Bader charges for the Pt and N atom[s]. The charge on the Pt in the ∅ remains close to neutral, implying that the interaction does not involve significant charge transfer. With the addition of the graphitic defect, G has Pt close to neutral as well, with N having -0.58 electrons. This supports the argument that the graphitic defect does not change the existing interaction to charge transfer between the N and the Pt atom[s] but that the N atoms inductively gain electronic density from the carbon support. In G 2 , the Pt electronic density does increase but arguably not significantly and, interestingly, one of the N atoms barely changes. Meanwhile, in G 2 , the electronic density on the N atoms does not differ by much. This is another difference due to the placement of the graphitic defects, relative to each other. The N with less electronic density in G 2 perhaps cannot inductively draw any more density from the electron-deficient C C M O A (Figure 2). The N in G 2 is further away from the MOA and does not experience this effect.
For G P , the electronic density of Pt deviates much more. In P 3 , Pt loses about 0.50 of an electron to the pyridinic defects, seen in Figure 2. The electronic densities of the N atoms are approximately equivalent in implying that all the charge transfer interactions per each pyridinic defect are on the same order of magnitude. In P 3 G , the graphitic defect electronic density is on par with that in G G but the electronic density on the pyridinic defect closest to the graphitic defect now has almost gained a full electron. It is known that the graphitic defect does affect the electronic density of the site where the pyridinic defect is located. With the N atom containing six electrons, the electrons most likely occupy the p z and s p 2 orbitals along with two σ -bonds, becoming unfavorable to interact with. P 4 has a similar electronic distribution across its N atoms, ranging from −0.55 to −0.50, and with its additional pyridinic defect, Pt loses one electron.
While the Bader charges and the charge difference density plot display electronic density reorganization, charge transfer is not evident enough to describe G G . On the other hand, G P ’s charge transfer directly opposes the claimed interaction of pyridinic defects donating their lone pair to the Pt as the Bader charges display otherwise. The observed electronic densities imply that the pyridinic defects are withdrawing electron density from the Pt and holding that density on the nitrogen atoms. In either case, charge transfer has proven to be not fully descriptive and further electronic analysis has been conducted. It is most likely that the rearrangement of electrons at this scale explains the seen E A d s , rather than a direct electron transfer.

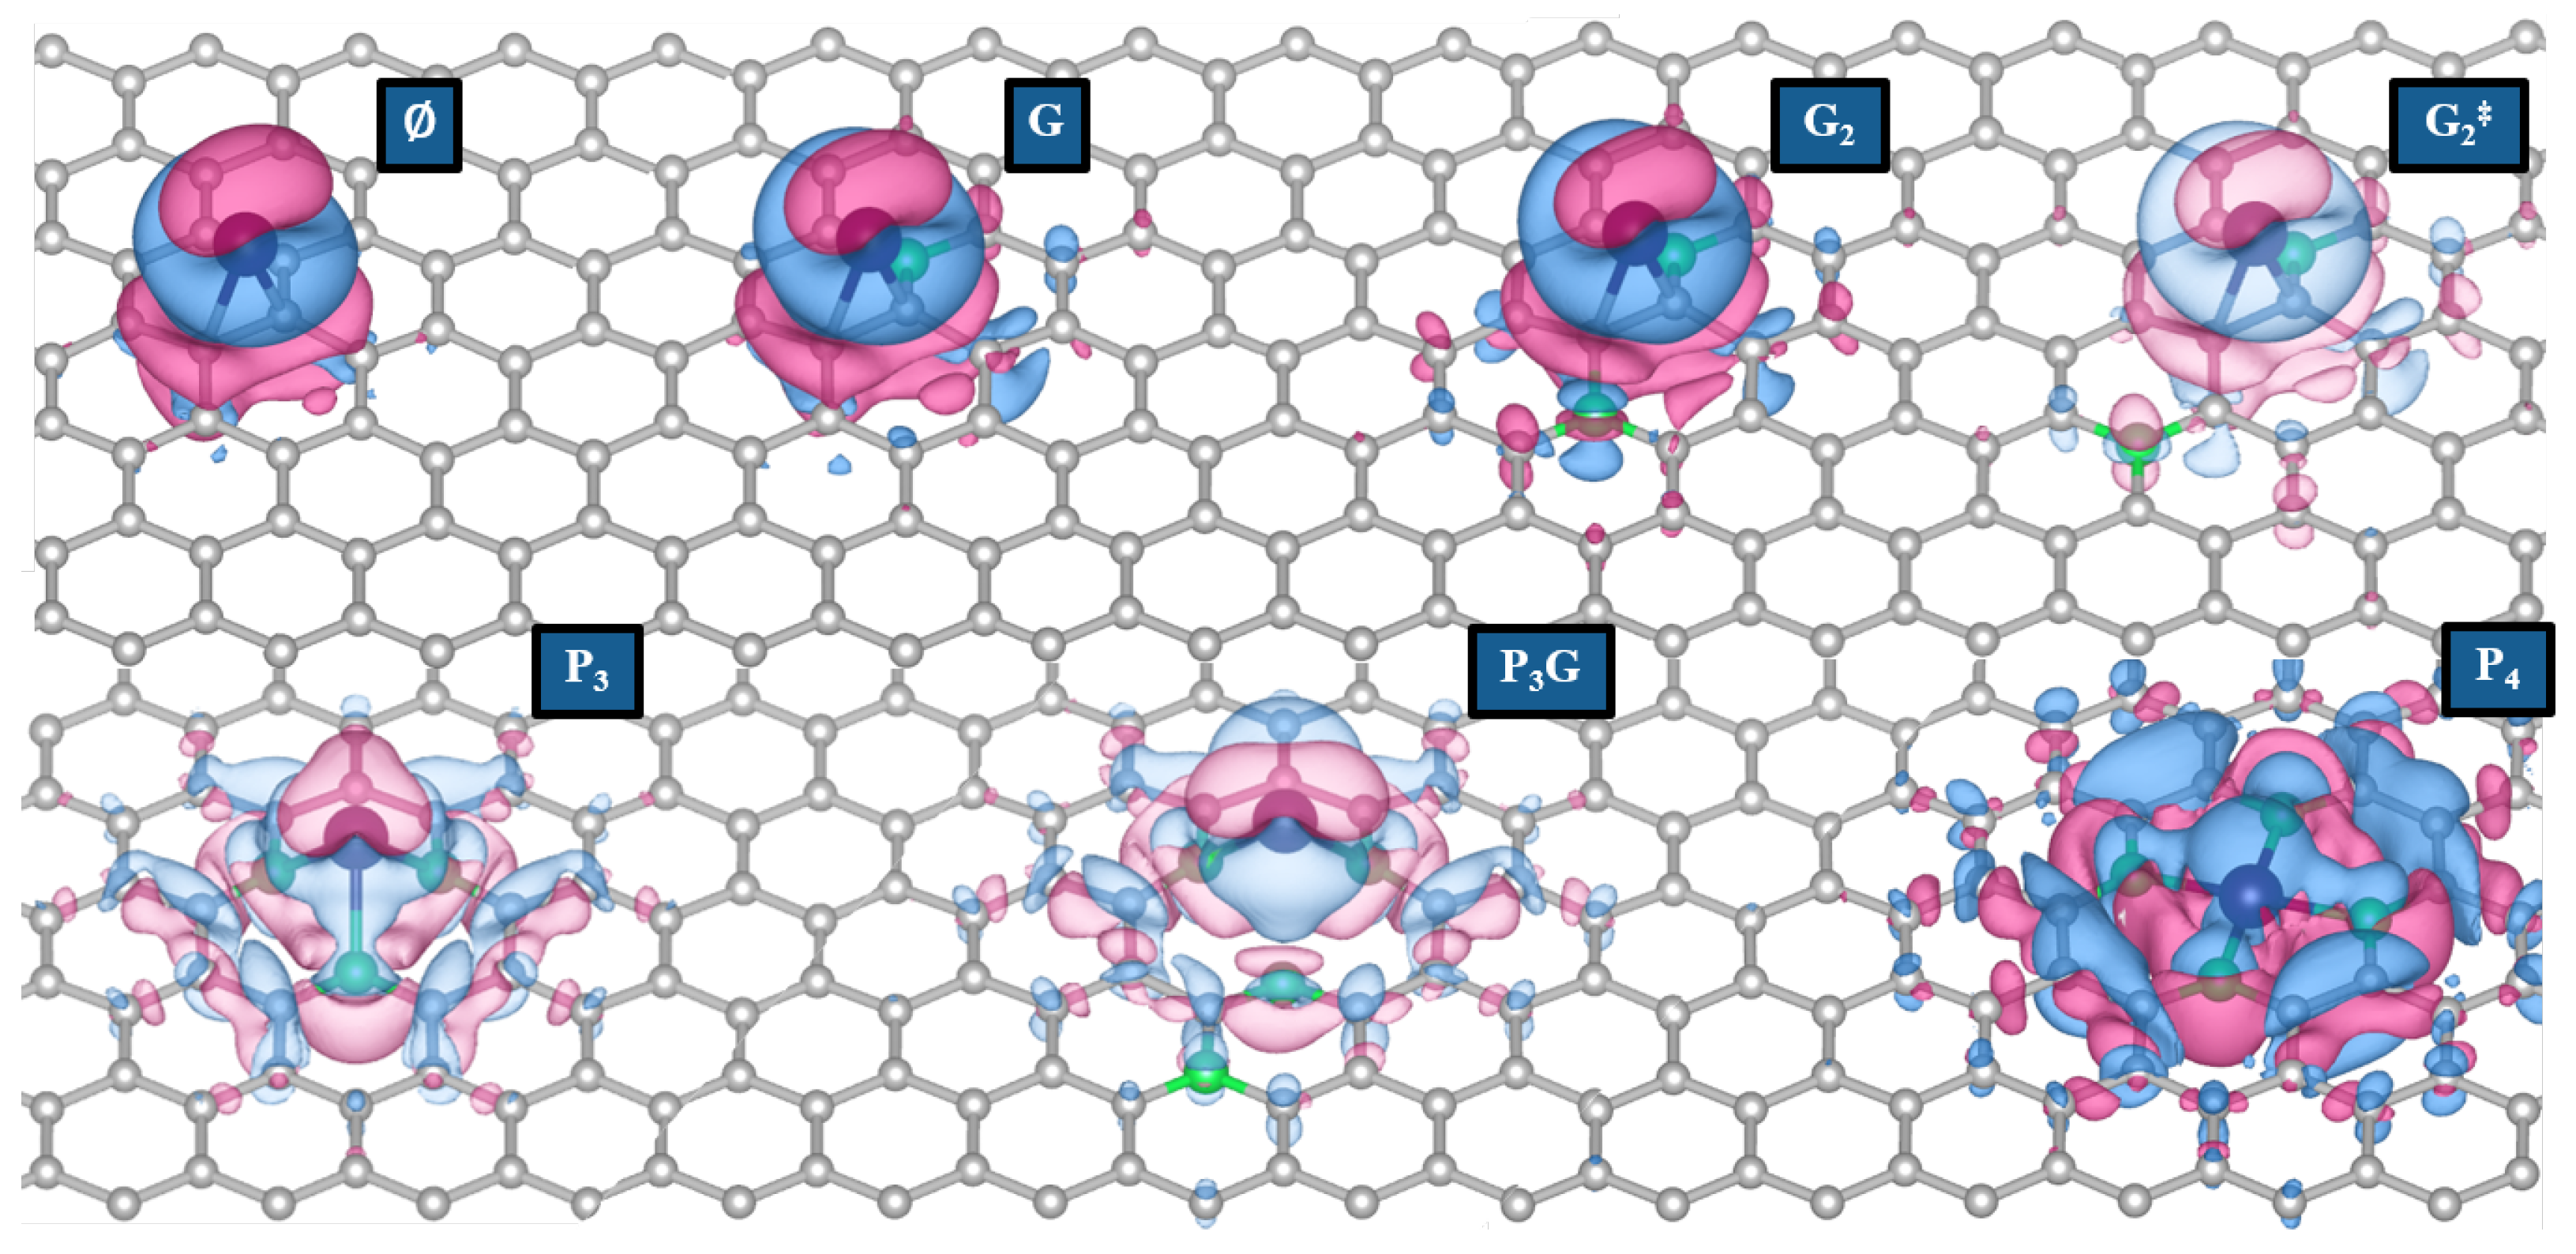
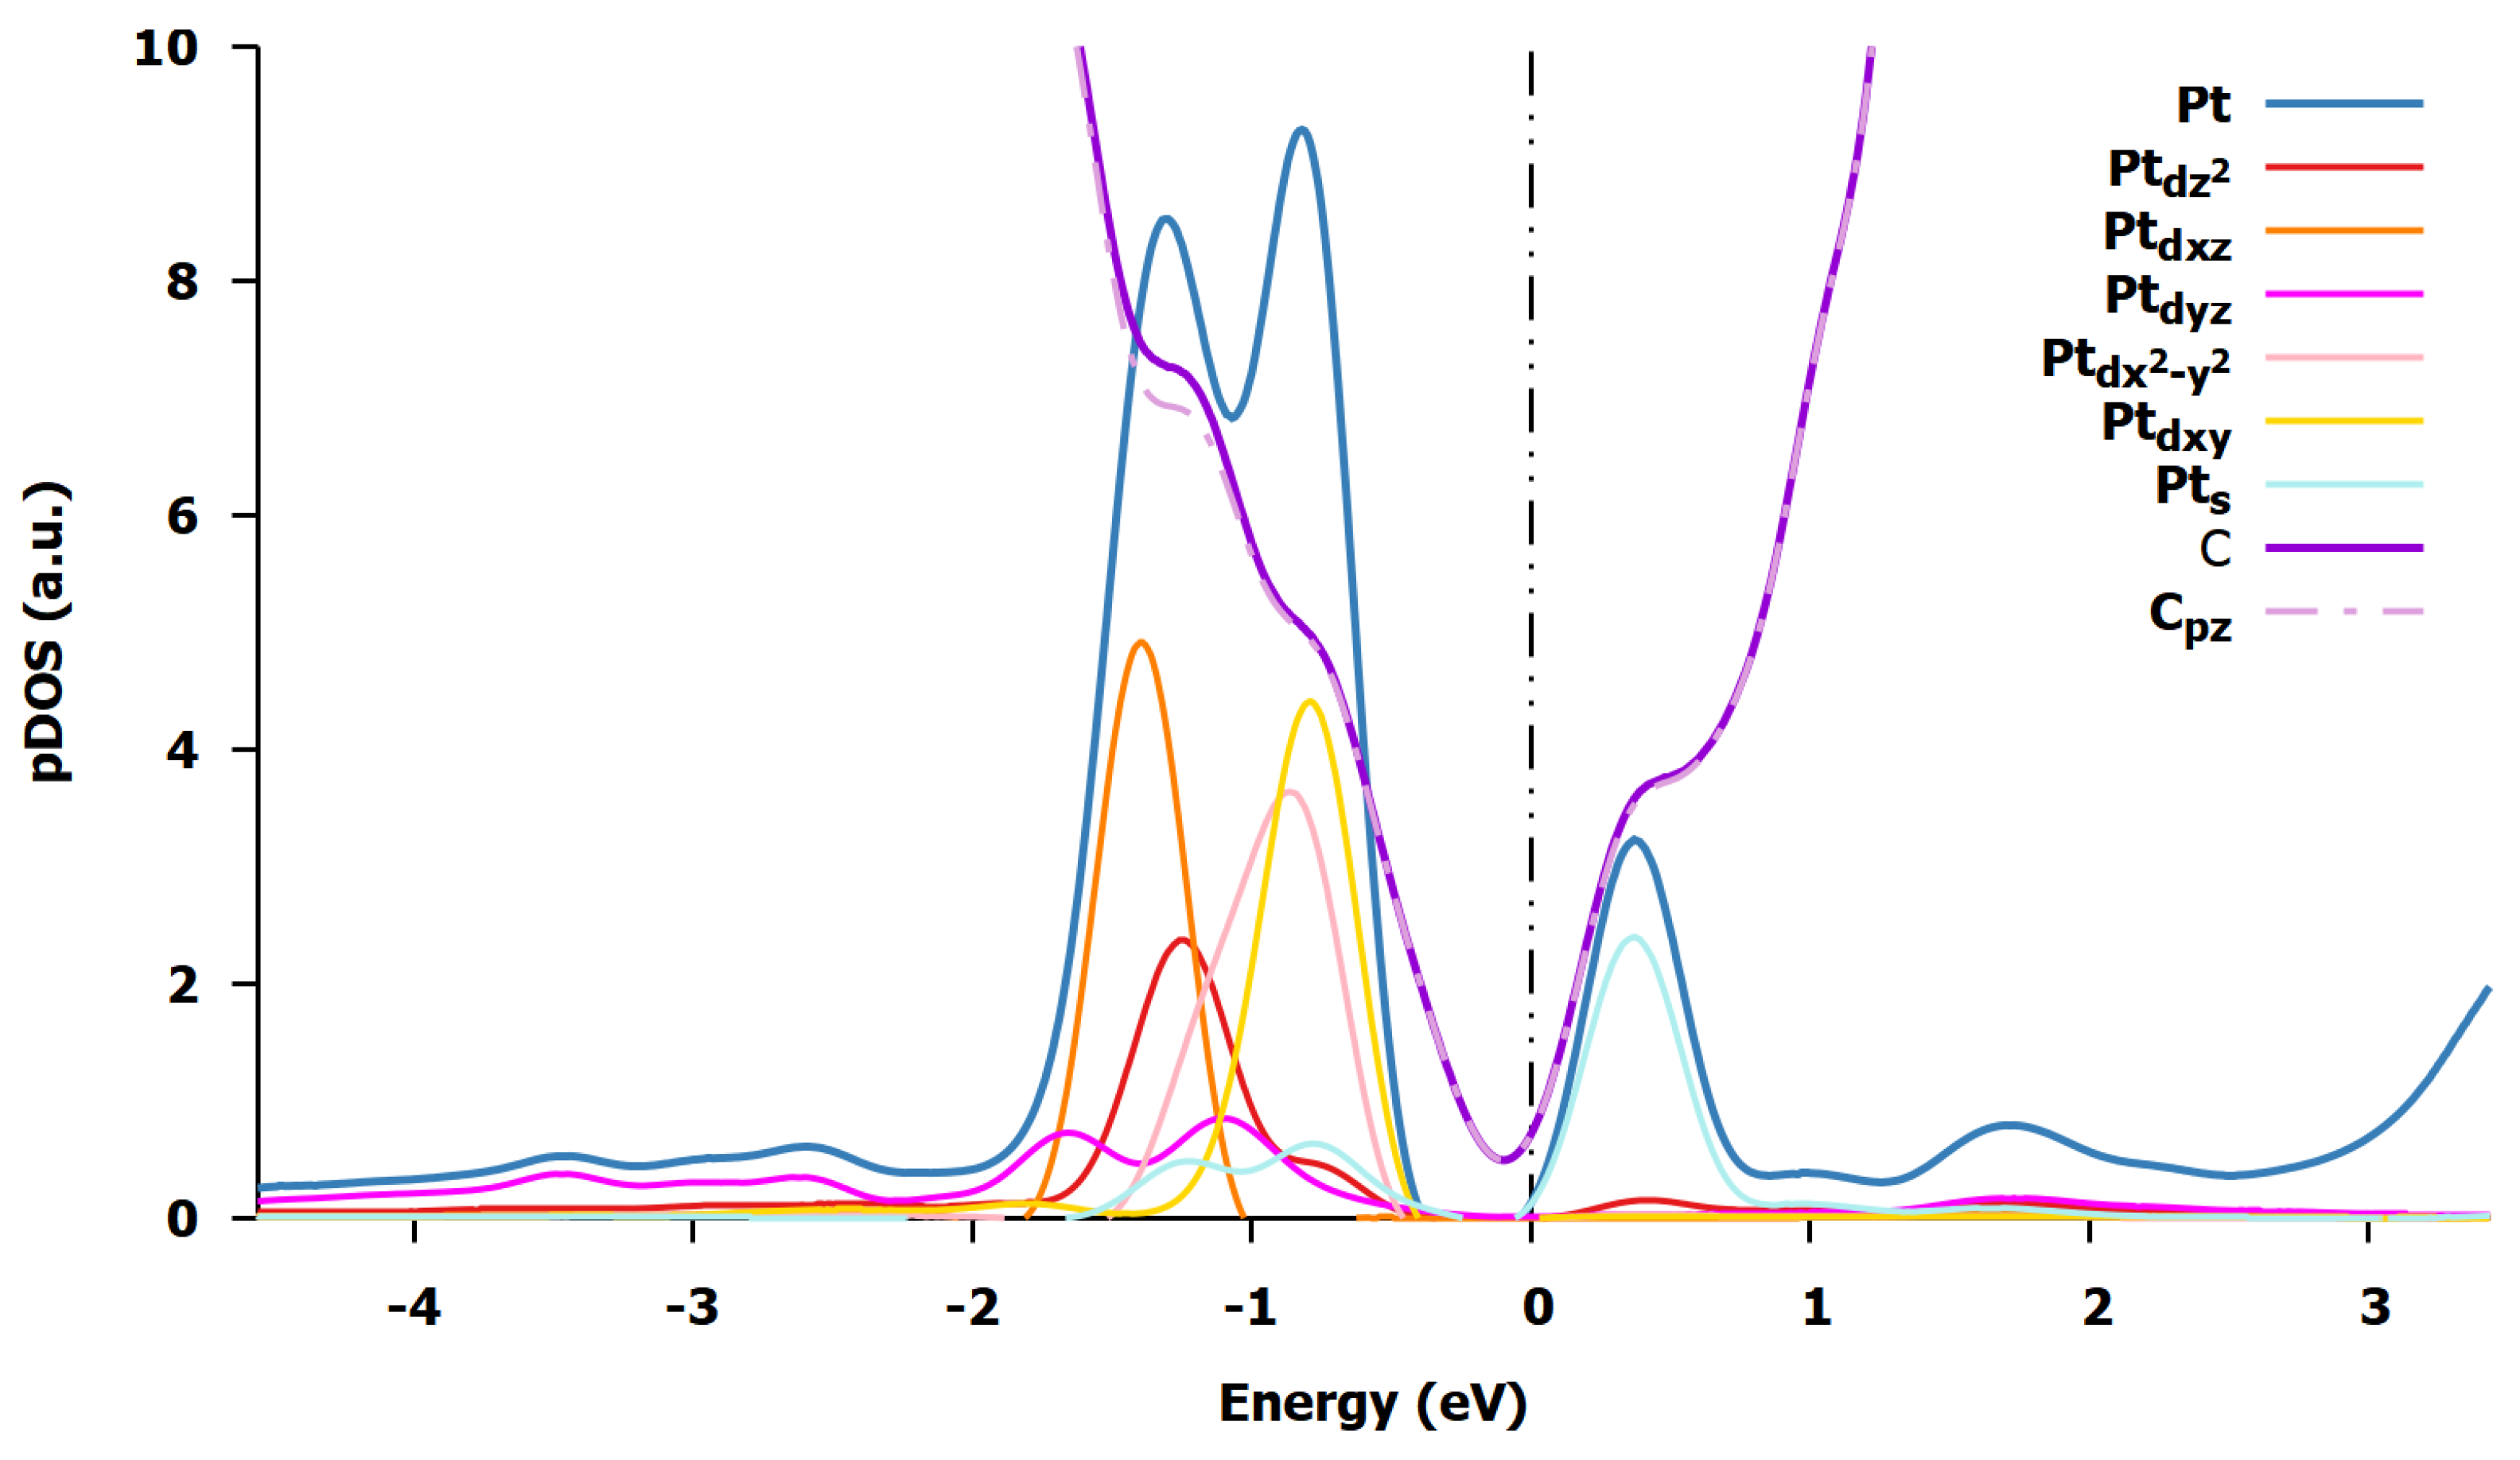
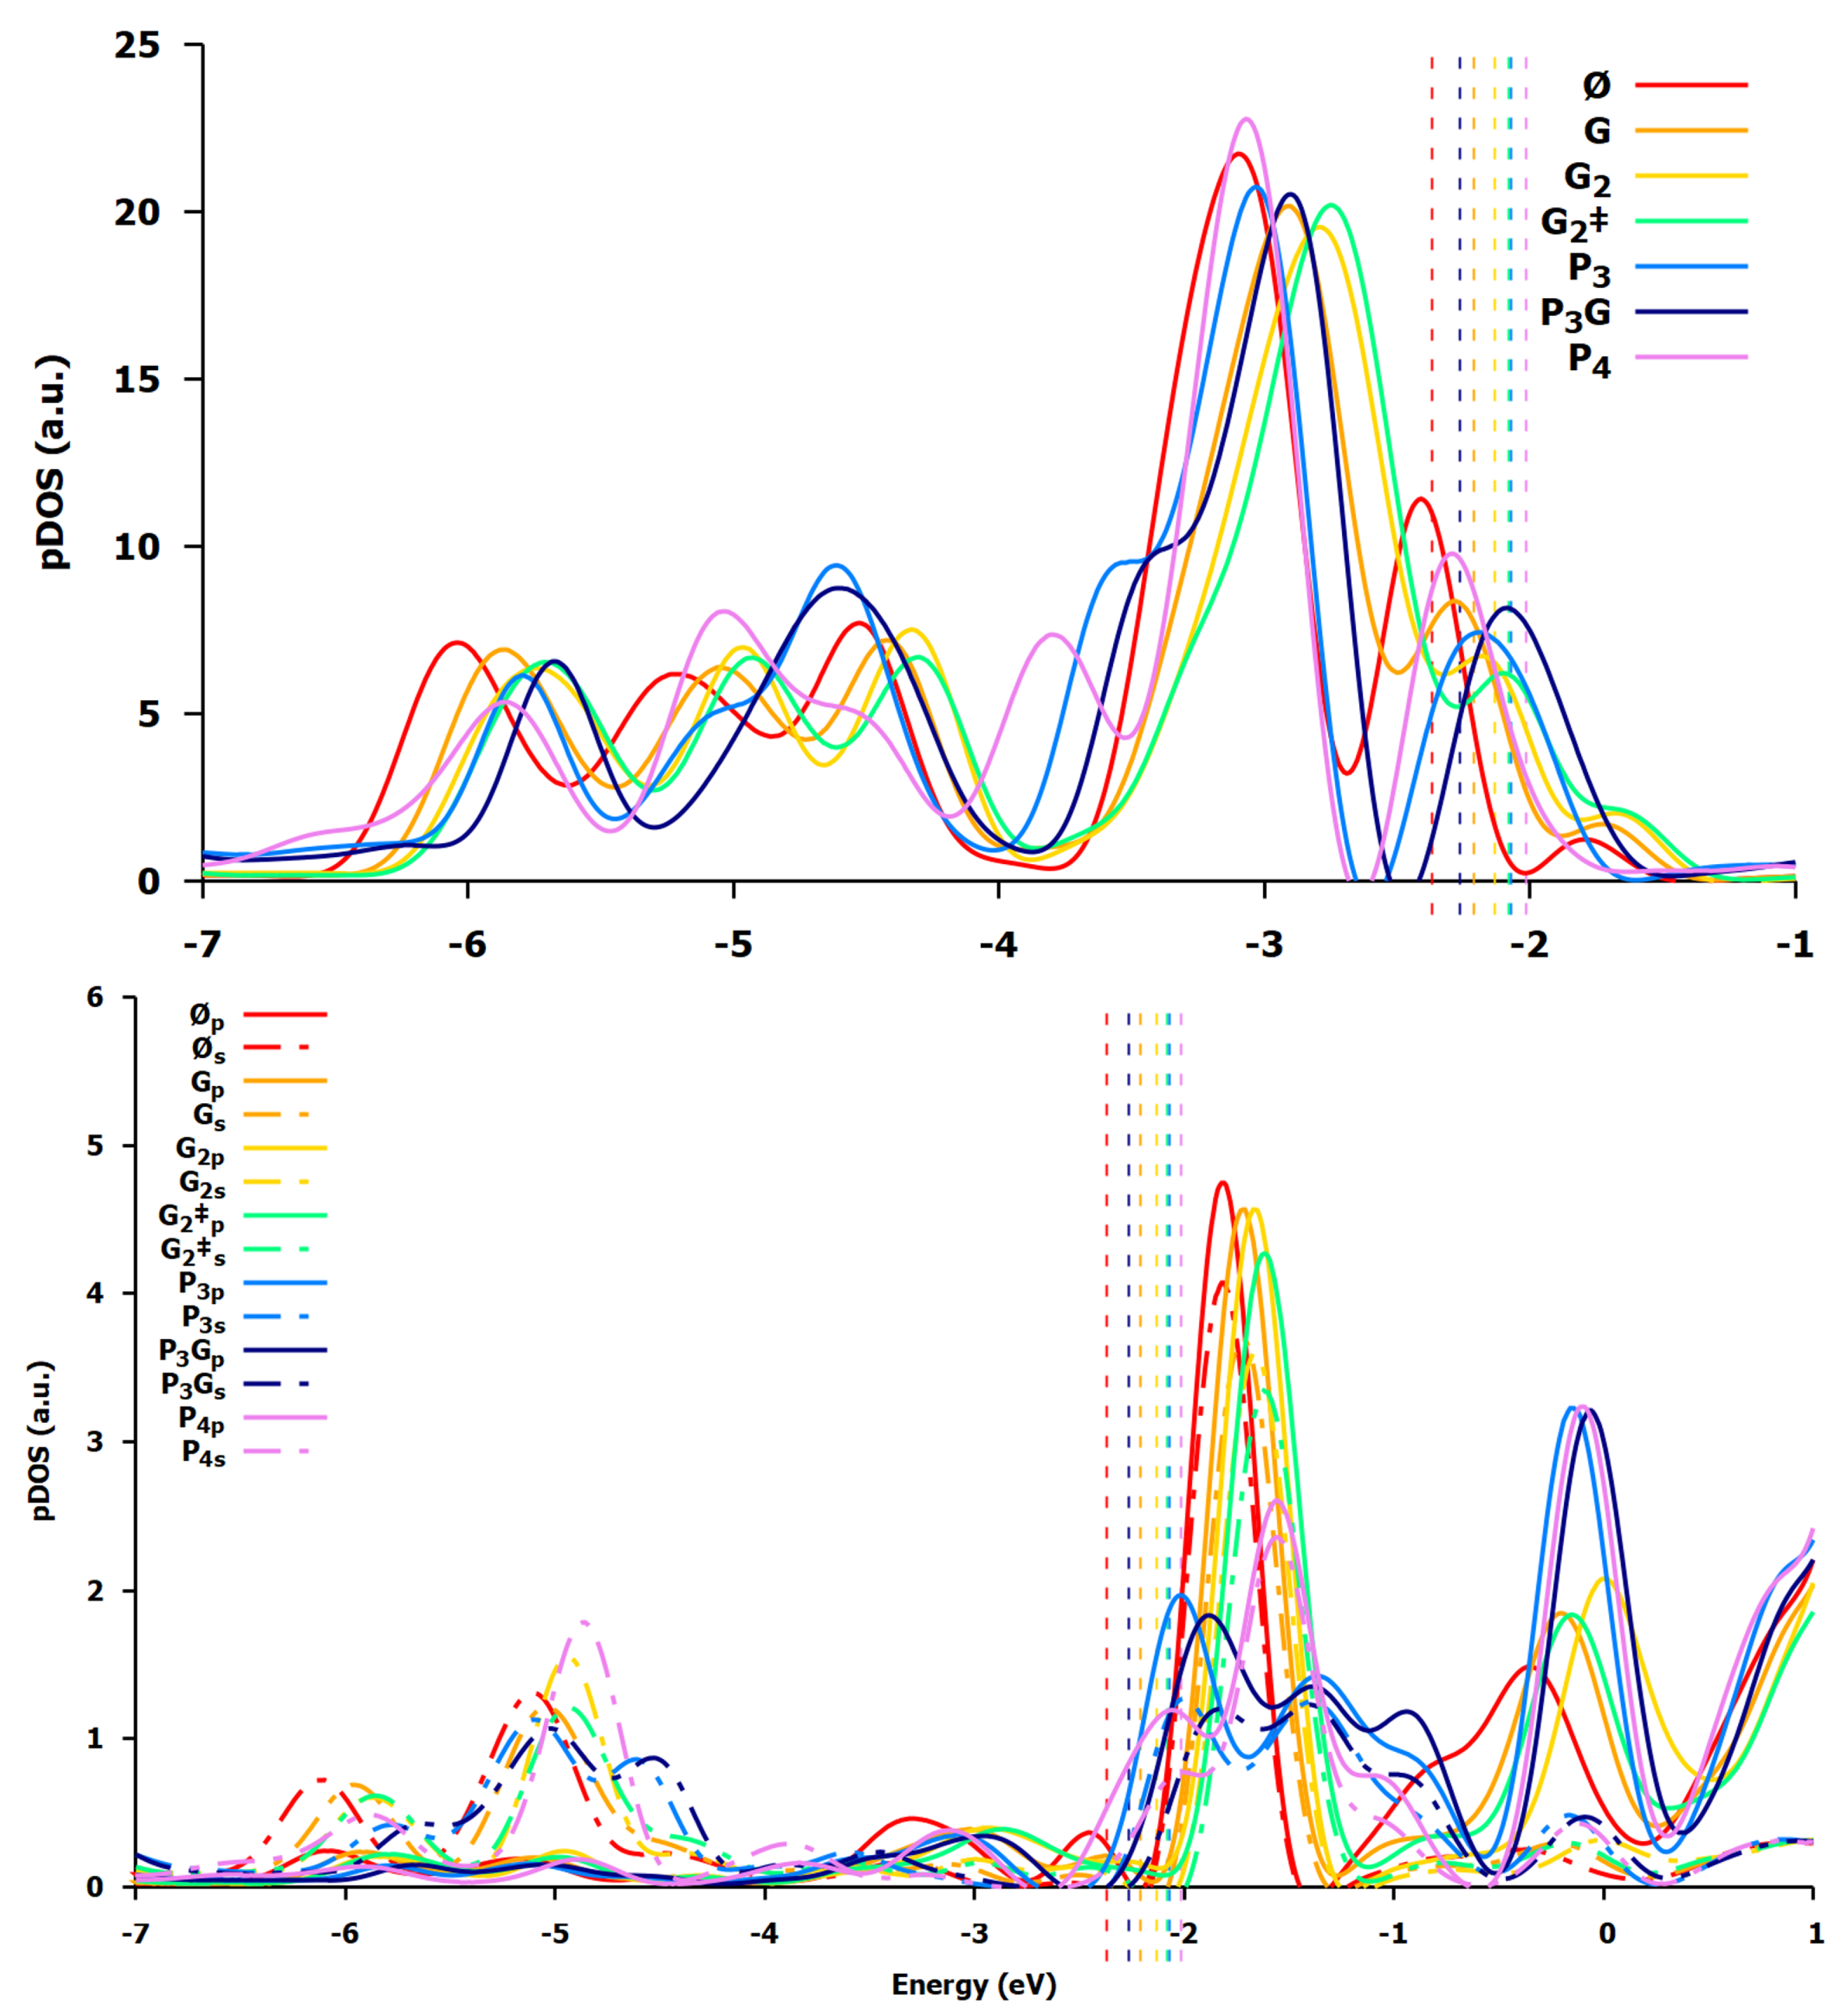
3.1.3. Electronic Rearrangement

The pDOS plots were obtained specifically for the Pt and N atom[s] across all defects to evaluate the adulterated electronic environments.
Figure 3 displays the pDOS for Pt on the ∅. The C pDOS is included to provide a reference as there are no N atoms. It is shown through the filled states that most of the C interactions with the Pt involve its p z orbitals. The Pt disrupts the π network and interacts with the p z orbitals at the C C M O A with its d orbitals as these are the occupied orbitals closest to the ϵ f . There is a slight band gap around the ϵ f . Above the ϵ f , the states are mostly comprised of Pt’s s orbitals and carbon’s antibonding orbitals.
Figure 4 shows the pDOS for Pt of G G . In all cases, the ϵ f has increased relative to the ∅ (Table 3) as the additional electron[s] from the graphitic defect[s] is filling the unoccupied states. Theses unoccupied states are compromised of Pt’s s and N’s p z orbitals. It is seen that there are two discrete states at −1.5 and −0.5 eV. At −0.5 eV, the states are mostly composed of Pt’s d x 2 y 2 and d x y orbitals while at −1.5 eV, energy states are mostly composed of Pt’s d z 2 and d x z orbitals, assuming the axis perpendicular to the support is the z-axis. N’s pDOS shows that its p z orbital is its frontier orbital.
The occupied orbitals support the Pt’s C C M O A of G G as consistency between their electronic structures is again apparent. The d z 2 and d x z have larger orbital overlap with the electronic density of the C C M O A . Pt’s d x 2 y 2 and d x y lie perpendicular to the support, in which there can be π -interactions that are higher in energy. The Pt’s d y z orbital has minimal overlap, as shown by its lower occupation. While the electronic distribution of states remains consistent, the extra electrons from the graphitic defect[s] raise the ϵ f to where the unoccupied Pt’s s orbitals were in the ∅. This s-orbital occupation is observed to be correlated with greater E A d s [28]. In G 2 , Pt’s s orbital overlaps both nitrogen atoms’ electronic density, compared to just one nitrogen’s in G 2 . This C C M O A is best described by the degree of orbital overlap.
Figure 5 shows that G P ’s pDOS differs from G G . For P 3 , there are three discrete Pt states at −2, 0, and 0.5 eV. At −2 eV, the states are mostly comprised of d x 2 y 2 , d x y , and d z 2 orbitals. These orbitals have minimal orbital overlap with the pyridinic defects as the Pt atom is slighty above the plane over the atomic vacancy. Around the ϵ f , these states are mostly Pt’s d y z and d x z orbitals as well as N’s p x and p y orbitals. Pt’s d y z and d x z orbitals have overlap with N’s p x and p y orbitals, which are hybridized as s p 2 orbitals. N’s p z states gain electronic density from the Pt. It is worth noting that there are energetically close-by unoccupied Pt’s p z and s orbitals for possible downstream reactivity.
P 3 G ’s pDOS significantly deviates from P 3 , supporting that the graphitic defect has a significant effect on the pyridinic defects. N’s p x and p y states are now split between two different energy levels, where the higher energy level is only partially filled. P 3 G has pDOS characteristics that were seen with G G ’s. Pt’s d orbitals have also changed. Its d x 2 y 2 and d x y states are not degenerate anymore and have slighty shifted upwards in energy. The d x z and d y z are also not degenerate anymore. These losses of degeneracy support an the asymmetrical interaction of the Pt with the P 3 G . With the Pt moving away from one of the pyridinic defects, the d x z gains more overlap while d y z loses overlap. This is further corroborated as the spatial differences between the N and Pt atom[s] change from P 3 to P 3 G . For two of the N, the length to the Pt decreases by about 0.07 Å, whereas for the other N part of the vacancy, the length increases by 0.55 Å.
P 4 is also different from the other G P members. This strongly demonstrates that the electronic structure is largely dependent on the number of pyridinic defects and the vacancy size, rather than some dependence on the number of pyridinic defects. A majority of the Pt states are found to be much lower than the ϵ f . There are two discrete states at −3 and −2 eV made up of mostly d x 2 y 2 and d z 2 states, respectively. Pt’s d x 2 y 2 aligns with the four pyridinic defects as it is close to energy of the N’s p x and p y states. The higher energy states consists of Pt’s d z 2 , d x z , and s orbital[s]. Pt’s s orbital being occupied explains P 4 ’s high E A d s , as this occupation is also seen with the graphitic in increasing E A d s . As these states are low lying, their antibonding orbitals are equally high in energy, further contributing to the high E A d s .
Through calculating the d-band center ϵ d and d-band width ϵ w as metrics in gauging the distribution of Pt’s d states, the pDOS is quantified (Table 3). In examining the ϵ f , the ϵ f increases from the ∅ in all defects, except for P 3 due to its vacancy. P 3 G has a graphitic defect and P 4 has filled p z states from its strongly bonding states at lower energies to to maintain their ϵ f . ϵ d measures the separation from ϵ f down to E d . When compared to the ∅, all cases have their ϵ d decrease more, meaning a larger separation between their ϵ f and E d . There is almost a direct correlation between the E A d s and the ϵ d . G G have less of a decrease in their ϵ d than G P , similar to E A d s . The relative trends within G G and G P match for ϵ d and E A d s . For example, a greater ϵ d entails a greater increase in E A d s in G G (G < G 2 < G 2 ). This is true for G P as well ( P 3 G < P 3 < P 4 ). The only exception is when considering relative trends between G G and G P , as P 3 G has the greater decrease in ϵ f but a lower E A d s than G 2 ; however, it is not by much.
When ϵ d is greater, Pt has more energy states at lower energies. A lower E d indicates that more, if not all, of its d orbitals will be occupied and stabilized directly or indirectly by N’s orbitals (Figure 4 and Figure 5). Thus, this implies that E A d s increases with a lower E d . It is worth noting that too strong of a stabilization may cause inactivity for proceeding catalytic reactions as a majority of the d orbitals are then away from the ϵ f . However, this is beneficial for Pt’s stability and for G G , there are partially filled and unfilled Pt s and p states around the ϵ f . Pt’s d orbitals are mostly responsible for the orbital overlap with the carbons’ p z orbitals and pyridinic defects’ s p 2 orbital. This reinforces that interactions at this level are from electronic rearrangement directed by the directs, rather than from the defect directing electron density to different locations.
The same exact trend and correlation is seen with ϵ w , where ϵ w measures the distribution of filled and unfilled states around the ϵ f ; a greater ϵ w would entail more states further away from the ϵ f . G G have a lower ϵ w than G P . It can be seen that the G G states are closer and more centered around the ϵ f , as a majority of states are between −2 and 2 eV (with respects to the ϵ f ). G P states are more spread out, where it is seen that the states expand below −3 eV and above 3 eV. This is highly evident in P 4 , where a majority of states are centered around −3 eV. This reinforces that lower energetic d orbitals provide greater Pt E A d s to the support and stabilization. Further examination of Pt with additional Pt atoms (forming a larger Pt catalyst) was carried out to explore the validity of these conclusions regarding a “bulk” phase.

3.2. Platinum Nanoclusters

The P t 4 cluster was relaxed over the defects in a manner where one of the Pt atoms was directly interacting with the support while the other three were bonded to that Pt atom. The P t 4 had the same MOA across each defect as the single-Pt atom cluster ( P t 1 ) in Table 1.
Table 4 displays the range of metrics for P t 4 that were used for P t 1 . The E A d s along with ϵ f , E d , ϵ d , and ϵ w were again calculated. In addition, E D i s , bond length (BL), and coordination number (CN) were calculated for the Pt atom interacting with the support P t i and all other Pt atoms of the P t 4 cluster.
P t 4 shares the same trend as P t 1 where any form of N-doping increases E A d s . Furthermore, P t 4 also preserves the trend between G G and G P . G G increase their E A d s by ∼0.3–0.5 eV and G P by ∼2.6–3.2 eV when compared to ∅. E A d s in P t 1 and P t 4 systems are about the same, maintaining that the only P t i is directly interacting with the support. For the G G , corresponding E A d s between P t 1 and P t 4 differs by, at most, 0.5 eV, in terms of numerical value. The relative trend of increasing E A d s (G < G 2 < G 2 ) is present in both Pt clusters. The values are of greater magnitude in P t 1 than in P t 4 , which implies that the additional Pt atoms do lessen the adsorption strength.
In the case of G P , the corresponding E A d s values differ up to ∼3.6 eV. The P 3 and P 3 G have greater E A d s in the P t 4 cluster, whereas P 4 has greater E A d s in P t 1 , making the overall relative trends differ between clusters for PP. In P t 4 , the E A d s increases from P 3 G to P 4 to P 3 while in P t 1 , the E A d s increases from P 3 G to P 3 to P 4 . In both cases, most importantly, P 3 has a greater E A d s than P 3 G , supporting that the graphitic defect negatively affects the three pyridinic defect site and pyridinic sites overall. The E A d s of the P 3 compared to P 4 is what differs between the two clusters. The difference between the P 3 and P 4 is 0.57 eV in P t 4 , whereas it is 4.93 eV in P t 1 . This is most likely due to the P t 1 spatially inserting into the vacancy, which is not viable for the larger P t 4 . The P t 4 cluster instead develops a similar MOA as the P t 1 on top of P 3 , shown in Figure S1. These spatial considerations do, in turn, affect the electronic structure, as they are defined by orbital overlap. A vacancy that best “fits” the larger Pt cluster along with the pyridinic defects might be more advantageous in creating for stability.
Herein, by introducing P t 4 , E D i s can be evaluated alongside to E A d s , as another axis of measuring these electronic interactions. E D i s examines the propensity for a Pt atom of the Pt cluster to detach from the cluster when nucleated to the support. In G G , E D i s decreases, meaning the Pt would detach from the cluster with less required energy. Meanwhile, in G P , E D i s increases, meaning the Pt would detach from the cluster with more required energy, with the exception of P 4 . This overall trend between graphitic and pyridinic defects would be worthwhile to confirm experimentally with N-doped supported Pt clusters tested with electrochemical cycling. A higher E D i s is desired to maintain the structural integrity and stability of the cluster as the overall amount of reactive surface area would be preserved. In G G , going from P 3 to P 3 G , E D i s does not change by more than 0.03 eV. This minimal change implies that graphitic defect[s] does not significantly affect the E D i s when N-doping is already present. The P 4 has worsened dissolution due to its difference in structure from P 3 . Charge transfer and electronic structure have been used again to explain these dissolution relations.
With the introduction of other Pt atoms, there are other metrics to supplement and analyze how the d orbitals are rearranged and are translated to other properties. P t 4 ’s BL and CN are also reported separately for P t i and P t b . In G G , the BL lengthens for P t i and decreases for G P when compared to ∅. However, these lengths are within the standard deviations and may not be significant. The BL with the P t b remains consistent in G G but increases in G P when compared to ∅. The CN remains 3.00 across P t i and P t b in confirming no large geometric change with the P t 4 cluster and the observed effects are electronic. The ϵ f for P t 4 is increased from the ∅ in all defect cases. Furthermore, the same trend seen in P t 1 with ϵ d is also evident in P t 4 as it decreases across defects and to a larger degree in G P . The ϵ w trend with P t 1 is shared with P t 4 as well, reinforcing the correlations made with these metrics to Pt stabilization even in the presence of a representative bulk phase.
Generally, the Bader charges and charge difference plots are similar to their P t 1 counterparts with one difference, shown in Figures S1 and S2. Across all defects, the N atoms gain electronic density as the P t 1 and their electronic distributions remain fairly consistent between corresponding defects of P t 1 and P t 4 . However, the major difference is that with more than one Pt atom, the P t i loses more electronic density, with the P t b observed to gain some of that electronic density.
pDOS plots were also created for the P t 4 cluster across these defects, shown in Figure S3, in examining the P t i states with N states. With ∅, there are now lower energy states present from bonding with P t b . G G ’s pDOS are essentially very similar to the ∅’s pDOS with the exception that there are less available states from Pt’s d and s orbitals to pass the ϵ f . However, there are now unoccupied p orbitals in place of those s orbitals. There are N p z states right above the ϵ f , showing that the additional electron is still delocalized and participating in the Pt’s stabilization, leaving those states for possible occupation. The lack of P t i ’s s orbital occupation explains the generally lower E A d s , as the electronic promotion to the Pt’s s orbital is not accessible anymore for G G with the P t b . The addition of a bulk phase presents that Pt SACs develops more stabilizing interactions in absence of a bulk phase but ones that are still representative enough to convey the extent of stability from N-doping with the G G . G P with P t 4 pDOS are similar to that of P t 1 pDOS as they have those matching lower energy states that display occupation of the pyridinic defects’ s p 2 and p z states. The pDOS presents that N atoms are taking electron density from Pt.
Outside of the states to be expect from the addition of Pt “bulk”, there were only minor effects on the electronic structures of the Pt with the N-doped supports. Overall, G G and G P behaved in the same manner as if they were P t 1 . This largely provided validity to the extrapolation of supported larger-sized catalyst stability from SAC-based calculations. The observed minor effects may be altered with the changes to the Pt’s catalyst composition and shape. The geometries chosen in this study were intentionally selected to best study the structure–property relations vide supra. The application of ϵ d and ϵ w to DOS may be a viable initial judgment of E A d s and E D i s as two descriptors of catalytic stability. For example, the graphitic defect does weakens the P t i and P t b bonding strength, with the extra electron possibly affecting the distribution of d-orbitals states between the Pt atoms, in turn affecting E D i s .

3.3. Larger Platinum Nanocluster

The extension of the bulk phase from P t 4 to P t 13 maintains the preservation of stability behavior from P t 1 . Figures S1–S3 display the same electronic characteristics between the P t i and the N-doped support with the inclusions of the additional Pt atoms present in P t 13 interacting with P t i . Figure 6 and Figure 7 present the pDOS for the P t b of P t 4 and P t 13 . Overall, when comparing P t b ’s s-, p-, and d-orbital states between the defects and ∅, the occupation remains fairly consistent with very minor energetic shifts. G P does have more significant shifts in their pDOS but that can be attributed to the inherent difference in behavior between G G and G P , as shown with P t 1 and P t 4 . It is noted that the P t 13 in G P does go under geometric changes, quantitatively shown below in Table 5 with the lower CN and deviated BL. This alludes that G P may have the capacity to alter Pt clusters’ geometries with how their MOA works. Even so, the overall electronic structure remains mostly invariant within G P . Since P t b remains mostly unchanged, previous Pt reactivity is maintained but with increased stability on the support from N-doping.
Table 5 shares the same metrics for P t 13 as P t 4 and the trends found with P t 1 and P t 4 are also observed here. E A d s increases from the ∅ with N-doping and E D i s decrease in G G while it increases in G P compared to ∅. Important relative trends are also preserved with P t 13 where for E A d s , G 2 and G 2 are greater than G and G 2 is greater than G 2 . For G P ’s E A d s , P 3 ’s is greater than P 3 G ’s. In terms of E D i s , G G is less than ∅ but not by much, while all of G P is greater than ∅. ϵ f for all defects is greater than the ∅ but E d , ϵ d , and ϵ w are shown to be dependent on whether the defect is part of G G or G P . For E d , G G has values greater, while G P has values lesser than ∅. For ϵ d , G G has values less than but very close to ∅, while G P has values that are significantly less than ∅. For ϵ w , G G has values greater than, but again, very close to ∅, while G P ’s values are significantly greater than ∅. In evaluating those three metrics, G P has it d orbital related states lower in energy, explaining the greater E A d s and greater ϵ w , as its antibonding orbitals are further away from its ϵ d with the lower energetic interactions. For G G , the d-orbital state distribution remains relatively unchanged as the graphitic defects simply occupied previously unfilled states for its stabilization.
These d-orbital states are shown to be definitive of how the Pt interacts with the defect on the support. Correlations, then, between the E A d s and E D i s and the ϵ d and ϵ w are examined (Figure 8). For E A d s , Figure 8’s plots show that there may be a correlation between E A d s and both ϵ d and ϵ w . It is reinforced even with the larger Pt nanoclusters that there is a relation between E A d s and ϵ d . Generally, it is observed that with increased ϵ d or ϵ w , E A d s is greater in all Pt cluster cases. Furthermore, the plots support that the ϵ d and ϵ w of the Pt are dictated by the type of defect (graphitic or pyridinic) that it is interacting with. G G and G P are grouped closer to their respective members. There is also a significant gap between ϵ d and ϵ w of G G to G P . In terms of the Pt cluster sizing, P t 1 ’s correlation of ϵ d and ϵ w to E A d s does generally match when there is a bulk phase added. The exception of P 4 offsets its plot to be more condensed.
For E D i s , both plots are also largely segregated between G G and G P . The plots present that there is no direct correlation between either ϵ d or ϵ w and E D i s , as G G shows lower E D i s with increasing ϵ d and ϵ w . Moreover, the plots show that E D i s is more affected by the presence of a graphitic defect than by ϵ d or ϵ w with the plotting of P 3 G . P 3 G in both P t 4 and P t 13 has worse E D i s when its ϵ d and ϵ w are greater than the G G or around equivalent to the ϵ d and ϵ w of P 3 . It is also noticed that ϵ d and ϵ w are closely correlated to each other.
Figure 9 presents the correlation of E A d s to E D i s for P t 4 and P t 13 . There is no direct correlation between E A d s and E D i s but it is seen that G G and G P are separated at different amounts of bulk Pt atoms. The defects are also spaced relatively the same between each other for P t 4 and P t 13 . The plot again reinforces overall trends from the defects and the distinction between G G and G P . E A d s increases with N-doping but G P gives enhanced resistance to dissolution while the G G gives worse resistance to dissolution. The relative trends between defects for E A d s are not matched with E D i s .

4. Conclusions

While synthetic selectivity for the designed defects presented here is not completely feasible, the study offered insights in evaluating Pt stability with graphitic and pyridinic defects-containing carbon supports. The study reinforced that N-doping increased E A d s but further explored unique subtleties between the graphitic and pyridinic defects found with N-doping in a cohesive examination. It was supported that G G and G P behaved differently to each other in their MOA and stability. With G G , the data implied that more graphitic defects optimally placed would enhanced Pt’s stability. G P was shown to have greater stability than G G but would be negatively affected if there was a nearby graphitic defect. Furthermore, these trends were preserved when the calculations were performed with P t 4 and P t 13 metal clusters. This provides confidence in drawing conclusions about larger-sized catalytic clusters and even nanoparticles for SAC-based studies. It was also concluded that the d orbitals of P t i participate in interaction with the carbon support while not significantly affecting the orbitals of P t b . Charge transfer does occur between Pt and the support but electronic reorganization is still definitive of the metal–support interactions only allowed by the electronegativity of N atoms on the flexibility of the carbon support. Overall, an evaluation of different Pt catalysts sizes found similar theoretical electronic structures among N-doped defects to confirm applicable N-doping considerations.

Supplementary Materials

The following supporting information can be downloaded at: https://www.mdpi.com/article/10.3390/catal15070635/s1.

Author Contributions

Conceptualization, V.N.; methodology, V.N.; software, V.N.; validation, V.N., S.V.; formal analysis, V.N.; investigation, V.N.; resources, S.V.; data curation, V.N.; writing—original draft preparation, V.N.; writing—review and editing, V.N., S.V.; visualization, V.N.; supervision, S.V.; project administration, S.V.; funding acquisition, S.V. All authors have read and agreed to the published version of the manuscript.

Funding

This work was funded by the National Science Foundation (CHE-1800585) and supported by the high-performance computing facility at the Colorado School of Mines.

Data Availability Statement

All data will be made available as published and as requested through the corresponding author’s contacts.

Acknowledgments

The work was performed between two of the affiliated institutions and we acknowledge both institutions.

Conflicts of Interest

The authors declare no conflicts of interest.

Abbreviations

The following abbreviations are used in this manuscript:
pDOSPartial Density of States
MOAMode of Adsorption
BLBond Length
CNCoordination Number

References

  1. Kaiser, S.K.; Chen, Z.; Faust Akl, D.; Mitchell, S.; Pérez-Ramírez, J. Single-Atom Catalysts across the Periodic Table. Chem. Rev. 2020, 120, 11703–11809. [Google Scholar] [CrossRef] [PubMed]
  2. Zhuo, H.Y.; Zhang, X.; Liang, J.X.; Yu, Q.; Xiao, H.; Li, J. Theoretical Understandings of Graphene-based Metal Single-Atom Catalysts: Stability and Catalytic Performance. Chem. Rev. 2020, 120, 12315–12341. [Google Scholar] [CrossRef] [PubMed]
  3. Nakatsuka, K.; Yoshii, T.; Kuwahara, Y.; Mori, K.; Yamashita, H. Controlled synthesis of carbon-supported Co catalysts from single-sites to nanoparticles: Characterization of the structural transformation and investigation of their oxidation catalysis. Phys. Chem. Chem. Phys. 2017, 19, 4967–4974. [Google Scholar] [CrossRef] [PubMed]
  4. Zhou, M.; Zhang, A.; Dai, Z.; Zhang, C.; Feng, Y.P. Greatly enhanced adsorption and catalytic activity of Au and Pt clusters on defective graphene. J. Chem. Phys. 2010, 132, 194704. [Google Scholar] [CrossRef]
  5. Yumura, T.; Awano, T.; Kobayashi, H.; Yamabe, T. Platinum clusters on vacancy-type defects of nanometer-sized graphene patches. Molecules 2012, 17, 7941–7960. [Google Scholar] [CrossRef]
  6. Shao, Y.; Yin, G.; Gao, Y. Understanding and approaches for the durability issues of Pt-based catalysts for PEM fuel cell. J. Power Sources 2007, 171, 558–566. [Google Scholar] [CrossRef]
  7. Alia, S.M.; Ngo, C.; Shulda, S.; Ha, M.A.; Dameron, A.A.; Weker, J.N.; Neyerlin, K.C.; Kocha, S.S.; Pylypenko, S.; Pivovar, B.S. Exceptional Oxygen Reduction Reaction Activity and Durability of Platinum-Nickel Nanowires through Synthesis and Post-Treatment Optimization. ACS Omega 2017, 2, 1408–1418. [Google Scholar] [CrossRef]
  8. Holme, T.; Zhou, Y.; Pasquarelli, R.; O’Hayre, R. First principles study of doped carbon supports for enhanced platinum catalysts. Phys. Chem. Chem. Phys. 2010, 12, 9461–9468. [Google Scholar] [CrossRef]
  9. Marshall-Roth, T.; Libretto, N.J.; Wrobel, A.T.; Anderton, K.J.; Pegis, M.L.; Ricke, N.D.; Voorhis, T.V.; Miller, J.T.; Surendranath, Y. A pyridinic Fe-N4 macrocycle models the active sites in Fe/N-doped carbon electrocatalysts. Nat. Commun. 2020, 11, 5283. [Google Scholar] [CrossRef]
  10. Zhao, L.; He, R.; Rim, K.T.; Schiros, T.; Kim, K.S.; Zhou, H.; Gutiérrez, C.; Chockalingam, S.P.; Arguello, C.J.; Pálová, L.; et al. Visualizing individual nitrogen dopants in monolayer graphene. Science 2011, 333, 999–1003. [Google Scholar] [CrossRef]
  11. Rangel, E.; Magana, L.F.; Sansores, L.E. A theoretical study of the interaction of hydrogen and oxygen with palladium or gold adsorbed on pyridine-like nitrogen-doped graphene. ChemPhysChem 2014, 15, 4042–4048. [Google Scholar] [CrossRef]
  12. Xin, L.; Yang, F.; Rasouli, S.; Qiu, Y.; Li, Z.F.; Uzunoglu, A.; Sun, C.J.; Liu, Y.; Ferreira, P.; Li, W.; et al. Understanding Pt Nanoparticle Anchoring on Graphene Supports through Surface Functionalization. ACS Catal. 2016, 6, 2642–2653. [Google Scholar] [CrossRef]
  13. Antolini, E. Graphene as a new carbon support for low-temperature fuel cell catalysts. Appl. Catal. Environ. 2012, 123, 52–68. [Google Scholar] [CrossRef]
  14. Artyushkova, K.; Serov, A.; Rojas-Carbonell, S.; Atanassov, P. Chemistry of Multitudinous Active Sites for Oxygen Reduction Reaction in Transition Metal-Nitrogen-Carbon Electrocatalysts. J. Phys. Chem. C 2015, 119, 25917–25928. [Google Scholar] [CrossRef]
  15. Singh, S.K.; Takeyasu, K.; Nakamura, J. Active Sites and Mechanism of Oxygen Reduction Reaction Electrocatalysis on Nitrogen-Doped Carbon Materials. Adv. Mater. 2019, 31, 1804297. [Google Scholar] [CrossRef]
  16. Campisi, S.; Chan-Thaw, C.E.; Villa, A. Understanding heteroatom-mediated metal-support interactions in functionalized carbons: A perspective review. Appl. Sci. 2018, 8, 1159. [Google Scholar] [CrossRef]
  17. Meng, Y.; Huang, X.; Lin, H.; Zhang, P.; Gao, Q.; Li, W. Carbon-Based Nanomaterials as Sustainable Noble-Metal-Free Electrocatalysts. Front. Chem. 2019, 7, 759. [Google Scholar] [CrossRef]
  18. Han, H.; Noh, Y.; Kim, Y.; Park, S.; Yoon, W.; Jang, D.; Choi, S.M.; Kim, W.B. Selective electrochemical CO2 conversion to multicarbon alcohols on highly efficient N-doped porous carbon-supported Cu catalysts. Green Chem. 2020, 22, 71–84. [Google Scholar] [CrossRef]
  19. Dzara, M.J.; Artyushkova, K.; Shulda, S.; Strand, M.B.; Ngo, C.; Crumlin, E.J.; Gennett, T.; Pylypenko, S. Characterization of Complex Interactions at the Gas-Solid Interface with in Situ Spectroscopy: The Case of Nitrogen-Functionalized Carbon. J. Phys. Chem. C 2019, 123, 9074–9086. [Google Scholar] [CrossRef]
  20. Xu, Y.; Dzara, M.J.; Kabir, S.; Pylypenko, S.; Neyerlin, K.; Zakutayev, A. X-ray photoelectron spectroscopy and rotating disk electrode measurements of smooth sputtered Fe-N-C films. Appl. Surf. Sci. 2020, 515, 146012. [Google Scholar] [CrossRef]
  21. Martinez, U.; Komini Babu, S.; Holby, E.F.; Zelenay, P. Durability challenges and perspective in the development of PGM-free electrocatalysts for the oxygen reduction reaction. Curr. Opin. Electrochem. 2018, 9, 224–232. [Google Scholar] [CrossRef]
  22. Ramos-Sanchez, G.; Praserthdam, S.; Godinez-Salomon, F.; Barker, C.; Moerbe, M.; Calderon, H.A.; Lartundo, L.A.; Leyva, M.A.; Solorza-Feria, O.; Balbuena, P.B. Challenges of modelling real nanoparticles: Ni@Pt electrocatalysts for the oxygen reduction reaction. Phys. Chem. Chem. Phys. 2015, 17, 28286–28297. [Google Scholar] [CrossRef] [PubMed]
  23. Chen, B.W.; Xu, L.; Mavrikakis, M. Computational Methods in Heterogeneous Catalysis. Chem. Rev. 2021, 121, 1007–1048. [Google Scholar] [CrossRef] [PubMed]
  24. Pylypenko, S.; Borisevich, A.; More, K.L.; Corpuz, A.R.; Holme, T.; Dameron, A.A.; Olson, T.S.; Dinh, H.N.; Gennett, T.; O’Hayre, R. Nitrogen: Unraveling the secret to stable carbon-supported Pt-alloy electrocatalysts. Energy Environ. Sci. 2013, 6, 2957–2964. [Google Scholar] [CrossRef]
  25. Calle-Vallejo, F.; Martínez, J.I.; Rossmeisl, J. Density functional studies of functionalized graphitic materials with late transition metals for oxygen reduction reactions. Phys. Chem. Chem. Phys. 2011, 13, 15639–15643. [Google Scholar] [CrossRef]
  26. Hossain, M.D.; Liu, Z.; Zhuang, M.; Yan, X.; Xu, G.L.; Gadre, C.A.; Tyagi, A.; Abidi, I.H.; Sun, C.J.; Wong, H.; et al. Rational Design of Graphene-Supported Single Atom Catalysts for Hydrogen Evolution Reaction. Adv. Energy Mater. 2019, 9, 1803689. [Google Scholar] [CrossRef]
  27. Kropp, T.; Mavrikakis, M. Transition Metal Atoms Embedded in Graphene: How Nitrogen Doping Increases CO Oxidation Activity. ACS Catal. 2022, 58, 24. [Google Scholar] [CrossRef]
  28. Nguyen, V.; Etz, B.D.; Pylypenko, S.; Vyas, S. Periodic Trends behind the Stability of Metal Catalysts Supported on Graphene with Graphitic Nitrogen Defects. ACS Omega 2021, 6, 28215–28228. [Google Scholar] [CrossRef]
  29. Perazzolo, V.; Brandiele, R.; Durante, C.; Zerbetto, M.; Causin, V.; Rizzi, G.A.; Cerri, I.; Granozzi, G.; Gennaro, A. Density Functional Theory (DFT) and Experimental Evidences of Metal-Support Interaction in Platinum Nanoparticles Supported on Nitrogen- and Sulfur-Doped Mesoporous Carbons: Synthesis, Activity, and Stability. ACS Catal. 2018, 8, 1122–1137. [Google Scholar] [CrossRef]
  30. Myshlyavtsev, A.V.; Stishenko, P.V.; Svalova, A.I. A systematic computational study of the structure crossover and coordination number distribution of metallic nanoparticles. Phys. Chem. Chem. Phys. 2017, 19, 17895–17903. [Google Scholar] [CrossRef]
  31. Kong, F.; Ren, Z.; Norouzi Banis, M.; Du, L.; Zhou, X.; Chen, G.; Zhang, L.; Li, J.; Wang, S.; Li, M.; et al. Active and Stable Pt-Ni Alloy Octahedra Catalyst for Oxygen Reduction via Near-Surface Atomical Engineering. ACS Catal. 2020, 10, 4205–4214. [Google Scholar] [CrossRef]
  32. Imaoka, T.; Toyonaga, T.; Morita, M.; Haruta, N.; Yamamoto, K. Isomerizations of a Pt4 cluster revealed by spatiotemporal microscopic analysis. Chem. Commun. 2019, 55, 4753–4756. [Google Scholar] [CrossRef] [PubMed]
  33. Lou, Y.; Xu, J.; Zhang, Y.; Pan, C.; Dong, Y.; Zhu, Y. Metal-support interaction for heterogeneous catalysis: From nanoparticles to single atoms. Mater. Today Nano 2020, 12, 100093. [Google Scholar] [CrossRef]
  34. Aprà, E.; Fortunelli, A. Density-functional calculations on platinum nanoclusters: Pt 13, Pt 38, and Pt 55. J. Phys. Chem. A 2003, 107, 2934–2942. [Google Scholar] [CrossRef]
  35. Demiroglu, I.; Yao, K.; Hussein, H.A.; Johnston, R.L. DFT Global Optimization of Gas-Phase Subnanometer Ru-Pt Clusters. J. Phys. Chem. C 2017, 121, 10773–10780. [Google Scholar] [CrossRef]
  36. Parreira, R.L.; Caramori, G.F.; Galembeck, S.E.; Huguenin, F. The nature of the interactions between Pt4 cluster and the adsorbates H, OH, and H2O. J. Phys. Chem. A 2008, 112, 11731–11743. [Google Scholar] [CrossRef]
  37. Gao, Z.; Li, A.; Liu, X.; Ma, C.; Li, X.; Yang, W.; Ding, X. Density functional study of the adsorption of NO on Ni n (n = 1, 2, 3 and 4) clusters doped functionalized graphene support. Appl. Surf. Sci. 2019, 481, 940–950. [Google Scholar] [CrossRef]
  38. Henkelman, G.; Arnaldsson, A.; Jónsson, H. A fast and robust algorithm for Bader decomposition of charge density. Comput. Mater. Sci. 2006, 36, 354–360. [Google Scholar] [CrossRef]
  39. Giannozzi, P.; Andreussi, O.; Brumme, T.; Bunau, O.; Nardelli, M.B.; Calandra, M.; Car, R.; Cavazzoni, C.; Ceresoli, D.; Cococcioni, M.; et al. Quantum Espresso. 2017. Available online: https://iopscience.iop.org/article/10.1088/1361-648X/aa8f79 (accessed on 20 March 2025).
  40. Giannozzi, P.; Baroni, S.; Bonini, N.; Calandra, M.; Car, R.; Cavazzoni, C.; Ceresoli, D.; Chiarotti, G.L.; Cococcioni, M.; Dabo, I.; et al. Quantum Espresso. 2009. Available online: https://iopscience.iop.org/article/10.1088/0953-8984/21/39/395502 (accessed on 20 March 2025). [CrossRef]
  41. Perdew, J.P.; Burke, K.; Ernzerhof, M. Generalized gradient approximation made simple. Phys. Rev. Lett. 1996, 77, 3865–3868. [Google Scholar] [CrossRef]
  42. Nguyen, V.T.; Fitzgerald, M.A.; Ibbotson, D.; Foster, J.; Dzara, M.J.; Zaccarine, S.F.; Vyas, S.; Pylypenko, S. Effects of Graphitic and Pyridinic Nitrogen Defects on Transition Metal Nucleation and Nanoparticle Formation on N-Doped Carbon Supports: Implications for Catalysis. ACS Appl. Nano Mater. 2022, 5, 14922–14933. [Google Scholar] [CrossRef]
  43. Methfessel, M.; Paxton, A.T. High-precision sampling for Brillouin-zone integration in metals. Phys. Rev. B 1989, 40, 3616. [Google Scholar] [CrossRef] [PubMed]
  44. Monkhorst, H.J.; Pack, J.D. Special points for Brillouin-zone integrations. Phys. Rev. B 1976, 13, 5188. [Google Scholar] [CrossRef]
  45. Sohier, T.; Calandra, M.; Mauri, F. Density functional perturbation theory for gated two-dimensional heterostructures: Theoretical developments and application to flexural phonons in graphene. Phys. Rev. B 2017, 96, 075448. [Google Scholar] [CrossRef]
  46. Wood, K.N.; O’Hayre, R.; Pylypenko, S. Recent progress on nitrogen/carbon structures designed for use in energy and sustainability applications. Energy Environ. Sci. 2014, 7, 1212–1249. [Google Scholar] [CrossRef]
  47. Vojvodic, A.; Nørskov, J.K.; Abild-Pedersen, F. Electronic structure effects in transition metal surface chemistry. Top. Catal. 2014, 57, 25–32. [Google Scholar] [CrossRef]
  48. Inoǧlu, N.; Kitchin, J.R. Simple model explaining and predicting coverage-dependent atomic adsorption energies on transition metal surfaces. Phys. Rev. B-Condens. Matter Mater. Phys. 2010, 82, 045414. [Google Scholar] [CrossRef]
  49. Sanville, E.; Kenny, S.D.; Smith, R.; Henkelman, G. Improved grid-based algorithm for Bader charge allocation. J. Comput. Chem. 2007, 28, 899–908. [Google Scholar] [CrossRef]
  50. Matanovic, I.; Artyushkova, K.; Strand, M.B.; Dzara, M.J.; Pylypenko, S.; Atanassov, P. Core Level Shifts of Hydrogenated Pyridinic and Pyrrolic Nitrogen in the Nitrogen-Containing Graphene-Based Electrocatalysts: In-Plane vs Edge Defects. J. Phys. Chem. C 2016, 120, 29225–29232. [Google Scholar] [CrossRef]
  51. Chen, Y.; Ji, S.; Chen, C.; Peng, Q.; Wang, D.; Li, Y. Single-Atom Catalysts: Synthetic Strategies and Electrochemical Applications. Joule 2018, 2, 1242–1264. [Google Scholar] [CrossRef]
  52. Muhich, C.L.; Westcott, J.Y.; Morris, T.C.; Weimer, A.W.; Musgrave, C.B. The effect of N and B doping on graphene and the adsorption and migration behavior of Pt atoms. J. Phys. Chem. C 2013, 117, 10523–10535. [Google Scholar] [CrossRef]
  53. Groves, M.N.; Chan, A.S.; Malardier-Jugroot, C.; Jugroot, M. Improving platinum catalyst binding energy to graphene through nitrogen doping. Chem. Phys. Lett. 2009, 481, 214–219. [Google Scholar] [CrossRef]
  54. Usachov, D.; Vilkov, O.; Grüneis, A.; Haberer, D.; Fedorov, A.; Adamchuk, V.K.; Preobrajenski, A.B.; Dudin, P.; Barinov, A.; Oehzelt, M.; et al. Nitrogen-doped graphene: Efficient growth, structure, and electronic properties. Nano Lett. 2011, 11, 5401–5407. [Google Scholar] [CrossRef] [PubMed]
  55. Wickramaratne, N.P.; Xu, J.; Wang, M.; Zhu, L.; Dai, L.; Jaroniec, M. Nitrogen enriched porous carbon spheres: Attractive materials for supercapacitor electrodes and CO2 adsorption. Chem. Mater. 2014, 26, 2820–2828. [Google Scholar] [CrossRef]
Figure 1. The top portion of the figure displays the seven defect types used within the carbon support, where the gray and blue spheres are carbon and nitrogen atoms, respectively. The notation for each defect type are as follows: G denotes that the defect type includes a graphitic defect and P denotes the inclusion of a pyrdinic defect. The subscript denotes the quantity of such defect while other symbols are as follows: ∅ is for undoped (no defect) support and ‡ is for an alternative arrangement of a that defect combination. For example, G represents a carbon atom being replaced with a nitrogen atom and G2 represents two of those replacements, presented in two different configurations. P presents the same substitution but with another atom of carbon lattice removed such that the P can be unattached from the carbon lattice. The bottom portion displays the geometry for the P t 4 (in a tetrahedral geometry) and P t 13 (in a isosahedron geometry), where the blue spheres are Pt atoms. The one-atom Pt cluster is a just a Pt atom.
Catalysts 15 00635 g001
Figure 2. Charge difference density plots for singular Pt atom over the seven different defects of ∅, G, G 2 , G 2 , P 3 , P 3 G , and P 4 . The blue and red gradient-matched isosurfaces represent an increase and decrease in electronic density, respectively (isovalue = 0.01 a.u.). The densities change around the Pt atom, above and below, and along the surrounding carbon atoms of the support. The gray, green, and purple spheres represent carbon, nitrogen, and platinum, respectively. The defects have been spliced together to appear to be on a single support.
Catalysts 15 00635 g002
Figure 3. The pDOS plot for singular Pt atom with the ∅ defect support. The black vertical dotted line denotes the ϵ f , which the other energy values have been normalized to. The colored lines are the pDOS for the atoms (C is included in the ∅ to provide a sense in how the C is interacting with the Pt; it can be seen that a majority of the overlapping states with the Pt comprise mostly of C’s p z orbitals). Some lines are dotted for visibility. The key denotes the corresponding pDOS per color where Pt’s is blue, P t d z 2 ’s is red, P t d x z ’s is orange, P t d y x ’s is pink, P t d x 2 y 2 ’s is light pink, P t x y ’s is yellow, P t s ’s is light blue, the carbons’ are purple, and the carbons’ pz is dotted purple.
Catalysts 15 00635 g003
Figure 4. The pDOS plots for Pt with G G : (a) is G, (b) is G 2 , and (c) is G 2 . The plots are formatted with the same parameters as in Figure 3, including the coloring, where nitrogen and its orbitals are added as solid and dotted green lines, respectively.
Catalysts 15 00635 g004
Figure 5. The pDOS plots for Pt with G P : (a) is P 3 , (b) is P 3 G , and (c) is P 4 . The plots are formatted with the same parameters as in Figure 3, including different shading now while retaining the previous aforementioned coloring for Pt’s and N’s p orbitals.
Catalysts 15 00635 g005
Figure 6. The pDOS plots for P t b in P t 4 over the seven defects. The top plot displays the pDOS for Pt’s collective d orbitals. The vertical line represents the respective ϵ f for each defect. The bottom plot does the same except for Pt’s collective s and p orbitals. The coloring for the defects have been assigned where ∅ is red, G is orange, G 2 is yellow, G 2 is green, P 3 is blue, P 3 G is blue, and P 4 is pink.
Catalysts 15 00635 g006
Figure 7. The pDOS plots for P t b in P t 13 over the seven defects. The figure is formatted as in Figure 6, as is the coloring for the defects.
Catalysts 15 00635 g007
Figure 8. Correlation plots between the E A d s and E D i s and the ϵ d and ϵ w for the Pt clusters over the seven defects. All values for those four metrics have been transformed such that ∅ is at the origin and normalized against the maximum value per metric and Pt cluster size. The points are color-coordinated to the Pt cluster size (where P t 1 is red, P t 4 is green, and P t 1 3 is blue) and shape-coordinated to the specific defect type (where ∅ is a cross, G is a plus sign, G 2 is triangle, G 2 is a delta sign, P 3 is a square, P 3 G is a pentagon, and P 4 is a diamond.) as denoted by the keys located in the top-left plot. The plots have additional labeling in showing the significance in the directionality of the axes.
Catalysts 15 00635 g008
Figure 9. Correlation plots between E A d s and E D i s for the Pt clusters over the seven defects, with formatting, coloring, and shapes as in Figure 8.
Catalysts 15 00635 g009
Table 1. The E A d s and MOA of Pt atom over the select defect in the nitrogen-doped carbon support.
DefectG G 2 G 2 P 3 P 3 G P 4
E Ads (eV)−1.85−2.26−2.81−2.51−3.13−2.70−8.06
MOACCCCCCCCVVV
Table 2. The Bader charges for the Pt and N atom[s] over the seven defects. The numbers are in a.u.
Bader ChargeG G 2 G 2 P 3 P 3 G P 4
Pt0.04−0.03−0.10−0.100.500.381.06
N#1−0.58−0.67−0.60−0.56−0.54−0.50
N#2−0.17−0.63−0.53−0.55−0.55
N#3−0.53−0.95−0.55
N#4−0.68−0.51
Table 3. The quantitative values for the pDOS plots of the Pt over the seven doped supports. It presents the Fermi energy ϵ f , d-band centroid E d , d-band center ϵ d , and and d-band width ϵ w . The numbers are in eV.
DefectsG G 2 G 2 P 3 P 3 G P 4
ϵ f −2.44−2.32−2.27−2.21−2.54−2.24−2.35
E d −3.80−3.78−3.88−3.76−4.39−3.92−4.93
ϵ d −1.36−1.46−1.61−1.55−1.85−1.68−2.58
ϵ w 1.051.091.141.101.291.161.90
Table 4. Calculated values are shown for P t 4 cluster across the seven defects. P t i refers to the Pt atom of the cluster that is directly interacting with the doped support while P t b refers to all the other Pt atoms of the cluster. The bonds of P t i are with the coordinated Pt atoms from P t b while the bonds of P t b are just between each other. The coordination number is determined by counting all the other Pt atoms within 3 Å for a Pt atom.
DefectsG G 2 G 2 P 3 P 3 G P 4
E Ads −1.82−2.10−2.38−2.30−5.04−4.42−4.47
E Dis 4.124.014.044.034.484.454.08
Average Bond
Length of Pt i (Å)
2.61 ± 0.022.62 ± 0.022.64 ± 0.052.63 ± 0.022.57 ± 0.032.54 ± 0.012.58 ± 0.01
Coordination Number
of Pt i (Å)
3.003.003.003.003.003.003.00
Average Bond Length
Between Pt b (Å)
2.56 ± 0.002.56 ± 0.002.56 ± 0.012.56 ± 0.012.59± 0.002.59 ± 0.012.58 ± 0.01
Average Coordination
Number of Pt b (Å)
3.00 ± 0.003.00 ± 0.003.00 ± 0.003.00 ± 0.003.00 ± 0.003.00 ± 0.003.00 ± 0.00
ϵ f −2.37−2.21−2.13−2.08−2.07−2.01−2.27
E d −4.11−3.97−3.89−3.88−4.09−4.00−4.15
ϵ d −1.74−1.76−1.76−1.80−2.02−1.99−1.88
ϵ w 1.371.381.381.391.441.441.42
Table 5. Calculated values are shown for P t 13 cluster across the seven defects. The table is formatted as Table 4. All the energies reported here are in eV.
DefectsG G 2 G 2 P 3 P 3 G P 4
E Ads −2.03−2.39−2.82−2.65−6.83−6.19−8.75
E Dis 4.664.624.584.605.276.084.98
Average Bond
Length of Pt i (Å)
2.80 ± 0.092.80 ± 0.082.79 ± 0.082.80 ± 0.082.58 ± 0.022.67 ± 0.102.77
Coordination Number
of Pt i (Å)
6.006.006.006.003.004.001.00
Average Bond Length
Between Pt b (Å)
2.72 ± 0.072.72 ± 0.072.72 ± 0.072.72 ± 0.072.64 ± 0.072.65 ± 0.062.65 ± 0.08
Average Coordination
Number of Pt b (Å)
6.00 ± 0.006.00 ± 0.006.00 ± 0.006.00 ± 0.004.36 ± 1.124.91 ± 0.544.73 ± 0.90
ϵ f −2.23−2.07−1.98−1.94−1.94−1.97−1.98
E d −4.01−3.87−3.80−3.76−4.14−4.17−4.20
ϵ d −1.78−1.80−1.82−1.82−2.20−2.20−2.22
ϵ w 1.461.471.481.481.661.711.69
Disclaimer/Publisher’s Note: The statements, opinions and data contained in all publications are solely those of the individual author(s) and contributor(s) and not of MDPI and/or the editor(s). MDPI and/or the editor(s) disclaim responsibility for any injury to people or property resulting from any ideas, methods, instructions or products referred to in the content.

