Article

Stability of an Ultra-Low-Temperature Water–Gas Shift Reaction SILP Catalyst

Chair of Chemical Engineering, Center of Energy Technology, University of Bayreuth, 95447 Bayreuth, Germany
*
Author to whom correspondence should be addressed.
Catalysts 2025, 15(6), 602; https://doi.org/10.3390/catal15060602
Submission received: 13 May 2025 / Revised: 11 June 2025 / Accepted: 14 June 2025 / Published: 18 June 2025
(This article belongs to the Section Catalysis for Sustainable Energy)

Abstract

For PEM fuel cell operation, high-purity hydrogen gas containing only trace amounts of carbon monoxide is a prerequisite. The water–gas shift reaction (WGSR) is an industrially applied mature operation mode to convert CO with H2O into CO2 (making it easy to separate, if necessary) and H2. Since the WGS reaction is an exothermic equilibrium reaction, low temperatures (below 200 °C) lead to full CO conversion. Thus, highly active ultra-low-temperature WGSR catalysts have to be applied. A homogeneous Ru SILP (supported ionic liquid phase) catalyst based on the precursor complex [Ru(CO)3Cl2]2 has been identified to operate at such low temperature levels. However, in a hydrogen rich atmosphere, transition metal complexes are prone to form nanoparticles (NPs) when dissolved in ionic liquids (ILs). In this article, the behavior of an anionic SILP WGSR catalyst, i.e., [Ru(CO)3Cl3] dissolved in [BMMIM]Cl, in an H2-rich CO environment is described. The data reveal that during the WGSR, Ru nanoparticles form in the catalyst when very low CO concentrations are reached. The Ru NPs formation has been confirmed by transmission electron microscopy imaging and X-ray diffraction (XRD).

1. Introduction

Currently, steam reforming of natural gas, i.e., of methane, is the main source of hydrogen production on industrial scale. Thereby, CO is inevitably formed, constituting about 10% by volume of the product stream. A typical gas composition downstream the steam reforming unit on a water-free basis contains hydrogen (56–75%), CO (10–13%) as well as N2 (0.1–22%) and methane CH4 (0.3–4%) and carbon dioxide CO2 (8–11%) [1]. Hence, quantitative removal of CO from the H2-rich gas stream is essential to attain the high purity (CO < 20–250 ppm [2]) required for applications like proton exchange membrane (PEM) fuel cells. Here, the water–gas shift reaction (WGSR) is applied in the chemical industry, since it is a mature process to convert carbon monoxide according to the following reaction:
C O + H 2 O   C O 2 + H 2             H R = 41.2   k J · m o l 1
The thermodynamics of the WGS reaction show that low temperatures shift the equilibrium to the desired right-hand side of the reaction. The challenge is that commercially available low-temperature water–gas shift (LTWGS) catalysts (CuO/ZnO/Al2O3) have a rather low activity when operating below 200 °C [3]; here, the CO content is approximately 3000 ppm at equilibrium conversion [3]. This level far exceeds the permissible limit for fuel cell applications; further processing steps like pressure swing adsorption or membrane processes, e.g., based on Pd membranes [4], methanation, or partial CO oxidation, have to be employed for fine purification of hydrogen-rich gas streams [5]. The limitations of commercial WGSR catalysts at low temperatures provide significant research opportunities to develop catalysts that are highly active at or below 140 °C, i.e., the temperature threshold. Below 140 °C, equilibrium conversion yields the desired ultra-low CO level, enabling continuous PEM operation without further fine purification process steps.
Werner et al. have developed a Ru-based supported ionic liquid phase (SILP) WGSR catalyst that is highly active at this temperature threshold and even outperforms commercially available WGSR catalysts under these low-temperature conditions [3]. The SILP catalyst concept involves immobilization of an ionic liquid, containing the homogeneous catalyst or catalyst precursor, on the inner surface of a highly porous solid support. Here, the dimeric Ru complex [Ru(CO)3Cl2]2 applied by Werner et al. forms the active anionic Ru complex [Ru(CO)3Cl3] through the addition of a chloride ligand provided by a chloride-based ionic liquid. As the IL is present in molar excess, and chloride ligation to the dimer is an equilibrium reaction, surplus chloride increases the amount of the active Ru catalyst, thereby increasing catalytic activity (see Figure S7 in the Supporting Information). Thus, the catalyst is dissolved in the IL and can also be regarded as an IL itself. Furthermore, the extremely low vapor pressure of both ionic liquids stabilizes the catalyst complex (against the formation of volatile Ru carbonyls), whereas the porous support supplies a large (internal) surface area [6,7]. This hybrid approach provides a highly selective catalyst active under mild reaction conditions, and the immobilization allows for easy product separation and enables a simple fixed-bed reactor design [7].
Werner et al. even improved and optimized this catalyst further [8,9,10]. Their best catalyst consists of the ionic liquid [BMMIM]Cl and the anionic catalyst [Ru(CO)3Cl3]. [BMMIM]Cl was chosen due to its stabilizing effect (reduced Ru leaching), as the Ru complex can incorporate chloride and effectively become part of the ionic liquid phase. Additionally, C2 methylation prevents carbene formation, further enhancing stability under basic conditions. Recently, we have shown in a kinetic study that this catalyst exhibits activity even at temperatures below 140 °C and is capable of achieving nearly complete CO conversion (>99.9%) [11]. Furthermore, a favorable start/stop behavior of the SILP catalyst has been observed, indicating its potential use in CO removal upstream of PEM cells for decentralized or mobile fuel cell applications. It has also been demonstrated that the reaction rate and thus the catalytically active complex operate in a stable manner under typical reaction conditions (pCO = 0.1 bar, pH2O = 0.2 bar) after a run-in period [11].
However, it is well known that transition metal complexes dissolved in ionic liquids are prone to forming metal nanoparticles under reducing conditions [12,13,14,15,16]. Here, the ionic liquid primarily serves to stabilize the nanoparticles, preventing Ostwald ripening of the metal NPs [17]. For more details, reviews on nanoparticle formation in ionic liquids given by Dupont et al. [15] and Janiak [17] are recommended. Kratzer et al. studied the hydrogenation of 1-alkenes with homogeneous Rh-based SILP catalysts and described the formation of Rh NPs with time on stream [18]. Their data show that the addition of carbon monoxide increases the stability of the Rh catalyst, but at the expense of catalytic activity. CO stabilizes the Rh complex not only when already present in the Rh complex but also when present in the feed gas; thus, CO stabilizes the Rh complex by ligation. In contrast, SILP hydroformylation catalysts and catalytically active metal complexes in WGSR do not undergo nanoparticle formation, even under similar reducing conditions for olefin hydrogenation, because the CO present as the reactant stabilizes the catalysts. The complexes of Ru and Rh contain at least one CO ligand stabilizing the catalyst. This may explain why Rh SILP catalysts are particularly suitable for hydroformylation [19] and Ru SILP catalysts for WGSR [11]. Hence, the question arises whether the low-temperature SILP WGSR catalyst is stable when there is virtually no CO present, i.e., at a very low CO partial pressure, as desired for the WGSR, and thus reached in the rear part of a fixed-bed reactor.
In this work, the effect of carbon monoxide on the stability of a Ru-based SILP WGSR catalyst is presented; thereby, it was confirmed that the presence of CO in certain amounts is necessary to stabilize the active complex under reducing conditions.

2. Results

This chapter presents the findings gained in this study and combines them with the current literature to identify potential explanations for the observed results.

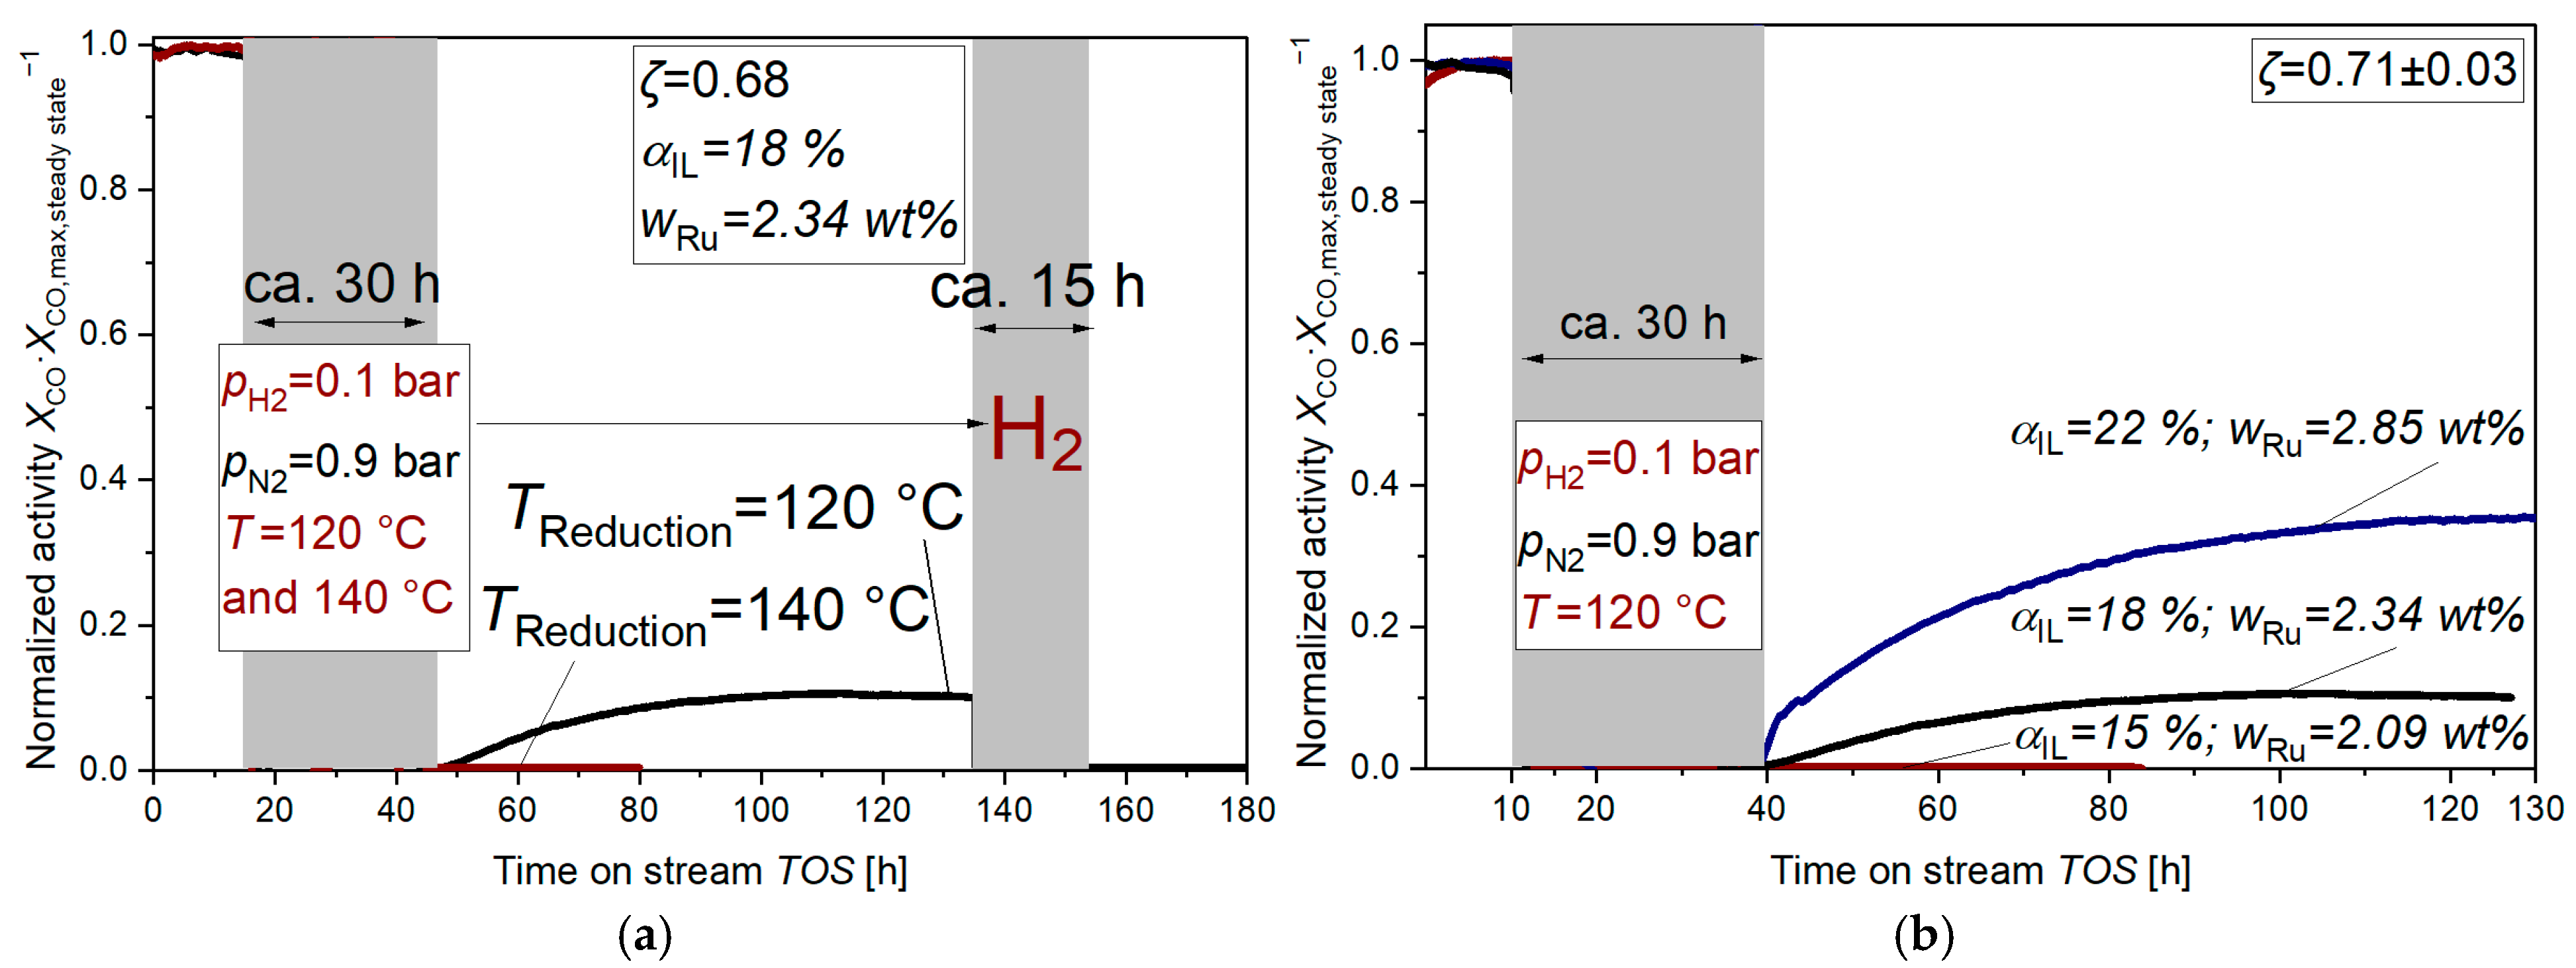
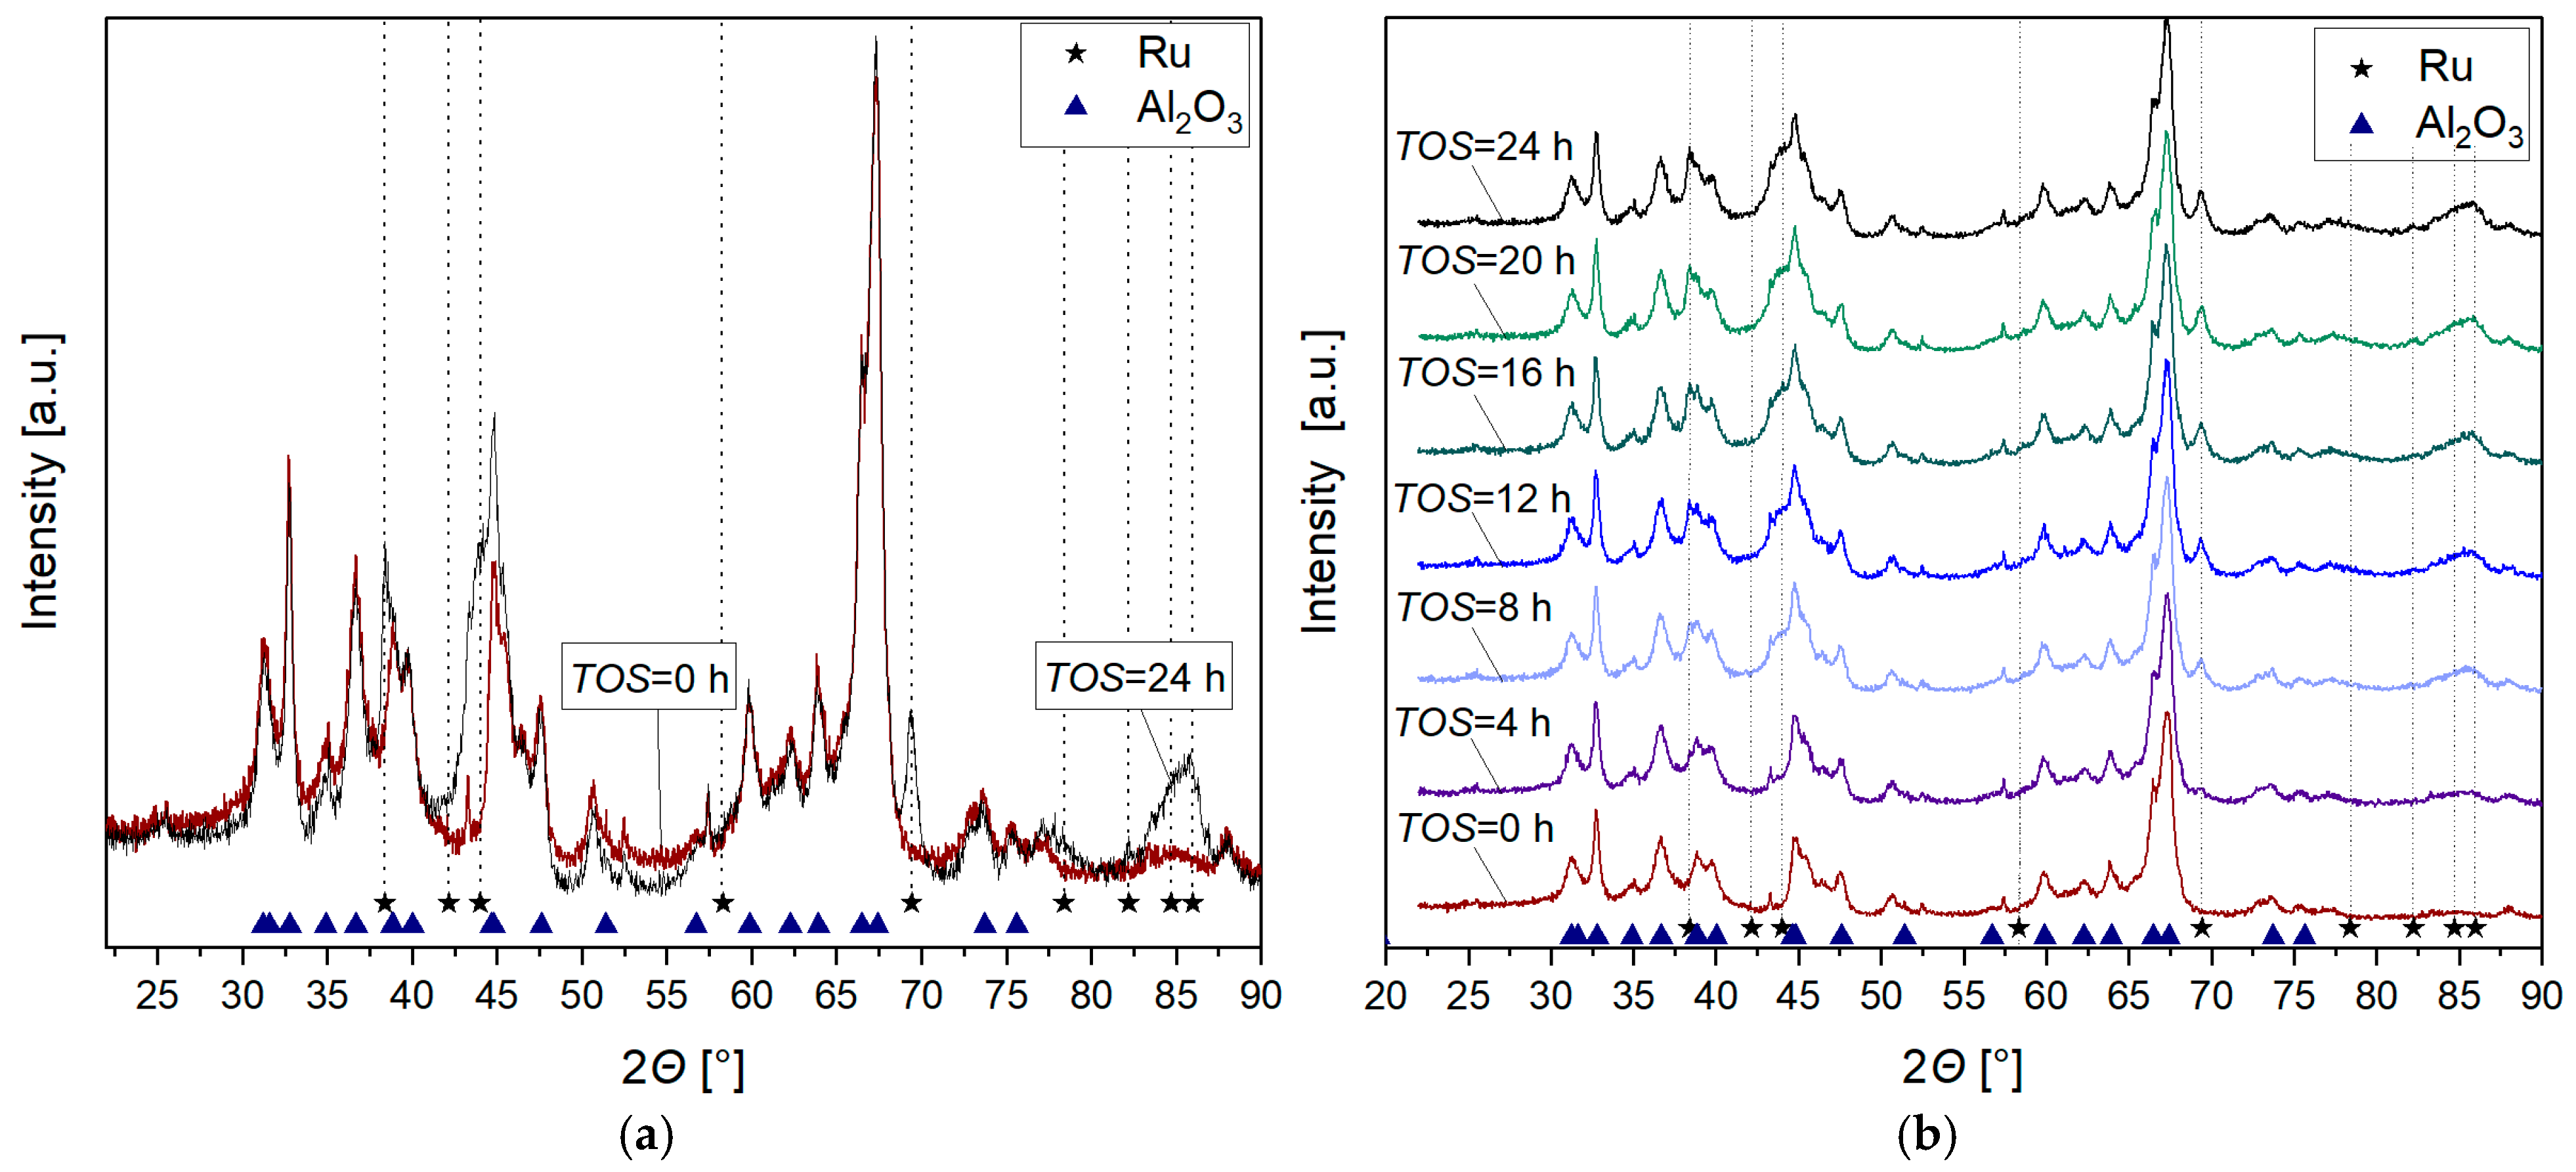
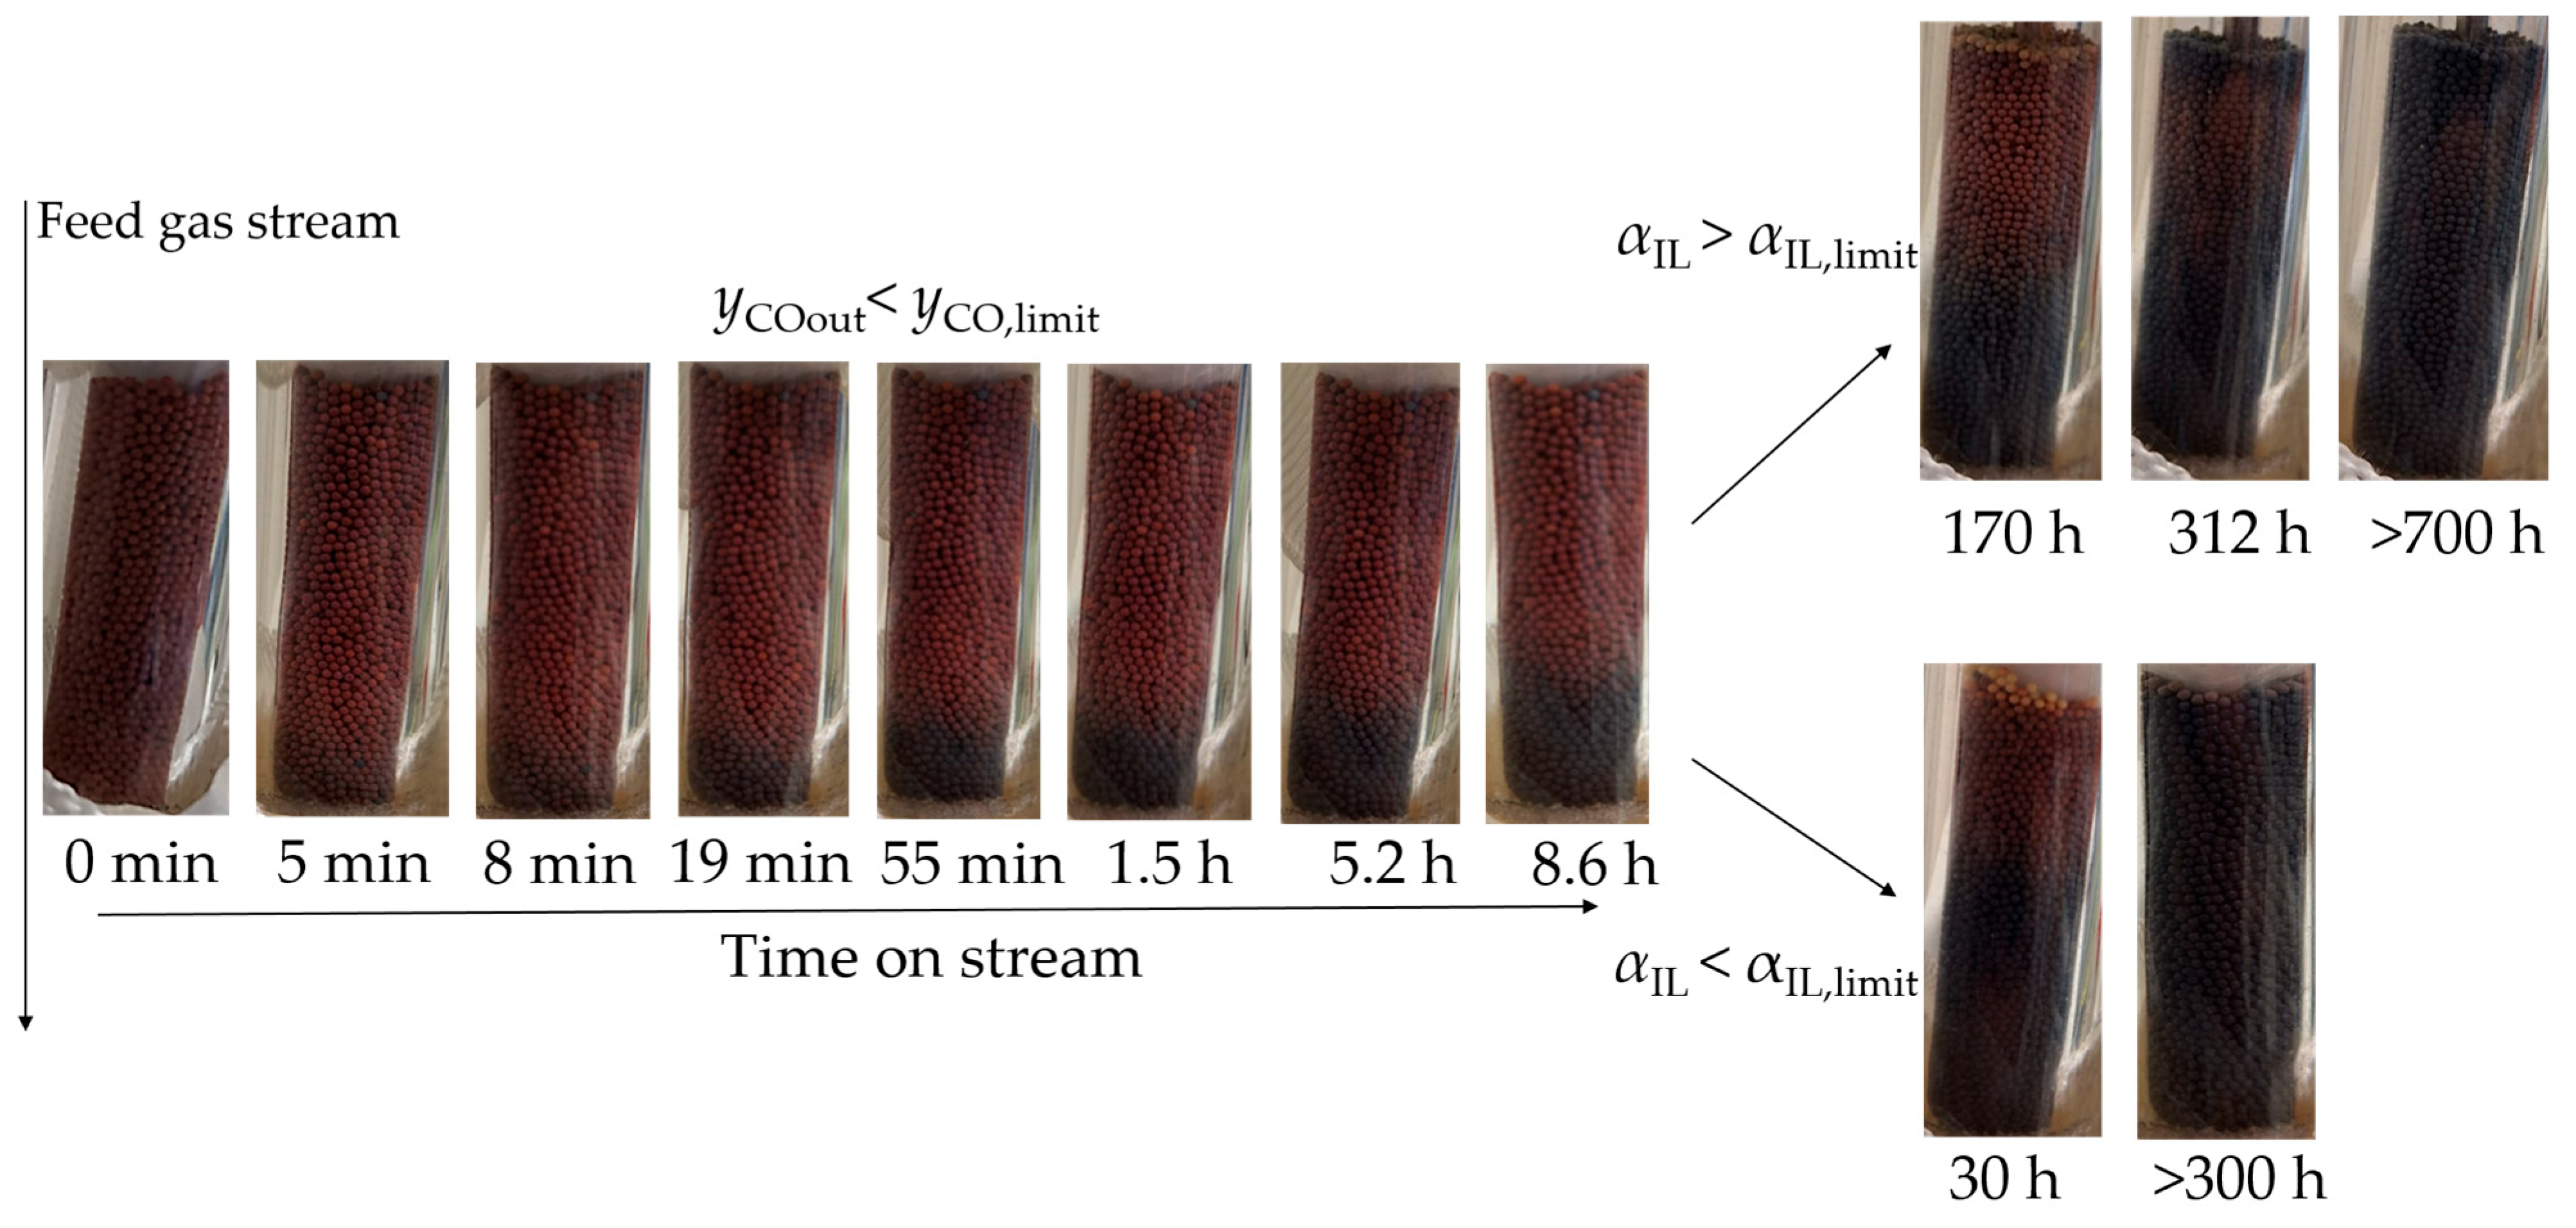
2.1. Nanoparticle Formation Under Reducing Conditions

The Ru SILP catalyst was exposed to a hydrogen atmosphere to find out whether ruthenium NPs would form. For this purpose, the effect of hydrogen exposure on WGSR activity, catalyst regeneration, and the color of the catalyst was investigated. Furthermore, the catalysts were characterized by transmission electron microscopy and X-ray diffraction measurements.
In a first series of experiments, the effect of H2 exposure on the catalytic activity of the SILP water–gas shift reaction catalyst was studied. Figure 1 shows the experimental data; the corresponding activity changes of the different experiments are listed in Table 1.
In Figure 1, CO (pCO = 0.1 bar) was replaced by H2 (pH2 = 0.1 bar), and the water vapor supply was switched off and substituted by N2. Thereby, reducing conditions were adjusted for the catalyst as applied in nanoparticle synthesis [15].
After restoring the WGSR conditions (e.g., after 45 h TOS in Figure 1a), there was little or no conversion of carbon monoxide at a filling degree of 15%, indicating a lack of regaining the activity of the water–gas shift reaction. Nevertheless, at higher filling degrees and lower temperatures, activity regained to a certain extent with the TOS (Figure 1b). The residual activity of the catalyst and the necessary time under reducing conditions until there was no residual activity were both affected by the temperature and filling degree. As shown in Figure 1a, deactivation, and consequently the rate of nanoparticle formation (deactivation was induced by nanoparticle formation, as will be shown later in this work), was highly temperature-dependent. Figure 1b illustrates that at a filling level of 15%, the water–gas shift reaction (WGSR) was no longer detectable after 30 h of exposure to hydrogen. Conversely, at a filling degree of 22%, approximately 35% of the initial activity remained. This was due to the growing number of catalytically active Ru complexes with increasing filling degree in the support particles. A longer exposure time was then required to convert all the Ru available in the catalyst into Ru NPs. This was demonstrated experimentally for a filling degree of 18%: after 30 h of hydrogen exposure, the residual activity decreased to only 10% of the CO conversion at steady state. Following an additional 15 h of hydrogen exposure (Figure 1a), the activity dropped down because the Ru in the remaining active complexes also transformed into NPs. Regeneration of the catalyst and thus restoration of the WGSR activity were not feasible with the Ru species formed, whether under WGSR conditions or under pure CO (see Supporting Information S1). This finding is a further indication that Ru NPs formed, since the active complex can be restored as long as Ru is present in a positive oxidation state either in complexes such as [Ru(CO)xCly]n− [9,20] or RuCl2 under WGS reaction conditions [21]. The formation of Ru nanoparticles is shown in the next paragraph.
In addition, the decrease in catalytic activity could be observed through alteration of the catalyst’s color. During reaction time, the initial orange-like colored catalyst changed its color to black, as shown in Figure 2. Measurements performed with only the IL [BMMIM]Cl and the support showed no black discoloration under reducing conditions; hence, the color change observed at these temperatures was attributed to reactions of the Ru complex. In the literature, emerging of the black color is described as a strong indication of Ru NPs [22,23]. The degree of activity decrease correlates with the intensity of the catalyst’s darkening. However, NP formation has to be confirmed unequivocally by reliable analysis. For the analysis of Ru NP formation, transmission electron microscopy (TEM) measurements (Figure 2) were performed. Since the electron beam of the TEM can also lead to NPs [16], the fresh (orange-brownish) Ru SILP catalyst was measured as a reference (Figure 2a). The TEM images of the catalyst after hydrogen exposure (i.e., CO removal in the feed gas) show NPs, whereas the TEM images of the active catalyst reveal no NPs formation.
Furthermore, the SILP catalyst was analyzed using in situ XRD spectroscopy at 140 °C. Herein, the catalyst was exposed to 10% hydrogen in nitrogen atmosphere (pges = 1 bar).
The characteristic reflection patterns of metallic Ru at 2Θ of 38.4°, 44°, 69.4°, 78.4°, 84.7°, and 86°, respectively, did not appear in the XRD patterns before hydrogen exposure. As depicted in Figure 3, these reflections developed gradually and increased in intensity over time during the reduction process. After 18 h, the intensities of the Ru reflections remained constant, indicating complete reduction. Both the TEM and XRD measurements showed that the Ru-based SILP catalyst decomposed under reducing conditions (H2 exposure only), yielding ruthenium NPs. Then, the metallic ruthenium was no longer WGSR-active; thus, the SILP–WGSR catalyst was irreversibly destroyed under pure hydrogen (H2 in N2) conditions. It is well known in the literature that Ru nanoparticles catalyze the methanation reaction [24]. However, no methane could be detected at 140 °C. Since the reactor setup (oil thermostat) did not allow temperatures above 160 °C, and the setting of temperatures which were applied for the methanation reaction could not be conducted.
Regarding these experimental results, the question arose as to whether nanoparticles were formed and at which gas compositions or CO to H2 ratios this occurred. Hence, various gas compositions were passed over the catalyst. Table 1 shows the varying gas compositions studied and the activity loss after 30 to 75 h of exposure.
The data given in Table 1 show that neither the addition of CO2 nor of water vapor could prevent the formation of Ru nanoparticles in the absence of CO and thus the decrease in activity. Only the presence of CO prevented the reducing action of hydrogen on the catalyst (see Table 1 and Supporting Information Figure S2). The maximum activity loss was 11% in the presence of 10% CO. In a CO atmosphere (10% CO; 90% N2), the catalyst remained in its active anionic form, thereby preventing the formation of volatile Ru carbonyl complexes. These findings suggest that the Ru SILP catalyst is susceptible to chemical instability without CO present in the gas stream. The addition of CO enables the SILP catalyst to retain its catalytically active form, as evidenced by preserving the catalyst’s original color. Furthermore, TEM measurements showed no signs of nanoparticles in the SILP system. As seen in Figure 4, the X-ray diffractogram shows that no metallic Ru signals appeared in the XRD pattern in the presence of CO (10% CO and 10% H2; rest N2), strongly indicating the stabilizing effect of CO.
As in the case of H2 exposure, water vapor had an effect on the catalyst activity too. When only water vapor and nitrogen as inert gas were passed through the catalyst bed, the activity decreased to 58% of the initial value. This was caused by the water–gas shift reaction taking place, as CO was present as ligands of the Ru complex; when the CO ligands were consumed, the WGSR stopped. Consequently, the hydrogen acted as a reducing agent, leading to Ru NPs. The catalyst also changed color, turning black. As long as the feed gas contained CO (10%) and water vapor, the catalyst performed in a stable manner at 120 °C (αIL = 18%) and at the desired WGSR activity. However, a slight deactivation could be observed at lower filling degrees and/or higher temperatures (see Supporting Information, Figure S3).
The catalyst displayed remarkable stability in a pure nitrogen atmosphere, maintaining its efficacy after 120 °C and after 40 °C (see Table 1, No. 7). Both findings substantiate that the catalyst was not compromised by water condensation and exhibited excellent dynamic behavior. According to Werner [9], the catalyst has also been found to demonstrate stability in air.
As illustrated in Table 1, when the CO content was set at 10% (at low CO conversions), the hydrogen-to-carbon monoxide (H2-to-CO) ratio displayed minimal impact on the rate of activity decline.

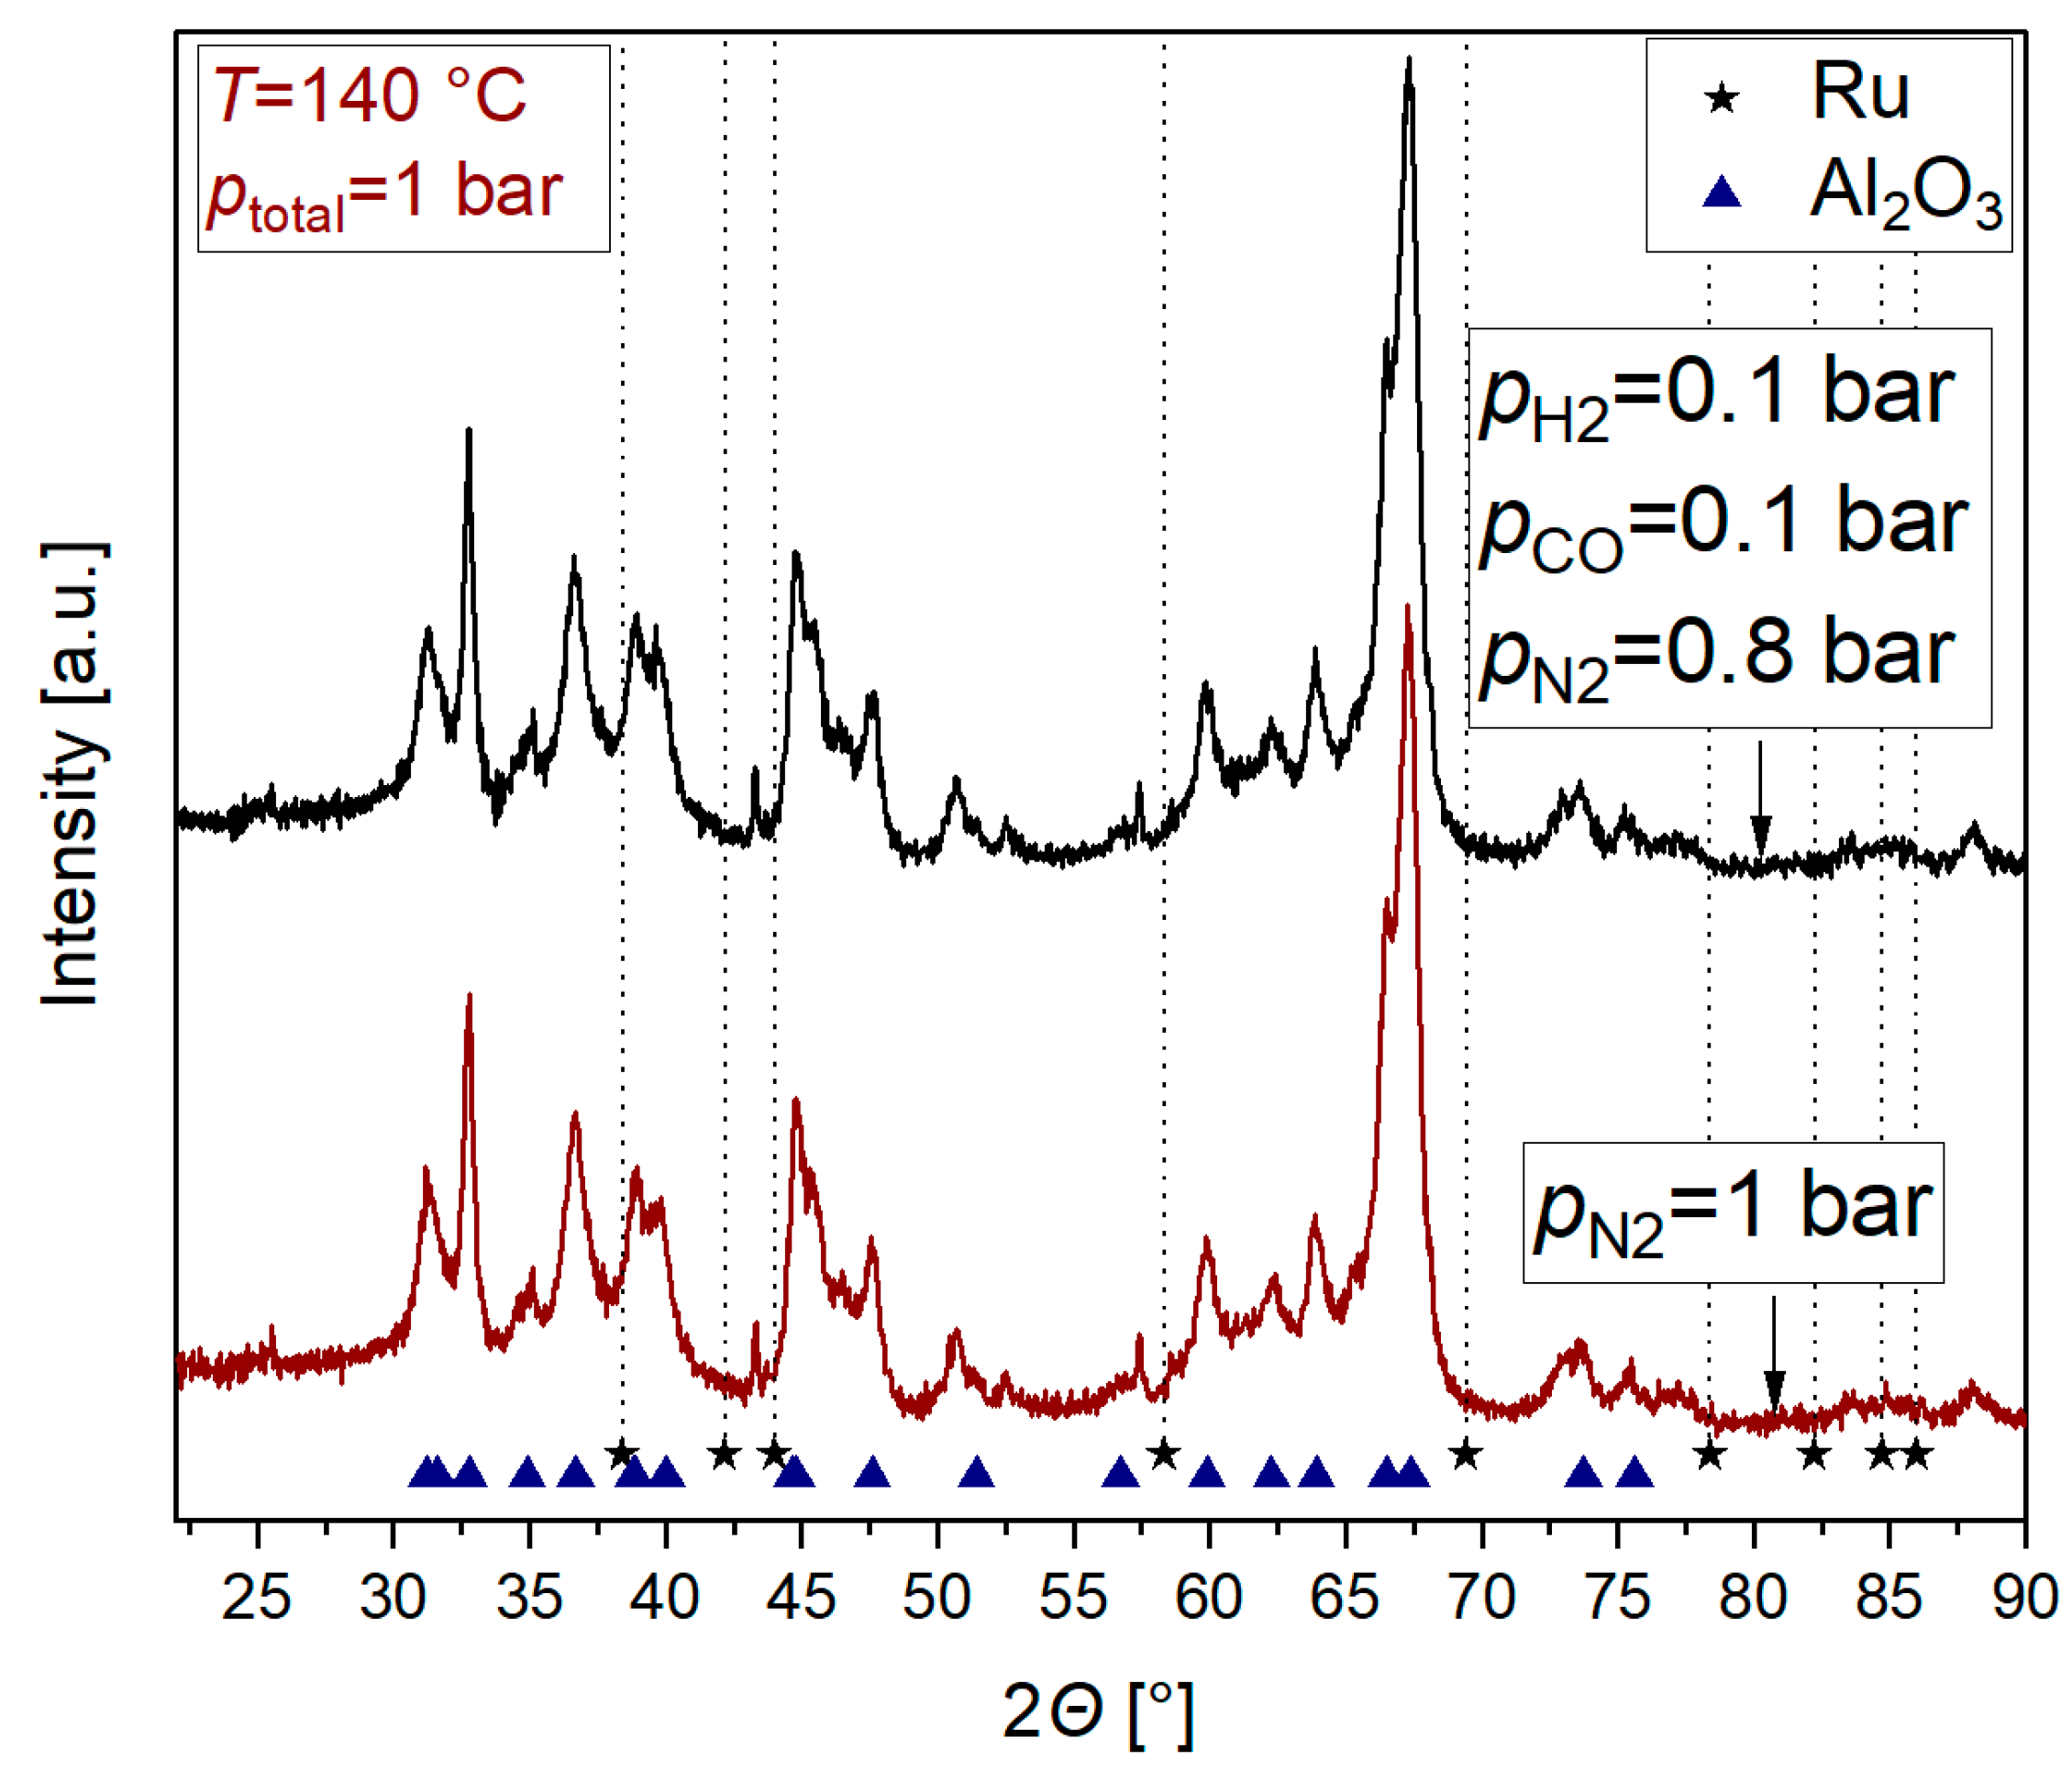
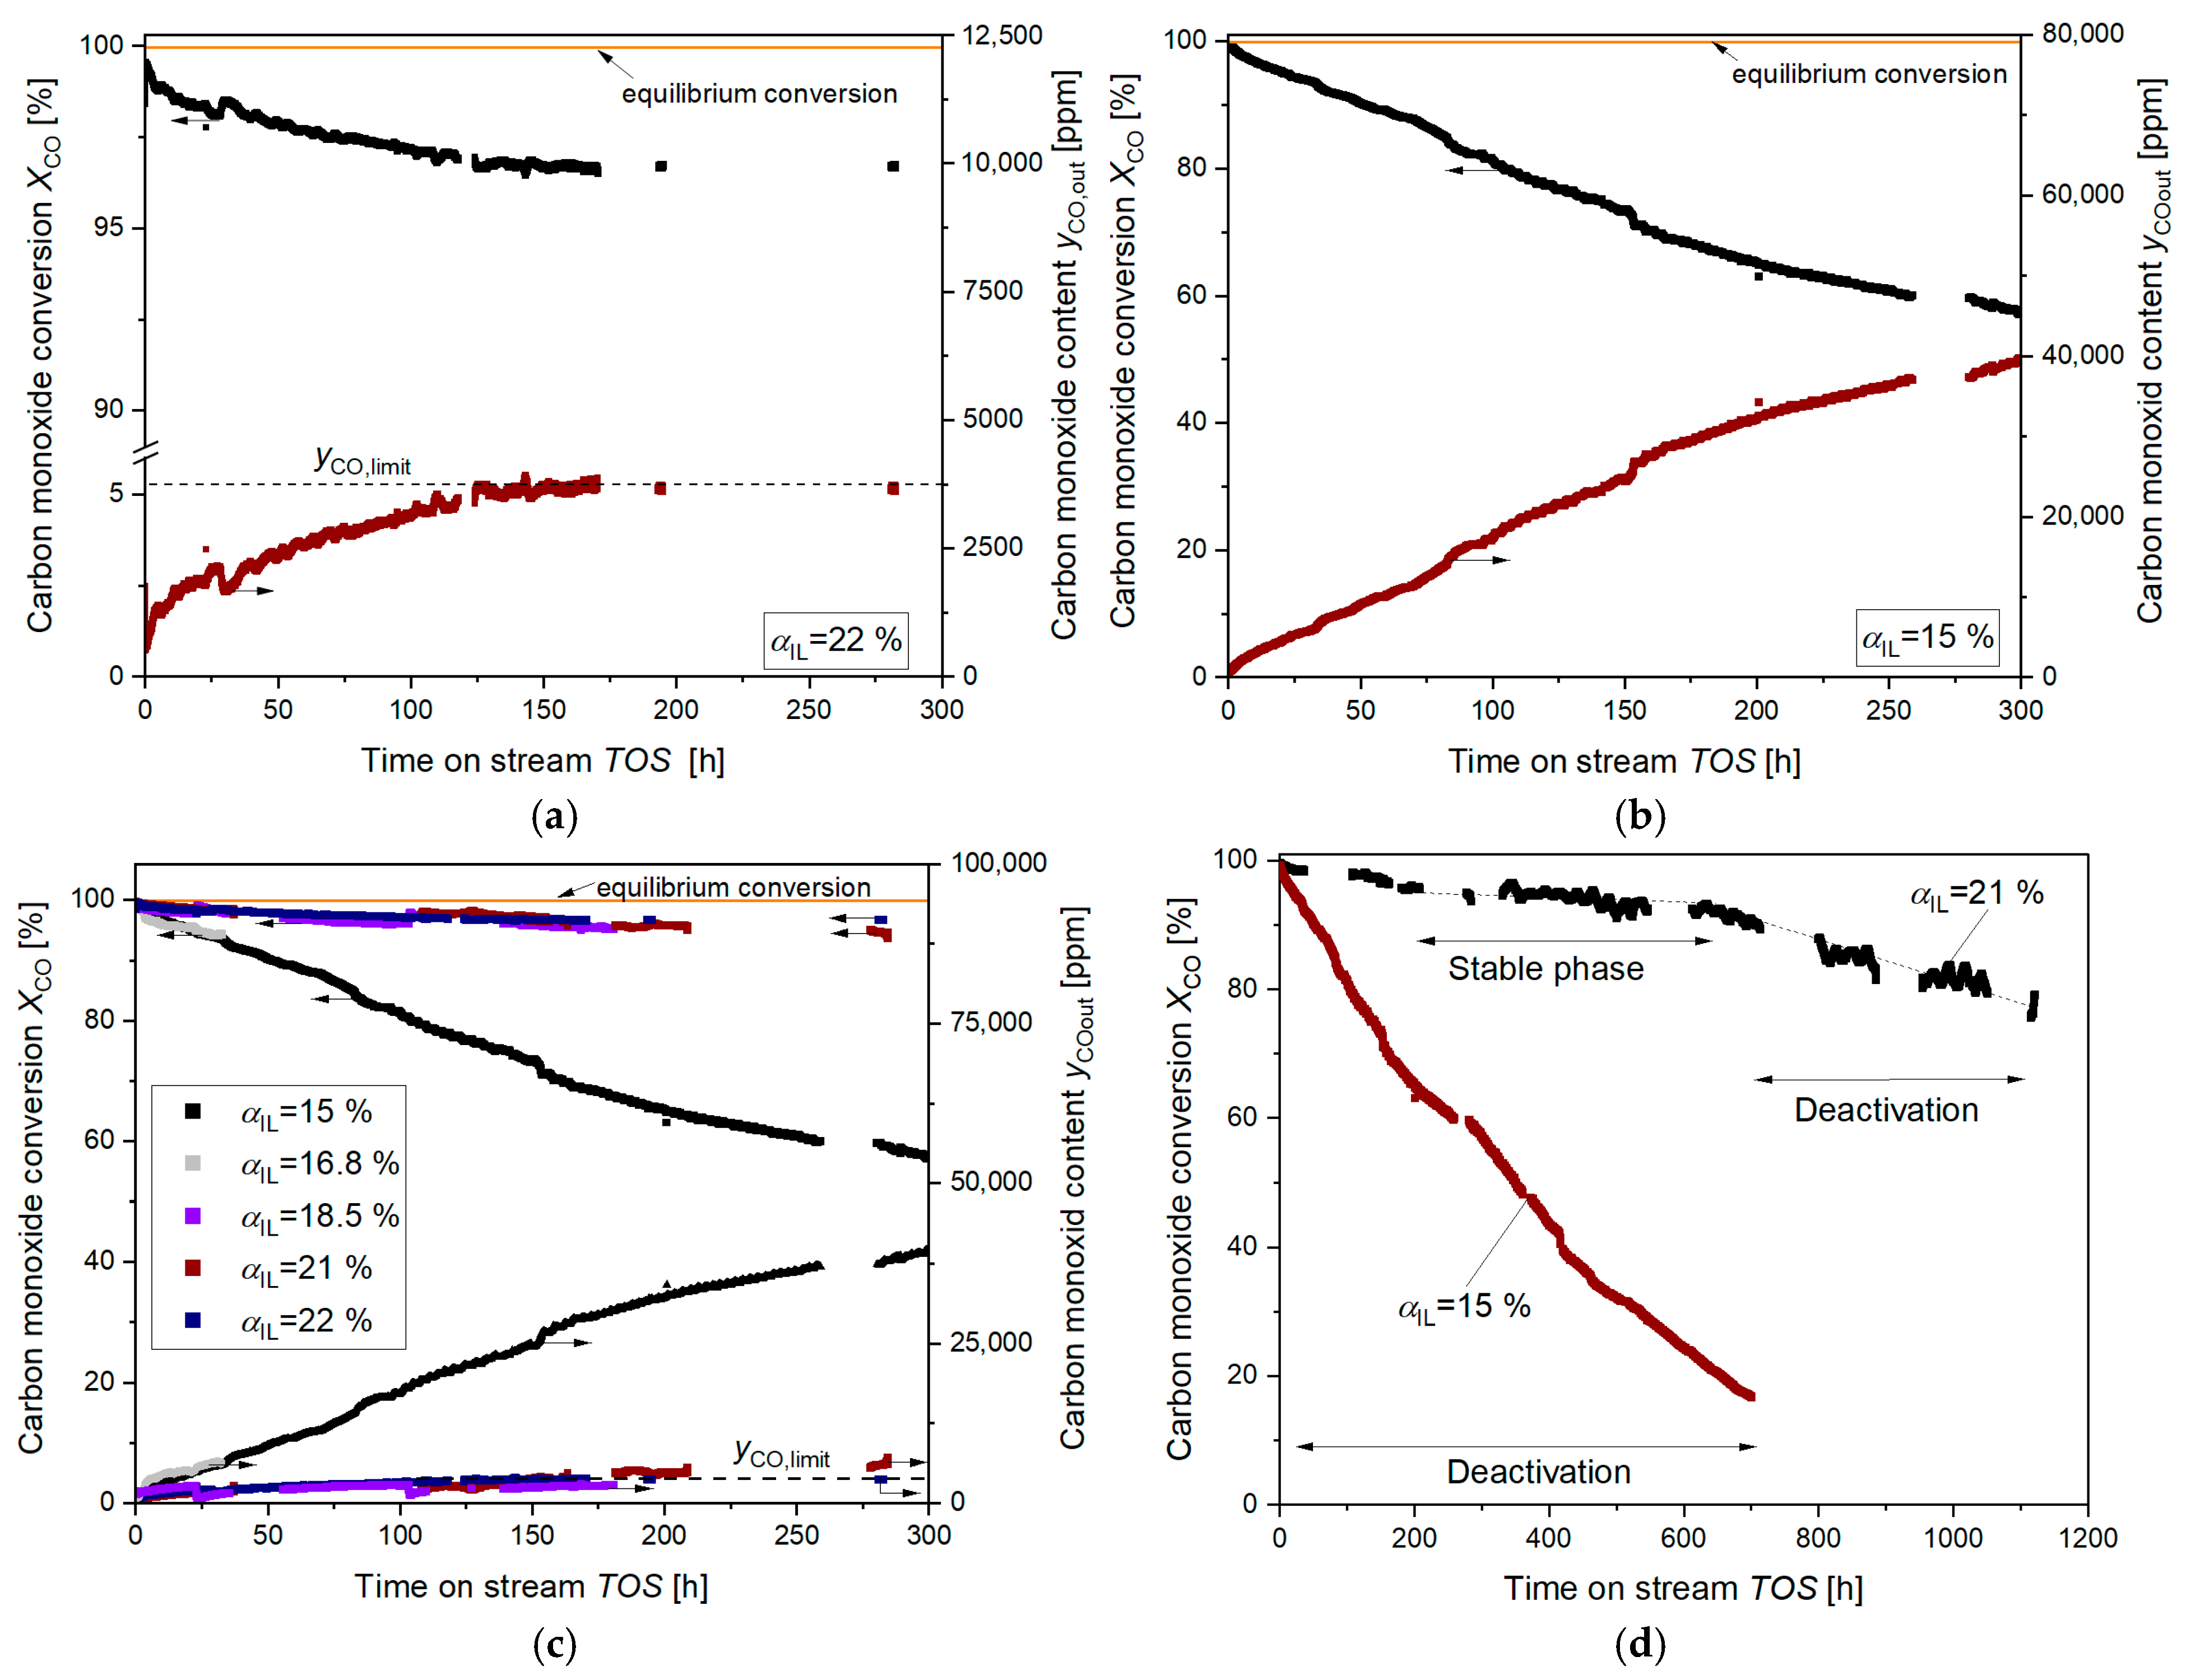
2.2. Influence of CO on Ru Nanoparticle Formation

The ultra-low-temperature WGSR SILP catalyst was designed and optimized to exhibit activity at temperatures below 140 °C, rendering almost complete CO conversion thermodynamically possible and thereby avoiding a post-WGSR purification step. However, the findings given in the previous chapter reveal a challenge with regard to CO removal down to trace values by applying this Ru SILP catalyst. The amount of CO available for stabilizing the active complex at the end of the catalyst bed will be too low at certain, albeit high, CO conversion. Then, the reducing conditions due to the hydrogen content take over and cause Ru NP formation, i.e., irreversible decomposition of the WGSR SILP catalyst (see Figure 1 for a complete CO-free condition). Consequently, the question arises of the minimum CO partial pressure that is required to keep the catalytic complex in its active form; this amount of CO should be in a range of 20 to 255 ppm for rendering fuel cell applications possible. Therefore, the limiting molar fraction of CO in the gas (yCO,limit) that is necessary to prevent this ultra-low-temperature WGSR catalyst from irreversible NP formation has to be determined. Deactivation can be observed from both the activity and color change of the catalyst. In order to determine this specific CO content, an (almost) complete CO conversion was set experimentally by extending the residence time. Thereby, a concentration gradient for carbon monoxide (CO) along the catalyst bed, with minimal CO present at the end of the bed, was established. Correspondingly, the concentration profile for H2 in the catalyst bed was reversed.
Hence, as long as the CO content is above the limiting value, the color of the Ru SILP catalyst remains orange-brown, indicating no deactivation. However, at and below the limiting CO content, the color of the bed should turn to black from this point onwards to the end of the catalyst bed as a result of Ru nanoparticle formation. The resulting CO content at the end of the bed (yCOout), theoretically, corresponds to the value at which no further reduction takes place (yCO,limit).
Figure 5 shows the conversion curves and CO contents corresponding to the conversion at the end of the catalyst bed of five catalysts, having different filling degrees, as a function of time. The equilibrium conversion at 140 °C is also shown.
At first, all catalysts showed a conversion of CO very close to the thermodynamic limit of 99.95% at 140 °C (see Figure 5c). Figure 5a reveals that the catalyst having a filling degree of 22% initially deactivated quickly, but that the deactivation rate decreased over time. As a result, CO conversion decreased, and the CO content increased. Now, as the CO content increased, the deactivation rate slowed down and finally reached a plateau at 3800 ppm of CO. The result shows that the stabilizing CO concentration was reached at 3800 ppm, with the catalyst tested in the presence of the hydrogen formed. Furthermore, other catalysts with higher filling degrees (≥18.5%) had a similar deactivation behavior, reaching a comparable limit value of 3000 to 5000 ppm (see Figure 5c). This indicates that the aforementioned value represents the yCO,limit needed to stabilize the active catalyst complex and to suppress the reduction by hydrogen. Despite the partial pressure variation of the catalyst with a filling degree of 18.5%, the CO content continuously approached the specified limit value. Nevertheless, a WGSR experimental run exceeding 1100 h of time on stream (Figure 5d) demonstrated that the catalyst with a 21% filling degree gradually resumed deactivation following the attainment of a “limit value” at approximately 460 h after reaching it. However, deactivation was slower compared to the catalyst, having a filling degree of 15% (Figure 5a). In addition to the proceeding reduction by H2, which slowed down considerably with increasing CO content, this deactivation can be attributed to the thermal decomposition of the active ionic liquid catalyzed by the support. In contrast to the observed behavior at higher filling degrees, the deactivation behavior of the catalysts with a low filling degree, i.e., ≤16.8%, seems to be in conflict with the expected trend. At a filling degree of 15% (Figure 5b), no specific limit value for the CO content could be identified, as the conversion continued to decrease over time. Even after 700 h (Figure 5d), the catalyst continued to deactivate. This suggests that the catalyst complex is not fully stabilized by CO at such filling degrees, even at higher CO concentrations. Thus, a threshold filling degree for the used SILP catalyst is to be expected. If the filling degree is below this threshold value (αIL,limit ≈ 16.8–18.5%), the catalyst deactivates, no matter what the CO content is. Conversely, if the filling degree is above this value, the catalyst remains (apparently) stable for a longer period of time after a certain CO limit is reached at the end of the catalyst bed. Figure 6 provides a visual confirmation of the observed phenomena.
The discoloration and accompanying deactivation/decomposition of the catalyst began at the end of the catalyst bed, with the catalyst turning black regardless of the filling degree (Figure 6). This process was rapid, taking several hours for all catalysts. The initial color changed from orange to black, and the resulting nanoparticle (NP) formation rates were significantly influenced by the CO partial pressure; lower CO partial pressures accelerated the color change. In addition, a color gradient within the catalyst bed is observed due to different CO partial pressures along the catalyst bed. The initially blackened end of the catalyst bed (Figure 6, 8.6 h) corresponds to the region where the CO content has been reduced to approximately 3800 ppm due to the WGSR. Even after this initial color change, further discoloration of catalysts at different filling degrees followed a similar pattern. However, catalysts at lower filling degrees showed a much faster progression, turning black from bottom to top (direction of gas flow). These catalysts showed a completely black catalyst bed after only 300 h of operation, which continued to darken over time. As shown in Figure 6, higher loading catalysts did not show a completely black catalyst bed after 300 h. However, even though these catalysts were in a steady state of activity between 300 and 700 h, they continued to turn black, indicating the formation of nanoparticles. At 700 h, the entire catalyst bed was black, even for higher loading catalysts. The differences in the blackening behavior observed at various filling degrees may be attributed to dilution effects and to variations in the concentration of nanoparticles within the catalytically active ionic liquid phase.

3. Discussion

This chapter takes the findings from the previous chapters and places them in the context of current knowledge. An attempt will be made to explain these results and to reconcile them with existing theories.

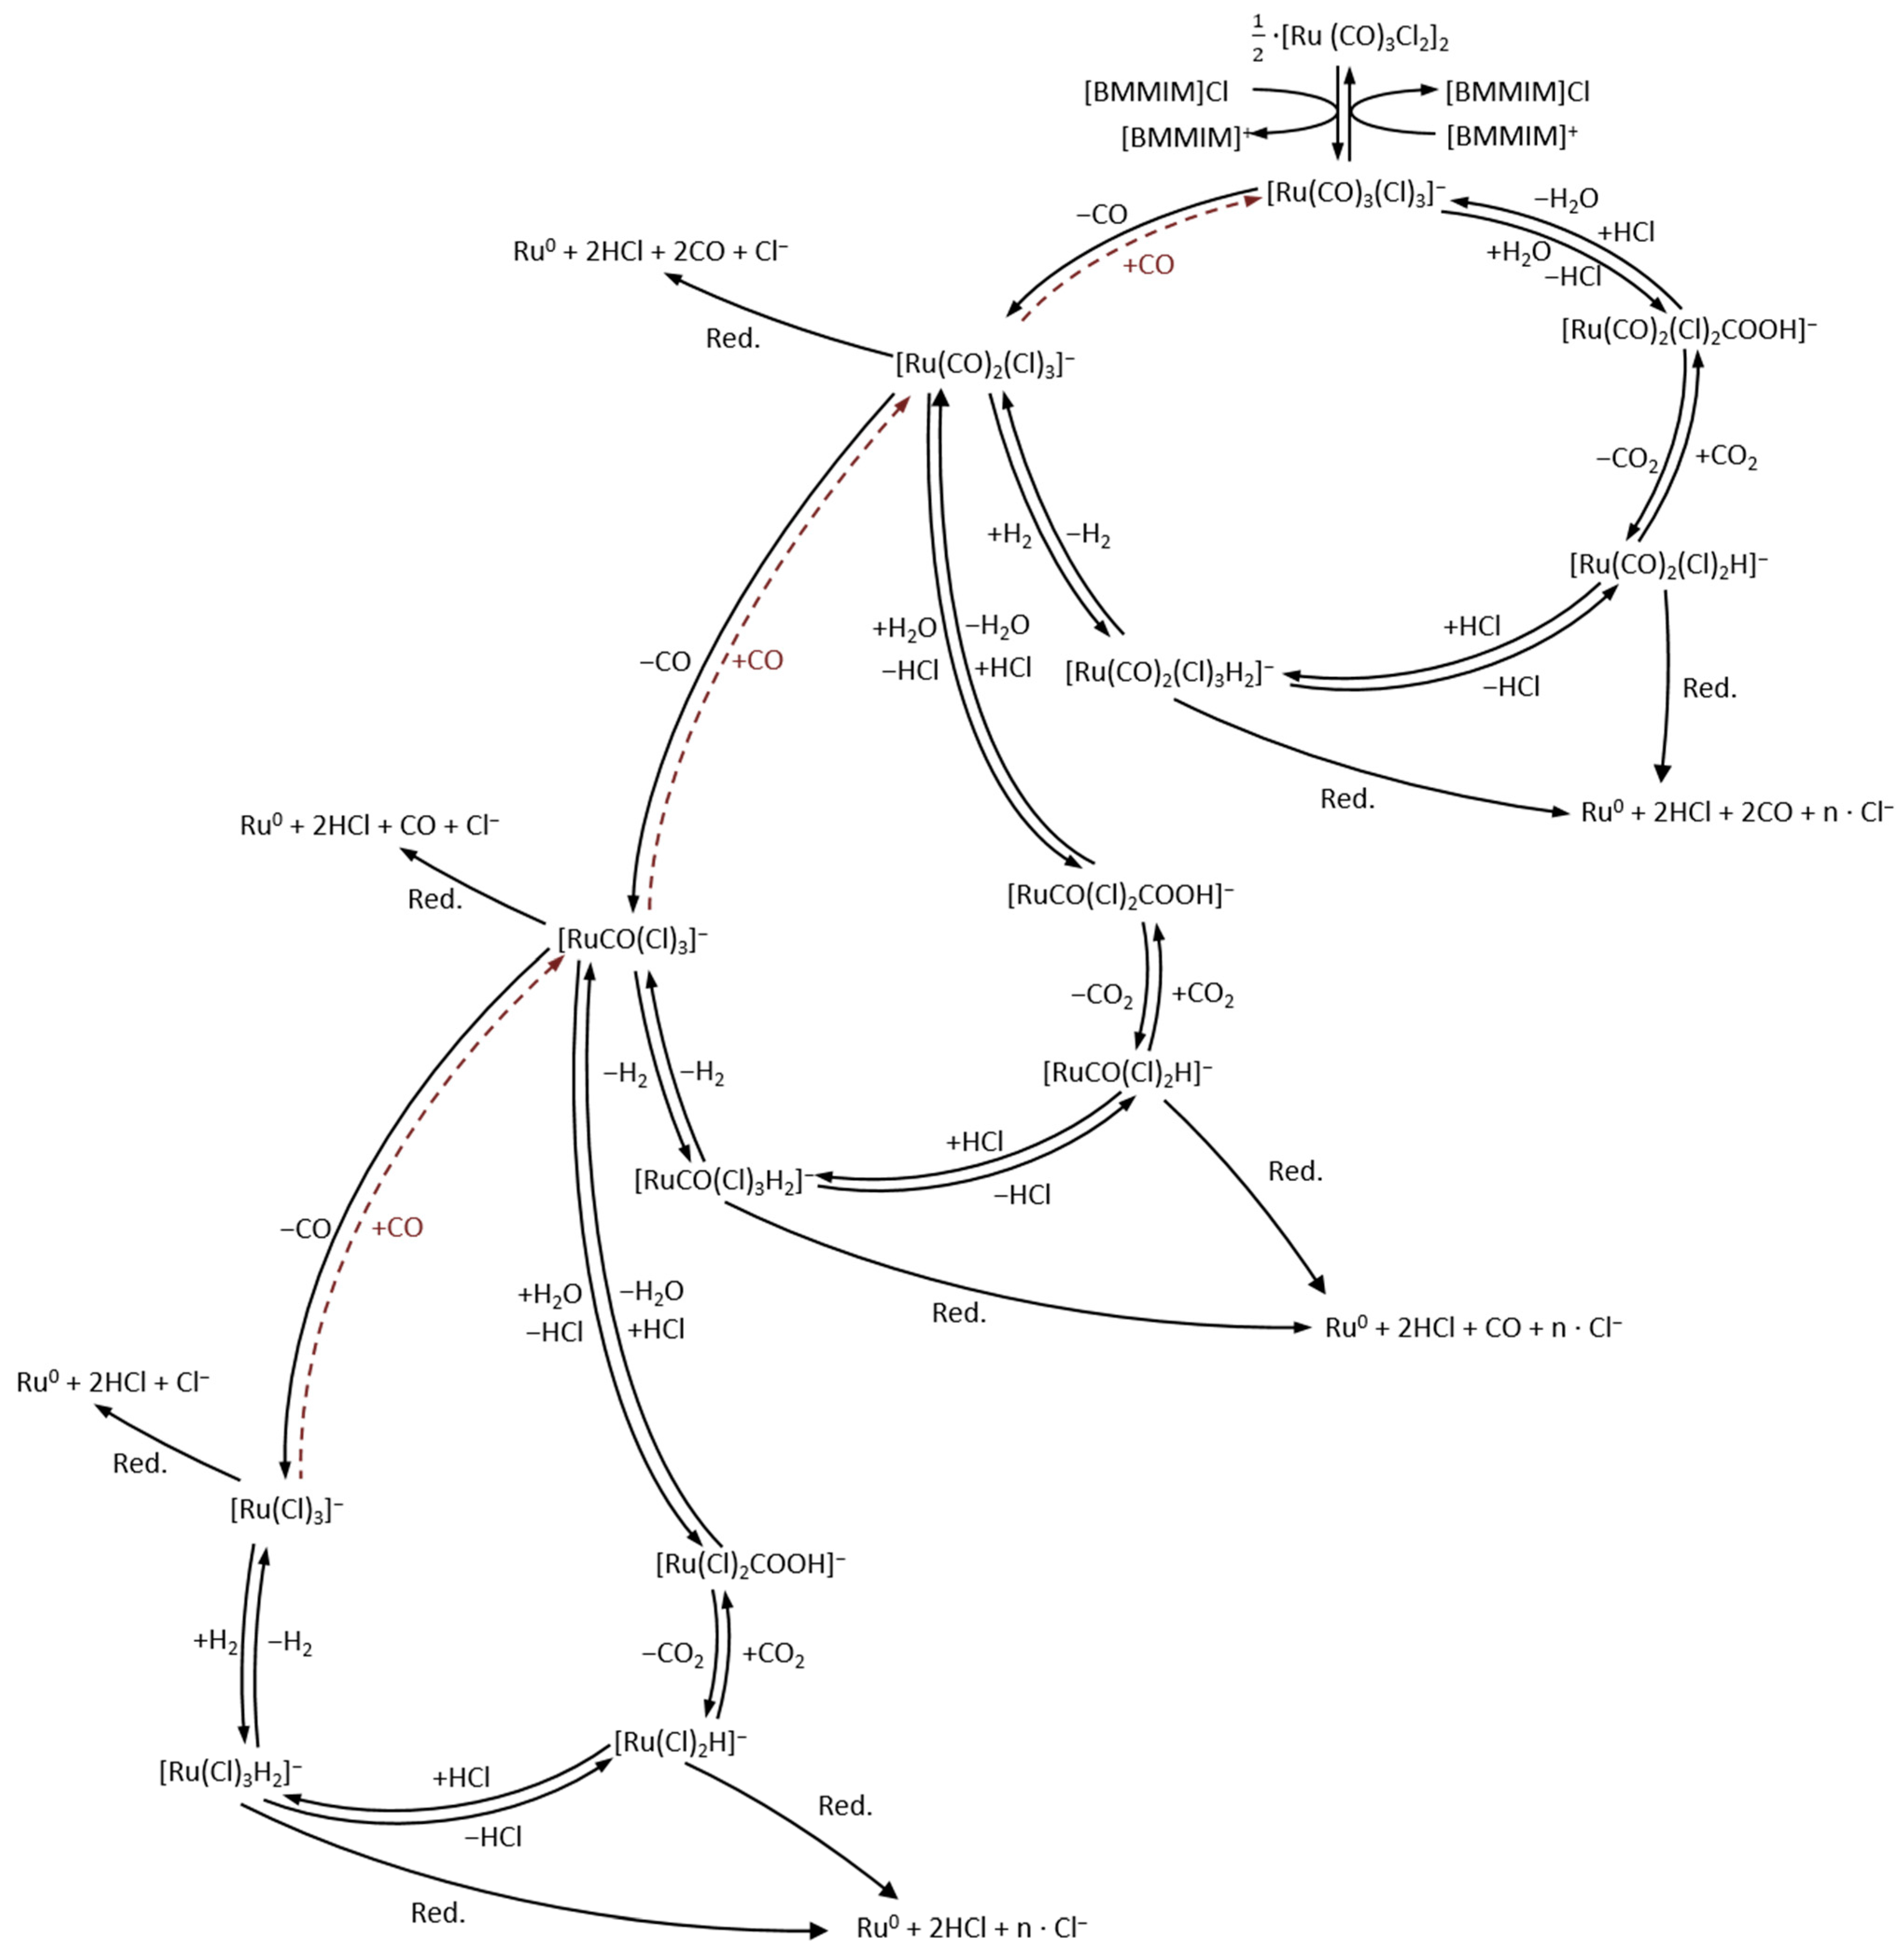
3.1. Nanoparticle Formation

As shown above, the decomposition of the catalyst complex to ruthenium nanoparticles is based on two separate and simultaneous reactions. First, the catalyst complex requires a certain amount of CO (more than 3800 ppm) for stable operation. The reduction of the ionic ruthenium complex to nanoparticles due to the presence of hydrogen occurs at every filling degree, thus representing the carbon monoxide threshold value below which the SILP catalyst system decomposes. In other words, the Ru SILP WGSR catalyst studied in this work required 3800 ppm CO to remain active and sound, regardless of the filling degree, so further optimization is required to overcome this threshold. This threshold is independent of the conversion rate and CO inlet partial pressure.
Deactivation also took place even with sufficient CO (>3800 ppm) present to stabilize the [Ru(CO)3Cl3] catalyst in the upper part of the catalyst bed. Hence, a second deactivation mechanism must have been operating. The Ru NPs produced by the XRD measurement in Figure 3 were formed through the first NP formation mechanism with hydrogen and in the absence of CO. To ensure that Ru NPs are also formed in the presence of sufficient CO, an XRD measurement was conducted on the black catalyst from the upper third of the catalytic bed (Figure S4 in the Supporting Information). The XRD measurement also showed the presence of metallic ruthenium reflections. This means that, under this mechanism, the active Ru complexes are converted into inactive nanoparticles even in the presence of a CO atmosphere. This second deactivation path is most likely a thermal decomposition of the active ruthenium complex or the resulting active [BMMIM][Ru(CO)3Cl3] IL catalyzed by the catalyst support. The catalytic effect of the alumina support on the decomposition has also been described in the literature; Sobota et al. [25] demonstrated the decomposition of the Ru complex they used (the catalyst precursor [Ru(CO)3Cl2]2) on an aluminum oxide surface to metallic Ru clusters and Ru carbonyl surface species. This process is thus catalyzed by the aluminum surface. Werner [9] determined the catalytic effect of the support on thermal decomposition. The deactivation of the WGSR by decomposition of the Ru complex proceeded on different supports at different rates. In the Ru SILP catalysts studied, the decomposition was faster on boehmite than on alumina. Furthermore, Heym states that the thermal decomposition kinetics of supported ILs are influenced by the support, especially of the first IL layer (monolayer) [26]. The other layers behave more like the pure IL during thermal decomposition. A similar phenomenon can be observed with the IL utilized in this context (see Supporting Information, Figure S5).
The second nanoparticle formation mechanism, namely, the thermal decomposition of the active Ru complex, became apparent in activity measurements only when the filling degree fell below 16.8% (ζ = 0.67). In contrast, discoloration of the catalyst bed—particularly in the upper regions—was observed across all filling degrees, including those above the threshold range of 16.8–18.5%, indicating that thermal decomposition occurred regardless of the filling degree. Consequently, the system’s characteristics and properties must have undergone a fundamental alteration between a 16.8% and 18.5% filling degree.
In Section 2.2, the deactivation of the catalyst system was primarily related to the WGSR activity or, in other words, CO conversion. It seems likely that the SILP system under examination is an active interfacial system (gas–liquid interface) analogous to the SLP system described by Gerritsen et al. [27]. This is because CO has been observed to dissolve poorly in ILs [28,29]. It can therefore be concluded that the reaction predominantly occurs at the gas–liquid interface. Consequently, the accessible liquid surface is proportional to the WGSR activity. The maximum reaction rate in relation to the mass of the support is observed precisely in the filling degree range between 16.8 and 18.5% (see Supporting Information Figure S6). This indicates that the maximum accessible active surface area must be present within this range of filling degree. Any further increase of the filling degree has no effect on the reaction rate in relation to the support up to a certain point (up to 30%). This suggests that from this filling degree (16.8–18.5%) onwards, the additional active Ru complexes do not contribute to an increase of the active surface area but form a reservoir of active Ru complexes. When an inactive Ru nanoparticle is formed from an active ruthenium complex on the surface, it can be replaced by an active ruthenium complex from this reservoir. Only when this reservoir is depleted, deactivation can be observed in the form of decreasing activity. This assumption is also supported by the fact that in catalysts with higher filling degrees (21% and 22%), despite the apparent stable activity (from the CO conversion measurements, see Figure 5), further black coloring of the catalyst bed occurred, i.e., the formation of nanoparticles.
Therefore, the catalyst with a filling degree of 21% was subjected to a long-term test (1100 h), see Figure 5d, to investigate whether the catalyst deactivates after a steady-state phase in which Ru complexes from the reservoir replace the inactive Ru nanoparticles at the gas–liquid interface. It was found that the catalyst began to deactivate after about 680 h, which is consistent with this hypothesis. As shown in Section 2.1, the reduction time under hydrogen conditions depends on the filling level, confirming this idea. However, this needs further experimental confirmation.
Another approach to explain the observed data is that at these filling degrees, a theoretical monolayer of the system at ζ = 0.67 is formed. The theoretical monolayer describes complete coverage of the catalyst support with a compact layer of ionic pairs (anions and cations). This kind of monolayer for the catalyst support used in this study with [BMMIM]Cl would occur at a filling degree of 19.5% according to Equation (8). Due to the aforementioned formation of a [BMMIM][Ru(CO)3Cl3] IL dissolved in or mixed with [BMMIM]Cl, the monolayer is already achieved at lower IL filling degrees (αIL), which is due to the enlarged size of the anion. It is reasonable to conclude that a complete monolayer is formed between 16.8% and 18.5% IL. This leads to the following assumption: the formation of nanoparticles catalyzed by the support does not occur when the support is fully covered. However, this is in contradiction with the measurement that the catalyst at 21% filling degree continues to deactivate after the stable phase (Figure 5d), which suggests that the monolayer hypothesis is less likely; nevertheless, it is included here for the sake of completeness.
Strobel [30] has found that catalysts with a low filling degree exhibited deactivation under WGSR conditions, a finding that is consistent with the results of the present study. Conversely, Strobel also observed that catalysts with a higher filling degree (>αIL,limit) demonstrated a certain degree of steady or increasing activity. However, the optimal filling degree limit is dependent on the support, with values between 8% and 11% according to Strobel. Furthermore, studies by Werner et al. [9] and Fischer et al. [11] have shown deactivation at low filling degrees. Nevertheless, the extent of deactivation at 120 °C is only marginal.
In summary, a CO concentration of 3800 ppm is required—independent of the filling degree—to prevent the reduction of the active Ru complex to catalytically inactive nanoparticles by hydrogen. However, it should be noted that even under these stabilizing WGSR conditions, a CO content of 3800 ppm is insufficient to fully prevent catalyst degradation, as thermal decomposition of the Ru complex (at least at 140 °C) continues to occur. This second nanoparticle formation mechanism proceeds continuously, occurs across all filling degrees, and is attributed to the thermal instability of the active species on the catalyst support. As a result, the catalyst bed gradually turns black even at elevated filling degrees and during phases of seemingly stable CO conversion. The catalytic activity remains unaffected as long as a sufficient reservoir of Ru complexes is available to maintain an accessible active surface area. Once this reservoir is depleted, the formation of Ru nanoparticles correlates with a loss of interfacial activity, leading to a decline in CO conversion. This effect becomes evident after approximately 700 h of time on stream for a catalyst with a 21% filling degree. The higher the filling degree, the longer this apparent steady-state CO conversion can be sustained. Nevertheless, the kinetics and additional influencing factors of the thermal decomposition pathway require further investigation.
Compared to commercial (CuO/ZnO/Al2O3) catalysts for LTWGSR at 200 °C, where CO contents of 3000 ppm can be achieved (yCOin = 10–13%), the Ru-based SILP–WGSR catalyst used here is currently not an improvement. It has to be noted that the H2 generated through the water–gas shift reaction is sufficient to reduce the catalytic complex, even if the feed gas is free of hydrogen.

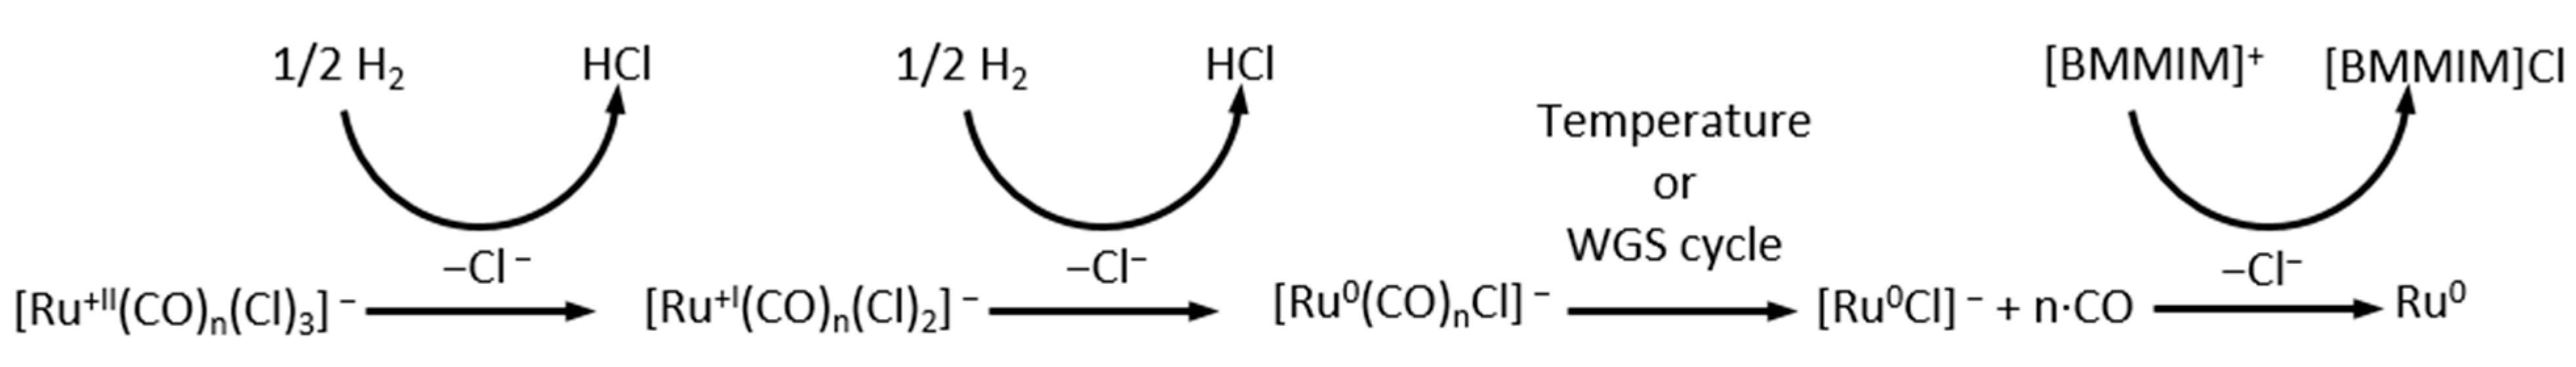
3.2. Nanoparticle Formation Mechanism in the Absence of CO

As outlined in Section 2.2, NP formation can either be catalyzed by the support in the presence of CO or, in the absence of CO, by H2. While the mechanism of catalytic NP formation is likely to be similar to a heterogeneous reaction mechanism and needs to be further investigated, a scheme for nanoparticle formation under CO deficiency can be proposed based on the existing knowledge.
In a hydrogen atmosphere, chloride ligands dissociate from the Ru complex, leading to the formation of HCl; the formation of HCl has been observed by precipitation of silver chloride (AgCl) from the exhaust gas passing through a silver nitrate solution acidified with nitric acid. This process is accompanied by the reduction of the RuII complex to RuI or Ru0 (Scheme 1). In addition to chloride loss via HCl, the released chloride ions can also replace the [Ru(CO)3Cl3] anion, yielding [BMMIM]Cl; this is the reverse reaction of anionic catalyst formation via chloride addition to the Ru dimer catalyst precursor (Scheme 2). As a result, the Ru complex becomes neutral.
The WGSR catalyzed by the Ru SILP catalyst can also occur in the absence of CO in the feed gas. However, in this case, the carbonyl groups that are ligated to the Ru complex (as shown in Scheme 2) are consumed. As a result, one CO ligand is lost per reaction cycle. The final step of the catalytic cycle, which involves coordination of CO, is impossible. It is theoretically possible that all ruthenium complexes containing chloride and carbonyl ligands act as catalysts for the water–gas shift reaction (WGSR) [20]. However, species with less CO, such as [Ru(CO)2Cl3], could also catalyze the WGS reaction by losing CO in the same or a similar manner as long as CO is coordinated to Ru. Additionally, the elevated reaction temperature can lead to the cleavage of CO ligands from the complex [12]. Bauer et al. [20] confirmed this, and our study also detected CO in the gas after incorporating the catalyst and increasing the temperature to 120 °C (without CO in the feed gas).
As already mentioned, the last step of the catalytic cycle can no longer be carried out in the absence of CO. Therefore, the Ru complexes formed during the catalytic cycle (Scheme 2) are reduced in the reaction with hydrogen. This reaction appears to be slow compared to the individual steps of the water–gas shift reaction, e.g., the reverse reaction yielding to the active Ru complex with CO, as it hardly takes place in the presence of CO (>3800 ppm). The rate of this reduction reaction therefore decreases with increasing CO content, whereby this reaction is strongly dependent on the CO partial pressure. Above a CO content of more than 3800 ppm, the formation of nanoparticles via this mechanism is rare but can never be ruled out.

4. Materials and Methods

4.1. Catalyst Preparation

The ionic liquids 1-butyl-2,3-dimethylimidazolium chloride [BMMIM]Cl (LOT: 10190054) and dichloromethane (DCM) were purchased from Alfa Aeser (Morecambe, UK, Alfa Aesar, LOT: U30G766). Tricarbonyldichlororuthenium(II) dimer [Ru(CO)3Cl2]2 was purchased from Thermo Scientific (Waltham, MA, USA, LOT: W04F006), and the alumina support (θ-Al2O3, LOT: M10730) was obtained from Sasol Germany GmbH (Hamburg, Germany). The ruthenium-based supported ionic liquid phase (SILP) catalyst was synthesized according to the following sequence. At first, [BMMIM]Cl was dissolved in DCM; then, [Ru(CO)3Cl2]2 was added to the solution. After the Ru dimer had dissolved completely, the alumina support was added into the solution. Next, DCM was removed under reduced pressure by rotary evaporation. During this process, the IL containing the catalyst was soaked into the pores of the alumina support due to capillary forces. A detailed protocol of the catalyst synthesis can be found in [11].

4.2. Experimental Setup

WGSR experiments were performed using an isothermal plug flow reactor with a length of 0.3 m. An oil thermostat was used to adjust the reaction temperature. The individual gas flow rates, i.e., nitrogen (N2), hydrogen (H2), carbon dioxide (CO2), and carbon monoxide (CO), were regulated by mass flow controllers (MFCs). The partial pressure of the water vapor was adjusted by passing nitrogen through a water saturator; the temperature of the saturator was regulated using an oil thermostat. Gas composition was monitored via a gas analysis device. A more detailed description of the entire reactor concept is given in [11]. In each case, steady-state operation with regard to CO conversion was obtained after a run-in period of the catalyst at standard conditions with CO and H2O in the inlet gas stream (pCO = 0.1 bar, pH2O = 0.2 bar, pN2 = 0.7 bar). Then, feed gases with different H2 to CO ratios were fed through these conditioned catalysts at a total constant pressure of 1 bar. After 30 to 75 h time on stream at different fixed temperatures (120–140 °C), the catalysts were exposed again to WGSR standard operating conditions, and a comparative analysis of their activity relative to the initial condition was performed to study if the initial catalytic WGSR activity could be restored.
In situ XRD measurements were performed with finely grinded catalyst particles in an Anton Paar (Graz, Austria) XRK 900 reaction chamber mounted in a Bruker (Billerica, MA, USA) D8 Advance diffractometer (CuKα radiation, Lynxeye XE detector). XRD measurements of the catalyst were carried out before and after heating to 140 °C in a continuous N2 flow. Afterwards, diffractograms were recorded in 10% CO in N2 and in 10% H2 plus 10% CO in N2 at 140 °C. Total pressure was always 1 bar. Finally, measurements were conducted in regular intervals of 4 h for 24 h at 140 °C and 10% H2 in nitrogen.

4.3. Calculations

The volume of ionic liquid per pore volume, expressed as pore filling degree αIL, is given as
α I L = V I L V p o r e
The ratio of active metal (here Ru) to ionic liquid on a molar basis ζ is given as
ζ = n R u n I L
Both parameters are essential for understanding of SILP catalysts. The influence of these parameters on the reaction kinetics was investigated and is reported in [11].
In the SILP-catalyzed WGS reaction, only CO2 is formed as a carbon-containing product (SCO2 → 100%). Thus, the carbon mass balance is described by Equation (4) as
n ˙ C O , i n = n ˙ C O , o u t + n ˙ C O 2 , o u t
Assuming ideal gas behavior, the molar fractions can be determined using Equation (5) as
y C O = n ˙ C O n ˙ i
Combining Equation (5) and the stoichiometry of the WGS reaction, CO conversion can be calculated using the mole fractions on a dry basis (gas analysis after condensation of water) using Equation (6):
X C O = y C O 2 , G A y C O , G A + y C O 2 , G A
Therefore, the CO content at the reactor outlet differs from the CO content at the end of the catalyst bed due to water condensation before entering the gas analysis. The carbon monoxide content present at the outlet of the catalyst bed is calculated according to Equation (7) as
y C O , o u t = X C O n ˙ C O , i n n ˙ i
If a cubic geometry is assumed for the ion pair of the ionic liquid, the theoretical monolayer (NIL = 1) can be easily calculated as
α I L = N I L S B E T M I L V p o r e , 0 ρ I L N A A I P
AIP is the surface area of the ionic liquid, SBET is the BET surface area of the support, NA is the Avogadro number, Vpore,0 is the pore volume of the support (in m3 kgsupport−1), ρIL and MIL represent the IL density and the molar mass, respectively. The theoretical monolayer is defined as the filling degree at which the catalyst support’s inner surface is completely covered with a compact layer of ionic pairs, with anions and cations arranged in a stacked configuration on top of each other [31]. The ruthenium loading on the support (wRu) can be described by the expression given in Equation (9):
θ R u / s u p p o r t = m R u m s u p p o r t
Alternatively, it can be expressed as a function of the pore filling degree (see Equation (2)) and the molar ratio (see Equation (3)) using Equation (10):
θ R u / s u p p o r t = ζ M R u M I L θ I L / s u p p o r t = ζ M R u α I L ρ I L V p o r e , 0 M I L

5. Conclusions

In summary, the Ru SILP catalyst for the WGSR investigated in this work performs at temperatures below 140 °C and should be able to convert CO completely from a thermodynamic perspective. However, complete conversion cannot be achieved, as the catalyst requires CO to remain stable under conditions where H2 is present; otherwise, Ru NPs are formed. In this work, a minimum CO content of about 4000 ppm has been identified to stabilize the complexes of the SILP catalyst at an IL filling degree of 18%, although the catalyst complex was found to also undergo reduction under even higher CO concentrations. One possible option for stabilizing the catalytic complex is to modify the complex with other ligands, rendering the Ru complex stable against reduction in the absence of CO and thus maintaining the catalyst active to achieve the thermodynamic equilibrium conversion of CO at the 140 °C temperature required for PEM application.

Supplementary Materials

The following supporting information can be downloaded at https://www.mdpi.com/article/10.3390/catal15060602/s1. Figure S1: Catalyst regeneration with a carbon monoxide and nitrogen stream. Figure S2: Hydrogen exposure in the presence of CO. CO conversion as a function of time. Figure S3: (a) Deactivation at 120 °C for catalysts with a filling degree of 11% and 19%. (b) Deactivation of a catalyst at 141 °C with a pore filling degree of 9%. Figure S4: X-ray diffractograms of SILP catalyst (αIL = 0.15; ζ = 0.66) of the upper third of the catalyst bed before and after (>700 h TOS) WGS., Figure S5: normalized mass change rates versus temperature for the pure IL [BMMIM]Cl and support + IL (0.11–0.44% filling degree). Figure S6: The Figure shows the reaction rates with respect to the support mass as a function of the pore filling degree (αIL). Figure S7: This Figure shows the influence of the ionic liquid on the activity.

Author Contributions

Conceptualization, F.F.; methodology, F.F.; software, F.F. and J.T.; validation, F.F.; formal analysis, F.F.; investigation, F.F. and J.T.; resources, A.J.; data curation, F.F.; writing—original draft preparation, F.F.; writing—review and editing, F.F., J.T., W.K. and A.J.; visualization, F.F.; supervision, A.J.; project administration, A.J. All authors have read and agreed to the published version of the manuscript.

Funding

This research received no external funding.

Data Availability Statement

The data presented in this study are available upon request from the corresponding author.

Acknowledgments

The authors express their gratitude to Markus Drechsler from the Bavarian Polymer Institute for providing transmission electron microscope (TEM) images for this study. The authors gratefully acknowledge the support of the Center of Energy Technology of the University of Bayreuth. The authors acknowledge AI-based tools for language editing and grammar correction. The authors produced the scientific content and interpretations.

Conflicts of Interest

There are no competing interests to declare.

Abbreviations

The following abbreviations are used in this manuscript:
DCMDichlormethane
ILIonic liquid
LTLow temperature
NoBy the number
NPNanoparticle
PEMProton exchange membrane
SILPSupported ionic liquid phase
TEMTransmission electron microscopy
TOSTime on stream
WGSRWater–gas shift reaction
XRDX-ray diffraction

References

  1. Ratnasamy, C.; Wagner, J. Water Gas Shift Catalysis. Catal. Rev. Sci. Eng. 2009, 51, 325–440. [Google Scholar] [CrossRef]
  2. Divisek, J.; Oetjen, H.-F.; Peinecke, V.; Schmidt, V.M.; Stimming, U. Components for PEM Fuel Cell Systems Using Hydrogen and CO Containing Fuels. Electrochim. Acta 1998, 43, 3811–3815. [Google Scholar] [CrossRef]
  3. Werner, S.; Szesni, N.; Kaiser, M.; Fischer, R.W.; Haumann, M.; Wasserscheid, P. Ultra-Low-Temperature Water-Gas Shift Catalysis Using Supported Ionic Liquid Phase (SILP) Materials. ChemCatChem 2010, 2, 1399–1402. [Google Scholar] [CrossRef]
  4. Yun, S.; Ted Oyama, S. Correlations in Palladium Membranes for Hydrogen Separation: A Review. J. Memb. Sci. 2011, 375, 28–45. [Google Scholar] [CrossRef]
  5. Mishra, A.P.R. A Review on Preferential Oxidation of Carbon Monoxide in Hydrogen Rich Gases. Chem. React. Eng. Catal. 2011, 6, 1–14. [Google Scholar] [CrossRef]
  6. Steinrück, H.P.; Wasserscheid, P. Ionic Liquids in Catalysis. Catal. Lett. 2015, 145, 380–397. [Google Scholar] [CrossRef]
  7. Riisager, A.; Fehrmann, R.; Haumann, M.; Wasserscheid, P. Supported Ionic Liquid Phase (SILP) Catalysis: An Innovative Concept for Homogeneous Catalysis in Continuous Fixed-Bed Reactors. Eur. J. Inorg. Chem. 2006, 2006, 695–706. [Google Scholar] [CrossRef]
  8. Werner, S.; Szesni, N.; Bittermann, A.; Schneider, M.J.; Härter, P.; Haumann, M.; Wasserscheid, P. Screening of Supported Ionic Liquid Phase (SILP) Catalysts for the Very Low Temperature Water-Gas-Shift Reaction. Appl. Catal. A Gen. 2010, 377, 70–75. [Google Scholar] [CrossRef]
  9. Werner, S. Ultra-Low Temperature Water-Gas Shift Reaction with Supported Ionic Liquid Phase (SILP) Catalysts Wassergas-Shift-Katalyse Mit Geträgerten Ionischen Flüssigkeiten Unter Extrem Milden Reaktionsbedingungen. Ph.D. Thesis, Universität Erlangen, Erlangen, Germany, 2011. [Google Scholar]
  10. Werner, S.; Szesni, N.; Fischer, R.W.; Haumann, M.; Wasserscheid, P. Homogeneous Ruthenium-Based Water-Gas Shift Catalysts via Supported Ionic Liquid Phase (SILP) Technology at Low Temperature and Ambient Pressure. Phys. Chem. Chem. Phys. 2009, 11, 10817–10819. [Google Scholar] [CrossRef]
  11. Fischer, F.; Jess, A. Kinetic Study of the Water-Gas Shift Reaction at Ultralow Temperature over a Ru-Based Supported Ionic Liquid Phase Catalyst. Chem. Ing. Tech. 2022, 94, 1695–1703. [Google Scholar] [CrossRef]
  12. Scholten, J.D.; Leal, B.C.; Dupont, J. Transition Metal Nanoparticle Catalysis in Ionic Liquids. ACS Catal. 2012, 2, 184–200. [Google Scholar] [CrossRef]
  13. He, Z.; Alexandridis, P. Nanoparticles in Ionic Liquids: Interactions and Organization. Phys. Chem. Chem. Phys. 2015, 17, 18238–18261. [Google Scholar] [CrossRef] [PubMed]
  14. Seitkalieva, M.M.; Samoylenko, D.E.; Lotsman, K.A.; Rodygin, K.S.; Ananikov, V.P. Metal Nanoparticles in Ionic Liquids: Synthesis and Catalytic Applications. Coord. Chem. Rev. 2021, 445, 213982. [Google Scholar] [CrossRef]
  15. Dupont, J.; Scholten, J.D. On the Structural and Surface Properties of Transition-Metal Nanoparticles in Ionic Liquids. Chem. Soc. Rev. 2010, 39, 1780–1804. [Google Scholar] [CrossRef]
  16. Wegner, S.; Janiak, C. Metal Nanoparticles in Ionic Liquids. Top. Curr. Chem. 2017, 375, 65. [Google Scholar] [CrossRef]
  17. Janiak, C. Ionic Liquids for the Synthesis and Stabilization of Metal Nanoparticles. Z. Naturforschung—Sect. B J. Chem. Sci. 2013, 68, 1059–1089. [Google Scholar] [CrossRef]
  18. Kratzer, E.; Schötz, S.; Maisel, S.; Blaumeiser, D.; Khan Antara, S.; Ewald, L.; Dotzel, D.; Haumann, M.; Görling, A.; Korth, W.; et al. Wilkinson-Type Catalysts in Ionic Liquids for Hydrogenation of Small Alkenes: Understanding and Improving Catalyst Stability. Catal. Sci. Technol. 2023, 13, 2053–2069. [Google Scholar] [CrossRef]
  19. Marinkovic, J.M.; Riisager, A.; Franke, R.; Wasserscheid, P.; Haumann, M. Fifteen Years of Supported Ionic Liquid Phase-Catalyzed Hydroformylation: Material and Process Developments. Ind. Eng. Chem. Res. 2019, 58, 2409–2420. [Google Scholar] [CrossRef]
  20. Bauer, T.; Stepic, R.; Wolf, P.; Kollhoff, F.; Karawacka, W.; Wick, C.R.; Haumann, M.; Wasserscheid, P.; Smith, D.M.; Smith, A.S.; et al. Dynamic Equilibria in Supported Ionic Liquid Phase (SILP) Catalysis: In Situ IR Spectroscopy Identifies [Ru(CO)XCly]n Species in Water Gas Shift Catalysis. Catal. Sci. Technol. 2018, 8, 344–357. [Google Scholar] [CrossRef]
  21. Stepić, R.; Wick, C.R.; Strobel, V.; Berger, D.; Vučemilović-Alagić, N.; Haumann, M.; Wasserscheid, P.; Smith, A.; Smith, D.M. Mechanism of the Water–Gas Shift Reaction Catalyzed by Efficient Ruthenium Based Catalysts: A Computational and Experimental Study. Angew. Chem. 2018, 58, 741–745. [Google Scholar] [CrossRef]
  22. Upadhyay, P.R.; Srivastava, V. Ionic Liquid Mediated In Situ Synthesis of Ru Nanoparticles for CO2 Hydrogenation Reaction. Catal. Lett. 2017, 147, 1051–1060. [Google Scholar] [CrossRef]
  23. Nandanwar, S.U.; Chakraborty, M.; Mukhopadhyay, S.; Shenoy, K.T. Stability of Ruthenium Nanoparticles Synthesized by Solvothermal Method. Cryst. Res. Technol. 2011, 46, 393–399. [Google Scholar] [CrossRef]
  24. Garbis, P.; Kern, C.; Jess, A. Kinetics and Reactor Design Aspects of Selective Methanation of CO over a Ru/γ-Al2O3 Catalyst in CO2/H2 Rich Gases. Energies 2019, 12, 469. [Google Scholar] [CrossRef]
  25. Sobota, M.; Schernich, S.; Schulz, H.; Hieringer, W.; Paape, N.; Wasserscheid, P.; Görling, A.; Laurin, M.; Libuda, J. Preparation and Characterization of Ultrathin [Ru(CO)3Cl2]2 and [BMIM][Tf2N] Films on Al2O3/NiAl(110) under UHV Conditions. Phys. Chem. Chem. Phys. 2012, 14, 10603–10612. [Google Scholar] [CrossRef]
  26. Heym, F. Dampfdruck Und Thermische Zersetzung Reiner Und Geträgerter Ionischer Flüssigkeiten. Ph.D. Thesis, Universität Bayreuth, Bayreuth, Germany, 2013. [Google Scholar]
  27. Gerritsen, L.A.; Herman, J.M.; Scholten, J.J.F. Hydroformylation with Supported Liquid Phase Rhodium Catalysts Part III Influence of the Type of Support, the Degree of Pore Filling and Organic Additives on the Catalytic Performance. J. Mol. Catal. 1980, 9, 241–256. [Google Scholar] [CrossRef]
  28. Ohlin, C.A.; Dyson, P.J.; Laurenczy, G. Carbon Monoxide Solubility in Ionic Liquids: Determination, Prediction and Relevance to Hydroformylation. Chem. Commun. 2004, 4, 1070–1071. [Google Scholar] [CrossRef]
  29. Haumann, M.; Riisager, A. Hydroformylation in Room Temperature Ionic Liquids (RTILs): Catalyst and Process Developments. Chem. Rev. 2008, 108, 1474–1497. [Google Scholar] [CrossRef]
  30. Strobel, V. Towards Rational Design of SILP Catalysts: A Water-Gas Shift Reaction Case Study Reaktionstechnische Modellierung von SILP Katalysatoren Am Beispiel Der Wasser-Gas Shift Reaktion. Ph.D. Thesis, Universität Erlangen, Erlangen, Germany, 2020. [Google Scholar]
  31. Rietzler, F.; May, B.; Steinrück, H.P.; Maier, F. Switching Adsorption and Growth Behavior of Ultrathin [C2C1Im][OTf] Films on Au(111) by Pd Deposition. Phys. Chem. Chem. Phys. 2016, 18, 25143–25150. [Google Scholar] [CrossRef]
Figure 1. Activity effects due to carbon monoxide removal from the feed gas. The experiments were conducted under identical WGSR conditions, with the run-in phase of the catalysts excluded from the plotted data. Following the reduction period, represented by the gray areas, the initial WGSR conditions were restored. WGSR conditions: Treaction = 120 °C, total = 12 nL h−1, mSILP = 2–3 g, ptotal = 1 bar, pCO = 0.1 bar, pH2O = 0.2 bar, pN2 = 0.7 bar. Reduction conditions: pH2 = 0.1 bar, pN2 = 0.9 bar, Treaction = 120 °C/140 °C. (a) Temperature variation. (b) Variation in pore filling degree.
Catalysts 15 00602 g001
Figure 2. TEM images and the images of the catalysts (left upper corner of (a,b)) (a) of the fresh WGSR catalyst (orange-brownish) and (b) the reduced WGSR catalyst (black). The circular, nm scale dark entities shown in (b), which were not found anywhere in the reference, appear to correspond to ruthenium (Ru) nanoparticles.
Catalysts 15 00602 g002
Figure 3. X-ray diffractograms of the catalyst during hydrogen exposure. The (ICDD-database) PDF card numbers are monoclinic θ-Al2O3 (01-086-1410) and metallic Ru (00-006-0663). The catalyst was exposed to an atmosphere of 10% hydrogen in nitrogen for 24 h reduction, during which in situ X-ray diffraction (XRD) measurements were performed at intervals of 4 h. Prior to XRD measurement, the catalyst had already been heated in pure nitrogen and exposed to an atmosphere of 10% CO, 10% H2, and 80% N2. However, the XRD measurements preceding hydrogen exposure showed identical XRD patterns as the reference measurement, and therefore, they are not presented here. (a) XRD measurement at the beginning of the reduction (red, TOS = 0, T = 140 °C) and at the end of the reduction (black, TOS = 24 h, T = 140 °C); (b) In situ X-ray diffraction patterns of the reduction process (every 4 h). αIL = 18%, ζ = 0.67.
Catalysts 15 00602 g003
Figure 4. X-ray diffractograms of the catalyst before and after (20 h) exposition with carbon monoxide and hydrogen at the same time. The (ICDD-database) PDF card numbers are monoclinic θ-Al2O3 (01-086-1410) and metallic Ru (00-006-0663). The catalyst was exposed to an atmosphere of 10% H2, 10% CO in nitrogen. The catalyst used had a pore filling degree of 43% and a mass ratio of 0.67.
Catalysts 15 00602 g004
Figure 5. Deactivation of SILP catalysts between 15 and 22% filling degree. The deactivation is shown by the decreasing CO conversion and the corresponding increasing CO content at the end of the catalyst bed. The orange line represents equilibrium conversion of CO at 140 °C. The graphs show the CO conversion over time for: (a) a catalyst with a filling degree of 22%, (b) a catalyst with a filling degree of 15%, (c) a series of catalysts with filling degrees between 15% and 22%, and (d) a direct comparison of the long-term performance of catalysts with 15% and 22% filling degree. Arrows indicate the corresponding axis for each data set, distinguishing between CO conversion and CO concentration. The CO partial pressure was systematically changed for a filling degree of αIL = 18.5% in order to investigate this influence more comprehensively. As the reduction in partial pressure led to an augmentation in conversion, the alterations in the purple curve are evident through the discontinuities in conversion. Constant parameters in all experiments: ζ = 0.68 ± 0.04, Treaction = 140 °C, pH2O = 0.3 bar, ptotal = 1 bar, prest = N2. Varied parameters: αIL = 0.15: mSILP = 9.2 g, total = 5.9 nL h−1, pCO = 0.095 bar; αIL = 0.168: mSILP = 9.5 g, total = 5.9 nL h−1, pCO = 0.10 bar; αIL = 0.21: mSILP = 9.5 g, total = 5.9 nL h−1, pCO = 0.11 bar; αIL = 0.22: mSILP = 9.5 g, total = 5.9 nL h−1, pCO = 0.11 bar; αIL = 0.185: mSILP = 9.9 g, TOS (0–28 h): total = 5.9 nL h−1, pCO = 0.11 bar. TOS (28–108 h): total = 5.5 nL h−1, pCO = 0.069 bar; TOS (108 h–end): total = 5.4 nL h−1, pCO = 0.058 bar.
Catalysts 15 00602 g005
Figure 6. Visual analysis of the reduction of the catalyst bed. The visual analysis confirms the results of the activity tests. At yCOout degrees below 3800 ppm, the catalyst turned black from the bottom. There was a strong color gradient at all times. At filling degrees above the limit (αIL,limit ≈ 16.8–18.5%), the catalyst bed remained like this, with the catalyst above the black part of the catalyst retaining the color it had in the active state. At lower fill degrees, the whole bed turned black.
Catalysts 15 00602 g006
Scheme 1. A possible pathway for the cleavage of the chloride ligands is shown, abbreviated as ‘Red’. The Ru complex is reduced to Ru nanoparticles by the uptake of chloride ions by H2 present in the system, whereby H2 itself is oxidized, leading to hydrochloric acid (HCl). The reduction also occurs through formation of [BMMIM]Cl. The carbonyl groups present on the complex are cleaved by temperature or by a new WGSR cycle, leading to CO2. Note that this reaction step can occur at any point along the pathway. In addition, the reduction reactions can take place in a different order.
Catalysts 15 00602 sch001
Scheme 2. The diagram shows the proposed catalytic cycle of the most prevalent active Ru complex, [Ru(CO)3Cl3] [21]. The final step, represented by the red dashed section of CO addition, cannot be formed again without CO in the feed gas. This leads to a Ru complex with fewer bound carbonyl groups. Any Ru complex with a chloride and a carbonyl ligand can, in principle, catalyze the WGSR. The Ru complex undergoes a WGSR catalysis cycle until no more CO ligands bind to the central Ru atom. H2 in the system can reduce the Ru complex at various points within the WGSR cycles shown.
Catalysts 15 00602 sch002
Table 1. Activity losses of the catalysts after exposure to a specific gas composition for 25–75 h. The same conditions (pH2O = 0.2 bar; pCO = 0.1 bar; Treaction = 120 °C) were set before and after exposure. The catalysts had a molar ratio ζ of 0.69 ± 0.05, total = 12–18 nL h−1, mSILP = 2–4 g, ptotal = 1 bar, prest = N2. The relative activity, which quantifies deactivation, is calculated as the ratio of the steady-state conversion following exposure to the steady-state conversion observed prior to exposure. Deactivation during exposure is negligible when the relative activity is greater than 90% (blue and below 90% red). Conversely, deactivation below this threshold is assumed to be relevant. Catalysts without deactivation (here greater than 93%) could be subjected to a new deactivation measurement by means of gas exposure after renewed steady state. The measurements were grouped into seven discrete exposure categories. The CO (blue) and H2 (red) contents in the gas flow during period 2 are shown in different colors.
No.αILFeed Gas Composition (Rest N2),
Period Duration and Temperature
XCO, P1
in %
XCO, P3 in %Rel. Activity
(XCO, P3/XCO, P1) in %
Period 1Period 2Period 3
Ref.0.18WGSR:
10% CO, 20% H2O
steady state b
120 °C
WGSR: 10% CO, 20% H2O, 60 h, 120 °CWGSR:
10% CO,
20% H2O
10–90 h c
120 °C
13.613.6100
10.1810% H2, 30 h, 120 °C13.31.3810
0.1810% H2, 45 h a, 120 °C13.300
0.1810% H2, 30 h, 140 °C1400
0.1510% H2, 30 h, 120 °C12.200
0.2210% H2, 30 h, 120 °C12.54.435
0.2210% H2, 45 h a, 120 °C12.52.419
20.1810% H2, 10% CO, 30 h, 120 °C1413.798
0.1890% H2, 10% CO, 30 h, 120 °C13.21291
30.1810% CO, 40 h, 120 °C13.913.698
40.1810% H2O, 30 h, 120 °C12758
0.1110% H2, 10% H2O; 30 h, 120 °C1000
0.1810% H2, 10% H2O; 30 h, 120 °C13.500
50.1810% H2, 10% CO2, 30 h, 120 °C12.200
60.1156% H2, 20% H2O,
10% CO, 9% CO2,
5 h, 140 °C + 25 h, 120 °C
8.77.789
0.1870% H2, 20% H2O, 10% CO 30 h, 120 °C14.513.993
70.18100% N2, 60 h, 120 °C8.58.296
0.18100% N2, 75 h, 40 °C13.413.198
a The total duration of 45 h consists of a hydrogen exposure of 30 h and an exposure of 15 h. A transition to WGSR conditions occurred between the individual exposures. b The term “steady state” is used to describe a period of at least ten hours during which the catalysts (i.e., the activity) are in a stationary state and is achieved if the relative decrease in conversion (1-XCO,t1/XCO,t2) during this period is less than 4%. It should be noted that the run-in time of the catalysts until the steady state was reached was not included in the present study. The run-in time is dependent on the filling degree of the SILP catalyst. Catalysts with a filling degree in the range of the theoretical monolayer (16–18%) are virtually in a steady state from the time of installation. In contrast, lower and higher filling degrees have longer run-in phases. c As part of the present study, it was initially investigated whether a renewed increase in activity was occurring. Subsequently, the respective duration of the increase in activity was observed.
Disclaimer/Publisher’s Note: The statements, opinions and data contained in all publications are solely those of the individual author(s) and contributor(s) and not of MDPI and/or the editor(s). MDPI and/or the editor(s) disclaim responsibility for any injury to people or property resulting from any ideas, methods, instructions or products referred to in the content.

