Article

Development of Cu3P/SnS2 Composite and Its High Efficiency Electrocatalytic Reduction of Carbon Dioxide

1
School of Energy and Power Engineering, University of Shanghai for Science and Technology, Shanghai 200093, China
2
Huzhou Institute of Zhejiang University, Huzhou 313000, China
3
Zhejiang Provincial Atmospheric Detection Technical Support Center, Hangzhou 310002, China
4
Research Institute of Fudan University in Ningbo, Ningbo 315204, China
5
Shanghai Non-Carbon Energy Conversion and Utilization Institute, Shanghai 200240, China
*
Author to whom correspondence should be addressed.
Catalysts 2025, 15(6), 552; https://doi.org/10.3390/catal15060552
Submission received: 25 April 2025 / Revised: 26 May 2025 / Accepted: 28 May 2025 / Published: 3 June 2025
(This article belongs to the Special Issue CO2 Catalytic Valorization and Utilization)

Abstract

With the increase of CO2 emissions caused by human activities, the development of efficient CO2 reduction technology is crucial to help address the energy crisis and mitigate climate change. In this study, a series of Cu3P/SnS2 composites with varying Cu/Sn molar ratios were synthesized using a hydrothermal method to improve the activity and selectivity of the electrocatalytic reduction of CO2 (CO2RR). The successful synthesis and structural advantages of the composite were verified via XRD, XPS, SEM, TEM, and BET. Cu3P/SnS2-3 (Cu/Sn = 2:1) had the largest specific surface area (78.01 m2 g−1) and abundant active sites. The electrochemical performance test showed that in 0.1 M KHCO3 electrolyte saturated with CO2, the Faraday efficiency of Cu3P/SnS2-3 to CO reached 87% at −1.0 V potential, which was 29 times and 1.78 times higher than that of Cu3P (3%) and SnS2 (48.88%). In addition, the catalyst maintained a CO Faraday efficiency of more than 75% in a 5 h stability test. The mechanism study shows that the low Tafel slope, low charge transfer resistance, and high electrochemically active area of the composite significantly promote the CO2RR kinetics.

1. Introduction

The increasing CO2 released by human activities has gradually broken the balance between the production and consumption of carbon dioxide on Earth [1], causing energy crises and climate change, and the problem of global warming is imminent [2,3]. Concerns about the increasing concentration of carbon dioxide in the atmosphere have accelerated the development of various CO2 reduction and conversion technologies, including chemical [4,5], photochemical [6,7], electrochemical, and photoelectrochemical methods [8,9,10]. The hope is to convert CO2 into value-added chemical products and fuels and contribute to a sustainable carbon cycle [11,12]. Direct electrocatalytic reduction of CO2 (CO2RR) into fuels and useful chemical products is a viable way to rebalance the carbon cycle. The electricity in the CO2RR process comes from a variety of renewable energy sources, such as solar, wind, hydrothermal, and tidal energy [13], and the electrolytes can be recycled. Therefore, CO2RR is considered as an ideal means of CO2 reduction. This method can not only effectively alleviate the over-dependence on fossil energy but also provide valuable resources for the industrial sector [14,15,16].
Electrochemical catalytic removal of CO2 from the atmosphere has great development prospects [17]. However, traditional electrocatalysts have problems, such as poor selectivity, low energy efficiency, and high onset potential, which greatly limit the electrocatalytic efficiency [18]. In the long-term development process of electrocatalytic technology, a series of improvement methods have been summarized to enhance the electrocatalytic activity. In terms of the improvement of electrocatalysts, it can be achieved by constructing bimetallic materials, metal oxides, preparing nitrogen-doped carbon materials (NCs), constructing metal–organic framework materials (MOFs), etc. [19,20,21,22,23,24,25]. Due to the advantages of rich reserves and low price of metal copper, scholars have carried out a large number of studies on its morphology, crystal phase, exposed surface, defect sites, oxidation state, alloying, surface modification strategies, etc., aiming to improve its electrocatalytic selectivity and activity [26]. For example, Peng et al. successfully synthesized the Cu3P/C nanocomposite using the copper–organic framework as a precursor. The research shows that this nanocomposite has high activity and good selectivity for the CO2 reduction reaction. The onset potential is about −0.25 V, and when the potential is −0.3 V, the Faraday efficiency of CO reaches 47%. In addition, metal Sn shows selectivity for the formation of formic acid in the process of electrocatalytic reduction of CO2, and it has non-toxic and environmentally friendly characteristics. Therefore, as an efficient electrochemical catalyst for CO2, it has received extensive research and attention in the academic community [27,28]. He et al. successfully prepared the catalyst SnS2 for electrocatalytic reduction of CO2. The research shows that in terms of formic acid production, this catalyst has a high Faraday efficiency of 94% and excellent stability. This is because the thin atomic layer of the catalyst SnS2 is beneficial to the key initial step of generating the HCOO* intermediate, and its electron-rich surface further promotes the subsequent proton–electron transfer, thus promoting the electrocatalytic CO2 reduction reaction [29]. In addition, combining with another metal to form a bimetallic catalyst can also effectively enhance the catalytic performance [30,31]. Compared with the selectivity exhibited by copper, the bimetallic catalyst of Cu shows further improvement in the catalytic performance of CO2RR. For instance, in the study by Yang et al., Sn-doped copper-based bimetallic catalysts were synthesized, demonstrating a Faraday efficiency of 98% for CO and long-term stability, which was attributed to the weakened adsorption capacity of the Sn-doped Cu surface for the intermediate *CO [32].
In this work, cuprous phosphide and tin disulfide were combined to improve the catalytic activity and selectivity by adjusting the morphology and surface-active site of the catalyst (Figure 1a). Cuprous phosphide tin disulfide composite is mainly obtained by a simple hydrothermal reaction. In this work, the effect of the molar ratio of Cu to Sn on the electrocatalytic carbon dioxide reduction as well as the effect of different potentials, different electrolytes and catalyst loads on the electrocatalytic performance were studied.

2. Results and Discussion

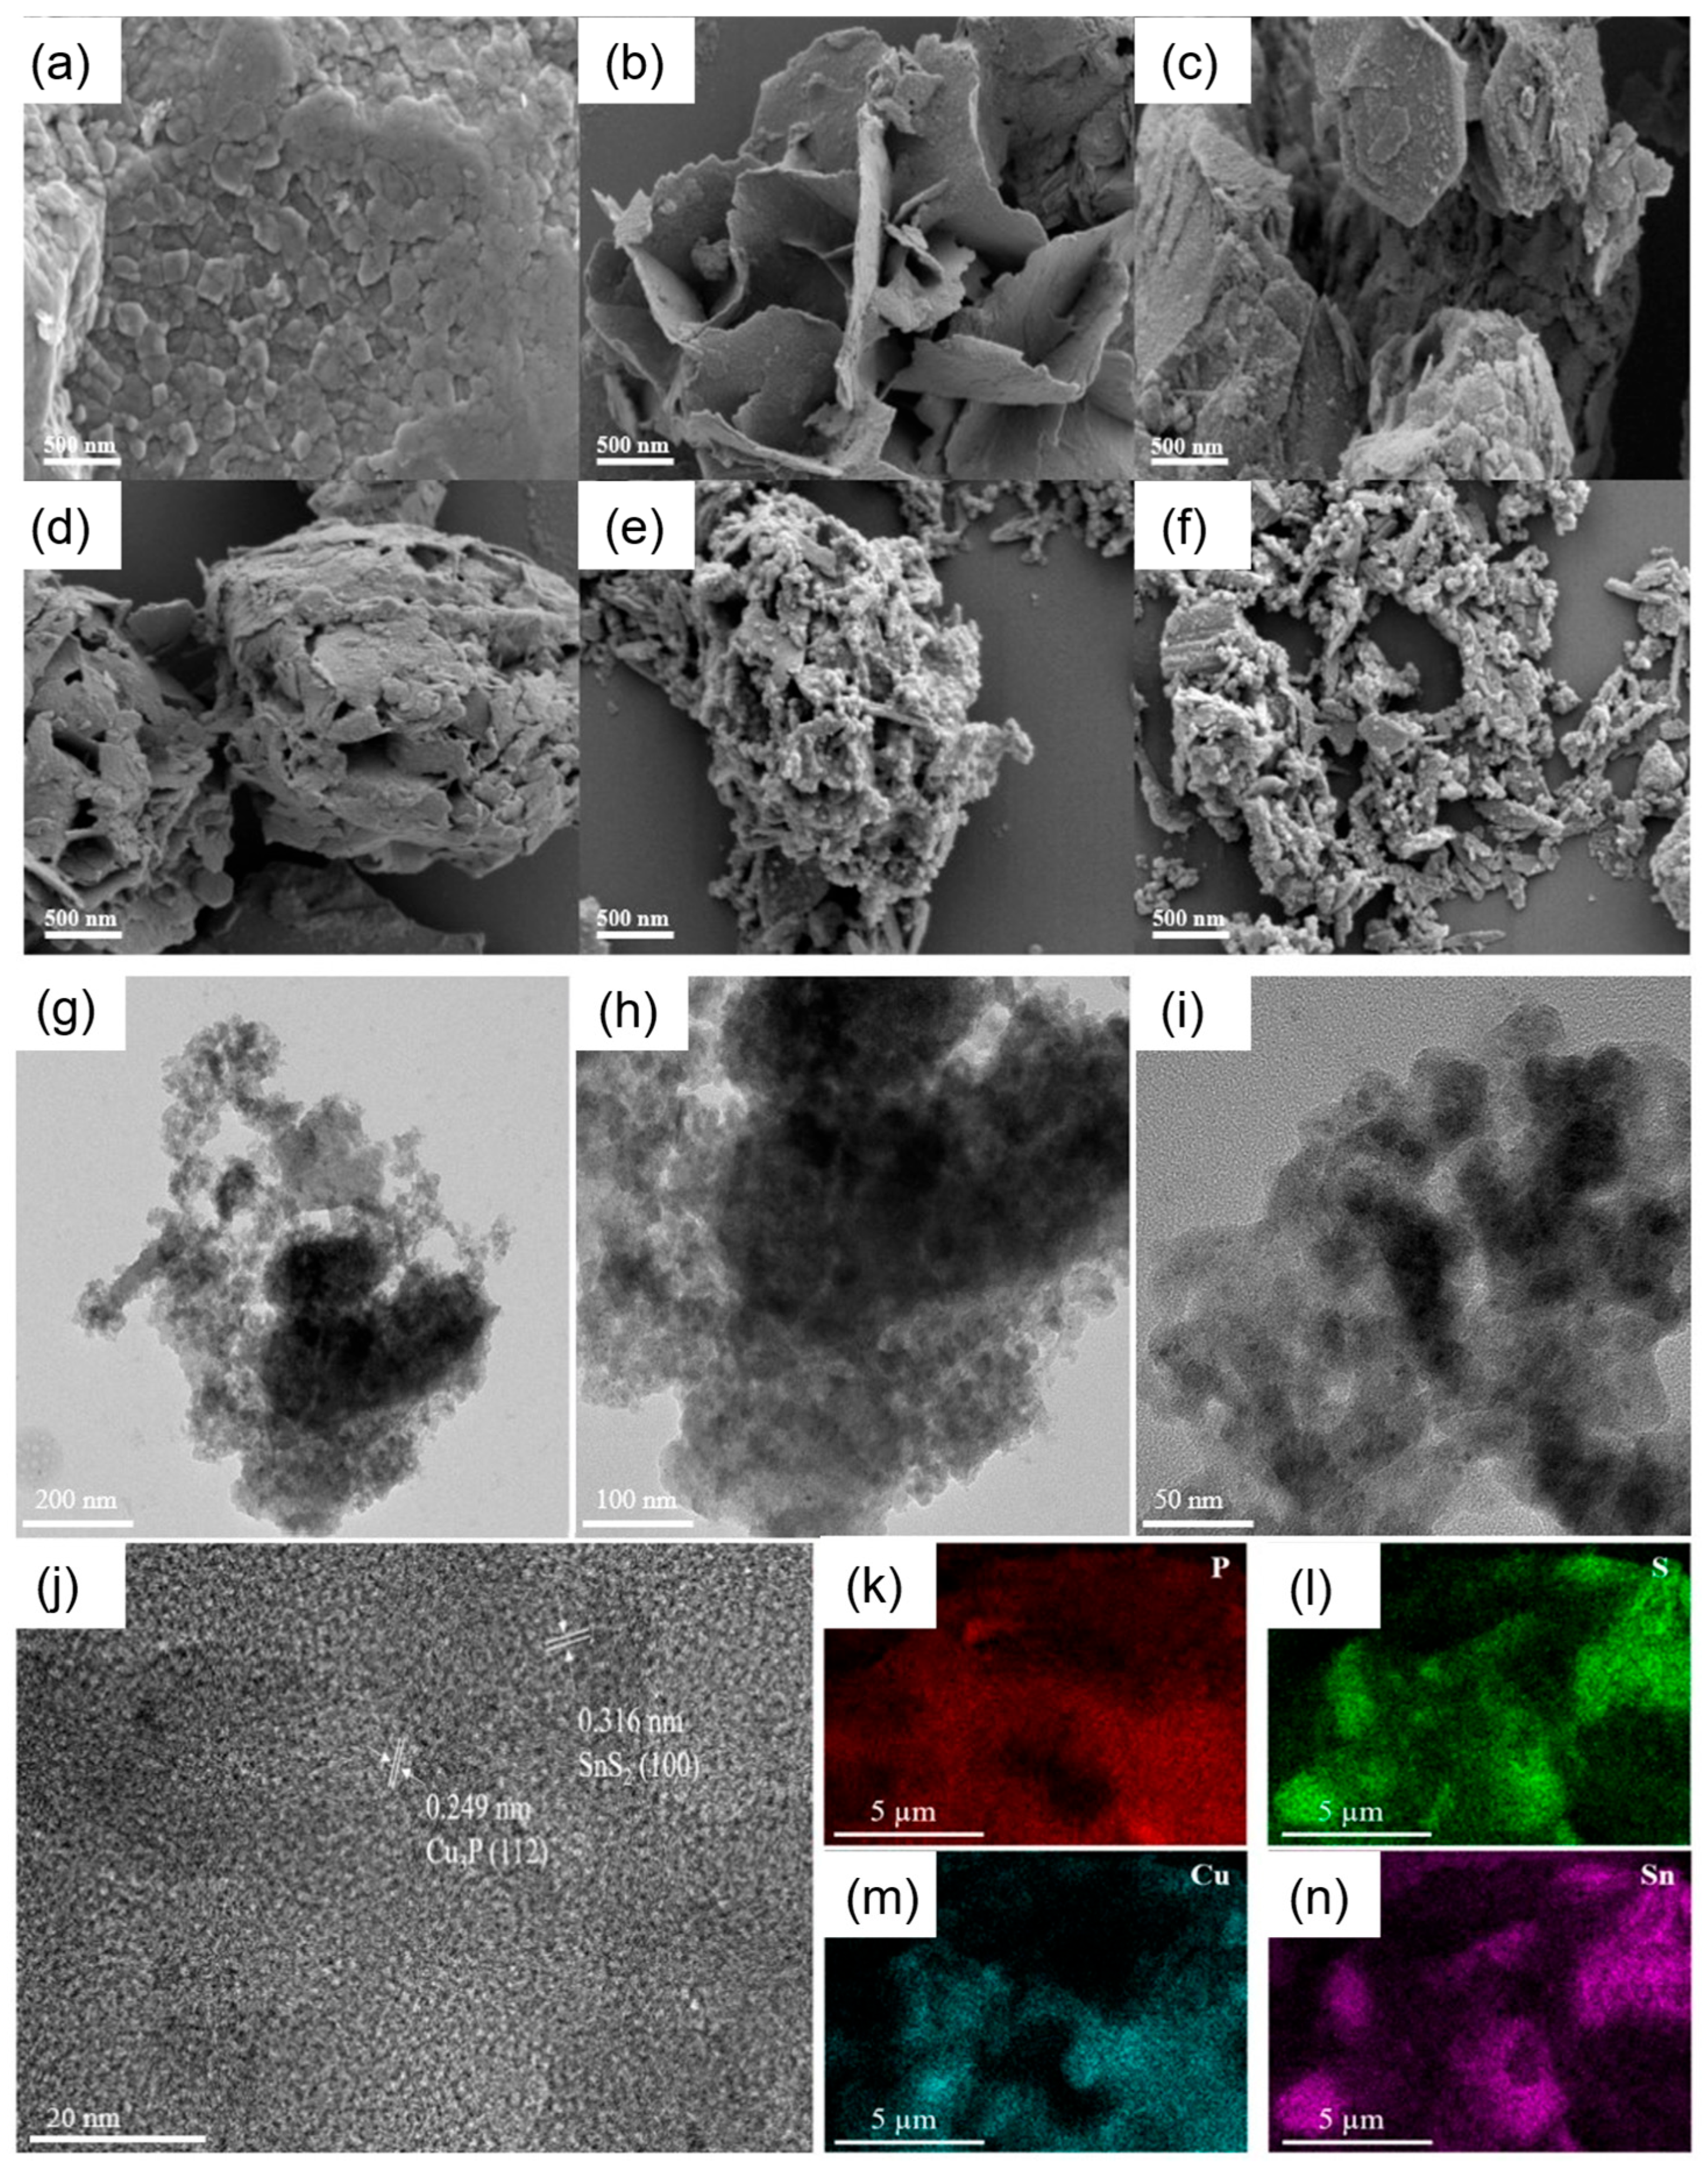
2.1. Synthesis and Characterization of Cu3P/SnS2 Catalysts

In order to determine the crystal structure characteristics of Cu3P, SnS2, and Cu3P/SnS2 composites, XRD tests were conducted on the prepared samples. As can be seen from Figure 1b, the diffraction angles of Cu3P samples at 36.0°, 39.1°, 45.1°, 46.2°, and 47.3° correspond to the elemental phase of Cu3P (PDF#71-2261), corresponding to the crystal faces of Cu3P (112), (202), (300), (113), and (212), and there are fewer hybrid peaks. This phenomenon indirectly indicates that the prepared Cu3P sample has a high purity. It can also be seen from the figure that the diffraction peaks of SnS2 at 28.2°, 32.1°, 41.9°, 50.0°, 52.5°, 55.0°, and 67.2° are completely consistent with the SnS2 standard card (PDF#23-0677). Corresponding to the (100), (101), (102), (110), (111), (103), and (202) crystal planes of SnS2, indicating the successful synthesis of SnS2. In the composite Cu3P/ SnS2-1-4, the diffraction peaks of both Cu3P and SnS2 can be observed, and with the increase in the molar ratio of Cu3P/SnS2, the diffraction peaks of Cu3P can be seen to gradually increase, which proves the successful synthesis of the composite Cu3P/SnS2. In order to investigate the elemental composition and chemical state of Cu3P/SnS2-3 composites, XPS was used to characterize them. Figure S1a shows the full spectrum of XPS. Characteristic peaks of Cu, O, Sn, C, S, and P are detected in the range of 0–1200 eV, indicating that the sample contains these six elements. Figure 1c shows the high-resolution XPS spectrum of Cu 2p. Strong peaks at 932.6 eV and 952.6 eV indicate the presence of Cu(0) or Cu(I), and weak peaks at 934.3 eV and 954.1 eV indicate the presence of a small amount of Cu(II). The satellite peaks at 944.2 eV and 963.0 eV may be related to surface oxidation. Combined with XRD results, the peaks at 932.6 eV and 952.6 eV are likely to belong to Cu 2p3/2 and Cu 2p1/2 of Cu3P. The quantitative analysis showed that Cu(I) accounted for 82.2% and Cu(II) accounted for 17.8%, among which Cu(I) was the catalytic active center, which was conducive to the electrocatalytic reduction of CO2. Figure 1e shows the high-resolution XPS spectra of P 2p. The peaks at 129.1eV and 130.1 eV correspond to the peaks at P 2p3/2 and P 2p1/2, 133.6 eV in Cu3P, respectively, indicating the presence of P-O structure, which may be caused by surface oxidation of Cu3P. Figure 1d shows the Sn 3d fine scan. The peaks at 486.6 eV and 495.0 eV belong to Sn4+ 3d5/2 and Sn4+ 3d3/4, respectively. Figure 1f shows the S 2p high-resolution XPS spectrum, and the peaks at 161.3 eV and 162.5 eV are attributed to S 2p3/2 and S 2p1/2 of SnS2, respectively. Figure S2 shows the nitrogen absorption and desorption curves of pure Cu3P, SnS2, and Cu3P/SnS2-3. Cu3P/SnS2-3 has the largest BET specific surface area (78.01 m2 g−1), and the total pore volume is 0.0875 cm3 g−1. The BET specific surface area of Cu3P was 1.43 m2 g−1, and the total pore volume of Cu3P was 0.0014 cm3 g−1. The BET specific surface area of pure SnS2 is only 0.6079 m2 g−1, and the total pore volume of a single point is 0.0007 cm3 g−1. Compared with Cu3P and SnS2, Cu3P/SnS2-3 has a larger specific surface area, which is conducive to improving the catalytic performance of the material and has a better potential in electrocatalytic reduction of CO2. Cu3P usually has a close-packed crystal structure, and the specific surface area of the SnS2 is limited if the stacking spacing is insufficient or the open porous structure is not formed. Cu3P/SnS2-3 may form a new micropore or mesoporous structure through its unique interface and structural reconstruction, and Cu3P particles can be embedded into the SnS2 structure to form an interpenetrating network, increasing the porosity and channel and greatly increasing the specific surface area. In addition, the hydrothermal method during synthesis optimizes the nanostructure, promotes particle dispersion and interface contact, and also helps to increase its specific surface area.
In order to characterize the Cu3P/SnS2 composite, scanning electron microscope (SEM) scanning was used to investigate the Cu3P/SnS2 1-4 composite and the pure sample Cu3P and SnS2. According to Figure 2a, Cu3P appears to be particles or patches of different sizes, with particles gathering together and being densely arranged, and the Spaces between particles are small. Figure 2b shows that SnS2 has a flower-like structure composed of thin sheets, which makes it have a large surface area and provides more spots for the loaded Cu3P. Figure 2c–f show the SEM diagram of Cu3P/SnS2 1-4. It can be observed that Cu3P is loaded on the SnS2 surface. With the increase in Cu/Sn molar ratio, the number of particles in Cu3 increased, and the structure of SnS2 gradually changed from flake to fluffy flake ball and eventually to stacked flake structure, which caused the void and specific surface area of the composite to change correspondingly. In Figure 2e, Cu3P was more evenly loaded and denser, and the fluffy flake flower ball SnS2 had a large specific surface area, indicating a potential optimal molar ratio Cu/Sn of 2:1. The results above confirm that Cu3P is successfully loaded on the SnS2 surface, so Cu3P/SnS2 composite is successfully synthesized. In addition, transmission electron microscopy (TEM) was used to investigate the morphology, composition, and structure of the catalyst. According to Figure 2g–i, Cu3P/SnS2-3 was composed of a crisscrow-sided sheet structure and an agnate granular structure. The granular structure was evenly loaded on the sheet structure, and a great voidage formed in the structure. According to Figure 2j, the lattice spacing was about 0.249 nm, which was consistent with the theoretical value of the (112) crystal face spacing of Cu3P. In addition, the 0.316 nm crystal face spacing was also analyzed, which was consistent with the SnS2 (100) crystal face. EDS tests were carried out to clarify element composition, as shown in Figure 2k–n, where red represents P element, green represents S element, blue represents Cu element, and purple represents Bi element. It can be observed that the sample is mainly composed of Cu, P, Sn, and S elements, and these elements are evenly distributed in the sample. The results of XRD and SEM indicate that Cu3P/SnS2-3 composite has been synthesized successfully.

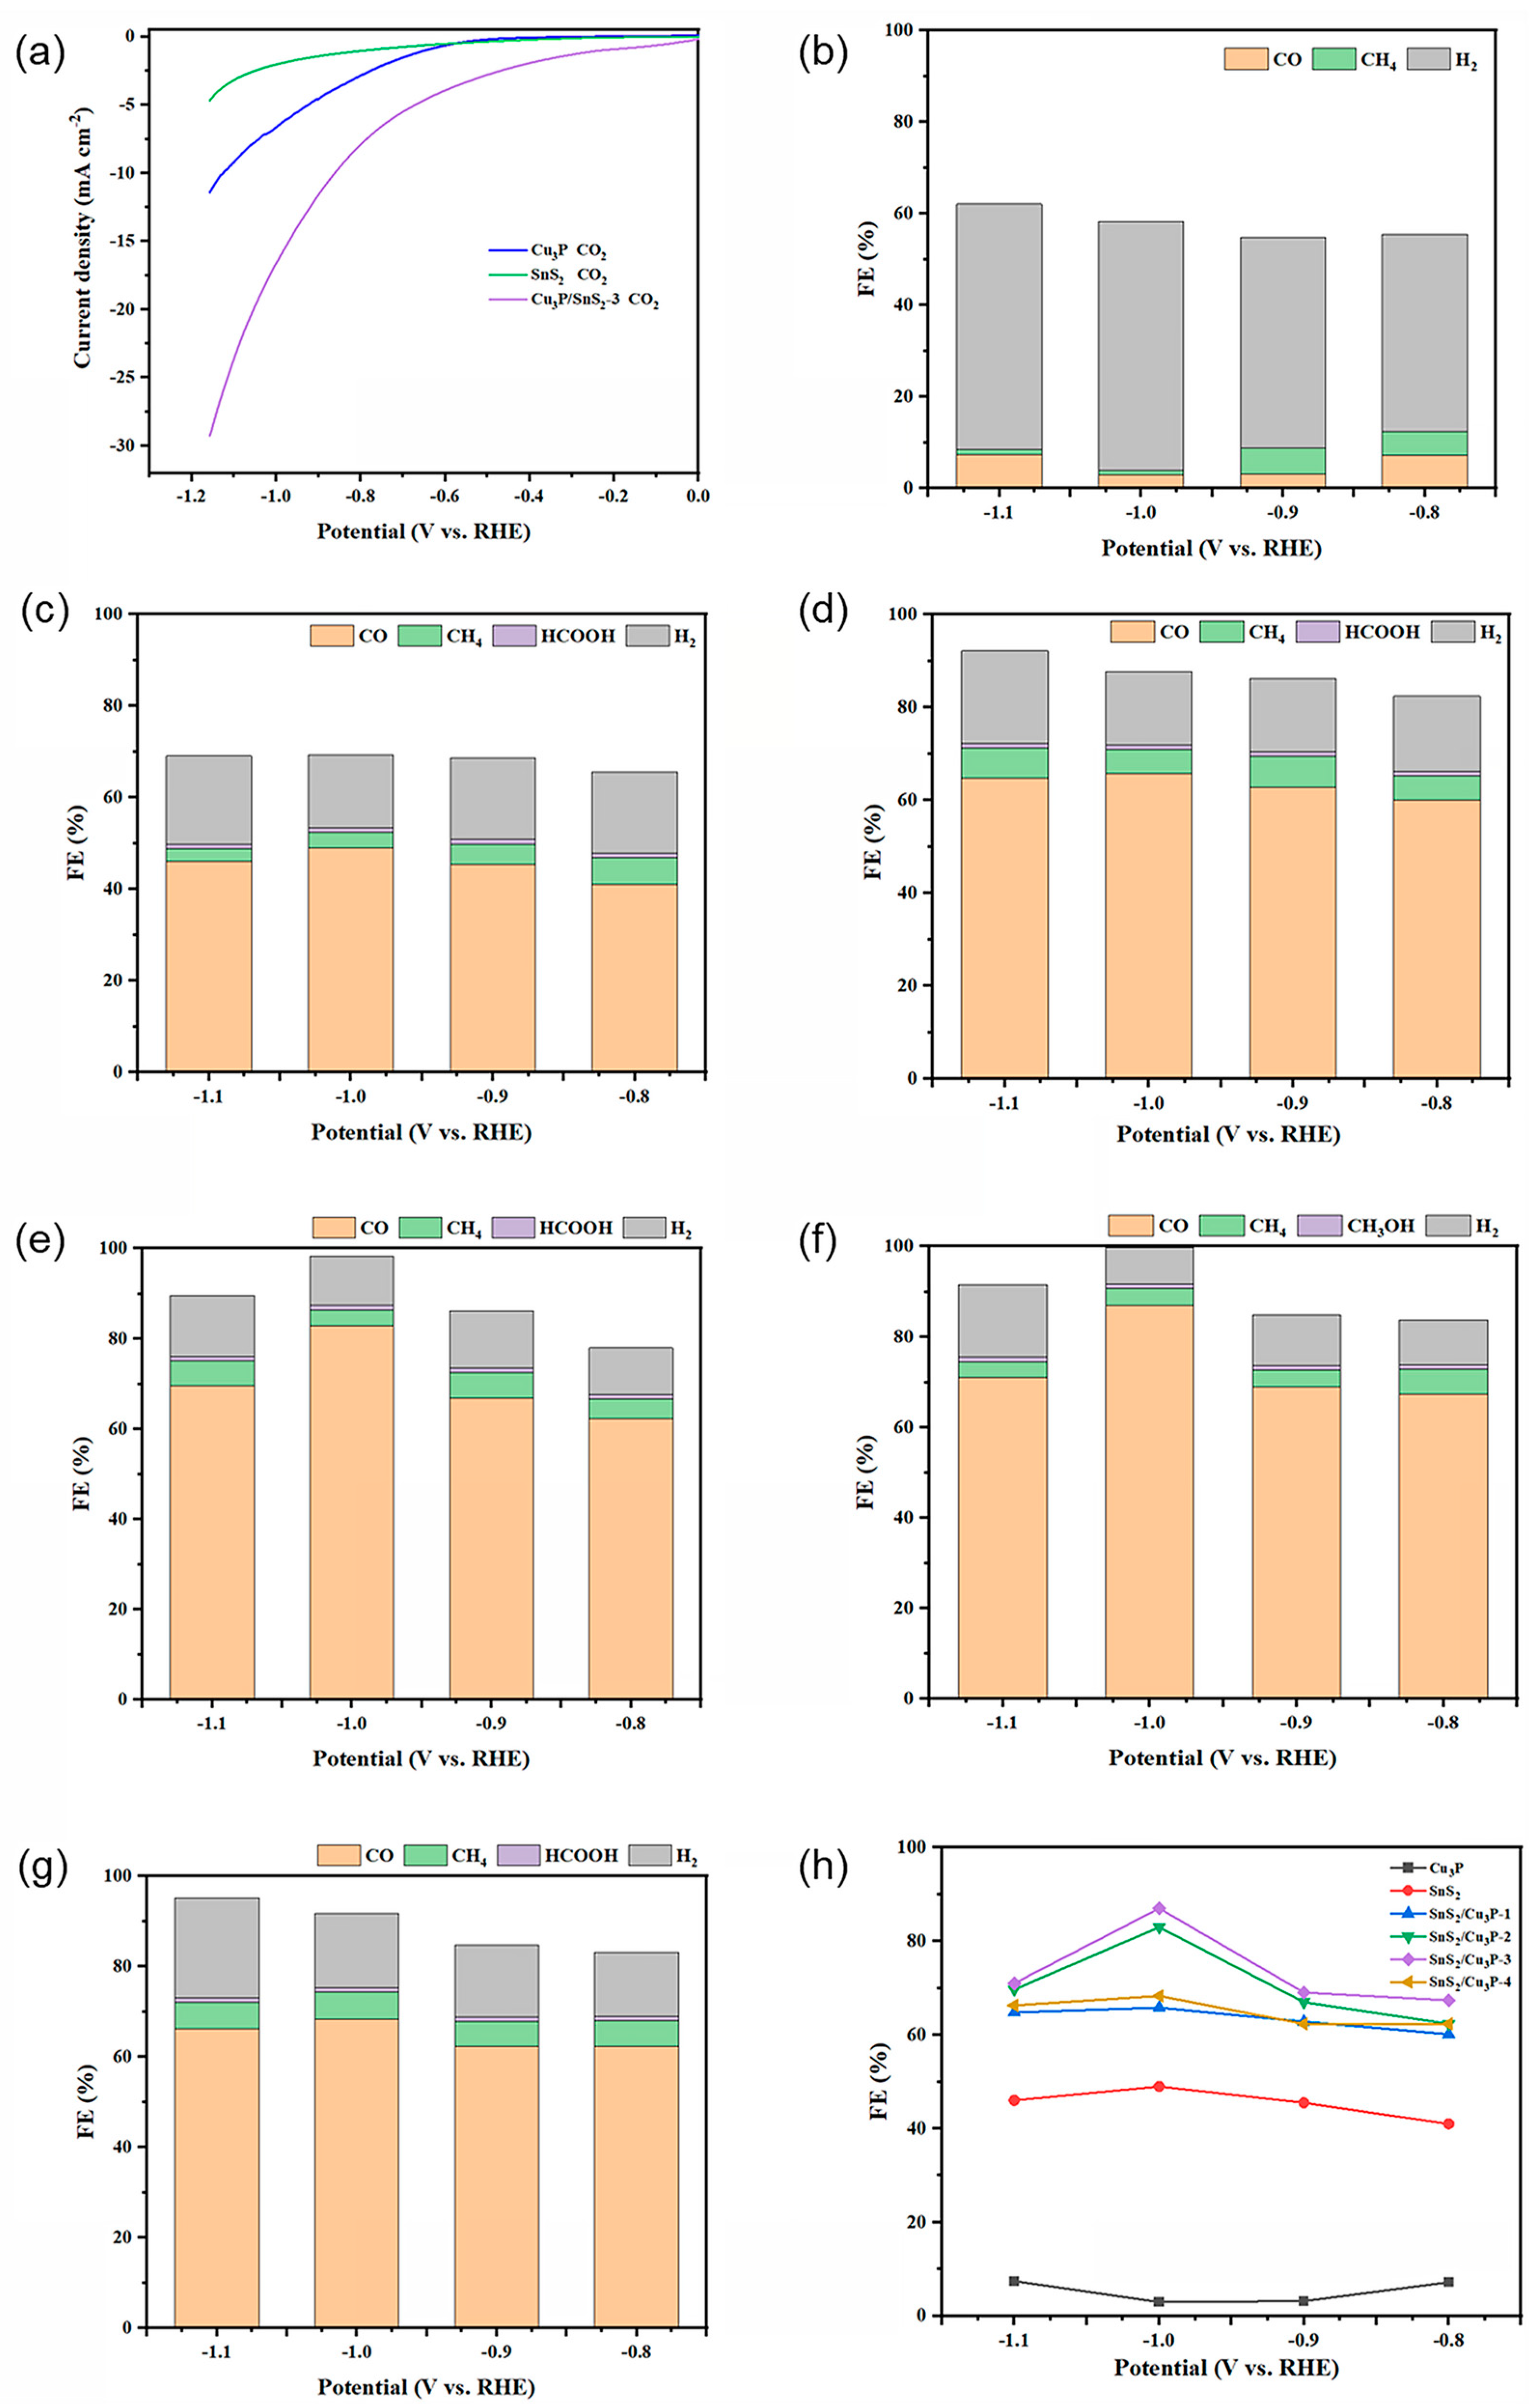
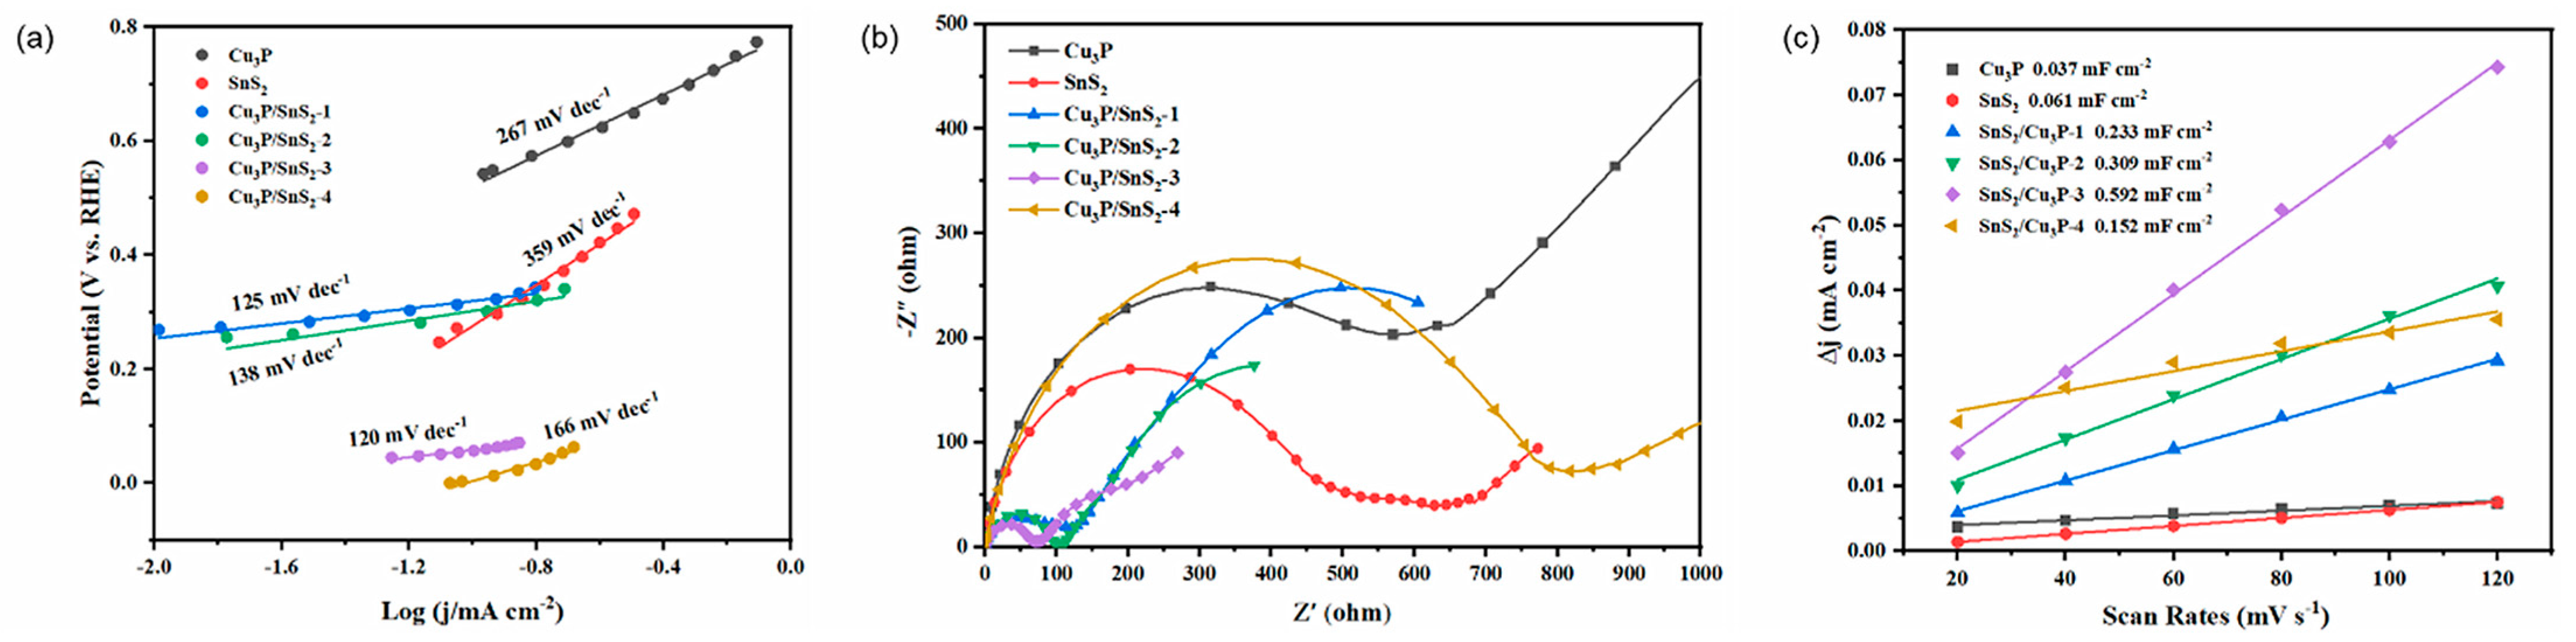
2.2. Electrochemical Performance of Cu3P/SnS2 Catalysts

In order to evaluate the electrocatalytic performance of Cu3P/SnS2-3 composites on CO2RR, in a standard three-electrode system of H-type electrolytic cell, Linear sweep voltammetry (LSV) was used to measure the current densities of pure Cu3P, SnS2, and composite Cu3P/SnS2-3 in the range of −1.15–0 V vs. RHE. As can be seen from Figure S3a–c, the current density of pure Cu3P, SnS2, and composite Cu3P/SnS2-3 in CO2-saturated 0.1 M KHCO3 solution is generally higher than that in N2 atmosphere in the entire potential range, indicating that these three materials have the ability of electrocatalytic reduction of CO2. As shown in Figure 3a, the current density of Cu3P/SnS2-3 is higher than that of pure Cu3P and SnS2 in CO2 atmosphere, and the current density in CO2-saturated electrolyte increases sharply when the potential is lower than −0.7 V, indicating that the CO2 electrocatalytic reduction performance of Cu3P/SnS2-3 is better than that of pure Cu3P and SnS2. As shown in Figure S4, gas chromatography (GC) and nuclear magnetic resonance spectroscopy (NMR) were used for quantitative analysis of gaseous and liquid products, respectively. As shown in Figure S4a, peaks of CO, CH4, and CO2 can be seen in the FID column of gas chromatography (GC), and peaks of H2 and N2 can be seen in the TCD column of Figure S4b. Among them, CO2 and N2 are the gases entered in the experiment, and CO, CH4, and H2 belong to gaseous products. As shown in Figure S4c, the peak of internal standard DMSO and HCOOH can be seen, indicating that the liquid phase product has HCOOH, but the yield is small, indicating that the catalyst has poor selectivity for HCOOH. The electrocatalytic reduction of CO2 from pure Cu3P, SnS2, and Cu3P/SnS2-3 composites was tested in CO2-saturated 0.1 M KHCO3 electrolyte at potentials ranging from −0.8 V to −1.1 V, respectively. As shown in Figure 3b,c,f, Faraday efficiencies of pure Cu3P, SnS2, and composite Cu3P/SnS2-3 at different potentials are shown. Specifically, for pure Cu3P, the CO Faraday efficiency decreases first and then increases in the range of −0.8 V to −1.1 V potential. On the contrary, the CO Faraday efficiency of SnS2 and Cu3P/SnS2-3 increases first and then decreases in this potential range. When the potential is −1.0 V, the Faraday efficiency of Cu3P/SnS2-3 electrocatalytic CO2 production of CO is 87%, which is about 29 times that of pure Cu3P and 1.78 times that of pure SnS2. Compared with pure Cu3P and SnS2, the selectivity of Cu3P/SnS2-3 to CO is higher, indicating that the combination of Cu3P and SnS2 is beneficial to the electrocatalytic reduction of CO2 to produce CO. In order to test the effect of different molar ratios of Cu/Sn on the electrocatalytic reduction performance of CO2, Cu3P/SnS2 composites with different molar ratios were prepared in the experiment. In a CO2-saturated 0.1 M KHCO3 electrolyte with a potential range of −0.8 V to −1.1 V, the electrocatalytic CO2 reduction experiments were carried out on each catalyst, and the products were tested using GC and NMR. Figure 3d–h are the Faraday efficiency diagrams of the composite material. It can be seen that the CO Faraday efficiency of Cu3P/SnS2-1, Cu3P/SnS2-2, Cu3P/SnS2-3, and Cu3P/SnS2-4 shows a trend of first rising and then decreasing within the potential range of −0.8 V to −1.1 V. When the potential is −1.0 V, the Faraday efficiency of CO is the highest, and the Faraday efficiencies of the composite at this potential are 65.8%, 83%, 87%, and 68.3%, respectively. Among them, Cu3P/SnS2-3 has better CO selectivity and Faraday efficiency is 87%. It can be seen that the best potential in this experiment is −1.0 V, the best catalyst is Cu3P/SnS2-3, and the best FE of CO is 87%, about 29 times that of pure Cu3P (3%) and 1.78 times that of pure SnS2 (49%). The possible reason is that the large electrochemical active area of the composite Cu3P/SnS2-3 provides more active sites for it. These active sites can adsorb more CO2, thus promoting the reaction. When the potential reaches −1.0 V, there is more energy to overcome the reaction energy barrier of the RDS step, making the CO FE of Cu3P/SnS2-3 higher at −1.0 V.
After the optimum catalyst Cu3P/SnS2-3 was determined, the electrocatalytic reduction of CO2 by Cu3P/SnS2-3 in different electrolytic solutions was investigated. As shown in Figure 4a, it is the Faraday efficiency of CO2RR products in different electrolytes of the catalyst Cu3P/SnS2-3 at the −1.0 V potential. By comparing the electrocatalytic performance of Cu3P/SnS2-3 in different electrolytes, 0.1 M KHCO3, 0.1 M NaHCO3, and 0.1 M KCl, it was found that the Faraday efficiency of CO first decreased and then increased. By comparing different concentrations of electrolyte 0.1 M KHCO3 and 0.5 M KHCO3 and 0.1 M NaHCO3 and 0.5 M NaHCO3, it was found that the Faraday efficiency of CO showed a decreasing trend. Through comparison, it was found that Cu3P/SnS2-3 in the 0.1 M KHCO3 electrolyte showed a good electrocatalytic performance. The possible reason is that the KHCO3 electrolyte buffers pH changes, while K+ promotes CO2RR and inhibits HER. When the electrolyte concentration is increased, HCO3 may act as a proton donor and promote HER, thereby inhibiting CO2RR, and thus exhibit the best electrocatalytic performance in the 0.1 M KHCO3 electrolyte. In previous experiments, it was found that the presence of K+ can inhibit the hydrogen evolution process and contribute to the selective electrocatalytic reduction of CO2 under strongly acidic conditions (pH < 1), and with the increase in the K+ concentration, its contribution to the formation of multi-carbon (C2+) products gradually increases. Relevant studies have shown that bicarbonate aqueous solution is the most commonly used electrolyte in CO2RR, which can not only act as pH buffer or proton donor but also increase local CO2 concentration through rapid equilibrium with CO2(aq), thus promoting electrocatalytic CO2 reduction [33]. As shown in Figure 4b, the electrocatalytic performance of Cu3P/SnS2-3 catalysts with different loads was tested in 0.1 M KHCO3 electrolyte at −1.0 V potential, and the Faraday efficiency of the products was calculated, respectively. It can be seen that with the increase in the catalyst load, the Faraday efficiency of CO goes through a change process of first rising and then decreasing. When the loading rate is 0.37 mg cm−2, it shows better electrocatalytic performance. Later, with the increase in loading rate, the CO2RR performance begins to decrease. The possible reason is that too much catalyst loading will lead to a too-thick catalyst on the carbon paper, which is not favorable for the reaction between CO2 and the inner catalyst. As shown in Figure 4c, the electrocatalytic reduction CO2 electrolysis experiment of Cu3P/SnS2-3 catalyst was carried out continuously for 5 h in KHCO3 electrolyte saturated with CO2 at −1.0 V, so as to explore the stability of the catalyst. It was found that the current density of Cu3P/SnS2-3 remained within a certain range without obvious fluctuation, and the CO Faraday efficiency in the electrocatalytic CO2 reduction reaction was always above 75%, indicating that the catalyst Cu3P/SnS2-3 had good stability. The stability of the Cu3P/SnS2-3 catalyst decreased slightly after 4 h, which may be due to the prolonged stability test leading to phase separation of the originally uniformly dispersed Cu3P and SnS2, reducing the synergistic effect between the two phases, thus affecting the overall properties of the material.

2.3. Mechanism Research of Cu3P/SnS2 Catalysts

As shown in Figure 5a, the Tafel slopes of Cu3P, SnS2, Cu3P/SnS2-1, Cu3P/SnS2-2, Cu3P/SnS2-3, and Cu3P/SnS2-4 catalysts are 267 mV dec−1, 478 mV dec−1, 125 mV dec−1, 138 mV dec−1, 120 mV dec−1, and 296 mV dec−1, respectively. It can be seen that the catalyst Cu3P/SnS2-3 has the lowest Tafel slope, so the catalyst Cu3P/SnS2-3 has faster CO2RR kinetics than other materials. It is shown that the final step of Cu3P/SnS2-3 electrocatalytic CO2 reduction process is to obtain an electron on the catalyst surface and activate CO2 molecules into CO2·− free radicals. In order to further investigate the electrocatalytic activity of Cu3P and Cu3P/SnS2-1-4, electrochemical impedance tests were performed in the experiment. Figure 5b shows the Nyquist diagram of the electrocatalyst, which is mainly composed of semi-arcs and curves. The semi-arc belongs to the high-frequency region, which represents the electron transfer during the reaction, the diameter of the semi-arc represents the electrochemical impedance value, and the part of the curve behind belongs to the low-frequency region, which represents the material diffusion. From the figure, we can see that the electrochemical impedance (Rct) of pure Cu3P is about 650 Ω, Rct of pure SnS2 is 500 Ω, and the Rcts of the materials Cu3P/SnS2-1-4 are 120 Ω, 100 Ω, 70 Ω, and 800 Ω, respectively. Compared with Cu3P and SnS2, the resistance of Cu3P/SnS2-1-3 decreases, while the resistance of Cu3P/SnS2-4 increases. The material Cu3P/SnS2-3 has the smallest diameter in the Nyquist diagram, with a charge transfer resistance of about 70 Ω. The results show that the Cu3P/SnS2-3 catalyst has a smaller surface electron transfer resistance and faster charge transfer rate, which promotes the charge transfer between the reactive substance and the catalyst in the electrolyte, and has a better catalytic performance of CO2RR. As shown in Figure S5a–f, they are the cyclic voltammetry curves of Cu3P, SnS2 and the composite material Cu3P/SnS2 1-4 at different scanning speeds in 0.1 M KHCO3 electrolyte, with scanning speeds ranging from 20 to 120 mV s−1. As shown in Figure 5c, the double-layer capacitance (Cdl) of pure Cu3P, SnS2, and composite Cu3P/SnS2-1-4 are obtained by calculation, which are 0.037 mF cm−2, 0.061 mF cm−2, 0.233 mF cm−2, and 0.309 mF cm−2, respectively. Compared with pure Cu3P, SnS2, and other composites, it can be seen that the double-layer capacitance value of Cu3P/SnS2-3 is the most prominent. In general, double-layer capacitors (Cdl) are used to qualitatively evaluate the electrochemically active area (ECSA). The larger the Cdl, the larger the corresponding ECSA, indicating that there are more catalytic active sites, which means that the composite Cu3P/SnS2-3 has better CO2RR catalytic activity.

3. Experimental Procedures

3.1. Materials

All the reagents were analytical grade and used without further purification. Copper chloride dihydrate (CuCl2·2H2O), red phosphorus, tin tetrachloride (IV) pentahydrate (SnCl4·5H2O), ethanol, thiourea, potassium bicarbonate (KHCO3), sodium bicarbonate (NaHCO3), and potassium chloride (KCl) were purchased from Shanghai Yi En Chemical Technology Co., Ltd., Shanghai, China. High-purity carbon dioxide and high-purity nitrogen were purchased from Huzhou First Gas Co., Ltd., Zhejiang, China. Nafion was acquired from DuPont, Wilmington, DE, USA.

3.2. Synthesis of Cu3P, SnS2, and Cu3P/SnS2

Synthesis of Cu3P: Mix 0.511 g of CuCl2·2H2O and 0.3097 g of red phosphorus, then put the mixture in a beaker and add 60 mL of deionized water, stir continuously for 30 min, then transfer it to a 100 mL reaction kettle, and put it into a 180 °C oven for continuous heating for 12 h. After the reaction was finished, the sample was naturally cooled down to room temperature, then taken out for centrifugation, and washed with ethanol and deionized water for several times alternately. After the reaction was completed, the sample was centrifuged, washed with ethanol and deionized water alternately for several times, and finally the mixture was dried at 70 °C for 4 h.
Synthesis of SnS2: In total, 0.3506 g of SnCl4·5H2O and 0.2284 g of thiourea were weighed and added to 40 mL of distilled water successively and continuously stirred in a magnetic stirrer for 30 min. The mixture was then transferred to a high-pressure reactor with a capacity of 100 mL, and a hydrothermal reaction was carried out at 180 °C for up to 12 h. After the reaction, the samples were cooled to room temperature, centrifuged, and then washed alternately with deionized water and anhydrous ethanol. Finally, the cleaned sample was placed in the oven and dried at 70 °C for 10 h to obtain SnS2 material.
Synthesis of Cu3P/SnS2: In total, 0.3506 g of SnCl4·5H2O and 0.2284 g of thiourea were weighed and added into 40 mL of distilled water successively, stirring with a strong magnetic flux for 30 min. Then, the synthesized Cu3P powder is prepared according to a certain molar ratio (Cu3P:SnS2 = 1:2; 1:1; 2:1; 3:1) Add the mixture to the above solution, stir continuously for 20 min, and then transfer the mixture into a 100 mL reactor after mixing evenly. After the hydrothermal reaction at 180 °C for 12 h, centrifuge after the reaction is finished and cooled to room temperature, and then wash with deionized water and anhydrous ethanol alternately for several times. Finally, the samples were dried at 70 °C for 5 h to obtain Cu3P/SnS2 composites, which were successively named Cu3P/SnS2-1, Cu3P/SnS2-2, Cu3P/SnS2-3, and Cu3P/SnS2-4.

3.3. Characterization

In this paper, the model of an X-ray diffractometer Bruker D8 Advance is used, the radiation source is Cu-Kα, λ = 0.15406 nm, the scanning speed is 1.2° min−1, and the scanning angle 2θ = 5°–90°.
In this experiment, a K-Alpha X-ray photoelectron spectrometer was used, and Al-K-α radiation was selected as the excitation light source. In the course of the experiment, the chemical element composition of the catalyst was qualitatively identified and quantitatively determined according to the position and relative strength of the characteristic spectral lines in the obtained spectra.
In this experiment, a Micromeritics ASAP 2020 (Micromeritics Instrument Corporation, Norcross, GA, USA) equipment was used to carry out the test work. The samples were first placed in the instrument and degassed for 10.0 h at 110.0 °C to fully remove the residual gas. Subsequently, the same Micromeritics ASAP 2020 instrument was used to continue the rigorous test program to accurately determine key physical parameters, such as the specific surface area and pore size of the catalyst.
The scanning electron microscope used in this experiment is S-4800 (Hitachi, Ltd., Tokyo, Japan), and the acceleration voltage condition used is 15 kV or 10 kV. In this experiment, Zeiss LIBRA 200 FEG (Oberkochen, Germany) transmission electron microscopy was used to analyze the morphology, structure, and size of the catalyst.

3.4. Electrochemical Measurements

Electrode preparation: In order to prepare a uniform catalyst suspension, the 5 mg catalyst powder was first accurately weighed, and then 375 μL of deionized water, 125 μL of ethanol, and 40 μL of Nafion solution with a concentration of 5 wt.% were added in sequence. The mixture was placed in the ultrasonic dispersion equipment for 30 min, and finally, the uniformly dispersed catalyst suspension was obtained. Then, the catalyst suspension of 40 μL was uniformly coated on the carbon paper with the size of 2 cm × 1 cm, and the catalyst load on the carbon paper was 0.37 mg cm−2. Finally, the carbon paper uniformly coated with the catalyst was placed in a constant temperature oven at 60 °C for drying treatment, and the duration was set to 30 min. After the drying process is over, take out the treated carbon paper to obtain the required working electrode.
The electrocatalytic experiments in this study were all carried out at room temperature, using H-type electrolytic cell, and the electrolytes without special instructions were 0.1 M KHCO3 solution. Before the start of the formal experiment, CO2 gas should be continuously passed into the electrolyte in the cathode chamber, the ventilation time should be set to 30 min, in order to fully expel the residual air inside the electrolyte, make CO2 saturated in the electrolyte of 0.1 M KHCO3, and then carry out a series of ECR experiments. The reaction stirring rate was 400 rpm, and no iR compensation was carried out.
The gas phase product was analyzed using a gas chromatograph model Agilent 7890A (Santa Clara, CA, USA). Liquid phase product detection: After each electrolytic experiment, collect the electrolyte, use the pipette to take 500 μL electrolyte, and then take 0.1 μL of dimethyl sulfoxide (DMSO) into the electrolyte to be measured. Before the test, the standard curve of the liquid product was prepared. The concentration of the standard solution was taken as the horizontal coordinate, and the ratio between the peak area of the liquid product and the peak area of DMSO measured by nuclear magnetic resonance spectroscopy was taken as the vertical coordinate to establish the standard concentration curve.

3.5. Computational Methods

The Faraday efficiency of gas products is calculated as follows:
F E g = Q g Q t o t a l × 100 % = 1.67 × 10 8 × F × x g × v C O 2 × K i t o t a l × V m × 100 %
where F represents Faraday’s constant, F = 96,485 C·mol−1; xg is the target product concentration, unit ppm; νCO2 is the CO2 flow rate at the outlet of the electrolyzer, in mL·min−1; K is the number of transferred electrons corresponding to different products; itotal is the total current in the reaction, expressed in mA; Vm represents the molar volume of the gas, Vm = 24.5 L·mol−1 at normal temperature and pressure.
The Faraday efficiency of liquid products is calculated as follows:
F E = m × n × F I × t
where m represents the number of moles of the product, n represents the number of electrons transferred by the CO2 reduction product, F is the Faraday constant (96,485 C·mol−1), I is the current of the electrolytic process, and t is the duration of the electrolytic reaction.

4. Conclusions

In this paper, a new composite material Cu3P/SnS2 was prepared using the hydrothermal method and applied to CO2RR. According to the regulation of different molar ratios of Cu and Sn, the microstructure and electrocatalytic performance of Cu3P/SnS2 catalyst were optimized. The catalyst was characterized by XRD, XPS, BET, SEM, and TEM, which proved the successful recombination of Cu3P and SnS2. The LSV curves of Cu3P/SnS2-3 indicate that the current density of Cu3P/SnS2-3 is high, and the combination of Cu3P and SnS2 is beneficial to improve the electrocatalytic performance of Cu3P/SnS2-3. The i–t test was carried out to calculate the Faraday efficiency of the products. It was found that the main gaseous products were CO, CH4, and H2. After comparing the Faraday efficiency of different catalysts, it was determined that the CO Faraday efficiency of Cu3P/SnS2-3 was the highest (87%) in CO2 saturated 0.1 M KHCO3 electrolyte and −1.0 V potential in the H-type electrolyte, which was about 29 times that of pure Cu3P (3%) and 1.78 times that of SnS2 (49%). The results showed that the selectivity of CO2RR to CO was improved by the combination of Cu3P and SnS2, and the performance of CO2RR could be effectively regulated by adjusting the molar ratio of Cu to Sn. The experimental results show that the optimal potential and electrolyte for Cu3P/SnS2-3 electrocatalytic reduction of CO2 are the −1.0 V and 0.1 M KHCO3 electrolytes, and the optimal load of catalyst supported on carbon paper is 0.37 mg cm−2. In the stability test, the prepared Cu3P/SnS2-3 was tested for CO2RR for five consecutive hours, and its Faraday efficiency was only reduced from the initial 87% to 77%, which strongly confirmed the excellent stability of the catalyst. Finally, the excellent performance of Cu3P/SnS2-3 is proven by the tests of Tafel slope, electrochemical impedance, and electrochemical active area. This study provides a new method for producing CO from CO2RR.

Supplementary Materials

The following supporting information can be downloaded at https://www.mdpi.com/article/10.3390/catal15060552/s1: Figure S1: XPS full spectrum of Cu3P/SnS2-3. Figure S2: N2 adsorption–desorption curves of Cu/Sn-3. Figure S3: (a–c) Current densities of Cu/Sn-3 composites in N2 and CO2 atmospheres. Figure S4: (a,b) GC chromatogram of Cu3P/SnS2-3; (c) Hydrogen NMR spectra. Figure S5: Cyclic voltammetry curves of (a) Cu3P, (b) SnS2, (c) Cu3P/SnS2-1, (d) Cu3P/SnS2-2, (e) Cu3P/SnS2-3, (f) Cu3P/SnS2-4 in 0.1 M KHCO3 electrolyte at different scanning speeds.

Author Contributions

Conceptualization, H.S. and H.W.; methodology, Y.Z.; writing—original draft preparation, H.W.; writing—review and editing, H.S. and Z.W.; supervision, J.J. All authors have read and agreed to the published version of the manuscript.

Funding

This research was funded by the “Bureau of Huzhou Municipal Science and Technology, grant number (2021ZD2043, 2021ZD2003)” and by the “Bureau of Shanghai Municipal Science and Technology, grant number (23010503500)”.

Data Availability Statement

The data that support the findings of this study are available from the corresponding author upon reasonable request.

Conflicts of Interest

The authors declare that they have no known competing financial interests or personal relationships that could have appeared to influence the work reported in this paper.

References

  1. ReferencesAlbo, J.; Alvarez-Guerra, M.; Castaño, P.; Irabien, A. Towards the electrochemical conversion of carbon dioxide into methanol. Green Chem. 2015, 17, 2304–2324. [Google Scholar] [CrossRef]
  2. Wang, G.X.; Chen, J.X.; Ding, Y.C.; Cai, P.W.; Yi, L.C.; Li, Y.; Tu, C.Y.; Hou, Y.; Wen, Z.H.; Dai, L.M. Electrocatalysis for CO2 conversion: From fundamentals to value-added products. Chem. Soc. Rev. 2021, 50, 4993–5061. [Google Scholar] [CrossRef] [PubMed]
  3. Kibria, M.G.; Edwards, J.P.; Gabardo, C.M.; Dinh, C.T.; Seifitokaldani, A.; Sinton, D.; Sargent, E.H. Electrochemical CO2 Reduction into Chemical Feedstocks: From Mechanistic Electrocatalysis Models to System Design. Adv. Mater. 2019, 31, 1807166. [Google Scholar] [CrossRef] [PubMed]
  4. Sanz-Pérez, E.S.; Murdock, C.R.; Didas, S.A.; Jones, C.W. Direct Capture of CO2 from Ambient Air. Chem. Rev. 2016, 116, 11840–11876. [Google Scholar] [CrossRef]
  5. Gao, P.; Li, S.G.; Bu, X.N.; Dang, S.S.; Liu, Z.Y.; Wang, H.; Zhong, L.S.; Qiu, M.H.; Yang, C.G.; Cai, J.; et al. Direct conversion of CO2 into liquid fuels with high selectivity over a bifunctional catalyst. Nat. Chem. 2017, 9, 1019–1024. [Google Scholar] [CrossRef]
  6. Wang, C.L.; Sun, Z.X.; Zheng, Y.; Hu, Y.H. Recent progress in visible light photocatalytic conversion of carbon dioxide. J. Mater. Chem. A 2019, 7, 865–887. [Google Scholar] [CrossRef]
  7. Lee, Y.Y.; Jung, H.S.; Kang, Y.T. A review: Effect of nanostructures on photocatalytic CO2 conversion over metal oxides and compound semiconductors. J. CO2 Util. 2017, 20, 163–177. [Google Scholar] [CrossRef]
  8. Costentin, C.; Robert, M.; Savéant, J.M. Catalysis of the electrochemical reduction of carbon dioxide. Chem. Soc. Rev. 2013, 42, 2423–2436. [Google Scholar] [CrossRef]
  9. Kumar, B.; Brian, J.P.; Atla, V.; Kumari, S.; Bertram, K.A.; White, R.T.; Spurgeon, J.M. New trends in the development of heterogeneous catalysts for electrochemical CO2 reduction. Catal. Today 2016, 270, 19–30. [Google Scholar] [CrossRef]
  10. Zheng, Y.; Zhang, W.Q.; Li, Y.F.; Chen, J.; Yu, B.; Wang, J.C.; Zhang, L.; Zhang, J.J. Energy related CO2 conversion and utilization: Advanced materials/nanomaterials, reaction mechanisms and technologies. Nano Energy 2017, 40, 512–539. [Google Scholar] [CrossRef]
  11. Hu, J.Y.; Liu, H.Z.; Han, B.X. Basic ionic liquids promoted chemical transformation of CO2 to organic carbonates. Sci. China Chem. 2018, 61, 1486–1493. [Google Scholar] [CrossRef]
  12. White, J.L.; Baruch, M.F.; Pander, J.E.; Hu, Y.; Fortmeyer, I.C.; Park, J.E.; Zhang, T.; Liao, K.; Gu, J.; Yan, Y.; et al. Light-Driven Heterogeneous Reduction of Carbon Dioxide: Photocatalysts and Photoelectrodes. Chem. Rev. 2015, 115, 12888–12935. [Google Scholar] [CrossRef] [PubMed]
  13. Li, Z.Y.; Yang, Y.S.; Wei, M. Structural Design and Performance of Electrocatalysts for Carbon Dioxide Reduction: A Review. Acta Chim. Sin. 2022, 80, 199–213. [Google Scholar] [CrossRef]
  14. Peterson, A.A.; Norskov, J.K. Activity Descriptors for CO2 Electroreduction to Methane on Transition-Metal Catalysts. J. Phys. Chem. Lett. 2012, 3, 251–258. [Google Scholar] [CrossRef]
  15. Jones, J.P.; Prakash, G.K.S.; Olah, G.A. Electrochemical CO2 Reduction: Recent Advances and Current Trends. Isr. J. Chem. 2014, 54, 1451–1466. [Google Scholar] [CrossRef]
  16. Ma, W.C.; He, X.Y.; Wang, W.; Xie, S.J.; Zhang, Q.H.; Wang, Y. Electrocatalytic reduction of CO2 and CO to multi-carbon compounds over Cu-based catalysts. Chem. Soc. Rev. 2021, 50, 12897–12914. [Google Scholar] [CrossRef]
  17. Wang, Y.F.; Han, P.; Lv, X.M.; Zhang, L.J.; Zheng, G.F. Defect and Interface Engineering for Aqueous Electrocatalytic CO2 Reduction. Joule 2018, 2, 2551–2582. [Google Scholar] [CrossRef]
  18. Zhang, W.J.; Hu, Y.; Ma, L.B.; Zhu, G.Y.; Wang, Y.R.; Xue, X.L.; Chen, R.P.; Yang, S.Y.; Jin, Z. Progress and Perspective of Electrocatalytic CO2 Reduction for Renewable Carbonaceous Fuels and Chemicals. Adv. Sci. 2018, 5, 1700275. [Google Scholar] [CrossRef]
  19. Song, Y.F.; Chen, W.; Zhao, C.C.; Li, S.G.; Wei, W.; Sun, Y.H. Metal-Free Nitrogen-Doped Mesoporous Carbon for Electroreduction of CO2 to Ethanol. Angew. Chem. Int. Ed. 2017, 56, 10840–10844. [Google Scholar] [CrossRef]
  20. Sarfraz, S.; Garcia-Esparza, A.T.; Jedidi, A.; Cavallo, L.; Takanabe, K. Cu-Sn Bimetallic Catalyst for Selective Aqueous Electroreduction of CO2 to CO. ACS Catal. 2016, 6, 2842–2851. [Google Scholar] [CrossRef]
  21. Huang, J.; Dai, J.W.; Zhu, J.N.; Chen, R.; Fu, X.Q.; Liu, H.F.; Li, G.F. Bimetallic Au-Cu gradient alloy for electrochemical CO2 reduction into C2H4 at low overpotential. J. Catal. 2022, 415, 134–141. [Google Scholar] [CrossRef]
  22. Fu, Y.; Xie, Q.X.; Wu, L.X.; Luo, J.S. Crystal facet effect induced by different pretreatment of Cu2O nanowire electrode for enhanced electrochemical CO2 reduction to C2+ products. Chin. J. Catal. 2022, 43, 1066–1073. [Google Scholar] [CrossRef]
  23. Jiang, X.C.; Herricks, T.; Xia, Y.N. CuO nanowires can be synthesized by heating copper substrates in air. Nano Lett. 2002, 2, 1333–1338. [Google Scholar] [CrossRef]
  24. Ye, J.Q.; Yan, J.P.; Peng, Y.L.; Li, F.W.; Sun, J. Metal-organic framework-based single-atom catalysts for efficient electrocatalytic CO2 reduction reactions. Catal. Today 2023, 410, 68–84. [Google Scholar] [CrossRef]
  25. Zhang, Y.X.; Sun, T.T.; Zhang, P.P.; Liu, K.L.; Li, F.L.; Xu, L.B. Synthesizing MOF-derived Ni-N-C catalyst via surfactant modified strategy for efficient electrocatalytic CO2 to CO. J. Colloid Interface Sci. 2023, 631, 96–101. [Google Scholar] [CrossRef]
  26. Sha, Y.F.; Zhang, J.L.; Cheng, X.Y.; Xu, M.Z.; Su, Z.Z.; Wang, Y.Y.; Hu, J.Y.; Han, B.X.; Zheng, L.R. Anchoring Ionic Liquid in Copper Electrocatalyst for Improving CO2 Conversion to Ethylene. Angew. Chem. Int. Ed. 2022, 61, e202200039. [Google Scholar] [CrossRef]
  27. Feaster, J.T.; Shi, C.; Cave, E.R.; Hatsukade, T.T.; Abram, D.N.; Kuhl, K.P.; Hahn, C.; Norskov, J.K.; Jaramillo, T.F. Understanding Selectivity for the Electrochemical Reduction of Carbon Dioxide to Formic Acid and Carbon Monoxide on Metal Electrodes. ACS Catal. 2017, 7, 4822–4827. [Google Scholar] [CrossRef]
  28. Yadav, V.S.K.; Noh, Y.; Han, H.; Kim, W.B. Synthesis of Sn catalysts by solar electro-deposition method for electrochemical CO2 reduction reaction to HCOOH. Catal. Today 2018, 303, 276–281. [Google Scholar] [CrossRef]
  29. He, J.; Liu, X.J.; Liu, H.X.; Zhao, Z.; Ding, Y.; Luo, J. Highly selective electrocatalytic reduction of CO2 to formate over Tin(IV) sulfide monolayers. J. Catal. 2018, 364, 125–130. [Google Scholar] [CrossRef]
  30. Ren, H.; Wang, X.; Zhou, X.; Wang, T.; Liu, Y.; Wang, C.; Guan, Q.; Li, W. In-situ constructing Cu1Bi1 bimetallic catalyst to promote the electroreduction of CO2 to formate by synergistic electronic and geometric effects. J. Energy Chem. 2023, 79, 263–271. [Google Scholar] [CrossRef]
  31. Li, M.; Hu, Y.; Dong, G.; Wu, T.C.; Geng, D.S. Achieving Tunable Selectivity and Activity of CO2 Electroreduction to CO via Bimetallic Silver-Copper Electronic Engineering. Small 2023, 19, 2207242. [Google Scholar] [CrossRef] [PubMed]
  32. Yang, S.; Liu, Z.; An, H.; Arnouts, S.; de Ruiter, J.; Rollier, F.; Bals, S.; Altantzis, T.; Figueiredo, M.C.; Filot, I.A.W.; et al. Near-Unity Electrochemical CO2 to CO Conversion over Sn-Doped Copper Oxide Nanoparticles. ACS Catal. 2022, 12, 15146–15156. [Google Scholar] [CrossRef] [PubMed]
  33. Deng, B.W.; Huang, M.; Zhao, X.L.; Mou, S.Y.; Dong, F. Interfacial Electrolyte Effects on Electrocatalytic CO2 Reduction. ACS Catal. 2022, 12, 331–362. [Google Scholar] [CrossRef]
Figure 1. (a) Cu3P/SnS2 composite catalyst electrocatalyzes carbon dioxide to produce carbon monoxide; (b) XRD patterns of Cu3P/SnS2 with different molar ratios, pure SnS2 and pure Cu3P; (c) Cu 2p XPS diagram of Cu3P/SnS2-3; (d) Sn 3d XPS diagram of Cu3P/SnS2-3; (e) P 2p XPS diagram of Cu3P/SnS2-3; (f) S 2p XPS diagram of Cu3P/SnS2-3.
Catalysts 15 00552 g001
Figure 2. SEM images of (a) Cu3P, (b) SnS2, (c) Cu3P/ SnS2-1, (d) Cu3P/ SnS2-2, (e) Cu3P/ SnS2-3, and (f) Cu3P/ SnS2-4; (gj) TEM images of Cu3P/SnS2-3; EDS element diagram of (kn) P (red), S (green), Cu (blue), and Sn (purple).
Catalysts 15 00552 g002
Figure 3. (a) Current density of pure Cu3P, SnS2, and Cu3P/ SnS2-3 composites in CO2 atmosphere; FE diagrams of electrolytic products of (b) Cu3P and (c) SnS2 at different potentials; (d) Cu3P/SnS2-1, (e) Cu3P/SnS2-2, (f) Cu3P/SnS2-3, (g) FE diagram of Cu3P/SnS2-4 electrolytic products; (h) CO Faraday efficiency of Cu3P, SnS2, and Cu3P/SnS2 composites with different molar ratios.
Catalysts 15 00552 g003
Figure 4. (a) FE diagram of electrolytic products of Cu3P/SnS2-3 catalyst under different electrolyte conditions; (b) FE diagram of the electrolytic products of Cu3P/SnS2-3 composites with different loadings; (c) Cu3P/SnS2-3 stability curve.
Catalysts 15 00552 g004
Figure 5. (a) Tafel slopes of Cu/Sn composites with different molar ratios; (b) electrochemical impedances of Cu3P, pure SnS2, and Cu3P/SnS2 with different molar ratios; (c) Cu3P, SnS2, and Cu3P/SnS2 current density and sweep speed relationship.
Catalysts 15 00552 g005
Disclaimer/Publisher’s Note: The statements, opinions and data contained in all publications are solely those of the individual author(s) and contributor(s) and not of MDPI and/or the editor(s). MDPI and/or the editor(s) disclaim responsibility for any injury to people or property resulting from any ideas, methods, instructions or products referred to in the content.

