2.1. Electrocatalyst Morphology Characterization
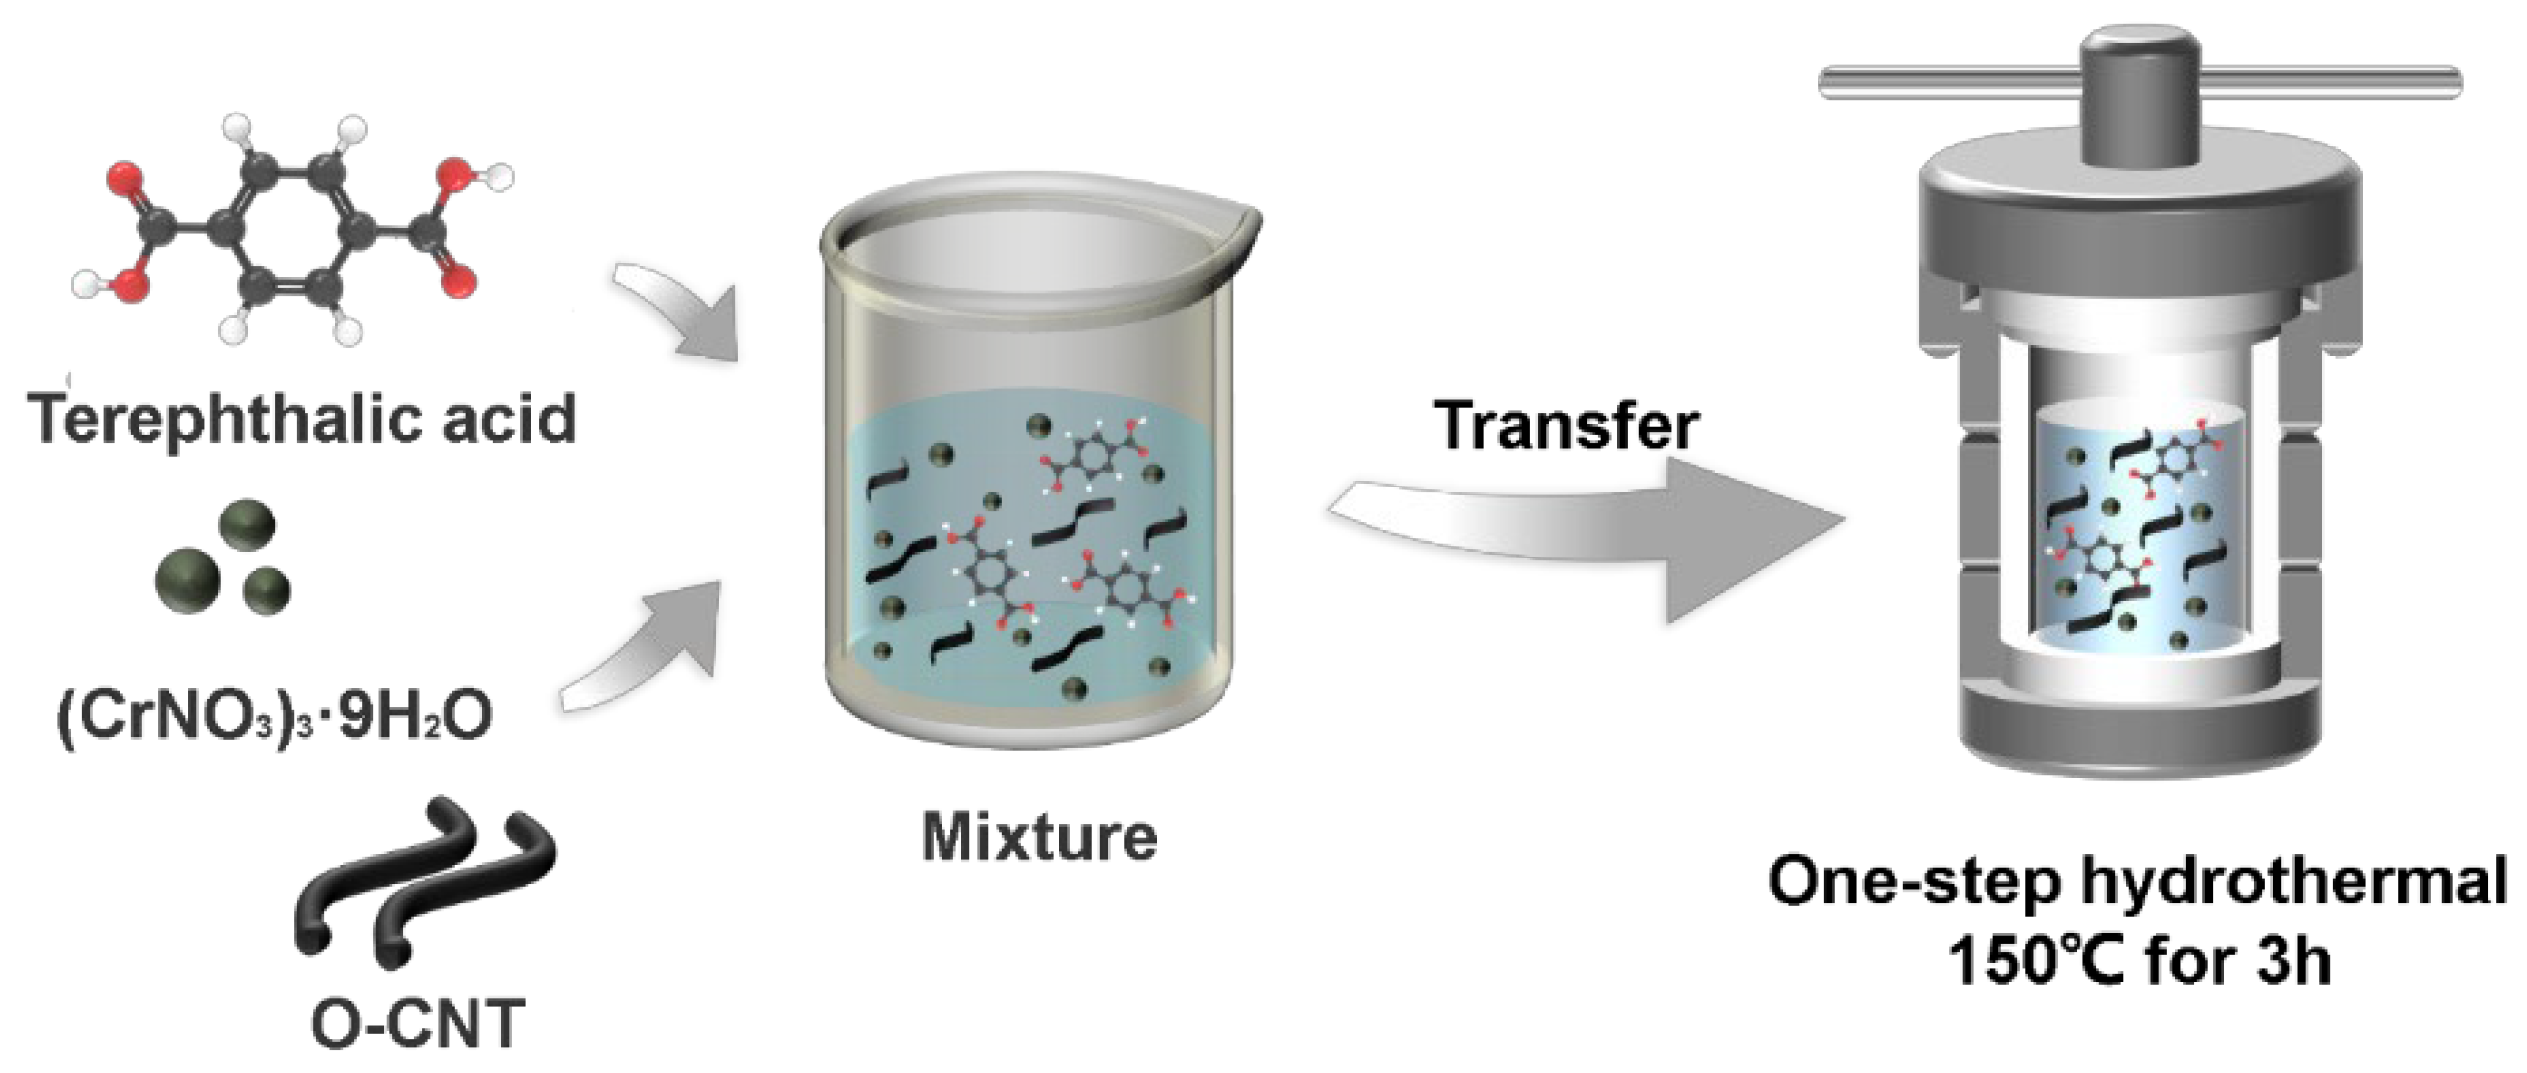
The Cr-Ps@O-CNT was prepared using a one-step hydrothermal method, without any additives or post-treatment (
Figure 1). The final product was obtained by dissolving a specific amount of Cr(NO
3)
3·9H
2O, terephthalic acid (BDC), and O-CNTs in N, N-dimethylformamide at room temperature, with ultrasonic mixing, followed by a hydrothermal reaction at 150 °C for 3 h. In addition to BDC, we also used two other homologous compounds, 1,2,4-benzenetricarboxylic acid (BTC) and 1,2,4,5-benzenetetracarboxylic acid (BFC), to investigate their regulatory role. In general, the synthesis of electrocatalysts involves complex post-treatments, such as energy-intensive carbonization and acid etching, which can lead to the collapse of the material framework and mask the original active sites, eventually reducing their activity. To address these shortcomings, we considered the 2e
− ORR activity of O-CNTs and integrated it with Cr-Ps to explore the activity and selectivity of 2e
− ORR for H
2O
2 production.
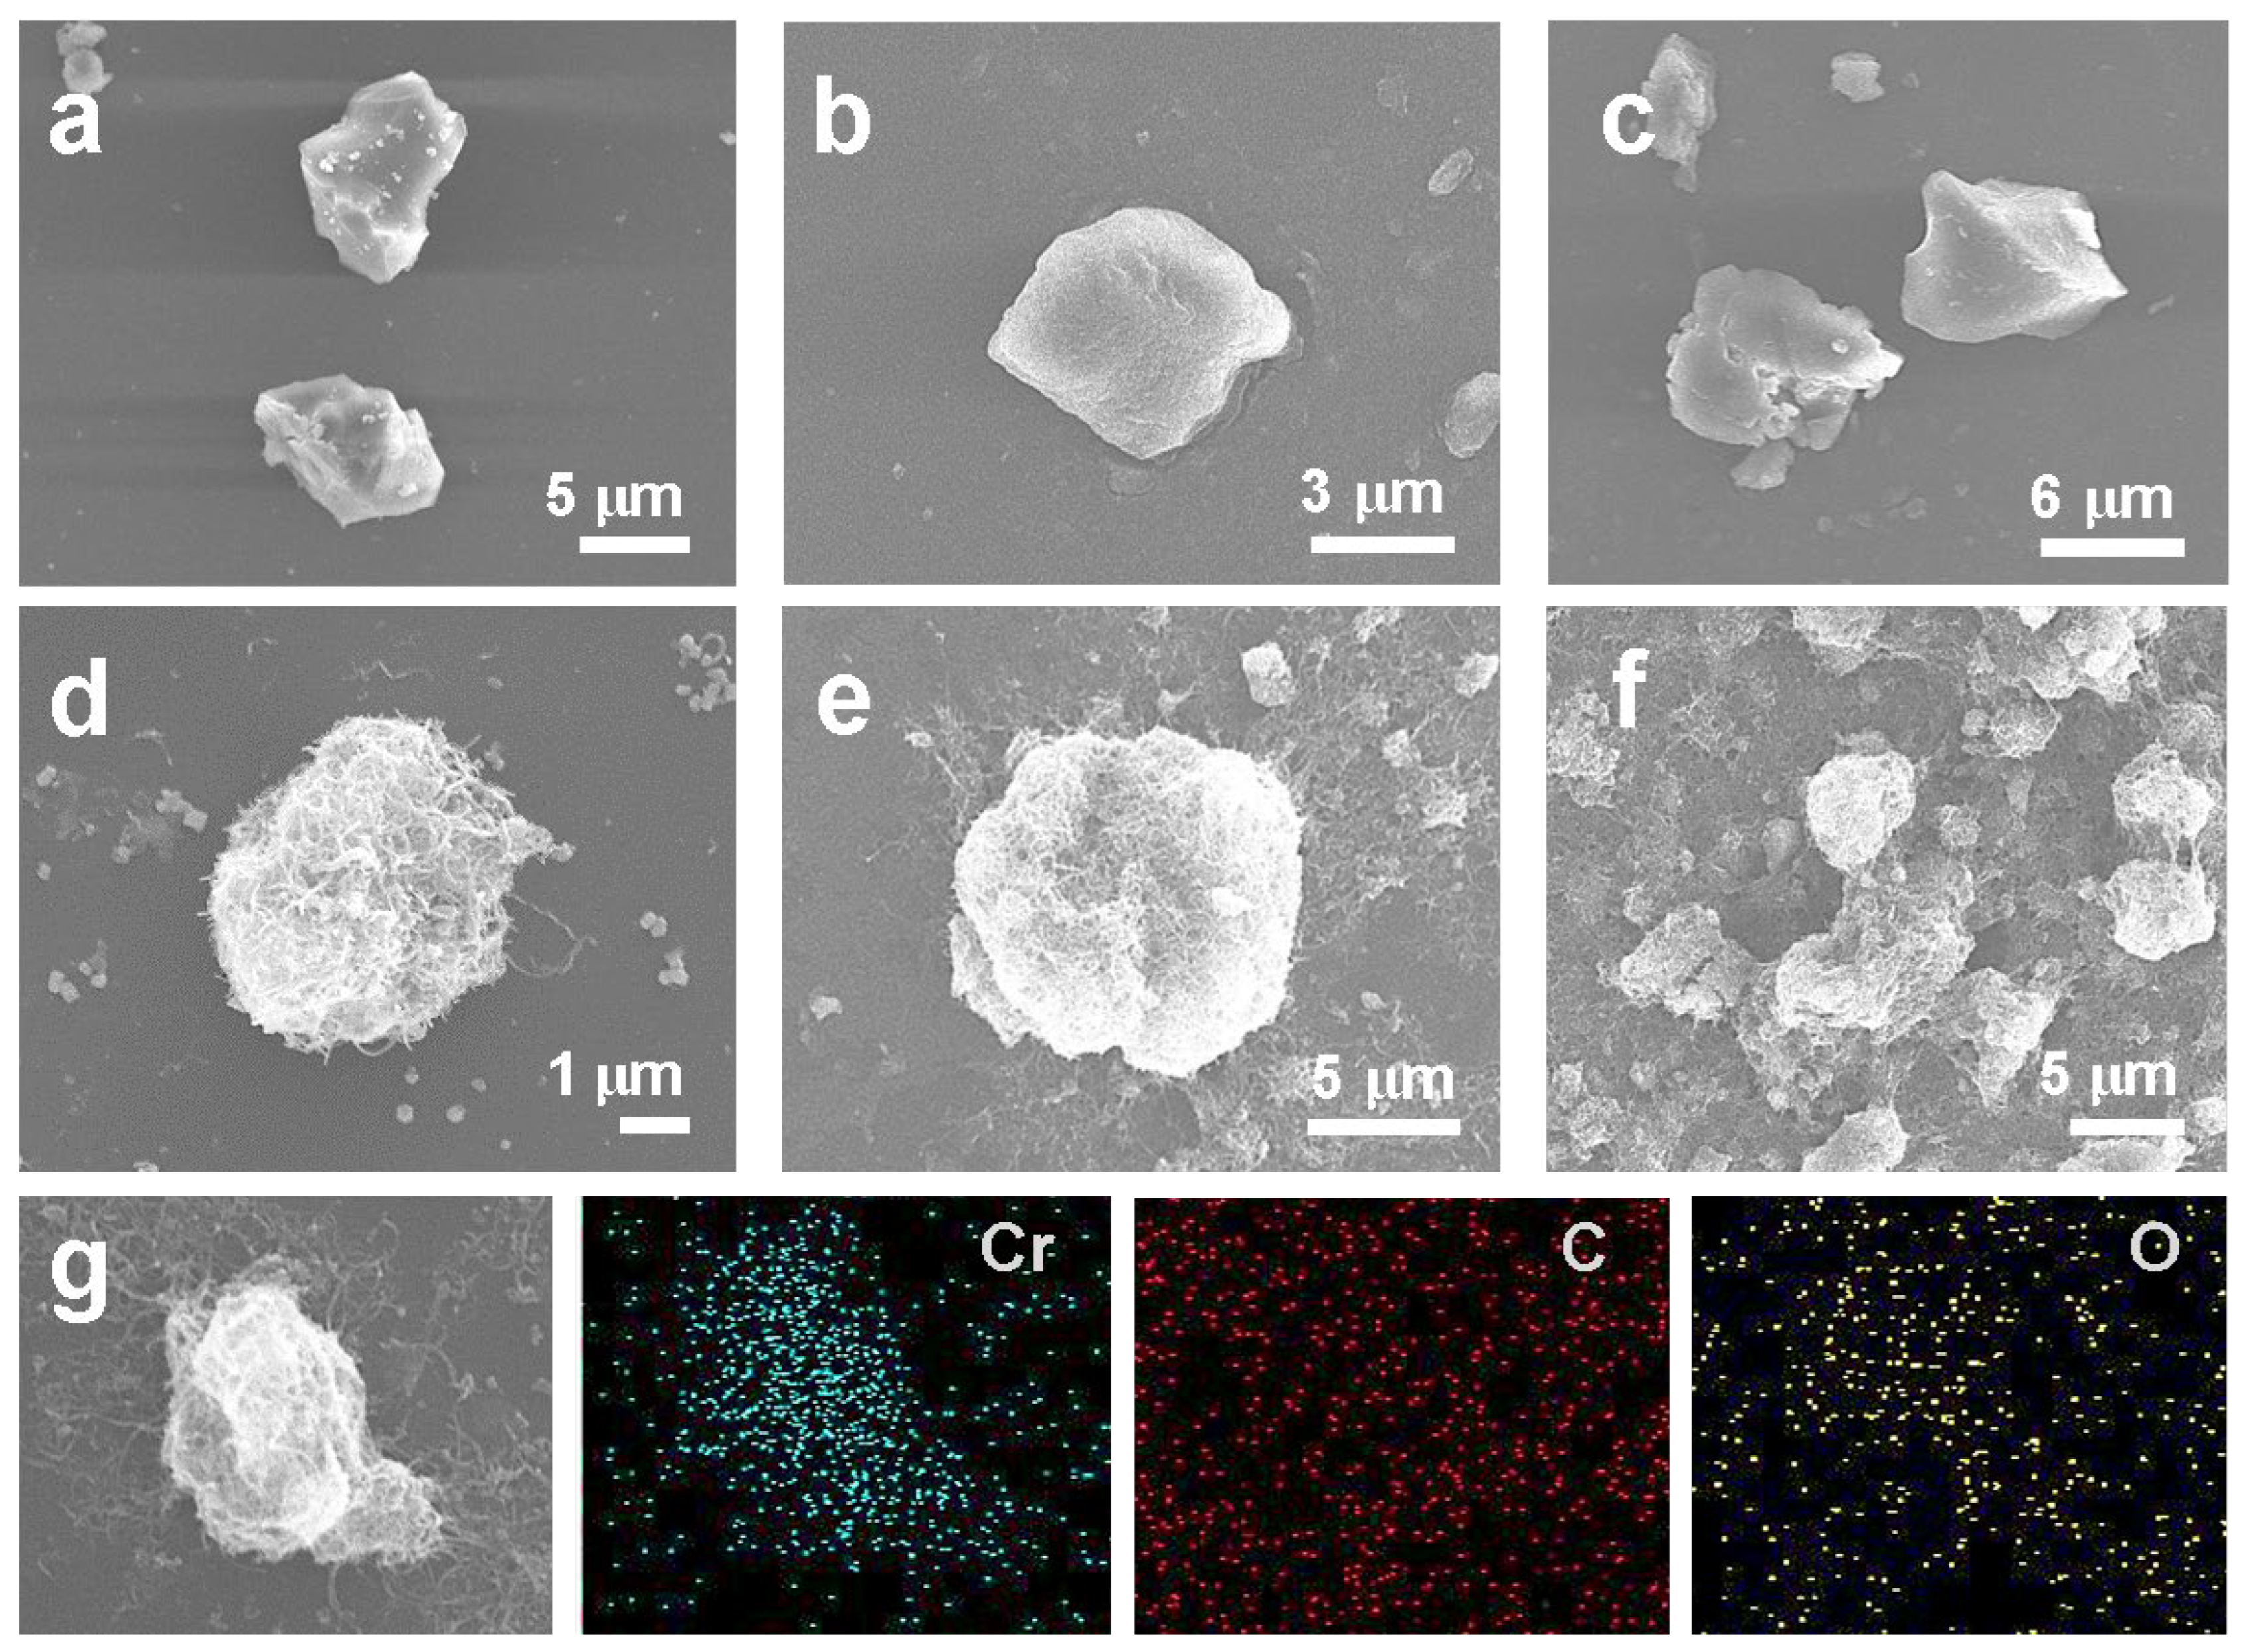
The morphological changes in the Cr-Ps were evaluated using SEM images. The SEM image of Cr-BDC shows an irregular, rough, block-like morphology (
Figure 2a). We investigated the effect of different organic ligands on the morphology shown in
Figure 2b,c. Both Cr-BTC and Cr-BFC exhibit a similar irregular bulk morphology, with sizes roughly in the range of 3–6 µm. After being combined with O-CNTs, all the composites exhibit plush ball shapes. Importantly, the change in size is consistent with the samples without the addition of O-CNTs, demonstrating that the nucleation and growth of the polymers primarily depend on the organic ligands rather than the synthesis environment. After the completion of the hydrothermal composite process, the Cr-BDC@O-CNT composite exhibits a dense and uniform distribution of oxidized carbon nanotubes on its outer surface, while the carbon nanotubes are tightly wrapped around the Cr-BDC (
Figure 2d). The morphology and size of both the Cr-BDC and O-CNTs have changed significantly, with a decrease in the bulk structure volume and an increase in the surface area due to the wrapping of the O-CNTs, contributing to an increased surface area. The metal Cr cations are likely coordinated with –COOH on the BDC, while the O-CNT with its oxygen functional groups can also provide coordination sites for Cr. By connecting these oxygen functional groups for nucleation growth, catalytically active Cr–O sites are formed and, finally, porous heterogeneous structures with abundant catalytic sites are obtained. Importantly, the overall composite maintains its initial shape compared to the Cr-BDC, and only the physical size is reduced after compounding, while the structural morphology remains intact. In
Figure 2e,f, only a small amount of carbon nanotubes are present on the surface after compounding with O-CNTs, and there is no significant size reduction. For the Cr-BFC@O-CNT, more severe agglomeration occurs, indicating that the increase in the number of carboxyl groups causes an increase in the volume of the product, which can lead to material agglomeration. The larger volume and the lower loading of O-CNTs also result in a smaller specific surface area. Additionally, the agglomeration between the materials can mask the exposure of the catalytic sites, affecting the catalytic activity and selectivity of the composites. To further investigate the elemental distribution, we conducted scanning electron microscopy-energy dispersive spectroscopy (SEM-EDS) (
Figure 2g). The data showed that Cr, C, and O elements were uniformly distributed in the catalyst. The Cr content in the bulk region of the Cr-BDC was significantly higher than in other regions, whereas C and O were uniformly distributed throughout the system’s structure. This phenomenon demonstrates that the Cr-Ps grow to a large size and occur predominantly on the O-CNT surface, forming a robust architecture.
2.2. Structural Characterization of the Electrocatalysts
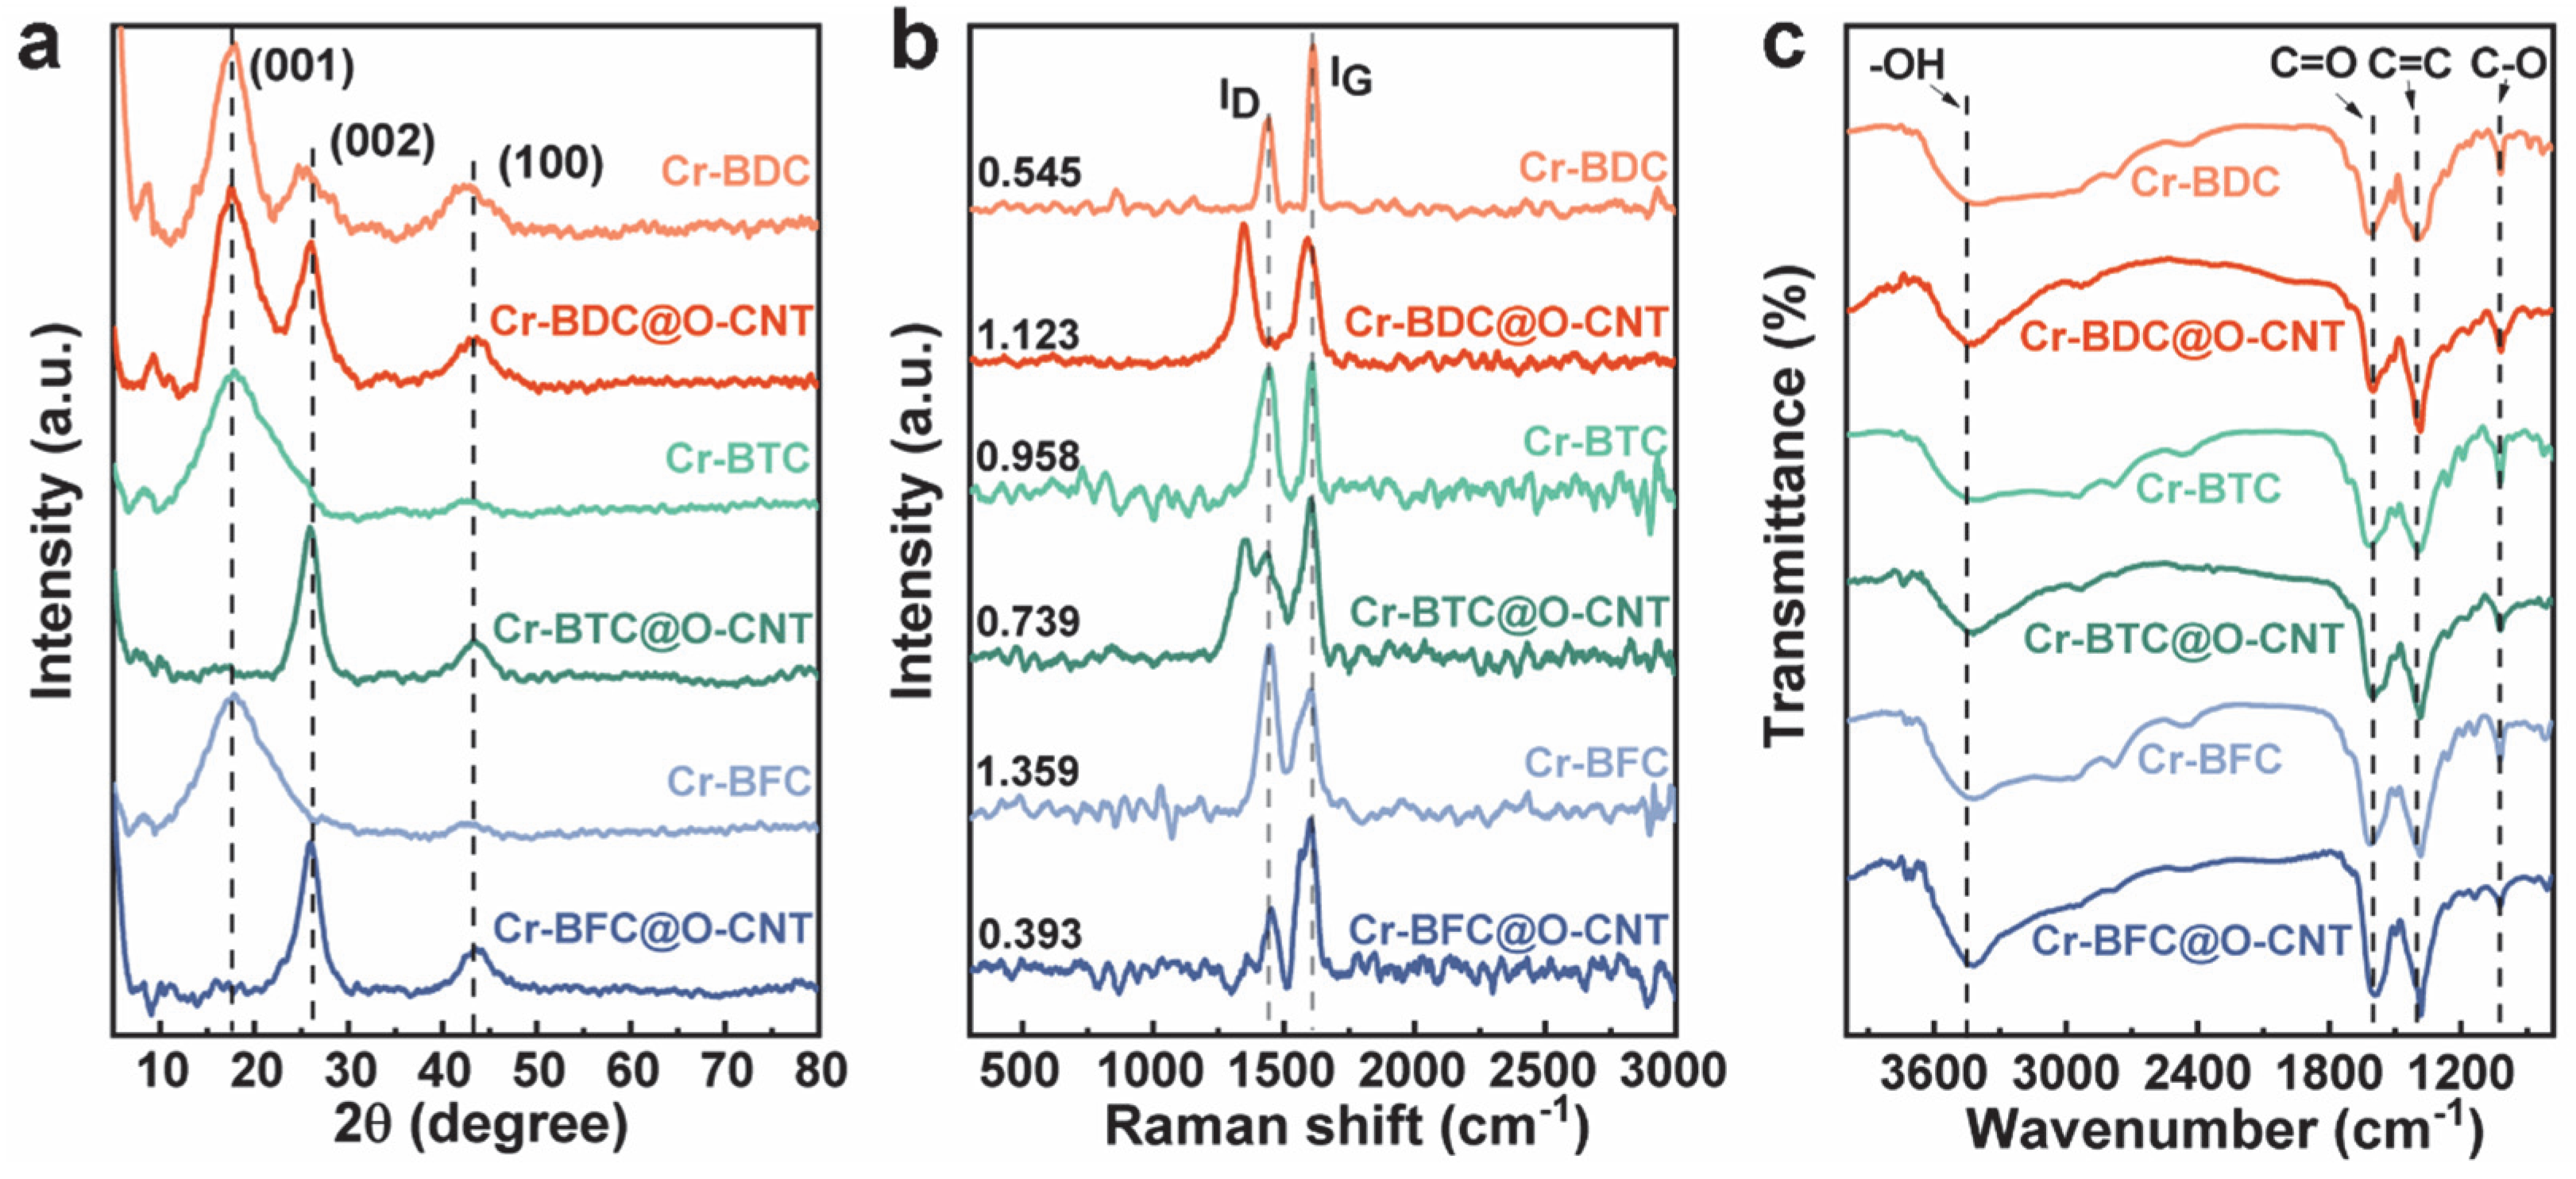
The phase structure of the various catalysts was investigated using XRD spectra (
Figure 3a). The samples before compounding exhibit a broad diffraction peak at 17.8°, corresponding to the (001) crystal plane of the graphitic carbon structure [
17,
18], which is characteristic of amorphous materials without crystalline ordering. Only Cr-BDC has a weak peak at 25.5° and 43.2°, corresponding to the (002) and (100) planes of graphite [
19]. The latter peak may occur because the bonding of Cr and BDC increases the degree of graphitization. After their combination with O-CNTs, all the samples exhibit a sharper peak at 26°, which is attributed to O-CNTs [
20]. Only Cr-BDC@O-CNT still has an intense peak at 17.5°, indicating that the addition of O-CNTs causes a transformation of the (001) plane to take place into the (002) plane. Furthermore, Cr-BDC@O-CNT maintains the equilibrium state of coexistence in terms of the two crystal planes. In addition, all three samples exhibit a (100) plane with enhanced graphitization, due to the binding of the O-CNTs. No peaks associated with metallic Cr were detected in the XRD patterns, indicating that Cr successfully participated in the porous carbon skeleton, and that the metal-organic polymer (MOP) binding did not affect the overall structure of the crystals.
To estimate the degree of disorder in the catalyst, Raman scattering was used, with different degrees of disorder leading to different numbers of defects. The spectra of the three bands in
Figure 3b reveal that the D-band (1443 cm
−1) is assigned to structural defects, and the G-band (1615 cm
−1) is associated with the graphite-layer sp2 carbon mode [
21]. The results show that the Cr-BDC@O-CNT samples have a higher degree of disorder (ID/IG = 1.12) compared to the pure Cr-BDC material, confirming the high degree of disorder. This is mainly attributed to the introduction of O-CNTs, which increases the presence of vacancies, defects, and oxygen atoms. The formation of many vacancies provides fixed sites for O atoms and preferential binding sites for metal Cr atoms. In contrast, in the Cr-BTC@O-CNT and Cr-BFC@O-CNT samples, the introduction of O-CNTs reduces the degree of disorder, which is one of the reasons for their lower catalytic selectivity. For the pure Cr-Ps system, the increase in the number of ligand carboxyl groups enhances the degree of disorder. However, due to the agglomeration of the structure, it hinders the exposure of active defect sites, leading to a decrease in its catalytic performance. In contrast, in the composite system, the increase in the number of ligand carboxyl groups reduces the degree of disorder of the materials, indicating that BDC is the most suitable ligand for O-CNTs.
The chemical bonding of O and Cr on the catalyst surface was investigated using FTIR and X-ray photoelectron spectroscopy. Based on the FTIR spectra shown in
Figure 3c, all the samples contained stretching vibration peaks of –OH, C=C, C=O, and C–O, appearing at 3000–3600, 1382, 1588, and 1011 cm
−1, respectively [
22], which confirms that the oxygen-containing functional groups are strongly bound to the C atom.
As can be seen from the XPS total spectrum, the binding energy of the sample shifts toward higher values after its integration with O-CNTs, which indicates its enhanced ability to attract the electrons from the catalysts. The C1s spectra of the catalyst materials were analyzed and deconvoluted into three peaks, attributed to 284.80, 286.35, and 288.95 eV, corresponding to C–C/C=C [
23], C–O [
24], and C=O [
25], respectively. The data showed that the addition of O-CNTs can accelerate the formation of C–O bonds and leads to an increase in C–O and a corresponding decrease in C=O functionalities, which is consistent with the changes observed following O-CNT incorporation. The presence of C–O groups is thought to be one of the robust active sites in the H
2O
2 production process, which is supported by the excellent H
2O
2-producing performance of the Cr-BDC@O-CNT sample with the highest C–O content. The analysis also revealed that the C=O content increased with an increase in the number of carboxyl groups of the ligands used, from BDC to BFC, indicating that the fewer carboxyl groups in the ligands, the higher the C–O content in the produced composites.
The O1s spectra of all the catalysts show three typical peaks (
Figure S2a), corresponding to C–O (533.29 eV), C=O (532.00 eV), and Cr–O (531.05 eV) [
26,
27]. The change in the C=O and C–O content in the O1s spectra is similar to that of the C1s spectra, as shown in
Figure S2a. Notably, the characteristic peak of Cr-BDC@O-CNT shifts positively relative to that of Cr-BDC, indicating a significant interaction between the Cr species and the oxygen functional group. The O1s spectra also exhibit higher C–O content, which can activate the catalytic reaction. Similarly, the trend of the C–O content in regard to the number of carboxyl groups is consistent with that observed in the C1s spectra, and Cr-BDC@O-CNT has the highest C–O content, which contributes to its catalytic activity. Moreover, the introduction of O-CNTs significantly increases the Cr–O content in the O1s spectra, with Cr-BDC@O-CNT exhibiting the highest Cr–O content. This suggests that the formation of C–O bonds promotes the formation of Cr–O bonds, providing additional catalytic possibilities for the reaction.
The Cr 2p spectra were analyzed to confirm the evolution of Cr valence (
Figure S2b). The spectra exhibited two peaks, Cr 2p3/2 and Cr 2p1/2, located at 577.5 and 587.33 eV, respectively. The peak of Cr 2p3/2 could be fitted to three peaks of Cr–O (576.49 eV) [
28], Cr3+ (577.44 eV) [
29], and Cr5+ (578.61 eV) [
30]. As shown in
Figure S2b, the addition of O-CNTs led to greater conversion from Cr3+ to Cr5+, and the increased valence can facilitate charge transfer. Additionally, the highest Cr–O content was found in the BDC system, which supports the results of the relative O1s spectra. Cr–O can provide numerous reaction sites for the reduction of oxygen to H
2O
2, making it another active site for the catalytic reaction.
From the above analysis, two conclusions can be drawn. Firstly, the change in ligands has an impact on the content of C–O and Cr–O. Moreover, O-CNTs can induce C–O formation and enhance the electron-donating effect of the system, as well as increase the catalytic sites of Cr–O. Secondly, the effect of different ligands on the system is clarified, namely that more carboxyl groups in the ligand does not necessarily result in better catalytic performance. On the contrary, the para-carboxyl groups of BDC have better coordination with Cr and O-CNTs, resulting in the highest C–O and Cr–O content in this system. This conclusion can be further verified from the findings in relation to the electrochemical performance. Therefore, it can be predicted with confidence that the BDC combined with the O-CNT system will have the best performance.
2.3. Electrocatalyst Performance Testing
We investigated the 2e− ORR electrocatalytic activity of Cr-BDC@O-CNT and compared it with other samples, using a three-electrode system. We first optimized the preparation conditions of Cr-BDC@O-CNT based on the test results, focusing on the effect of the mass ratio of metal salts to organic ligands and the content of the added O-CNTs on the catalytic system. Once the optimal preparation conditions were determined, we investigated the catalytic activity and selectivity of Cr-BDC@O-CNT.
The electrochemical activity of the catalysts for the oxygen reduction reaction was evaluated using the CV method.
Figure S3a,c compares the CV curves for a series of catalysts before and after their exposure to an oxygen-saturated 0.1 M KOH electrolyte. Similar general characteristics were observed for all the samples, with current peaks at 0.5 V–0.7 V related to the quasi-reversible redox process at the active sites on the catalyst surface. Comparing the CV curves before and after O-CNT compounding, it was found that the curve area of the three catalysts slightly increased after O-CNT compounding, indicating the enhanced effect of the formed Cr–O active sites on the reaction efficiency. To further understand the ORR kinetics of the catalysts, linear scan voltammetry (LSV) with rotating disc electrodes was performed (
Figure S3b,d). Each catalyst showed electrocatalytic ORR activity, but exhibited a lower peak current in the LSV, implying the occurrence of a reduction process, with a lower electron transfer number.
The electrochemical activity and selectivity of the catalysts in regard to the oxygen reduction reaction (ORR) were evaluated by monitoring the reduction current of O
2 on the rotating ring-disk electrode and the quantitative oxidation on the Pt ring at different bias potentials during the ORR (
Figure 4a and
Figure S4). The disc currents of all six samples, including Cr-BDC@O-CNT, began to decrease at approximately 0.5 V vs. RHE, indicating a comparable O
2 reduction performance on the disk. The yield of H
2O
2 produced was detected at the ring electrode, and a positive current was measured at the ring electrode, once H
2O
2 was produced on the disc. It was observed that all six samples showed significantly different ring currents, and the para-carboxyl group of BDC had the strongest effect on the improvement of the catalytic performance of the system. This suggests that both in the pure MOP system and in the composite system, the para-carboxyl group and Cr have the best affinity with the oxygen functional group, thus exerting the strongest catalytic effect.
After the introduction of O-CNTs, the ring current density of the three samples is significantly enhanced, as shown in
Figure S4, which reveals the positive promotion effect of the O-CNTs. Furthermore, the polarization curve of Cr-BDC@O-CNT is positively shifted compared to that of Cr-BDC, indicating that the combination of these two components could further enhance the 2e
− ORR activity. The excellent electrocatalytic performance of Cr-BDC@O-CNT can be attributed to its abundant active catalytic sites, which provide a higher current output and a lower overpotential for the ORR, with excellent mass and electron transfer efficiency. The enhanced electrocatalytic performance of Cr-BDC@O-CNT may be related to its high electrical conductivity, the synergistic interaction between the two components, the large number of defects, and the suitable adsorption capacity of the active site for ORR intermediates.
The average electron transfer number (
n) of the series of catalysts falls within the range of 2.2–3.1, as shown in
Figure S5. Notably, the
n values of the comparison products are significantly higher than the value for Cr-BDC@O-CNT (
n = 2.2), indicating that they follow an approximate four-electron pathway during the ORR. In contrast, Cr-BDC@O-CNT undergoes a two-electron transfer pathway, suggesting that the doping of O-CNTs can modulate the electronic structure of the active sites on the catalyst surface and, thus, change the ORR pathway. However, for Cr-BTC and Cr-BFC, the organic ligands containing tricarboxylic and tetracarboxylic groups do not provide a suitable coordination mode for the two-electron pathway and, the addition of O-CNTs, does not have a positive effect on their overall performance. This further suggests that the para-carboxyl group of BDC is essential in forming an active site with Cr and O-CNTs to enhance the catalytic performance of the system.
Figure 4b and
Figure S6 show the H
2O
2 selectivity plotted against the applied potential for each catalyst; in addition to the higher activity. It can be observed that Cr-BDC does not exhibit a selectivity advantage over the three pure MOP products in the entire applied potential region, and the selectivity of Cr-BDC, Cr-BTC, and Cr-BFC decreases (
Figure S6), indicating that the increase in the number of carboxyl groups in the pure MOP system weakens the selectivity. After the introduction of O-CNTs (
Figure 4b), the selectivity of Cr-BDC@O-CNT and Cr-BTC@O-CNT slightly increases, while that of Cr-BFC@O-CNT decreases. Moreover, a significant increase in selectivity is observed in Cr-BDC@O-CNT, which implies that the para-carboxyl group in it produces the strongest promoting effect. The H
2O
2 selectivity of Cr-BDC@O-CNT for the ORR is approximately 87% in the potential range from 0.2 V to 0.7 V. The order of H
2O
2 selectivity in the catalysts combined with O-CNTs is as follows: Cr-BDC@O-CNT > Cr-BTC@O-CNT > Cr-BFC@O-CNT. Considering that pure Cr-BDC exhibits relatively low selectivity, it can be concluded that the introduction of O-CNTs enhances the overall catalytic activity of the system.
The Faraday efficiency (FE) is an important parameter for determining the cost of the catalytic process.
Figure S7 shows the FE obtained for each catalyst. Cr-BDC@O-CNT has the highest FE of 94%, when a voltage of 0.35 V (vs. RHE) is applied (
Figure 4c). Interestingly, the FE value is consistent with the selectivity of the material, with Cr-BDC@O-CNT showing the highest selectivity and FE, indicating that the catalyst has a tendency to participate in the 2e
− ORR process.
Figure 4d summarizes the mass activity of the catalysts during the O
2 to H
2O
2 transformation process. The optimized Cr-BDC@O-CNT achieved a current of 19.42 A g
−1 H
2O
2 (0.2 V, 1600 rpm), which outperforms the comparison products and is better than most electrocatalysts reported to date.
The activity of limiting the diffusion current density (J
K) of the H
2O
2 at 0.20, 0.25, and 0.30 V was compared among the samples (
Figure 4e). It was found that all the samples exhibited the highest activity at 0.20 V, which decreased sequentially with increasing potential. The trend of increasing and decreasing activity of the materials before and after modification was consistent with the trend in their selectivity. Cr-BDC@O-CNT was observed to be the most active among the samples (1.50 mA cm
−2 at 0.20 V). It exhibited the highest kinetic current and selectivity (87%), while Cr-BDC showed a poor J
K, H
2O
2 (0.62 mA cm
−2 at 0.20 V) and the lowest H
2O
2 yield. The different selectivity of the samples was the main reason for this phenomenon, and it was more pronounced in the low potential region.
The obtained Tafel plots (
Figure 4f and
Figure S8) provide further insights into the ORR mechanism of the catalysts. The Tafel slope of Cr-BDC@O-CNT is 63.5 mV/dec, which is significantly lower than the Tafel slopes of Cr-BTC@O-CNT (77.8 mV/dec) and Cr-BFC@O-CNT (67.7 mV/dec). This lower Tafel slope for Cr-BDC@O-CNT indicates faster ORR kinetics and is also lower than that of pure Cr-BDC. This suggests that the incorporation of O-CNTs into the Cr-BDC structure decreases the charge transfer resistance and accelerates oxygen reduction kinetics. These effects improve the electrocatalytic activity towards oxygen reduction reactions and make Cr-BDC@O-CNT a promising candidate for the synthesis of H
2O
2.
To further investigate the kinetics related to Cr-BDC@O-CNT, we recorded a series of linear sweep voltammetry (LSV) curves at different rotation rates (225 rpm to 2050 rpm), using a rotating disk electrode (RDE) (
Figure S9a). The obtained LSV curves showed a limiting current that was specifically dependent on the rotational speed, followed by a second wave at more negative potentials. Such a profile strongly confirms that the oxygen reduction reaction (ORR) undergoes a two-electron process, with the formation of a hydrogen peroxide anion as an intermediate, which is subsequently reduced to a hydroxyl anion. The Koutecky-Levich (K-L) plots for the catalysts at each applied potential are shown in the corresponding K-L plots, revealing a series of approximately parallel lines, indicating no significant change in the number of electron transfers per molecule and an effective surface area over the range of potentials studied. The slopes of the K-L plots calculate (
n) values of 2.1–2.3 for each catalyst in the potential range, indicating that oxygen is reduced to H
2O
2 via a two-electron pathway. However, it is important to note that the K-L calculations are somewhat uncertain and need to be further confirmed using RRDE techniques.
Furthermore, the stability of the electrocatalyst is essential for the production of H
2O
2. The 36,000 s long-term durability test of the Cr-BDC@O-CNT catalyst was measured at a constant potential, as shown in
Figure 4g. The current is very stable after the initial transient period, demonstrating the adequate durability of Cr-BDC@O-CNT for guaranteeing its activity and selectivity.
The true catalytic activity of a catalyst was analyzed by determining its electrochemically active specific surface area (ECSA) (
Figure S9b). The double-layer capacitance (Cdl) value was used to calculate the ECSA, which showed a much higher value for Cr-BDC@O-CNT (4.27 mF cm
−2) compared to Cr-BDC (1.39 mF cm
−2), indicating that the introduction of O-CNTs resulted in the exposure of more catalytically active sites on the Cr-BDC@O-CNT. This observation suggests that the introduction of O-CNTs can improve the catalytic performance of Cr-BDC, making it a promising material for use in various catalytic applications. The findings of this study provide new insight into the development of highly efficient and stable catalysts, by combining the unique properties of different materials.


