1. Introduction
The two global challenges, like rapid industrialization and increased population growth, have caused environmental pollution and energy scarcity, which have triggered the search for sustainable alternatives. Besides energy-related challenges, which may be managed by harnessing solar energy (visible light), as it is abundant, cost-effective, and readily accessible, water contamination is another major issue of great concern. Industries produce and supply products to fulfill human needs for sustainable life on the earth planet, but at the same time discharge mainly organic compounds (dyes, personal care products, medicinal drugs, pesticides, bioproducts, phenols, chlorophenols, etc.) of toxic, non- or poorly biodegradable and recalcitrant in nature into the freshwater bodies effecting the water quality for usage via posing a serious risk to humans health, aquatic life as well as to the environment [
1]. Various water treatment methods, including coagulation, flocculation, membrane filtration, ion-exchange, reverse osmosis, wet air oxidation, chemical oxidation, adsorption, and biological techniques have been developed and applied for the removal of pollutants. The majority of these techniques are not only unable to eradicate the pollutants present in water, but also merely transform them to other acceptable secondary phases, in addition to time consumption, low removal process efficiency, small-scale applicability, high capital, operational and maintenance cost, fouling problems, media regeneration, high usage of chemical reagents, extreme process temperature and pressure conditions, and increased amount of sludge generation, but not limited to [
2]. In such a scenario, the use of green chemistry approach of developing advanced oxidation processes (AOPs) are imperative for the sustainable growth of human society and reduction of water pollution. AOPs make use of their produced abundant and non-selective hydroxyl or sulfate radicals, singlet oxygen and superoxide radicals towards complete pollutant removal and mineralizing them to acceptable non-hazardous products such as water, carbon dioxide and mineral acids.
Among several AOPs, heterogeneous photocatalytic processes are capable of effectively reducing a variety of contaminants at ambient temperature and pressure [
3], having the requirement of efficient and active semiconductor photocatalyst and light energy. Over the years, a variety of photocatalysts, like titanium dioxide (TiO
2), zinc oxide (ZnO), tungsten oxide (WO
3), cadmium sulphides (CdS), zinc sulphides (ZnS), silica oxide (SiO
2), lead sulphides (PbS), zirconia oxide (ZrO
2), ferric oxide (Fe
2O
3), etc., are employed [
4]. Among them, TiO
2 has received much attention from researchers for environmental remediation, hydrogen production, value added products productions due to its excellent stability in wide range of solution pH, photo corrosion resistant character, high activity, ease of cost-effective production, non-selectivity towards pollutant molecules, and powerful oxidation nature. However, the large-scale practical applications of TiO
2 photocatalysis are hampered due its wide band gap of 3.2 eV (anatase-TiO
2) requiring the usage of 4~5% of UV light in solar spectrum for activation, high recombination rate of photo generated electron–hole pairs (e
−/h
+) hindering the rate of photocatalytic reactions, non-uniform dispersion and agglomeration and low surface area (commercial Degussa P-25 TiO
2 has 50 m
2/g BET surface area) for pollutants adsorption.
To improve physicochemical, optical, and photocatalytic properties, researchers have introduced metal and non-metals as dopants into TiO
2. This alteration goal is to modify the forbidden bandgap, oxygen defect concentration, retarding e
−/h
+ recombination rate, and increased surface area, and coupling properties [
5]. Doping rare earth (RE) metals in TiO
2 lattice has garnered a lot of interest due to their distinct 4f electronic configuration aiding towards notable redshift of light absorption but also obstructing the anatase to rutile TiO
2 transformation during annealing at high temperature. Also, it is also commonly known that RE ions tend to combine with certain Lewis bases on the surface of TiO
2 to create complexes that increase the material’s adsorption capacity and rate simultaneously [
6]. In the lanthanide series of periodic table elements, cerium (Ce) salts are frequently employed as dopants, and their effectiveness is illustrated through ease of handling, cost-effectiveness, high stability, and non-toxic properties [
7]. Their use in stoichiometric quantities is frequently thwarted by unwanted environmental and economic features [
8]. Additionally, the redox couple, Ce
3+/Ce
4+, creates a cerium oxide shift between CeO
2 and Ce
2O
3 under oxidizing and reducing conditions. Also, ceria’s strong oxygen storage capacity for higher activity is enhanced by these two prevalent valency states [
9]. The electronic configurations of 4f
15d
0/4f
05d
0 could result in different optical properties and improve photo electrons acceptance by retarding e
−/h
+ recombination, thereby improving photostability and quantum yield [
10]. Moreover, labile oxygen vacancies (V
os) are produced due to Ce
3+/C
4+ charge balance in addition to the relatively high mobility of bulk oxygen species, which in turn results in a strong catalytic potential [
11]. According to recent research, the photocatalytic activity of Ce-doped TiO
2 is influenced by Ce content and its distribution in the lattice, crystallinity improvement, developed functional groups, and the diffusion length of e
−/h
+ pairs [
4,
12,
13].
The literature commonly reports the usage of titanium alkoxide (tetrabutyl titanate -TBOT, titanium isopropoxide -TTIP) and inorganic precursors (titanium tetrachloride -TiCl
4) for the synthesis of cerium-doped titanium dioxide (Ce-TiO
2) [
4,
5,
7,
14,
15]. Due to their extreme sensitivity to heat and moisture, these precursors require handling and an inert atmosphere because the fast synthesis process’s hydrolysis kinetics are difficult to manage. In addition, ethanol is a commonly used solvent with these alkoxide and inorganic precursors in the common sol–gel process. Therefore, in this study, we report for the first time the preparation of Ce-doped TiO
2 (0–1.0 weight ratios) with reduced bandgaps via water-based sol–gel technique (a scarcely reported process in the literature) followed by spray drying and employing the titanium inorganic precursor, i.e., titanium oxysulfate (TiOSO
4). With this procedure, clear and regular and uniform sphere-like nanoparticles are produced and characterized for their physiochemical, optical, and electronic properties to establish the successful growth of this unique photocatalyst. Hence, surface-confined Ce
3+ ions on stable Ce-TiO
2 nanoparticles with enhanced photocatalytic capabilities for the elimination of aqueous organic contaminants particularly under visible light exposure were designed. The consequences of solution pH and photocatalyst dosage on photocatalytic performance, as well as the mechanism of the oxidative elimination of pharmaceutical antibiotic spiramycine (SPR) and role of radicals scavengers are explained for the first time. Numerous medicinal substances (antibiotics, anti-inflammatory drugs) have been found in the aquatic environment in recent years. They are seen as a rising pollution issue because of their presence and buildup in natural waters, which disrupts the ecosystem and increases aquatic species’ inability to reproduce [
16]. Antibiotics (amoxicillin, tetracycline, oxytetracycline, doxycycline, nitroimidazoles, sulfamethoxazole, sulfanilamide, sulfadiazine, ciprofloxacin, levofloxacin, enrofloxacin, ofloxacin, norfloxacin, tylosin, erythromycin, clarithromycin, spiramycin, azithromycin, ceftriaxone sodium, cephalexin, metronidazole, tinidazole, ornidazole, lincomycin, chloramphenicol, etc. [
17,
18,
19,
20]) have drawn particular attention, because of their increasing usage for the treatment of humans illness and excessive usage in production of food, turning soil and water into breeding grounds for antibiotic-resistant bacteria. Therefore, their buildup in the food chain can hasten the development of resistant microorganisms like pathogens. In addition, these antibiotics also cause damage to the central nervous system, arthropathy, spermatogenesis, endocrine disruption, and carcinogenic effects [
20]. Thus, there is an increased need to address the treatment of these alarming pollutants, which pose risks to the ecosystem. Pure and hybrid TiO
2 photocatalysis has been tested for some of these antibiotics (tetracycline, sulfamethoxazole, sulfamethazine, ciprofloxacin, levofloxacin, tylosin) degradation, while the rest require testing [
17].
Spiramycin SPR is a 16-membered macrolide antibiotic, categorized as an “emerging contaminant”, a class of substances that could potentially infiltrate the environment and have harmful effects at all levels of the biological hierarchy [
21]. Therefore, it is imperative to create long-lasting and efficient strategies for reducing or breaking down antibiotic residues in the aquatic environment. The developed Ce-TiO
2 material demonstrates great UV and visible light-assisted photocatalytic potential with recyclability and, finally, we hope that this effort will help create effective and long-lasting solutions to the increasing problem of pharmaceutical contamination in aquatic ecosystems, thereby fostering a healthier and cleaner environment for present and future generations.
2. Results and Discussions
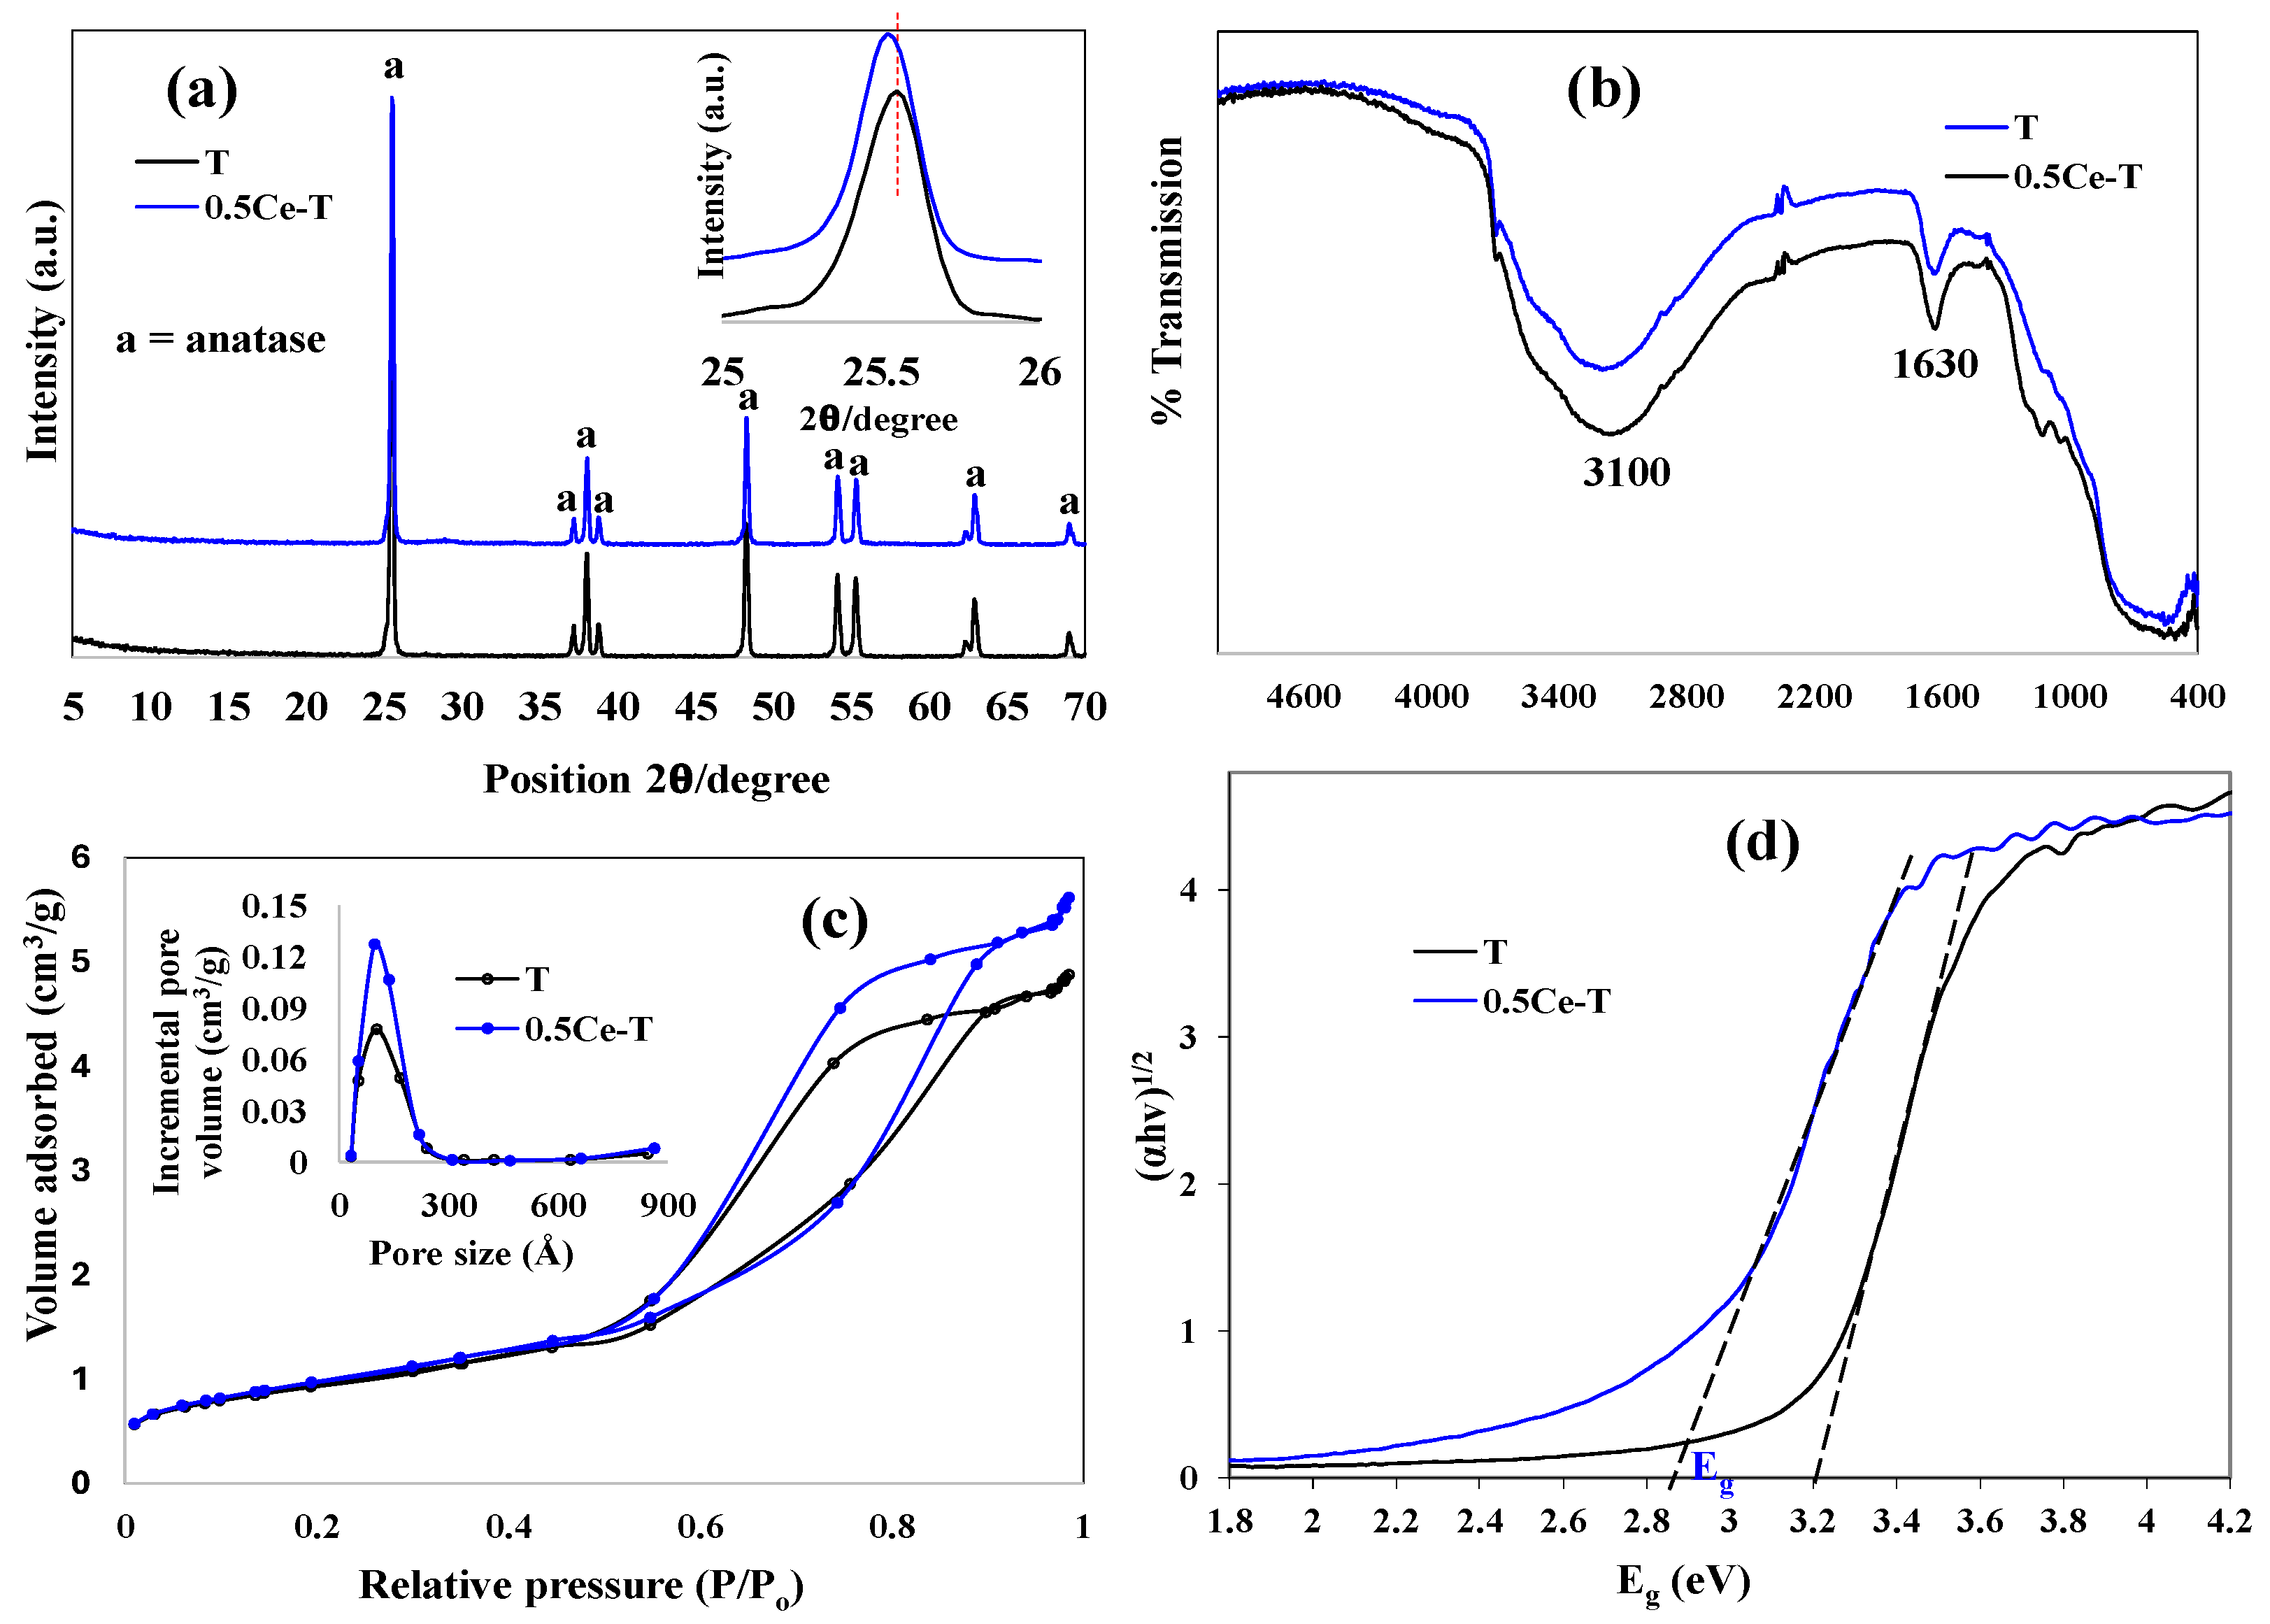
X-ray diffraction patterns of pure and the representative 0.5Ce-T are shown in
Figure 1a. In all samples, peaks of pure anatase crystalline phase (JCPDS No: 21-2172, tetragonal TiO
2) were observed at 2θ positions of 25.3°, 37.2°, 38.0°, 38.8°, 48.3°, 54.1°, 55.4°, 62.3°, and 69.3°, respectively, suggesting the stability of TiO
2 crystal structure upon doping. Upon close observation, no Ce peaks were noticed in the XRD patterns, this may be due to its low percentage; also, no cerium oxide (CeO
2) peaks were found, indicating that Ce ions were successfully doped into the TiO
2 lattice structure either substitutionally or interstitially. Furthermore, these findings also indicated that Ce loading affected both the titania crystallite size and the degree of crystallinity.
Table 1 demonstrates the crystallite size of pure and doped powders calculated by using the Scherrer’s formula (D = 0.9λ/βCosθ, where λ is the X-ray wavelength, θ is the Bragg angle, and β is the full width at half maximum (FWHM)) taking the diffraction plane [101] at 25.3° ± 0.2 of the prepared material). The crystallite size of the doped sample decreases up to the optimum content of Ce, i.e., 0.5 wt. ratio, and further increase in Ce loading results in the increase of crystallite size. This means the excess dopant amount distributes in the grain boundaries/grain junction and may cause particle agglomeration. It is known that Ce forms (ceria phase, small CeO
2 nuclei, Ce ions in crystal lattice) depending on photocatalyst preparation technique and Ce doping concentration. Matejova et al. [
22] reported Ce-doped TiO
2 synthesis employing the sol–gel method, with Ce doping levels ranging from 0 to 10 mol. %. They observed that at low Ce concentrations (<5.0 mol %), cerium could be effectively incorporated into the TiO
2 lattice. However, at higher Ce doping levels (5–10 mol %), the TiO
2 lattice became saturated, causing cerium to exist as amorphous CeO
2 instead. In another study, Lopez et al. [
23] stated that Ce could be incorporated into the TiO
2 lattice because the anatase crystalline structure contains interstitial channels that allow Ce
4+ ions to replace some of the Ti
4+ ions. During the sol phase, when ≡Ti–O– chains are formed, Ce
4+ can be positioned between these chains either by direct linking or substitution, ultimately resulting in a ≡Ti–O–Ce–O–Ti≡ structure. A slight shift to a smaller 2θ angle of the diffraction peaks was noticed with increasing Ce content up to 0.7 wt. ratio (see
Figure 1a (insert)), it is very well known that lattice distortion is associated with the shift to lower angles, which is promoted when dopants with larger ionic radii are incorporated into the lattice [
24,
25]. Since the ionic radii of Ce
3+ and Ce
4+ (0.103 nm and 0.093 nm, respectively) are significantly larger than that of Ti
4+ (0.064 nm), doping TiO
2with Ce can cause perturbations in the lattice [
26]. This leads to the accumulation of strain energy in the crystalline phase, resulting in a shift toward smaller angles, this may be an evident of the successful substitution of Ce in TiO
2 lattice structure [
24]. In further support, Kayani et al. [
27] also attributed the shift in diffraction angle to the substitution of smaller Ti
4+ by larger Ce
3+ in the TiO
2 lattice.
Figure 1b demonstrates the Fourier transform infrared spectra (FTIR). Pure and doped samples showed a broad band in the region 3400–2900 cm
−1 centered at 3100 cm
−1, which corresponds to the presence of -OH stretching groups on the surface of TiO
2. Another prominent peak at 1630 cm
−1 was noticed and attributed to the bending mode of adsorbed water on the TiO
2 surface or to Ti-OH coordination [
28]. Moreover, several small peaks were identified in the area below 1000 cm
−1 as belonging to the Ti–O and O–Ti–O flexion vibration absorption bands. The FTIR analysis made it clear that the powders had surface hydroxyl groups and absorbed water, both of which are crucial for photocatalysis. The hydroxyl ions (OH
−) can scavenge photoinduced h+s to form the highly reactive hydroxyl radicals (OH
•), which cause the pollutant molecules to break down.
To guarantee high potential photocatalytic activity, surface area and pore size are the crucial characteristics to be examined.
Figure 1c illustrates the N
2 adsorption–desorption isotherms measured at 77 K and BJH pore size distribution plots of pure and 0.5CeT powders, while the BET specific surface area and BJH pore volume values are mentioned in
Table 1. All the powders exhibited the typical Type IV adsorption–desorption isotherm, with an H4 hysteresis loop, which is characteristic of mesoporous materials. Additionally, a narrow pore size distribution (
Figure 1c (insert)) was obtained through BJH analysis. The volume of N
2 gas adsorbed is enhanced with an increase in Ce content up to 0.7 wt. ratio as depicted from the increase in the hysteresis loop area. Among the samples, the highest BET surface area and BJH pore volume is measured for 0.5CeT. Further increase in dopant content resulted in decrease surface area and pore volume implying the excess dopant amount caused particle agglomeration and/or get deposited in the pores. The improvement in the surface area will be beneficial in initiating the photocatalytic activity by increasing the reaction sites [
29]. Also, larger material surface area illumination results in enhanced photon absorption, which consequently ends up in a larger number of charge carrier’s production required for the process redox reactions.
The bandgap energy (E
g) values of the synthesized pure and doped products were investigated by measuring UV–vis absorption spectra, followed by its conversion on the Kubelka–Munk procedure to draw the Tauc’s plots ((αhv)
0.5 vs. hv) as given in
Figure 1d. The bandgap value gradually decreased when compared with pure to doped powders. As illustrated in
Table 1, the observed trend was 0.7CeT < 0.5CeT < 0.9CeT = 0.3CeT < 0.1CeT < T. The lowering in bandgap energy is mainly caused by the initiation of defects in the lattice of host material [
30], which are featured to Ce ions inclusion into TiO
2 lattice, i.e., impurity level of Ce
3+/Ce
4+, oxygen vacancies (V
os) formed because of Ce ions and Ti
4+ charge compensation. This red shift of the doped materials towards higher wavelength can be linked to improved electronic properties via greater visible light photon absorption.
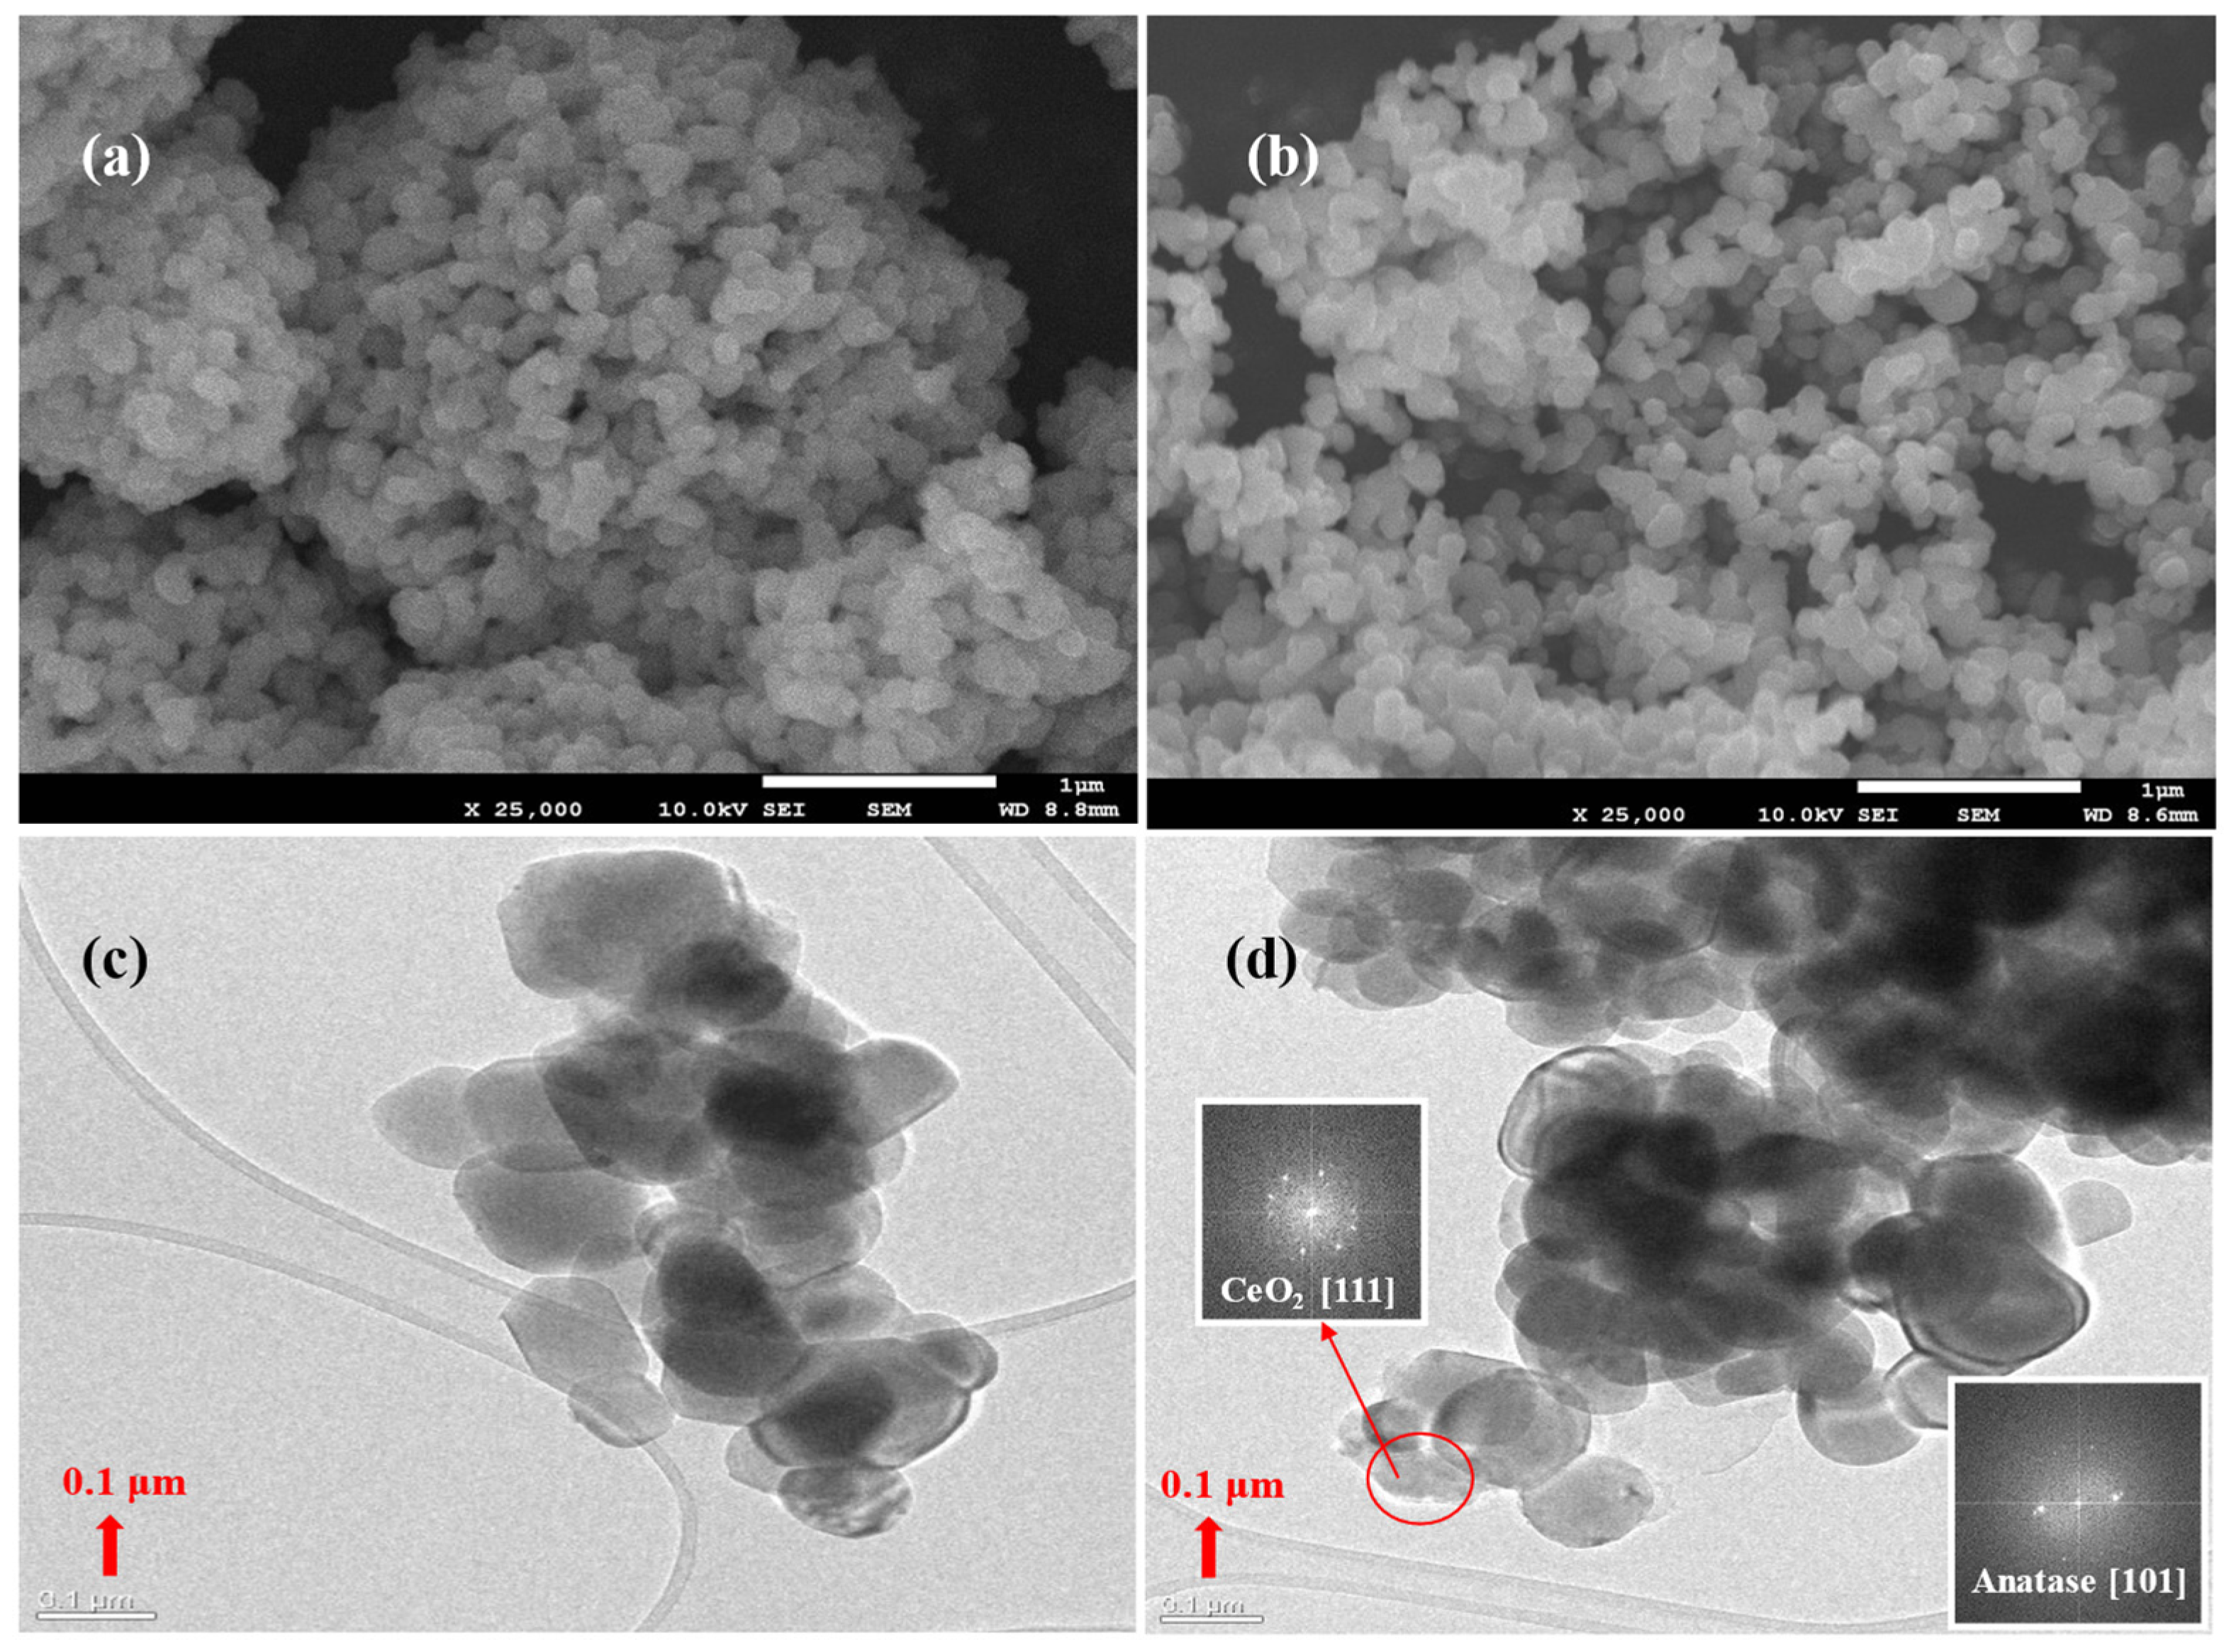
The morphology and surface nature of the prepared pure and Ce-doped materials were studied by electron microscopy. The FESEM micrograph of T and 0.5CeT samples shown in
Figure 2a,b illustrates the powders spherical morphology. On close observation, it can be perceived that particle agglomeration is decreased on Ce doping (
Figure 2b) compared to pure T (
Figure 2a). Further, the 0.5CeT SEM-EDX spectra (
Figure S1, Supplementary Information) has revealed the presence of elements, Ce dopant in addition to main Ti and O. The FETEM images are shown in
Figure 2c,d as well as in the
Supplementary Information (Figure S2) portraying the well-grown crystals, which were accumulated closely with each other. The selected area electron diffraction (SAED) patterns (
Figure 2d (insert)), which further specifies the crystalline nature of the photocatalyst microsphere in accordance with XRD observations, provide important evidence that, upon Ce doping, the anatase phase is confirmed to be the only TiO
2 polymorph observed. Further, on close investigation, it was found that some Ce dopants have migrated to the grain boundaries (as shown by enclosed red circle,
Figure 2d (insert)). Upon SAED analysis, this may be the CeO
2 planes.
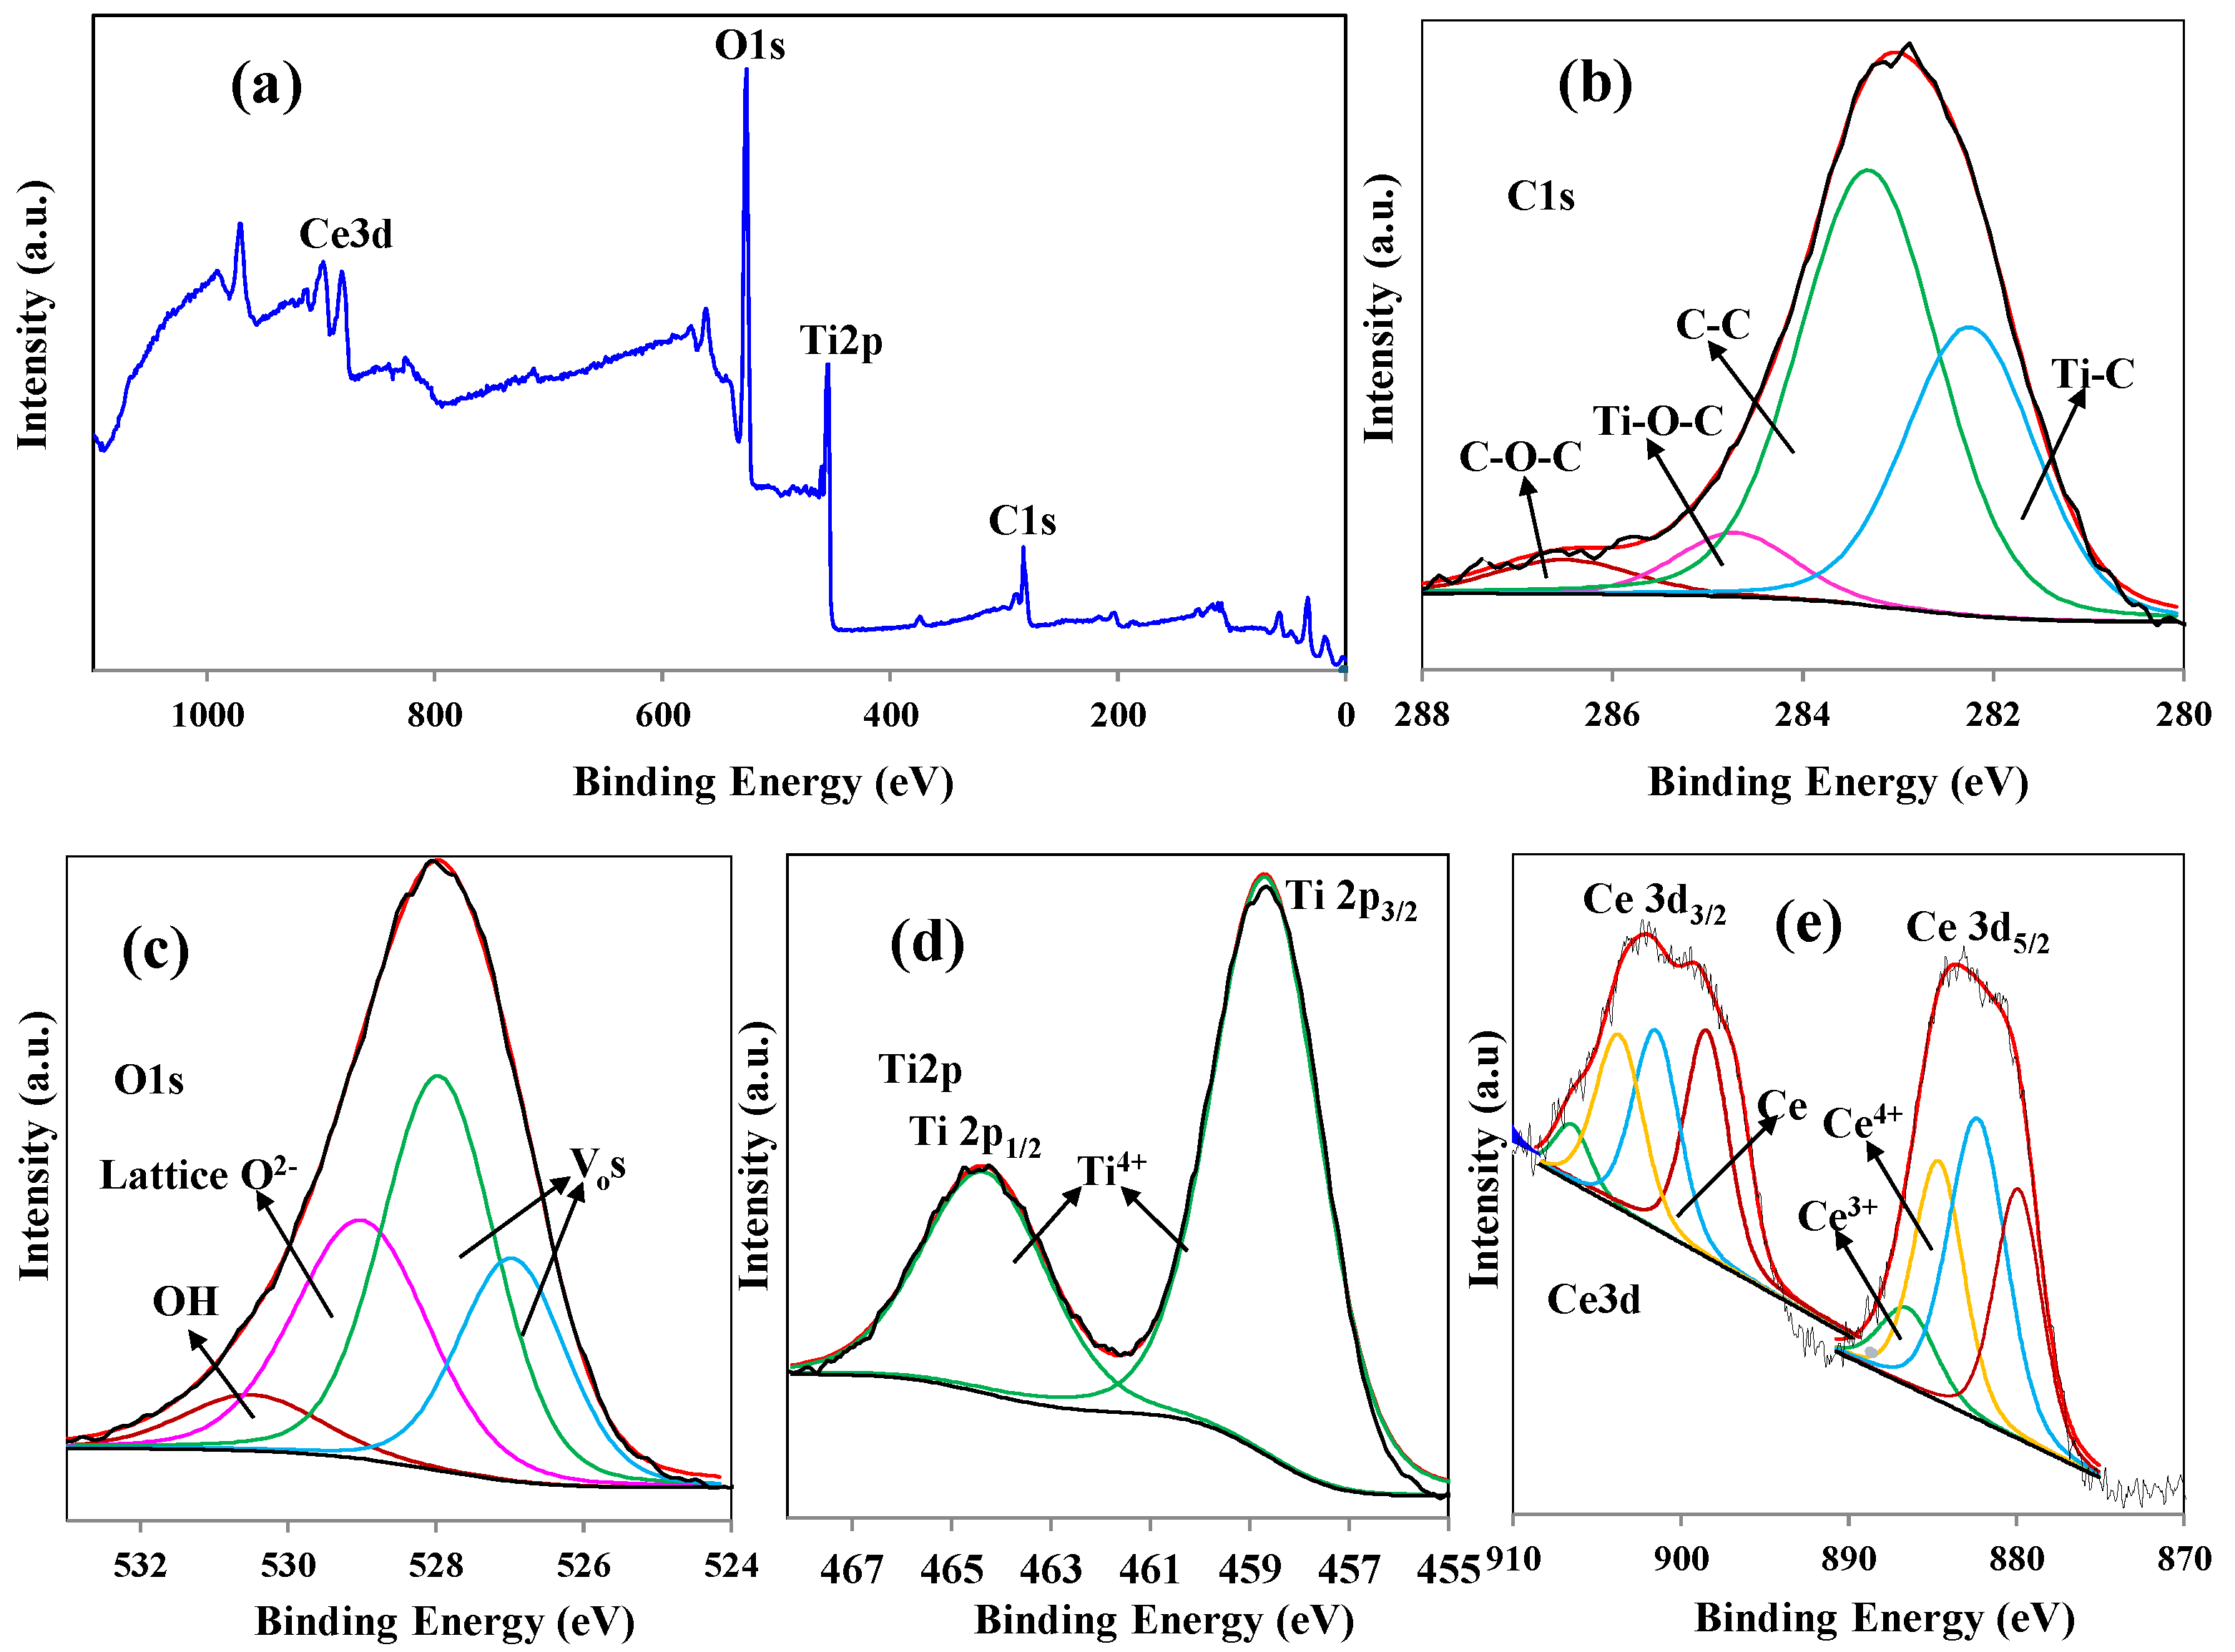
The XPS investigation of 0.5CeT is explained in
Figure 3, which confirms the elemental composition of the as-synthesized photocatalyst.
Figure 3a portrays the survey spectra, which reveals the presence of Ti, O, C, and Ce, and O in the sample with at. % of 33, 54, 2, and 11.0, respectively. We further analyzed the representative material by high resolution deconvolution of O1s, Ti 2p, Ce 3d, and the reference C1s. In the core level XPS spectrum of C1s, the dominant peak at 283.9 eV corresponds to the adventitious carbon from the XPS instrument, and the three other peaks observed at 286.5 eV attributed to C-O-C bond, 284.8 eV to Ti-O-C bond and 282.2 eV may be assigned to the chemical bonding between C and Ti [
31]. In the O1s high-resolution XPS scan spectrum, the signal is deconvoluted into four peaks (
Figure 3c), corresponding to the adsorbed -OH or H
2O at binding energy of 530.7 eV while peak at binding energy of 529 eV is ascribed to the lattice oxygen (O
2−) [
32]. The other two peaks at 527.8 and 527.0 eV confirms the oxygen vacancies (V
os) [
33]. The core level Ti 2p spectrum (
Figure 3d) shape and position (2p
3/2 and 2p
1/2: 458.2 and 464.3 eV, respectively) confirm good agreement with the values registered for TiO
2 in the National Institute of Standards and Technology (NIST) Standard Database for XPS and signifies that the element Ti mainly existed in the oxidation state of Ti
4+ [
34]. Moreover, these peaks are higher than pure TiO
2; this may be due to Ce having lower electronegativity than Ti, which gives higher electron binding energy. The high-resolution spectrum of the Ce 3D peak (
Figure 3e) can be credited to the spin-orbit split doublets states of 3d
3/2 and 3d
5/2. The deconvoluted four peaks at 906.7, 886.9 eV and 883.7, 904.0 eV corresponds to Ce
3+ and Ce
4+ oxidation states, respectively [
35]. The peaks at 901.2 and 882.1 eV indicate the existence of Ce, while the peaks at 890.0 and 879.4 eV are due to the transition of one or two e
−s from the filled orbit of O 2p to the empty Ce 4f orbital [
36].
The recombination of photoinduced charge carriers (e
−/h
+) is the source of photoluminescence (PL) spectra, whose intensity indicates the rate of recombination. By recording the PL spectra as demonstrated in
Figure S3 (Supplementary Information), we were able to explain how Ce affected the photo produced e
−/h
+ separation efficiency. The decreased PL intensity of the representative 0.5CeT compared to control T translated into a lowered recombination of photoinduced charge carriers under illumination and likely into an increased photocatalytic performance. Increasing the Ce dopant content beyond the optimum level (0.5 wt. ratio) causes the PL intensity to increase, implying that excess Ce atoms act as recombination centers as a consequence of lowering the separation efficiency. Further in sighting the steady-state PL spectra of the examined samples with excitation wavelength at 320 nm revealed a PL peak at about 380 nm, which is produced from the recombination of photogenerated e
−/h
+ pairs, equating to an energy of 3.26 eV, which was in good agreement with the anatase TiO
2 bandgap energy. Meanwhile, the broad emission peak in the visible range at 440 nm was attributed to self-trapped excitons localized in TiO6 octahedra, transitions, and indirect band edges. Conduction band electrons confined on the Ti 3D orbital combine with holes in the O 2p orbital of TiO
2 to produce the self-trapped exciton [
37].
3. Photocatalytic Activity Tests
To examine the potential of pure and Ce-doped TiO
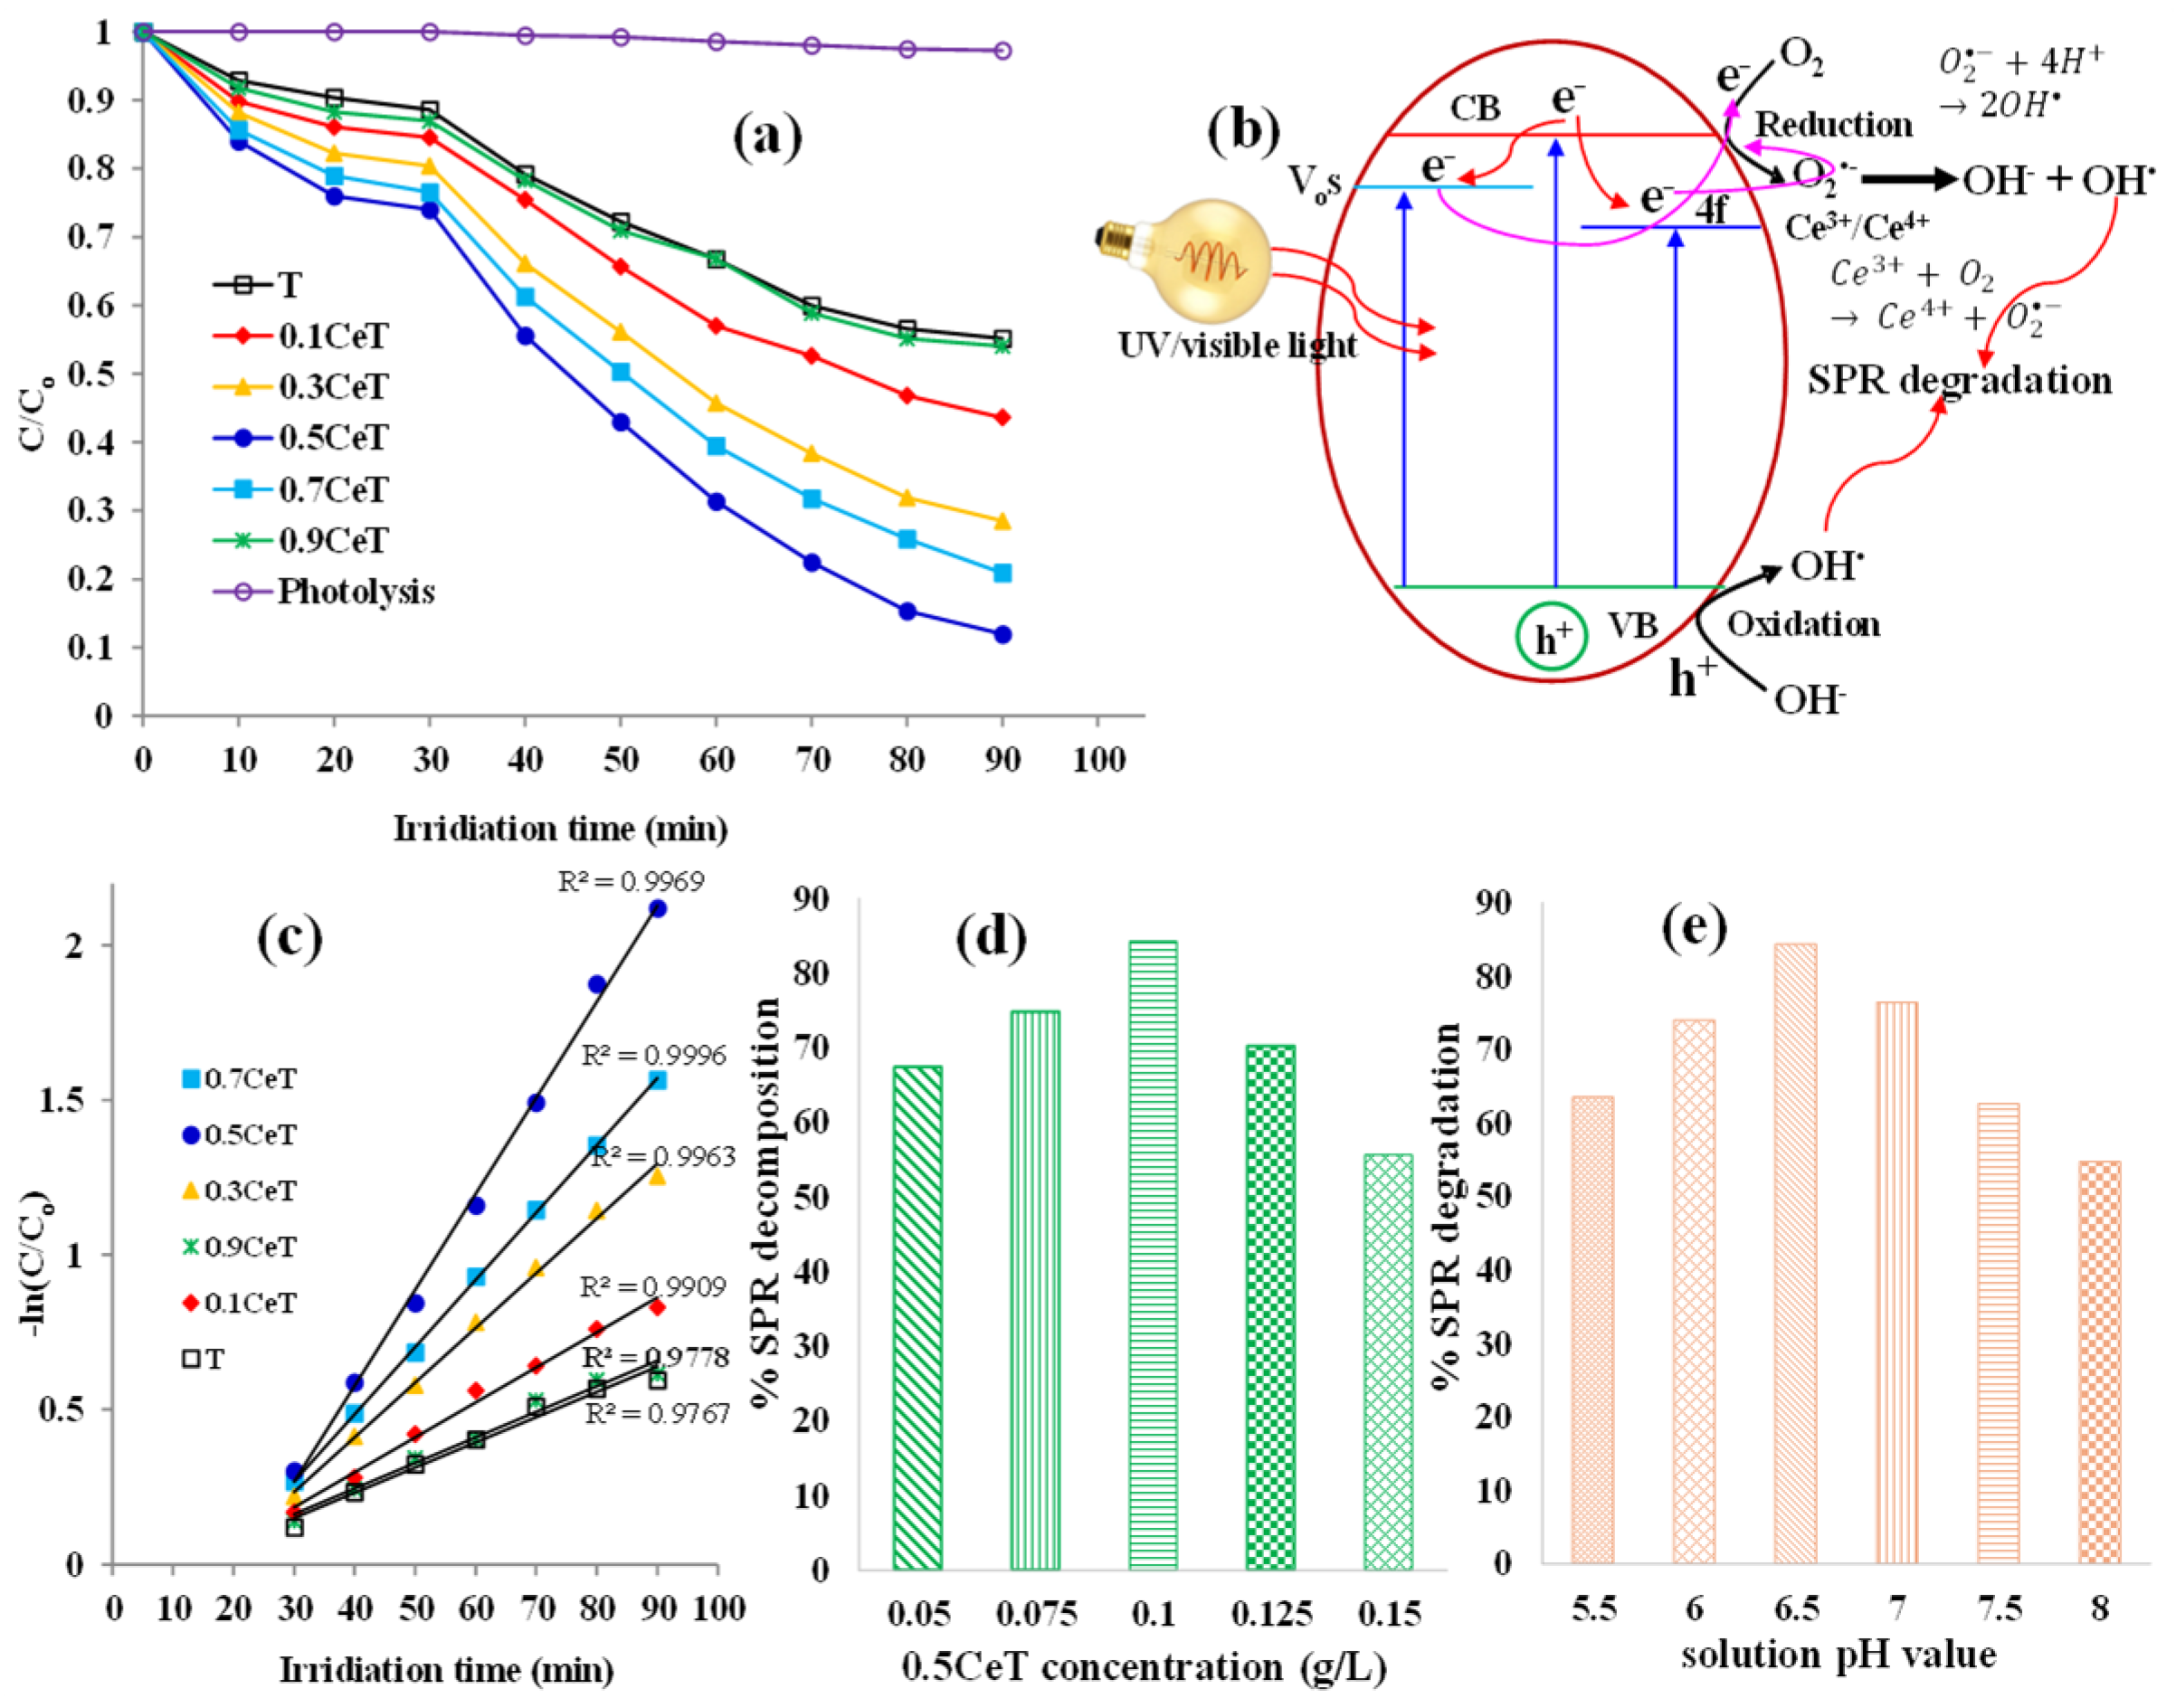
2 nanoparticles as effective photocatalysts for the degradation of organic pollutants in water, photocatalytic elimination of pharmaceutical antibiotics spiramycin (SPR), as a model organic pollutant, was tested under UV and visible light, respectively. The decrease in concentrations of SPR was monitored by its respective UV–vis absorption spectra having maximum at 232 nm. SPR is chemically stable; no significant change in its concentration was measured under UV irradiation (photolysis) in the absence of photocatalyst. Before each activity experiment, the reaction mixture was stirred thoroughly through magnetic stirring in dark for 30 min to attain the adsorption–desorption equilibrium. Afterwards, the mixture was irradiated with light and the samples taken at specific intervals of 10 min out of the full 60 min duration and were analyzed on UV–vis spectrophotometer. In the UV experiments (
Figure 4a), the observed photocatalytic activity trend was 0.5CeT > 0.7CeT > 0.3CeT > 0.1CeT ≈ T meaning the highly active photocatalyst was 0.5CeT and for this reason, just its visible activity is recorded as shown in
Figure S4 (Supplementary Information). It should be noted that pure T possesses a high bandgap energy value of 3.2 eV, thus not suitable for visible photocatalytic studies implying it mainly absorbs UV region photons. Witnessing the physicochemical properties, the difference in the activity results of the prepared powders can be credited to the crystallite size via specific surface area and pore size, dopant concentration via decrease in bandgap energy and increase in photons absorption, defect structures (oxygen vacancies and presence of dopant in different oxidation states) and decrease in e
−/h
+ pairs recombination.
Figure 4b shows a schematic diagram of the UV–visible light photocatalytic process over xCeT material. The dopant Ce ion induces an unoccupied 4f state just below the conduction band (CB) of TiO
2, allowing excited e-s to diffuse from the TiO
2 valance band (VB) to the Ce 4f level when exposed to light irradiation. Consequently, excited electrons can temporarily reside in the Ce impurity band before taking part in the redox catalytic process. Numerous research sources have reported these findings [
38,
39]. In support of our XPS analysis, it is well known that oxygen vacancies are formed when Ce ions are incorporated into the TiO
2 lattice, thus creating energy levels located below the TiO
2 CB. This phenomenon retards the e
−/h
+ recombination and promotes photodecomposition activity, as illustrated by the reactions. TEM studies show the possibility of ceria oxide (CeO
2) presence, which also plays a beneficial role in the material activity performance by producing a significant amount of reactive oxygen radicals such as O
2•− (super oxide anions) and hydroxyl species (OH
•, OH
−, HO
2) on the surface of the doped photocatalyst powder. Also, CeO
2 can act as a powerful oxidant to oxidize water or hydroxyl ions and produce active species such as OH
•, which helps reduce electron–hole recombination. In addition, VB h
+s can readily be captured by O
2•− for charge recurrence (
) and produces hydroxyl radicals (OH
•) (
, which can efficiently break down organic pollutants (
since they have a higher oxidation power [
40]. Moreover, we measured the zeta potential of pure T (−13.7 mV), which is less negative than 0.5CeT (−17.9 mV) as is presented in the
Supplementary Information (Figure S5). This inhibits agglomeration of 0.5CeT and facilitates surface integration with spiramycine thus improving the photocatalytic activity. Therefore, in the net shell, the photocatalytic decomposition efficiency of xCeT powders can be improved in multiple ways, as follows: one, as reducing agents for O
2 adsorbed species by converting to Ce
4+, two, as trapping sites for photoinduced e
−s, thereby converting back to Ce
3+ oxidation state, and thirdly, decreasing agglomeration of nanoparticles in solution. Hence, nanoparticles xCeT are efficient nanocrystalline materials for the UV–visible light-assisted elimination of aqueous organic pollutants.
Figure 4c illustrates the kinetic plots of SPR degradation following the pseudo first-order kinetics on fitting the obtained experimental data [
39].
where C
SPR is the concentration of spiramycin and k
app is the apparent reaction rate constant with respect to SPR. Assuming C
SPR = 0, when t = 0, integrating Equation (1) gives
where C
o is the initial concentration of SPR when t = 0, C is SPR concentration at any time (t) during the reaction. The k
app values were obtained from the slopes of the linear graphs plotted for −ln(C
o/C) against time, and the observed trend was 0.5CeT (0.032) > 0.3CeT (0.22) > 0.7CeT (0.18) > 0.1CeT (0.012) > 0.9CeT (0.008) ≈ T (0.008). The high correlation coefficient (R
2) values as depicted in
Figure 4c indicates a good match to a first-order reaction. The corresponding apparent reaction rate constant values for xCeT were significantly higher than pure T for lower values of x (dopant concentration), indicating high photodegradation performance of doped samples. This further means that xCeT shows potential as a practical and valuable choice for use in photocatalytic applications that aim to break down organic contaminants. The findings of this study suggest that xCeT nanoparticles could play a vital role in the advancement of effective and workable means for addressing environmental pollution.
Photocatalytic reactions depend on the continuous production of e
−/h
+ pairs, which leads to radical chain reactions that oxidize the organic containments. The dosage of photocatalyst is a major consideration as the decomposition is strongly dependent on it. The amount of the hybrid material varied between 0.05 to 0.15 g/L to study the decomposition of 0.1 g/L of SPR solution under UV irradiation at a natural pH of 6.5. The results are shown in
Figure 4d. As discussed earlier, decomposition of SPR in the absence of a photocatalyst showed no significant change in the concentration. However, upon introducing a photocatalyst, the decomposition rate revealed a significant increase, reaching 67.4%, 74.8%, 88.0% at a catalyst dose of 0.05, 0.075, and 0.1 g/L 0.5CeT, respectively, this portrays that a large surface area is available for adsorption of the pollutant followed by its degradation on the enhanced number of active sites. Any further increase in photocatalyst content above the optimum level (0.1 g/L) resulted in a gradual decline in the pollutant percentage degradation, because of an increase in solution opacity. Consequently, the influence of light penetration in the reactor solution and/or light shielding phenomenon is caused due to the aggregation of excess photocatalyst particles. The effective light utilization is reduced, which limits the photon numbers available for redox reactions, also a higher probability of photogenerated e
−/h
+ pairs recombination, thus leading to a decrease in decomposition percentage.
The reactor solution pH influences the photocatalyst surface charge, which affects the crucial step of adsorption of pollutant molecules onto the material surface. Thus, the pH effect on the photocatalytic decomposition of SPR was studied at pH 5.5, 6, 6.5, 7, 7.5, and 8 at an optimal catalyst dose of 0.1 g/L, as shown in
Figure 4e. The pH of 0.1 g/L SPR solution was measured to be 6.6. The observed trend was 63.5%, 74.0%, 88.3%, 76.4%, 62.6%, and 54.7%, respectively. Under alkaline conditions, the decomposition percentage was found to decrease, suggesting that neutral and mild alkaline conditions are conducive to the SPR degradation. This can be elucidated based on the photocatalyst surface charge as it can be protonated and deprotonated in acidic and alkaline solutions, respectively, according to the following equations.
SPR has pH of 8, and the amino and OH
− groups of the molecule can be protonated and deprotonated, respectively, depending on the solution pH value. A PZC (point zero charge) value was found to be 5.5 for 0.5CeT; this means the photocatalyst surface is positively charged in solution pH lower than 5.5 while a pH greater than 5.5 the photocatalyst surface will be negatively charged. SPR is positively charged below pH 8.0 while catalyst is negatively charged above pH > 5.5. The optimal conditions for photocatalysis are therefore at
, at which the positively charged SPR molecules and negatively charged xCeT should readily attract each other. Such electrostatic attraction will enhance the amount of SPR adsorbed on catalyst surface and therefore accelerate the photocatalytic reaction. Moreover, at higher pH (>6.5), the decrease in the degradation rate could be attributed to the electrostatic repulsion between negatively charged photocatalyst surface and the negatively charged ionized molecules formed by deprotonation. Finally, at high solution pH values, the hydroxyl radicals may be scavenged and do not have the chance to react with contaminant molecules. The current results are supported by the reports mentioned elsewhere [
41,
42]. Therefore, we selected pH 6.5 as the optimum pH value for photocatalytic experimentation.
To understand the SPR photocatalytic decomposition mechanism over 0.5CeT material by radical scavengers, the role of key active species including hydroxyl radicals (OH
•), superoxide anions (O
2•−), and holes (h
+s) in the degradation process were carefully examined. Herein, specific scavengers were used to recognize the active species function in the photodegradation process. Isopropyl alcohol (IPA, 0.25 mM) was used to scavenge the hydroxyl radicals. Benzoquinone (BQ, 0.5 mM) and ammonium oxalate (AO, 0.1 g/L) were employed to quench O
2•− and h
+s, respectively. The scavengers were properly agitated with the pollutant prior to the addition of the photocatalyst. Upon UV irradiation, as shown in
Figure S6 (Supplementary Information), the decrease in percentage decomposition of SPR was 88.0%, 28.0%, 67.0%, and 43.0% without and with IPA, BQ, and AO as sacrificial agents, respectively. From these results, it was concluded that primarily OH
• radicals followed by holes were responsible for the photocatalytic decomposition of SPR pollutant molecules.
6. Materials and Methods
6.1. Chemicals
Titanium oxysulfate (TiOSO4, ≥ 29% Ti (as TiO2) basis, grade technical), cerium nitrate hexahydrate (Ce(NO3)3·6H2O, 99.999%), were supplied by Sigma Aldrich, Saudi Arabia. Both nitric acid (HNO3) and ammonium hydroxide (NH4OH) in concentration of 10% v/v aqueous solution (Ricca chemicals), respectively, anhydrous barium chloride (BaCl2) and spiramycin (percent purity ≥ 90%, water solubility 0.196 mg/mL) were purchased from Fisher Scientific and deionized (DI) water was used as a dispersing medium. All the chemicals were employed as received without any purification.
6.2. Photocatalyst Synthesis
Undoped TiO
2 was synthesized by the modified sol–gel process stated elsewhere [
48]. Briefly, ammonium hydroxide was gradually added to a 0.3 M solution of titanium oxysulfate (TiOSO
4) while stirring continuously, until the pH reached the desired value of 7.0. The resulting titanium hydroxide precipitates were separated from the mother liquor by centrifugation and thoroughly washed with warm DI water to remove sulfate ions (if any unreacted), as confirmed by a BaCl
2test. The precipitates were then dispersed in DI water and peptized by adding nitric acid until the pH dropped to 5.0. During the sol to gel transition, the stable sol was allowed to age at room temperature for a specified time of 12 h. After aging, the gel was dried by spray drying operation using a Yamato GB-22 spray dryer, which produces hot air at 130 °C within a glass chamber (dimensions: diameter: 132 mm, height: 577 mm) to produce the final material powders. The slurry was atomized using two stainless steel fluid nozzles, with diameters of 1.270 mm for the gas and 0.406 mm for the slurry. The slurry was fed into the dryer glass chamber via a peristaltic pump running at a rate of 3.0 mL/min, with a gas flowrate of 0.3 m
3/min. After spray drying, the collected powders were calcined at 600 °C in a programmable muffle furnace for 2 h, with a heating rate of 3 °C/min, to obtain crystalline pure TiO
2 [
49].
The same procedure was used as mentioned earlier to prepare Ce-doped TiO2 with the modification of introducing the Ce precursor in water after dispersing the titanium hydroxide precipitates in warm DI water, which means before the peptization step. The Ce to TiO2 weight ratios were set at 0%, 0.1%, 0.3%, 0.5%, 0.7%, and 0.9% and the resulting products were labeled as T and xCeT, where x represents the Ce weight ratio.
6.3. Material Characterization
X-ray diffraction (XRD) was performed using a Phillips PW 1710 with high-intensity Cu Kα monochromatic radiation (λ = 0.15418 nm) to analyze the crystalline phases and to calculate the crystallite size. Fourier transform infrared (FTIR) spectra were recorded using the DTGS detector of a Bruker Tensor 27 spectrometer with the OPUS data collection program (version 1.1) in the frequency range of 5000–400 cm−1, with a resolution of 1 cm−1. Microscopy images and energy dispersive X-ray (EDX) analysis were conducted using a SEM-JEOL JSM-7600F microscope (JEOL, Tokyo, Japan) to study the morphology and elemental composition of the material. High resolution microscopy images were obtained on a Philips Technai G2 20 TEM (Philips/FEI, Hillsboro, OR, USA) operated at 200 kV. Textural properties of the materials were examined using a Quantachrome Autosorb-1 instrument by measuring nitrogen adsorption and desorption isotherms at 77 K. Brunauer–Emmett–Teller (BET) method (P/P0: 0.05–0.30, C constant: 50–200) was used for surface area measurements, and the Barrett–Joyner–Halenda (BJH) method was used to calculate the pore diameter from the desorption branch (P/P0: 0.15–0.995). Praying Mantis™ diffuse reflection (DRIFTS) accessory mounted on a UV/Vis Evolution 300 spectrophotometer was used to record the diffuse reflectance spectra (DRS) in the range of 190–600 nm. Tauc plots were then used to determine the bandgap of the prepared materials using the Kubelka–Munk function procedure. Elemental composition and oxidation state analysis were performed by X-ray photoelectron spectroscopy (XPS) using a Al Kα (1486.6 eV) X-rays equipped Thermo Scientific K-alpha instrument (Waltham, MA, USA). A survey spectrum was first recorded to identify the elements in the material, followed by a high-resolution scan of the identified elements at a pass energy of 20 eV and 0.05 eV steps. Data were processed using Thermo Scientific’s Advantage software (version 3.1), and finally FluroMax-2 spectrofluorometer (Horiba, Irvine, CA, USA) is employed to record the photoluminescence (PL) spectra in the range 340–620 nm with a 320 nm excitation source of Xe lamp at room temperature.
6.4. Photocatalytic Experiments
The UV photocatalytic tests were conducted in a self-designed cylindrical acrylic batch photoreactor (volume 2 L), height (215 mm), diameter (108 mm)) at room temperature. Prior to each experiment, a weighted amount of the model spiramycin pollutant (0.1 g/L) and prepared TiO2powder (0.1 g/L) were suspended in separate 25 mL flasks containing DI water and sonicated for 15 min to reduce particle agglomeration and ensure a more stable solution and suspension. Both the spiramycin (SPR) solution and TiO2suspension were then added to the reactor, and the final volume was adjusted to 160 mL with additional DI water. Throughout the experiment, the reactor solution was continuously bubbled with filtered external air. Before irradiation, the reactor mixture was magnetically stirred for 30 min to ensure uniform distribution of the SPR and TiO2and to establish adsorption/desorption equilibrium. Irradiation was performed for 60 min using a UV light source (Atlantic Ultraviolet Corp, Hauppauge, New York, NY, USA, GPH212T5L/4–10W) emitting strongly at 254 nm, positioned vertically in the center of the reactor and housed in a quartz sleeve. At regular 10 min intervals, 5 mL aliquots of the irradiated suspension were withdrawn, filtered through Millipore syringe filters (0.22 μm porosity) to remove photocatalyst particles, and analyzed for SPR concentration by measuring the maximum absorbance at 232 nm on a UV–vis spectrophotometer using the calibration curve.
For visible light experiments, a self-designed rectangular acrylic batch reactor (capacity 1 L) was placed below two LED lamps (350 mA, 9–48 V DC, 16.8 W) with an emission range of 400–700 nm. The reactor suspension was maintained at 10 cm from the light source. Moreover, the experimental conditions and sampling procedure were the same as stated before for the UV tests.
In addition, in this setup, no significant temperature change occurred due to the illumination from the LED lamp. The photolysis experiments showed negligible degradation of the pollutant, with less than 2% degradation over the 60 min period.


