Article

Evaluation of Vacuum Residue Decomposition Kinetics with a Catalyst by Thermogravimetric Analysis

1
Chemical Faculty, Karaganda University Named After Academician E.A. Buketov, Karaganda 100028, Kazakhstan
2
Karaganda Medical University, Karaganda 100000, Kazakhstan
3
College of Chemistry and Chemical Engineering, Xinjiang University, Urumqi 830046, China
*
Authors to whom correspondence should be addressed.
Catalysts 2025, 15(5), 493; https://doi.org/10.3390/catal15050493
Submission received: 1 April 2025 / Revised: 4 May 2025 / Accepted: 14 May 2025 / Published: 20 May 2025

Abstract

:
The study of thermal developments of heavy oil feedstock, vacuum residue in particular, is a relevant factor for the development of technologies for the processing and production of petroleum products. This paper investigates the process of thermal decomposition of the vacuum residue in the manufacturing of catalyst and polymer material using thermal analysis methods, including thermogravimetric analysis (TGA) in isothermal and dynamic modes. Particular attention is paid to the measurement of kinetic parameters of thermolysis using model and non-model methods, which allows us to assess the output power and other kinetic characteristics of decomposition. The results obtained can be used for the development of new oil refining technologies for significantly increasing the efficiency and safety of processes. During the course of this study, experimental and theoretical activation energy values were obtained for the vacuum residue without a catalyst (experimentally: 91.54 kJ mol−1/theoretically: 91.35 kJ mol−1) and a sample with the presence of a catalyst (experimentally: 89.68 kJ mol−1/theoretically: 90.87 kJ mol−1). The reduction in activation energy in the presence of the catalyst confirms its catalytic activity and potential for processing heavy hydrocarbon feedstock.

Graphical Abstract

1. Introduction

In recent years, scientific trends in the field of research of methods of processing heavy crude oil materials have been focused on the development of new technological approaches for obtaining environmentally sound fuel and petrochemical raw materials for the production of various chemicals.
At the same time, the possibilities of technological processing of heavy crude oil materials, vacuum residue in particular, remain largely unexplored. According to the data [1,2,3,4,5], high values of nickel, vanadium, and asphaltic in the vacuum residue composition do not allow its use in hydrocracking and catalysis.
The heavy oil feedstock contains monomeric, oligomeric, naphthenic, multimeric, aromatic, and heterocyclic molecules associated with various valence and intermolecular interactions. The complexity of the vacuum residue composition creates difficulties for the creation of efficient and selective processing processes. The key problems are associated with the high coking tendency of the feedstock and the presence of metals such as vanadium and nickel, which are primarily found in the form of porphyrin and non-porphyrin complexes that poison the catalyst. Vanadium, nickel, iron, and copper deposited on the catalyst’s surface reduce its selectivity, enhance dehydrogenation reactions, and contribute to increased gas and coke yields. In addition, vanadium can form a fusible eutectic on the surface of the support, leading to melting of the catalyst particles, a decrease in its surface area, a decrease in activity, and deactivation of acid centers.
Detailed information on the kinetics of catalytic decomposition of the vacuum residue under the influence of temperature is of great importance. Thermogravimetric analysis, conducted in both isothermal and dynamic modes, is widely used to study the kinetics of thermal decomposition of heavy petroleum feedstock [6,7].
Despite the widespread use of thermogravimetric analysis (TGA) and differential scanning calorimetry (DSC) methods to investigate the kinetics of thermal decomposition in heavy hydrocarbon systems, such as vacuum oil residues, there remains an urgent need to develop more advanced and efficient approaches. Previously, for example, in Baikenov et al. [8], similar thermal analysis methods were used to study the degradation of coal tar and shale mixtures, which confirmed their applicability to complex systems. However, these prior studies did not examine the effect of catalysts on thermal decomposition processes.
Traditional kinetic parameter calculations based on TGA/DSC data typically rely on model approaches that assume a simple reaction order, which often fail to accurately describe the complex, multi-stage decomposition processes in heterogeneous systems like vacuum residues. To overcome these limitations, this study employs modern methods for calculating kinetic parameters, particularly the Šesták–Berggren model, which offers a flexible representation of the nonlinear dependence of the reaction rate on the conversion degree, and the non-parametric kinetics (NPK) technique, which allows kinetics analysis without prior assumptions about the reaction mechanism. These advanced methods provide a more accurate and detailed description of the pyrolysis process.
This study is novel in that it provides the first comprehensive kinetic analysis of the thermal decomposition of a vacuum residue in the presence of a nanocatalyst based on Fe3O4 nanoparticles modified with oleylamine. The work evaluates not only the catalytic effect of the functionalized Fe3O4 nanoparticles but also employs modern approaches to kinetic modeling, enabling more accurate characterization of the catalytic decomposition processes.
Unlike previous studies that primarily utilized TGA/DSC methods without catalyst systems, the present work investigates the effect of a nanocatalyst based on oleylamine-modified Fe3O4 nanoparticles on the pyrolysis kinetics of a vacuum residue. This allows for the development of new insights into the reaction mechanisms and the optimization of processing parameters for residual petroleum products.
The analysis of literature data on the determination of kinetic parameters of the thermal decomposition of petroleum feedstock reveals model-based and model-free approaches [9,10]. In model-free methods, kinetic parameters are obtained by creating kinetic curves at different heating rates and then extracting kinetic characteristics at different conversion levels [11]. However, the development of accurate mathematical models of the kinetics of degradation of coal, polymers, and petroleum raw materials is difficult due to their complex structure and various chemical bonds [12,13,14]. Therefore, a key area of research is the creation of accurate kinetic models of the thermal decomposition of heavy hydrocarbons, as well as comprehensive databases of kinetic parameters. The aim of this study is to investigate the thermal decomposition of the vacuum residue, both with and without catalysts, using thermal analysis methods, as well as to establish the kinetic parameters of pyrolysis using both model and non-model computational methods [8].

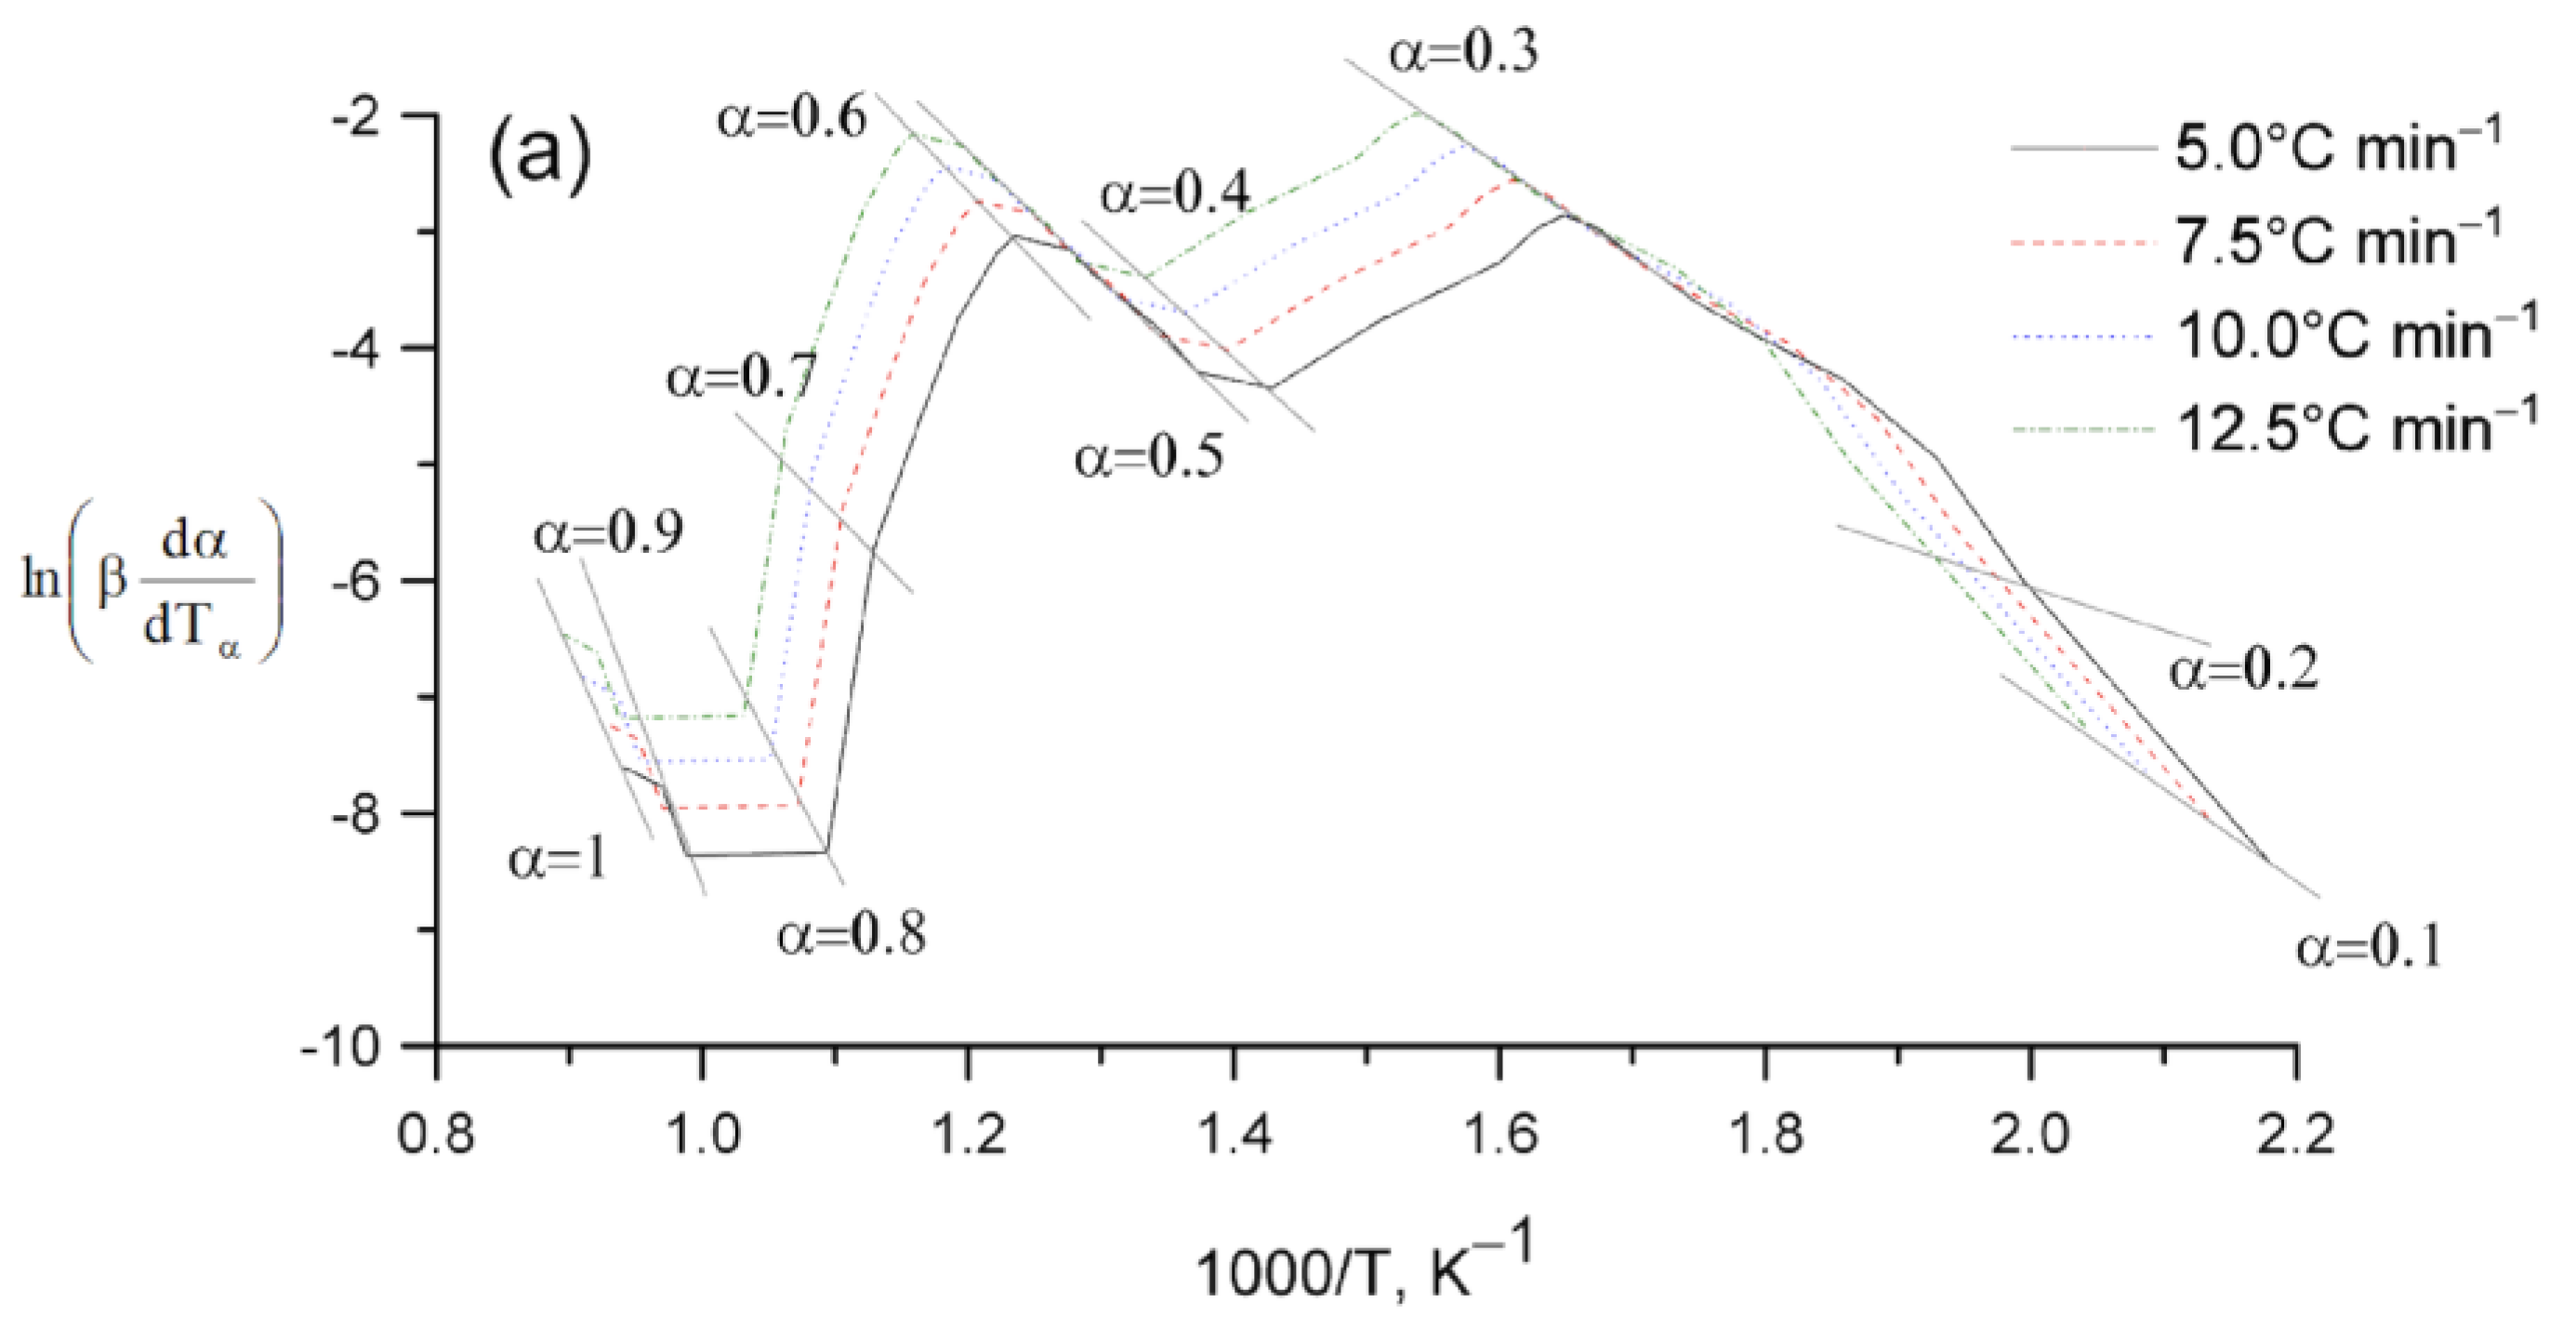
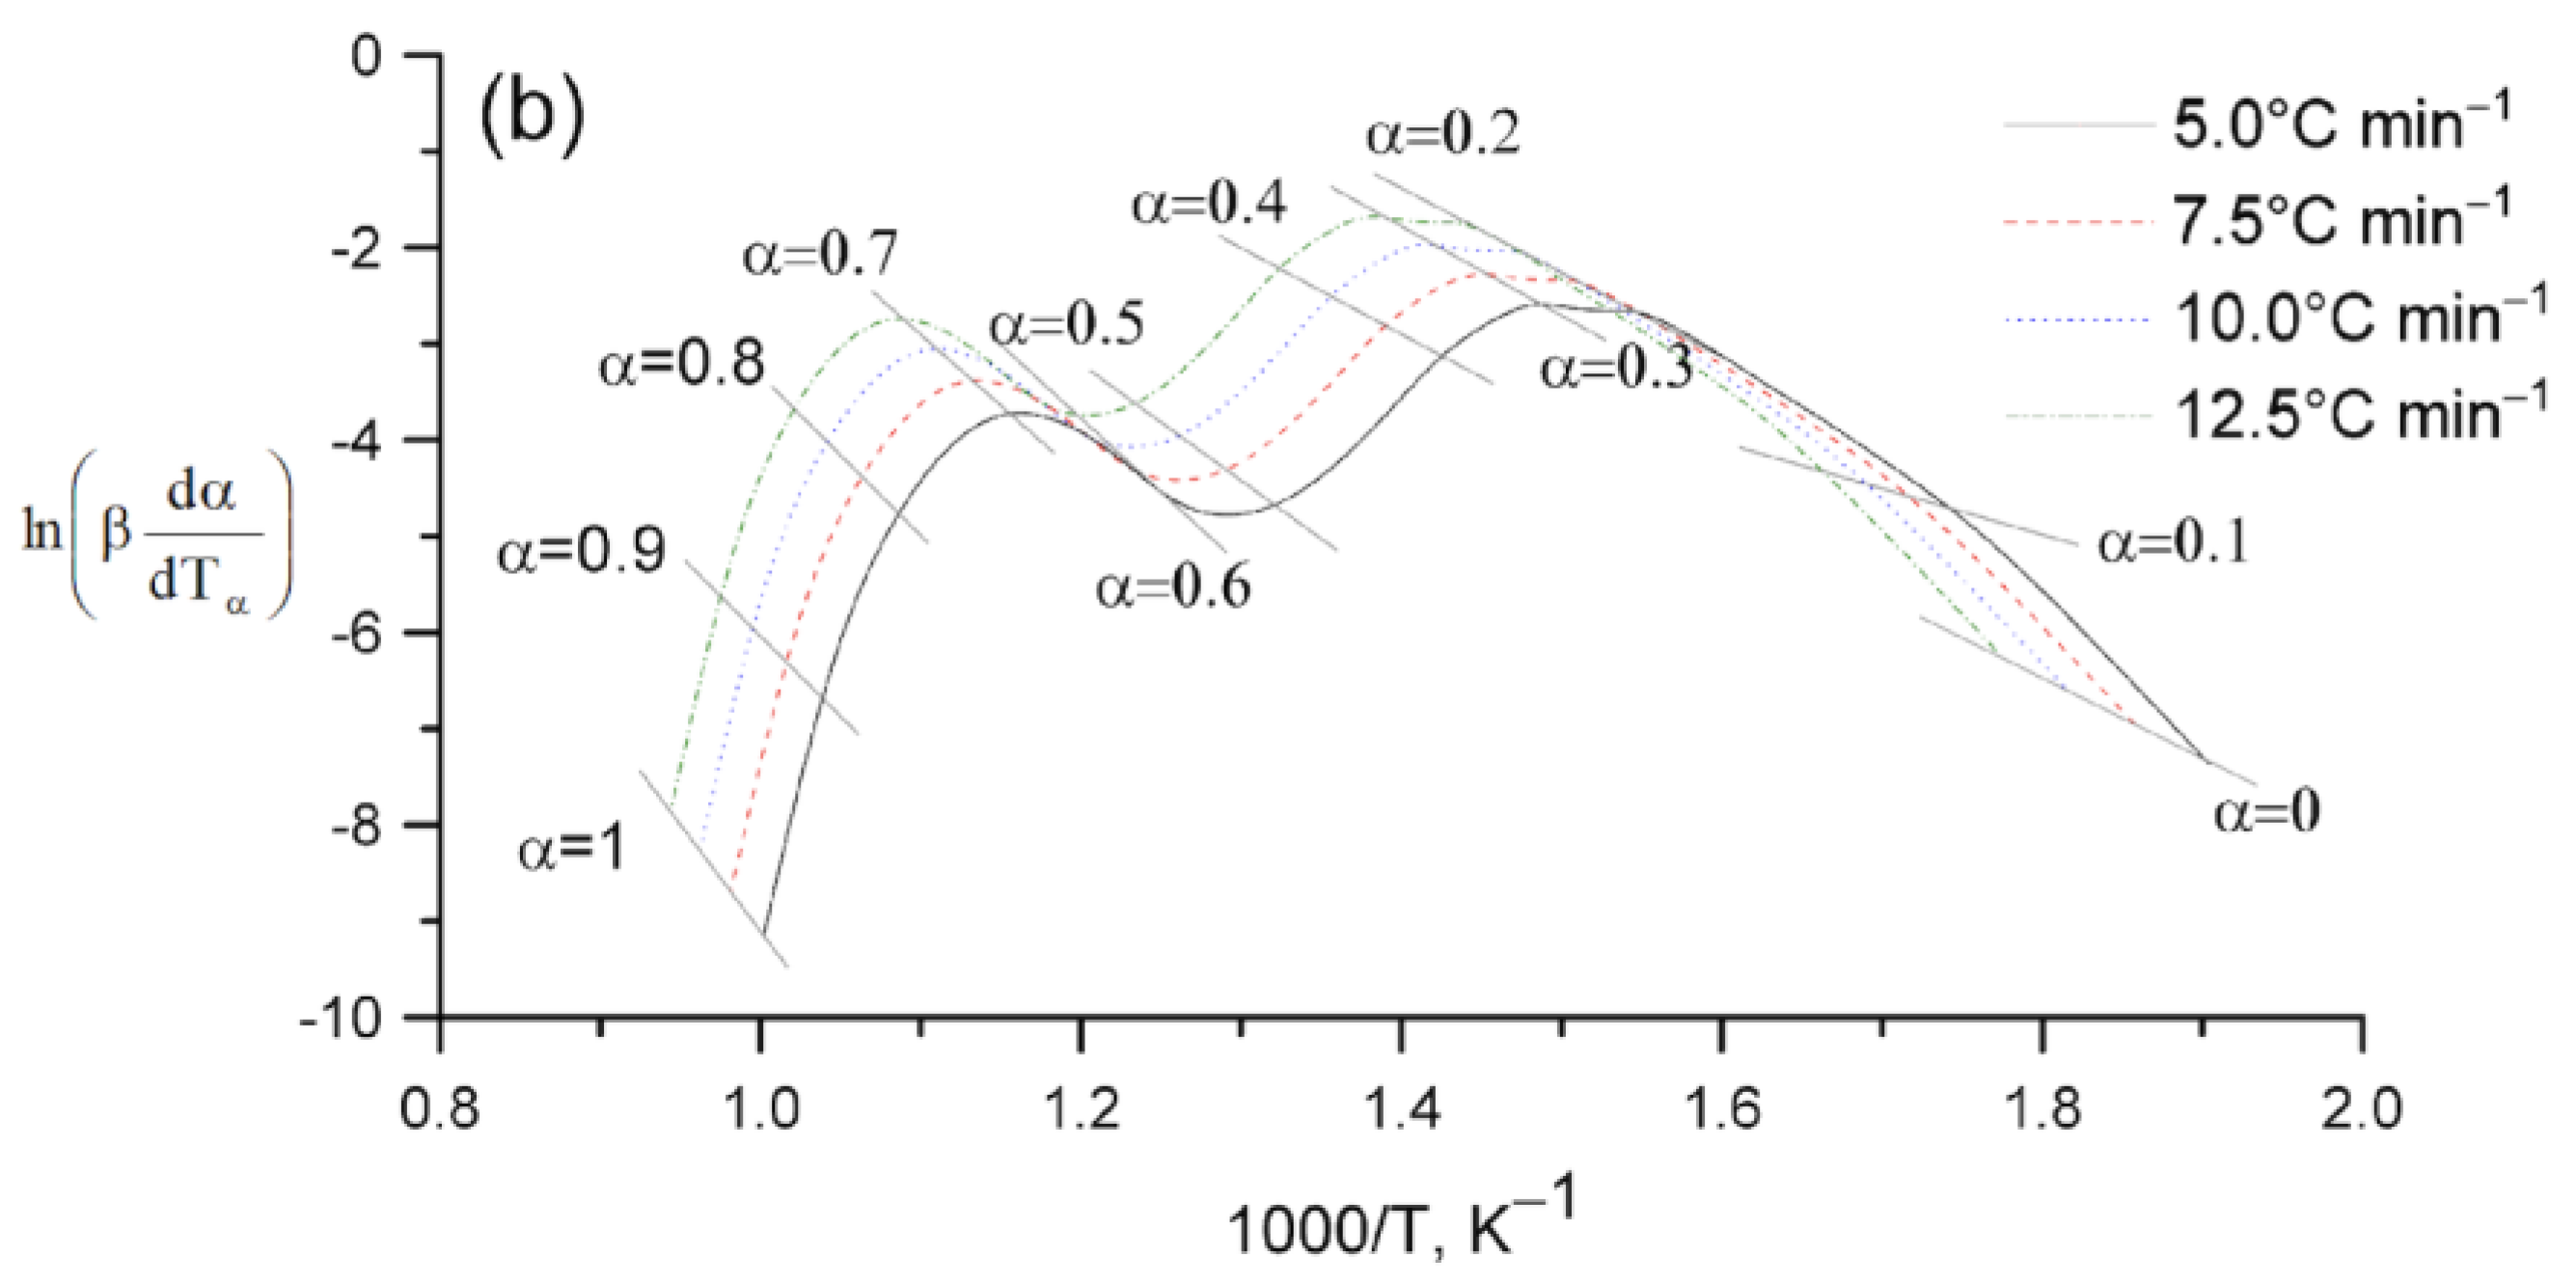
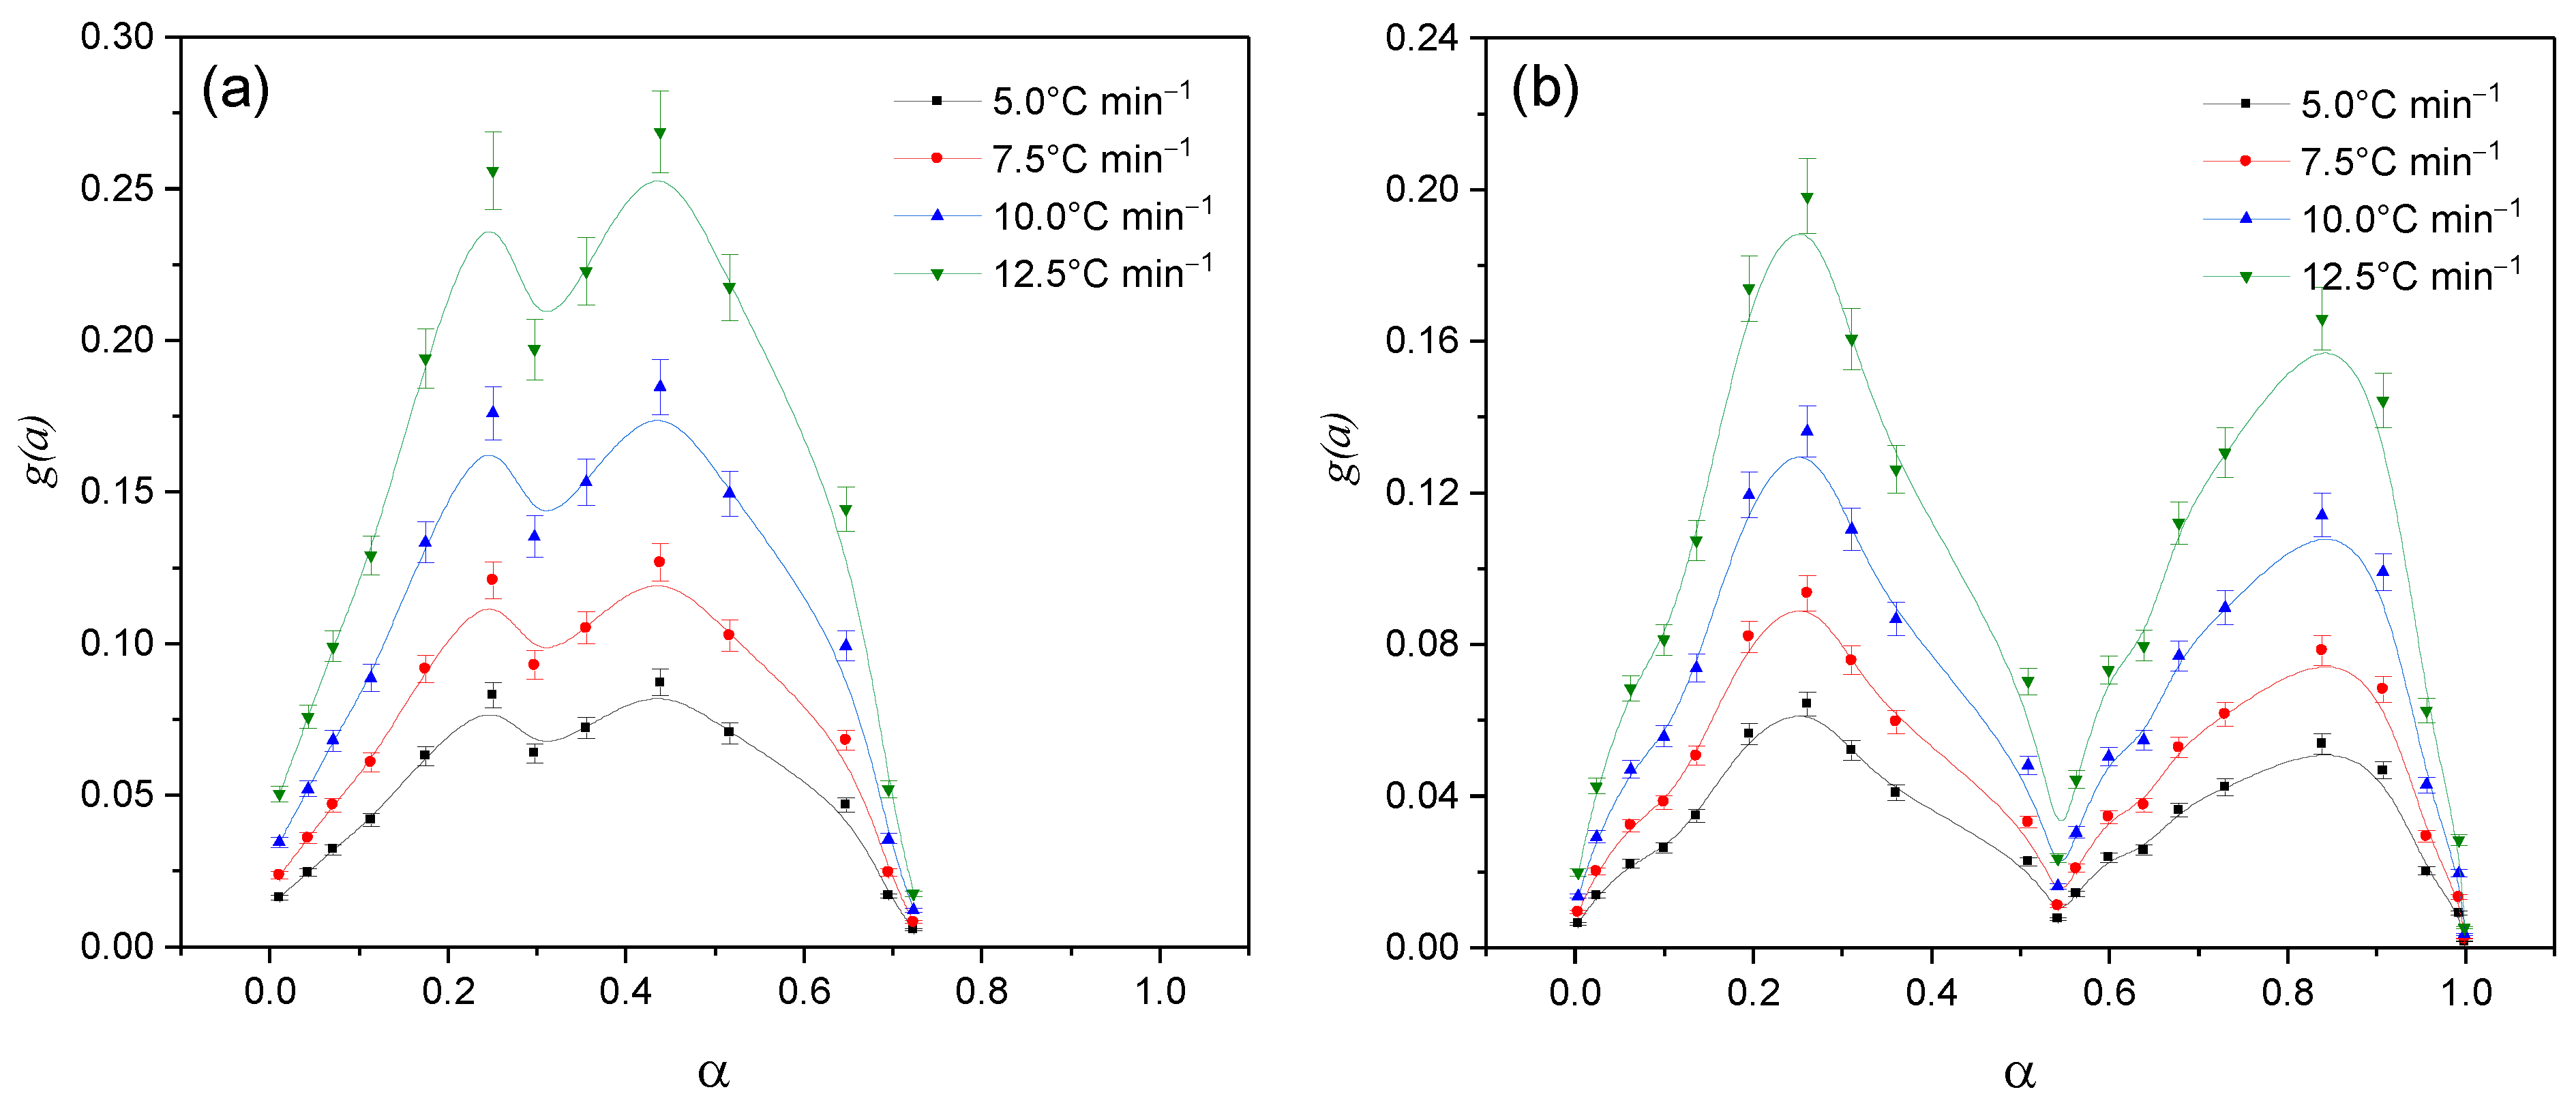
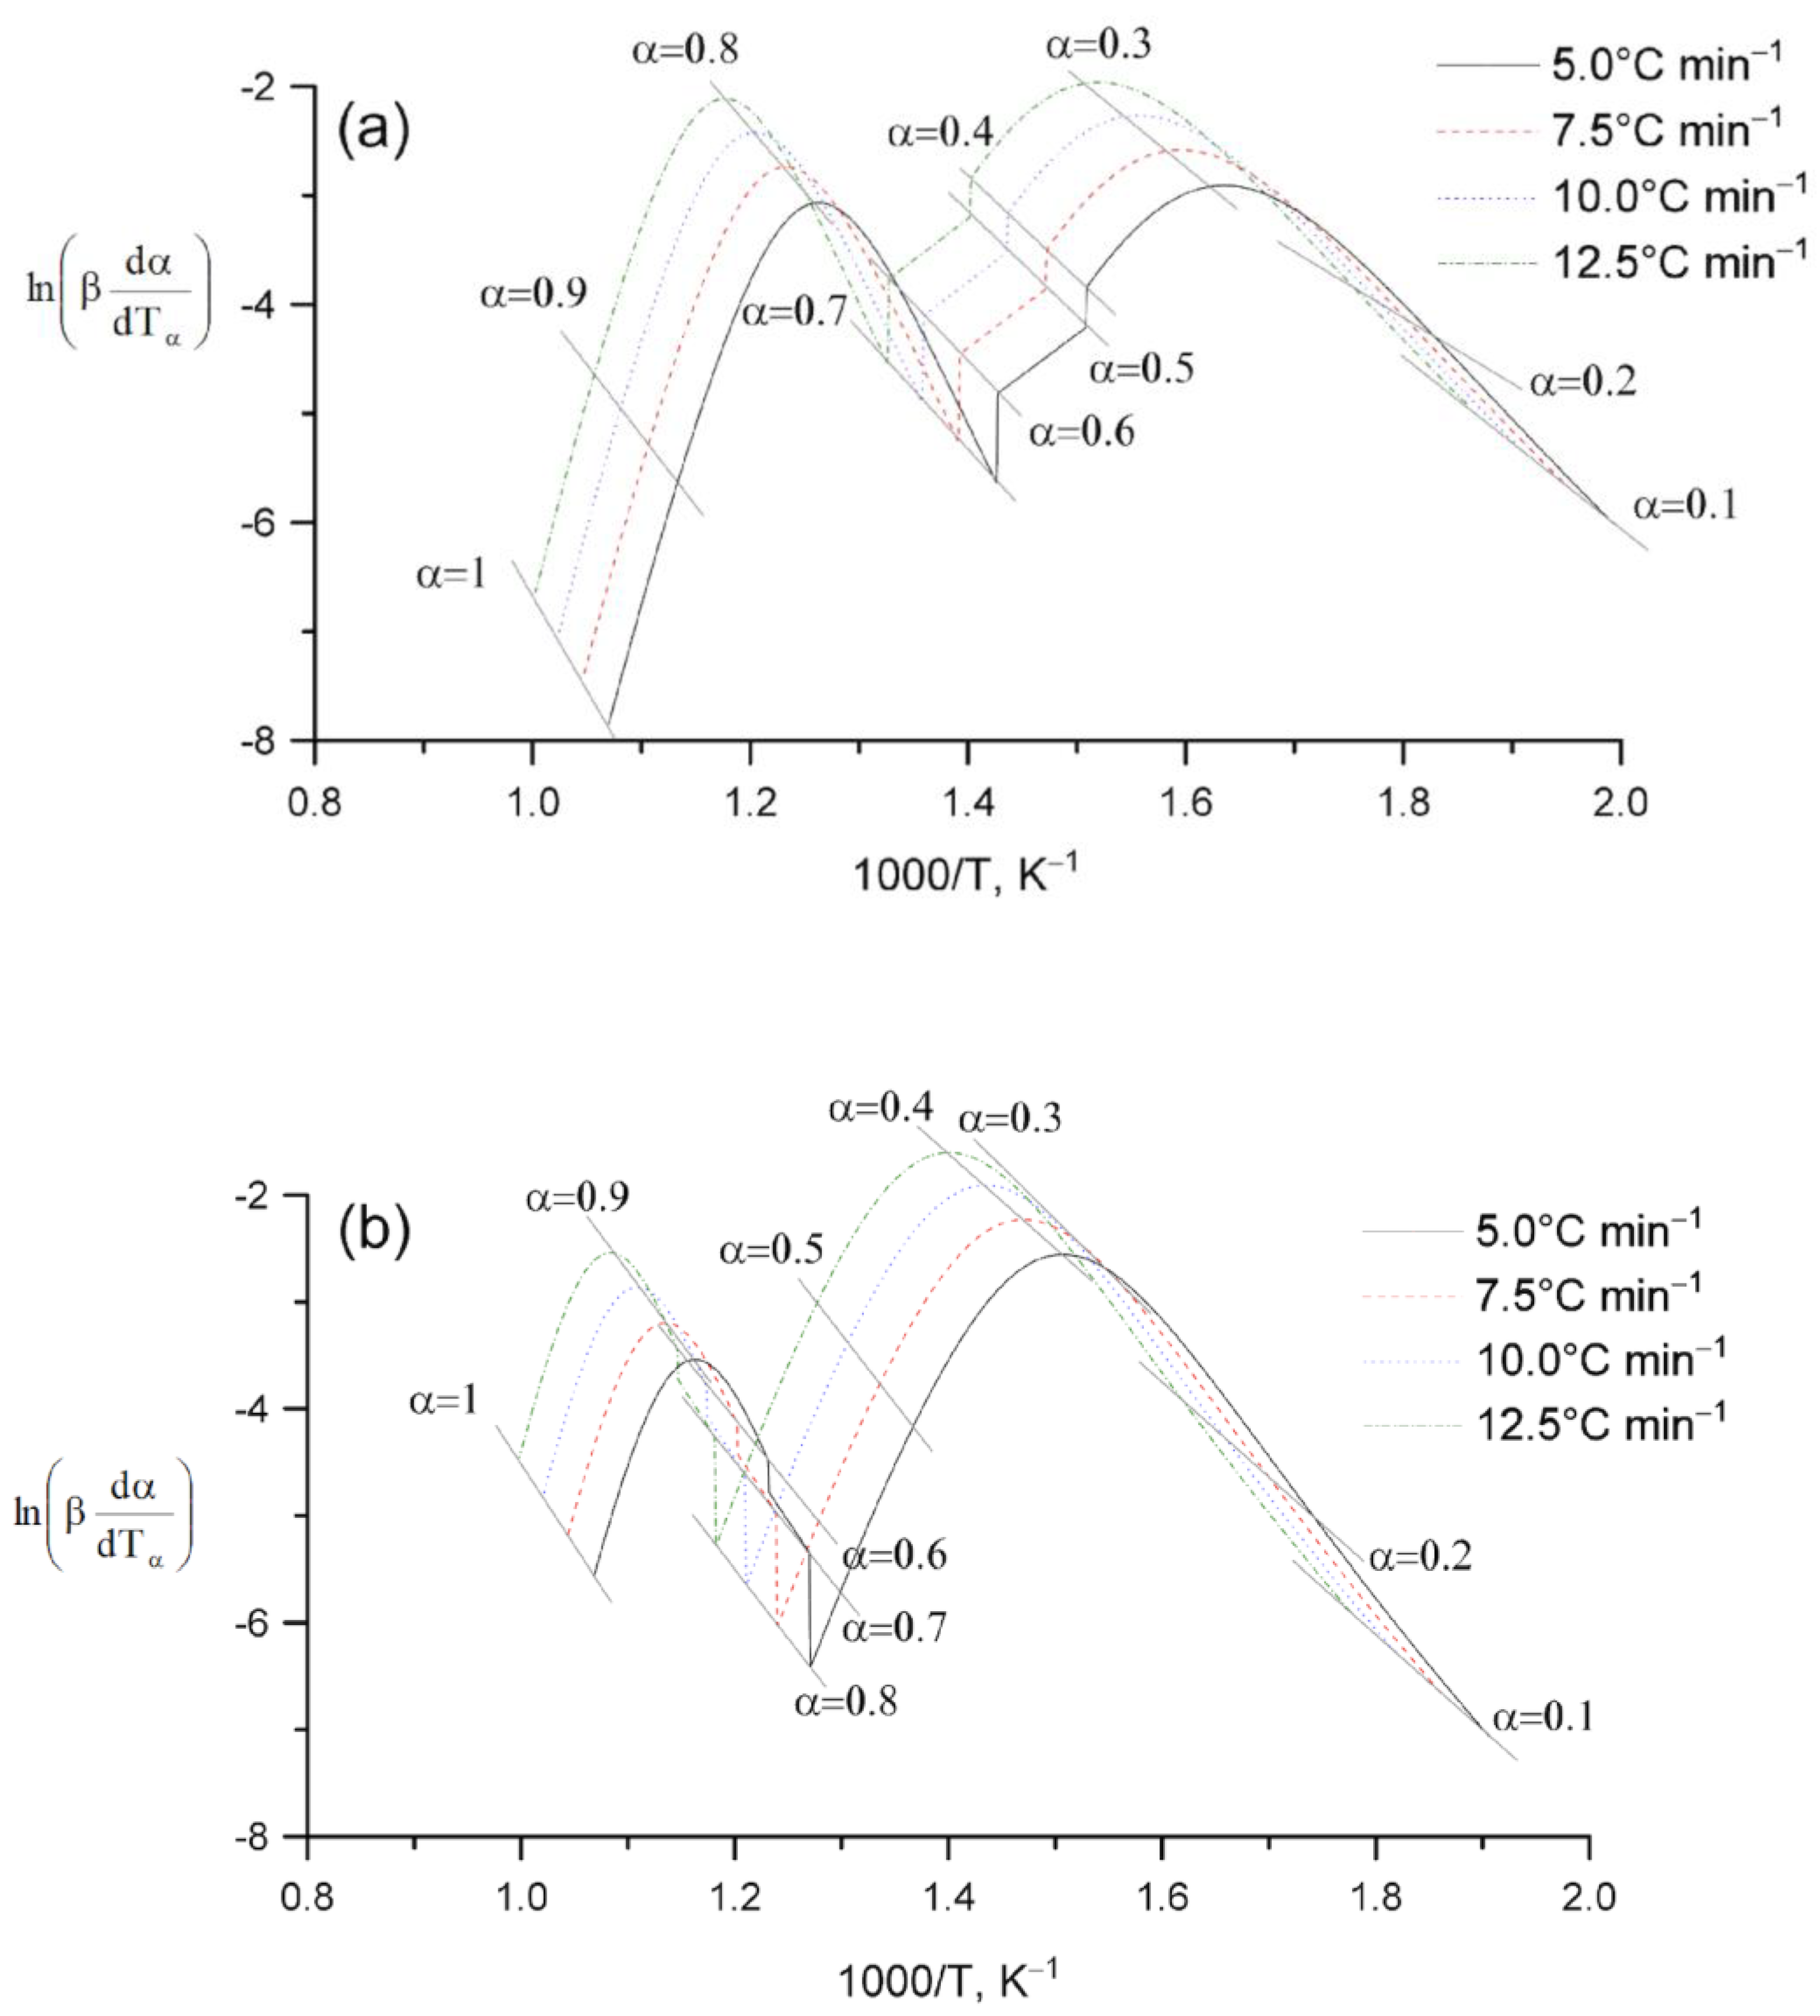
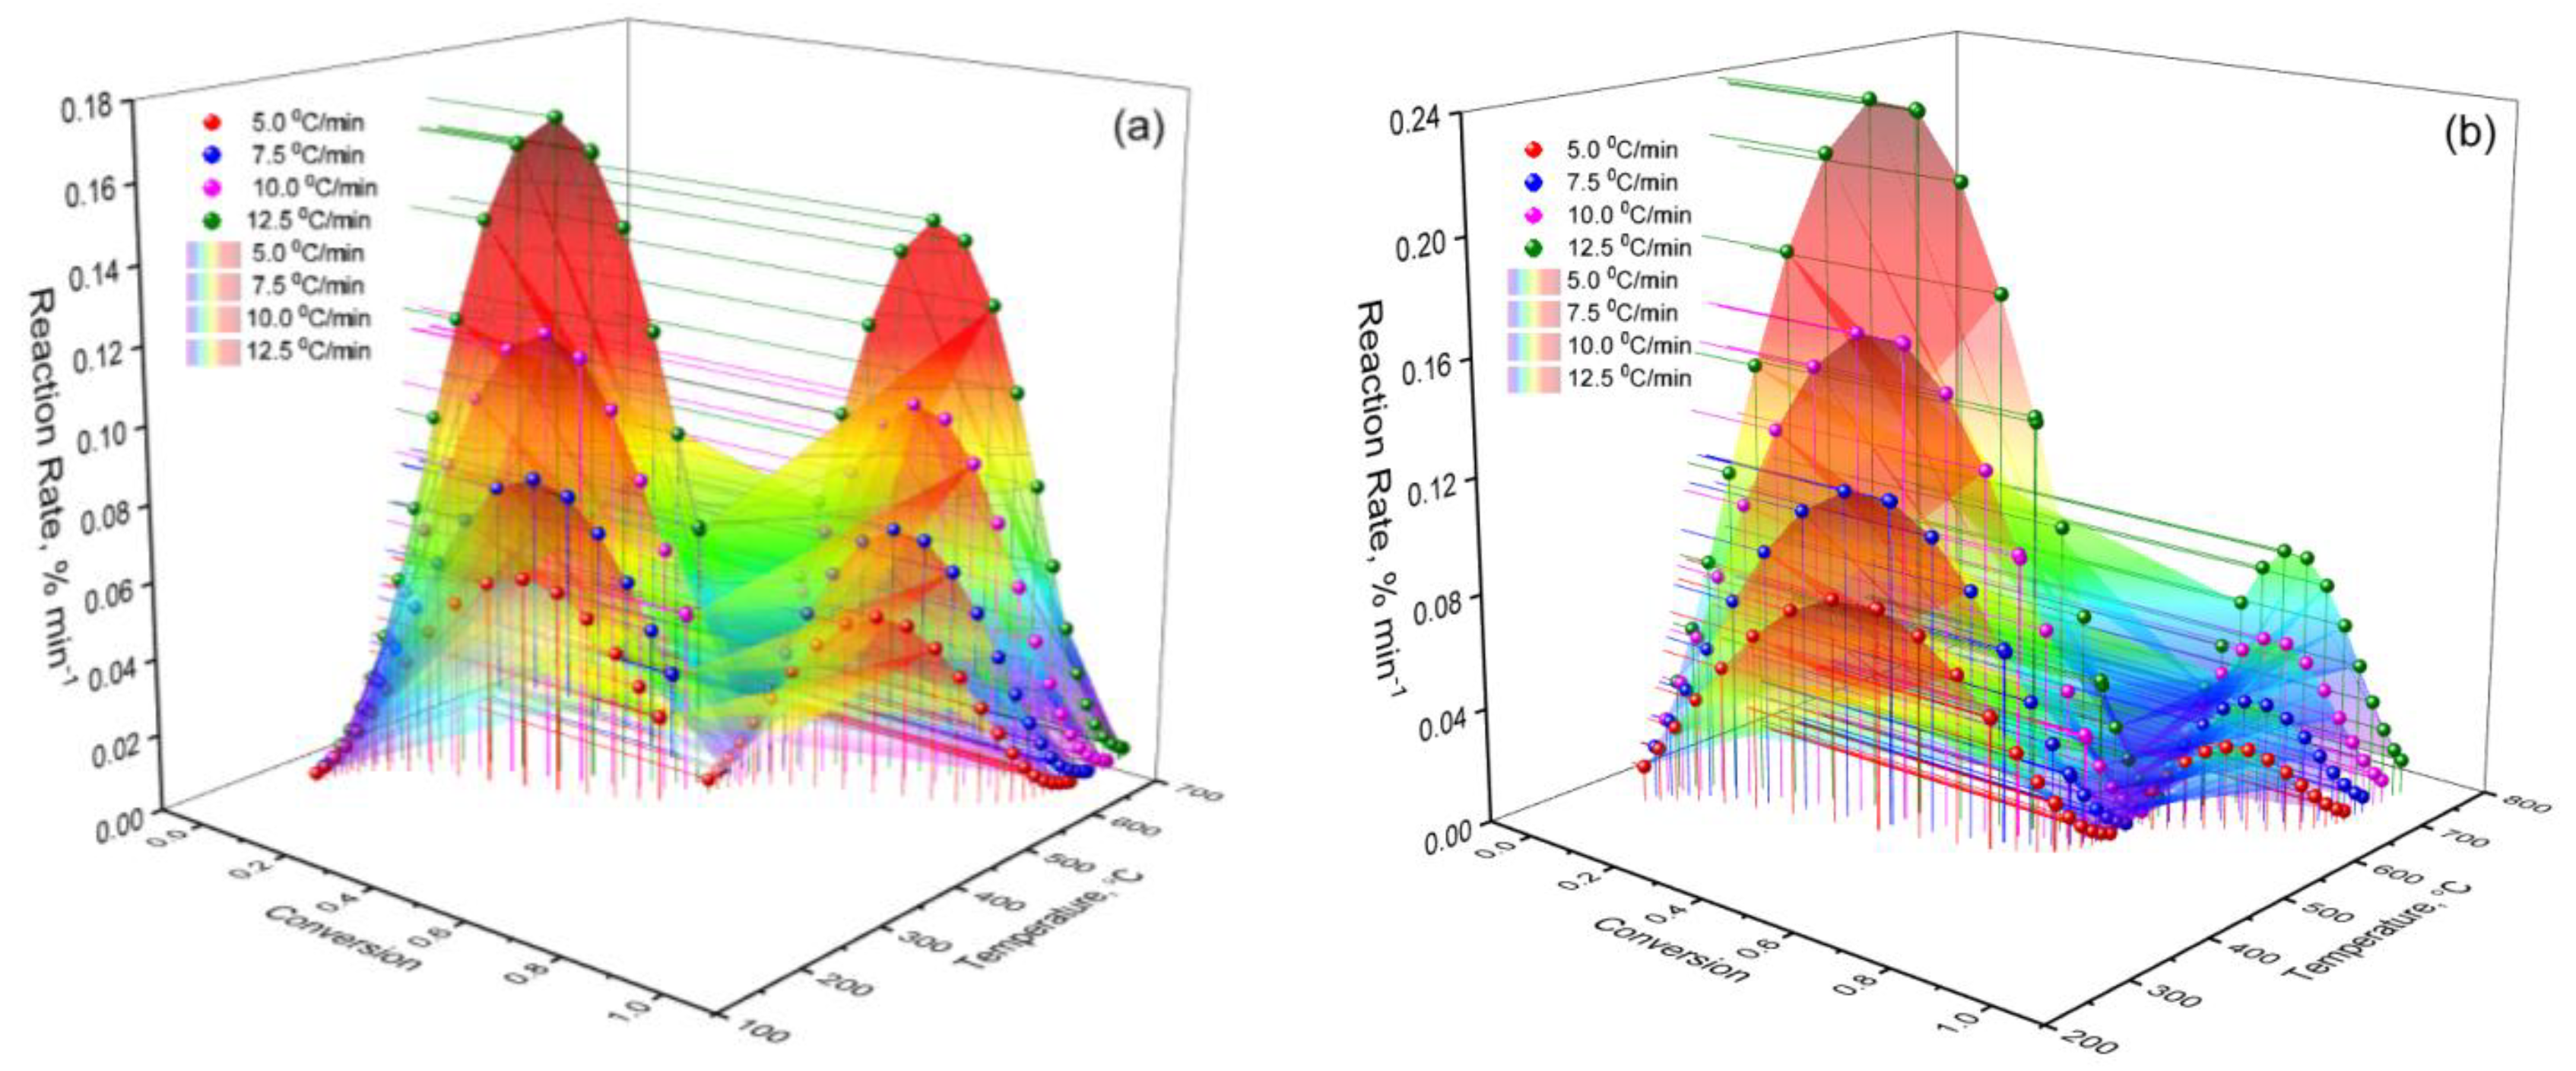
2. Results and Discussion
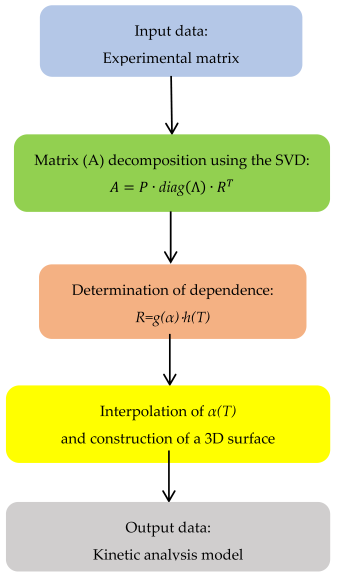
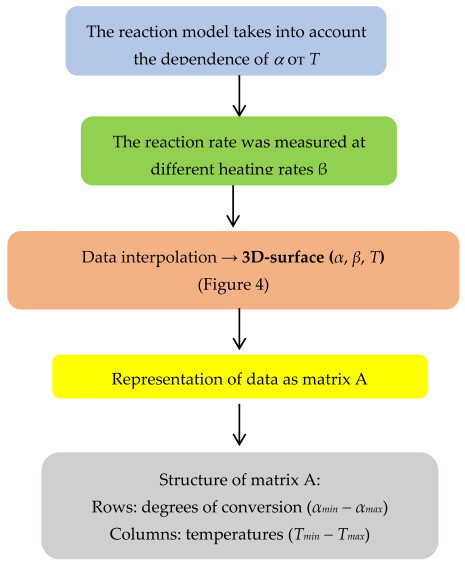
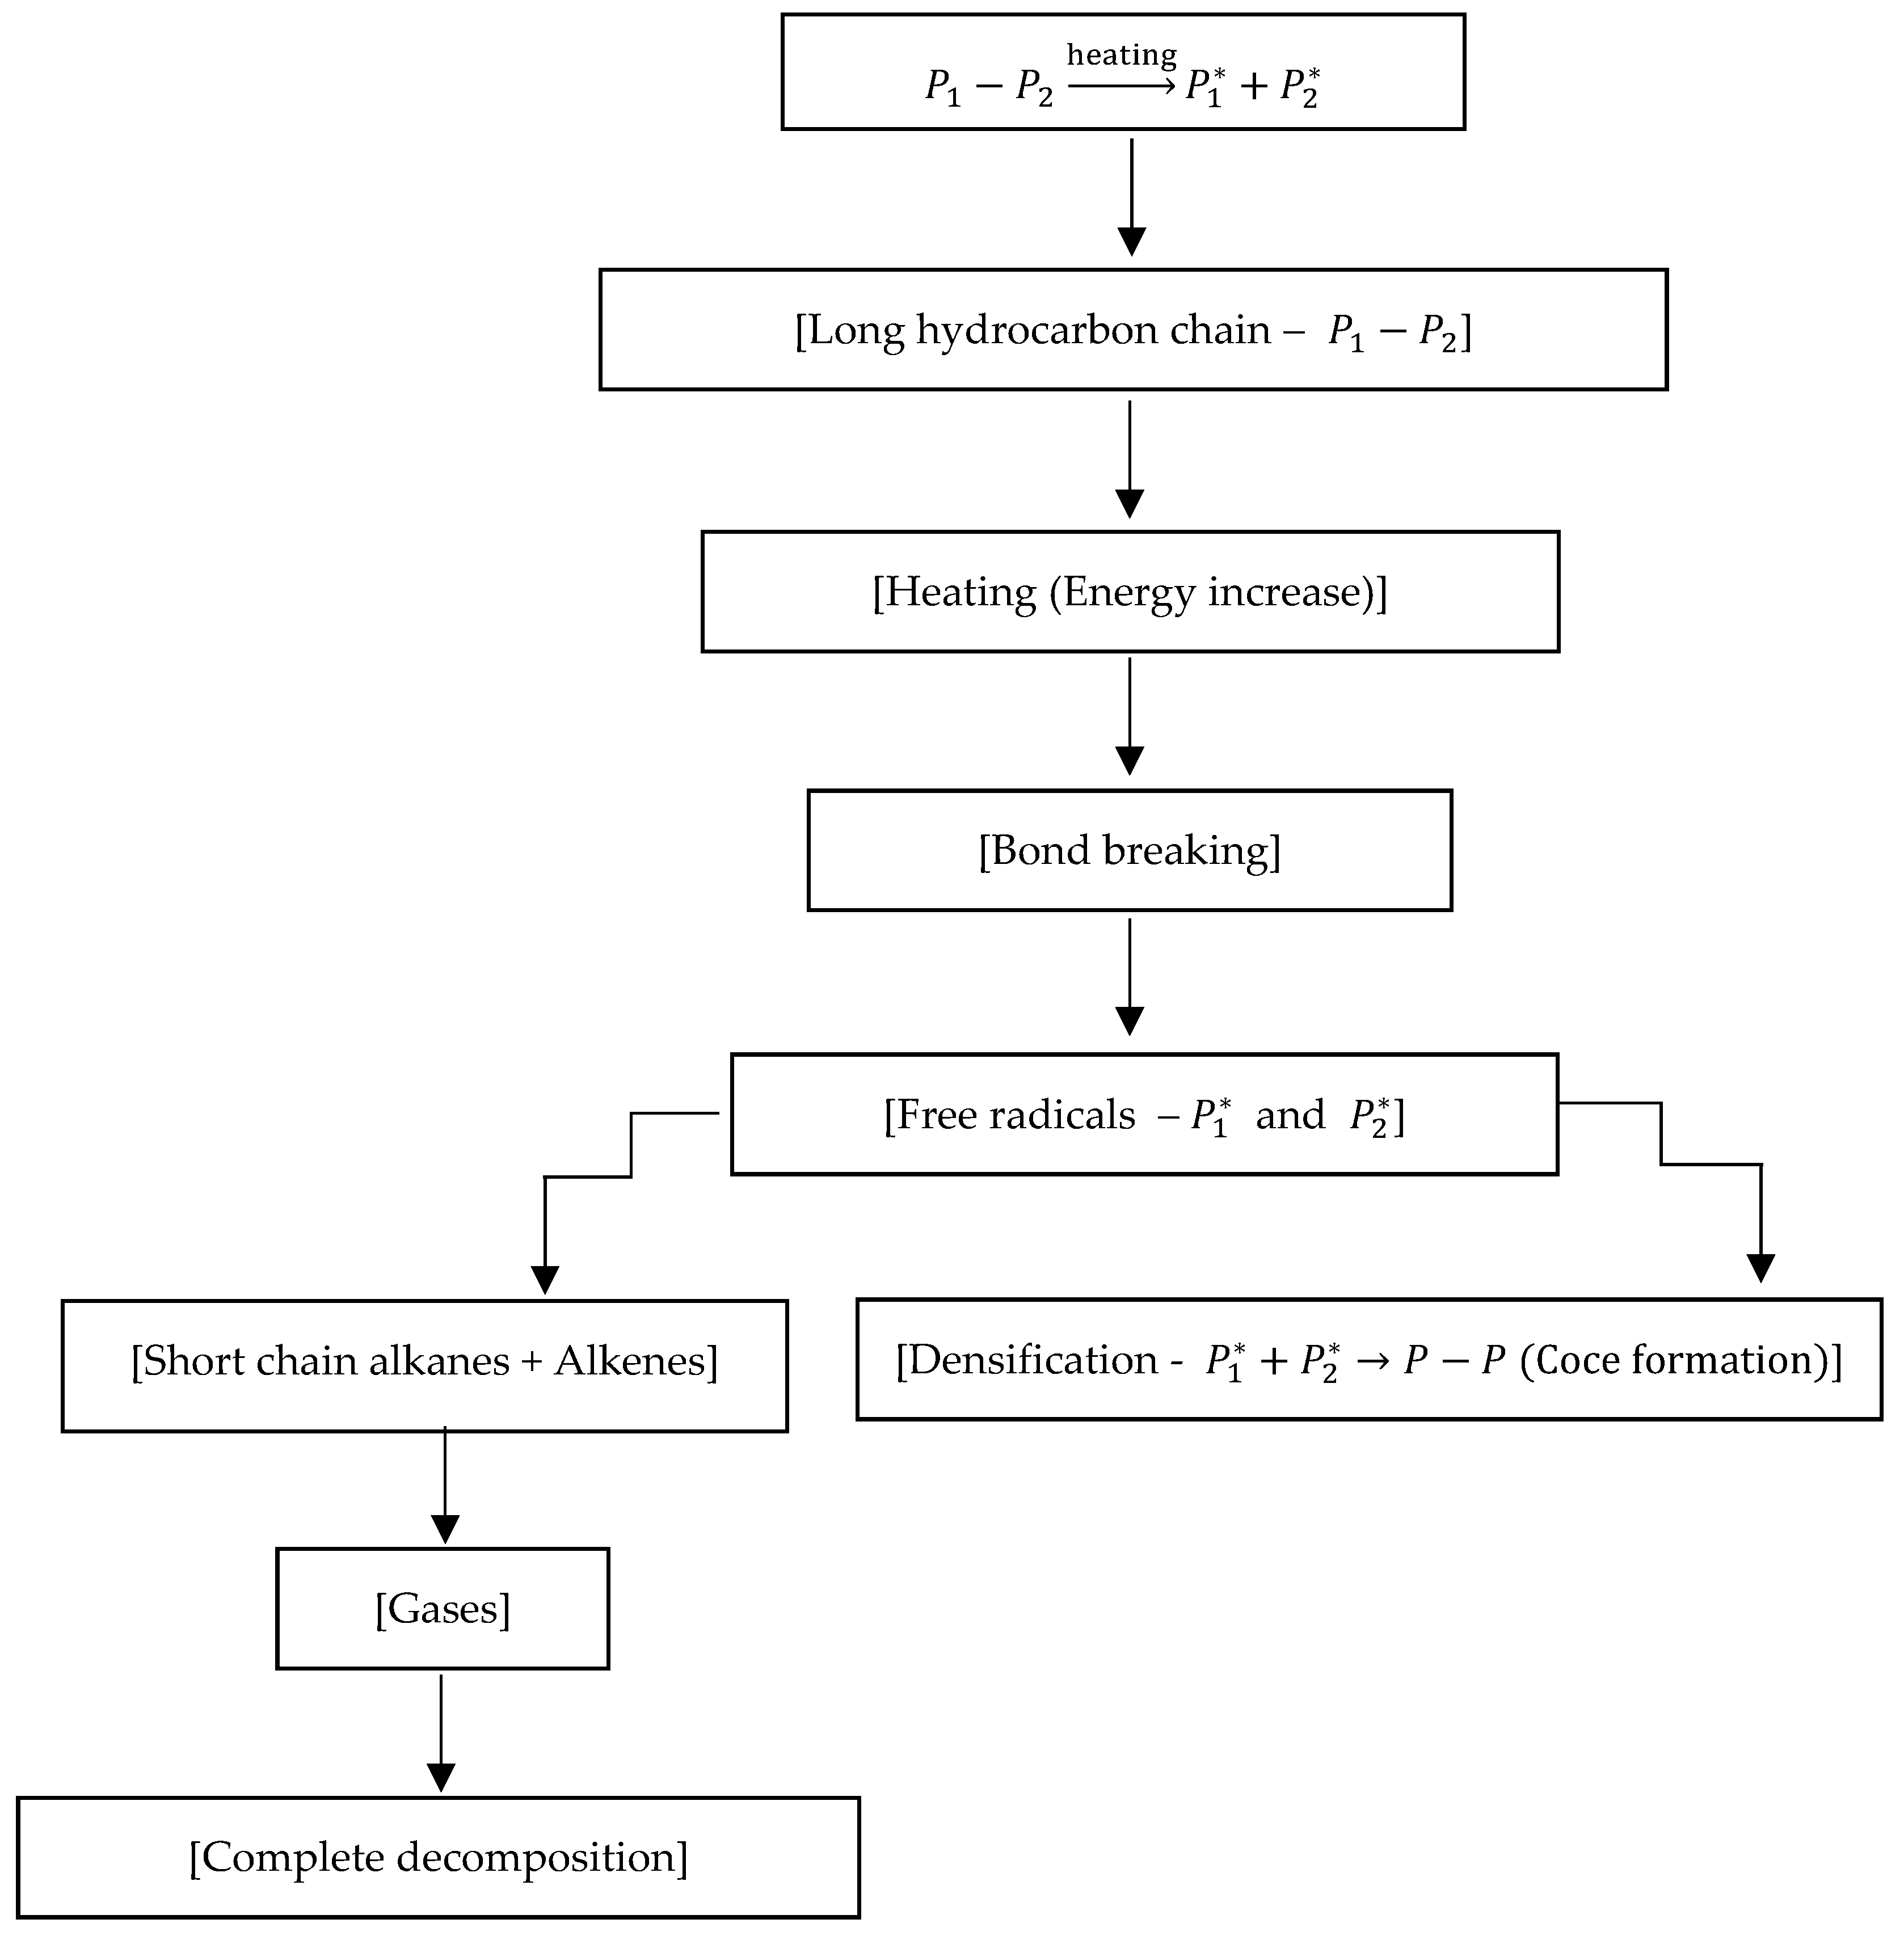
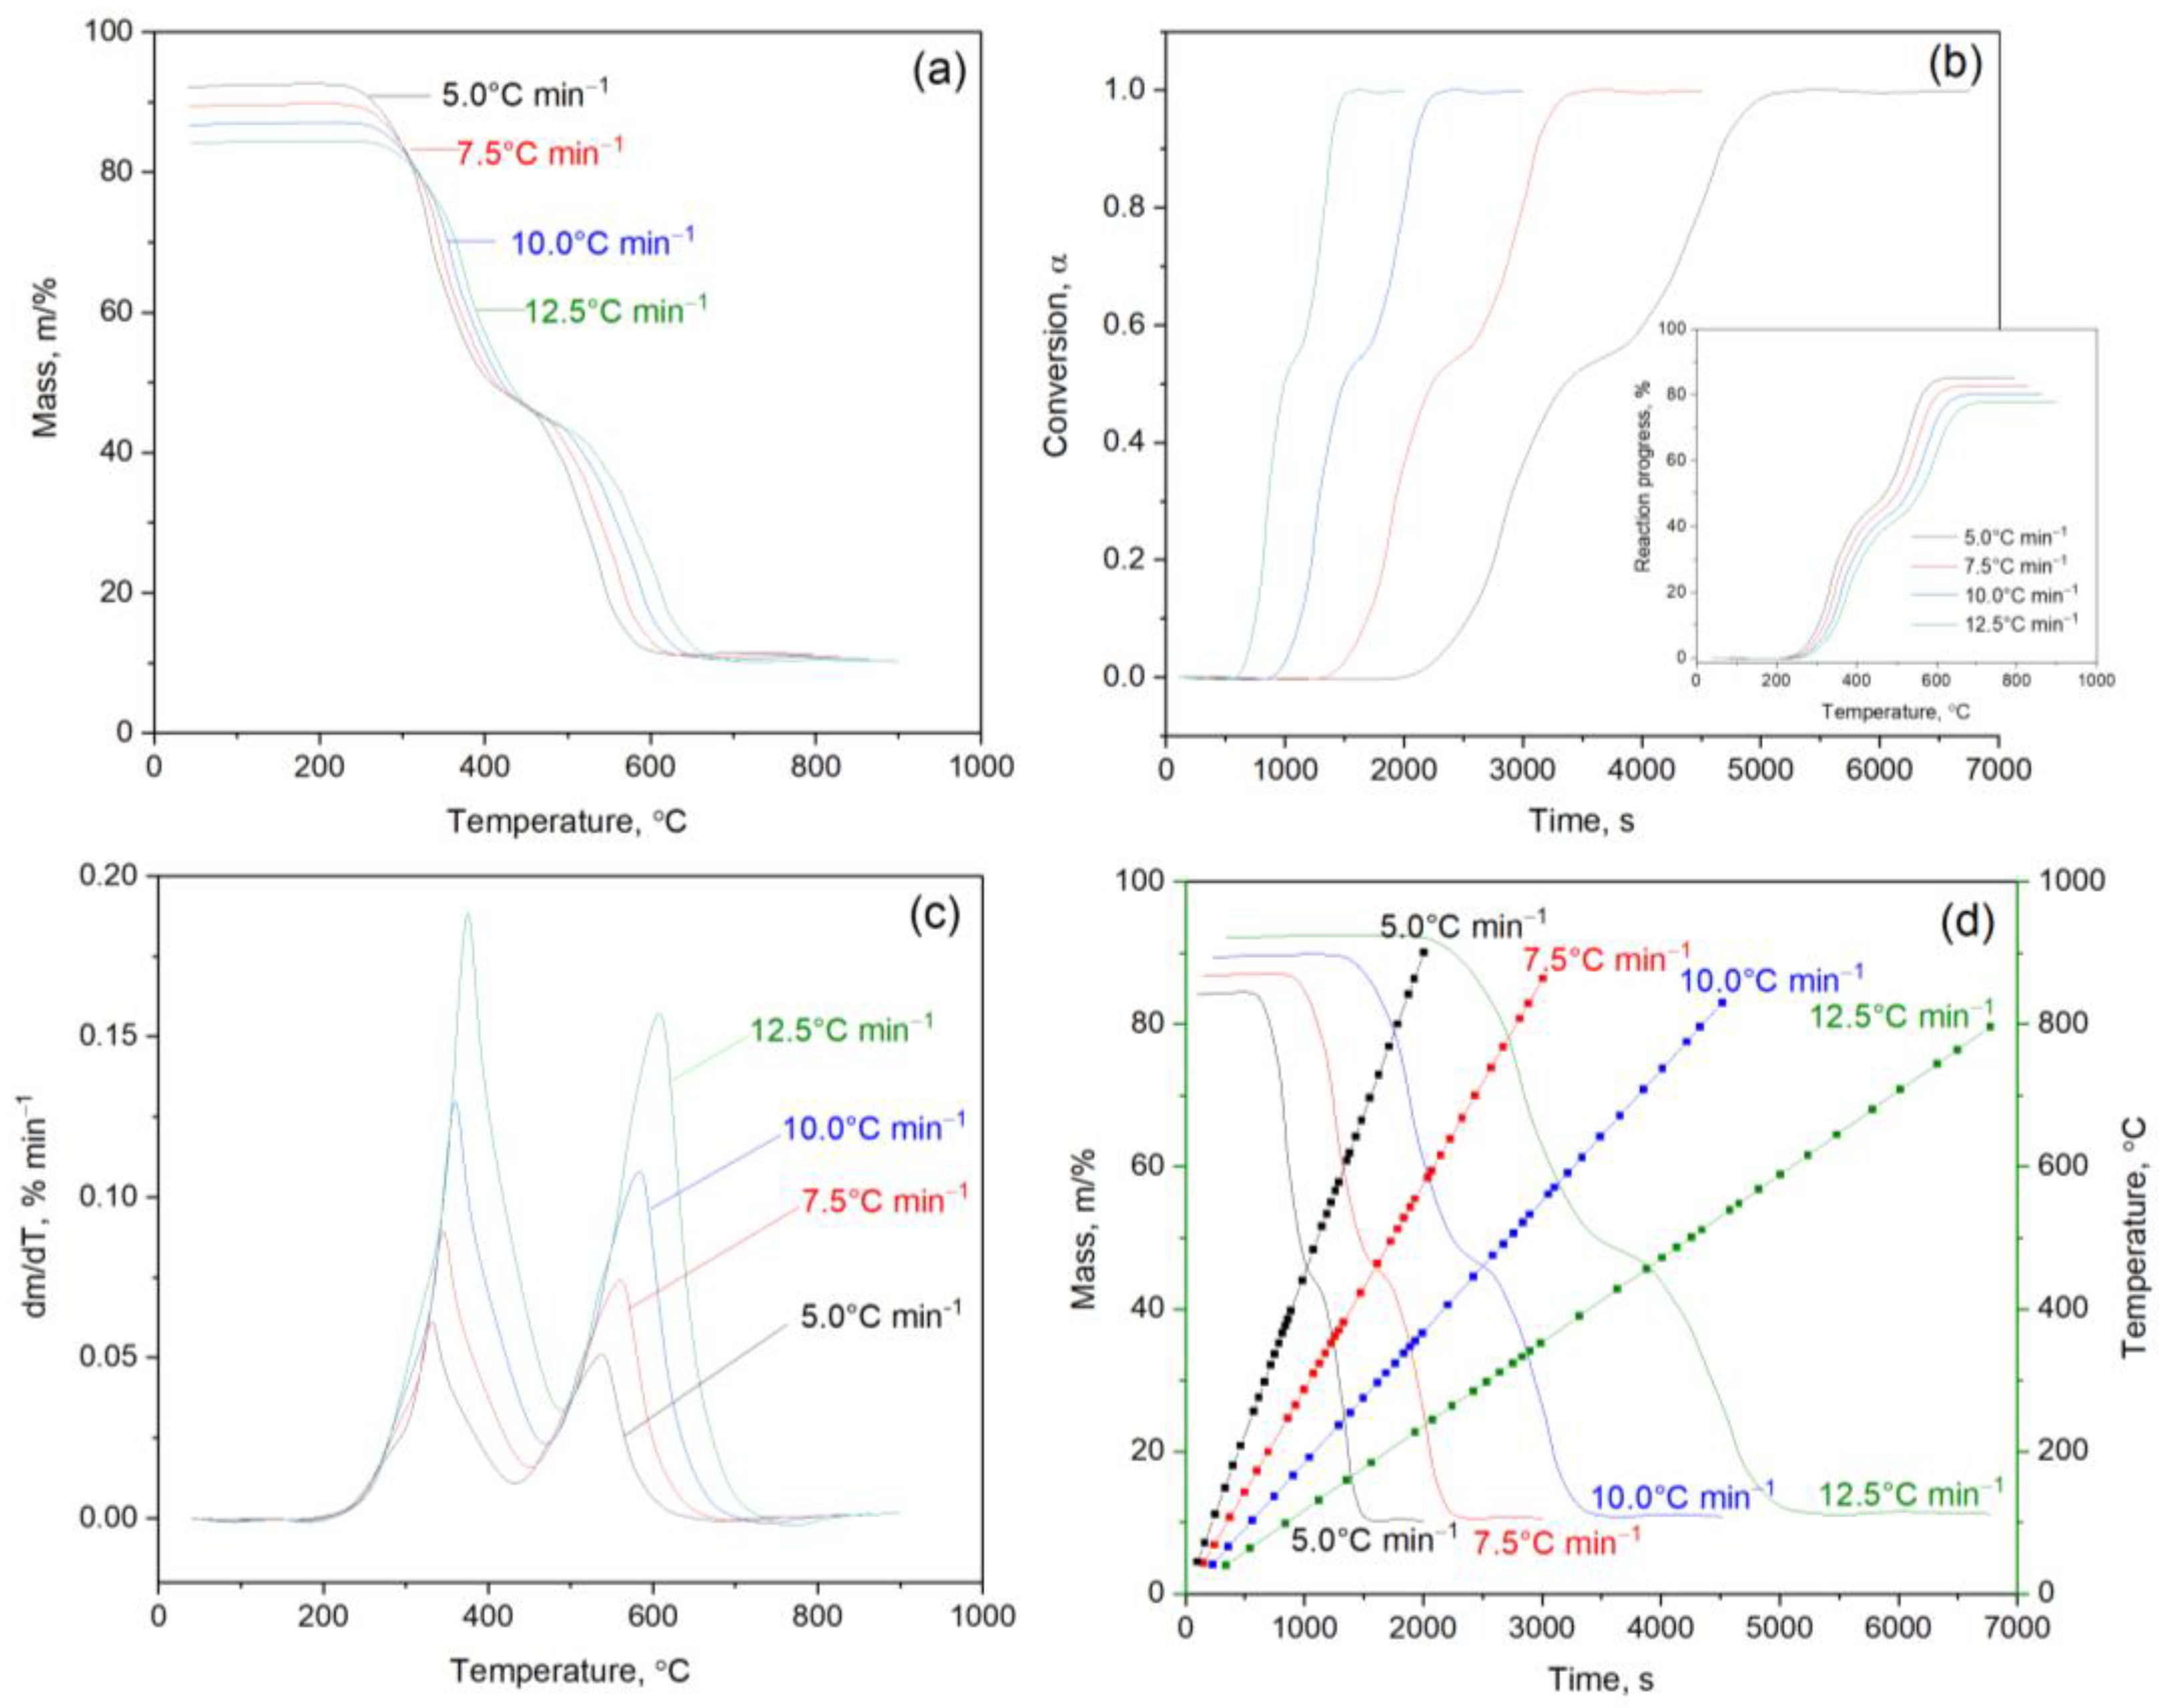
The thermal behavior of the vacuum residue in the pyrolysis process involves several competing reactions, such as breaking bonds, forming feces, molecular cracking, and densification processes. Understanding these basic pathways is important for analyzing kinetic characteristics and product distribution. Figure 1 is a diagram summarizing the main mechanisms responsible for the decomposition processes.
The thermal decomposition behavior of the vacuum residue was studied using TGA and DSC techniques. The decomposition of the vacuum residue when heated from 30 to 600 °C is a multi-stage process mechanism involving physical changes and a number of dynamic processes such as thermolysis, cracking, dehydrogenation, and polymerization (Figure 2). Figure 2 shows the thermogravimetric (TG) and differential thermogravimetric (DTG) analysis results of vacuum residue under a nitrogen atmosphere at heating rates of 5.0 °C/min, 7.5 °C/min, 10.0 °C/min, and 12.5 °C/min. As shown in Figure 2a, at temperatures up to 100 °C, moisture contained in the form of an emulsion or particles adsorbed on the surface is removed from the vacuum residue.
In the same temperature range, the lightest hydrocarbon compounds begin to evaporate at low carbon temperature. In the thermogram (Figure 2b) of the vacuum residue in the temperature range from 100 °C to 200 °C, softening of the material and the beginning of thermal changes in the vacuum residue are observed.
Based on thermogravimetric (TG/DTG) curves, a certain temperature range of Tterm (I) 200–400 °C can be distinguished with a varying rate of mass loss, where a maximum (as shown in Figure 2c) or an inflection point on the DTG curve is observed.
In addition, based on the analysis of thermogravimetric curves (TG/DTG), as well as on the literature data on the thermal decomposition of heavy oil residues [15,16,17], it was concluded that the yield of volatile components, including gasoline and kerosene fractions, as well as light gaseous products such as methane, ethane, and propane, increased. This conclusion is based on characteristic changes in mass loss rates in certain temperature ranges typical for the release of these fractions during pyrolysis of heavy hydrocarbons. It should be noted that direct gas phase analysis (for example, using gas chromatography) was not performed during this stage of study; estimates are made on the basis of thermogravimetric data with previously published results of similar studies.
With a further increase in temperature to 350–500 °C, intensive thermolysis is observed, accompanied by the active decomposition of heavy carbon–hydrogen. Cracking plays a key role in thermolysis processes, leading to the formation of light gaseous compounds (methane, ethane, propane) and liquid products such as gasoline and diesel fuel. It should be distinguished: thermolysis in a broad sense means the general thermal decomposition of complex molecules under the influence of temperature, while cracking specifically refers to the process of splitting large hydrocarbon chains into smaller and valuable fragments [18].
Between 400 °C and 600 °C, heavy residues undergo polymerization, resulting in the formation of a solid carbon residue known as coke. As can be seen from Figure 2d, heating from 650 to 800 °C leads to deep pyrolysis and graphitization of coke.
The kinetic behavior of the vacuum residue without catalysts was analyzed in detail, which made it possible to identify the multi-stage mechanism of thermal decomposition and the influence of the heating rate. However, the complexity of processing heavy hydrocarbons often requires catalytic action to optimize cracking processes, reduce coke formation, and shift product distribution towards more valuable fractions. In this regard, the next part of this study examined the effect of an Fe3O4 nanocatalyst modified with oleylamine on the processes of thermal decomposition of the vacuum residue by using TGA/DSC methods. To further evaluate the catalytic effect on the process of thermal decomposition of the vacuum residue, thermogravimetric (TG) and differential thermogravimetric (DTG) analyses of the system in the presence of a nanocatalyst were carried out. The corresponding curves are shown in Figure 3, which allows a comparative analysis of the degradation behavior with and without a catalyst.
The addition of an oleylamine-modified Fe3O4-based nanocatalyst had a significant effect on the thermal decomposition behavior of the vacuum residue. As shown in Figure 3, the presence of the catalyst led to an earlier start of the main weight loss step associated with the thermal decomposition of the hydrocarbon components and an increase in the decomposition rate compared to the uncatalyzed sample. The TG curves show a steeper slope, and the DTG curves show the appearance of pronounced peaks at lower temperatures, indicating a catalytic acceleration of bond-breaking and molecule fragmentation processes.
In the thermogram of the vacuum residue with the catalyst (Figure 3a,b) in the temperature range up to 100 °C, the removal of surface and adsorbed water is observed. This is reflected in the thermogram as a small but noticeable drop in mass (Figure 3c,d). DTG of the vacuum residue with the catalyst (Figure 3b) characterizes two maximum effects: the first at 450 °C, where sequential reactions occur in the same temperature range, and the second at 650 °C. As can be seen from Figure 3a,c), the acceleration of the vacuum residue decomposition (increased decomposition rate) under the influence of the catalyst leads to a faster decrease in the vacuum residue mass with the change in temperature, which is reflected by a steeper slope of the graph. Features of this process are manifested in a sharp decrease in mass at lower temperatures, which indicates the active participation of the catalyst in the decomposition of the vacuum residue (Figure 3b,d). It should be noted that the absence of the catalyst in the vacuum residue leads to slower decomposition, which is reflected in a less steep slope of the graph (Figure 2). As the temperature of the vacuum residue rises to 700 °C in the presence of a catalyst, the carbon bonds break, and the destruction of more complex molecules occurs, which leads to the formation of simpler hydrocarbons and various compounds. As shown in this figure, when the temperature rises (700 °C), cracking reactions begin to actively occur, in which long hydrocarbon chains break into smaller fragments.
Thus, comparison of TG and DTG curves shows that the introduction of Fe3O4-based nanocatalysts significantly changes the behavior of vacuum residue during thermal decomposition. The catalytic effect is manifested in an earlier onset of the main mass loss step, an increase in the decomposition rate, and the appearance of pronounced DTG peaks at lower temperatures. These observations indicate that the nanocatalyst accelerates the bond-breaking processes and promotes the fragmentation of complex hydrocarbons into lighter products. Kinetic analysis was performed to quantitatively characterize the catalytic effect and determine the activation energies. Modern kinetic analysis methods were used to better understand kinetic behavior and to quantify the different stages of decomposition. In particular, the Šesták–Berggren model and non-parametric kinetics (NPK) methodology were used, thus avoiding the need for a priori assumptions about the reaction mechanism. The results of kinetic modeling are given in the following sections.

Kinetic Analysis

Isothermal and non-isothermal experimental data were used to evaluate the kinetics of thermal decomposition processes using model-free methods: the Friedman differential method [19] and the Ozawa–Flynn–Wall integral method [20,21]. These approaches allow us to determine the dependence of the apparent activation energy (Ea) on the degree of transformation (α) without the need for assumptions about the reaction mechanism or the type of kinetic function g(α) [22].
The Friedman method uses the following formulation:
n β α T α = l n A α g α E a R T
At a fixed α, we have a logarithmic relationship between the conversion rate /dt and 1/T, which is a straight line with an inclination tangent equal to Ea/R. The intercept is ln{Aαg(α)}. The pre-exponential factor is usually estimated from the Arrhenius equation, assuming a first-order reaction, g(α) = (1 − α), when averaged over all dynamic heating rates.
The Ozawa–Flynn–Wall method is represented by an integral equation structured as follows:
n β = 1.052 E a R T α + 5.3305 + l n R A E α 0 1 α g α                      
Thus, from Equation (2), we obtain the dependence of ln(β) on 1/T, which is represented by a straight line with the tangent of the angle of inclination −1.052 Ea/R [23].
The activation energy by the Friedman method [19] was determined graphically (Figure 3), plotting the dependence of the logarithm of the left side of the equation on the inverse temperature. As a result, straight lines were obtained for different degrees of conversion (α = 0.1…0.5…1.0) and four heating rates (β = 5.0; 7.5; 10.0; 12.5° C·min−1).
Figure 4 shows the processing of experimental data for the vacuum residue and the vacuum residue with catalyst by the Friedman method. As can be seen from Figure 4, Ea is significantly dependent on α, reflecting a change in the reaction mechanism at different stages of the process. As shown by previous studies of the authors [22], in the initial stages (α from 0.1 to 0.5), the activation energy is lower due to the presence of easily accessible active sites and lower energy barriers. As the degree of conversion (α) increases, the activation energy (Ea) increases, which is associated with a change in the structure of the vacuum residue and the vacuum residue with the catalyst, as well as the formation of more stable products that require more energy for further decomposition (Figure 3).
In continuation of the study to determine the kinetic triplet, the method of non-parametric kinetics (NPK) [23] was applied, which makes it possible to analyze the kinetic parameters of the process without preliminary assumptions about the mechanism. This work presents a flowchart for processing experimental data using the NPK method (Figure 1), demonstrating the sequence of the stages of analysis [24,25,26]. This method is characterized by high accuracy and detail in analysis, allowing the investigation of complex kinetic processes, including the decomposition of substances and the thermal destruction of materials.
Catalysts 15 00493 i001
Where
Catalysts 15 00493 i002
In the 3D graphics (Figure 5), the dependencies of the reaction rate (∂α/∂T) on temperature (T) and degree of conversion (α) are presented for the vacuum residue and the vacuum residue with catalyst. On the surface of the vacuum residue, it is observed that as the temperature (T) increases, the reaction rate increases ∂α/∂T (Figure 5a). As shown in Figure 5a, as the conversion rate increases, the reaction rate slows down as the amount of reagents decreases, bringing the reaction closer to completion. As a result, the 3D surface (Figure 5a) acquires an oblique shape, showing a stable increase in the reaction speed up to a certain limit, after which a decrease in the speed is observed. Figure 5b shows that the introduction of the catalyst significantly increases the reaction rate for the vacuum residue, which is visually expressed by a steeper and higher top of the surface compared to the vacuum residue without the catalyst. The catalyst reduces activation energy, so the reaction proceeds faster, even at lower temperatures. At the same time, the dependence of the reaction rate on the degree of conversion remains similar: the rate increases with increasing temperature but slows down as the amount of reagents decreases, causing a shape similar to the first surface but with a higher reaction rate (Figure 5b).
Thus, it is clear that the catalyst significantly improves the reaction characteristics of the system, increasing the overall reactivity.
Approximation of experimental data by functions of the form g(α) = αm(1 − α)n using the Šesták–Berggren method is an important tool in the analysis and modeling of various materials, especially in the fields of chemical sciences and materials science. This method allows us to effectively describe the behavior of complex systems such as vacuum residue. The selection of the function g(α) was carried out using the model in the coordinates ∂α/∂t–α at different β heating rates. As g(α), the expression g(α) = αm(1 − α)n was used. The function g(α) is the product of two factors depending on the variable α, where m and n are non-negative parameters. As shown in Figure 6a, for the vacuum residue with parameters m = 0.74 and n = 2.09, the function g(α) = α0.74(1 − α)2.09 reaches its maximum at the same point but has a more rounded shape. The graph of the function in Figure 6b for the vacuum residue with catalyst has a shape resembling a “bell” or “mound”, which corresponds to the positive values of both parameters m and n. The maximum is reached at the point α = m m + n .
To determine the kinetic parameters and verify the validity of the experimental data, thermogravimetric (TG) curves obtained during the experiments were compared with the results of approximation based on mathematical modeling. To this end, a model scheme has been developed that allows a deeper analysis of the behavior of the vacuum residue during thermal decomposition in the presence of an oleylamine-modified Fe3O4 nanocatalyst. This approach made it possible to assess the influence of key parameters—temperature, heating rate, and catalytic composition—on the kinetics of thermal decomposition. The use of mathematical methods, including regression analysis and numerical modeling, made it possible not only to accurately approximate the experimental dependencies of mass loss but also to predict the behavior of the system under various heating conditions. The obtained results made it possible to identify the main laws and mechanisms of pyrolysis in a complex hydrocarbon matrix, as well as to determine promising directions for optimizing process parameters. This is especially important for the subsequent scaling of the technology of thermocatalytic processing of heavy oil residues.
To more accurately approximate the experimental data and identify the main patterns, mathematical models embedded in the OriginPro 9.0 software package were used. Mass versus temperature curves were approximated using S-shaped models such as the Boltzmann function and DoseResp implemented in the Nonlinear Curve Fit (NLFit) module. The choice of these models was due to their ability to accurately describe the characteristic thermal degradation transients of multi-component systems such as vacuum residue and nanocatalysts. The use of models made it possible to provide higher accuracy of approximation, better agreement with experimental data, and a deeper interpretation of the kinetic characteristics of the pyrolysis process. Statistical evaluation of the up-approximation quality showed a high significance of the obtained models: the F-statistics were 4484.01254 at p < 0.0001, the reduced chi-square value was 0.45946, and the coefficients of determination R2 and the corrected R2adj reached 0.99999, which indicates almost complete coincidence of the calculated and experimental curves (Figure 7). As can be seen from the results (Figure 7), the relative standard uncertainty for the approximated mass–temperature data remains low for all models used, which confirms the reliability of the chosen mathematical approach.
Decomposition processes of condensed matter, such as the vacuum residue, often have a complex mechanism. In such situations, the total reaction rate does not depend on the concentration of the reactants, making it difficult to unambiguously determine the order of the reaction. Under these conditions, the concept of the concentration of the reacting substance loses its meaning, and it is more convenient to use the value α, which denotes the proportion of the reacting substances at the time. At the initial time, α is 0, and after the end of the process, α = 1.
The mathematical model can be represented by a differential equation with an initial condition corresponding to the value α of the reagent A at the time of the start of the reaction (t = 0):
d α A t d t = k α A t n α A 0 = α A 0
In Equation (1), the variables are separated, allowing it to be solved using the approximate Friedman method (Figure 8).
In the three-dimensional graphs presented (Figure 9a,b), two reporting vertices are observed depending on T, α, and α T . In particular, the degree of conversion (α) establishes the dynamics and nature of the process, reflecting at what stage the reaction is: from the initial stages (α = 0.1...0.2), when the rate may be low, to the stage of high activity (α = 0.5), and then to the completion of α = 1.0, when the rate decreases (Figure 9).
The presence of two peaks indicates sequential processes. The first peak corresponds to the initial stage of the process and can be associated with the degradation of low molecular weight components. The main stage, represented by the second peak, requires higher activation energy, which leads to a change in the high speed of the process in the region of elevated temperatures.
Theoretical data (Table 1) obtained from mathematical modeling using selected models (Boltzmann functions and DoseResp) demonstrates good correspondence with experimental data. This agreement indicates that the selected mathematical models effectively describe the behavior of the system and accurately approximate the experimental results. This consistency validates the models and enables the assessment of their error when applying computational methods for the efficient study of the vacuum residue and the vacuum residue with a catalyst.
As shown in Table 1, the incorporation of the catalyst reduces the efficiency of thermal decomposition of the vacuum residue, since the catalyst promotes the breaking of bonds and the preservation of intermediates.

3. Materials and Methods

The vacuum residues produced at the Pavlodar petrochemical plant (Pavlodar, Republic of Kazakhstan) were selected for this study.

3.1. Chemical Analysis of the Vacuum Residue

The elemental composition of the vacuum residue (carbon, hydrogen, nitrogen, and sulfur) was determined on a Vario MICRO Cube elemental analyzer (Elementar, Langenselbold, Germany) in accordance with ISO 29541:2025 [27]. Measurements were made with three times repetition to improve accuracy, and the errors of the results were ±0.20% by weight for each element.
Calculation of the oxygen content:
Since the direct determination of oxygen was not performed, its content was calculated from the material balance, taking into account ash, according to the following formula:
O = 100% − (C + H + N + S + Ash)
This approach made it possible to increase the accuracy of evaluating oxygen-containing components.
Proximate analysis, including determination of humidity, volatile substances, ash, and fixed carbon, was carried out in accordance with GOST 6382-91 [28] and GOST 1461-2023 [29].
Moisture and volatiles were determined by standard drying and calcination at specified temperatures.
Ash determination was carried out as follows: crucibles with the sample were pre-treated with diluted hydrochloric acid, washed with distilled water, dried, and calcined in a muffle furnace at (775 ± 25) °C for 10 min. After cooling in air and incubation in a desiccator without drying agent for 30 min, the crucibles were weighed to the nearest 0.0002 g. The calcination and weighing were repeated until a constant mass was reached, and the difference between two consecutive weighings did not exceed 0.0004 g. Fixed carbon was calculated using the following formula:
Fixed carbon = 100% − (Moisture + Volatiles + Ash)
The results of the elemental and proximate analyses are shown in Table 2 and Table 3.
As shown in Table 2 and Table 3, the vacuum residue mainly consists of carbon (82.4%) and hydrogen (11.8%), indicating its rich hydrocarbon nature and high energy potential. The nitrogen content (0.9%) and sulfur content (2.6%) are within the limits characteristic of heavy oil residues and may be important from the point of view of environmental aspects during thermal processing.
The oxygen content (2.3%) calculated from the difference is probably due to the presence of oxygenates or residual moisture and contributes to the thermal reactivity of the feed. Low ash content (given separately in the proximate analysis) confirms an insignificant amount of inorganic impurities. The resulting composition confirms that the vacuum residue is a complex organic system suitable for catalytic pyrolysis studies aimed at splitting long hydrocarbon chains into more valuable fractions.

3.2. Determination of Kinematic Viscosity and Vacuum Residue Density

The kinematic viscosity of the vacuum residue was determined in accordance with the requirements of GOST 33-2016 [30]. Before testing, the samples were heated to a temperature of 50 °C. Then, two viscometers installed in a thermostat with temperature maintenance were filled with the test sample to the marks provided by the design of the devices. For each viscometer, the sample efflux time between the two controls was recorded to within ±0.1 s. As a result, the average kinematic viscosity was calculated for each outflow rate.
Vacuum residue density was measured according to GOST 3900-2022 [31]. The sample was also heated to 50 °C and placed in a cylinder with a hydrometer and a built-in thermometer. After achieving temperature equilibrium, the areometer readings were taken, followed by adjustment for the meniscus effect and thermal expansion of the glass. The density values obtained were converted to a standard temperature of 20 °C using temperature correction factors in accordance with the standard procedure.
All measurements were carried out in triplicate to increase the accuracy of the results and minimize random errors.

3.3. Synthesis of Fe3O4 Nanocatalyst

The commercial Fe3O4 powder (2.315 g, corresponding to 10 mmol) was dispersed in 300 milliliters of ethanol by magnetic stirring. Oleylamine (0.535 g or 2 mmol) was then added to this solution. The resulting solution was heated to 75 °C for one hour. Samples were removed from the solution using an external magnet and washed with ethanol. The products were then dried at room temperature [32]. The physicochemical characteristics of the synthesized nanocatalyst are presented in [32,33,34].

3.4. Thermogravimetric Analysis of the Vacuum Residue

Thermal decomposition of the mixture of the vacuum residue with the nanocatalyst was carried out using a LabsysEvoTG-DTA/DSC (SETARAM, Caluire-et-Cuire, France) derivatograph in corundum crucibles in the temperature range from 30 to 1000 °C in a nitrogen stream (the flow rate of the protective and purge gas was 20 and 50 mL per minute, respectively). Moreover, 1.0 wt% Fe3O4 nanocatalyst was added to the raw material (vacuum residue). As shown in our previous studies [32,33] on the thermal destruction of heavy hydrocarbon feedstocks, the best results are achieved by adding a catalyst in an amount of 1.0–1.5% by weight of the starting material. In addition, Professor Xintai Su and his students in the article [14] showed that in the process of hydrogenation of a coal mixture in the presence of tetralin, the consumption of the Fe3O4 nanocatalyst was 1.5 wt%. Based on the above data, it is believed that the optimum amount of added nanocatalyst for thermal degradation and destructive hydrogenation of the heavy and solid hydrocarbon feedstocks is 1.0% by weight of the feedstock. The heating rates were 5.0 °C min−1, 7.5 °C min−1, 10.0 °C min−1, and 12.5 °C min−1. The mass of the sample was recorded continuously depending on temperature and time.
In the present study, the term “conversion rate” (α) means the degree of thermal decomposition of the vacuum residue during TGA. The conversion was calculated from the following expression:
α = m 0 m t m 0 m f
where:
  • m0—the initial sample weight,
  • mt—mass at time t,
  • mf—the final mass after degradation.
This approach allows a direct assessment of the degree of degradation of the sample during thermogravimetric analysis.
The data were processed using the OriginPro 9.0 software package and the Anaconda distribution (Python 3.10 with NumPy, Matplotlib version 3.10.1, and SciPy libraries).
Polynomial regression models were used to analyze the relationships using the Polynomial Fit module of OriginPro 9.0 software, which allowed statistical evaluation of the data and graphical representation of the results.
Each experiment was performed three times to improve the accuracy of the measurements. Next, mean values were calculated to minimize random errors and improve the reproducibility of the data.

4. Conclusions

This study investigated the effect of an oleylamine-modified Fe3O4-based nanocatalyst on the thermal decomposition of the vacuum residue by the TG/DTG method. It was obtained that the average activation energy without a catalyst is 91.54 ± 0.18 kJ mol−1 (experiment) and 91.35 kJ mol−1 (calculation), while in the presence of a catalyst it decreases to 89.68 ± 0.36 kJ mol−1 (experiment) and 90.87 kJ mol−1 (calculation).
The decrease in energy barriers in the presence of a nanocatalyst indicates its high activity, which is accompanied by an increase in the decomposition rate, a shift of the reaction onset to lower temperatures, and a potential to reduce coke formation. These effects confirm the catalytic efficiency of Fe3O4 nanoparticles due to their modified surface and high dispersion.
Thus, the use of a modified Fe3O4 nanocatalyst can significantly increase the efficiency of heavy oil residue processing. The results of the present work confirm the prospectivity of this approach and form the basis for further research in the field of the development of energy-saving and selective catalysts for the processes of deep conversion of hydrocarbon raw materials.

Author Contributions

Conceptualization, A.T. (Almas Tusipkhan), D.M., F.M. and A.Z.S.; methodology, A.T. (Almas Tusipkhan), M.B. and A.Z.S.; software, M.B. and N.B.; validation, N.B., A.Z.S., F.M. and D.A.; formal analysis, D.M., A.T.(Alma Tateeva) and N.B.; investigation, D.M., A.Z.S. and D.I.; resources, A.T. (Almas Tusipkhan); data curation, M.B., A.T. (Alma Tateeva) and N.B.; writing—original draft preparation, A.Z.S. and N.B.; writing—review and editing, A.Z.S. and M.B.; visualization, D.I. and B.K.; supervision, B.K.; project administration, A.T. (Almas Tusipkhan); funding acquisition, A.T. (Almas Tusipkhan). All authors have read and agreed to the published version of the manuscript.

Funding

This research was funded by the Ministry of Science and Higher Education of the Republic of Kazakhstan, grant number AP23488758.

Data Availability Statement

Data are contained within the article.

Conflicts of Interest

The authors declare no conflicts of interest.

References

  1. Jenifer, A.C.; Sharon, P.; Prakash, A.; Sande, P.C. A review of the unconventional methods used for the demetallization of petroleum fractions over the past decade. Energy Fuels 2015, 29, 7743–7752. [Google Scholar] [CrossRef]
  2. Speight, J.G. Heavy and Extra-Heavy Oil Upgrading Technologies; GPP: Houston, TX, USA, 2013. [Google Scholar]
  3. Liu, H.; Wang, Z.; Guo, A.; Lin, C.; Chen, K. The Distribution of Ni and V in Resin and Asphaltene Subfractions and Its Variation During Thermal Processes. Pet. Sci. Technol. 2014, 33, 203–210. [Google Scholar] [CrossRef]
  4. Liu, T.; Lu, J.; Zhao, X.; Zhou, Y.; Wei, Q.; Zhang, Y.; Shi, Q. Distribution of Vanadium Compounds in Petroleum Vacuum Residuum and Their Transformations in Hydrodemetallization. Energy Fuels 2015, 29, 2089–2209. [Google Scholar] [CrossRef]
  5. Ancheyta, J. Modeling of Processes and Reactors for Upgrading of Heavy Petroleum; CRC Press, Taylor and Francis Group: Boca Raton, FL, USA, 2013. [Google Scholar]
  6. Shin, S.; Ikem, S.; Nho, N.; Bong Lee, K. Kinetic analysis using thermogravimetric analysis for nonisothermal pyrolysis of vacuum residue. J. Therm. Anal. Calorim. 2016, 126, 933–941. [Google Scholar] [CrossRef]
  7. Xu, Y.; Zhang, Y.; Wang, Y.; Zhang, G.; Chen, L. Thermogravimetric study of the kinetics and characteristics of the pyrolysis of lignite. React. Kinet. Mech. Catal. 2013, 110, 225–235. [Google Scholar] [CrossRef]
  8. Baikenov, M.I.; Izbastenova, D.; Sarsenbekova, A.Z.; Balpanova, N.Z.; Tusipkhan, A. Determination of the Kinetic Parameters of Thermal Degradation and Hydrodemetallization of a Mixture of the Heavy Fraction of Low-Temperature Coal Tar and Coal Shale. Energies 2024, 17, 1766. [Google Scholar] [CrossRef]
  9. Koga, N.; Vyazovkin, S.; Burnham, A.; Favergeon, L.; Muravyev, N.; Pérez-Maqueda, L.; Saggese, C.; Sánchez-Jiménez, P. ICTAC Kinetics Committee recommendations for analysis of thermal decomposition kinetics. Thermochim. Acta 2023, 719, 179384. [Google Scholar] [CrossRef]
  10. DaCosta, H.; Fan, M. Rate Constant Calculation for Thermal Reactions: Methods and Applications; Wiley: Hoboken, NJ, USA, 2012. [Google Scholar]
  11. Vyazovkin, S.; Chrissafis, K.; Di Lorenzo, M.L.; Koga, N.; Pijolat, M.; Roduit, B.; Sbirrazzuoli, N.; Suñol, J.J. ICTAC Kinetics Committee Recommendations for Collecting Experimental Thermal Analysis Data for Kinetic Computations. Thermochim. Acta 2014, 590, 1–23. [Google Scholar] [CrossRef]
  12. Vyazovkin, S.; Burnham, A.K.; Favergeon, L.; Koga, N.; Moukhina, E.; Pérez-Maqueda, L.A.; Sbirrazzuoli, N. ICTAC Kinetics Committee Recommendations for Analysis of Multi-Step Kinetics. Thermochim. Acta 2020, 689, 178597. [Google Scholar] [CrossRef]
  13. Burkeev, M.Z.; Bolatbay, A.N.; Sarsenbekova, A.Z. Integral Ways of Calculating the Destruction of Copolymers of Polyethylene Glycol Fumarate with Acrylic Acid. Russ. J. Phys. Chem. 2021, 95, 2009–2013. [Google Scholar] [CrossRef]
  14. Li, Y.; Ma, F.; Su, X.; Sun, C.; Liu, J.; Sun, Z.; Hou, Y. Synthesis and catalysis of oleic acid-coated Fe3O4 nanocrystals for direct coal liquefaction. Catal. Commun. 2012, 26, 231–234. [Google Scholar] [CrossRef]
  15. Bajus, M. Pyrolysis technologies for biomass and waste treatment to fuels and chemical production. Pet. Coal 2010, 52, 1–10. [Google Scholar]
  16. Ekejiuba, A.I.B. Natural Petroleum Chemistry and Valuable Products Fractions. Inter-World J. Sci. Technol. 2021, 4, 300–337. [Google Scholar]
  17. Gautam, R.; Bhaskar, T.; Singh, R. On the products from the pyrolysis of heavy fuel and vacuum residue oil. J. Anal. Appl. Pyrolysis 2023, 171, 106060. [Google Scholar] [CrossRef]
  18. Gary, J.H.; Handwerk, G.E.; Kaiser, M.J. Petroleum Refining: Technology and Economics, 5th ed.; CRC Press: Boca Raton, FL, USA, 2007. [Google Scholar]
  19. Friedman, H.L. Kinetics of Thermal Degradation of Char-Forming Plastics from Thermogravimetry. Application to a Phenolic Plastic. J. Polym. Sci. Part C Polym. Symp. 1964, 6, 183–195. [Google Scholar] [CrossRef]
  20. Flynn, J.H.; Wall, L.A. A Quick, Direct Method for the Determination of Activation Energy from Thermogravimetric Data. J. Polym. Sci. Part B Polym. Lett. 1966, 4, 323–328. [Google Scholar] [CrossRef]
  21. Ozawa, T. A New Method of Analyzing Thermogravimetric Data. Bull. Chem. Soc. Jpn. 1965, 38, 1881–1886. [Google Scholar] [CrossRef]
  22. Balpanova, N.; Baikenov, M. Thermal Degradation Kinetics of Vacuum Residues in the Presence of Chrysotile Supported Ni-Ti Catalyst. Catalysts 2023, 13, 1361. [Google Scholar] [CrossRef]
  23. Li, Y.; Yang, C.; Ge, J.; Sun, C.; Wang, J.; Su, X. A general microwave-assisted two-phase strategy for nanocrystals synthesis. J. Colloid Interface Sci. 2013, 407, 296–301. [Google Scholar] [CrossRef]
  24. Serra, R.; Sempere, J.; Nomen, R. A new method for the kinetic study of thermoanalytical data: The non-parametric kinetics method. Thermochim. Acta 1998, 316, 37–45. [Google Scholar] [CrossRef]
  25. Serra, R.; Nomen, R.; Sempere, J. The Non-Parametric Kinetics A New Method for the Kinetic Study of Thermoanalytical Data. J. Therm. Anal. Calorim. 1998, 52, 933–943. [Google Scholar] [CrossRef]
  26. Wall, M.E.; Rechtsteiner, A.; Rocha, L.M. Singular Value Decomposition and Principal Component Analysis. In A Practical Approach to Microarray Data Analysis; Berrar, D.P., Dubitzky, W., Granzow, M., Eds.; Springer: Boston, MA, USA, 2003. [Google Scholar]
  27. ISO 29541:2025; Coal and Coke—Determination of Total Carbon, Hydrogen and Nitrogen—Instrumental Method. ISO: Geneva, Switzerland, 2025.
  28. GOST 6382-91; Mineral Solid Fuel. Determination of Volatile Matter. GOST: Moscow, Russia, 2023.
  29. GOST 1461-2023; Petroleum and Petroleum Products. Method of Ash Test. GOST: Moscow, Russia, 2023.
  30. GOST 33-2016; Petroleum and Petroleum Products. Transparent and Opaque Liquids. Determination of Kinematic and Dynamic Viscosity. GOST: Moscow, Russia, 2016.
  31. GOST 3900-2022; Petroleum and Petroleum Products. Methods for Determination of Density. GOST: Moscow, Russia, 2022.
  32. Tyanakh, S.; Baikenov, M.; Yun, M.F.; Khamitova, T.; Balpanova, N.; Tulebayeva, B.; Kyzkenova, A.; Karimova, A.; Rakhimzhanova, N.; Kochegina, E. Kinetic of Oil Sludge Thermolysis Process in Presence of Nickel, Cobalt and Iron-Supported Microsilicate. Pol. J. Chem. Technol. 2023, 25, 101–109. [Google Scholar] [CrossRef]
  33. Balpanova, N.Z.; Baikenov, M.I.; Gyulmaliev, A.M.; Absat, Z.B.; Batkhan, Z.; Ma, F.; Su, K.; Kim, S.V.; Baikenova, G.G.; Aitbekova, D.E.; et al. Thermokinetic parameters of the primary coal tars destruction in the presence of catalysts and polymeric materials. Bull. Univ. Karaganda—Chem. 2021, 102, 86–95. [Google Scholar] [CrossRef]
  34. Sarsenbekova, A.Z.; Zhumanazarova, G.M.; Tazhbayev, Y.M.; Kudaibergen, G.K.; Kabieva, S.K.; Issina, Z.A.; Kaldybayeva, A.K.; Mukabylova, A.O.; Kilybay, M.A. Research the Thermal Decomposition Processes of Copolymers Based on Polypropyleneglycolfumaratephthalate with Acrylic Acid. Polymers 2023, 15, 1725. [Google Scholar] [CrossRef] [PubMed]
Figure 1. Thermal decomposition mechanism (*—free radical).
Catalysts 15 00493 g001
Figure 2. Thermogravimetric (TG) and vacuum residue conversion curves for thermal decomposition under nitrogen at different heating rates (5.0 °C min−1, 7.5 °C min−1, 10.0 °C min−1, and 12.5 °C min−1): (a)—mass loss curves (TG) versus temperature; (b)—conversion curves as a function of time; (c)—differential thermogravimetric (DTG) vacuum residue curves; and (d)—mass loss curves (TG) versus time and heating profiles (T-t) corresponding to different heating rates.
Catalysts 15 00493 g002
Figure 3. Thermogravimetric (TG) and degree of transformation curves of Fe3O4-based nanocatalyst during thermal decomposition in a nitrogen atmosphere at different heating rates (5.0 °C min−1, 7.5 °C min−1, 10.0 °C min−1, and 12.5 °C min−1): (a)—mass loss (TG) curves as a function of temperature; (b)—degree of transformation curves as a function of time; (c)—differential thermogravimetric (DTG) curves of the vacuum residue; and (d)—mass loss (TG) curves as a function of time and heating profiles (T-t) corresponding to different heating rates.
Catalysts 15 00493 g003
Figure 4. Processing of experimental data by the Friedman method [1]: (a) the vacuum residue and (b) the vacuum residue with the catalyst.
Catalysts 15 00493 g004aCatalysts 15 00493 g004b
Figure 5. Reaction rate β d α / dt versus temperature T and conversion α for the vacuum residue (a) and vacuum residue with catalyst (b).
Catalysts 15 00493 g005
Figure 6. Approximation of the experimental data using the Šesták–Berggren function: (a)—vacuum residue and (b)—vacuum residue with catalyst.
Catalysts 15 00493 g006
Figure 7. Description of these thermograms using mathematical models: (a)—vacuum residue and (b)—vacuum residue with catalyst.
Catalysts 15 00493 g007
Figure 8. Theoretical curves obtained by the Friedman method: (a)—for the vacuum residue and (b)—for the vacuum residue with catalyst.
Catalysts 15 00493 g008
Figure 9. Theoretical dependences of reaction rate β d α / dt state on temperature T and conversion degree α for the vacuum residue (a) and the vacuum residue with catalyst (b).
Catalysts 15 00493 g009
Table 1. Thermal decomposition kinetics for the vacuum residue and the vacuum residue with catalyst. Note: Activation energy (Ea) is given in kJ mol−1; pre-exponential factor (A) is given in s⁻1. All values are presented as mean ± standard deviation from triplicate measurements.
Sample E ¯ NPK ,
kJ mol−1
±SD
A ¯ ·103, s−1
±SD
Šesták–Berggren E ¯ S B ,
kJ mol−1
±SD
A ¯ · 104, s−1
±SD
E ¯ FR ,
kJ mol−1
±SD
A ¯ · 103, s−1
±SD
αm(1 − α)n
mn
Experimental data
Vacuum residue91.54
±0.18
4.83
±0.12
0.752.3694.23
±0.56
1.49
±0.05
91.54
±0.26
4.80
±0.05
Vacuum residue with a catalyst89.68
±0.36
9.86
±0.10
0.742.0992.52
±0.13
2.08
±0.18
89.68
±0.36
9.95
±0.05
Theoretical data
Vacuum residue91.35
±0.50
4.83
±0.05
0.752.3794.13
±0.50
1.48
±0.09
91.43
±0.35
3.33
±0.10
Vacuum residue with a catalyst90.87
±0.50
7.98
±0.15
0.742.1091.52
±0.50
2.15
±0.18
90.87
±0.50
8.01
±0.10
Table 2. Ultimate analysis of vacuum residue (wt%) with corresponding impurities.
Element Content (wt%)Error
(±wt. %)
Methodology
Carbon (C) 82.4±0.20Vario MICRO Cube/ISO 29541
Hydrogen (H)11.8±0.20Vario MICRO Cube/ISO 29541
Nitrogen (N)0.9±0.20Vario MICRO Cube/ISO 29541
Sulfur (S)2.6±0.20Vario MICRO Cube/ISO 29541
Oxygen (O) 2.3Estimated valueBy elemental difference
Table 3. Proximate analysis of vacuum residue (wt%) with corresponding errors.
Indicator Value (wt%)Error
(±wt. %)
Methodology/Standard
Moisture 0.21±0.05GOST 6382-91
Ash 1.64±0.02GOST 1461-2023
Volatiles 53.15±0.10GOST 6382-91
Fixed carbon 44.99By difference
Disclaimer/Publisher’s Note: The statements, opinions and data contained in all publications are solely those of the individual author(s) and contributor(s) and not of MDPI and/or the editor(s). MDPI and/or the editor(s) disclaim responsibility for any injury to people or property resulting from any ideas, methods, instructions or products referred to in the content.

