Review

Multidimensional Engineering of Nanoconfined Catalysis: Frontiers in Carbon-Based Energy Conversion and Utilization

by
Qimin Fang
1,†,
Qihan Sun
1,†,
Jinming Ge
1,
Haiwang Wang
1,* and
Jian Qi
2,3,*
1
Key Laboratory of Dielectric and Electrolyte Functional Material Hebei Province, Northeastern University at Qinhuangdao, Qinhuangdao 066004, China
2
State Key Laboratory of Biochemical Engineering, Institute of Process Engineering, Chinese Academy of Sciences, Beijing 100190, China
3
School of Chemical Engineering, University of Chinese Academy of Sciences, Beijing 100049, China
*
Authors to whom correspondence should be addressed.
These authors contributed equally to this work.
Catalysts 2025, 15(5), 477; https://doi.org/10.3390/catal15050477
Submission received: 28 March 2025 / Revised: 4 May 2025 / Accepted: 6 May 2025 / Published: 12 May 2025
(This article belongs to the Collection Catalytic Conversion and Utilization of Carbon-Based Energy)

Abstract

:
Amid global efforts toward carbon neutrality, nanoconfined catalysis has emerged as a transformative strategy to address energy transition challenges through precise regulation of catalytic microenvironments. This review systematically examines recent advancements in nanoconfined catalytic systems for carbon-based energy conversion (CO2, CH4, etc.), highlighting their unique capability to modulate electronic structures and reaction pathways via quantum confinement and interfacial effects. By categorizing their architectures into dimension-oriented frameworks (1D nanotube channels, 2D layered interfaces, 3D core-shell structures, and heterointerfaces), we reveal how geometric constraints synergize with mass/electron transfer dynamics to enhance selectivity and stability. Critical optimization strategies—including heteroatom doping to optimize active site coordination, defect engineering to lower energy barriers, and surface modification to tailor local microenvironments—are analyzed to elucidate their roles in stabilizing metastable intermediates and suppressing catalyst deactivation. We further emphasize the integration of machine learning, in situ characterization, and modular design as essential pathways to establish structure–activity correlations and accelerate industrial implementation. This work provides a multidimensional perspective bridging fundamental mechanisms with practical applications to advance carbon-neutral energy systems.

Graphical Abstract

1. Introduction

In the contemporary era, there is an indisputable and increasing prevalence of energy consumption and environmental pollution. These phenomena pose a significant challenge to the global energy structure and the preservation of the environment [1,2,3]. The warming effect of carbon dioxide (CO2) and methane (CH4) has been demonstrated to enhance the greenhouse effect by absorbing longwave radiation. This has been shown to significantly increase the frequency and intensity of extreme weather events, such as heatwaves and torrential rains. Furthermore, the release of methane from thawing permafrost in the Arctic region has been shown to create a positive feedback loop that accelerates climate warming [4]. Carbon monoxide (CO), a colorless and odorless gas, primarily originates from incomplete fuel combustion in sources such as vehicular exhaust and gas-powered appliances. Upon inhalation, it binds to hemoglobin, impeding oxygen transport and potentially resulting in headaches, unconsciousness, or even fatal outcomes. Additionally, CO is involved in photochemical reactions that generate ozone pollution and exacerbate the greenhouse effect [5,6]. Given the aforementioned circumstances, the proposal of the dual-carbon strategy (carbon peaking and carbon neutrality goals) has gained critical importance [7,8,9]. This approach has been shown to substantially impact greenhouse gas emissions, which are a significant contributing factor to global warming and climate change (e.g., glacial retreat and sea-level rise). Furthermore, it has been demonstrated that this approach can drive the energy transition by shifting from conventional fossil fuels to clean alternatives such as solar and wind power, thereby enhancing energy security. Consequently, developing efficient and low-pollution energy conversion technologies has emerged as a prominent research priority. Particular emphasis is being placed on catalytic conversion technologies for carbon-based energy systems.
Research on the catalytic conversion of carbon-based energy encompasses not only traditional thermal catalysis [10,11,12,13,14,15,16] but also emerging technologies such as photocatalysis [17,18,19,20,21,22,23,24], electrocatalysis [25,26,27,28,29], photothermal catalysis [30,31,32] and photo electrocatalysis [33,34]. These technologies offer critical pathways toward sustainable development and carbon neutrality goals by optimizing catalytic processes, enhancing energy conversion efficiency, and reducing pollutant emissions. Jeffry et al. investigated utilization technologies for greenhouse gases (e.g., CO2 and CH4), including electrochemical reduction, advanced catalyst systems, photocatalytic reduction, and plasma techniques [35]. Cai et al. modulated the interfacial properties of Cu surfaces using ionic liquids, altering CO2 electroreduction pathways and providing insights for optimizing product selectivity [36]. Yang et al. synthesized PtNPs@Th catalysts via organic doping, achieving stable CO2 electroreduction to CH4 under acidic conditions for over 100 h, thereby advancing dual-carbon strategy-compatible technologies [37]. Yu et al. demonstrated transition metal-doped ZnO as a photocatalyst for reducing carbon dioxide to methane, with an output of 1539.1 µmol g−1 h−1 and a selectivity of 90%. The integration of this photocatalyst with genetically engineered bacteria to synthesize valuable products, such as sucrose, established a sustainable carbon recycling route [38]. Hu et al. developed Co–In dual single-atom catalysts supported on C3N4 for CO2 reduction, achieving a CH4 production rate of 18.8 μmol g−1 h−1 with markedly enhanced selectivity compared to single-atom systems [39]. Zou et al. synthesized TiO2-supported Ni–Ru bimetallic catalysts with alloy and non-alloy structures for hydrogenation, revealing that the Ni–Ru system acts as an “H-atom valve” by regulating H2 spillover, enabling complete switching of CO2 hydrogenation selectivity [40]. These technologies are pivotal in achieving sustainable development and carbon neutrality goals by optimizing catalytic processes, enhancing energy conversion efficiency, and reducing pollutant emissions.
There have been substantial advancements in catalytic conversion technologies for carbon-based energy systems in recent years. These advancements can be attributed to interdisciplinary collaboration and integration, which have played a pivotal role in the emergence of novel conceptual frameworks within this domain. The concept of nanoconfined catalysis, pioneered by Xinhe Bao, refers to a catalytic mechanism that modulates catalyst electronic structures via nanoscale spatial or interfacial confinement effects, enabling precise control over reaction pathways and product selectivity [41]. Its core principle is leveraging quantum effects and microenvironment synergies to stabilize active sites and optimize intermediate adsorption energy, thereby markedly enhancing catalytic efficiency and selectivity [42,43,44,45,46,47,48,49]. Extensive research on nanoconfined catalysis has been conducted, with Web of Science data indicating a steady increase in publications concerning the development of nanoconfined catalysts for converting CO2 and CH4 into high-value chemicals (Figure 1a). For instance, Fan et al. achieved efficient room-temperature methane conversion to liquid C1 oxygenates by confining Cu atoms within ultrathin Ru nanosheets, with detailed reaction mechanisms elucidated [50]. He et al. developed thermally stable sub-2 nm Ni nanoparticles confined in SBA-15 mesochannels through combined surface hydroxyl modification and pore confinement strategies, addressing Ni catalyst deactivation via sintering and insufficient active site exposure in dry methane reforming [51]. Mo et al. confined the Ru3–SCs in Ni–PCN (porous carbon nitride)-222-PyrA by using the pre-coordination confinement strategy, and the resulting complex can efficiently electrocatalyze the reduction of CO2 to CH4 [52]. Lv et al. revealed that Cu–MOR catalysts synthesized via ion exchange contain elevated levels of zeolite-confined Cu2+ species, which synergize with non-thermal plasma to enhance direct methane oxidation to methanol [53]. Lu et al. designed Ag@Cu2O cascade nanoreactors with tunable shell thickness for CO2 reduction, demonstrating that moderate shell thickness optimizes CO diffusion and confinement effects to boost C2 product selectivity [54].
The literal interpretation of “confinement” typically evokes images of active catalytic components spatially confined within defined boundaries or reactant molecules isolated in specific microenvironments. Previously, Jiao et al. summarized the achievements of Professor Xinhe Bao’s research group in the field of nanoconfined catalysis and divided the framework of nanoconfined catalysis into four parts: 0D, 1D, 2D, and interface [41]. However, numerous studies on confined catalysis, although not explicitly framed in terms of “nanoconfined catalysis”, inherently fall under this category. To better illustrate the outstanding contributions of researchers worldwide in this field, we further categorized these systems into four classes based on dimensional classification: 1D, 2D, 3D, and interfacial nanoconfined catalysis. Yang’s team employed a Random Forest model combined with Grand Canonical Monte Carlo simulations, revealing that in carbon nanotube (CNT)-confined catalysis, shortened catalyst bond lengths lead to weakened binding energy and a downshift of the d-band center, elucidating the mechanism behind activity enhancement or suppression [55]. Fan’s team designed a C/Cu/C sandwich-structured catalyst using a bidirectional freezing and freeze-drying method. By utilizing the two-dimensional nanoconfinement effect to confine the free diffusion of CO intermediates between the layers, this structure enhances their local concentration and promotes C–C coupling, thereby doubling the selectivity for converting CO2 into C2 products in electrocatalysis [56]. Xie achieved more effective confinement of AuCu bimetallic nanoparticles within (ethylene diamine tetraacetic acid) EDTA-modified UiO-66 (a typical MOF (metal organic framework)) by utilizing MOF channels to restrict metal growth, significantly reducing the particle size and enriching the oxygen vacancies, thereby enhancing the catalytic activity for CO2 hydrogenation to methanol with a 3.21-fold improvement in methanol space-time yield [57]. Wang’s team induced the spontaneous dispersion of In2O3 nanoparticles into ultrathin InOx layers on TiO2 surfaces, forming In–O–Ti bonds while suppressing the over-reduction of In2O3 to metallic In. This strategy significantly enhanced the catalytic stability of CO2 hydrogenation (over 20-fold) and demonstrated the universality of the interface confinement effect across diverse oxide supports [58].
A considerable volume of research has been undertaken in recent years on various nanoconfined catalytic materials. The search for new nanoconfined catalytic materials with superior functionality remains a primary focus in the domain of carbon reduction capacity. In this review, we mainly introduced the recent progress of nanoconfined catalysts in CO2, CH4 conversion. The nanoconfined catalysts were classified and summarized from the dimensional perspective, and their characteristics were introduced. The synthesis and improvement strategies of various nanoconfined catalysts were discussed. Finally, the challenges faced by nanoconfined catalysts and their prospects for the future are summarized (Figure 1b).

2. Nanoconfined Catalysis

Xinhe Bao proposed the concept of “nanoconfined catalysis”, which establishes intrinsic correlations between catalyst structure, properties, and catalytic performance within spatially confined nanodomains. The confinement effect can be conceptually understood as a spatial phenomenon where nanocavities impose geometric constraints on guest molecules. Furthermore, electronic interactions or interface bonding between the nanocavity wall and the guest can regulate their atomic and electronic structures. This results in the formation of metastable structures that exhibit enhanced reactivity. Associated microenvironmental effects encompass the mass transfer effect, metal size effect, void confinement effect, spatial compartmentation effect, and surface modification effect [59].
Analyzing nanoconfined catalytic structures and properties often requires characterization tools. Scanning electron microscope-energy dispersive spectroscopy (SEM-EDS) provides high-resolution surface morphology analysis, combined with energy-dispersive spectroscopy for rapid detection of elemental composition and distribution, making it applicable for observing particle morphology, size, and surface elemental distribution. Transmission electron microscope (TEM) utilizes electron beam penetration to reveal nanoscale crystal structures, lattice arrangements, defects, and interfacial characteristics. The integration of these techniques comprehensively analyzes the microstructure, chemical composition, and physical properties of materials, offering critical data support for material design, performance optimization, and nanotechnology research. Above all, these characterization tools can detect the particle size distribution of metal nanoparticles, which directly influences the density of catalytic active sites. A uniform distribution optimizes surface atom utilization, enhancing reaction selectivity and efficiency. Simultaneously, uniformity strengthens structural stability, reduces sintering, and ensures efficient mass transfer and electron transport in nanoconfined environments.

2.1. One-Dimensional Nanoconfined Catalysis

1D nanoconfined catalysis refers to catalytic reactions occurring within longitudinally nanostructured confined spaces (e.g., nanotubes, nanochannels), where spatial confinement regulates electron dynamics and reactant mass transport to enhance catalytic performance. The fundamental principle underlying this phenomenon pertains to the observation that the nanoconfined space, typically measured in nanometers, exerts a profound influence on the electronic structure of the catalyst. This influence is manifested through the imposition of geometrical constraints, forming a built-in electric field. The consequence of this field is the promotion of photogenerated carrier separation, a process that is particularly salient in photocatalytic systems. Concurrently, the electric field exerts a nanoconfined influence on the migration and agglomeration of the metal nanoparticles, thereby ensuring the maintenance of a high dispersion of the active sites. Generally, one-dimensional nanoconfined catalysis has three characteristics: directed mass transfer, electron regulation, and confined enrichment [60,61,62].
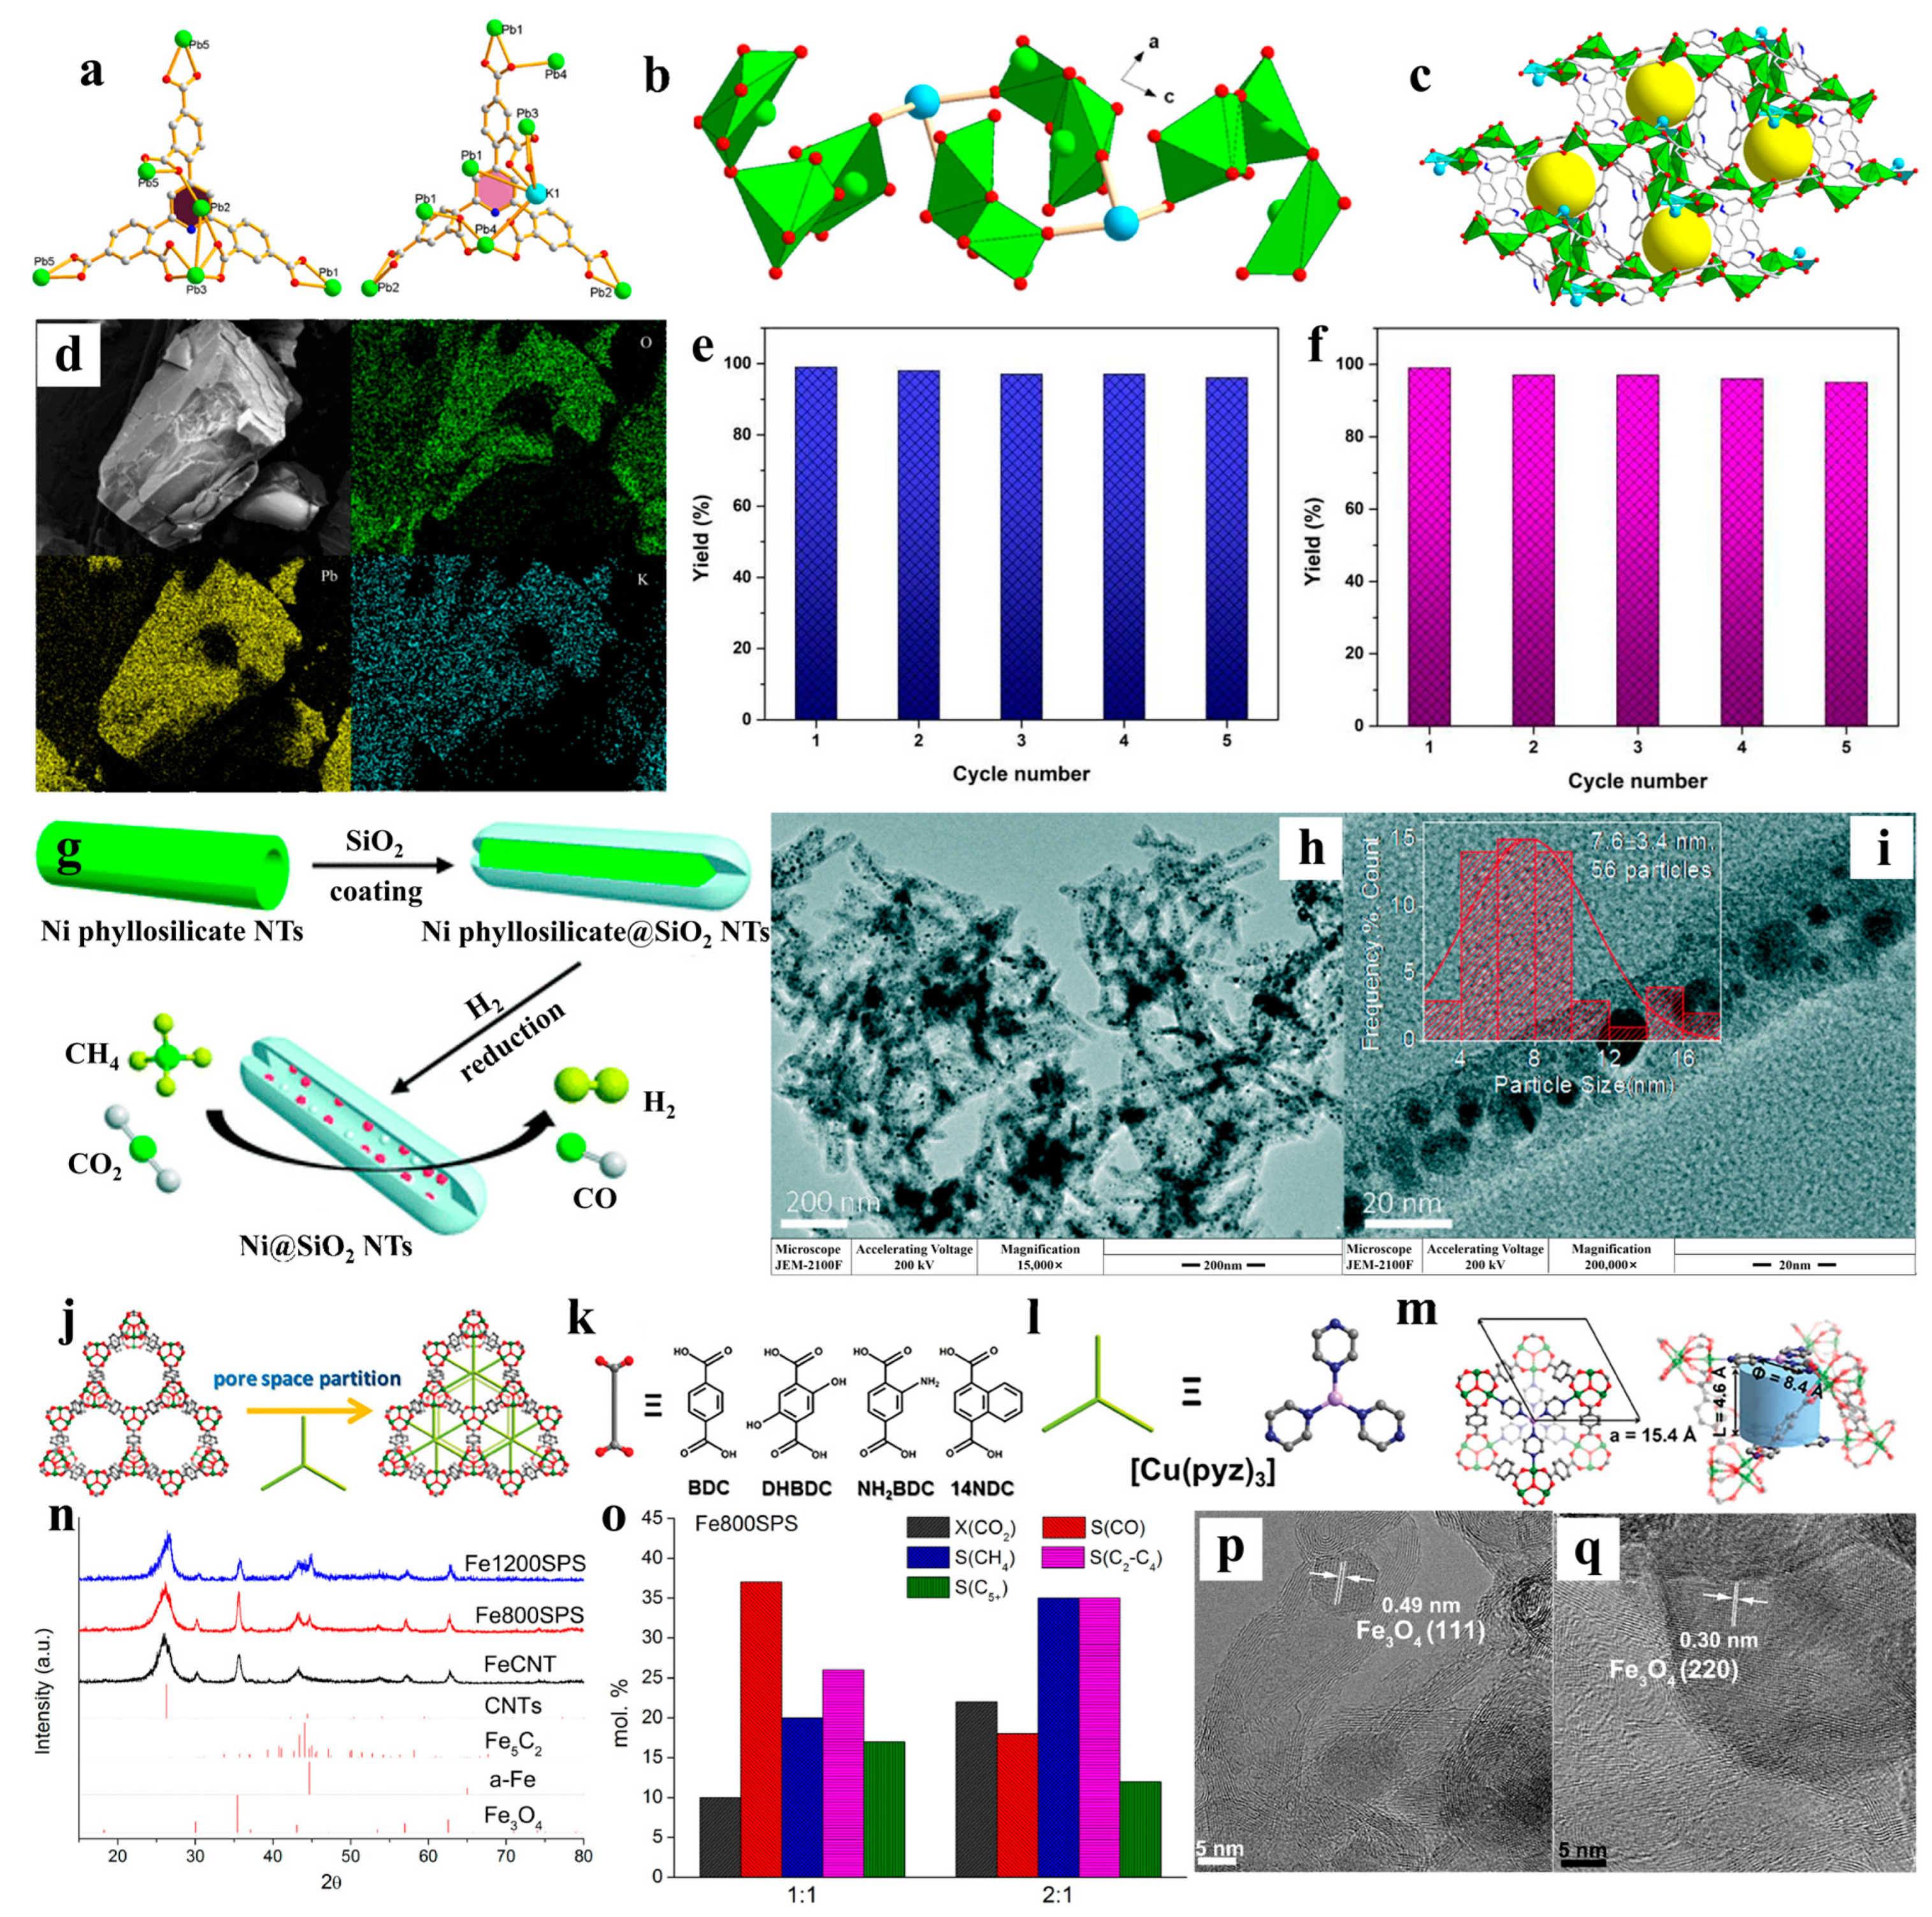
One-dimensional nanoconfined structures synergistically modulate active site microenvironments via spatial confinement effects, significantly enhancing catalytic stability, anti-sintering resistance, and substrate-selective activation capabilities, thereby offering a universal strategy for designing efficient heterogeneous catalysts. Therefore, Liu et al. developed a bifunctional Pb-K metal–organic framework (NUC-45) constructed from S-shaped [Pb10K22-OH)2(COO)24] clusters, featuring 1D open channels along the a-axis [63]. The NUC-45 architecture comprises robust 3D frameworks formed by {Pb10K2} clusters and TDP6− ligands, where each cluster is encircled by five quasi-rectangular 1D channels (Figure 2a–c). This 1D confinement system enhances catalytic performance by enriching Lewis acid sites (Pb2+, K+) and basic sites (μ2-OH, pyridinic N) within the nanochannels, creating synergistic catalytic microenvironments. SEM-EDS analysis confirmed the morphological characteristics of the synthesized crystals (Figure 2d). Physical confinement in the 1D architecture stabilizes reaction intermediates, endowing the catalyst with exceptional cyclability in CO2-epoxide cycloaddition and Knoevenagel condensation reactions (Figure 2e,f). Li et al. achieved precise confinement of Ni nanoparticles within SiO2 nanotubes via a core-shell design strategy [64]. The researchers successfully constructed NiPhy@SiO2 core-shell one-dimensional nanotubes by using nickel-layered silicate (NiPhy) nanotubes as structural templates and coating SiO2 shell layers on their surfaces. During the subsequent reduction process by high-temperature heat treatment, the thermal decomposition reaction of the NiPhy core layer occurred, generating nickel metal nanoparticles with a uniform particle size, which were confined inside the one-dimensional channels of the SiO2 nanotubes (Figure 2g). Combined physical confinement by SiO2 walls and in situ formed SiO2 nanoparticles effectively suppressed Ni migration and sintering while strengthening metal-support interactions. The confined structure demonstrated remarkable anti-sintering and coking resistance during dry methane reforming, with 7.6 nm Ni nanoparticles uniformly distributed in SiO2 channels and minimal carbon deposition after 70 h operation (Figure 2h,i). Xue et al. engineered SNNU-33s materials with 4.6 Å 1D confined pores by incorporating C3-symmetric [Cu(pyz)3] units into MIL-88-type MOF channels through pore-space partitioning (Figure 2j–m) [65]. The synergy between confinement effects and Cu+ π-complexation markedly improved selective adsorption of unsaturated hydrocarbons. Hydroxyl-functionalized SNNU-33b demonstrated an ideal adsorption solution theoretical selectivity value of 597.4 for C2H2/CH4, confirming its exceptional dynamic separation performance. Sergei A. Chernyak et al. developed a 1D confined catalysis system for CO2 hydrogenation via spark plasma sintering (SPS) densification of Fe oxide-decorated carbon nanotubes (CNTs) [66]. XRD analysis revealed confinement-enhanced metal-support interactions that facilitated Fe carburization into active χ-Fe5C2 phases (Figure 2n). Concurrently, carbon shells stabilized nanoparticles and optimized CO intermediate diffusion/activation (Figure 2o). TEM imaging demonstrated that dense CNT frameworks physically suppressed Fe sintering, ensuring catalytic stability (Figure 2p,q).
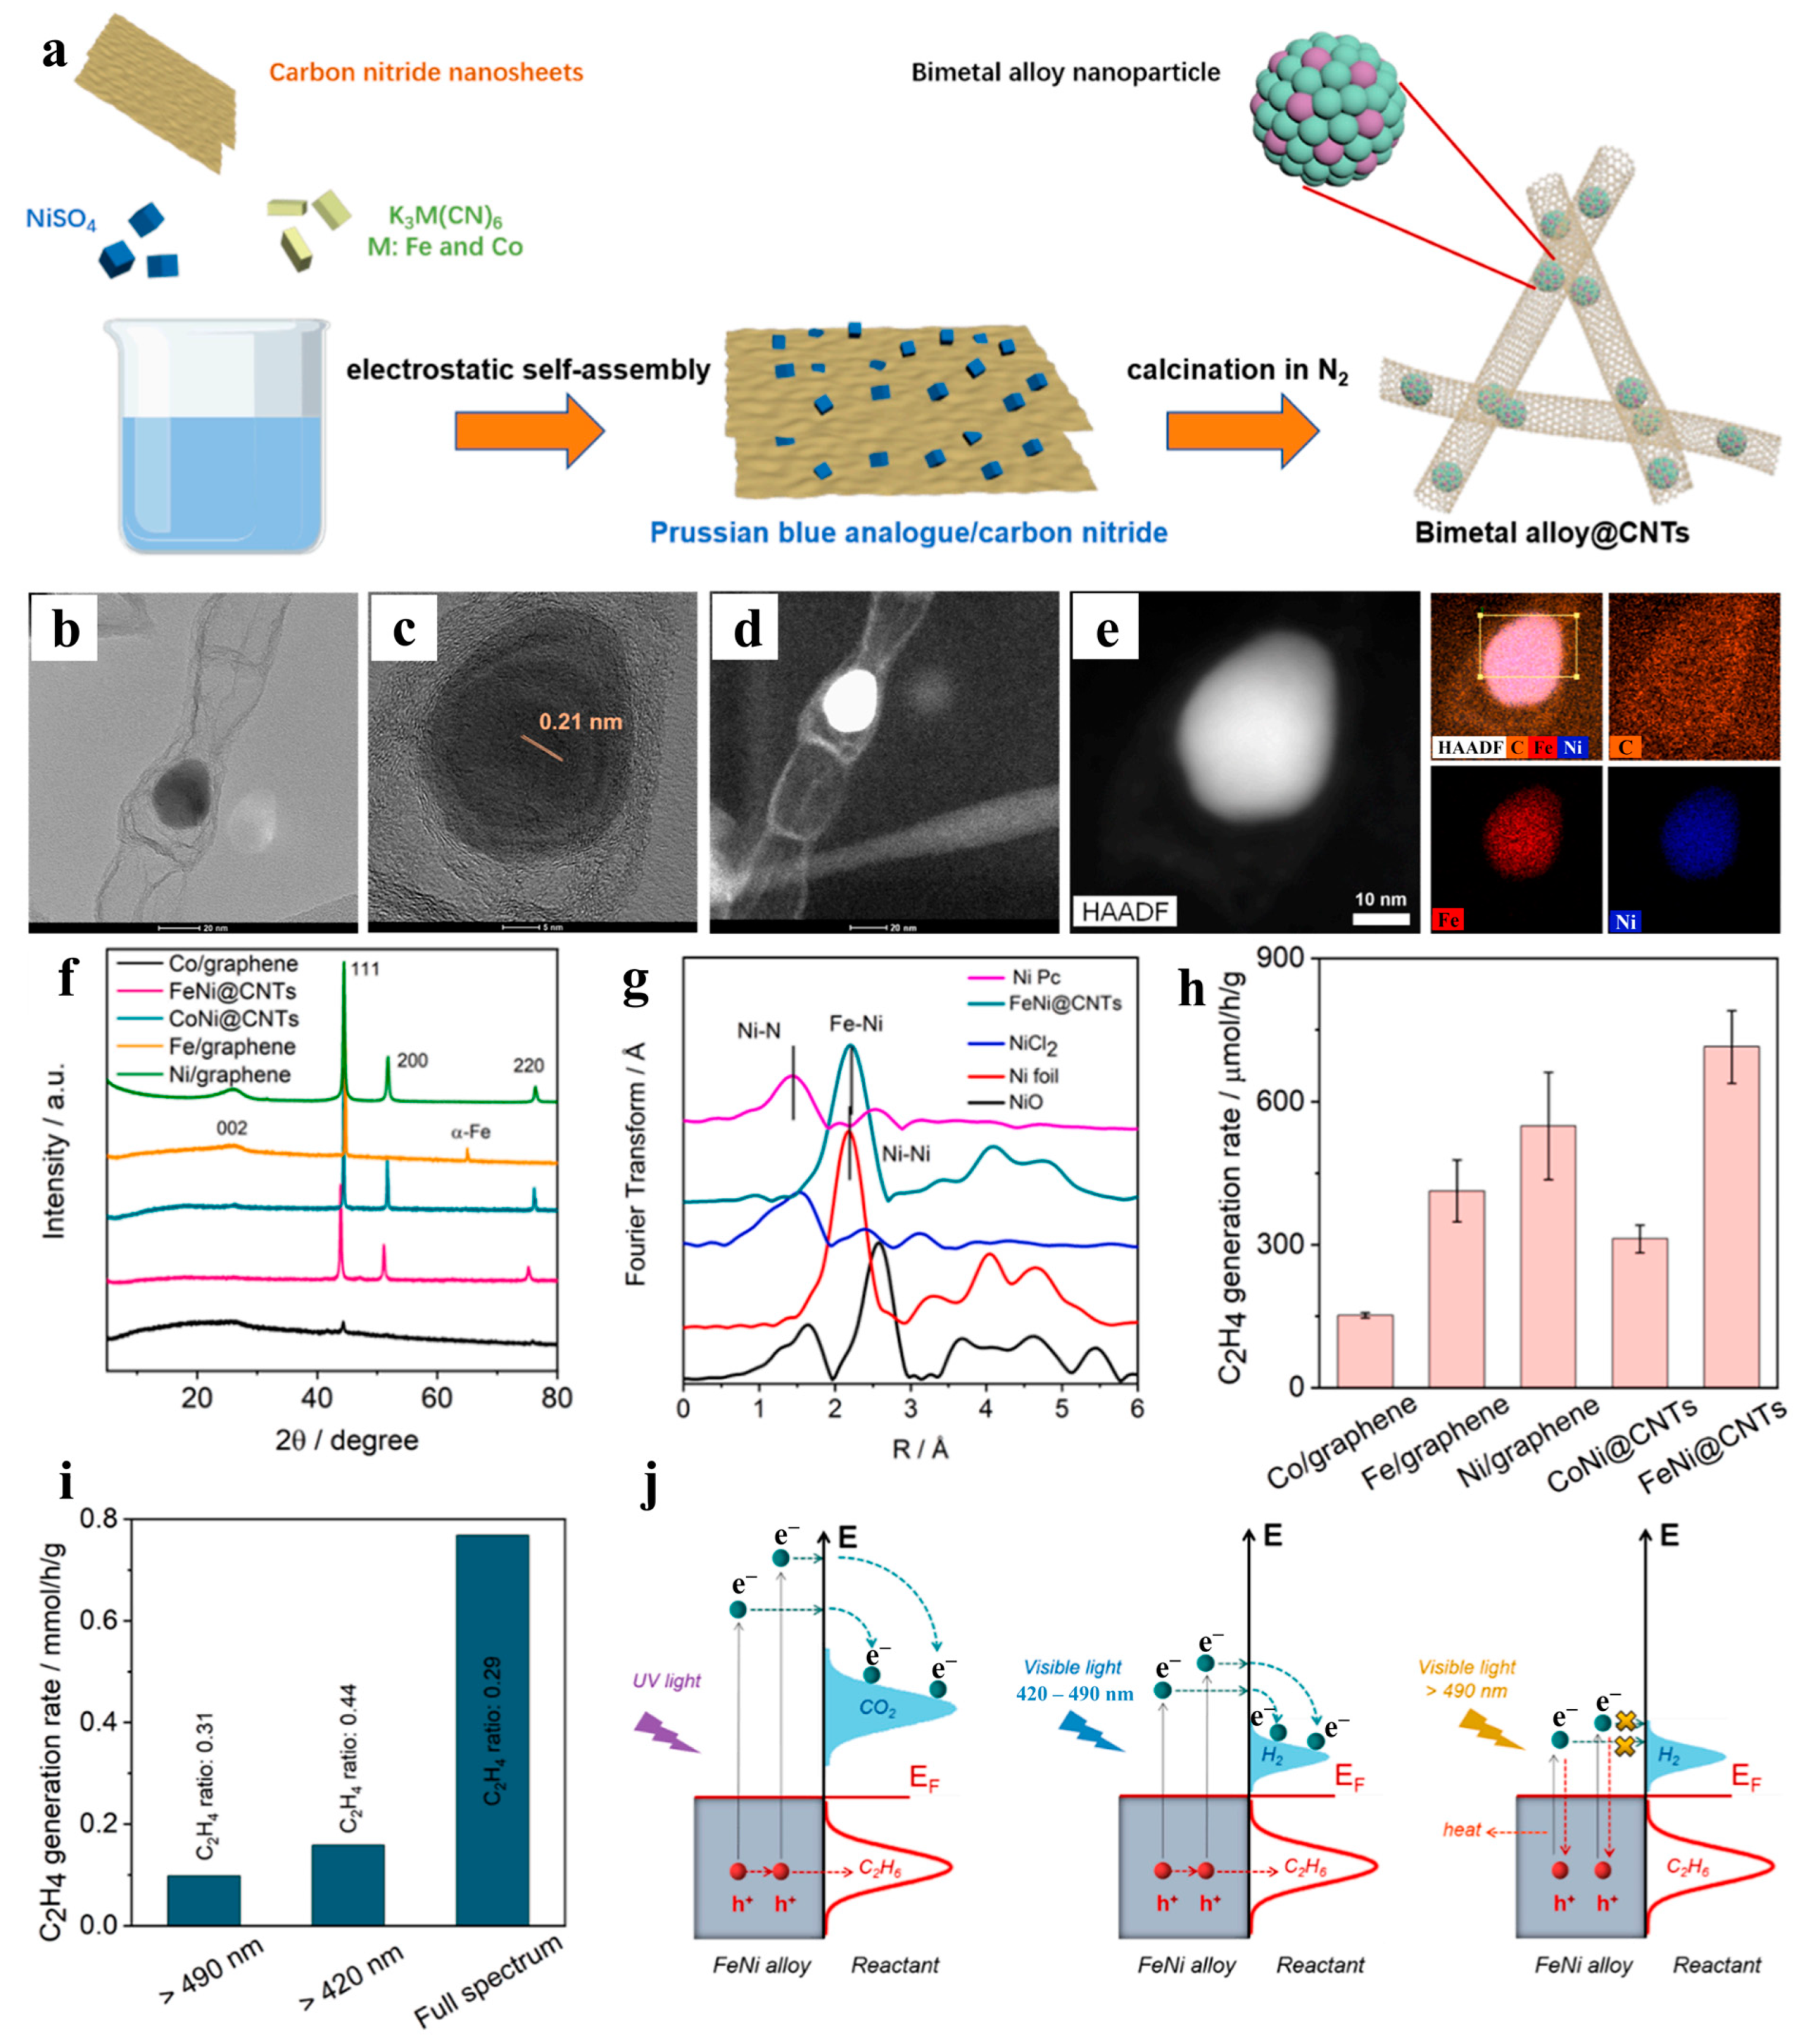
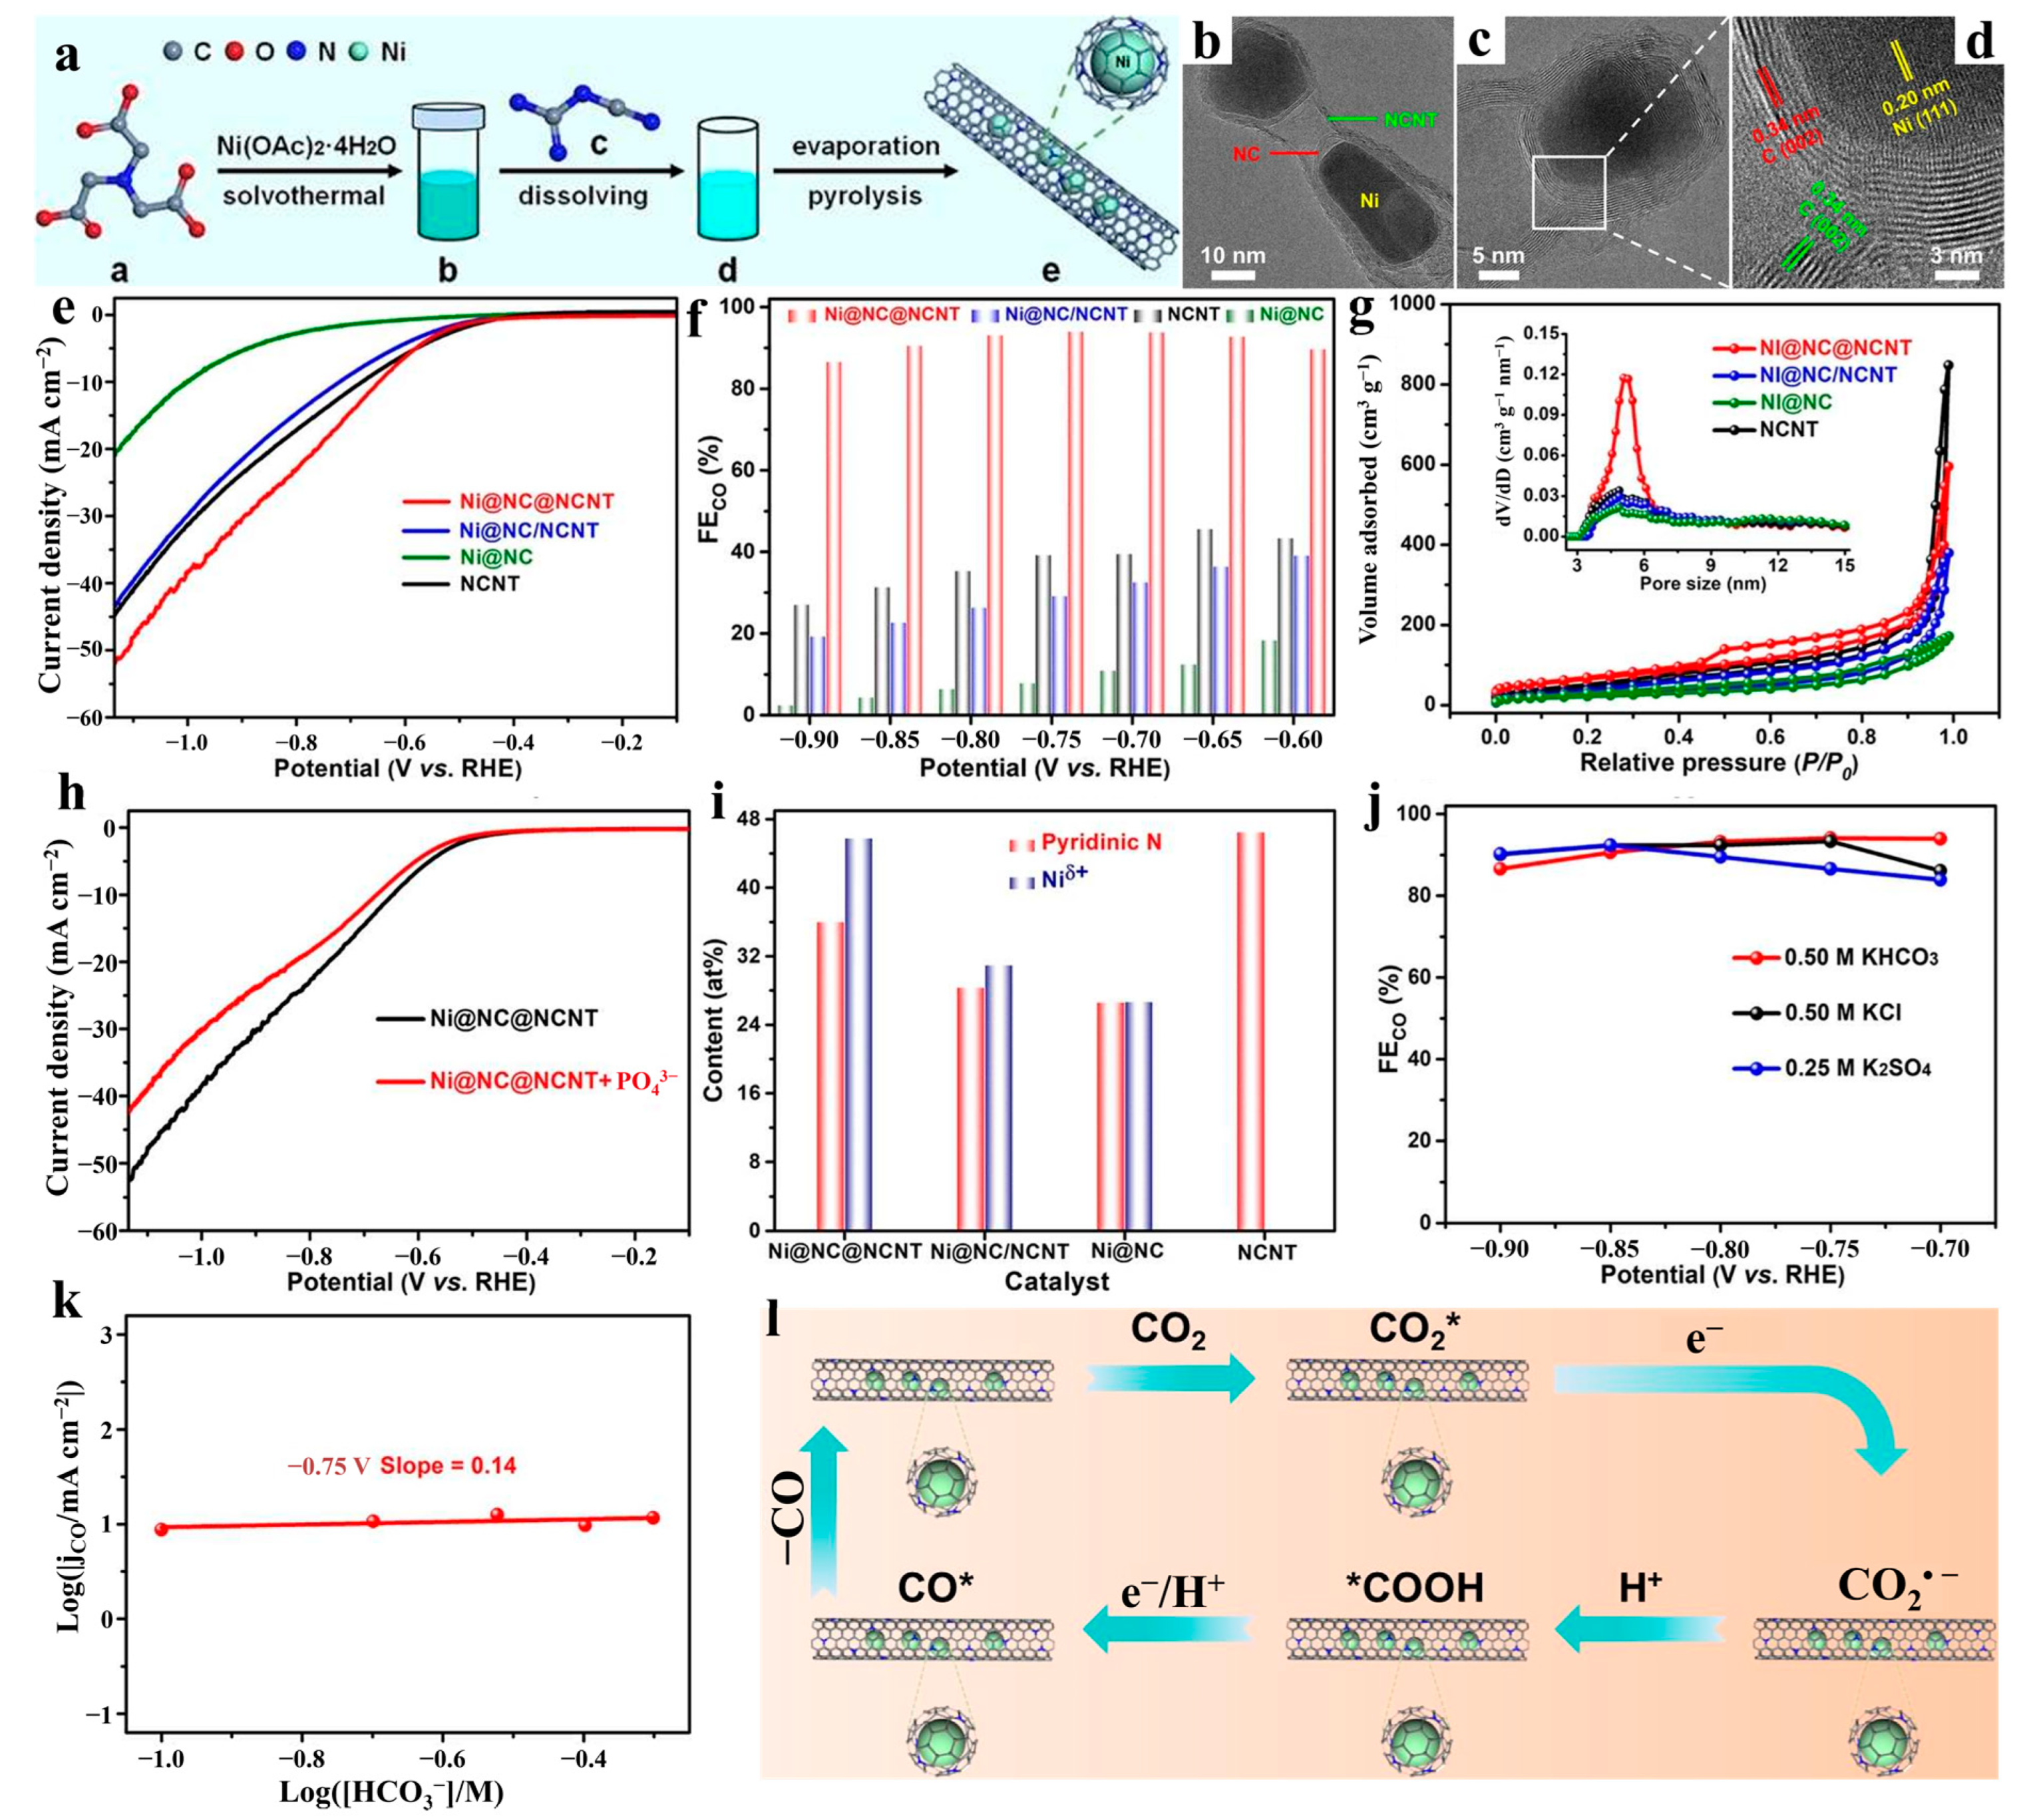
The Zhang team developed a carbon nanotube (CNT)-confined bimetallic alloy catalyst (FeNi@CNTs) for the photothermal catalytic oxidative dehydrogenation of ethane with CO2 (ODEC) to efficiently produce ethylene [67]. First, Prussian blue analog (PBA) precursors were electrostatically self-assembled on carbon nitride (C3N4) nanosheets. The PBA/C3N4 precursor was then calcined under a N2 atmosphere, enabling carbothermal reduction and directional growth of CNTs to form CNT-encapsulated alloy nanoparticles (FeNi) (Figure 3a). Transmission electron microscopy (TEM) revealed FeNi alloy nanoparticles (~20 nm in size) confined within bamboo-like CNTs, with a lattice spacing of 0.21 nm corresponding to the (111) crystal plane of the FeNi alloy (Figure 3b–e). XRD patterns showed a shifted (111) diffraction peak at 43.87° for FeNi@CNTs compared to the monometallic Ni (111) peak at 44.28°, further confirming FeNi alloy formation (Figure 3f). Extended X-ray absorption fine structure (EXAFS) analysis verified the presence of Ni–Fe bonds (bond length: 2.2 Å) in the alloy (Figure 3g). Performance tests demonstrated that the FeNi@CNTs achieved an ethylene production rate of 768 μmol/h/g, significantly surpassing monometallic and other bimetallic catalysts (Figure 3h). The researchers also investigated the wavelength-dependent selectivity of the catalyst (Figure 3i,j). Experimental results and simulations revealed that UV light excitation generated high-energy hot carriers, driving CO2 reduction and ethane oxidative dehydrogenation. Visible light in the 420–490 nm range promoted non-oxidative dehydrogenation to ethylene, while light >490 nm caused hot carrier decay into thermal energy, predominantly triggering ethane cracking to CH4. Niu et al. [68] reported a dual-chainmail-structured Ni-based catalyst (Ni@NC@NCNT), where Ni nanoparticles were doubly encapsulated by N-doped carbon layers and carbon nanotubes, synthesized via a solvothermal–evaporation–calcination method for efficient and stable CO2 electroreduction to CO (Figure 4a). High-resolution TEM images revealed that Ni particles were wrapped by carbon layers (2–3 nm) and carbon nanotube walls (4–5 nm), with lattice fringes corresponding to graphitic carbon (0.34 nm) and metallic Ni (0.20 nm), confirming the dual-chainmail structure (Figure 4b–d). Performance analysis showed that linear sweep voltammetry (LSV) curves achieved a high current density of 48.0 mA cm−2 at −1.10 V in CO2-saturated electrolyte (Figure 4e). Ni@NC@NCNT exhibited a CO Faradaic efficiency of 94.1% at −0.75 V (Figure 4f). Structurally, the catalyst possessed a high specific surface area (240.4 m2/g) and abundant pyridinic N active sites (Figure 4g–i). From the nanoconfinement perspective, the negligible difference in FECO (Faradaic efficiency) between buffered and unbuffered electrolytes confirmed that the nanotube confinement effect maintained a local high pH to suppress hydrogen evolution reactions (HERs) (Figure 4j). When investigating the CO2 reaction pathway, the near-zero reaction order of HCO3 indicated that protons derived from HCO3 were not involved in the rate-determining step (Figure 4k). Thus, the reaction proceeds through a stepwise electron-proton process to form *COOH, followed by a second electron–proton step releasing CO, with the initial proton-decoupled single-electron process identified as the rate-determining step (Figure 4l).

2.2. Two-Dimensional Nanoconfined Catalysis

2D nanoconfined catalysis involves catalytic reactions within nanoscale-confined spaces at interlayers or interfaces of two-dimensional materials (e.g., nanosheets, graphene, transition metal dichalcogenides), governed by geometric confinement and electronic modulation principles. The confinement of active sites (e.g., metal clusters, single atoms) within two-dimensional interlayers has been demonstrated to stabilize reaction intermediates through geometric constraints while concomitantly suppressing component aggregation. Concurrently, the modulation of the electronic structure via d-band center adjustment and the formation of a built-in electric field has been shown to enhance electron transfer efficiency. This is exemplified by graphene overlayer–substrate interactions, which optimize intermediate adsorption through electron tunneling effects. The following four points concisely summarize the characteristics of 2D nanoconfined catalysis: directed mass transfer and efficient diffusion, electronic structure modulation, high stability, and intermediate stabilization and selectivity enhancement [69,70,71].
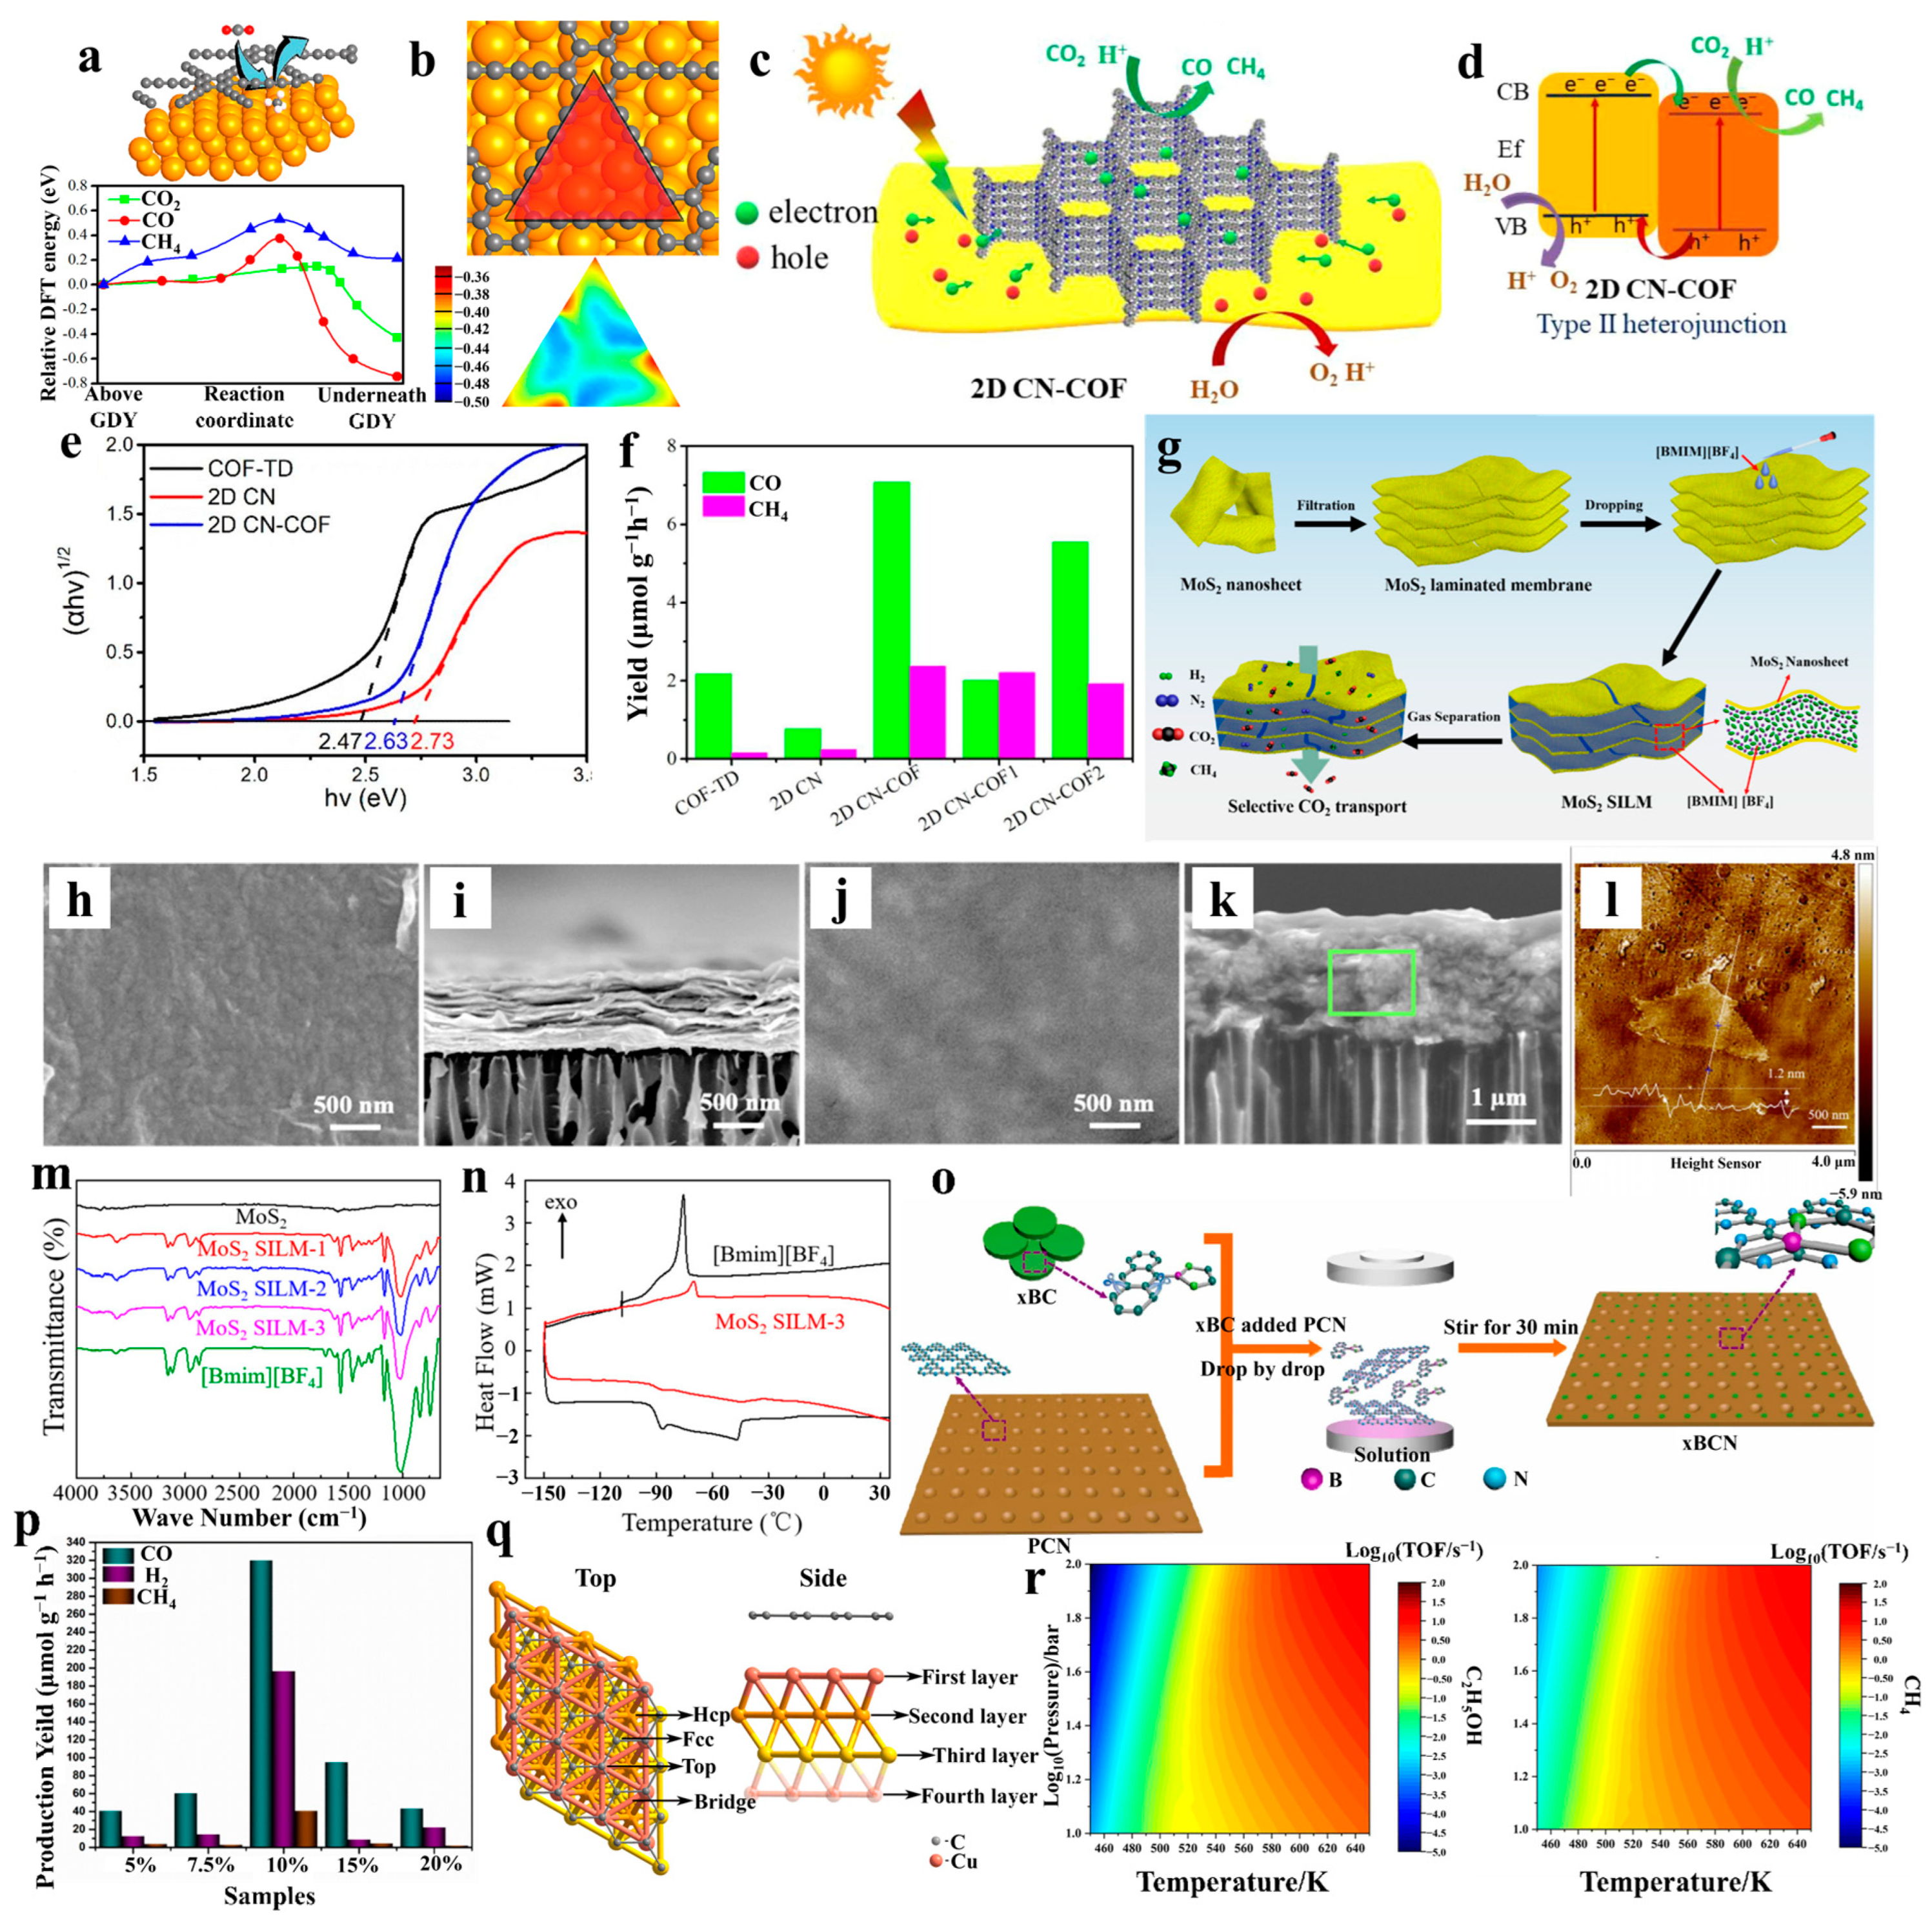
Two-dimensional nanoconfined structures achieve precise modulation of active site microenvironments through the synergistic interplay of spatial constraints and electronic state coupling, significantly enhancing catalytic reaction kinetics, product selectivity, and mass transfer behaviors, thereby offering multi-scale cooperative strategies for optimizing energy–mass transport and conversion efficiency in heterogeneous catalytic systems. Consequently, Li et al. pioneered and experimentally validated the novel concept of overlayer-confined catalysis using 2D materials [72]. Density functional theory (DFT) calculations on graphene/Pt(111) systems revealed that confined spaces between 2D overlayers and metal surfaces reduce adsorption energies (e.g., CO adsorption by 0.44 eV) through combined geometric constraints and confinement field effects. Chen et al. investigated graphdiyne (GDY)-coated copper surfaces for enhanced CO2 electroreduction under 2D confinement conditions [73]. DFT analysis demonstrated that GDY–Cu interfacial confinement lowers the free energies of key intermediates (COOH* and CHO*), significantly boosting catalytic activity. Meanwhile, analysis of the density-functional energy distribution and DFT potential energy surface maps indicates that CO2 crosses the GDY with a low potential barrier (0.15 eV) and is stable at room temperature. In addition, CO escapes with a high potential barrier (1.12 eV), while CH4 escapes easily with a low potential barrier (0.31 eV). Furthermore, the GDY pores promote efficient CO2 reduction (Figure 5a,b). Song et al. developed an all-organic 2D CN-COF-TD heterojunction catalyst for efficient photocatalytic CO2 reduction [74]. The two-dimensional nanoconfined domain effect plays a pivotal role in this system: the layered structure of 2D CN provides a high specific surface and abundant active sites, while the microporous structure of COF-TD promotes CO2 adsorption and activation through spatial nanoconfinement (Figure 5c). The van der Waals force-driven heterojunction interface has been demonstrated to form a tight π–π stack. This has been shown to significantly enhance the photogenerated carrier separation efficiency. In addition, the nanoconfined effect has been shown to shorten the charge migration path and reduce the complexation rate (Figure 5d). Experimental evidence demonstrated that the heterojunction band gap is reduced to 2.63 eV, the visible light response range is expanded, and the CO yield is enhanced by 9.2-fold compared with that of a single component (Figure 5e,f). Chen et al. demonstrated a 2D confinement-based membrane technology for efficient CO2 separation [75]. The researchers subjected MoS2 nanosheets to a chemical exfoliation process, subsequently assembling them into lamellar membranes through vacuum filtration. Thereafter, they infiltrated ionic liquids [BMIM][BF4] into the two-dimensional channels of MoS2 (Figure 5g). SEM revealed a lamellar stacked structure of a MoS2 membrane with interlayer expansion and surface continuity after infiltration of ionic liquid, thereby demonstrating the successful filling of the two-dimensional channels (Figure 5h–k). Atomic force microscopy was utilized to ascertain the thickness of the monolayer of MoS2, which was found to be approximately 1.2 nm, thereby confirming the efficacy of the exfoliation process (Figure 5l). Experimental findings have demonstrated that the solidification point of the ionic liquid within a nanoconfined environment is elevated, and the vibrational spectra exhibit a shift, indicating a robust interaction with the MoS2 interface (Figure 5m,n). Fu et al. engineered all-organic 0D/2D heterostructures to harness 2D nanoconfinement effects for photocatalytic CO2 reduction [76]. The researchers utilized an ultrasonication technique to amalgamate porous g-C3N4 with xBC ethanol solution, followed by stirring and centrifugation, and subsequently dried to yield 0D/2D heterojunctions (Figure 5o). The synergistic effect of the 2D nanoconfined environment and molecular-level structural modulation resulted in a CO yield of 2BCN that was up to 23.9 times that of PCN. Furthermore, the photocatalytic activity of the 2BCN samples did not increase with an increase in 2BC loading, thereby revealing the precise modulation mechanism of the 2D material-nanoconfined effect on the electronic microenvironment of the active site of the quantum dots (Figure 5p). Wei et al. investigated syngas conversion mechanisms at graphene-confined Cu(111) interfaces [77]. The proposed structural model of graphene-covered Cu(111) interfaces provides a geometrical explanation of the two central mechanisms in 2D nanoconfined interfaces: the electron transfer effect, which is manifested in the unidirectional charge redistribution from graphene to the Cu substrate; and the spatial confinement effect, whose mechanism of action stems from the physical nanoconfinement of the orientational degrees of freedom of the reactive intermediates and the diffusion paths (Figure 5q). The turnover frequency (TOF) for CH4 generation at 530 K demonstrated a consistent 2.5-fold enhancement over C2H5OH with increasing pressure, while gradual convergence was observed with rising temperature. This trend was accompanied by a monotonic TOF decline above the threshold pressure of 32 bar, revealing mass-transport constraints imposed by nanoconfinement effects (Figure 5r).
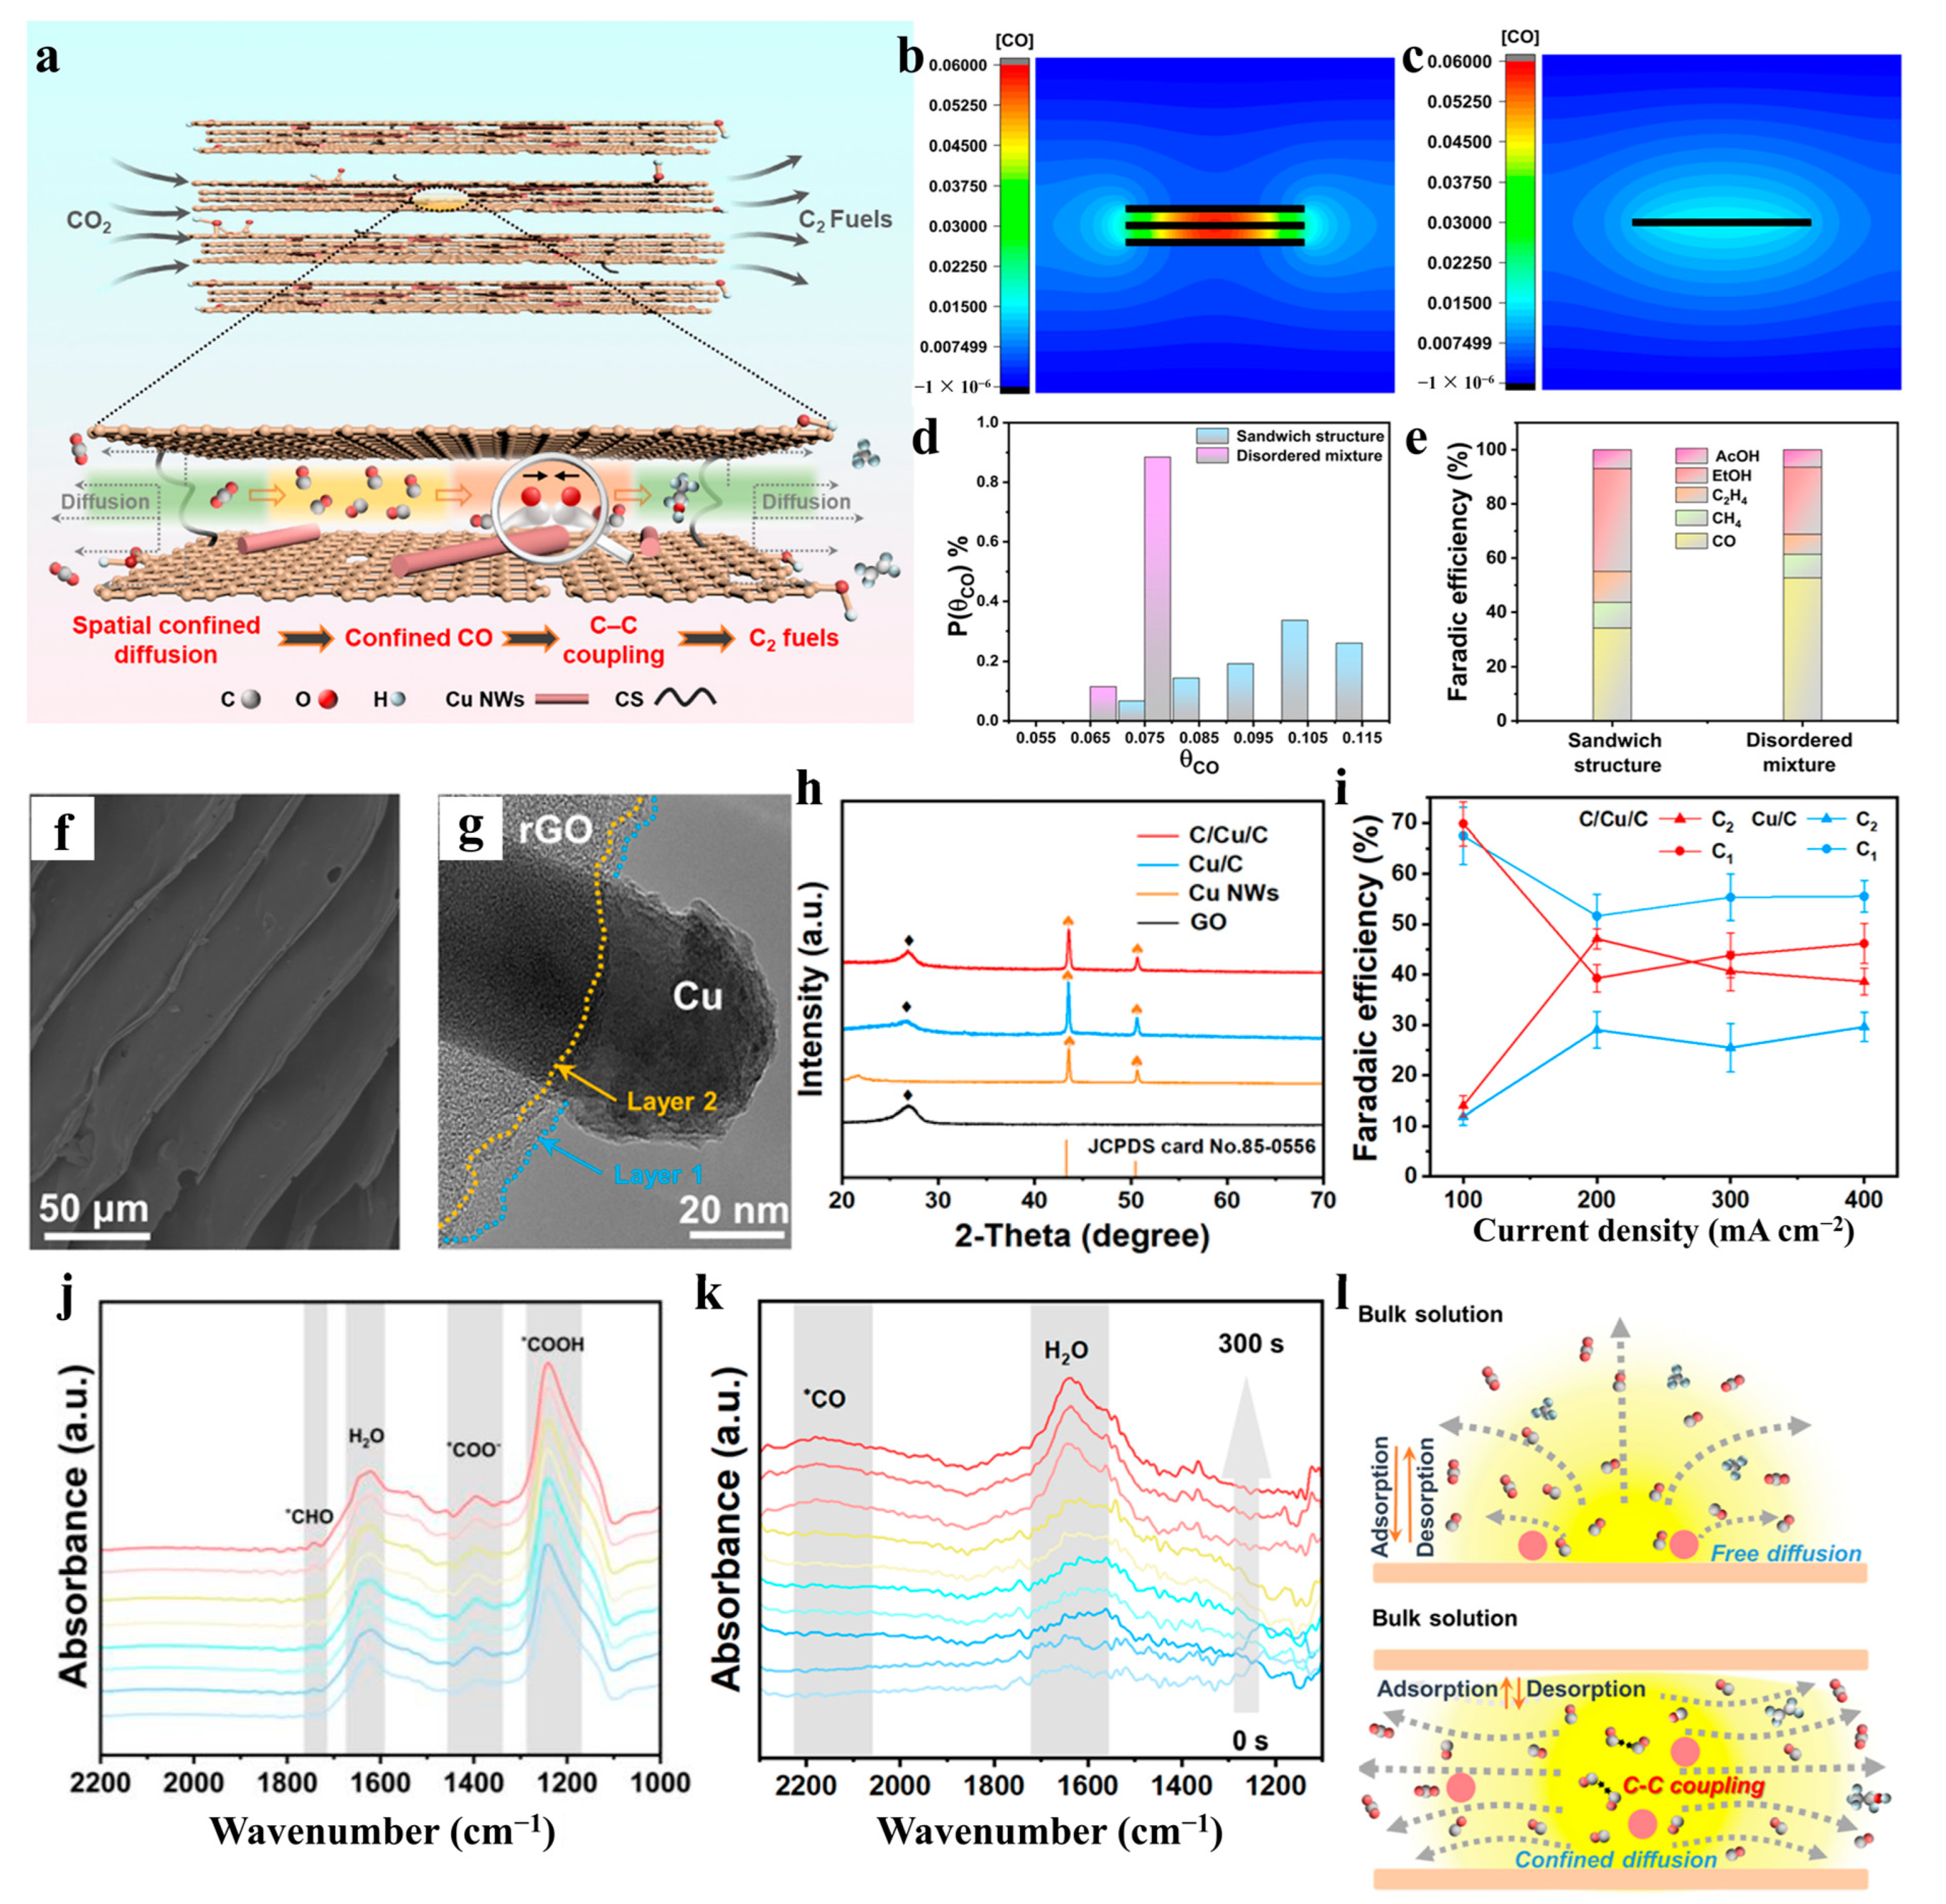
Fan et al. [56] reported a novel sandwich-structured catalyst (C/Cu/C) prepared via a bidirectional freezing-freeze-drying method, which features reduced graphene oxide (rGO)-encapsulated Cu nanowires in a layered architecture for efficient electrocatalytic CO2 conversion to C2 products (Figure 6a). The rGO layers form a physical barrier to restrict the free diffusion of *CO intermediates, significantly enhancing their local concentration compared to disordered mixtures, thereby promoting C–C coupling to generate C2 products (e.g., ethanol, ethylene) (Figure 6b–e). SEM and TEM images revealed the layered arrangement and porous structure of the sandwich architecture, with nanosized Cu uniformly embedded between rGO layers (Figure 6f,g). XRD patterns confirmed the presence of rGO (broad peak at ~27°) and the (111) crystal plane of Cu (2θ = 43.3°), further verifying the sandwich structure (Figure 6h). The catalyst achieved a C2 Faradaic efficiency (FE) of 47% at 200 mA cm−2, nearly double that of the disordered mixture (25%) (Figure 6i). In situ FTIR spectra showed a distinct *CO characteristic peak at 2146 cm−1 for the sandwich structure, indicating *CO enrichment, whereas the disordered mixture exhibited a *CHO peak at 1742 cm−1, corresponding to increased CH4 production (Figure 6j,k). These characterizations collectively demonstrated that in disordered mixtures, *CO freely diffused into the electrolyte bulk, while in the sandwich structure, *CO was confined between layers, facilitating C–C coupling for enhanced C2 product formation (Figure 6l).

2.3. Three-Dimensional Nanoconfined Catalysis

Three-dimensional nanoconfined catalysis is a catalytic reaction in a nanoconfined space characterized by a porous or layered structure. Examples of such structures include a three-dimensional porous membrane or a nanoparticle-filled system. The electronic structure and reaction mass-transfer pathway are regulated by the three-dimensional spatial confinement effect and interfacial synergism, thereby achieving efficient and precise catalytic performance. The fundamental principle underlying this phenomenon pertains to the observation that the three-dimensional nanoconfined space (e.g., nanopores, interlayer channels) exerts a significant influence on the electronic energy states (e.g., valence electron orbital properties) of the catalysts. This influence is facilitated by geometric constraints, resulting in the formation of a localized high-concentration reaction environment. Concurrently, this process reduces the migration distance of free radicals and stabilizes the active sites. The characteristics of 3D nanoconfined domain catalysis can be summarized as follows: electronic structure modulation, high specific surface area and mass transfer optimization, spatial stabilization, and efficient radical utilization [78,79,80,81,82,83].
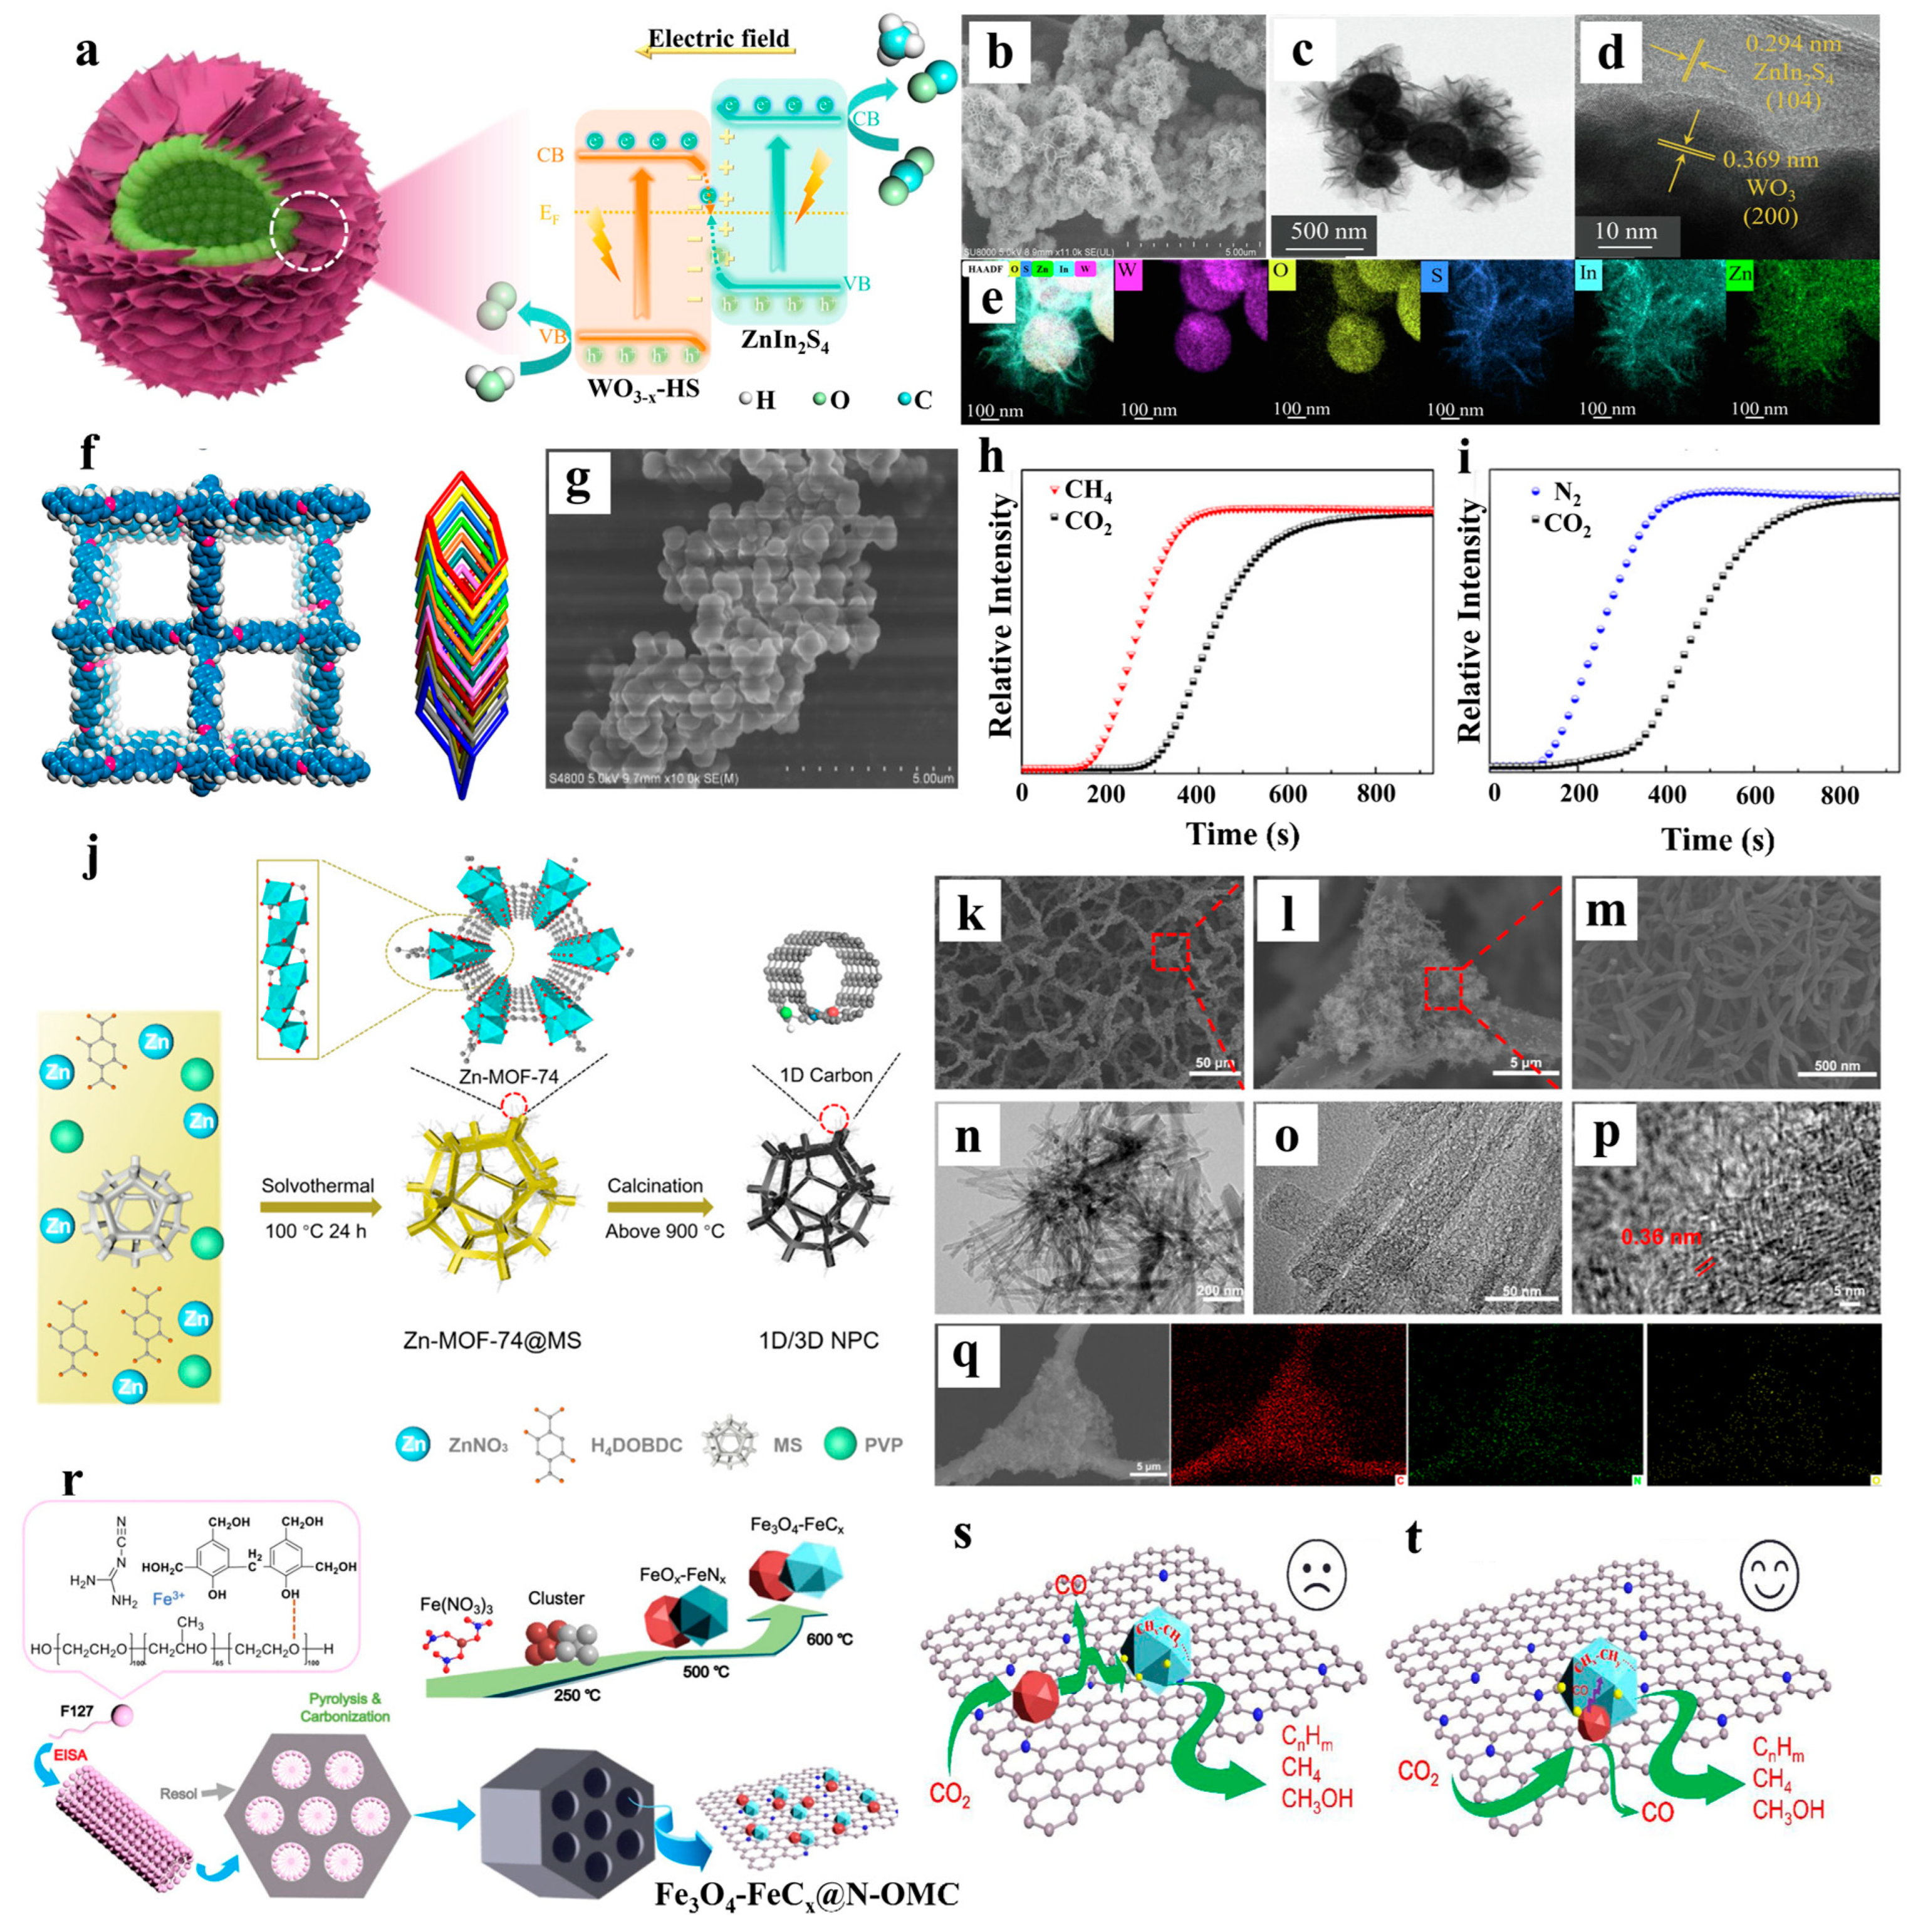
Three-dimensional nanoconfined catalysis optimizes interfacial and pore characteristics through microstructural modulation, significantly enhancing gas conversion/separation efficiency, thereby providing high-efficiency strategies for green energy technology development. Xia et al. engineered a sunflower-like WO3/ZnIn2S4 heterojunction with 3D confinement effects for efficient CO2 reduction [84]. The 3D core-shell confined architecture synergized cavity-mediated CO2 enrichment with S-scheme heterojunction charge transfer, achieving 82.1% CH4 selectivity in photocatalytic reduction through enhanced carrier separation (Figure 7a). SEM imaging revealed the integration of WO3 hollow sphere cores (300 nm) with petal-like ZnIn2S4 nanosheet shells (Figure 7b). The TEM and HRTEM analyses confirmed the 3D/2D heterogeneous interface and identified 0.369 nm (W) and 0.294 nm (ZIS) lattice fringes (Figure 7c,d). The EDS elemental distributions revealed that W/O is enriched in the inner core and Zn/In/S is distributed in the outer layers, thereby forming a spatially confined domain structure (Figure 7e). Guan et al. developed 3D ionic liquid-confined COFs (3D-IL-COFs) under normal pressure and temperature for selective CO2/CH4 separation [85]. As shown in Figure 7f, topological structure analysis and pore size distribution analysis revealed that 3D-IL-COF-3 is constructed by an 11-fold interpenetrated diameter net with the highest interpenetrated extent reported so far in the system of COFs. SEM characterization showed 3D-IL-COF-3 crystals (0.5–1.0 μm) forming intricate aggregates (Figure 7g). Breakthrough curves demonstrated exclusive CO2 retention in 3D-IL-COF-1 pores versus unimpeded N2/CH4 passage (Figure 7h,i), validating IL-COF’s molecular sieving capability and providing new ideas for the green and efficient preparation of nanoconfined catalytic materials. Zhang et al. fabricated MOF-derived 1D/3D nitrogen-doped porous carbon (NPC) architectures for syngas production via CO2 electroreduction [86]. The researchers grew Zn-MOF-74 crystals in situ using a melamine sponge (MS) as a three-dimensional scaffold, which was carbonized to form a composite structure consisting of 1D carbon rods (MOF-derived) with 3D nitrogen-doped porous carbon networks (Figure 7j). SEM maps (Figure 7k–m), TEM analyses (Figure 7n–p) and elemental mapping images (Figure 7q) of the 1D/3D NPC-1000 after carbonization show the uniform loading of the 3D skeleton with one-dimensional carbon rods, the coexistence characteristics of ordered graphitic carbon/amorphous carbon and the uniform distribution of nitrogen. Zhang et al. engineered Fe3O4-FeCx heterojunctions within N-doped ordered mesoporous carbon (N-OMC) for efficient CO2-to-olefin conversion [87]. Figure 7r depicts the two-step synthesis: precursor blending followed by staged carbonization to construct confined Fe3O4-FeCx/N-OMC catalysts. The difference in the reaction mechanism of CO2 hydrogenation on 0.8Fe-0.1K/N-OMC and 0.8Fe-0.1K@N-OMC reveals that the heterojunction-confined domain structure promotes the overflow of CO from Fe3O4 to the neighboring FeCx sites to achieve the efficient synergy between reverse water gas shift (RWGS) and Fischer–Tröpsch synthesis (FTS) (Figure 7s,t).
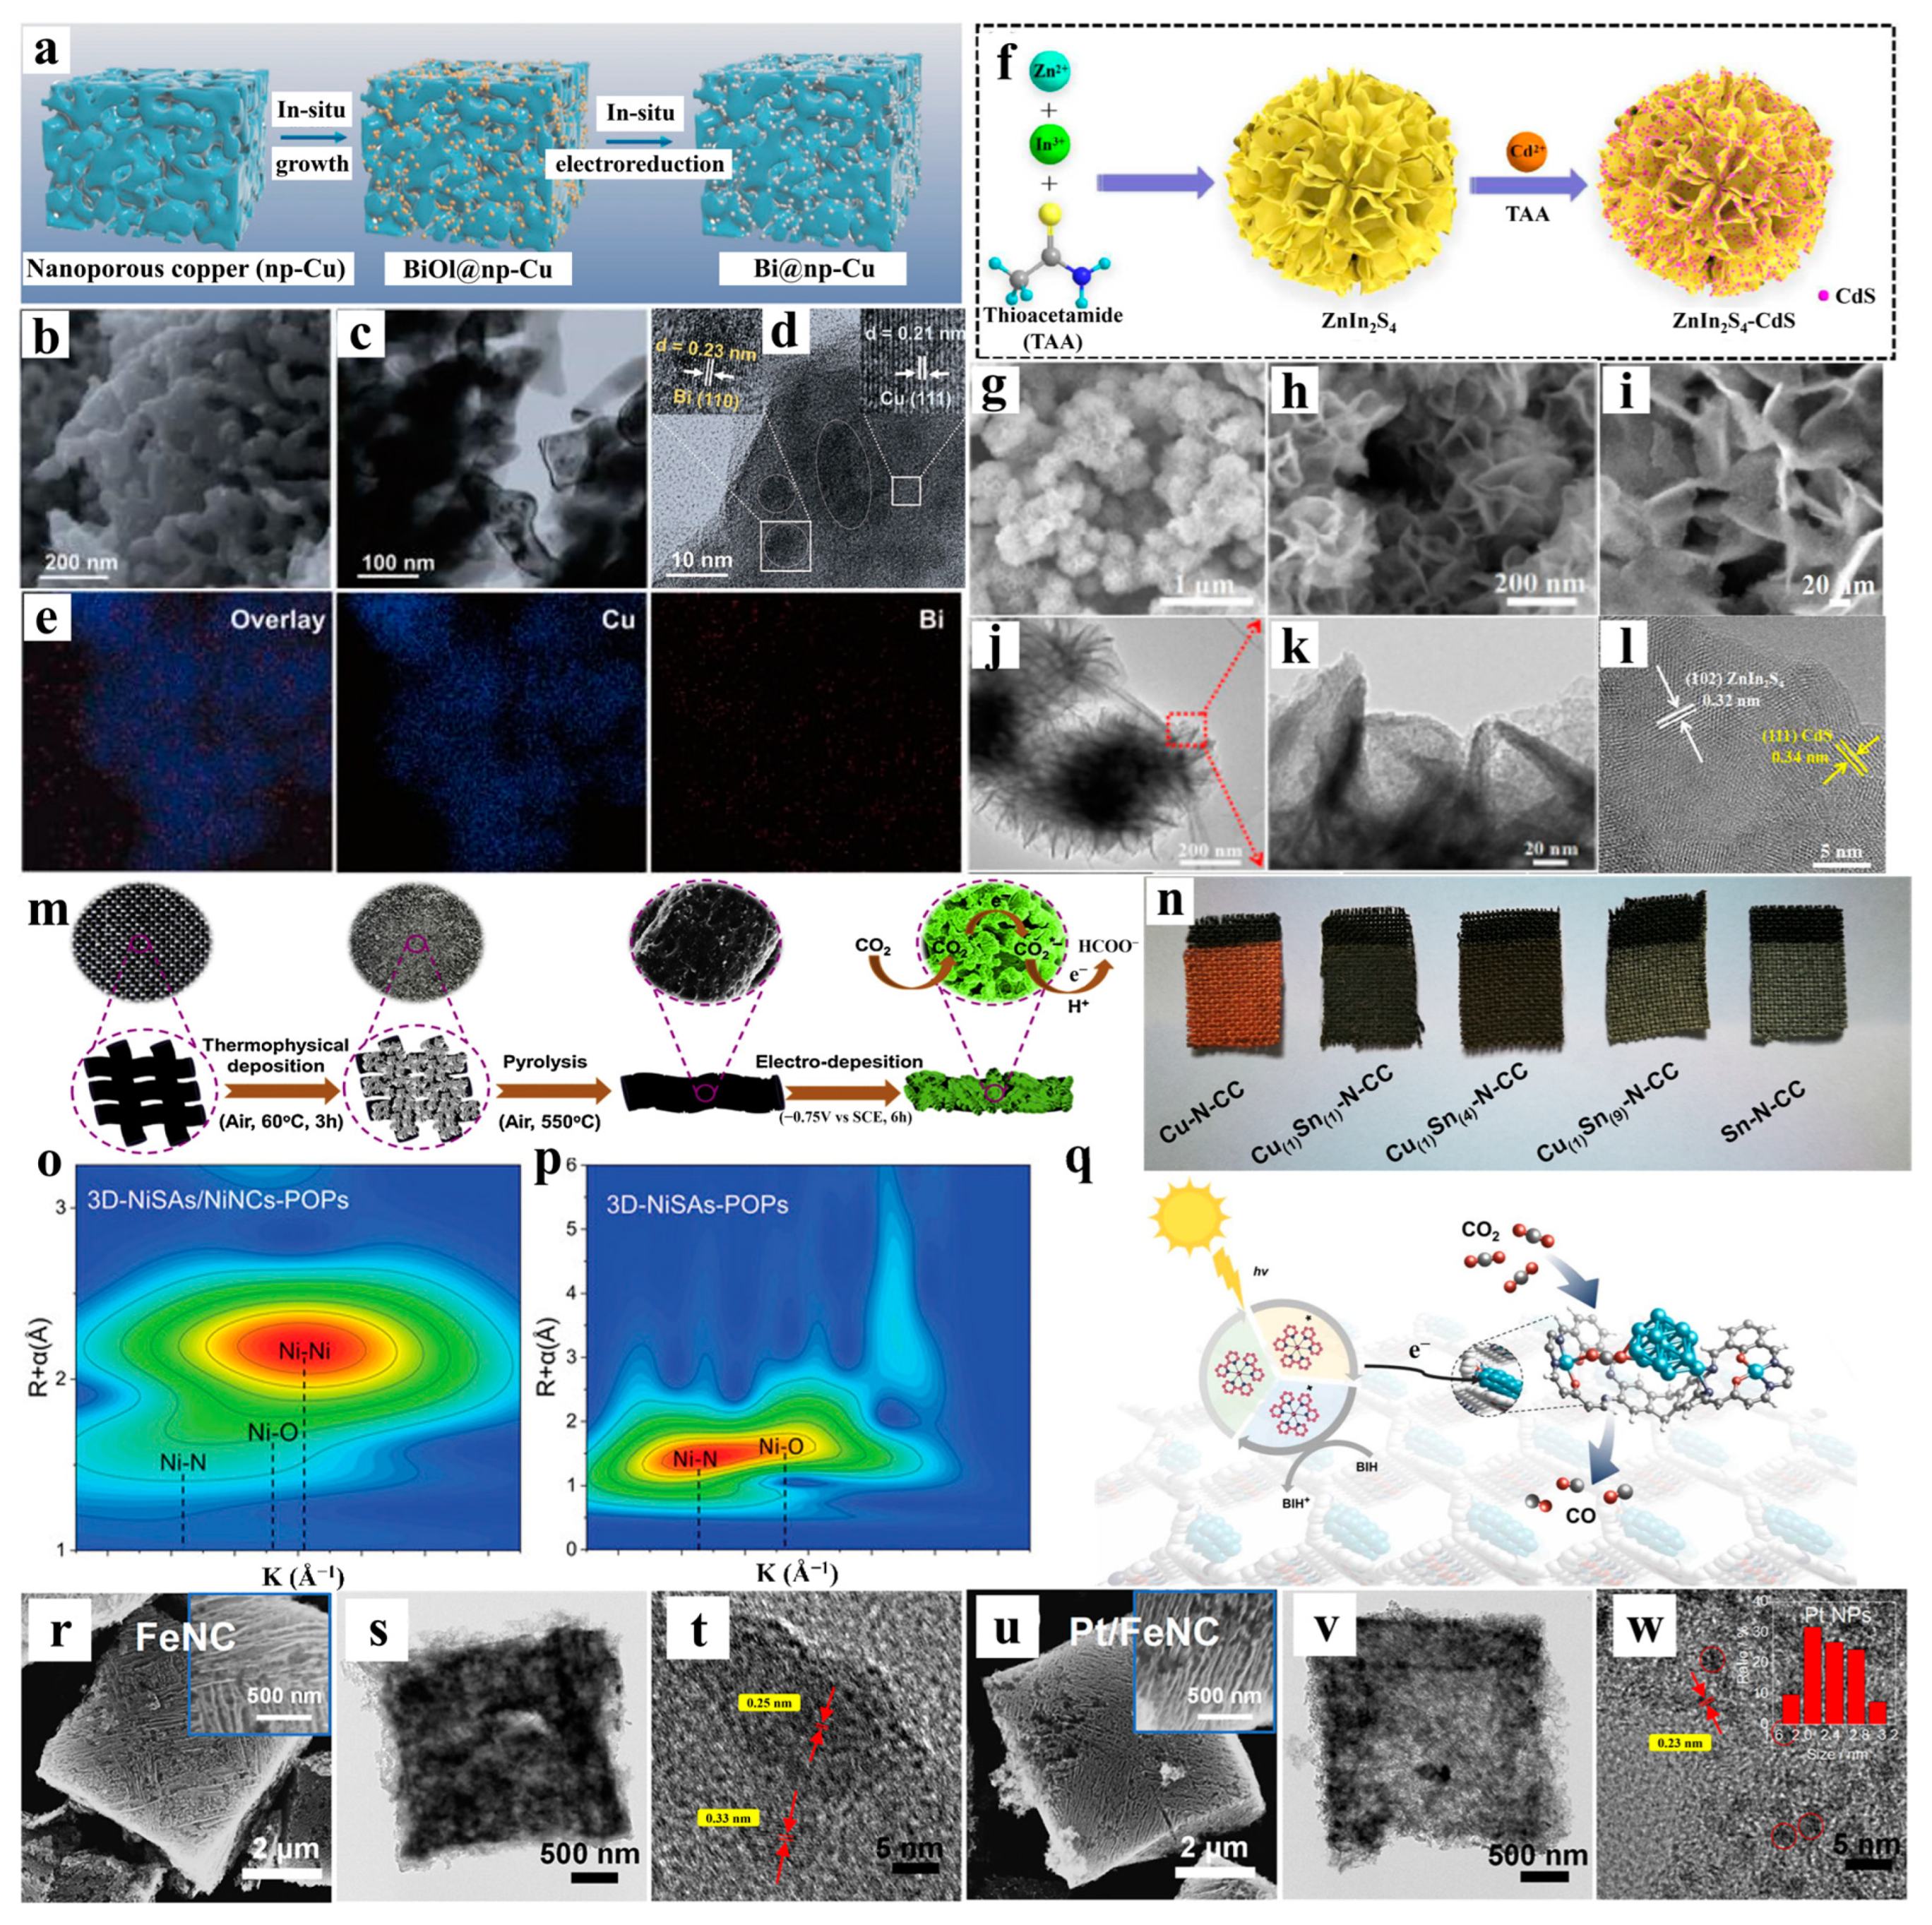
Taking it one step further, Zhao et al. developed a 3D nanoconfined Bi@np-Cu catalyst with bismuth nanoparticles confined in nanoporous copper for efficient CO2 electroreduction [88]. The 3D interconnected nanoporous copper framework was fabricated via selective dealloying, in situ growth, and electrochemical reconstruction (Figure 8a). SEM imaging revealed uniformly dispersed Bi nanoparticles (about 20 nm) on the np-Cu scaffold without agglomeration (Figure 8b,c). High-resolution transition electron microscopy (TEM/HR-TEM) analyses identified heterointerfaces between Cu(111) (d-spacing: 0.21 nm) and Bi(110) (0.23 nm) (Figure 8d). EDX mapping confirmed the three-dimensional spatial confinement of the Bi and Cu elements (Figure 8e). This demonstrates the critical role of 3D confinement in enhancing catalyst dispersion, stability and interfacial electronic effects. In the study by Zhu et al. [89], a hierarchical heterostructure of 0D CdS quantum dots confined in 3D ZnIn2S4 nanoflowers was constructed by means of a two-step solvothermal method for efficient photocatalytic CO2 reduction (Figure 8f). SEM revealed three-dimensional nanoflower structures (Figure 8g–i). TEM and HRTEM confirmed the uniform dispersion of CdS quantum dots (0.34 nm lattice) on the surface of ZnIn2S4 nanosheets (0.32 nm lattice) (Figure 8j–l). The formation of the 3D ZnIn2S4 nanoflowers is attributed to the self-assembly of the 2D nanosheets, resulting in a porous hierarchical structure. This structure is characterized by a high specific surface area and many CO2 adsorption sites. Additionally, it enhances the light trapping ability through multiple light scattering. The 0D CdS quantum dots are uniformly anchored on the surface of the 3D skeleton to form a strong interfacial coupling, and the quantum confinement effect is utilized to modulate the electronic energy level structure and promote the directional migration of ZnIn2S4 conduction-band electrons to CdS. Peng et al. designed a 3D honeycomb-like N-doped carbon cloth electrode (Cu1Sn4-N-CC) with bimetallic Cu/Sn loading [90]. Figure 8m illustrates the synthesis of copper and tin alloy catalysts on N-doped porous carbon cloth by an electro-deposition strategy. Figure 8n presents the macroscopic morphologies of electrodes with different Cu/Sn molar ratios: Cu-N-CC appears dark red, Sn-N-CC is silver gray, and Cu/Sn alloy electrodes (such as Cu1Sn4-N-CC) are brownish gray, intuitively reflecting the regulation of electrode color by the metal ratio. Yan et al. constructed three-dimensional porous organic frameworks (3D-NiSAs/NiNCs-POPs) in which nickel single atoms (Ni SAs) and nickel nanoclusters (Ni NCs) were simultaneously loaded to enhance the CO2 photocatalytic performance [91]. Average bond lengths of 2.1 Å (Ni–O) and 2.0 Å (Ni–N) were found in the 3D-NiSAs-POPs. Wavelet-transform EXAFS contour plots confirmed the coexistence of Ni-N/O sites and Ni-NCs in the 3D-NiSAs/NiNCs-POPs (Figure 8o,p). The researchers also proposed a possible mechanism for 3D-NiSAs/NiNCs-POP-catalyzed CO2 photoreduction: Ni single atoms and clusters synergistically photocatalyze CO2 reduction by asymmetric adsorption, electron transfer, and optimized intermediate binding to lower the energy barrier (Figure 8q). Zhang et al. developed Pt/FeNC composite cathodes with 3D confinement effects for high-performance Li-CO2/O2 batteries [92]. Cubic FeNC frameworks embedded with FeC nanoparticles (0.25 nm lattice) were characterized (Figure 8r–t). The Pt/FeNC maintains a cubic morphology with 2.4 nm Pt nanoparticles loaded uniformly on the surface of carbon flakes, and HRTEM confirmed the Pt(111) crystalline facets (0.23 nm spacing), revealing the spatial nanoconfined effect of the three-dimensional porous carbon carriers on Pt (Figure 8u–w).

2.4. Interfacial Nanoconfined Catalysis

Interfacial nanoconfined catalysis is a broad category encompassing 1D/2D/3D systems, operating through nanoscale interface structures that precisely modulate electronic states and geometric configurations of catalytic active centers. Specifically, ligand-unsaturated active sites (e.g., the In-O-Ti bonding interface of In2O3 nanolayers with TiO2) are formed through the interlayer-confined domain space of metal–oxide interfaces or layered materials. The interfacial electron penetration effect and geometrical constraints are utilized to change the center position of the d-band of the catalysts to optimize the intermediate adsorption energy. Three defining features characterize interfacial nanoconfined catalysis: electron modulation dominance, enhanced mass transfer efficiency, and chemically bonded interfaces [49,93,94,95,96].
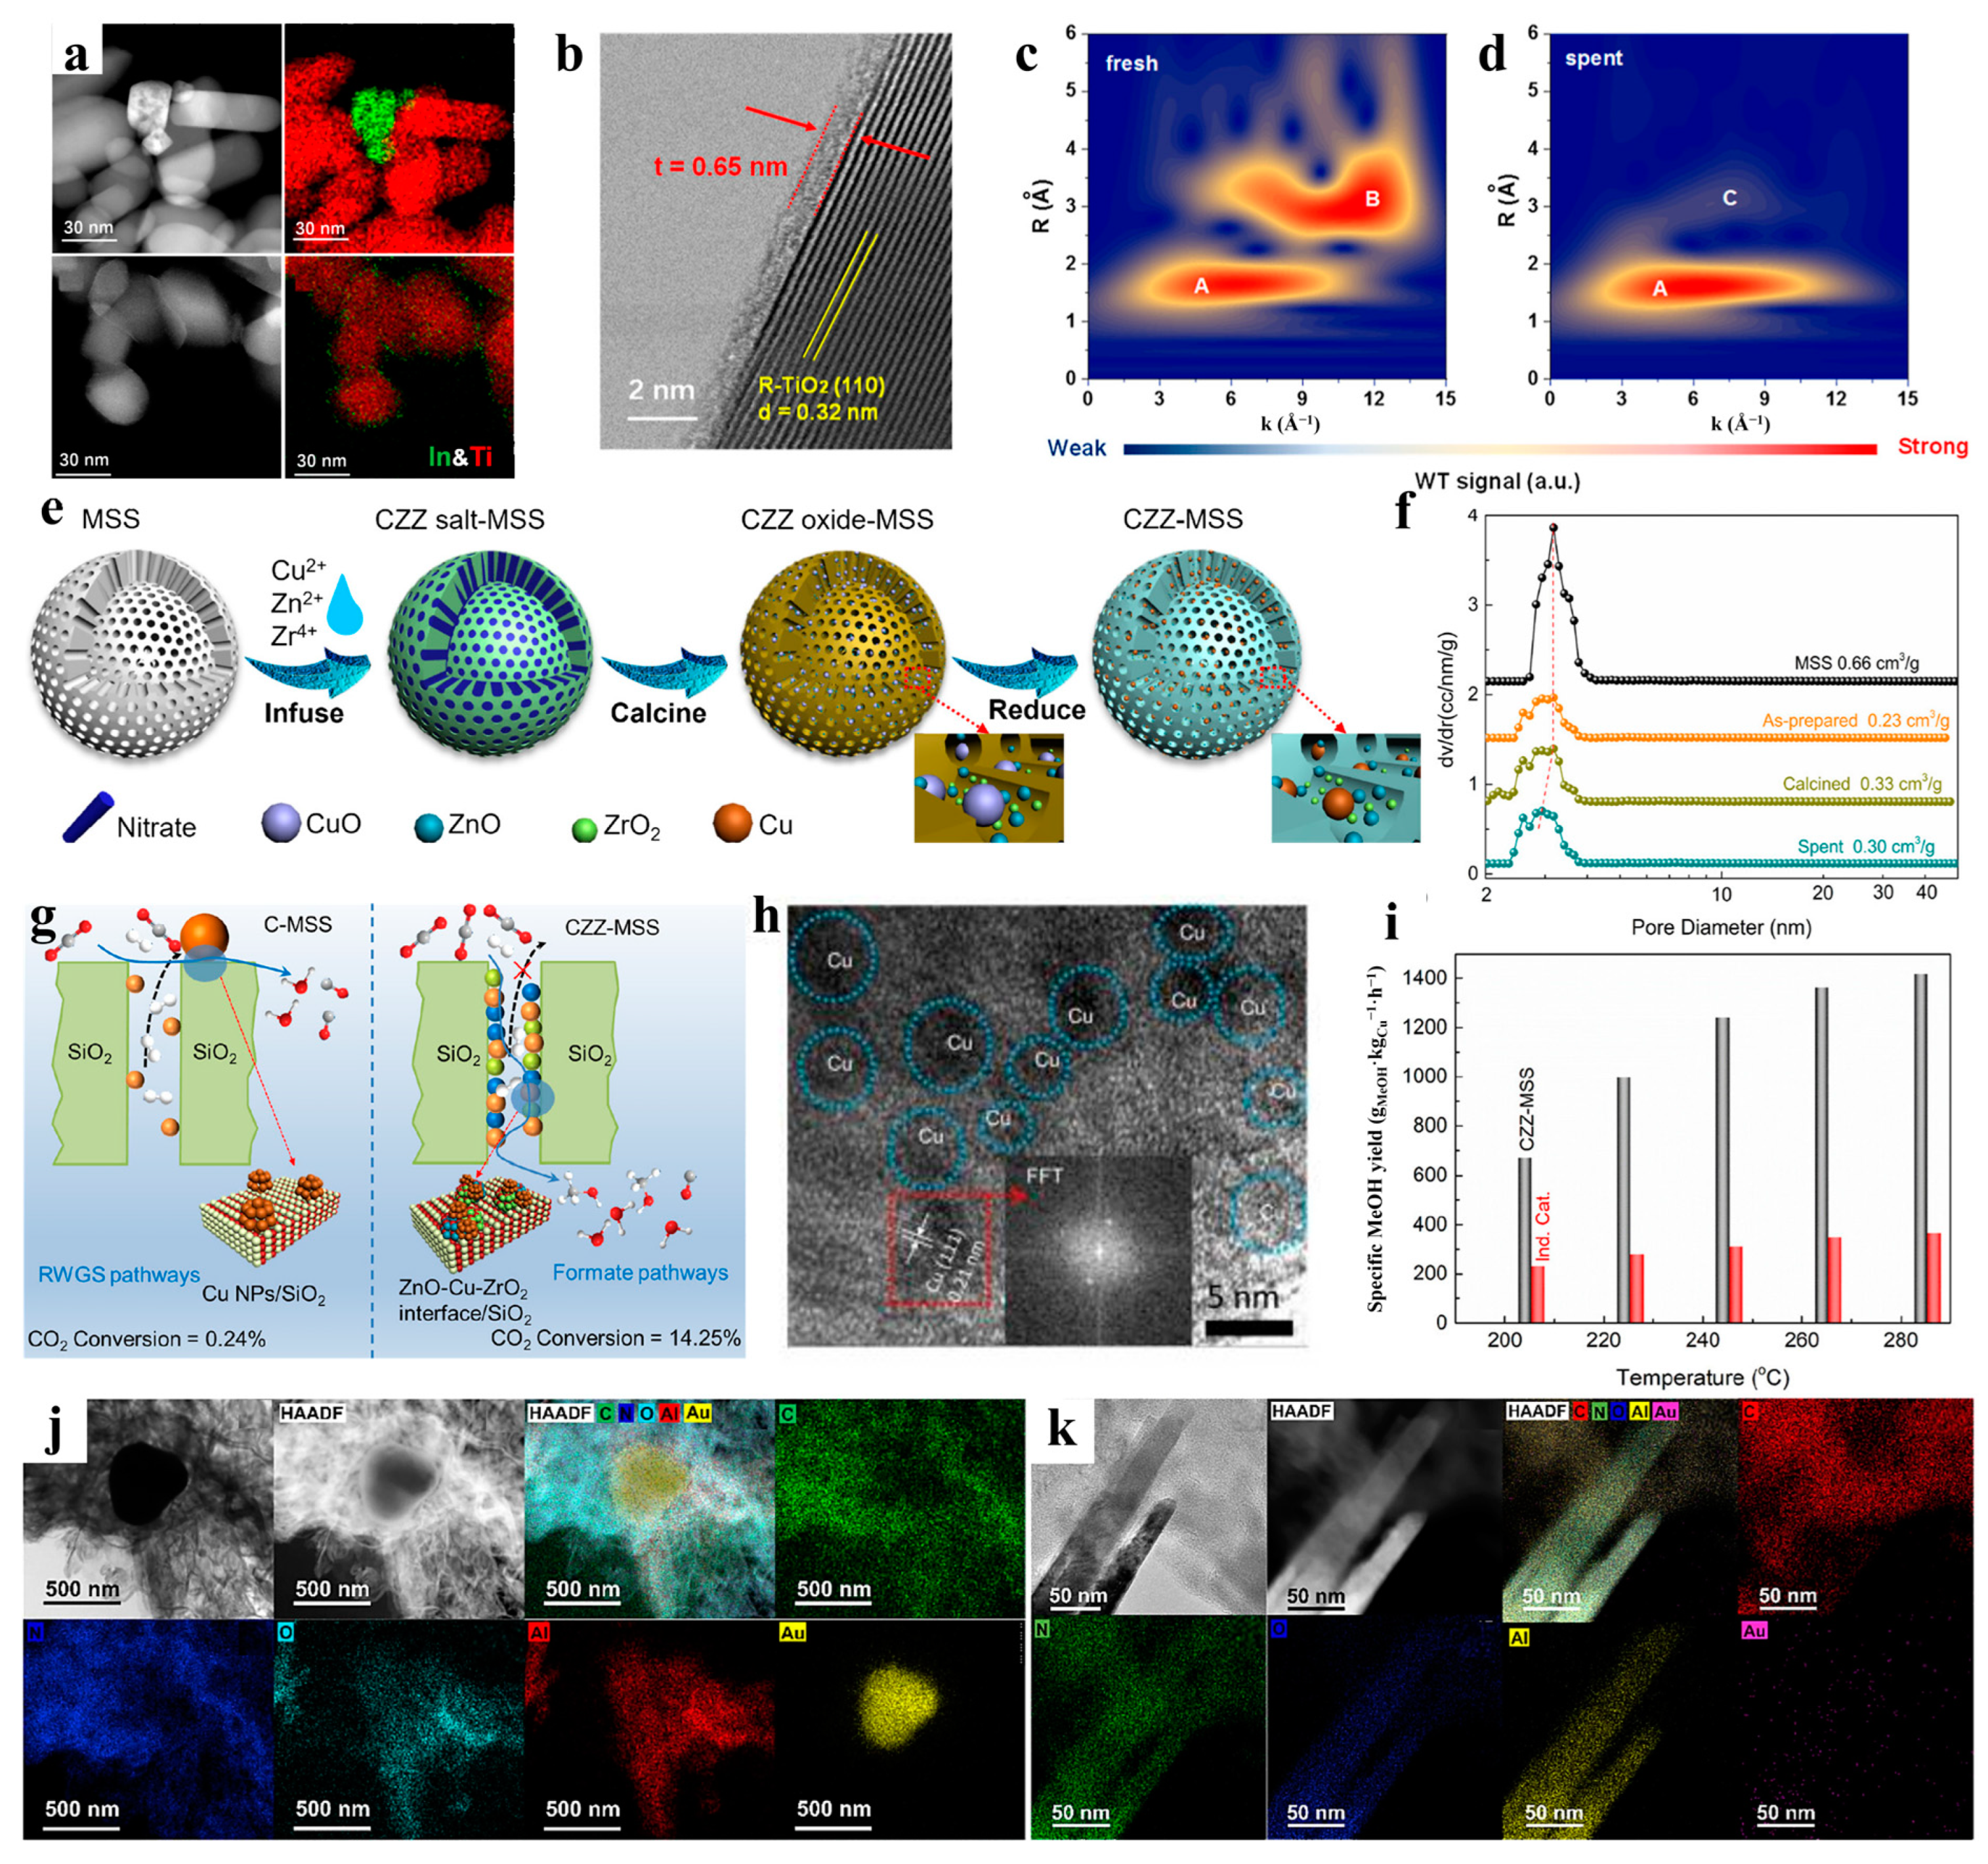
Researchers have significantly enhanced gas conversion efficiency and product selectivity by modulating interfacial electronic states and active site distributions through nanoconfinement strategies, thereby offering innovative directions for designing green energy catalytic systems. TiO2 exhibits low activity in CO2 hydrogenation with difficulty in generating surface oxygen vacancies, requiring combination with active components to enhance catalytic performance [97,98]. Cubic-phase In2O3 offers advantages in RWGS, including stronger H2 dissociation and adsorption, facile oxygen vacancy formation, and efficient CO2 activation [99]. Studies on In2O3 and supported In2O3 catalysts have attracted significant attention in CO2 hydrogenation reactions [58,100,101]. Among them, Wang et al. elucidated the regulatory mechanisms of interfacial nanoconfined effects on CO2 hydrogenation reactions [58]. Under the H2/CO2 atmosphere, In2O3 nanoparticles dynamically disperse into ultrathin InOx nanolayers on TiO2 supports, forming In–O–Ti interfacial bonds (Figure 9a). As illustrated in Figure 9b, the cross-sectional HRTEM image of the TiO2@InOx catalyst reveals that the thickness of the InOx nanolayer is measured at 0.6–0.7 nm (~2–3 atomic layers). This observation indicates that In2O3 forms an ultrathin overlayer on the surface of TiO2, closely approaching the monolayer limit. As demonstrated in the wavelet transformed (WT) extended EXAFS spectra (Figure 9c,d), the In–O and In–O–In bonds experience a reduction in strength following the reaction, concomitant with the emergence of the In–O–Ti bond. This observation serves as evidence for forming an InOx–TiO2 interfacial bond, wherein the In–O–Ti bond replaces a proportion of the In–O–In bonds. The interfacial nanoconfined effect stabilizes the stable InOx structure through electronic interactions, promotes the formation of surface oxygen vacancies, and inhibits the excessive reduction into the metallic state. Consequently, this enhances the CO2 adsorption activation capacity. As posited by Chen et al. [102], Cu, Zn, and Zr precursors were loaded into the pores of mesoporous silica spheres (MSS) through wet impregnation. Following this process, the creation of confined nanoparticles occurred via calcination and reduction (Figure 9e). The construction of highly dispersed Cu-ZnO, Cu-ZrO2, and ternary interfacial active sites was achieved by confining the ZnO-Cu-ZrO2 three-phase interface to less than 3.5 nm pores (Figure 9f,g). The high-resolution TEM images of the reduced (Cu-ZnO-ZrO2) CZZ-MSS samples (Figure 9h) demonstrate the dispersion of Cu nanoparticles with a stripe spacing of 0.21 nm on the MSS carriers. The methanol spatiotemporal yield of this nanoconfined system was found to be significantly higher than that of the industrial catalyst (Figure 9i). Li et al. engineered Au-θ-Al2O3/Au/PCN composites through a synergistic active site structure design for efficient CO2 photoreduction [103]. Through the process of nanosheet layer intercalation assembly, the PCN establishes close proximity with the Au-θ-Al2O3 interface, thereby constructing a multilevel built-in electric field and promoting the spatial separation of photogenerated carriers. The atomically dispersed Au atomic energy, confined by oxygen vacancies in Au-θ-Al2O3/Au, provides a substantial number of effective active sites for the CO2R reaction. The TEM and HAADF images demonstrate that the Au-θ-Al2O3/Au nanosheets are closely wrapped by the PCN layer, thereby forming a face-to-face contact heterojunction. Furthermore, the elemental mapping revealed that C, N, O, Al, and Au are distributed uniformly, with Au existing both in the atomic state (θ-Al2O3 oxygen vacancies-confined domain) and in nanoparticle form (Figure 9j,k).
Further onwards, Bao et al. synthesized PCN-222 via solvothermal methods, then precisely anchored Cu nanoparticles onto its Zr6-oxo clusters through ion exchange to construct the Cu@PCN-222 catalyst (Figure 10a) [104]. FESEM and TEM analyses confirmed the retained rod-like morphology of PCN-222 with highly dispersed Cu nanoparticles (Figure 10b,c). EDX mapping demonstrated uniform Cu distribution, verifying successful anchoring on Zr6-oxo clusters (Figure 10d). Strong metal-support interactions (SMSI) between Zr6-oxo clusters and Cu generated abundant interfacial active sites, including Zr4+-O2−-Cu2+ and Zr4+-Cu2+ configurations. Bu et al. innovatively integrated hexagonal boron nitride (h-BN) with (Ni, Mg)Al2O4 nanosheets derived from layered double hydroxides (LDHs), establishing a 2D interfacial confinement architecture [105]. Figure 10e illustrates the reaction mechanism of NiMA-BN-M-R catalysts in methane dry reforming. The presence of highly dispersed Ni nanoparticles has been shown to promote the dissociation of CH4 to CHx*, with CO2 forming carbonate and hydroxyl species at the interface. These react with CHx* to produce CO/H2 while inhibiting carbon buildup. Figure 10f shows by cross-sectional SEM and EDX line scanning that the h-BN with the oxide lamellae is distributed alternately with heterogeneous interfaces inhibiting Ni sintering, confirming the structural stability. The characteristic peaks of two carbonate (monodentate and bidentate carbonate) species did not completely disappear, indicating that the NiMA-BN-M-R catalyst has good adsorption and activation capacity for CO2 (Figure 10g). Long et al. developed a novel composite catalyst featuring hollow sulfur-doped carbon shells encapsulating CoFe alloys (CoFe@CS) [106]. Figure 10h outlines the synthesis: CoFeHCF precursors self-assembled with S2−, followed by high-temperature calcination to form hollow multilayered carbon shells around CoFe alloys, with acid washing yielding CoFe@CS. As illustrated in Figure 10i, the electrostatic potential distribution of sulfur-doped and defective regions exhibits stronger positive potentials, verifying that sulfur doping enhances the electron absorption and transport capacity and optimizes the catalytic performance by altering the electron distribution. SEM images demonstrate that CoFe@CS is an irregular spherical particle, with a significantly larger particle size than undoped CoFe@C. TEM images reveal the core-shell structure: the CoFe alloy core (lattice spacing of 0.20 nm) is wrapped by a multilayered, ultrathin carbon shell (the distance between graphite layers is 0.34 nm), which is characterized by porous properties (Figure 10j,k). The elemental distribution map confirmed that the core region is enriched with Co/Fe, C is uniformly distributed, and S overlaps with C, indicating that S has been successfully doped into the carbon skeleton (Figure 10l,m).

2.5. Systematic Evaluation

As an advanced catalytic technology, nanoconfined catalysis demonstrates promising potential primarily due to the microenvironment constructed by its nanoconfined structures. However, this system inherently involves high complexity, encompassing diverse interactions among active component particles, confined frameworks, and reactant molecules. Considering that dimensional features often exhibit distinct performance variations, we concisely summarized their shared advantages and outlined the limitations specific to each dimension to enhance the understanding of the microstructural characteristics of nanoconfined catalysis (Table 1).
Compared to other structural types of catalysts, nanoconfined catalysts exhibit enhanced local concentrations of active components or reaction intermediates due to their confined architecture, whereas disordered heterogeneous or homogeneous catalysts lack this capability, resulting in distinct product selectivity compared to traditional catalytic systems [56,67,107,108,109,110]. Additionally, nanoconfinement improves the sintering resistance of active components, thereby enhancing the overall stability of the catalytic system for long-term carbon-based energy conversion [51,64,66,105,108,111]. However, the industrialization of nanoconfined catalysts still lags behind traditional catalysts due to their complex synthesis processes and high raw material costs, which are major concerns for industries. Consequently, recent explorations into low-cost nanoconfined catalytic systems hold greater research value and significance.

3. Synthesis and Optimization Strategy for Nanoconfined Catalysts

3.1. Heteroatom Doping Engineering

Heteroatom doping engineering is a process that enables the targeted modulation of catalytic performance. This is achieved by the introduction of heterogeneous atoms into the nanoconfined catalytic system, resulting in the reconfiguration of the electronic structure and coordination microenvironment of materials from the atomic scale. Heteroatoms have been shown to enhance the adsorption strength and selectivity of the active sites for key intermediates by modifying the charge distribution of the host material (e.g., inducing charge polarization or localized electron enrichment). As a result, reaction barriers are reduced and reaction paths are modulated. Simultaneously, the dopant atoms form specific chemical bonds with metallic or non-metallic components in the nanoconfined space. This can stabilize the geometrical configuration of the active sites, thereby inhibiting agglomeration or deactivation. Furthermore, it can synergize with the nanoconfined effect to enhance the mass-transfer kinetics and promote the rapid directional diffusion of the reactants within the nanochannels [112,113,114,115]. This atomic-level electron-geometry dual-regulation mechanism enables heteroatom doping to overcome the limitations of traditional catalytic materials in terms of the trade-offs among activity, selectivity, and stability. It also provides a means of regulation with molecular-level precision for the rational design of efficient nanoconfined-domain catalytic systems [116,117,118,119,120].
The precise regulation of interfacial electronic states and active site distributions through heteroatom doping and synergistic nanoconfinement strategies significantly enhances carbon-based energy conversion efficiency and product selectivity. Chen et al. have significantly demonstrated a substantial enhancement of the CO2 electroreduction properties of In2O3 nanocrystals. This advancement has been achieved by implementing a synergistic strategy incorporating nickel doping and the introduction of carbon-confined domains [121]. Nickel-doped In2O3 nanocrystals were encapsulated within carbon fibers via electrospinning–carbonization methods (Figure 11a). HRTEM revealed the (111) crystal surface of In2O3 (0.29 nm lattice stripe). HAADF-STEM and EDX elemental distribution maps demonstrated the uniform distribution of Ni, In, and O within the nanocrystals, with complete encapsulation of the carbon fibers (Figure 11b,c). Nickel doping has been shown to optimize the electronic structure of In2O3, thereby improving the electrical conductivity of the catalyst. In addition, nickel doping has been demonstrated to accelerate the charge transfer rate of the electrocatalytic reaction (Figure 11d,e). Zang et al. engineered a confined interfacial catalyst (Cu-N-G) via nitrogen-doped graphene-coated copper foam to synergistically regulate CO2 electroreduction pathways [122]. Graphene was grown on copper foam via chemical vapor deposition (CVD), followed by ammonia treatment for nitrogen doping (Figure 11f). SEM analysis revealed that the Cu surface of the foam was enveloped by folded graphene, thereby establishing a three-dimensional conductive network (Figure 11g,h). Among them, a Cu-N-G hydrophobic surface (113.5°) was found to impede the hydrogen evolution reaction (Figure 11i). EDX elemental mapping verified a uniform C/N/Cu distribution and successful nitrogen incorporation (Figure 11j). X-ray photoelectron spectroscopy (XPS) analysis confirmed that nitrogen doping elevates the average valence state of Cu to promote C–C coupling (Figure 11k). DFT simulations revealed interactions between N and CO2 through charge transfer and adsorption energy optimization, enhancing CO2 activation. The synergistic effect of doping and nanoconfined significantly improved the ethanol selectivity (FE up to 33.1%), thus revealing the synergistic mechanism of the doped interfacial electronic structure and spatial nanoconfinement on the reaction path. Guo et al. [123] constructed nitrogen-doped hierarchically ordered porous carbon-loaded monoatomic zinc catalysts (Zn-N-HOPCPs) for efficient photocatalysis of CO2. This was achieved by pyrolyzing ZIF-8 single crystals in the interstitial space of SiO2 gel–crystal templates via a nanoconfined pyrolysis strategy (Figure 11l). SEM confirmed that template confinement prevented structural collapse during carbonization (Figure 11m). HAADF-STEM and the elemental distribution maps, in conjunction with aberration-corrected HAADF-STEM images, provided unequivocal confirmation of the observation that Zn is firmly anchored in the N-doped hierarchically ordered porous carbon as a solitary atom (Figure 11n–q). The XPS spectra revealed that the N-doped carbon matrix provides pyridinic N sites (398.6 eV) (Figure 11r). The Zn 2p3/2 (1021.1 eV) and Zn 2p1/2 (1044.2 eV) orbitals confirmed the presence of isolated Zn sites in Zn-N-HOPCP (Figure 11s). Recent studies demonstrated that single-atom Zn anchored by adjacent N atoms (Zn-N4 moieties) can be obtained through one-step pyrolysis of ZIF-8 [124,125], thus confirming the formation of atomically dispersed Zn-N4 acid–base synergistic catalytic centers. Concurrently, the nanoconfined effect ensured the uniform anchoring of Zn atoms to the carbon skeleton, and the graded pores facilitated mass transfer and light trapping for efficient CO2 photocatalytic conversion under mild conditions.
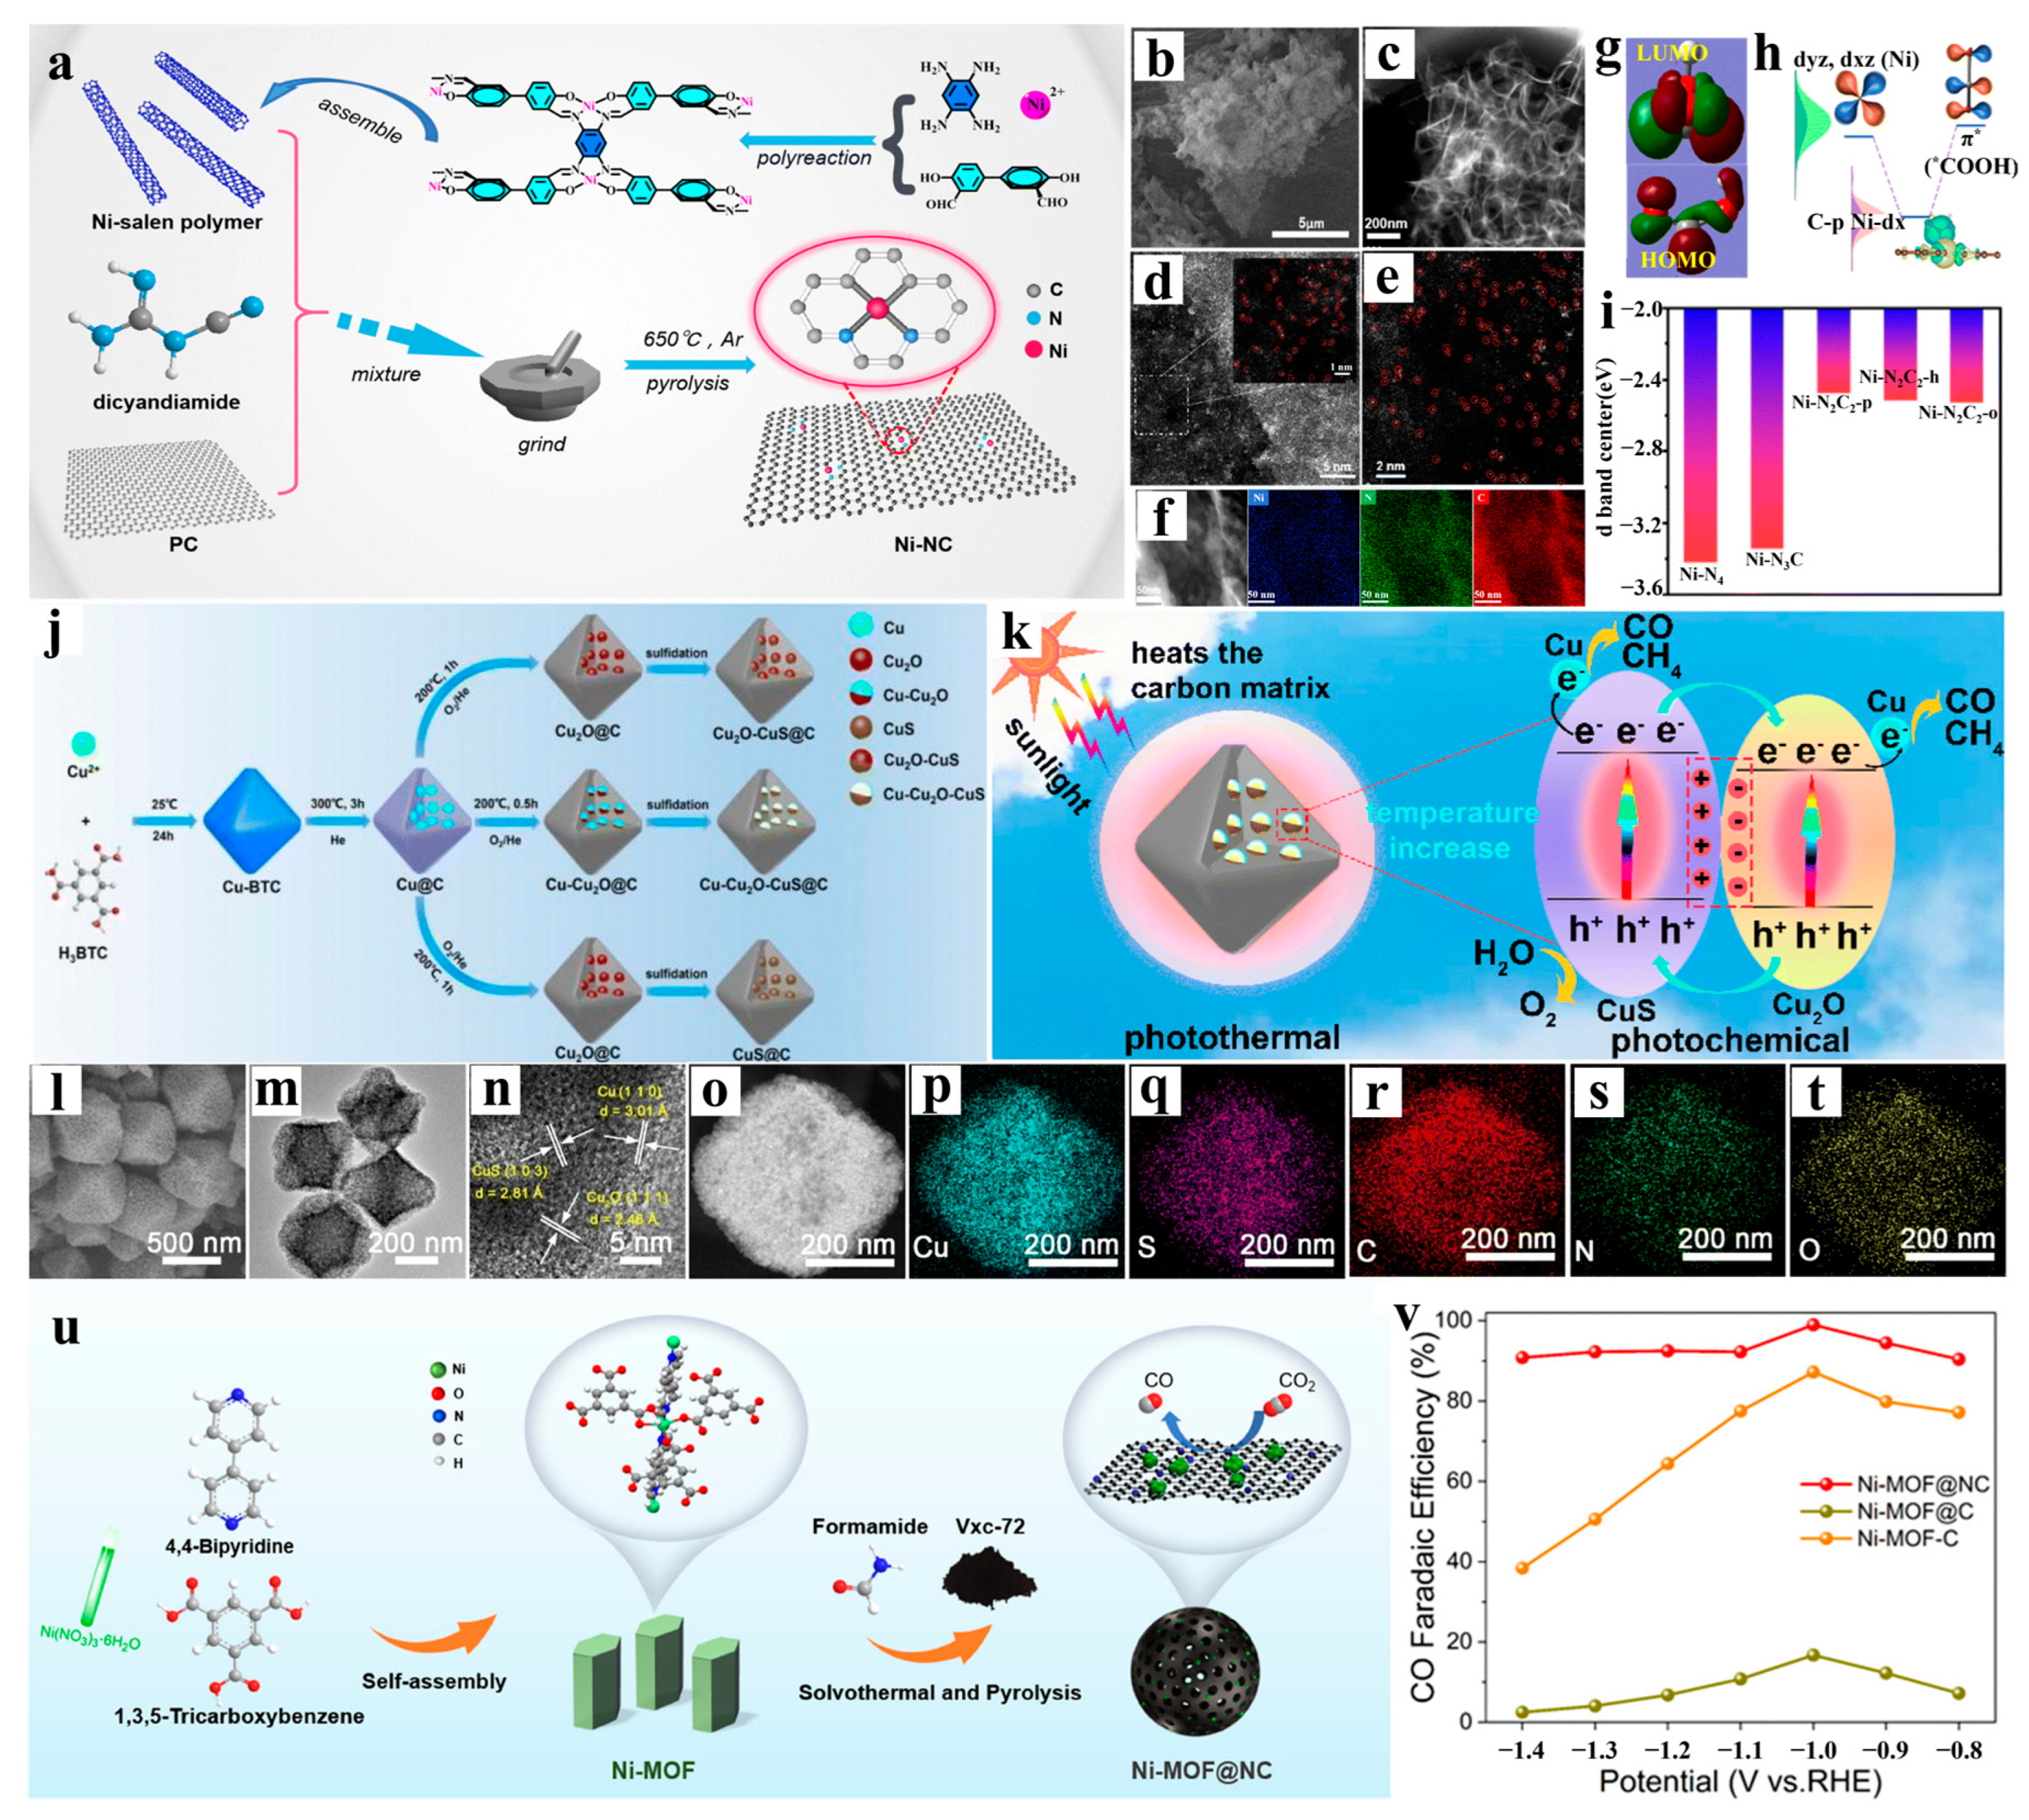
Additionally, Liu et al. [126] employed the tubular architecture of Ni-salen polymers (Ni-N2O2) to pre-anchor metal sites, achieving precise construction of Ni-Ni-N2O2 single-atom sites via Ni–O bond cleavage and Ni–C bond formation during pyrolysis (Figure 12a). They observed through high-resolution microscopy (Figure 12b–e) that the Ni-NC derived from pyrolysis with Ni-salen polymer addition exhibited a typical graphene-like structure with abundant surface pores, which facilitates mass transfer during catalytic processes. In conjunction with the elemental distribution analysis, it has been confirmed that Ni is dispersed in the nitrogen-doped carbon matrix through Ni-N2C2 coordination. This verifies the precise construction and high loading characteristics of single atomic sites (Figure 12f). Figure 12g–i jointly reveal the high-performance nature of Ni-N2C2-p: its unique electronic structure (D-band center shift up) facilitates the formation of COOH intermediates through orbital hybridization (dyz/dxz coupling with C-2p). In contrast, the spatial distribution of molecular orbitals (HOMO/LUMO localization) further optimizes the reaction path and ultimately reduces the energy barrier of the decision step (*COOH formation). Chen et al. [111] developed an efficient photothermal catalytic system through synergistic nanoconfinement and heteroatom doping strategies. Using Cu-BTC as a metal-organic framework precursor, the researchers successfully encapsulated Cu-Cu2O-CuS within a nitrogen-doped porous carbon octahedral matrix via a simple pyrolysis oxidation–sulfidation route (Figure 12j). Additionally, the mechanism for photothermal conversion of CO2 into CO and CH4 on the Cu-Cu2O-CuS@C catalyst has been proposed (Figure 12k). Characterization revealed N-doped carbon octahedrons containing uniformly dispersed Cu-Cu2O-CuS heterojunctions (Figure 12l–t). We surmise that the enhanced dispersion and the formation of compact heterojunction interfaces might be attributed to the confinement effect inhibiting the rate of sintering and aggregation, while enhancing the formation of heterojunctions within the core-shell structure [127,128,129]. Guo et al. [130] engineered a MOF-derived N-doped carbon-encapsulated Ni catalyst (Ni-MOF@NC) for enhanced CO2 electroreduction. The Ni-MOF was integrated with VXC-72 carbon black through a solvothermal process in formamide, inducing spontaneous polymerization to yield a nitrogen-doped carbon shell-encapsulated confined architecture. Subsequent pyrolysis of this hybrid precursor resulted in the formation of Ni nanoparticles (Figure 12u). Experiments demonstrate that Ni-MOF@NC maintains over 90% CO Faraday efficiency in a wide potential window of −0.8 to −1.4 V and reaches a peak of 99% at −1.0 V (Figure 12v).

3.2. Defect Engineering

Defect engineering is a process that artificially constructs atomic-level structural defects, such as vacancies, lattice distortions or interfacial mismatches, to confer unique electronic and geometrical regulatory properties on nanoconfined domain catalytic systems. The introduction of defects has been shown to have a significant impact on the local electron distribution within confined spaces (e.g., inducing charge polarization or the formation of unpaired electronic states). Furthermore, it has been demonstrated that this introduction can optimize the adsorption strength and selectivity of the active site to reaction intermediates. In addition, it was also observed that the strong anchoring effect at the defect sites stabilizes the metal nanoparticles or single atoms, thereby inhibiting their migration and aggregation. Furthermore, the defective structures can reconfigure the mass transfer pathways of the nanoconfined channels (for example, by shortening the radical migration distance or forming selective permeation sites), resulting in a synergistic enhancement of the reaction kinetics and substance transport efficiency. The dual regulation of electronic states and microenvironments on the atomic scale renders defect engineering a pivotal strategy for overcoming the limitations of catalytic activity, selectivity, and stability. Furthermore, it provides a dynamically tunable regulatory dimension for the precise design of nanoconfined catalytic systems [131,132,133,134].
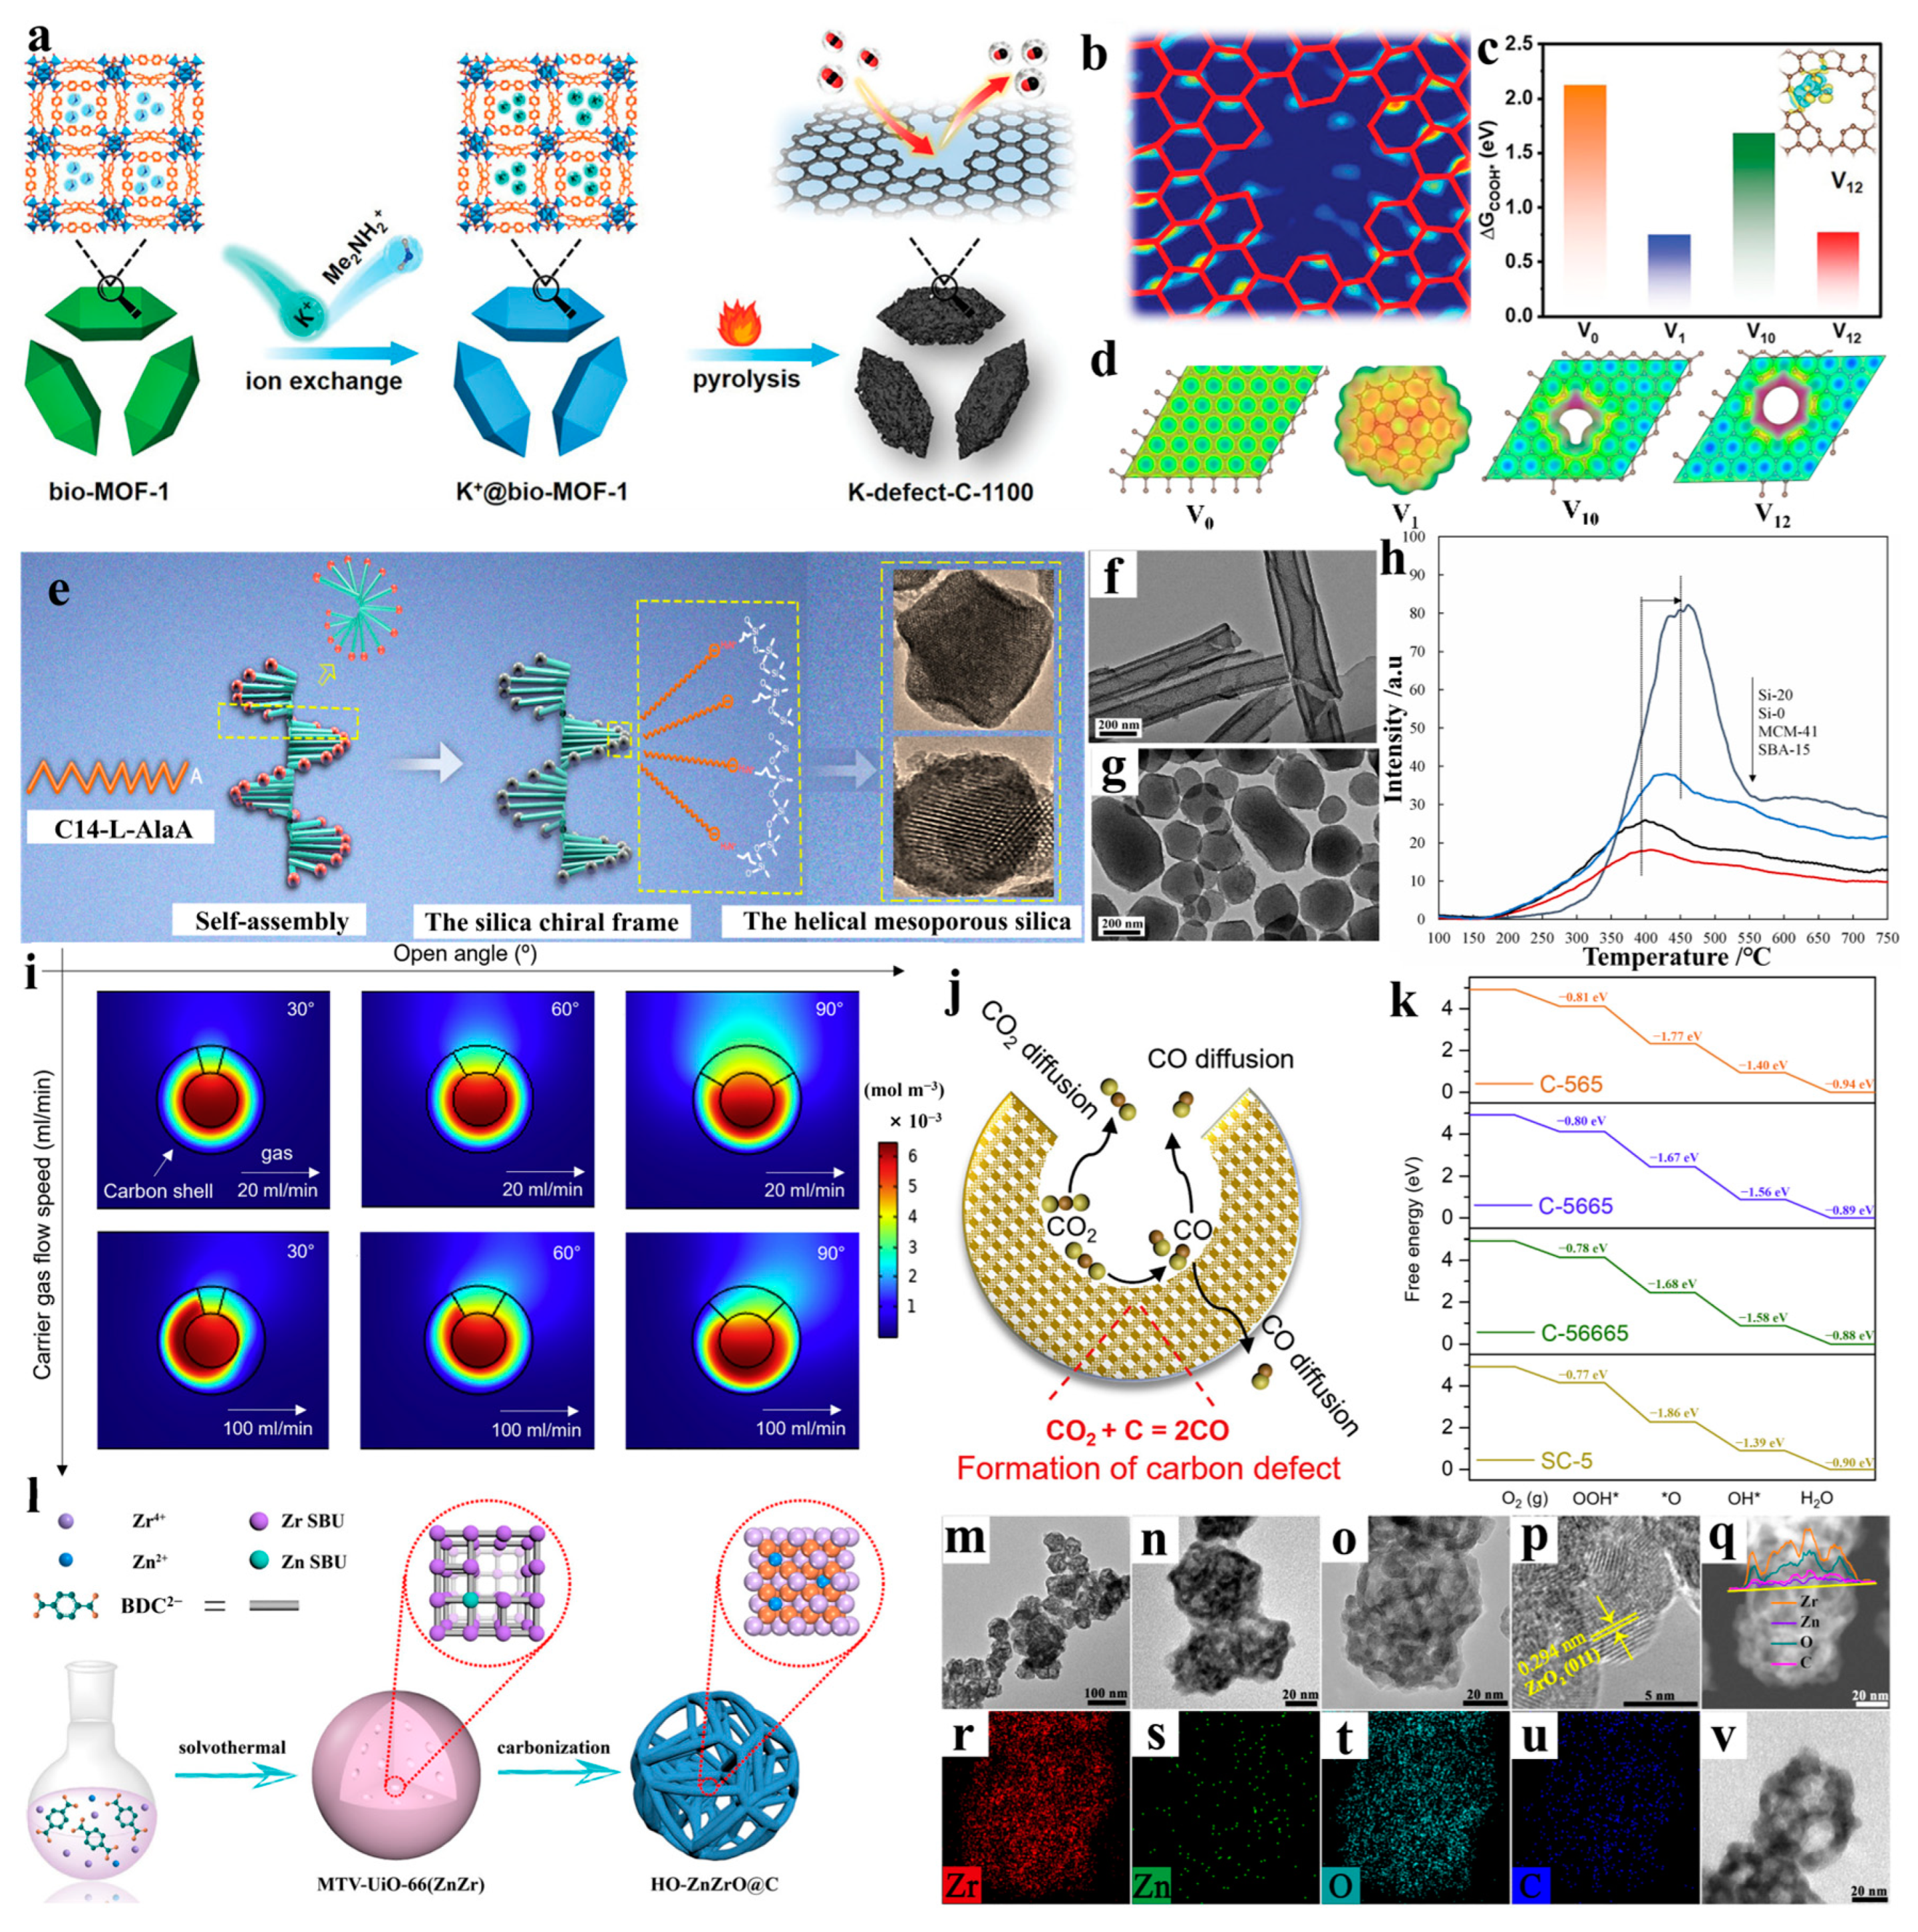
Defect engineering synergistically modulates catalyst multiscale architectures with nanoconfinement, optimizing active site local electronic states and reaction-mass transfer pathways, thereby significantly enhancing carbon-based energy conversion kinetics and product selectivity, offering cross-scale cooperative mechanisms for high-performance catalytic systems. Ling et al. achieved defect modulation within MOF-confined spaces via a K+-assisted nanoconfinement strategy [135]. The researchers used K+ to exchange organic cations in MOF channels to form a nanoconfined environment during the pyrolysis process, and K+ achieved synchronous removal of nitrogen dopant and directional construction of intrinsic carbon defects through etching (Figure 13a). As demonstrated by HAADF-STEM images, the nanoconfined domain effect inhibits carbon network remodeling at elevated temperatures, thereby enabling the defective structure to exist stably within the porous carbon skeleton (Figure 13b). Theoretical calculations demonstrated that the nanoconfined-domain electronic environment of V12 defects (V12 is a defect-rich porous carbon with 12 vacancy-type defects, obtained through the pyrolysis of K+@bio-MOF-1 at 1100 °C, wherein 12 adjacent carbon atoms are missing) enhanced the CO2 adsorption capacity, significantly lowered the energy barrier for the formation of COOH* intermediates, and promoted the kinetics of the electrocatalytic CO2 reduction reaction (Figure 13c,d). This strategy combines defect engineering with nanoconfined-domain catalysis, providing a novel approach for precisely regulating the active sites of carbon-based catalysts. Wang et al. engineered asymmetric channels in helical mesoporous SiO2 through defect engineering, where surface defects and hydroxyl groups enhanced CO2 affinity [136]. The researchers elucidated the synthetic pathway of helical mesoporous SiO2 and the molecular basis of its asymmetric pore structure (Figure 13e). Helical pores (with a diameter of approximately 3.43 nm) of Si-20 form confined spaces (Figure 13f,g). Si-20 has been shown to exhibit selective adsorption of CO2, facilitated by a combination of factors, including its transportation through a pore wall defect structure and a strong dipolar interaction with hydroxyl groups (Figure 13h). The synergistic effect of defect engineering in conjunction with nanoconfined domains has been shown to enhance the CO2 permeability of mixed matrix membranes (MMMs) forming a 287.2 barrier while achieving a CO2/N2 selectivity of 26.36. This breakthrough surpasses the performance limitations of conventional membrane materials. Wu et al. proposed a novel method for preparing ultra-high-density carbon defects. This method termed the interfacial self-corrosion technique, involves the modulation of defect engineering through the nanoconfined domain strategy [137]. The researchers revealed the regulatory mechanism of the nanoconfined domain effect on CO2 diffusion and conversion through finite element simulation (Figure 13i). By constructing carbon cavity models (A–F) with different opening angles (30°, 60°, and 90°) in combination with the carrier gas flow rate, it was found that a slight opening angle (30°) and a low flow rate (20 mL/min) could effectively confine the escape of CO2, which could be retained in the carbon cavity and further react with carbon to generate CO. As demonstrated in Figure 13j, the schematic illustrates that confined CO2 instigates a self-corrosion reaction at elevated temperatures, thereby continuously removing carbon atoms and forming defects. Density functional theory posits the existence of a gradient “proximity effect” between these defects, with the reduction in spatial distance being conducive to optimizing the electronic structure and diminishing the theoretical overpotential of the oxygen reduction reaction (ORR) (Figure 13k). This study established a quantitative correlation between defect density and catalytic activity, thus providing novel insights into the design of carbon-based catalysts. Wang et al. [138] introduced local defects in UiO-66(ZnZr) via Zn SBU substitution, forming 3D hollow HO-ZnZrO@C through defect-guided contraction during carbonization (Figure 13l). TEM revealed open channels and hierarchical porosity, with HRTEM confirming ~3.5 nm ZnZrO nanoparticles. EDX mapping showed a homogeneous Zn/Zr distribution, while cross-sectional TEM identified mesoporous cavities (Figure 13m–v). The nanoconfined domain effect has been demonstrated to confine ultrafine ZnZrO particles in a hierarchical porous carbon skeleton. It has been shown that the open channels in this configuration enhance mass transfer efficiency, and that the carbon matrix reducibility promotes the enrichment of surface oxygen vacancies and enhances CO adsorption activation. The defects and nanoconfined domains have been shown to synergistically optimize active site exposure and the reaction pathway, thus promoting catalytic performance breakthrough.

3.3. Surface Modification Engineering

The field of surface modification engineering has been shown to enhance the dynamic interaction mechanism between active sites and reactants in the nanoconfined space by modulating the interfacial chemical properties and surface microenvironment of nanoconfined systems. The core function of the system is to introduce specific functional groups or charge distributions at nanoconfined interfaces to precisely regulate the electronic density of states in the active site and the strength of intermediate adsorption. Concurrently, surface modification optimizes the mass transfer kinetics in the nanoconfined channel, reduces the reactant diffusion barrier and enhances the local concentration gradient effect. Furthermore, surface modification engineering has been demonstrated to inhibit the migration and loss of active components through the construction of strong interfacial chemical bonds or spatial site-barrier effects, thereby significantly enhancing the chemical stability of the catalytic system. This modification strategy, founded upon interfacial electronic coupling and mass transfer synergy, integrates the spatial confinement effect of nanoconfined domain catalysis with the depth of surface chemical regulation. This provides a dynamically tunable interfacial regulation dimension for the efficient directed conversion of complex catalytic reactions [139,140,141,142].
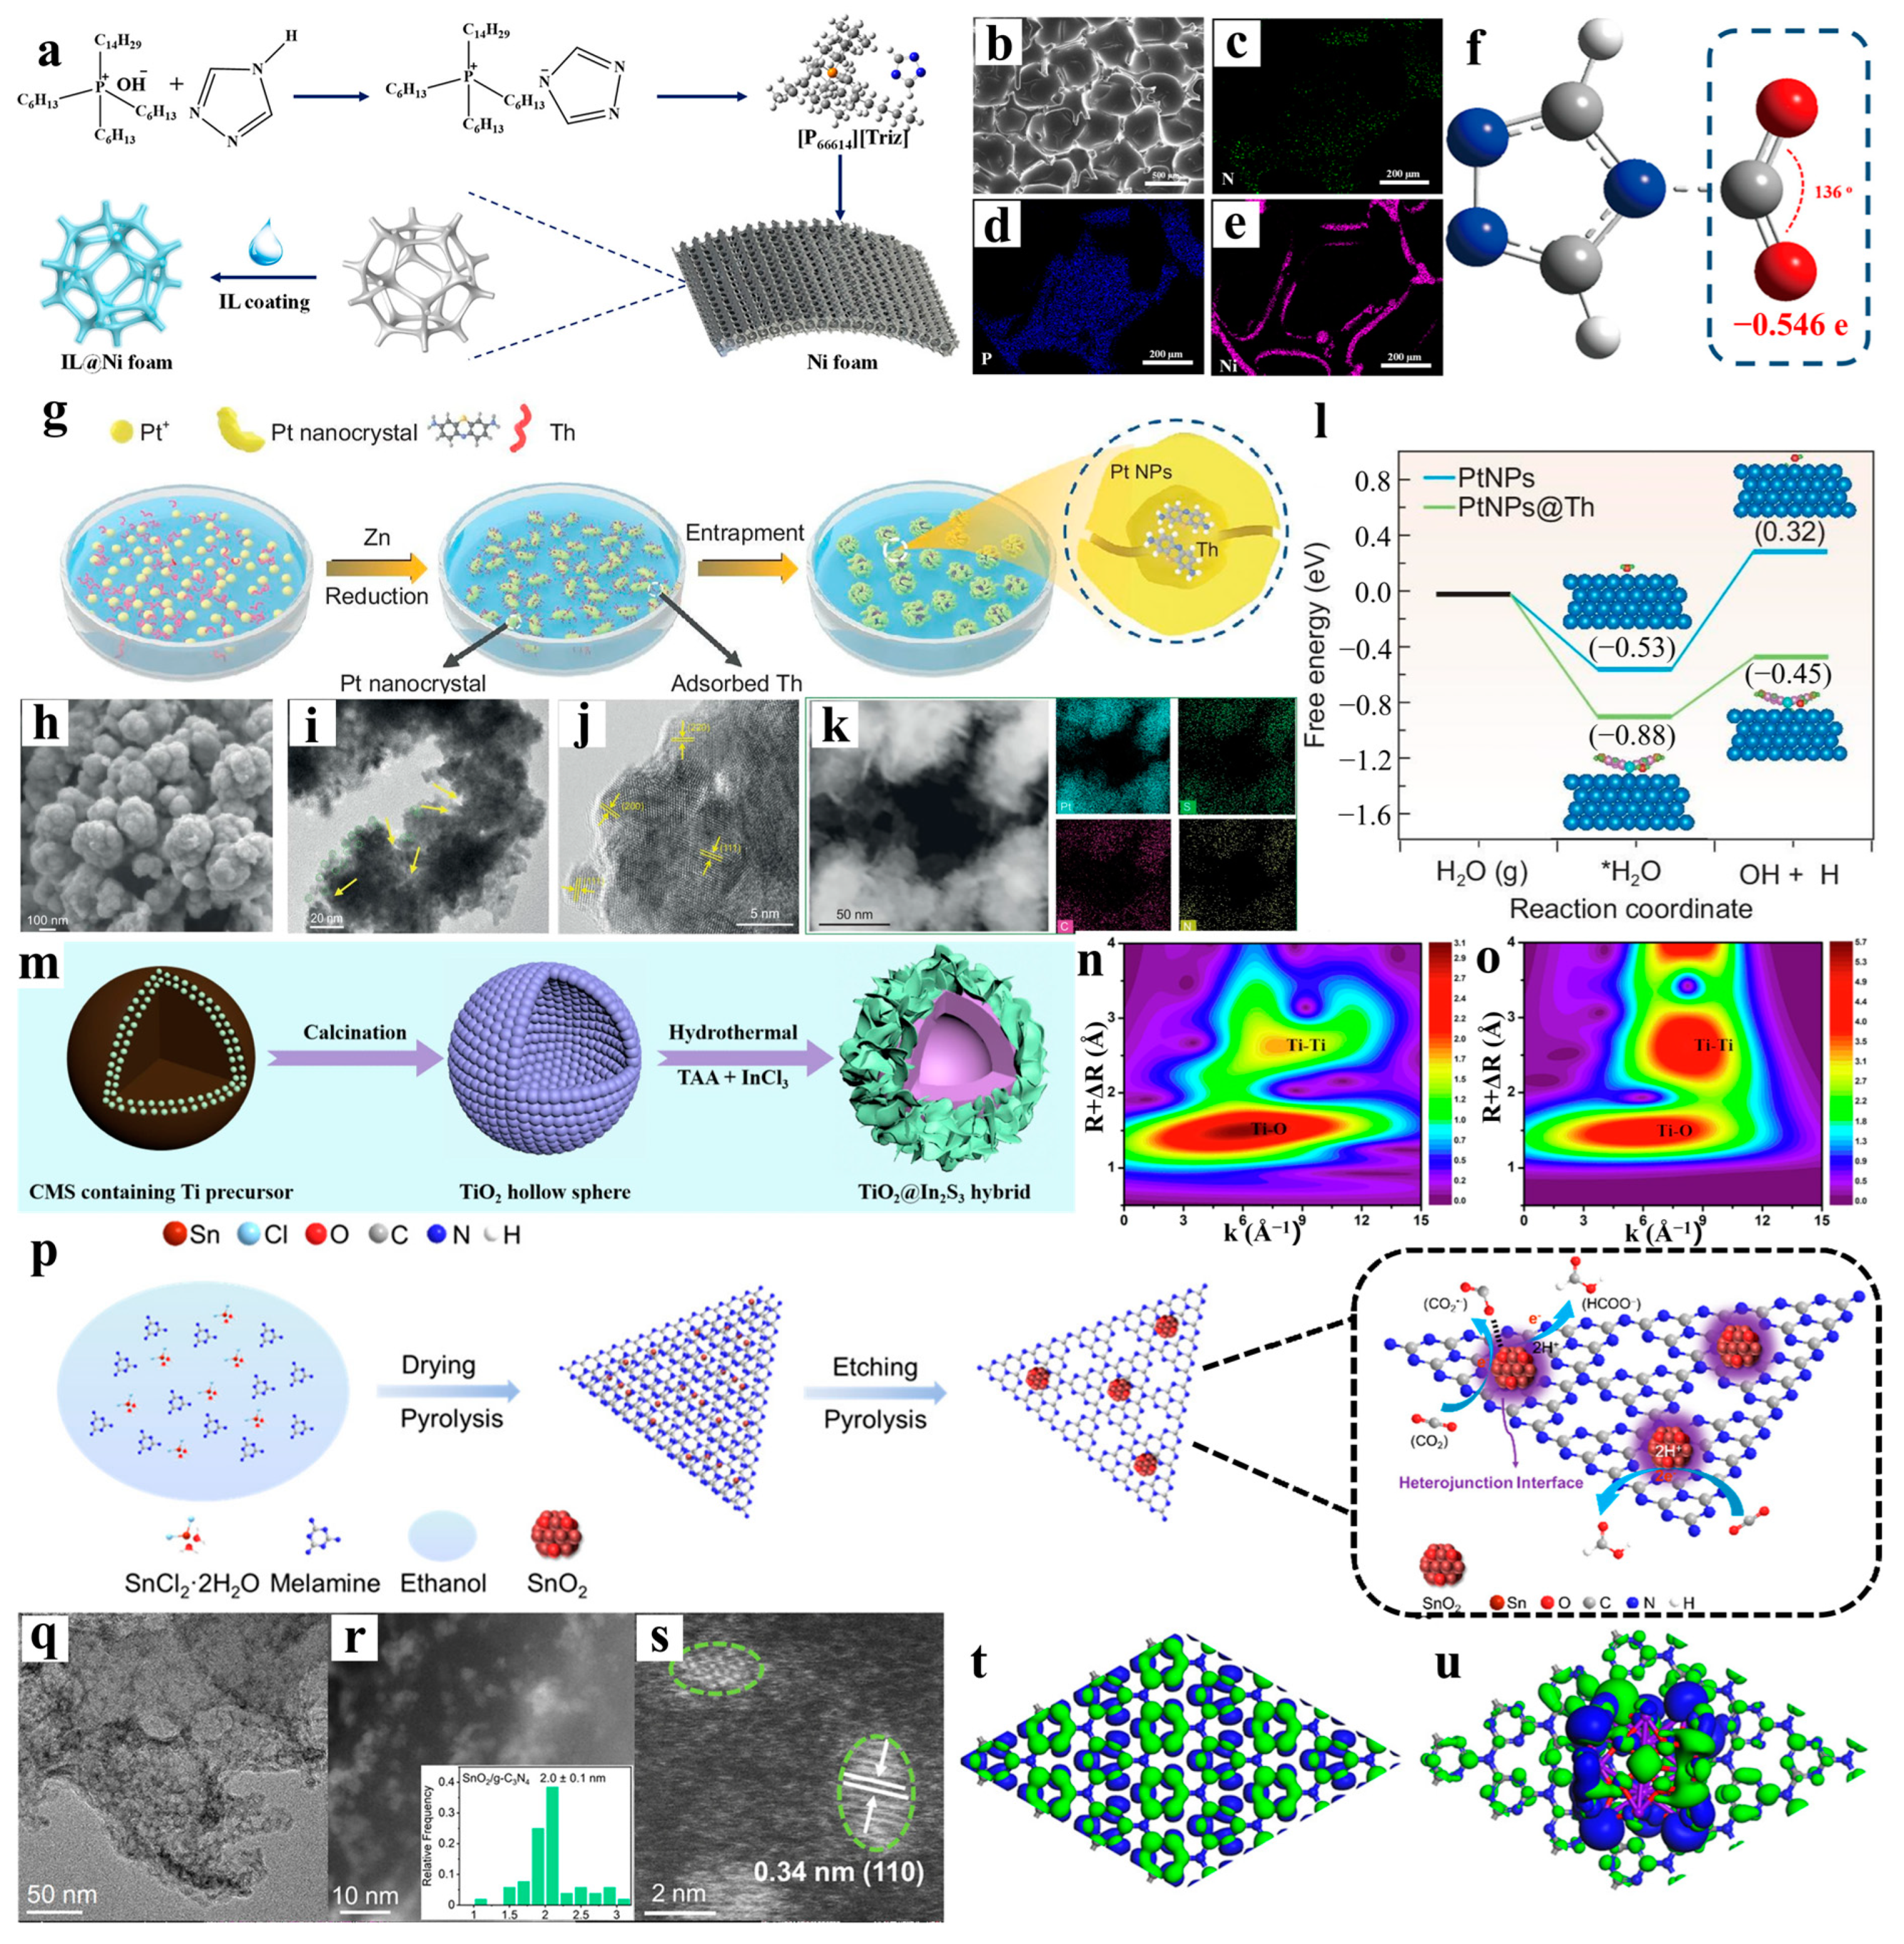
Surface modification engineering modulates interfacial electronic states and directional distribution of active sites, thereby optimizing reaction pathways and reducing energy barriers, thus advancing nanoconfined catalysis development. Feng et al. constructed a nanoconfined catalytic system by encapsulating superbase ionic liquid [P66614][Triz] within nickel foam pores through surface modification engineering [143]. The researchers dissolved the super basic ionic liquid [P66614][Triz] in isopropanol and then utilized a drop-coating technique to introduce it into the pores of acid-wash-treated nickel foams. These foams were then subjected to vacuum drying, a process that resulted in the formation of a self-supported catalyst (Figure 14a). SEM maps confirmed the uniform coverage of the nickel skeleton by IL (Figure 14b). N/P elemental distribution maps confirmed the successful loading of IL onto the nickel foam (Figure 14c–e). The ionic liquid modifies the nickel surface by bending and carrying a negative charge (−0.546 e) on the CO2 molecules through the strong chemical interaction of its superbase anion with CO2, which significantly reduces the reduction energy barrier (Figure 14f). Yang et al. confined thionine (Th) molecules within platinum nanocrystals via molecular doping, enabling efficient acidic CO2 electroreduction to methane [37]. In order to synthesize the composite structure of Pt nanocrystalline coated Th in a Th solution, it was necessary to reduce Pt2+ in zinc powder. This process was carried out in a single step (Figure 14g). The results of the SEM, TEM and HRTEM analyses showed the “bud” structure of Pt nanocrystals interwoven with Th molecules (Figure 14h–j). The EDX spectra confirmed the uniform distribution of C, N, and S (Th molecular elements) in the Pt matrix, and the molecular confinement was verified (Figure 14k). Theoretical calculations showed that the Th–Pt interface lowers the water decomposition energy barrier (0.43 eV vs. 0.85 eV for pure Pt), increases the *H supply and synergistically modulates the reaction pathway (Figure 14l). You et al. engineered hollow TiO2@In2S3 heterostructures through combined surface modification and nanoconfinement strategies [144]. The construction of the hollow structure was achieved by employing the complex template method (carbon sphere template) in conjunction with the hydrothermal vulcanization method. The shell layer was composed of a TiO2 composite with In2S3 nanoparticles (Figure 14m). Concerning the surface modification, the radial distance of the Ti-O coordination peaks in the WT contour plot of InTi-0.54 was shortened and their intensity was weakened. This directly confirmed the presence of oxygen vacancies and the coordination unsaturated state of Ti, which enhanced the CO2 adsorption capacity (Figure 14n,o). This nanoconfined spatially synergistic heterojunction effect effectively suppresses photogenerated carrier complexation, demonstrating a synergistic enhancement mechanism between surface modification and spatial confinement. Zhang et al. fabricated 0D/2D SnO2/g-C3N4 heterojunctions via surface modification engineering [145]. The 0D/2D heterojunction is formed by wet chemical mixing of SnCl2 and melamine, followed by pyrolysis and oxidative etching (Figure 14p). SEM/TEM showed that SnO2 nanodots (~2 nm) were uniformly loaded on g-C3N4 nanosheets, forming a porous layered structure (Figure 14q,r). HAADF-STEM further confirmed the lattice (0.34 nm, corresponding to the SnO2(110) crystal plane) and size distribution (average ~2 nm) of the SnO2 nanodots (Figure 14s). The p–p orbital coupling at the interface has been shown to promote efficient electron transfer from the electron-rich g-C3N4 to SnO2, which optimizes the electronic structure of the active site (Figure 14t,u). This strategy effectively overcomes the selectivity limitations of conventional Sn-based catalysts through nanoconfined size tuning and interfacial electronic engineering, offering a novel paradigm for nanoconfined catalytic design.

4. Application and Analysis of Nanoconfined Catalysis in Various Catalytic Fields

Thermal catalysis drives high-temperature reactions (e.g., methane reforming, Fischer–Tröpsch synthesis) to achieve efficient conversion of carbon-based fuels and resource utilization of industrial exhaust gases. Electrocatalysis utilizes electrical energy to reduce CO2 into high-value chemicals (e.g., CO, CH3OH), coupling with renewable energy sources to enable a low-carbon cycle. Photocatalysis harnesses solar energy to excite charge carriers, directly splitting water to produce hydrogen or converting CO2 into hydrocarbon fuels, offering green pathways for distributed clean energy systems. These three approaches, leveraging thermal, electrical, and solar energy inputs, respectively, synergistically advance efficient carbon resource utilization and carbon neutrality goals. Nanoconfinement catalysis has found applications across all three fields, and analysis of these applications is critical to deepen our understanding of the advantages of nanoconfinement.

4.1. Thermal Catalysis

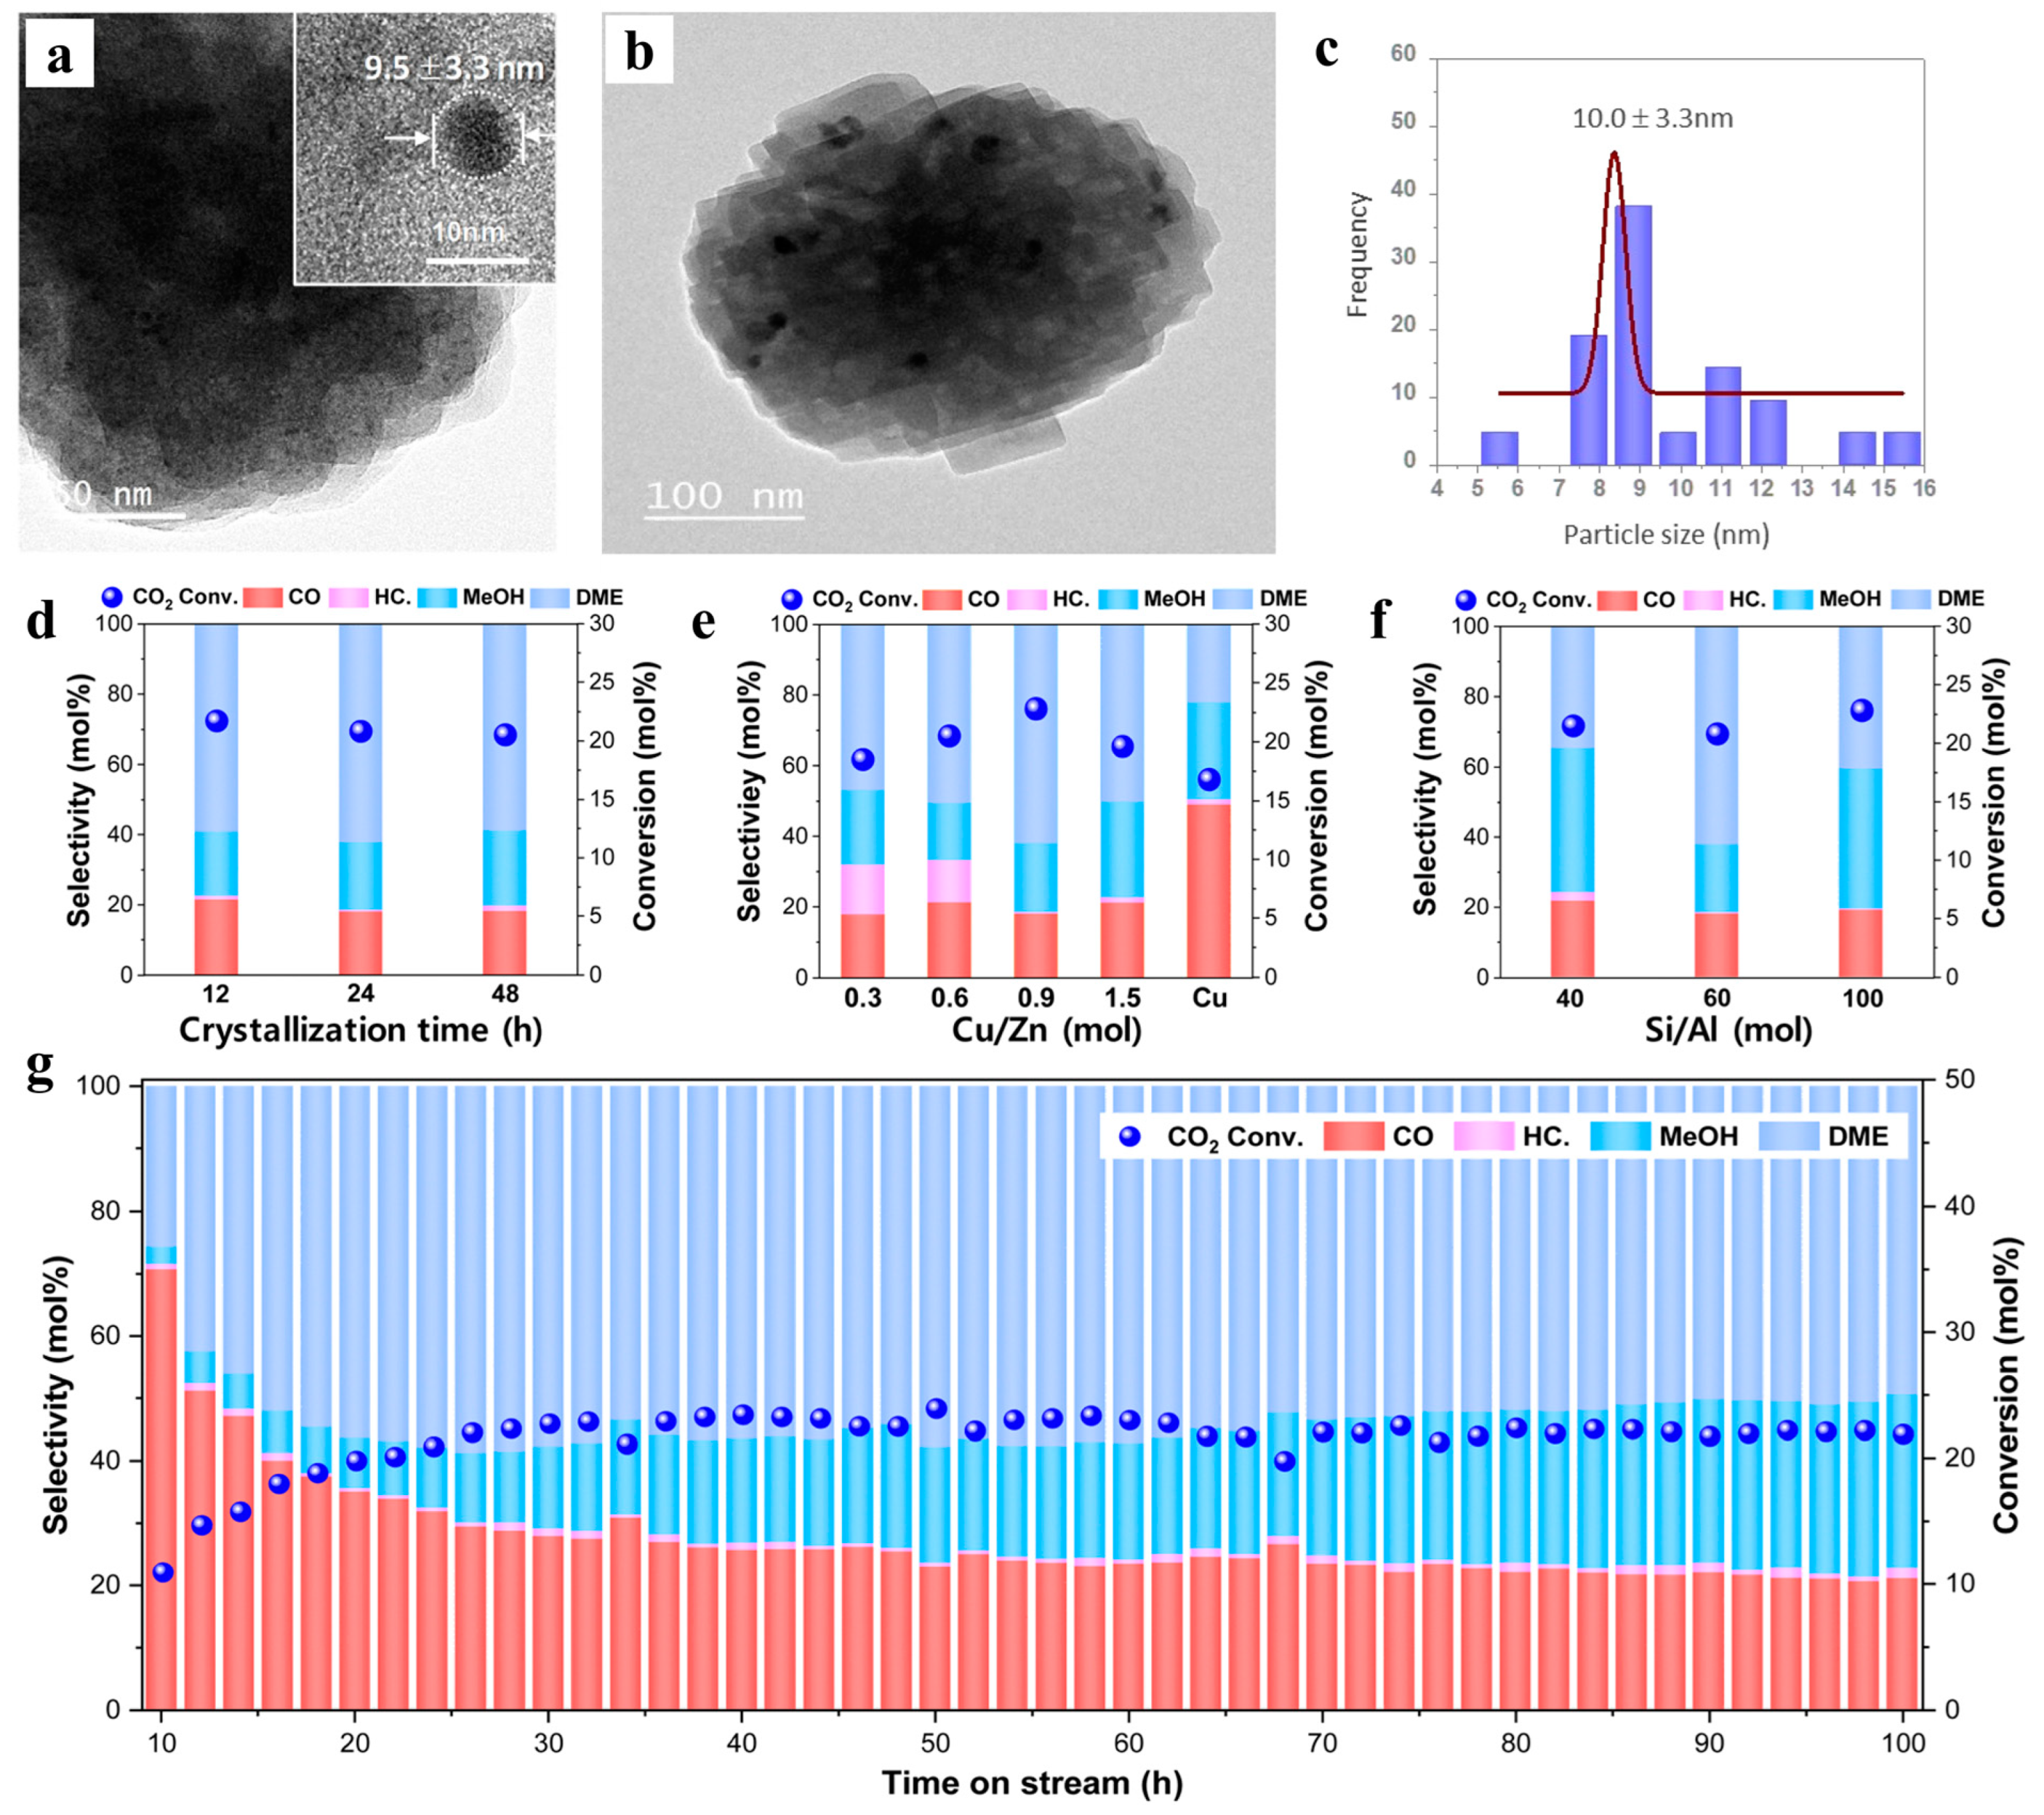
The Wang team developed a novel Cu-ZnO@ZSM-5 core-shell catalyst, encapsulating Cu-ZnO nanoparticles within ZSM-5 zeolite layers via a steam-assisted crystallization method for efficient catalytic CO2 hydrogenation to dimethyl ether (DME) and methanol [108]. Their study revealed that the spatial confinement effect of ZSM-5 effectively suppressed sintering and oxidation of the Cu-ZnO nanoparticles (Figure 15a–c). By optimizing the Cu/Zn molar ratio (0.9), Si/Al ratio (60), and crystallization time (24 h), the catalyst demonstrated exceptional performance at 260 °C and 5 MPa: CO2 conversion reached 20.8%, total methanol/dimethoxy ethane selectivity attained 81.6% (with dimethoxy ethane accounting for 62.2%), and stable operation was maintained for 100 h (Figure 15d–g).
He et al. resolved the challenges of sintering-induced deactivation and insufficient metal exposure in traditional Ni-based catalysts under high-temperature conditions by constructing a dually confined microenvironment [51]. Dynamic sintering rate analysis revealed that Ni/S-SBA-15-OH exhibited an extremely low sintering rate of 0.7%/h (Figure 16a,b), significantly lower than other catalysts. Pyridine-IR demonstrated that Ni/S-SBA-15-OH possessed the highest number of Lewis acid sites, originating from electron transfer between Ni and the hydroxylated support (Figure 16c). In situ CH4-DRIFTS and CH4-temperature-programmed surface reaction mass spectrometry (TPSR-MS) confirmed the strongest CH4 adsorption and activation capabilities of Ni/S-SBA-15-OH (Figure 16d–f). Additionally, the reaction pathway over Ni/S-SBA-15-OH featured an explicit *CHO intermediate (Figure 16g,h). Differential charge density and phononic density of states (PDOS) analyses revealed strong electronic interactions between Ni nanoparticles and the support, evidenced by hybridization of Ni d-orbitals with Si s/p-orbitals (Figure 16i,j).

4.2. Photocatalysis

Meng et al. [107] developed a novel Bi/TiO2 photocatalyst by anchoring Bi clusters onto porous TiO2 nanowires through alkali thermal synthesis, acid etching, high-temperature treatment, and wet impregnation (Figure 17a). The TiO2 nanowires exhibited a 1D structure with an average mesopore diameter of 6.6 nm on the nanowire walls, while Bi clusters (~2.2 nm) were confined within the pores (Figure 17b,c). The specific surface area of Bi/TiO2 (112.24 m2/g) surpassed that of pure TiO2 (73.86 m2/g) (Figure 17d). The Bi/TiO2 achieved 86.8% selectivity for CH4, significantly higher than TiO2 (46.2%), with a stable yield over five cycles, confirming structural robustness (Figure 17e,f). Electrochemical analysis revealed a smaller impedance arc radius for Bi/TiO2, indicating faster charge transfer (Figure 17g). The significantly reduced photoluminescence intensity of Bi/TiO2 suggested that Bi acted as an electron acceptor to suppress carrier recombination (Figure 17h). Bi/TiO2 exhibited a higher photocurrent density, verifying the enhanced separation efficiency of the photogenerated electron-hole pairs (Figure 17i). XPS analysis demonstrated that under light, Ti 2p and O 1s peaks shifted to lower and higher binding energies, respectively, reflecting electron transfer from O to Ti. The Bi 4f peaks shifted to lower binding energies, indicating Bi participated as an electron donor during the reduction process (Figure 17j–l).
Li et al. [109] effectively regulated the product selectivity of CO2 photoreduction by precisely controlling the spatial positions (within the core, at the interface, and on the shell surface) of PtCu alloy cocatalysts in the core-shell structured UiO-66@ZnIn2S4 (Figure 18a). The high specific surface area of UiO-66 dominated the adsorption performance of the composite. When PtCu was positioned closer to UiO-66 (PtCu/UiO/ZIS), the CO2 adsorption capacity increased due to the unblocked pores of UiO-66 (Figure 18b). PtCu/UiO/ZIS primarily produced CO (52.1%) and H2 (28.4%), UiO/PtCu/ZIS selectively generated CH3OH (72.7%), and UiO/ZIS/PtCu mainly yielded CH4 (88.8%). The O2 production followed the order: PtCu/UiO/ZIS < UiO/PtCu/ZIS < UiO/ZIS/PtCu (Figure 18c,d). Experimental analysis revealed that the photocurrent density sequence—UiO/ZIS/PtCu > UiO/PtCu/ZIS > PtCu/UiO/ZIS—indicated that surface-anchored PtCu most effectively promoted charge separation, reflecting a positive correlation between product selectivity and charge separation efficiency (Figure 18e). The decreasing trend in PL intensity further supported the suppression of charge recombination (Figure 18f). Similarly, the gradual reduction in charge transfer resistance (Rct) demonstrated that external PtCu placement lowered interfacial impedance and accelerated electron transport (Figure 18g).

4.3. Electrocatalysis

Mo et al. [52] developed a composite catalyst, Ru3-SCs@Ni-PCN-222-PyrA, featuring Ni-PCN-222-PyrA-supported triruthenium single clusters (Ru3-SCs) for efficient electrocatalytic CO2 reduction to methane. Using a pre-coordination strategy, Ru3(CO)12 was encapsulated into the PyrA-modified Ni-PCN-222 channels, followed by microwave treatment to release CO and form Ru3 single clusters (Figure 19a). The Ru3 formed single clusters (≈0.8 nm, bright spots composed of three atoms) in Ru3-SCs@Ni-PCN-222-PyrA, while Ru-SAs@Ni-PCN-222-PyrA exhibited isolated single-atom bright spots, providing a basis for subsequent performance comparisons (Figure 19b–e). LSV curves demonstrated that Ru3-SCs@Ni-PCN-222-PyrA achieved a significantly higher current density (−68 mA∙cm−2 at −1.5 V vs. RHE) than Ru-SAs@Ni-PCN-222-PyrA (Figure 19f). Additionally, Ru3-SCs@Ni-PCN-222-PyrA exhibited superior CH4 selectivity (71.8% at −1.0 V vs. RHE) compared to Ru-SAs@Ni-PCN-222-PyrA (16.8%) and Ni-PCN-222 (10.1%) under the same applied potential (Figure 19g,h). Simulations of the Gibbs free energy profiles showed that the energy barrier for *CO and *H coupling to form *CHO on Ru3-SCs was significantly lower than that on Ru-SAs, confirming that the synergistic effect reduced the reaction difficulty (Figure 19i). After CO2 adsorption on the active Ru3-SCs, a series of proton-coupled electron transfer processes occurred, forming intermediates such as *COOH, *CO, *CHO, *CH2O, and *CH3O, ultimately yielding the final product, CH4.
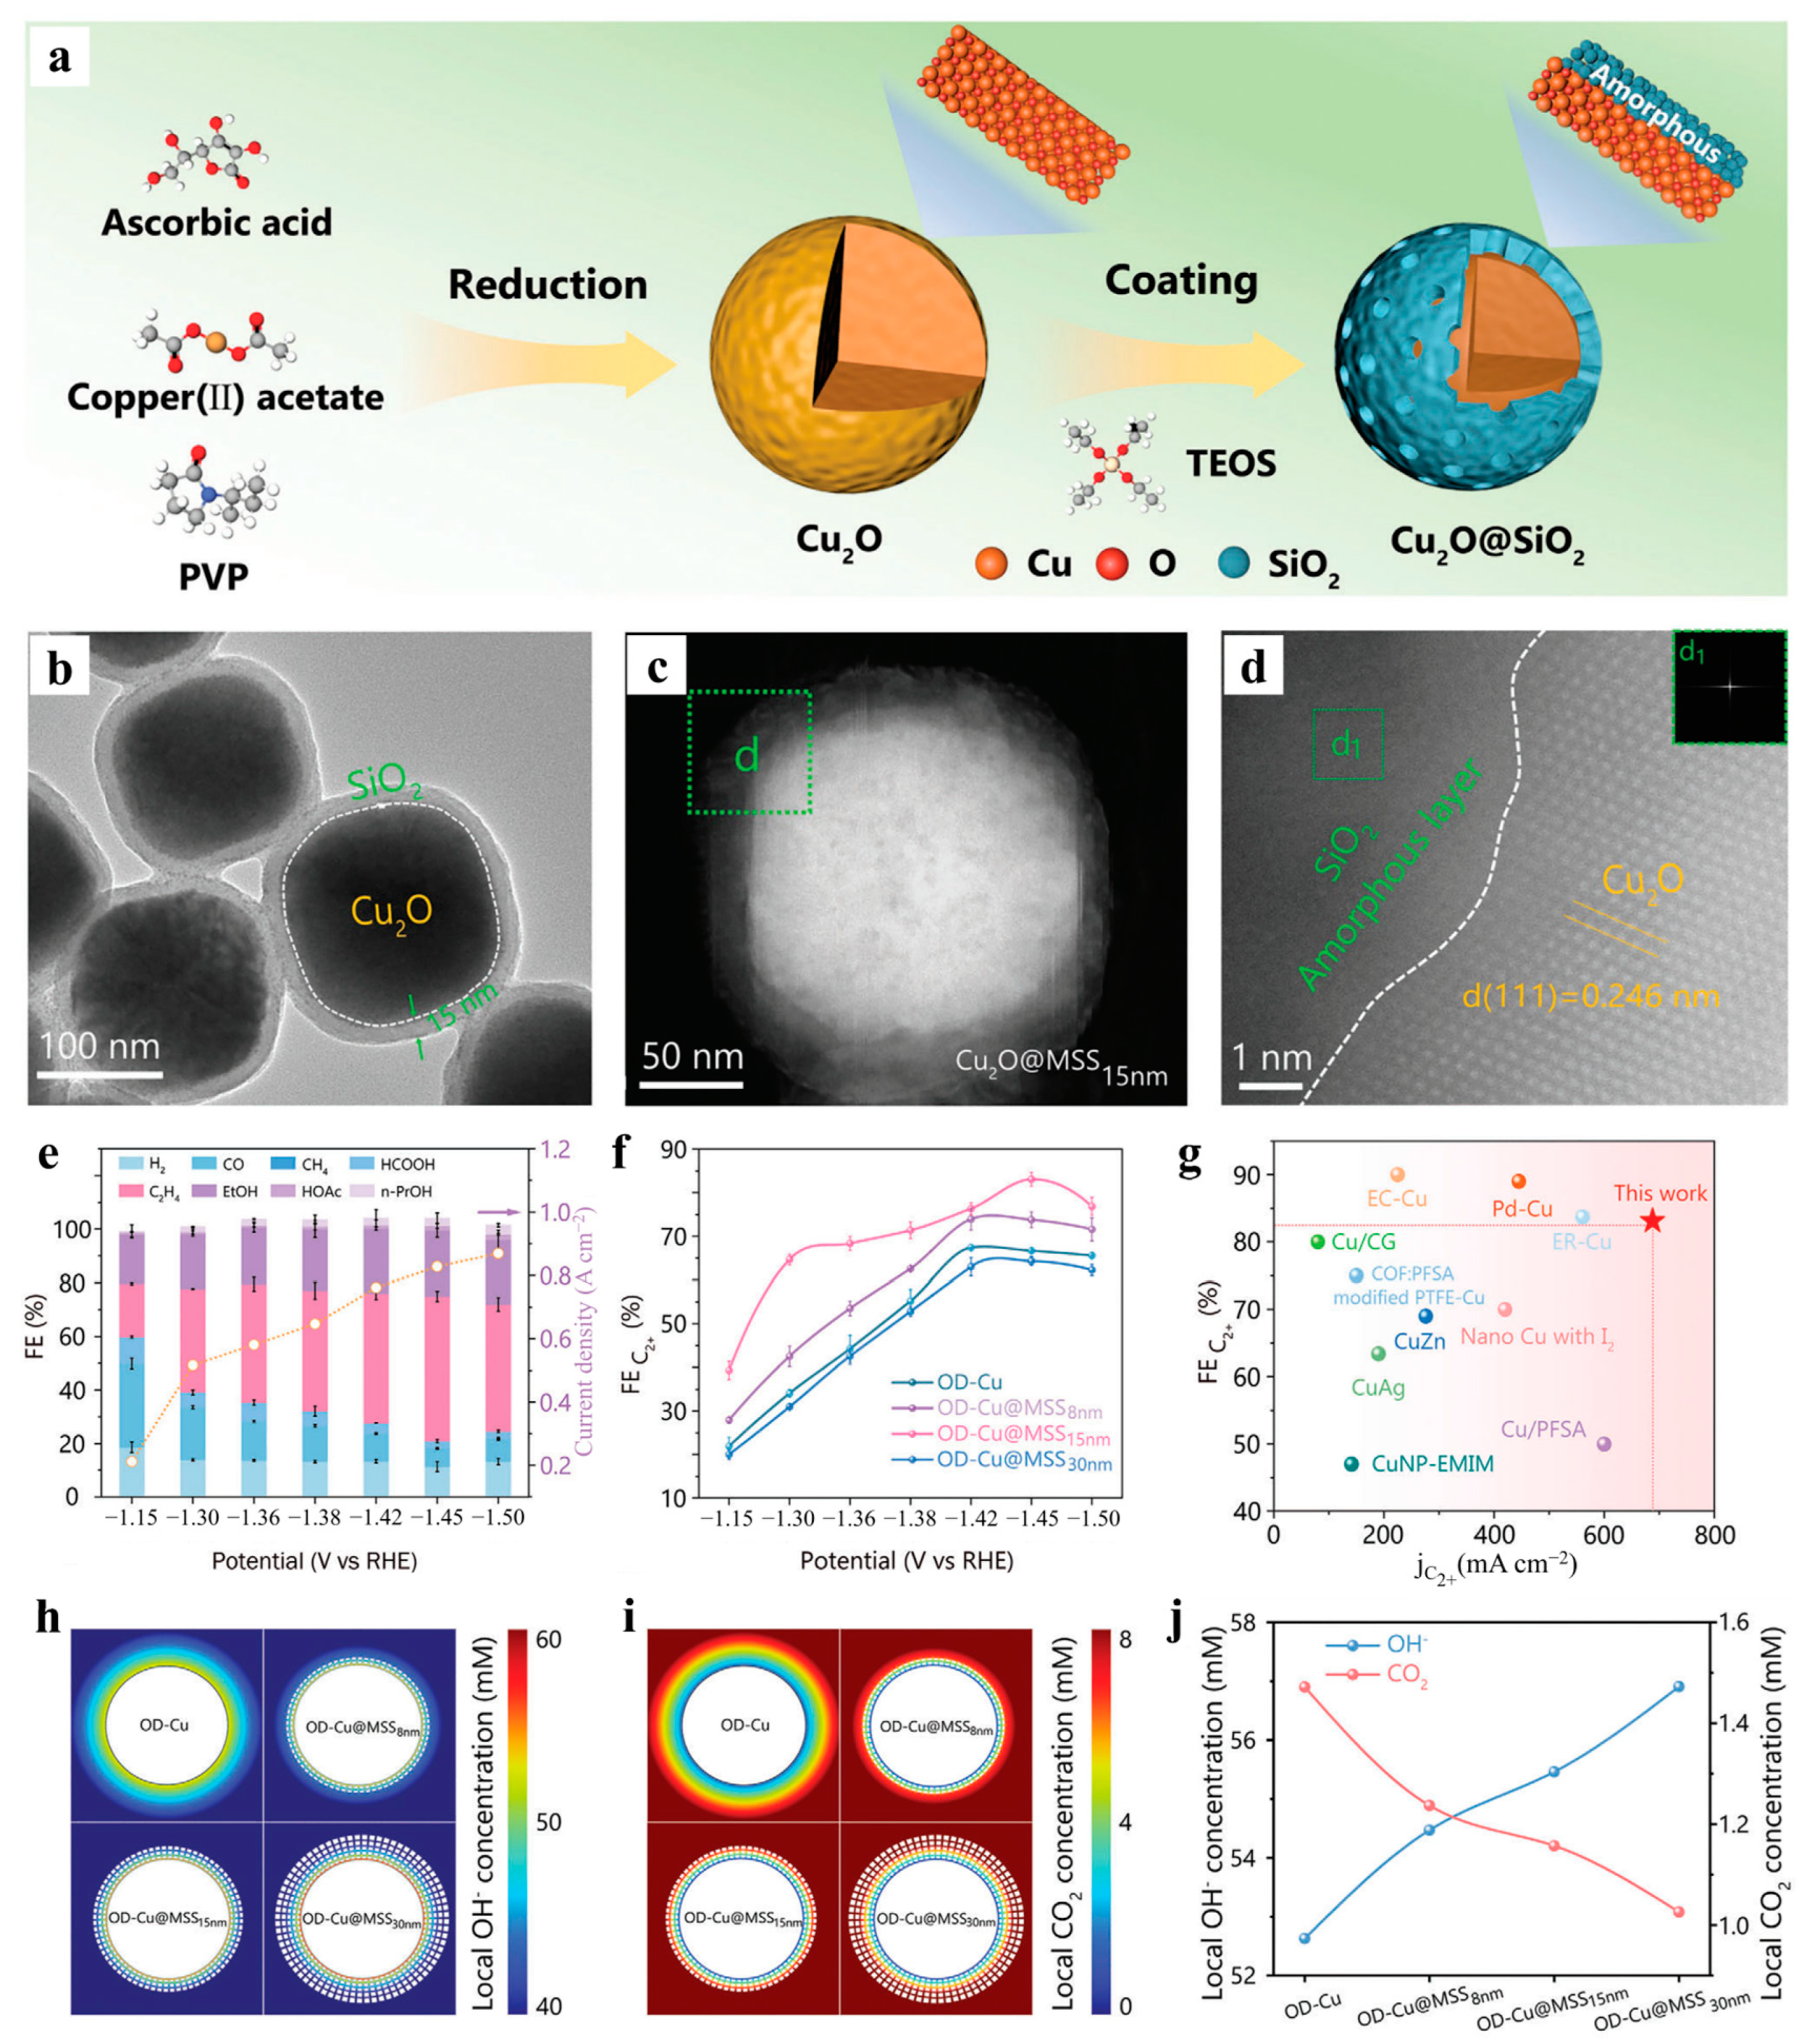
Wang et al. [110] investigated the regulatory mechanism of mesoporous SiO2 shell-coated Cu2O nanospheres for CO2 electroreduction to multi-carbon products (C2+). The synthesis involved preparing Cu2O cores and controlling the SiO2 shell thickness via the Stöber method (Figure 20a). TEM and HAADF-STEM images revealed the core-shell structure of Cu2O@MSS15nm (Figure 20b,c). Atomic-resolution HAADF-STEM images confirmed the Cu2O (111) crystal plane (0.246 nm lattice spacing) in the core region and the amorphous SiO2 shell (no lattice fringes) (Figure 20d). Performance tests showed that OD-Cu@MSS15nm achieved the highest C2+ Faradaic efficiency (FE) of 83.1% at −1.45 V vs. RHE (Figure 20e). A volcano-type relationship between C2+ FE and shell thickness was observed, with 15 nm thickness yielding optimal performance (Figure 20f). Compared to other catalysts, OD-Cu@MSS15nm exhibited leading C2+ current density (687.8 mA cm−2) and FE (Figure 20g). Multiphysics simulations revealed that an increased shell thickness elevates the local OH concentration (suppressing HER) but reduces the CO2 concentration, with these tradeoffs governing the volcano-type trend (Figure 20h–j).

5. Summary and Outlook

Nanoconfined catalysts enhance reaction efficiency, reduce energy consumption, and suppress byproduct emissions through precise regulation of active sites. By efficiently catalyzing carbon-based energy conversion and clean energy synthesis, they promote carbon cycling, mitigate greenhouse gas emissions, and provide critical technological support for green industries and climate governance. This paper focused on the application of nanoconfined catalytic technology in carbon-based energy conversion (e.g., CO2 and CH4 conversion), constructing a complete logical framework through progressive layers: background significance, classification mechanisms, optimization strategies, and application analysis. First, starting from the global energy transition and dual-carbon strategy, we emphasized the central role of greenhouse gas catalytic conversion technologies, discussing the performance of photo-/electro-/thermal catalysis versus emerging nanoconfined catalysis, highlighting the unique advantages of nanoconfined catalysis in modulating reaction pathways and enhancing selectivity and stability. Subsequently, under the theme of “confinement dimensions”, we systematically summarized four types of nanoconfined catalytic systems from the perspective of microstructural analysis and provided generalized conclusions. Next, we focused on three primary engineering tools for optimizing nanoconfined catalysts: heteroatom doping engineering to improve electrical conductivity and intermediate adsorption via electronic structure modification; defect engineering to lower reaction barriers through targeted construction of intrinsic defects; and surface modification to synergistically regulate local microenvironments via chemical modification and spatial confinement. Finally, we presented detailed analyses of nanoconfined catalysis applications across various catalytic fields. We believe research enthusiasm for nanoconfined catalytic materials will persist for an extended period. Therefore, we outline the challenges and prospects humanity faces in this field.
(I)
Although various structures have been developed to meet the demand for nanoconfined materials, creating nanoconfined materials that are easy to prepare, have excellent properties, exhibit structural stability, and can be applied in various environments remains a major challenge.
(II)
The coupled mechanisms of mass transfer, electronic effects, and interfacial chemistry in confined microenvironments have not been clarified, leading to difficulties in theoretical design.
(III)
Existing synthetic methods make it difficult to precisely control the size, shape and active site distribution of the confined cavity (e.g., uneven mass transfer due to the deviation of one-dimensional channel diameters), and the structure is prone to collapse at high temperature/pressure.
(IV)
Although the nanoconfined space can enrich reactants, the narrow channels tend to lead to increased mass transfer resistance (e.g., decreased CO2 diffusion rate in 3D MOF pores), limiting the overall reaction rate.
(V)
Laboratory-scale nanoconfined catalysts are complicated to synthesize (e.g., growing a graphene cover layer by the CVD method) and have high precious metal dependence (e.g., Pt-based confined systems), which makes it challenging to meet the demand for scale-up applications.
(VI)
Existing studies have mainly focused on single gas (e.g., CO2 or CH4) conversion and are not sufficiently adapted to real industrial exhaust gases (with SOx/NOx impurities) or liquid reaction systems (e.g., biomass-derived liquids).
Future research strategies should focus on the following aspects to address the above challenges. (i) Constructing multi-scale computational models (DFT + machine learning) to quantify the effects of microenvironmental parameters (electric field strength, local pH) on reaction pathways. (ii) Designing model catalysts (e.g., single-atom arrays, bionic confined cavities) to isolate single variables and reveal key regulatory factors (e.g., the contribution of H2O molecular arrangement in the confined space to HER inhibition). (iii) Integrating knowledge and methods from multiple disciplines, such as materials science, chemistry, physics, and computational science, to form a collaborative research mechanism to promote research progress on nanoconfined catalysis through interdisciplinary collaboration. (iv) Using advanced characterization techniques such as synchrotron radiation light sources, aberration-corrected transmission electron microscopy, and in situ characterization techniques to deeply reveal the microstructure and catalytic mechanism of nanoconfined catalysts and to provide accurate data support and theoretical guidance for research on nanoconfined catalysis.
Finally, we hope that this review will provide researchers with valuable insights into nanoconfined catalysis in carbon-based energy conversion, thereby promoting further advancements in related research on nanoconfined catalysis. Although we have summarized some of the applications of confined catalysis in carbon-based energy conversion in recent years, there is still a long way to go before it can be scaled up for industrial applications in the future. Nanoconfined catalytic technology needs to break through the three aspects of “precise structure, clear mechanism, and green process”, and through interdisciplinary synergy (material computation, in situ characterization, engineering thermodynamics) to achieve the leap from basic research to industrial implementation, and ultimately promote the construction of high-efficiency and low-carbon energy systems under the dual-carbon goal.

Author Contributions

Q.F.: Methodology, formal analysis, writing—original draft. Q.S.: Formal analysis, writing—original draft. J.G. Formal analysis, writing—review and editing. H.W.: Project administration, funding acquisition, supervision. J.Q.: Conceptualization, methodology, supervision, writing—review and editing. All authors have read and agreed to the published version of the manuscript.

Funding

This work was supported by the Special Fund for Basic Scientific Research of Central Colleges, Northeastern University under Grant (2023GFZD001, 2024GFZD001).

Data Availability Statement

No new data were created or analyzed in this study.

Conflicts of Interest

The authors declare that the research was conducted in the absence of any commercial or financial relationships that could be construed as a potential conflict of interest.

Abbreviations

The following abbreviations are used in this article:
RWGSReverse water gas shift
MOFMetal organic framework
SEMScanning electron microscope
EDSEnergy dispersive spectroscopy
TEMTransmission electron microscope
HR-TEMHigh-resolution transition electron microscopy
EDXEnergy dispersive X-ray spectroscopy
DFTDensity functional theory
HAADF-STEMHigh angle angular dark field-scanning transmission electron microscopy
XPSX-ray photoelectron spectroscopy
ORROxygen reduction reaction
DMEDimethyl ether
LSVLinear sweep voltammetry
FEFaradaic efficiency
RHEReversible hydrogen electrode
EISElectrochemical impedance spectroscopy
TOFTurnover frequency
CNTsCarbon nanotubes
GDYGraphdiyne
CVDChemical vapor deposition
CZZCu-ZnO-ZrO2
MMMsMixed matrix membranes
SPSSpark plasma sintering
DRIFTSDiffuse reflectance infrared Fourier transform spectroscopy
TPSR-MSTemperature-programmed surface reaction mass spectrometry
PDOSPhononic density of states
PLPhotoluminescence
WTWavelet transform
EXAFSExtended X-ray absorption fine structure
FFTFast Fourier transform
ACAberration-corrected
HERHydrogen evolution reaction
PCNPorous carbon nitride
MSSMesoporous silica shell
C2+Multi-carbon products
FTSFischer–Tröpsch synthesis

References

  1. Dorian, J.P.; Franssen, H.T.; Simbeck, D.R. Global challenges in energy. Energy Policy 2006, 34, 1984–1991. [Google Scholar] [CrossRef]
  2. Khan, H.; Weili, L.; Khan, I.; Oanh, L.t.K. Recent advances in energy usage and environmental degradation: Does quality institutions matter? A worldwide evidence. Energy Rep. 2021, 7, 1091–1103. [Google Scholar] [CrossRef]
  3. Yalew, S.G.; van Vliet, M.T.H.; Gernaat, D.E.H.J.; Ludwig, F.; Miara, A.; Park, C.; Byers, E.; De Cian, E.; Piontek, F.; Iyer, G.; et al. Impacts of climate change on energy systems in global and regional scenarios. Nat. Energy 2020, 5, 794–802. [Google Scholar] [CrossRef]
  4. Zhao, B.; Zhang, W.; Wang, P.; D’Imperio, L.; Liu, Y.; Elberling, B. Predicting CO2 and CH4 fluxes and their seasonal variations in a subarctic wetland under two shared socioeconomic pathway climate scenarios. Agric. For. Meteorol. 2025, 362, 110359. [Google Scholar] [CrossRef]
  5. Manisalidis, I.; Stavropoulou, E.; Stavropoulos, A.; Bezirtzoglou, E. Environmental and health impacts of air pollution: A review. Front. Public Health 2020, 8, 14. [Google Scholar] [CrossRef]
  6. Reşitoğlu, İ.A.; Altinişik, K.; Keskin, A. The pollutant emissions from diesel-engine vehicles and exhaust aftertreatment systems. Clean Technol. Environ. Policy 2014, 17, 15–27. [Google Scholar] [CrossRef]
  7. Huang, M.; Zhai, P. Achieving paris agreement temperature goals requires carbon neutrality by middle century with far-reaching transitions in the whole society. Adv. Clim. Chang. Res. 2021, 12, 281–286. [Google Scholar] [CrossRef]
  8. Wu, Z.; Huang, X.; Chen, R.; Mao, X.; Qi, X. The United States and China on the paths and policies to carbon neutrality. J. Environ. Manag. 2022, 320, 115785. [Google Scholar] [CrossRef]
  9. Zhang, X.; Luo, H.; Zeng, X.; Zhou, C.; Shu, Z.; Li, H.; Fei, Z.; Liu, G. Research on regional economic development and natural disaster risk assessment under the goal of carbon peak and carbon neutrality: A case study in Chengdu-Chongqing economic circle. Land Use Pol. 2024, 143, 107206. [Google Scholar] [CrossRef]
  10. Pan, X.; Xu, J.; Wang, Y.; Ma, M.; Liao, H.; Sun, H.; Fan, M.; Wang, K.; Sun, K.; Jiang, J. A new perspective on hydrogenation of CO2 into methanol over heterogeneous catalysts. Prog. Nat. Sci. Mater. Int. 2024, 34, 482–494. [Google Scholar] [CrossRef]
  11. Taherian, Z.; Shahed Gharahshiran, V.; Wei, X.; Khataee, A.; Yoon, Y.; Orooji, Y. Revisiting the mitigation of coke formation: Synergism between support & promoters’ role toward robust yield in the CO2 reformation of methane. Nano Mater. Sci. 2024, 6, 536–547. [Google Scholar]
  12. Wang, W.; Han, Z.; Wang, H.; Wei, X.; Zhong, R.; Qi, J. Construction of Co/Mn-based nanowires with adjustable surface state for boosting lean methane catalytic oxidation. Ceram. Int. 2024, 50, 2293–2302. [Google Scholar] [CrossRef]
  13. Wang, W.; Qiu, R.; Li, C.; Zhong, R.; Wang, H.; Qi, J. Advancing catalytic oxidation of lean methane over cobalt-manganese oxide via a phase-engineered amorphous/crystalline interface. Chem. Commun. 2024, 60, 8896–8899. [Google Scholar] [CrossRef] [PubMed]
  14. Wang, W.; Wei, R.; Zhu, Q.; Fu, Z.; Zhong, R.; Wang, H.; Qi, J. ZIF-67-derived hollow dodecahedral Mn/Co3O4 nanocages with enrichment effect and good mass transfer for boosting low temperature catalytic oxidation of lean methane. J. Environ. Chem. Eng. 2024, 12, 113783. [Google Scholar] [CrossRef]
  15. Wang, W.; Zeng, C.; Tsubaki, N. Recent advancements and perspectives of the CO2 hydrogenation reaction. Green Carbon 2023, 1, 133–145. [Google Scholar] [CrossRef]
  16. Wang, Z.; Wei, Y.; Qi, J.; Wan, J.; Wang, Z.; Yu, R.; Wang, D. Mass transfer modulation by hollow multi-shelled structures for high space-time yield synthesis of light olefins from syngas. Adv. Funct. Mater. 2024, 34, 2316547. [Google Scholar] [CrossRef]
  17. Hu, K.; Tian, J.; Zhou, Z.; Zhao, D.; Guan, X. Direct Z-scheme photocatalytic systems based on vdW heterostructures for water splitting and CO2 reduction: Fundamentals and recent advances. Microstructures 2024, 4, 2024021. [Google Scholar] [CrossRef]
  18. Ji, W.; Liu, J.; Sha, C.; Yong, Y.; Jiang, Y.; Fang, Z. Nanomaterial-biological hybrid systems: Advancements in solar-driven CO2-to-chemical conversion. Green Carbon 2024, 2, 322–336. [Google Scholar] [CrossRef]
  19. Li, H.; Du, H.; Luo, H.; Wang, H.; Zhu, W.; Zhou, Y. Recent developments in metal nanocluster-based catalysts for improving photocatalytic CO2 reduction performance. Microstructures 2023, 3, 2023024. [Google Scholar] [CrossRef]
  20. Li, J.; Wang, Y.; Wang, Y.; Guo, Y.; Zhang, S.; Song, H.; Li, X.; Gao, Q.; Shang, W.; Hu, S.; et al. MXene Ti3C2 decorated g-C3N4/ZnO photocatalysts with improved photocatalytic performance for CO2 reduction. Nano Mater. Sci. 2023, 5, 237–245. [Google Scholar] [CrossRef]
  21. Liao, H.; Huang, K.; Hou, W.; Guo, H.; Lian, C.; Zhang, J.; Liu, Z.; Wang, L. Atmosphere engineering of metal-free Te/C3N4 p-n heterojunction for nearly 100% photocatalytic converting CO2 to CO. Adv. Powder Mater. 2024, 3, 100243. [Google Scholar] [CrossRef]
  22. Ren, Q.; He, Y.; Wang, H.; Sun, Y.; Dong, F. Rapid energy exchange between in situ formed bromine vacancies and CO2 molecules enhances CO2 photoreduction. Research 2023, 6, 0244. [Google Scholar] [CrossRef] [PubMed]
  23. Wang, F.; Zhang, S.; Jing, W.; Qiu, H.; Liu, Y.; Guo, L. Double Z-scheme in SnO2/SnS2/Cu2SnS3 heterojunction for photocatalytic reduction of CO2 to ethanol. J. Mater. Sci. Technol. 2024, 189, 146–154. [Google Scholar] [CrossRef]
  24. Yang, X.; Wang, T.; Ma, H.; Shi, W.; Xia, Z.; Yang, Q.; Zhang, P.; Ma, R.; Xie, G.; Chen, S. Matched micro-geometrical configuration leading to hetero-interfacial intimate contact of MoS2@UiO-66-NH2 Z-scheme heterojunction for efficient photocatalytic CO2 reduction. J. Mater. Sci. Technol. 2024, 182, 210–219. [Google Scholar] [CrossRef]
  25. Cao, C.; Zhou, S.; Zuo, S.; Zhang, H.; Chen, B.; Huang, J.; Wu, X.; Xu, Q.; Zhu, Q. Si doping-induced electronic structure regulation of single-atom Fe sites for boosted CO2 electroreduction at low overpotentials. Research 2023, 6, 0079. [Google Scholar] [CrossRef]
  26. Deng, C.; Qi, C.; Wu, X.; Jing, G.; Zhao, H. Unveiling the relationship between structural evaluation and catalytic performance of InOOH during electroreduction of CO2 to formate. Green Carbon 2024, 2, 124–130. [Google Scholar] [CrossRef]
  27. Liu, S.; Wang, H.; Wang, X.; Zhou, J.; Liang, H. Bi2S3/In(OH)3 heterojunction for enhanced CO2 electroreduction to formic acid. Prog. Nat. Sci. Mater. Int. 2024, 34, 1167–1172. [Google Scholar] [CrossRef]
  28. Tu, X.; Liu, X.; Zhang, Y.; Zhu, J.; Jiang, H. Advances in Sn-based oxide catalysts for the electroreduction of CO2 to formate. Green Carbon 2024, 2, 131–148. [Google Scholar] [CrossRef]
  29. Wei, W.; Liu, H.; Zhu, Q. Electrocatalytic CO2 reduction in acids: A groundbreaking approach to converting CO2 into fuels and feedstocks. Research 2024, 8, 0589. [Google Scholar] [CrossRef]
  30. Du, P.; Deng, G.; Li, Z.; Sun, J.; Wang, L.; Yang, Y.; Wang, J.; Li, Y.; Xu, X.; Zhang, Y.; et al. Effective CO2 activation of enriched oxygen vacancies for photothermal CO2 methanation. J. Mater. Sci. Technol. 2024, 189, 203–210. [Google Scholar] [CrossRef]
  31. Liu, Y.; Shang, J.; Zhu, T. Enhanced thermal-assisted photocatalytic CO2 reduction by RGO/H-CN two-dimensional heterojunction. J. Mater. Sci. Technol. 2024, 176, 36–47. [Google Scholar] [CrossRef]
  32. Yang, J.; Wang, J.; Wang, G.; Wang, K.; Li, J.; Zhao, L. In situ irradiated XPS investigation on S-scheme TiO2/Bi2S3 photocatalyst with high interfacial charge separation for highly efficient photothermal catalytic CO2 reduction. J. Mater. Sci. Technol. 2024, 189, 86–95. [Google Scholar] [CrossRef]
  33. Li, C.; Guo, R.; Zhang, Z.; Wu, T.; Pan, W. Converting CO2 into value-added products by Cu2O-based catalysts: From photocatalysis, electrocatalysis to photoelectrocatalysis. Small 2023, 19, 202207875. [Google Scholar] [CrossRef] [PubMed]
  34. Suri, D.; Das, S.; Choudhary, S.; Venkanna, G.; Sharma, B.; Afroz, M.A.; Tailor, N.K.; Joshi, R.; Satapathi, S.; Tripathi, K. Enigma of sustainable CO2 conversion to renewable fuels and chemicals through photocatalysis, electrocatalysis, and photoelectrocatalysis: Design strategies and atomic level insights. Small 2025, 21, 2408981. [Google Scholar] [CrossRef]
  35. Jeffry, L.; Ong, M.Y.; Nomanbhay, S.; Mofijur, M.; Mubashir, M.; Show, P.L. Greenhouse gases utilization: A review. Fuel 2021, 301, 121017. [Google Scholar] [CrossRef]
  36. Cai, H.; Yang, H.; Feng, J.; Zhou, K.; Liu, C.; Hu, Q.; He, C. Ionic liquid-induced product switching in CO2 electroreduction on copper reaction interface. Adv. Funct. Mater. 2024, 34, 2404102. [Google Scholar] [CrossRef]
  37. Yang, H.; Cai, H.; Li, D.; Kong, Y.; Feng, S.; Jiang, X.; Hu, Q.; He, C. Molecular modification enables CO2 electroreduction to methane on platinum surface in acidic media. Natl. Sci. Rev. 2024, 11, nwae361. [Google Scholar] [CrossRef]
  38. Yu, M.; Li, M.; Zhang, X.; Ge, Z.; Xu, E.; Wang, L.; Yin, B.; Dou, Y.; Yang, Y.; Zhang, X.; et al. Coupling photocatalytic reduction and biosynthesis towards sustainable CO2 upcycling. Angew. Chem. Int. Edit. 2025, 137, e202423995. [Google Scholar]
  39. Hu, B.; Li, Z.; Wang, B.; Chen, L.; Wang, X.; Hu, X.; Bai, Z.; Li, Y.; Chen, G.; Luo, X.; et al. Construction of Co-In dual single-atom catalysts for photocatalytic CO2 reduction into CH4. Appl. Catal. B Environ. Energy 2025, 371, 125196. [Google Scholar] [CrossRef]
  40. Zou, S.; Wang, L.; Wang, H.; Zhang, X.; Sun, H.; Liao, X.; Huang, J.; Masri, A.R. Structure-performance correlation on bimetallic catalysts for selective CO2 hydrogenation. Energy Environ. Sci. 2023, 16, 5513–5524. [Google Scholar] [CrossRef]
  41. Jiao, F.; Mu, R.; Xu, S.; Liu, H.; Yu, L.; Gao, D.; Song, Y.; Deng, D.; Wang, G.; Zheng, H.; et al. A career in catalysis: Xinhe Bao. ACS Catal. 2025, 15, 3061–3084. [Google Scholar] [CrossRef]
  42. Feng, C.; Zhang, L. Microdroplet assisted hollow ZnCdS@PDA nanocages’ synergistic confinement effect for promoting photocatalytic H2O2 production. Mater. Horizons 2024, 11, 1515–1527. [Google Scholar] [CrossRef] [PubMed]
  43. Lin, S.; Zhi, Y.; Liu, Z.; Yuan, J.; Liu, W.; Zhang, W.; Xu, Z.; Zheng, A.; Wei, Y.; Liu, Z. Multiscale dynamical cross-talk in zeolite-catalyzed methanol and dimethyl ether conversions. Natl. Sci. Rev. 2022, 9, nwac151. [Google Scholar] [CrossRef]
  44. Yang, Y.; He, D.; Feng, X.; Xiao, X. Low-dimension confinement effect in COF-based hetero-photocatalyst for energy-conversion application. SmartMat 2023, 5, e1223. [Google Scholar] [CrossRef]
  45. Tao, M.; Jia, Z.; He, H.; Han, Y.; Yu, X.; Ren, Y.; Wu, Y.; Lin, Y.; Shi, Z.; Zhao, Z.; et al. Ti F bridged IL-CuCQDs-F/TiO2 inverse opal composite for boosting CO2 visible-photo reduction via slow photon effect. J. Colloid Interface Sci. 2025, 678, 45–56. [Google Scholar] [CrossRef]
  46. Wang, G.; Luo, R.; Yang, C.; Song, J.; Xiong, C.; Tian, H.; Zhao, Z.; Mu, R.; Gong, J. Active sites in CO2 hydrogenation over confined VOx-Rh catalysts. Sci. China Chem. 2019, 62, 1710–1719. [Google Scholar] [CrossRef]
  47. Xu, Z.; Han, Y.; Sun, J.; Xu, M.; Zhao, W.; Wang, Q. Confinement and interface engineering of CuSiO3 nanotubes for enhancing CO2 electroreduction to C2+ products. Electrochim. Acta 2023, 470, 143291. [Google Scholar] [CrossRef]
  48. Liu, T.; Xiao, S.; Li, N.; Chen, J.; Zhou, X.; Qian, Y.; Huang, C.; Zhang, Y. Water decontamination via nonradical process by nanoconfined Fenton-like catalysts. Nat. Commun. 2023, 14, 2881. [Google Scholar] [CrossRef]
  49. Peng, M.; Li, C.; Wang, Z.; Wang, M.; Zhang, Q.; Xu, B.; Li, M.; Ma, D. Interfacial catalysis at atomic level. Chem. Rev. 2025, 125, 2371–2439. [Google Scholar] [CrossRef]
  50. Fan, J.; Liang, S.; Zhu, K.; Mao, J.; Cui, X.; Ma, C.; Yu, L.; Deng, D. Boosting room-temperature conversion of methane via confining Cu atoms in ultrathin Ru nanosheets. Chem. Catal. 2022, 2, 2253–2261. [Google Scholar] [CrossRef]
  51. He, D.; Zhang, Y.; Li, T.; Chen, D.; Wang, H.; Zhang, L.; Liu, J.; Cao, X.; Lu, J.; Luo, Y. Designing ultra-stable and surface-exposed Ni nanoparticles with dually confined microenvironment for high-temperature methane dry reforming. Adv. Funct. Mater. 2025, 35, 2412895. [Google Scholar] [CrossRef]
  52. Mo, Q.; Chen, C.; Li, S.; Song, H.; Zhang, L. Highly dispersed single clusters supported porphyrinic metal–organic frameworks for synergetic CO2 electroreduction to CH4. Small 2025, 21, 2411926. [Google Scholar] [CrossRef] [PubMed]
  53. Lv, H.; Meng, S.; Cui, Z.; Li, S.; Li, D.; Gao, X.; Guo, H.; Bogaerts, A.; Yi, Y. Plasma-catalytic direct oxidation of methane to methanol over Cu-MOR: Revealing the zeolite-confined Cu2+ active sites. Chem. Eng. J. 2024, 496, 154337. [Google Scholar] [CrossRef]
  54. Lu, Y.; Li, H.; Sun, H.; Zhao, J.; Zhang, Y.; Wang, Y.; Zhu, C.; Gao, D.; Tuo, Y.; Zeng, J.; et al. Confinement catalysis of reaction intermediates in Ag@Cu2O cascade nanoreactors toward boosted electrochemical C–C coupling. ACS Catal. 2024, 14, 14744–14753. [Google Scholar] [CrossRef]
  55. Yang, C.; Fu, X.; Luan, D.; Xiao, J. Towards rational design of confined catalysis in carbon nanotube by machine learning and grand canonical monte carlo simulations. Angew. Chem. Int. Edit. 2025, 64, e202421552. [Google Scholar] [CrossRef]
  56. Fan, W.; Liu, Y.; Zhang, C.; Chen, X.; He, D.; Li, M.; Hu, Q.; Jiao, X.; Chen, Q.; Xie, Y. Confined CO in a sandwich structure promotes C–C coupling in electrocatalytic CO2 reduction. Mater. Horizons 2024, 11, 4183–4189. [Google Scholar] [CrossRef]
  57. Xie, G.; Bai, X.; Niu, Y.; Zhang, R.; Liu, J.; Yang, Q.; Wang, Z. Highly dispersed AuCu nanoparticles confined in Zr-MOFs for efficient methanol synthesis from CO2 hydrogenation. ACS Appl. Mater. Interfaces 2024, 16, 70626–70633. [Google Scholar] [CrossRef]
  58. Wang, J.; Li, R.; Zhang, G.; Dong, C.; Fan, Y.; Yang, S.; Chen, M.; Guo, X.; Mu, R.; Ning, Y.; et al. Confinement-induced indium oxide nanolayers formed on oxide support for enhanced CO2 hydrogenation reaction. J. Am. Chem. Soc. 2024, 146, 5523–5531. [Google Scholar] [CrossRef]
  59. Kuang, Y.; Li, H. Metal@hollow carbon sphere nanoreactors for sustainable biomass and CO2 valorization. J. Mater. Chem. A 2022, 10, 7557–7603. [Google Scholar] [CrossRef]
  60. Chen, W.; Fan, Z.; Pan, X.; Bao, X. Effect of confinement in carbon nanotubes on the activity of fischer−tropsch iron catalyst. J. Am. Chem. Soc. 2008, 130, 9414–9419. [Google Scholar] [CrossRef]
  61. Das, R.; Muthukumar, D.; Pillai, R.S.; Nagaraja, C.M. Rational design of a ZnII MOF with multiple functional sites for highly efficient fixation of CO2 under mild conditions: Combined experimental and theoretical investigation. Chem. Eur. J. 2020, 26, 17445–17454. [Google Scholar] [CrossRef] [PubMed]
  62. Pan, X.; Fan, Z.; Chen, W.; Ding, Y.; Luo, H.; Bao, X. Enhanced ethanol production inside carbon-nanotube reactors containing catalytic particles. Nat. Mater. 2007, 6, 507–511. [Google Scholar] [CrossRef] [PubMed]
  63. Liu, S.; Chen, H.; Zhang, X. Bifunctional {Pb10K2}–organic framework for high catalytic activity in cycloaddition of CO2 with epoxides and knoevenagel condensation. ACS Catal. 2022, 12, 10373–10383. [Google Scholar] [CrossRef]
  64. Li, Z.; Wang, Z.; Jiang, B.; Kawi, S. Sintering resistant Ni nanoparticles exclusively confined within SiO2 nanotubes for CH4 dry reforming. Catal. Sci. Technol. 2018, 8, 3363–3371. [Google Scholar] [CrossRef]
  65. Xue, Y.; Lei, J.; Lv, H.; Liang, P.; Li, L.; Zhai, Q. Spatially confined ?-complexation within pore-space-partitioned metal-organic frameworks for enhanced light hydrocarbon separation and purification. Small 2024, 20, 2311555. [Google Scholar] [CrossRef]
  66. Chernyak, S.A.; Ivanov, A.S.; Stolbov, D.N.; Maksimov, S.V.; Maslakov, K.I.; Chernavskii, P.A.; Pokusaeva, Y.A.; Koklin, A.E.; Bogdan, V.I.; Savilov, S.V. Sintered Fe/CNT framework catalysts for CO2 hydrogenation into hydrocarbons. Carbon 2020, 168, 475–484. [Google Scholar] [CrossRef]
  67. Zhang, J.; Li, M.; Tan, X.; Shi, L.; Xie, K.; Zhao, X.; Wang, S.; Zhao, S.; Zhang, H.; Duan, X.; et al. Confined FeNi alloy nanoparticles in carbon nanotubes for photothermal oxidative dehydrogenation of ethane by carbon dioxide. Appl. Catal. B-Environ. 2023, 339, 123166. [Google Scholar] [CrossRef]
  68. Niu, Y.; Zhang, C.; Wang, Y.; Fang, D.; Zhang, L.; Wang, C. Confining chainmail-bearing Ni nanoparticles in N-doped carbon nanotubes for robust and efficient electroreduction of CO2. ChemSusChem 2021, 14, 1140–1154. [Google Scholar] [CrossRef]
  69. Fu, Q.; Bao, X. Surface chemistry and catalysis confined under two-dimensional materials. Chem. Soc. Rev. 2017, 46, 1842–1874. [Google Scholar] [CrossRef]
  70. Mu, R.; Fu, Q.; Jin, L.; Yu, L.; Fang, G.; Tan, D.; Bao, X. Visualizing chemical reactions confined under graphene. Angew. Chem. Int. Edit. 2012, 51, 4856–4859. [Google Scholar] [CrossRef]
  71. Yao, Y.; Fu, Q.; Zhang, Y.Y.; Weng, X.; Li, H.; Chen, M.; Jin, L.; Dong, A.; Mu, R.; Jiang, P.; et al. Graphene cover-promoted metal-catalyzed reactions. Proc. Natl. Acad. Sci. USA 2014, 111, 17023–17028. [Google Scholar] [CrossRef] [PubMed]
  72. Li, H.; Xiao, J.; Fu, Q.; Bao, X. Confined catalysis under two-dimensional materials. Proc. Natl. Acad. Sci. USA 2017, 114, 5930–5934. [Google Scholar] [CrossRef] [PubMed]
  73. Chen, X.; Lin, Z.; Ju, M.; Guo, L. Confined electrochemical catalysis under cover: Enhanced CO2 reduction at the interface between graphdiyne and Cu surface. Appl. Surf. Sci. 2019, 479, 685–692. [Google Scholar] [CrossRef]
  74. Song, X.; Wu, Y.; Zhang, X.; Li, X.; Zhu, Z.; Ma, C.; Yan, Y.; Huo, P.; Yang, G. Boosting charge carriers separation and migration efficiency via fabricating all organic van der Waals heterojunction for efficient photoreduction of CO2. Chem. Eng. J. 2021, 408, 127292. [Google Scholar] [CrossRef]
  75. Chen, D.; Ying, W.; Guo, Y.; Ying, Y.; Peng, X. Enhanced gas separation through nanoconfined ionic liquid in laminated MoS2 membrane. ACS Appl. Mater. Interfaces 2017, 9, 44251–44257. [Google Scholar] [CrossRef]
  76. Fu, Z.; Huang, H.; Song, T.; Yin, S.; Long, B.; Ali, A.; Deng, G. Fine-tuning the conjugate system of 0D heteroborane to construct an all-organic 0D/2D heterojunction for photocatalytic CO2 reduction. J. Environ. Chem. Eng. 2021, 9, 106642. [Google Scholar] [CrossRef]
  77. Wei, Z.; Bai, B.; Bai, H.; Duan, Y.; Yang, M.; Cao, H.; Zuo, Z.; Zuo, J.; Wang, Q.; Huang, W. Mechanistic exploration of syngas conversion at the interface of graphene/Cu(111): Identifying the effect of promoted electron transfer on the product selectivity. Catal. Sci. Technol. 2023, 13, 6527–6540. [Google Scholar] [CrossRef]
  78. An, B.; Ma, Y.; Han, X.; Schröder, M.; Yang, S. Activation and catalysis of methane over metal–organic framework materials. Acc. Mater. Res. 2024, 6, 77–88. [Google Scholar] [CrossRef]
  79. Ding, C.; Wang, J.; Guo, S.; Ma, Z.; Li, Y.; Ma, L.; Zhang, K. Abundant hydrogen production over well dispersed nickel nanoparticles confined in mesoporous metal oxides in partial oxidation of methane. Int. J. Hydrog. Energy 2019, 44, 30171–30184. [Google Scholar] [CrossRef]
  80. Dong, H.; Liu, Q. Three-dimensional networked Ni-phyllosilicate catalyst for CO2 methanation: Achieving high dispersion and enhanced stability at high Ni loadings. ACS Sustain. Chem. Eng. 2020, 8, 6753–6766. [Google Scholar] [CrossRef]
  81. Wu, T.; Lin, J.; Cheng, Y.; Tian, J.; Wang, S.; Xie, S.; Pei, Y.; Yan, S.; Qiao, M.; Xu, H.; et al. Porous graphene-confined Fe–K as highly efficient catalyst for CO2 direct hydrogenation to light olefins. ACS Appl. Mater. Interfaces 2018, 10, 23439–23443. [Google Scholar] [CrossRef] [PubMed]
  82. Oshima, T.; Ichibha, T.; Qin, K.S.; Muraoka, K.; Vequizo, J.J.M.; Hibino, K.; Kuriki, R.; Yamashita, S.; Hongo, K.; Uchiyama, T.; et al. Undoped layered perovskite oxynitride Li2LaTa2O6N for photocatalytic CO2 reduction with visible light. Angew. Chem. Int. Edit. 2018, 57, 8154–8158. [Google Scholar] [CrossRef] [PubMed]
  83. Wang, Y.; Li, C.; Wan, S.; Zhang, C.; Li, Z.; Zhang, S.; Zhong, Q. ZIF-67-derived ultrathin Co-Ni layered double hydroxides wrapped on 3D g-C3N4 with enhanced visible-light photocatalytic performance for greenhouse gas CO2 reduction. J. Environ. Chem. Eng. 2022, 10, 108119. [Google Scholar] [CrossRef]
  84. Xia, Y.; Xiao, J.; Zhang, J.; Huang, R.; Huang, X.; Yan, G.; Zheng, L. Construction of a sunflower-like S-scheme WO3/ZnIn2S4 heterojunction with spatial charge transfer for enhanced photocatalytic CO2 reduction. Fuel 2025, 382, 133779. [Google Scholar] [CrossRef]
  85. Guan, X.; Ma, Y.; Li, H.; Yusran, Y.; Xue, M.; Fang, Q.; Yan, Y.; Valtchev, V.; Qiu, S. Fast, ambient temperature and pressure ionothermal synthesis of three-dimensional covalent organic frameworks. J. Am. Chem. Soc. 2018, 140, 4494–4498. [Google Scholar] [CrossRef]
  86. Zhang, W.; Li, H.; Feng, D.; Wu, C.; Sun, C.; Jia, B.; Liu, X.; Ma, T. MOF-derived 1D/3D N-doped porous carbon for spatially confined electrochemical CO2 reduction to adjustable syngas. Carbon Energy 2024, 6, e461. [Google Scholar] [CrossRef]
  87. Zhang, P.; Han, F.; Yan, J.; Qiao, X.; Guan, Q.; Li, W. N-doped ordered mesoporous carbon (N-OMC) confined Fe3O4-FeCx heterojunction for efficient conversion of CO2 to light olefins. Appl. Catal. B-Environ. 2021, 299, 120639. [Google Scholar] [CrossRef]
  88. Zhao, Q.; Wang, J.; Zhuang, Y.; Gong, L.; Zhang, W.; Fan, W.; Lu, Z.; Zhang, Y.; Fujita, T.; Zhang, P.; et al. In situ reconstruction of Bi nanoparticles confined within 3D nanoporous Cu to boost CO2 electroreduction. Sci. China Mater. 2024, 67, 796–803. [Google Scholar] [CrossRef]
  89. Zhu, Z.; Li, X.; Qu, Y.; Zhou, F.; Wang, Z.; Wang, W.; Zhao, C.; Wang, H.; Li, L.; Yao, Y.; et al. A hierarchical heterostructure of CdS QDs confined on 3D ZnIn2S4 with boosted charge transfer for photocatalytic CO2 reduction. Nano Res. 2020, 14, 81–90. [Google Scholar] [CrossRef]
  90. Peng, L.; Wang, Y.; Masood, I.; Zhou, B.; Wang, Y.; Lin, J.; Qiao, J.; Zhang, F. Self-growing Cu/Sn bimetallic electrocatalysts on nitrogen-doped porous carbon cloth with 3D-hierarchical honeycomb structure for highly active carbon dioxide reduction. Appl. Catal. B-Environ. 2020, 264, 118447. [Google Scholar] [CrossRef]
  91. Yan, F.; Dong, X.; Wang, Y.; Wang, Q.; Wang, S.; Zang, S. Asymmetrical interactions between Ni single atomic sites and Ni clusters in a 3D porous organic framework for enhanced CO2 photoreduction. Adv. Sci. 2024, 11, 2401508. [Google Scholar] [CrossRef] [PubMed]
  92. Zhang, P.; Zhuo, H.; Dong, Y.; Zhou, Y.; Li, Y.; Hao, H.; Li, D.; Shi, W.; Zeng, S.; Xu, S.; et al. Pt Nanoparticles confined in a 3D porous FeNC matrix as efficient catalysts for rechargeable Li-CO2/O2 batteries. ACS Appl. Mater. Interfaces 2023, 15, 2940–2950. [Google Scholar] [CrossRef] [PubMed]
  93. Wang, S.; Yan, D.; Zhang, W.; Wang, L. Graphene-supported isolated platinum atoms and platinum dimers for CO2 hydrogenation: Catalytic activity and selectivity variations. Chin. Chem. Lett. 2025, 36, 110611. [Google Scholar] [CrossRef]
  94. Wang, X.; Wang, Z.; Li, Y.; Wang, J.; Zhang, G. Efficient photocatalytic CO2 conversion over 2D/2D Ni-doped CsPbBr3/Bi3O4Br Z-scheme heterojunction: Critical role of Ni doping, boosted charge separation and mechanism study. Appl. Catal. B-Environ. 2022, 319, 121895. [Google Scholar] [CrossRef]
  95. Kumar, P.; Hu, J.; Kibria, M.G. Edge-confined under-coordinated Cu atoms on Ru nanosheets enable efficient CH4 activation. Chem. Catal. 2022, 2, 2118–2120. [Google Scholar] [CrossRef]
  96. Xu, Y.; Zhao, Y.; Kochubei, A.; Lee, C.; Wagner, P.; Chen, Z.; Jiang, Y.; Yan, W.; Wallace, G.G.; Wang, C. Copper/polyaniline interfaces confined CO2 electroreduction for selective hydrocarbon production. ChemSusChem 2024, 17, e202400209. [Google Scholar] [CrossRef]
  97. Kang, X.; Liu, J.; Xie, Y.; Wang, D.; Liu, Q.; Yu, P.; Tian, C.; Fu, H. Pt single atoms in oxygen vacancies boost reverse water-gas shift reaction by enhancing hydrogen spillover. Sci. China Mater. 2024, 67, 3579–3588. [Google Scholar] [CrossRef]
  98. Kim, S.S.; Lee, S.M.; Won, J.M.; Yang, H.J.; Hong, S.C. Effect of Ce/Ti ratio on the catalytic activity and stability of Ni/CeO2–TiO2 catalyst for dry reforming of methane. Chem. Eng. J. 2015, 280, 433–440. [Google Scholar] [CrossRef]
  99. Wang, J.; Liu, C.; Senftle, T.P.; Zhu, J.; Zhang, G.; Guo, X.; Song, C. Variation in the In2O3 crystal phase alters catalytic performance toward the reverse water gas shift reaction. ACS Catal. 2019, 10, 3264–3273. [Google Scholar] [CrossRef]
  100. Cannizzaro, F.; Kurstjens, S.; van den Berg, T.; Hensen, E.J.M.; Filot, I.A.W. A computational study of CO2 hydrogenation on single atoms of Pt, Pd, Ni and Rh on In2O3(111). Catal. Sci. Technol. 2023, 13, 4701–4715. [Google Scholar] [CrossRef]
  101. Wang, W.; Zhang, Y.; Wang, Z.; Yan, J.; Ge, Q.; Liu, C. Reverse water gas shift over In2O3–CeO2 catalysts. Catal. Today 2016, 259, 402–408. [Google Scholar] [CrossRef]
  102. Chen, C.; Kosari, M.; Xi, S.; Lim, A.M.H.; He, C.; Zeng, H.C. Optimizing the interfacial environment of triphasic ZnO-Cu-ZrO2 confined inside mesoporous silica spheres for enhancing CO2 hydrogenation to methanol. ACS EST Eng. 2023, 3, 638–650. [Google Scholar] [CrossRef]
  103. Li, C.; Zhang, P.; Gu, F.; Tong, L.; Jiang, J.; Zuo, Y.; Dong, H. Atomically dispersed Au confined by oxygen vacancies in Au-θ-Al2O3/Au/PCN hybrid for boosting photocatalytic CO2 reduction driven by multiple built-in electric fields. Chem. Eng. J. 2023, 476, 146514. [Google Scholar] [CrossRef]
  104. Bao, C.; Huo, Y.; Li, Y.; Yang, S.; Li, W.; Hu, T. Anchoring Cu on Zirconium-oxo nodes in a pore-confined metal-organic framework for CO2 hydrogenation to methanol. Chem. Eng. J. 2025, 503, 158610. [Google Scholar] [CrossRef]
  105. Bu, K.; Kuboon, S.; Deng, J.; Li, H.; Yan, T.; Chen, G.; Shi, L.; Zhang, D. Methane dry reforming over boron nitride interface-confined and LDHs-derived Ni catalysts. Appl. Catal. B-Environ. 2019, 252, 86–97. [Google Scholar] [CrossRef]
  106. Long, X.; Feng, C.; Liu, M.; Li, X.; Huang, Z.; Du, Y.; Chen, Y.; Yang, S.; Wang, G.; Ding, D.; et al. PMS activation by hollow sulfur doped multilayer carbon shell wrapped CoFe alloy: Confined adsorption and surface activation. J. Clean Prod. 2023, 425, 138672. [Google Scholar] [CrossRef]
  107. Meng, J.; Wang, K.; Wang, Y.; Ma, J.; Ban, C.; Feng, Y.; Zhang, B.; Zhou, K.; Gan, L.; Han, G.; et al. Bismuth clusters pinned on TiO2 porous nanowires boosting charge transfer for CO2 photoreduction to CH4. Nano Res. 2023, 17, 1190–1198. [Google Scholar] [CrossRef]
  108. Wang, X.; Woo, H.Y.; Shen, D.; Park, M.J.; Ali, M.; Zafar, F.; Kang, K.Y.; Choi, J.; Jang, E.; Bae, J.W. Cu–ZnO nanoparticles encapsulated in ZSM-5 for selective conversion of carbon dioxide into oxygenates. EES Catal. 2025, 3, 163–350. [Google Scholar] [CrossRef]
  109. Li, Z.; Wang, P.; Ren, C.; Wu, L.; Yao, Y.; Zhong, S.; Lin, H.; Zhao, L.; Gao, Y.; Bai, S. Modulating the selectivity of CO2 photoreduction by regulating the location of PtCu in a UiO-66@ZnIn2S4 core–shell nanoreactor. ACS Catal. 2024, 15, 828–840. [Google Scholar] [CrossRef]
  110. Wang, Y.; Lai, W.; Tao, H.; Qiao, Y.; Chen, X.; Lian, C.; Ge, J.; Li, J.; Huang, H. CO2 electroreduction to multicarbon products over Cu2O@mesoporous SiO2 confined catalyst: Relevance of the shell thickness. Adv. Energy Mater. 2024, 15, 2404606. [Google Scholar] [CrossRef]
  111. Chen, Y.; Ding, Y.; Han, W.; Li, W.; Yu, X.; Tian, G. Cu-BTC-confined synthesis of Cu-Cu2O-CuS nanojunctions embedded in a porous carbon matrix for remarkable photothermal CO2 conversion. J. Mater. Chem. A 2023, 11, 8342–8351. [Google Scholar] [CrossRef]
  112. Cai, S.; Tao, S.; Chong, M.; Shi, Z.; Liu, X.; Cheng, D.; Chen, F. Ag nanoparticles-confined doped within triazine-based covalent organic frameworks for syngas production from electrocatalytic reduction of CO2. ACS Appl. Mater. Interfaces 2024, 16, 55267–55275. [Google Scholar] [CrossRef]
  113. Gong, S.; Hou, M.; Niu, Y.; Teng, X.; Liu, X.; Xu, M.; Xu, C.; Ka-Man Au, V.; Chen, Z. Molybdenum phosphide coupled with highly dispersed nickel confined in porous carbon nanofibers for enhanced photocatalytic CO2 reduction. Chem. Eng. J. 2022, 427, 131717. [Google Scholar] [CrossRef]
  114. Liu, Y.; Zhang, T.; Deng, C.; Cao, S.; Dai, X.; Guo, S.; Chen, Y.; Tan, Q.; Zhu, H.; Zhang, S.; et al. Ordered mesoporous carbon spheres assisted Ru nanoclusters/RuO2 with redistribution of charge density for efficient CO2 methanation in a novel H2/CO2 fuel cell. J. Energy Chem. 2022, 72, 116–124. [Google Scholar] [CrossRef]
  115. Sun, C.; Beaunier, P.; Da Costa, P. Effect of ceria promotion on the catalytic performance of Ni/SBA-16 catalysts for CO2 methanation. Catal. Sci. Technol. 2020, 10, 6330–6341. [Google Scholar] [CrossRef]
  116. Lan, X.; Li, Q.; Cao, L.; Du, C.; Ricardez-Sandoval, L.; Bai, G. Rebuilding supramolecular aggregates to porous hollow N-doped carbon tube inlaid with ultrasmall Ag nanoparticles: A highly efficient catalyst for CO2 conversion. Appl. Surf. Sci. 2020, 508, 145220. [Google Scholar] [CrossRef]
  117. Zou, X.; Li, A.; Ma, C.; Gao, Z.; Zhou, B.; Zhu, L.; Huang, Z. Nitrogen-doped carbon confined Cu-Ag bimetals for efficient electroreduction of CO2 to high-order products. Chem. Eng. J. 2023, 468, 143606. [Google Scholar] [CrossRef]
  118. Wang, D.; Yuan, Z.; Wu, X.; Xiong, W.; Ding, J.; Zhang, Z.; Huang, W. Ni single atoms confined in nitrogen-doped carbon nanotubes for active and selective hydrogenation of CO2 to CO. ACS Catal. 2023, 13, 7132–7138. [Google Scholar] [CrossRef]
  119. Fu, Y.; Wang, T.; Zheng, W.; Lei, C.; Yang, B.; Chen, J.; Li, Z.; Lei, L.; Yuan, C.; Hou, Y. Nanoconfined tin oxide within N-doped nanocarbon supported on electrochemically exfoliated graphene for efficient electroreduction of CO2 to formate and C1 products. ACS Appl. Mater. Interfaces 2020, 12, 16178–16185. [Google Scholar] [CrossRef]
  120. Zhang, P.; Han, F.; Yan, J.; Qiao, X.; Zhu, M.; Guan, Q.; Li, W. Heteroatom induced synthesis of FeO-Fe3C confined within F-doped graphene shell for efficient CO2 hydrogenation to light olefins. Chem. Eng. J. 2023, 477, 147153. [Google Scholar] [CrossRef]
  121. Chen, Z.; Yu, G.; Li, B.; Zhang, X.; Jiao, M.; Wang, N.; Zhang, X.; Liu, L. In situ carbon encapsulation confined nickel-doped indium oxide nanocrystals for boosting CO2 electroreduction to the industrial level. ACS Catal. 2021, 11, 14596–14604. [Google Scholar] [CrossRef]
  122. Zang, D.; Gao, X.J.; Li, L.; Wei, Y.; Wang, H. Confined interface engineering of self-supported Cu@N-doped graphene for electrocatalytic CO2 reduction with enhanced selectivity towards ethanol. Nano Res. 2022, 15, 8872–8879. [Google Scholar] [CrossRef]
  123. Guo, Y.; Feng, L.; Wu, C.; Wang, X.; Zhang, X. Confined pyrolysis transformation of ZIF-8 to hierarchically ordered porous Zn-N-C nanoreactor for efficient CO2 photoconversion under mild conditions. J. Catal. 2020, 390, 213–223. [Google Scholar] [CrossRef]
  124. Xu, B.; Wang, H.; Wang, W.; Gao, L.; Li, S.; Pan, X.; Wang, H.; Yang, H.; Meng, X.; Wu, Q.; et al. A single-atom nanozyme for wound disinfection applications. Angew. Chem. Int. Edit. 2019, 58, 4911–4916. [Google Scholar] [CrossRef]
  125. Yang, Q.; Yang, C.; Lin, C.; Jiang, H. Metal–organic-framework-derived hollow N-doped porous carbon with ultrahigh concentrations of single Zn atoms for efficient carbon dioxide conversion. Angew. Chem. Int. Edit. 2019, 58, 3511–3515. [Google Scholar] [CrossRef]
  126. Liu, X.; Liao, L.; Xia, G.; Yu, F.; Zhang, G.; Shu, M.; Wang, H. An accurate “metal pre-buried” strategy for constructing Ni–N2C2 single-atom sites with high metal loadings toward electrocatalytic CO2 reduction. J. Mater. Chem. A 2022, 10, 25047–25054. [Google Scholar] [CrossRef]
  127. Huang, H.; Guo, X.; Jiang, Q.; He, H.; Yang, L.; Zhang, C.; Ying, G.; Xu, X. Space-confined growth of monodisperse Pt within nitrogen-doped mesostructured hexagonal prism carbon nanoarchitectures for boosted methanol oxidation reaction. Chem. Eng. J. 2025, 511, 161570. [Google Scholar] [CrossRef]
  128. Liu, L.; Lu, J.; Yang, Y.; Ruettinger, W.; Gao, X.; Wang, M.; Lou, H.; Wang, Z.; Liu, Y.; Tao, X.; et al. Dealuminated Beta zeolite reverses Ostwald ripening for durable copper nanoparticle catalysts. Science 2024, 383, 94–101. [Google Scholar] [CrossRef]
  129. Mamatkulov, M.; Zhdanov, V.P. Ostwald ripening of supported metal nanoparticles: Role of dimers and other general trends. Chem. Eng. Sci. 2025, 308, 121373. [Google Scholar] [CrossRef]
  130. Guo, M.; Du, S.; Yang, G.; Zhang, Q.; Liu, Z.; Peng, F. MOF-derived N-doped carbon-wrapped Ni electrocatalyst for highly efficient electrochemical CO2 reduction to CO. Energy Fuels 2024, 38, 11043–11050. [Google Scholar] [CrossRef]
  131. Yang, G.; Li, Y.; Wang, Q.; Wang, X.; Zuo, S.; Zhang, H.; Ren, X.; He, Y.; Ichihara, F.; Ye, J. Synergy between confined cobalt centers and oxygen defects on α-Fe2O3 platelets for efficient photocatalytic CO2 reduction. Sol. RRL 2021, 6, 2100833. [Google Scholar] [CrossRef]
  132. Yang, X.; Liu, T.; Zhang, M.; Song, B.; Li, Q.; Yang, J. Interfacial dual vacancies modulating electronic structure to promote the separation of photogenerated carriers for efficient CO2 photoreduction. Appl. Surf. Sci. 2021, 551, 149305. [Google Scholar] [CrossRef]
  133. Guo, D.; Lu, Y.; Ruan, Y.; Zhao, Y.; Zhao, Y.; Wang, S.; Ma, X. Effects of extrinsic defects originating from the interfacial reaction of CeO2-x-nickel silicate on catalytic performance in methane dry reforming. Appl. Catal. B-Environ. 2020, 277, 119278. [Google Scholar] [CrossRef]
  134. Karmakar, S.; Barman, S.; Rahimi, F.A.; Rambabu, D.; Nath, S.; Maji, T.K. Confining charge-transfer complex in a metal-organic framework for photocatalytic CO2 reduction in water. Nat. Commun. 2023, 14, 4508. [Google Scholar] [CrossRef]
  135. Ling, L.; Jiao, L.; Liu, X.; Dong, Y.; Yang, W.; Zhang, H.; Ye, B.; Chen, J.; Jiang, H. Potassium-assisted fabrication of intrinsic defects in porous carbons for electrocatalytic CO2 reduction. Adv. Mater. 2022, 34, 2205933. [Google Scholar] [CrossRef]
  136. Wang, T.; Jiang, L.; Zhang, Y.; Wu, L.; Chen, H.; Li, C. Fabrication of polyimide mixed matrix membranes with asymmetric confined mass transfer channels for improved CO2 separation. J. Membr. Sci. 2021, 637, 119653. [Google Scholar] [CrossRef]
  137. Wu, Q.; Jia, Y.; Liu, Q.; Mao, X.; Guo, Q.; Yan, X.; Zhao, J.; Liu, F.; Du, A.; Yao, X. Ultra-dense carbon defects as highly active sites for oxygen reduction catalysis. Chem 2022, 8, 2715–2733. [Google Scholar] [CrossRef]
  138. Wang, Y.; Zhan, W.; Chen, Z.; Chen, J.; Li, X.; Li, Y. Advanced 3D hollow-out ZnZrO@C combined with hierarchical zeolite for highly active and selective CO hydrogenation to aromatics. ACS Catal. 2020, 10, 7177–7187. [Google Scholar] [CrossRef]
  139. Shi, H.; Du, J.; Hou, J.; Ni, W.; Song, C.; Li, K.; Gurzadyan, G.G.; Guo, X. Solar-driven CO2 conversion over Co2+ doped 0D/2D TiO2/g-C3N4 heterostructure: Insights into the role of Co2+ and cocatalyst. J. CO2 Util. 2020, 38, 16–23. [Google Scholar] [CrossRef]
  140. Huang, X.; Song, J.; Wu, H.; Xie, C.; Hua, M.; Hu, Y.; Han, B. Ordered-mesoporous-carbon-confined Pb/PbO composites: Superior electrocatalysts for CO2 reduction. ChemSusChem 2020, 13, 6346–6352. [Google Scholar] [CrossRef]
  141. Shingdilwar, S.; Dolui, S.; Kumar, D.; Banerjee, S. Facile access to template-shape-replicated nitrogen-rich mesoporous carbon nanospheres for highly efficient CO2 capture and contaminant removal. Mater. Adv. 2022, 3, 665–671. [Google Scholar] [CrossRef]
  142. Xu, L.; Wang, F.; Chen, M.; Fan, X.; Yang, H.; Nie, D.; Qi, L. Alkaline-promoted Co-Ni bimetal ordered mesoporous catalysts with enhanced coke-resistant performance toward CO2 reforming of CH4. J. CO2 Util. 2017, 18, 1–14. [Google Scholar] [CrossRef]
  143. Feng, J.; Zhou, K.; Liu, C.; Hu, Q.; Fang, H.; Yang, H.; He, C. Superbase and hydrophobic ionic liquid confined within Ni foams as a free-standing catalyst for CO2 electroreduction. ACS Appl. Mater. Interfaces 2022, 14, 38717–38726. [Google Scholar] [CrossRef] [PubMed]
  144. You, F.; Zhou, T.; Li, J.; Huang, S.; Chang, C.; Fan, X.; Zhang, H.; Ma, X.; Gao, D.; Qi, J.; et al. Rich oxygen vacancies in confined heterostructured TiO2@In2S3 hybrid for boosting solar-driven CO2 reduction. J. Colloid Interface Sci. 2024, 660, 77–86. [Google Scholar] [CrossRef]
  145. Zhang, Q.; Sun, M.; Yuan, C.; Sun, Q.; Huang, B.; Dong, H.; Zhang, Y. Strong electronic coupling effects at the heterojunction interface of SnO2 nanodots and g-C3N4 for enhanced CO2 electroreduction. ACS Catal. 2023, 13, 7055–7066. [Google Scholar] [CrossRef]
Figure 1. (a) Number of publications in the last decade on catalysis of carbon dioxide and methane and nanoconfined catalysis of carbon dioxide and methane (blue for nanoconfined catalysis, red for catalysis). (b) Schematic classification and optimization strategies for nanoconfined catalysis.
Catalysts 15 00477 g001
Figure 2. (a) Two types of coordination modes of I-TDP6− and II-TDP6−. (b) the S-shaped [Pb10K22-OH)2(COO)24] cluster. (c) The formation of the {Pb10K2} cluster (green polyhedron = Pb2+; blue ball = K+; H atoms are omitted for clarity). (d) The SEM-EDS analysis of as-synthesized NUC-45. (e) The recycled Knoevenagel condensation reaction catalyzed by NUC-45a. (f) Recyclability study for catalytic activities of NUC-45a in cycloaddition reaction. Reprinted with permission from Ref. [63]. Copyright American Chemical Society, 2022. (g) Schematic illustration of the process to exclusively confine Ni nanoparticles within the SiO2 NTs. (h,i) TEM images of NiPhy@SiO2 NTs catalysts after 70 h of DRM reaction. Reprinted with permission from Ref. [64]. Copyright Royal Society of Chemistry, 2018. (j) Schematic diagram of pore space partition strategy. (k) Four dicarboxylate ligands in SNNU-33 frameworks. (l) New pore-partition agent of [Cu(pyz)3] in this work. (m) Unit cell and the diameter and height of each segment in SNNU-33s. Reprinted with permission from Ref. [65]. Copyright John Wiley and Sons, 2024. (n) XRD patterns of used unsintered and sintered Fe/CNT catalysts. (o) Comparison of catalytic performances of Fe800SPS at different H2:CO2 ratios. High resolution TEM images of (p) the used FeCNT and (q) the used Fe800SPS. Reprinted with permission from Ref. [66]. Copyright Elsevier, 2020.
Catalysts 15 00477 g002
Figure 3. (a) Illustration of synthesis of carbon nanotube-confined bimetallic alloy photothermal catalysts. (b,c) TEM images of FeNi@CNTs. (d,e) High-angle annular dark field (HAADF) and elemental mapping images of FeNi@CNTs. (f) XRD patterns of different samples. (g) Fourier transform for the extended X-ray fine structure (EXAFS) measurements of FeNi@CNTs and standard references. (h) Photothermal catalytic performances of ODEC on various catalysts. (i) Effect of light band on the photothermal catalytic ODEC. (j) Photothermal effects in photothermal catalysis. Reprinted with permission from Ref. [67]. Copyright Elsevier, 2023.
Catalysts 15 00477 g003
Figure 4. (a) Schematic illustration for the synthesis of Ni@NC@NCNT. (b) TEM and (c,d) high-resolution (HR) TEM of Ni@NC@NCNT. (e) LSV curves. (f) Faradaic efficiencies of CO. (g) N2 isotherms and the corresponding pore size distributions (inset). (h) LSV curves obtained in CO2-saturated 0.5 M KHCO3 aqueous solutions with the pretreatment of PO43−, (i) atomic content of Niδ+ and pyridinic N in Ni@NC@NCNT, Ni@NC/NCNT, Ni@NC, and NCNT. (j) Faradaic efficiencies of CO at different potentials in 0.5 M KCl, 0.25 M K2SO4, and 0.5 M KHCO3 aqueous solutions. (k) Fitting lines of log (JCO) vs. log([HCO3]) at −0.75 V vs. reversible hydrogen electrode (RHE) for Ni@NC@NCNT. (l) Proposed reaction pathways for CO production from CO2 over Ni@NC@NCNT. Reprinted with permission from Ref. [68]. Copyright John Wiley and Sons, 2021.
Catalysts 15 00477 g004
Figure 5. (a) The DFT energy profile of CO2, CO and CH4 through the triangular hole of the GDY cover. (b) The DFT potential energy surface of the CO2 molecule underneath the GDY. The color map (in eV) is plotted for the triangular region underneath the GDY. Reprinted with permission from Ref. [73]. Copyright Elsevier, 2019. (c) Possible reaction mechanism for photocatalytic reduction of CO2 over 2D CN-COF. (d) Schematic illustration of type II heterojunction of 2D CN-COF. (e) Tauc plots of the prepared catalysts. (f) Catalytic activities of the prepared catalysts. Reprinted with permission from Ref. [74]. Copyright Elsevier, 2021. (g) Schematic diagram of the synthesis process of MoS2 SILM, demonstrating the ionic liquid is confined in the MoS2 two-dimensional channels via infiltration. (h) Surface and (i) cross-section SEM images of the MoS2 membrane. (j) Surface and (k) cross-section SEM images of MoS2 SILM-3. (l) AFM image of the MoS2 sheet. The lateral dimension is scaled between two plus signs (inset). The MoS2 sheet is 1.2 nm thick. The sharp drop in the height profile is due to the silicon substrate. (m) FTIR spectra of MoS2 membrane, MoS2 SILMs and pure [BMIM][BF4]. (n) DSC curves of [BMIM][BF4] and MoS2 SILM-3. Reprinted with permission from Ref. [75]. Copyright American Chemical Society, 2017. (o) Illustration of the synthetic process of all-organic heterojunction with the 0D/2D heterostructure by a facile synthesis strategy. (p) Photocatalytic activity of the investigated samples after adding different amounts of 2BC. Reprinted with permission from Ref. [76]. Copyright Elsevier, 2021. (q) Top and side views of the graphene/Cu(111) catalyst. Gray, pink, orange, yellow, and transparent pink represent C, the first Cu layer, the second Cu layer, the third Cu layer, and the fourth Cu layer, respectively. (r) TOFs of ethanol and methane formation mapped with pressure (10–100 bar) and temperature (450–650 K). Reprinted with permission from Ref. [77]. Copyright Royal Society of Chemistry, 2023.
Catalysts 15 00477 g005
Figure 6. (a) Schematic diagram of mass transport in sandwich C/Cu/C. (b,c) Simulated CO concentration distributions in the sandwich structure (b) and the disordered mixture (c). (d) Simulated CO concentration distributions of the sandwich structure (blue bar) and disordered mixture (purple bar). (e) Simulated FE of C2 and C1 products among the carbonaceous products. Physical characterization of sandwich C/Cu/C. (f) SEM image. (g) TEM image. (h) XRD pattern. The peaks located at 431 and 511 belong to the diffraction of (100) and (110) facets of cubic Cu, respectively, and the broader peak centered at 271 corresponds to rGO. (i) FEs for C2 and C1 products at different applied current densities. (j) Electrochemical in situ FTIR spectra of Cu/C (−1.4 V vs. RHE) mixture from 0 to 300 s. (k) Electrochemical in situ FTIR spectra of sandwich C/Cu/C at a potential range from 0 to 300 s at 0.8 V. (l) Schematic diagrams of CO diffusion and confinement in the Cu/C mixture and sandwich C/Cu/C. Reprinted with permission from Ref. [56]. Copyright Royal Society of Chemistry, 2024.
Catalysts 15 00477 g006
Figure 7. (a) Schematic diagram of the sunflower-like S-scheme WO3/ZnIn2S4 heterojunction. (b) SEM of W/ZIS-x. TEM (c), HRTEM (d) and high-angle annular dark field and EDX-mapping (energy dispersive X-ray spectroscopy) images (e) of W/ZIS-1 composite. Reprinted with permission from Ref. [84]. Copyright Elsevier, 2025. (f) Structural representations of 3D-IL-COF-3. C, blue; H, gray; N, red. (g) SEM image of 3D-IL-COF-3. Breakthrough curves for 3D-IL-COF-1 using the CO2/CH4 (h) and CO2/N2 (i) gas mixture. Reprinted with permission from Ref. [85]. Copyright American Chemical Society, 2018. (j) Schematic illustration of the synthesis of 1D/3D NPC. (km) 1D/3D NPC-1000. (n) TEM and (o,p) high-resolution TEM images of 1D/3D NPC-1000. (q) Elemental mapping images of 1D/3D NPC-1000. Reprinted with permission from Ref. [86]. Copyright John Wiley and Sons, 2024. (r) Schematic of the preparation process of Fe3O4-FeCx@N-OMC. (s,t) The reaction mechanism of CO2 hydrogenation on 0.8Fe-0.1K/N-OMC and 0.8Fe-0.1K@N-OMC. The red particles are Fe3O4 NPs and the light blue particles are FeCx NPs; the gray, blue, and yellow balls represent C, N, and K+, respectively. Reprinted with permission from Ref. [87]. Copyright Elsevier, 2021.
Catalysts 15 00477 g007
Figure 8. (a) Schematic illustration of the preparation for Bi@np-Cu. (b) SEM image of Bi@np-Cu. (c) TEM images of Bi@np-Cu. (d) HR-TEM images of Bi@np-Cu. (e) EDX mappings of Bi@np-Cu. Reprinted with permission from Ref. [88]. Copyright Springer Nature, 2024. (f) Schematic illustration of the synthetic process of CdS QDs/ZnIn2S4 NF composites. (gi) SEM, (jl) TEM and HR-TEM images of ZnIn2S4-CdS nanocomposites. Reprinted with permission from Ref. [89]. Copyright Springer Nature, 2020. (m) Schematic illustration of the synthesis process of Cu(x)Sn(y)-N-CC. (n) From left to right: photographs of Cu-N-CC, Cu(1)Sn(1)-N-CC, Cu(1)Sn(4)-N-CC, Cu(1)Sn(9)-N-CC, Sn-N-CC. Reprinted with permission from Ref. [90]. Copyright Elsevier, 2020. (o,p) WT-EXAFS contour plots of 3D-NiSAs/NiNCsPOPs and 3D-NiSAs-POPs. (q) Proposed plausible mechanism of 3D-NiSAs/NiNCs-POPs. Reprinted with permission from Ref. [91]. Copyright John Wiley and Sons, 2024. ((r) and inset) SEM and HRSEM images of FeNC. (s,t) TEM and HRTEM images of FeNC. ((u) and inset) SEM and HRSEM images of Pt/FeNC. (v,w) TEM and HRTEM images of Pt/FeNC. Reprinted with permission from Ref. [92]. Copyright American Chemical Society, 2023.
Catalysts 15 00477 g008
Figure 9. Structural evolution and catalytic performance of the In2O3−TiO2 catalyst during the CO2 hydrogenation reaction. (a) (top) High angle angular dark field-scanning transmission electron microscopy (HAADF-STEM) and EDX mapping images of fresh In2O3−TiO2. (bottom) HAADF-STEM and EDX mapping images of spent In2O3−TiO2. (b) HRTEM image of 2 wt% InOx nanolayers on the TiO2 surface after RWGS. (c,d) Wavelet transforms for the k3-weighted χ(k) In K-edge EXAFS signals of fresh and spent In2O3−TiO2 catalysts. Reprinted with permission from Ref. [58]. Copyright American Chemical Society, 2024. (e) Schematic procedure illustrating the synthesis of CZZ-MSS (CZZ stands for Cu-ZnO-ZrO2) with carefully designed MSS support. (f) Pore size distribution (PSD) curves of MSS and CZZ–MSS (as-synthesized, calcined, and spent). (g) Schematic of triphasic ZnO-Cu-ZrO2 confined inside mesoporous silica spheres for enhancing CO2 hydrogenation to methanol. (h) HRTEM images of CZZ–MSS. The blue circles highlight the Cu nanoparticles. (i) Plot of methanol yield versus temperature for CZZ–MSS catalyst and industrial catalysts. Reprinted with permission from Ref. [102]. Copyright American Chemical Society, 2023. (j,k) TEM, HAADF and TEM-EDX elemental mappings of 10–Au-θ-Al2O3/Au/PCN for the different specified regions. Reprinted with permission from Ref. [103]. Copyright Elsevier, 2023.
Catalysts 15 00477 g009
Figure 10. (a) Schematic illustration of synthesis of PCN-222 and anchoring of Cu clusters on Zr6-oxo clusters. (b) FESEM, (c) TEM, and (d) EDS elemental mapping images of Cu@PCN-222. Reprinted with permission from Ref. [104]. Copyright Elsevier, 2025. (e) Possible reaction mechanism over NiMA-BN-M-R catalysts. (f) SEM image with the line scan EDX analysis (inset) carried out over a distance of 1.00 µm on the cross-section of the fresh NiMA-BN-M-R catalyst. (g) In situ diffuse reflectance infrared Fourier transform spectroscopy (DRIFTs) of CO2-TPD. Reprinted with permission from Ref. [105]. Copyright Elsevier, 2019. (h) Schematic illustration of the synthesis of hollow core-shell CoFe@CS composites. (i) Distributions of electrostatic surface potential (ESP). (j,k) SEM, TEM and HRTEM images of CoFe@C and CoFe@CS; (l,m) EDS elemental mapping images of Co, Fe, C and S in CoFe@C and CoFe@CS. Reprinted with permission from Ref. [106]. Copyright Elsevier, 2023.
Catalysts 15 00477 g010
Figure 11. (a) Schematic diagram of synthesis procedure of Ni-In2O3@C NFs. HRTEM image (b), HAADF-STEM image and EDX elemental mappings (c) of Ni-In2O3@C NFs. (d) In L3-edge XANES spectra of In2O3@C NFs and Ni-In2O3@C NFs, the inset is an enlarged view of the yellow dashed circle area. (e) Nyquist plots and the corresponding fitting curves and equivalent circuit. Reprinted with permission from Ref. [121]. Copyright American Chemical Society, 2021. (f) Schematic preparation process of Cu@N-doped graphene electrocatalyst for electrocatalytic CO2 reduction. (g) SEM images of Cu-N-G with (g) low and (h) high magnifications. (i) Contact angle measurement. (j) Elemental mapping images of Cu-N-G. (k) XPS spectra of the Cu 2p signals for Cu, Cu-G, and Cu-N-G catalysts. Reprinted with permission from Ref. [122]. Copyright Springer Nature, 2022. (l) Illustration of the fabrication of the Zn-N-HOPCPs. (m) The SEM image of Zn-N-HOPCPs. (n) HAADF-STEM image of Zn-N-HOPCPs, and (o) corresponding element mappings. (p,q) Aberration-corrected HAADF-STEM images of the Zn-N-HOPCPs (isolated single Zn atoms are highlighted with light-yellow circles). (r) XPS spectra of Zn-N-HOPCPs N 1s. (s) XPS spectra of Zn-N-HOPCPs Zn 2p. Reprinted with permission from Ref. [123]. Copyright Elsevier, 2020.
Catalysts 15 00477 g011
Figure 12. (a) Illustration of the accurate “metal pre-buried” strategy for the fabrication of Ni-N2C2 catalysts. (b) SEM images of Ni-NC-50. (c) TEM image. (d,e) Aberration-corrected HAADF-STEM images. (f) Elemental maps. (g) HOMO and lowest unoccupied molecular orbital of *COOH. (h) Schematic illustration of the interactions of the Ni dyz/dxz orbitals with the p* orbital of *COOH. (i) Calculated d-band centers of the five Ni SAC models. Reprinted with permission from Ref. [126]. Copyright Royal Society of Chemistry, 2022. (j) Synthetic scheme of the fabrication routes of Cu-based nanoparticles embedded in porous carbon octahedra derived from the Cu-BTC octahedron precursor. (k) Schematic illustration of the charge transfer pathway and photothermal catalytic mechanism for CO2 photoreduction over Cu-Cu2O-CuS@C. (l) SEM, (m) TEM, (n) HRTEM, (o) STEM, and (pt) the corresponding elemental mapping images of Cu-Cu2O-CuS@C. Reprinted with permission from Ref. [111]. Copyright Royal Society of Chemistry, 2023. (u) Schematic diagram for the preparation of the Ni-MOF@NC composite. (v) FECO of Ni-MOF@NC, Ni-MOF@C, and Ni-MOF-C. Reprinted with permission from Ref. [130]. Copyright American Chemical Society, 2024.
Catalysts 15 00477 g012
Figure 13. (a) Illustration for the fabrication of K-defect-C-1100 via K+-assisted strategy. The introduction of K+ to give K+@bio-MOF-1 by ion exchange is crucial in the first step, prior to the pyrolysis. (b) The HAADF-STEM image of K-defect-C-1100 after fast Fourier transformation filtering. (c) Free energy changes of COOH* formation (inset: electron density difference analysis of CO2 adsorbed on V12; yellow and cyan stand for charge accumulation and depletion, respectively). (d) Electrostatic potential of V0, V1, V10 and V12 sites (blue region corresponds to positive electrostatic potential, and purple region represents negative electrostatic potential. The more negative the electrostatic potential, the easier it will attract electrophilic CO2 molecules). Reprinted with permission from Ref. [135]. Copyright John Wiley and Sons, 2022. (e) The formation of the helical mesoporous silica. TEM images of different ordered helical-mesoporous SiO2 samples (f) Si-0; (g) Si-20. (h) TPD-CO2 results of different mesoporous silica. Reprinted with permission from Ref. [136]. Copyright Elsevier, 2021. (i) Comparison of CO2 gas diffusion state on carbon cavity with different open angles (30°, 60°, and 90°) and carrier gas flow speeds (20, 50, and 100 mL/min) at 10 ns. (j) Diagram of CO2 gas diffusion in the carbon cavity and relevant redox reactions during the pyrolytic process. (k) Free energy diagrams of the SC-5, C-56665, C-5665, and C-565 models at a potential of 0 V. Reprinted with permission from Ref. [137]. Copyright Elsevier, 2022. (l) Fabrication strategy of HO-ZnZrO@C. (mo) TEM, (p) high-magnification TEM images, (q) HAADF-STEM and line scan profiles, (ru) EDX mapping, and (v) cross-sectional TEM images of HO-ZnZrO@C. Reprinted with permission from Ref. [138]. Copyright American Chemical Society, 2020.
Catalysts 15 00477 g013
Figure 14. (a) Fabrication process of IL@Ni foam electrocatalysts. (b) SEM images of [P66614][Triz]@Ni foam. EDS elemental mapping images of [P66614][Triz]@Ni foam showing the EDS signals of N (c), P (d), and Ni (e). (f) Optimized geometries of the [Triz]−CO2 ion. Atom key: C atom (● gray), H atom (○), O atom (● red), and N atom (● blue). Reprinted with permission from Ref. [143]. Copyright American Chemical Society, 2022. (g) Schematic illustration of synthesis of PtNPs@Th. (h) FE-SEM image of the PtNPs@Th composite. (i) TEM image of the PtNPs@Th sample. (j) HR-TEM image of PtNPs@Th. Each small nanoparticle is composed of interconnected nanocrystals (green circles) surrounded with intercalated and marginal Th molecules (yellow arrows), indicating that Th may be encapsulated in PtNPs. (k) EDX elemental mapping images of PtNPs@Th, showing the signals of Pt, C, N and S. (l) Calculated energy barriers of water dissociation on Pt and Th-Pt (111) surfaces. Reprinted with permission from Ref. [37]. Copyright Oxford University Press, 2024. (m) Schematic illustration of the overall synthesis process for TiO2@In2S3 hybrid. Wavelet transform of (n) TiO2 and (o) InTi-0.54. Reprinted with permission from Ref. [144].Copyright Elsevier, 2024. (p) Schematic illustration of the synthesis procedure for SnO2/g-C3N4. (q) TEM image of SnO2/g-C3N4. (r,s) Aberration-corrected HADDF-STEM image of SnO2/g-C3N4 (green circles, SnO2 NDs), the inset shows the corresponding histograms of the size distribution. 3D contour plot of electronic distributions of (t) g-C3N4 and (u) SnO2/g-C3N4. Gray balls represent C, blue balls represent N, purple balls represent Sn, and red balls represent O. The blue isosurface represents bonding orbitals, and the green isosurface represents antibonding orbitals. Reprinted with permission from Ref. [145]. Copyright American Chemical Society, 2023.
Catalysts 15 00477 g014
Figure 15. (a) TEM and inset HR-TEM images of the fresh catalyst CZ(0.9)@Z(60)-24. (b) TEM image and (c) size distribution of the used CZ(0.9)@Z(60)-24 catalyst after 100 h reaction. Catalytic activity of the CZ(x)@Z(y)-t catalysts: (d) CZ(0.9)@Z(60)-t at different crystallization times (t = 12, 24 and 48 h). (e) CZ(x)@Z(60)-24 for different Cu-to-Zn molar ratios (x = 0.3, 0.6, 0.9, 1.5 and only Cu metal). (f) CZ(0.9)@Z(y)-24 for different Si/Al molar ratios (y = 40, 60 and 100). (g) Catalytic activity of CZ(0.9)@Z(60)-24 with time on stream at 260 °C and 5.0 MPa. Reprinted with permission from Ref. [108]. Copyright Royal Society of Chemistry, 2025.
Catalysts 15 00477 g015
Figure 16. (a) Particle size of the catalysts before and after long-time DRM reaction. (b) Sintering rate of the catalysts. (c) Lewis acid site of pyridine-adsorbed FT-IR over different catalysts. (d) In situ CH4-DRIFT spectra. (e) CH4-TPSR and (f) its area normalization results. (g,h) comparison of in situ DRIFT spectra for the DRM reaction. (i) Differential charge density of ultra-small Ni catalyst. (j) PDOS analysis of the Ni/S-SBA-15-OH catalyst. Reprinted with permission from Ref. [51]. Copyright John Wiley and Sons, 2024.
Catalysts 15 00477 g016
Figure 17. Morphology characterization of Bi/’TiO2. (a) Schematic illustration of Bi/TiO2 synthetic process. (b) TEM and (c) HRTEM images of Bi/TiO2. Inset in (b)shows the size distribution for pores. Inset in (c) shows the size distribution for Bi clusters. (d) N2 adsorption–desorption isotherms. (e) Selectivity in 2 h on samples of TiO2 and Bi/TiO2, respectively. (f) Cycling curves of photocatalytic production for Bi/TiO2. Mechanism of charge transfer. (g) Nyquist plots of the electrochemical impedance spectra. (h) Photoluminescence (PL) spectra. (i) Photocurrent responses measured with intermittent light spectra of TiO2 and Bi/TiO2. In situ XPS spectra of (j) Ti 2p, (k) O 1s and (l) Bi 4f over Bi/TiO2. Reprinted with permission from Ref. [107]. Copyright Springer Nature, 2023.
Catalysts 15 00477 g017
Figure 18. (a) The syntheses of PtCu/UiO/ZIS, UiO/PtCu/ZIS, and UiO/ZIS/PtCu involve three fundamental steps. PtCu at different locations yields distinct target products. (b) CO2 adsorption isotherms. (c) Comparative CO, H2, CH4, CH3OH, and O2 evolution rates. (d) Product selectivities of PtCu/UiO/ZIS, UiO/PtCu/ZIS, and UiO/ZIS/PtCu. Charge kinetics analysis: (e) photocurrent densities, (f) steady-state PL spectra, (g) electrochemical impedance spectroscopy (EIS) Nyquist plots. Reprinted with permission from Ref. [109]. Copyright American Chemical Society, 2025.
Catalysts 15 00477 g018
Figure 19. (a) Illustration of catalytic behaviors of Ru3-SCs@Ni-PCN-222-PyrA toward CO2 reduction to CH4. (b) STEM, (c) aberration-corrected (AC) HADDF-STEM and (d) HR-TEM and (e) AC HADDF-STEM images of Ru-SAs@Ni-PCN-222-PyrA. (f) LSVs of Ru3-SCs@Ni-PCN-222-PyrA, Ru-SAs@Ni-PCN-222-PyrA and Ni-PCN-222 in a CO2-saturated 1.0 M PBS with a scan rate of 5 mV·s−1, (g) Faradaic efficiency (FE) at 1.0 V versus RHE and (h) CH4 partial current densities (blue circle) of Ru3-SCs@Ni-PCN-222-PyrA at various applied potentials in a H-cell. (i) Free energy diagram of Ru3-SCs@Ni-PCN-222-PyrA and Ru-SAs@Ni-PCN-222-PyrA for CO2 reduction to CH4. Reprinted with permission from Ref. [52]. Copyright John Wiley and Sons, 2025.
Catalysts 15 00477 g019
Figure 20. Synthesis and characterization. (a) Schematic for preparation of Cu2O@MSST core-shell confined catalysts. (b) Low-magnification TEM image of as-prepared Cu2O@MSS15nm. (c) HAADF-STEM image of Cu2O@MSS15nm. (d) Atomic-resolution aberration-corrected HAADF-STEM image of Cu2O@MSS15nm. The inset shows the fast Fourier transform (FFT) pattern recorded from the d1 region in (d). Shell thickness-dependent CO2ER in acid. (e) FE (left axis) and total current density (right axis) of OD-Cu@MSS15nm catalyst at different applied potentials. (f) FEC2+ of OD-Cu, OD-Cu@MSS8nm, OD-Cu@MSS15nm, and OD-Cu@MSS30nm catalysts. (g) The FE and partial current density of C2+ products in this work compared with state-of-the-art catalysts ever reported in acidic medium. (h) The distribution of local OH concentration over OD-Cu, OD-Cu@MSS8nm, OD-Cu@MSS15nm, and OD-Cu@MSS30nm. (i) The distribution of local CO2 concentration over different catalysts. (j) The summarized local OH concentration and local CO2 concentration derived from (h,i). Reprinted with permission from Ref. [110]. Copyright John Wiley and Sons, 2024.
Catalysts 15 00477 g020
Table 1. Systematic evaluation of the advantages and limitations of nanoconfined catalysis across different dimensions.
DimensionTypical StructureCommon AdvantageLimitation
1DCarbon nanotubeMass transfer effectDiffusion issues caused by non-uniform pore sizes
2DGraphene overlayerSpatial compartmentation effectThe overlayer requires high mechanical stability
3DMOFsSurface modification effectHigh-temperature structural collapse risk
InterfaceMetal–oxide heterojunctionMetal size effectScalability challenges in manufacturing
Disclaimer/Publisher’s Note: The statements, opinions and data contained in all publications are solely those of the individual author(s) and contributor(s) and not of MDPI and/or the editor(s). MDPI and/or the editor(s) disclaim responsibility for any injury to people or property resulting from any ideas, methods, instructions or products referred to in the content.