
Synthesis of Iron Oxide Nanoparticles via Atmospheric Pressure Microplasma for High-Performance Energy Storage and Environmental Applications


 ,
,  ,
,  , and
, and
Abstract
1. Introduction
2. Results and Discussion
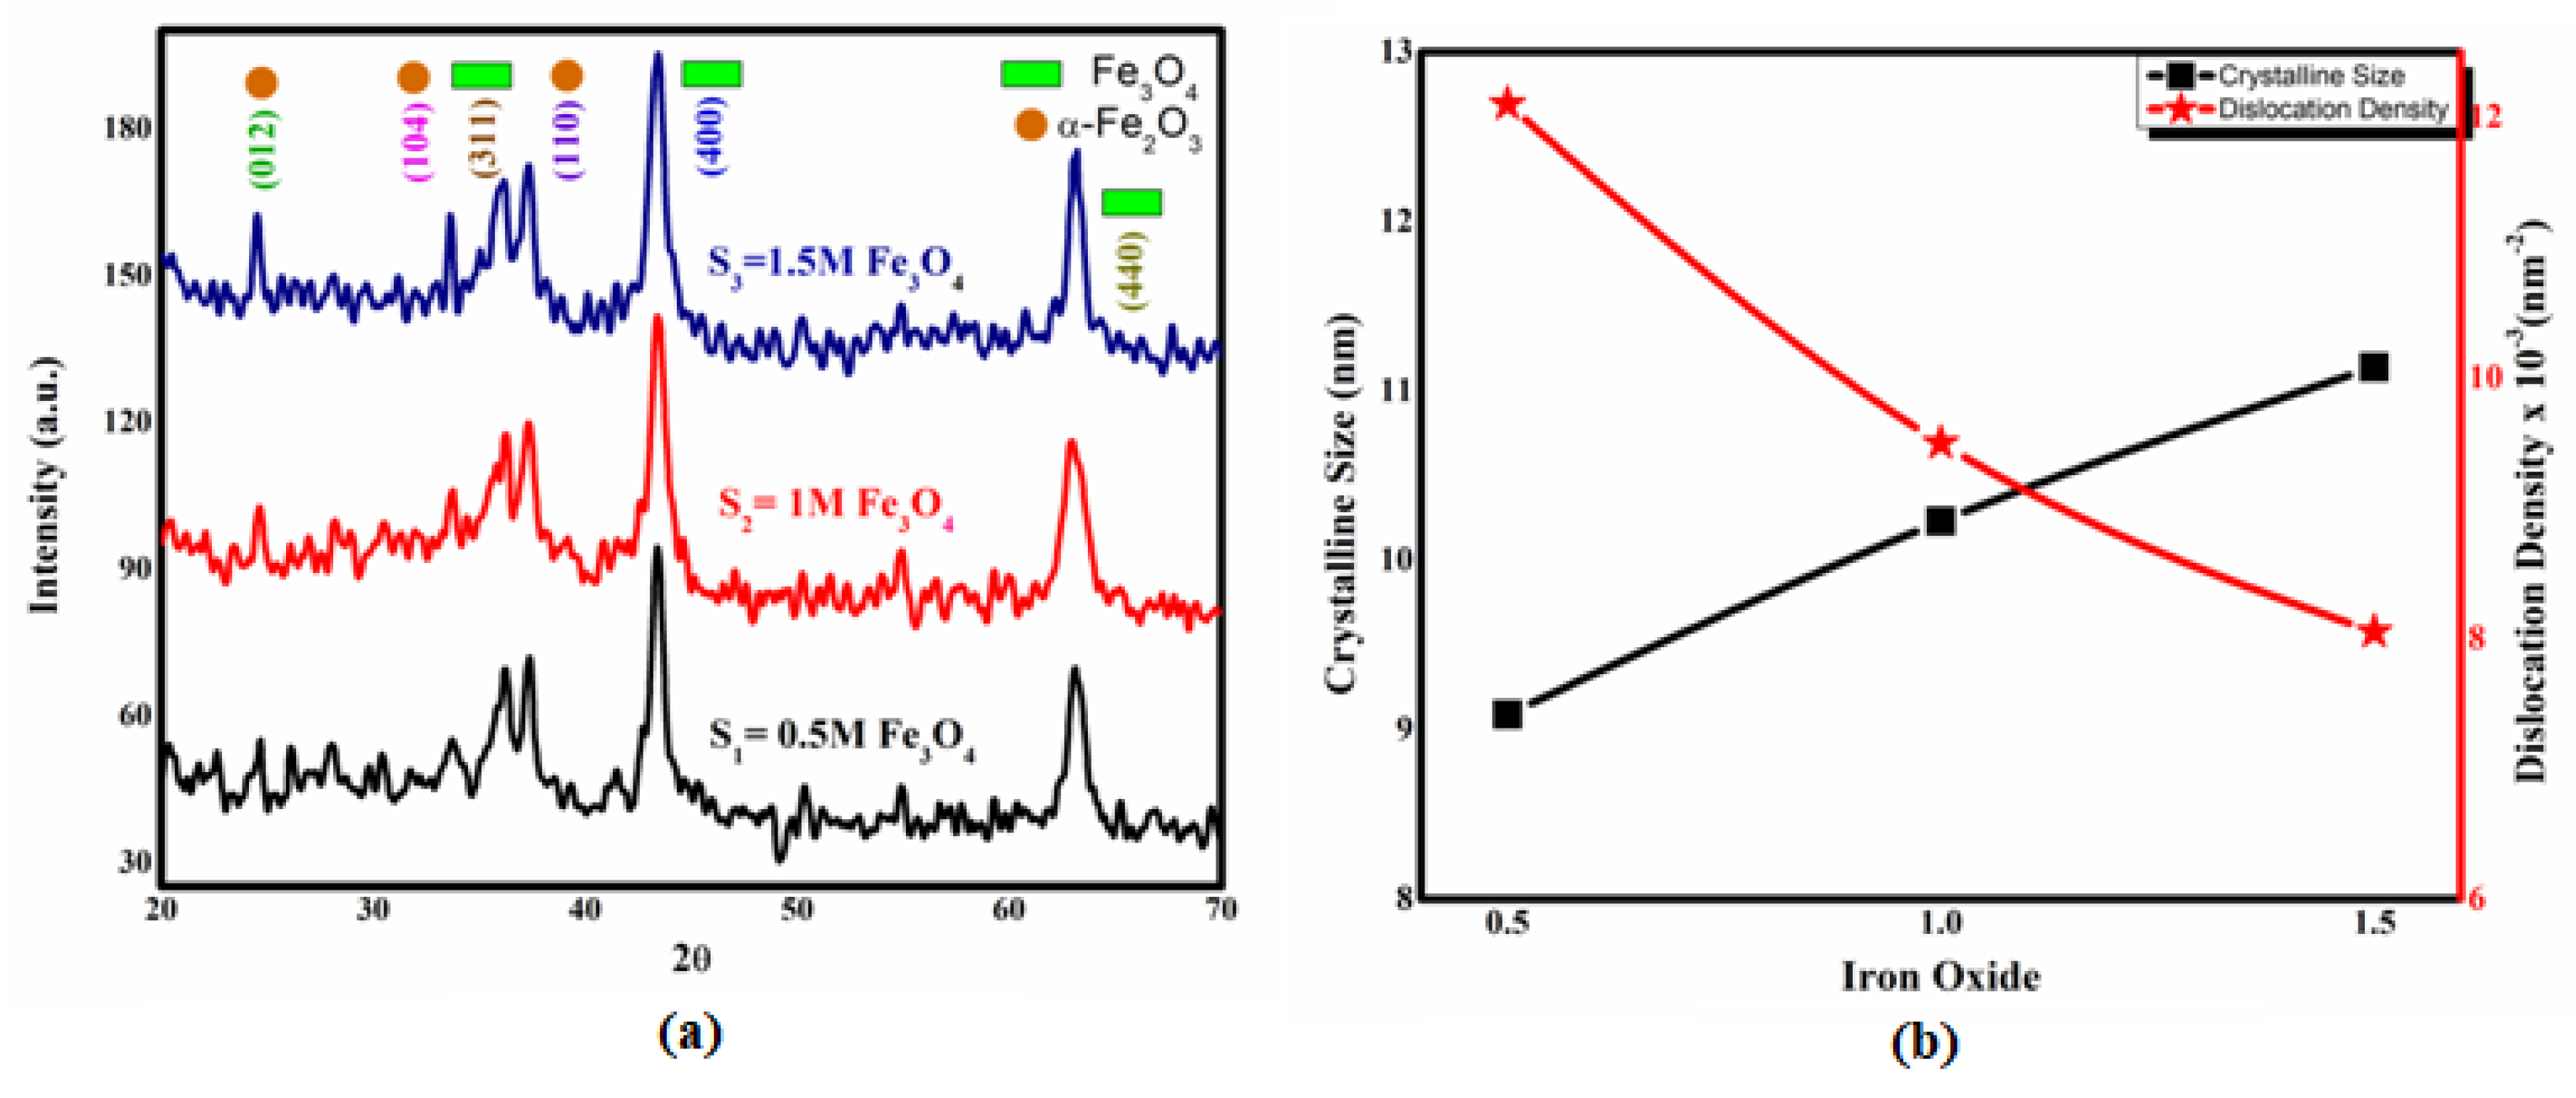
2.1. XRD Results
2.2. SEM
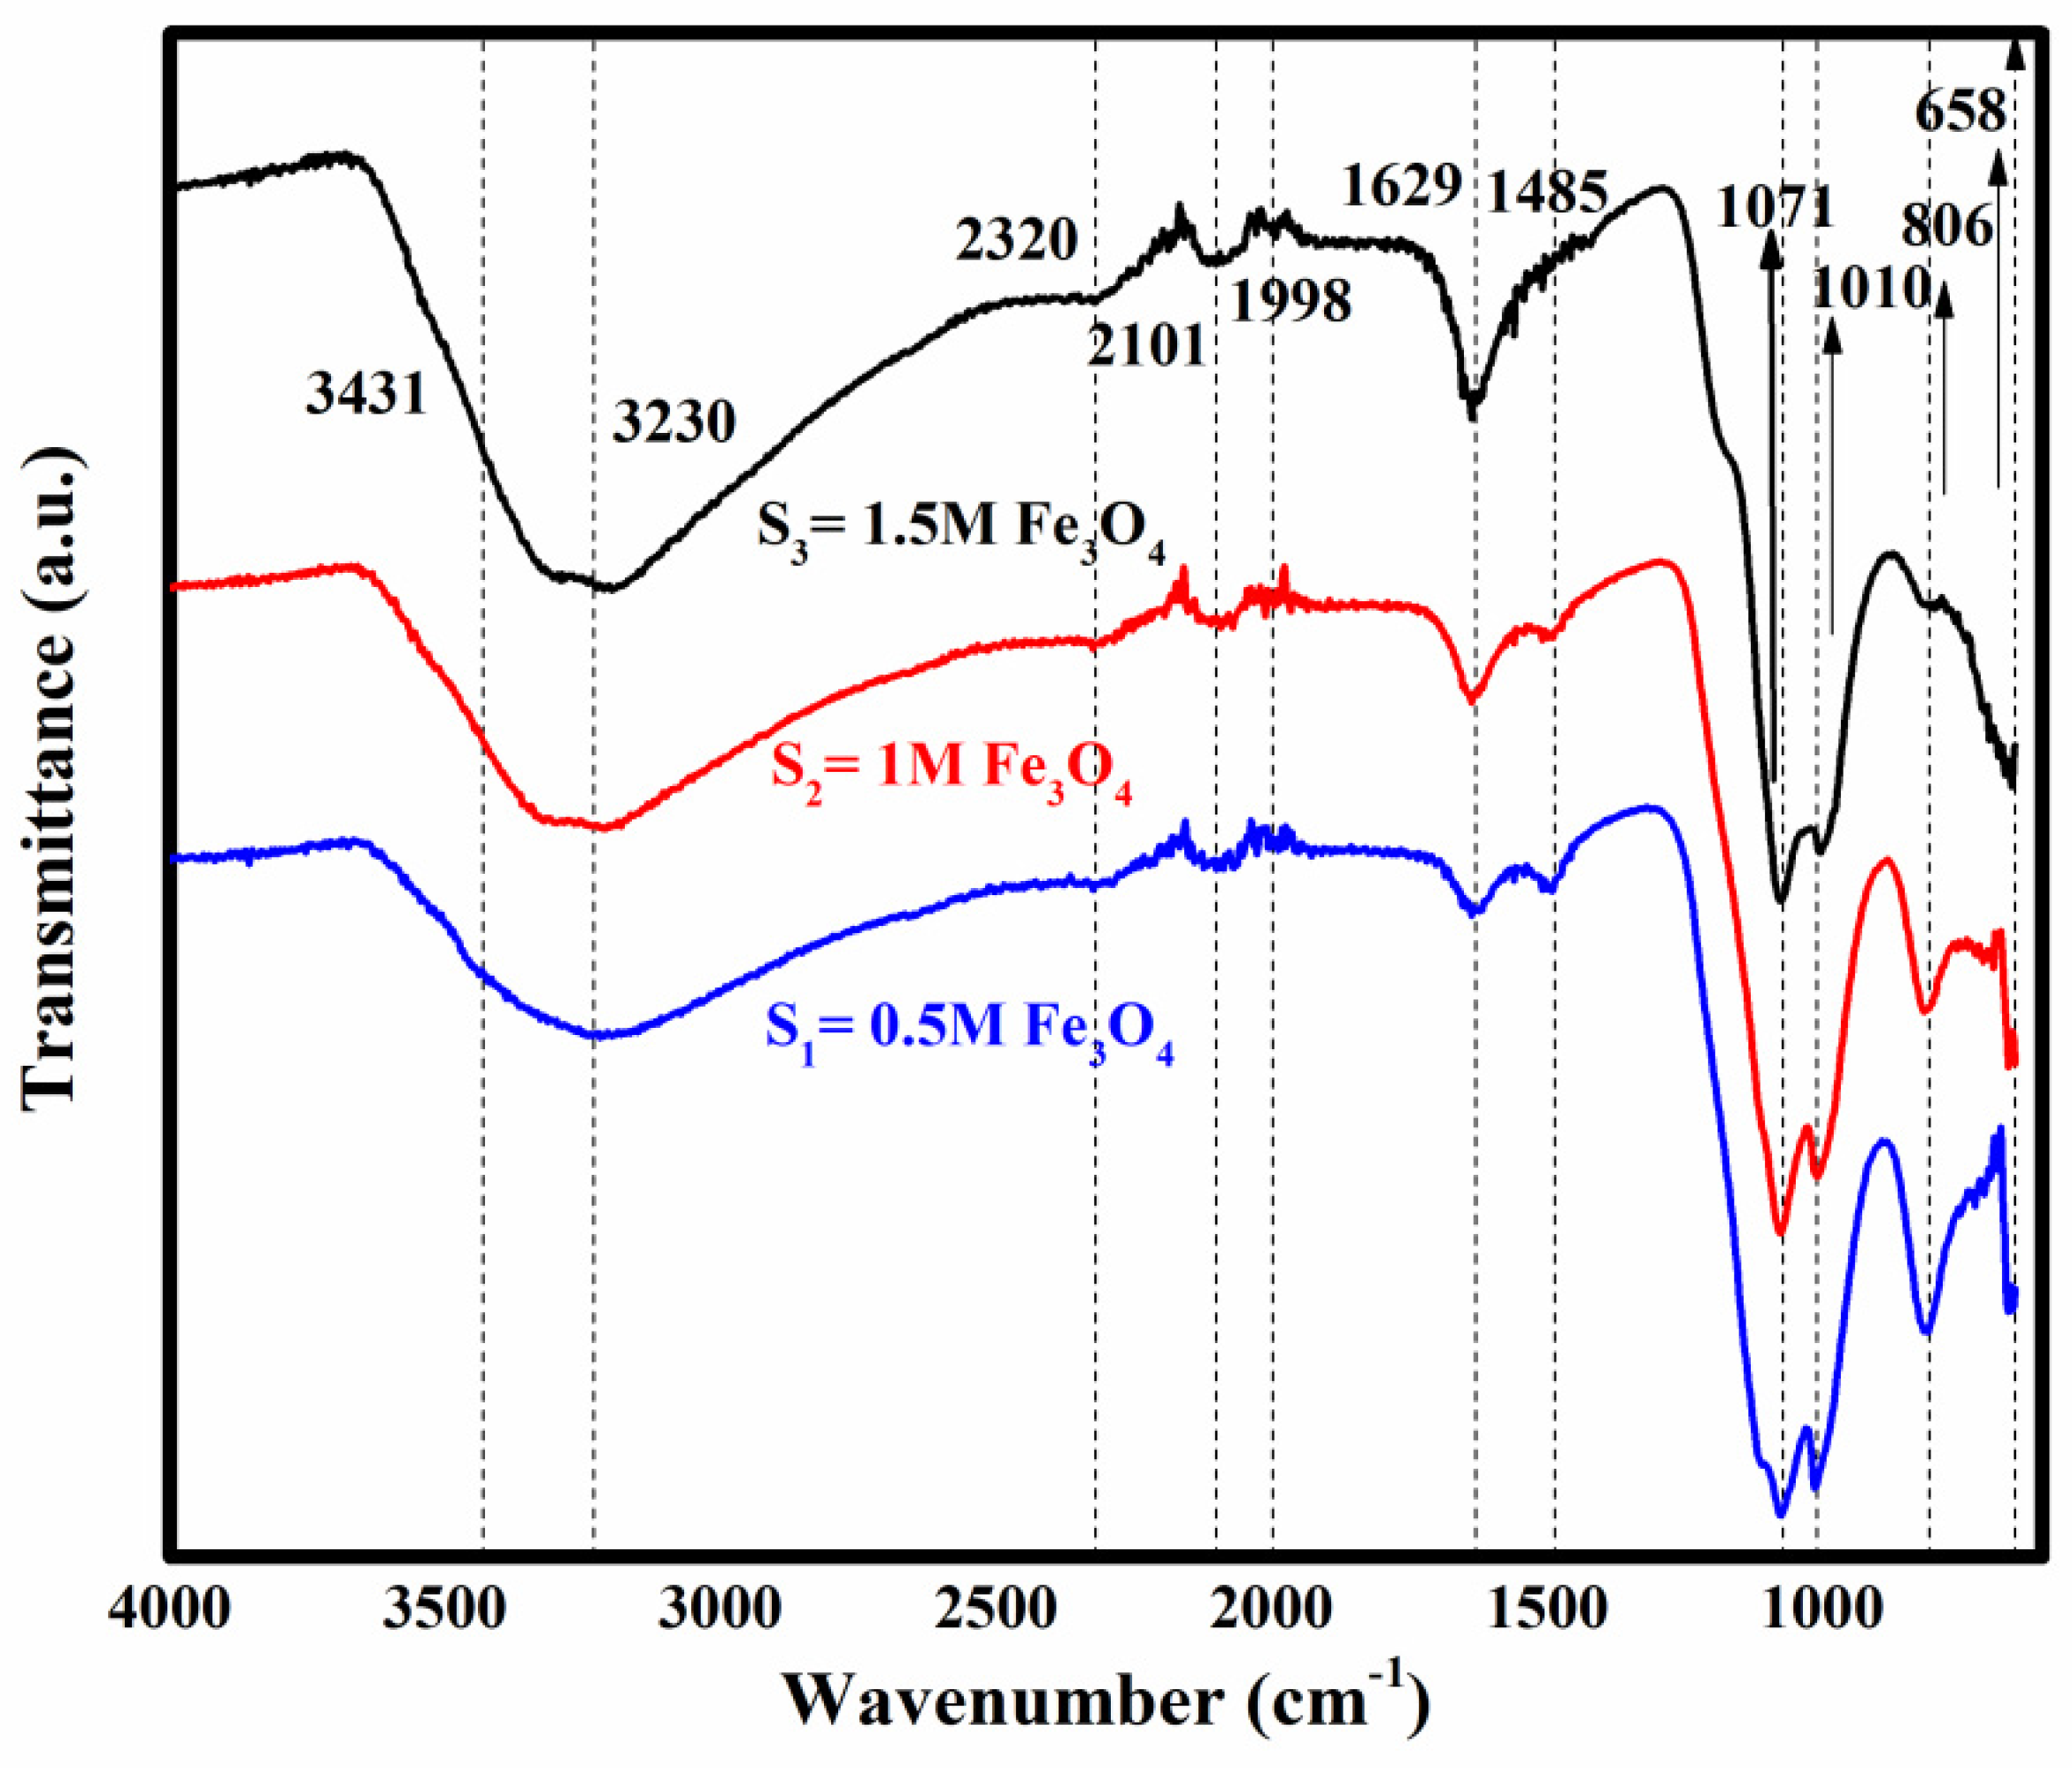
2.3. FTIR Results
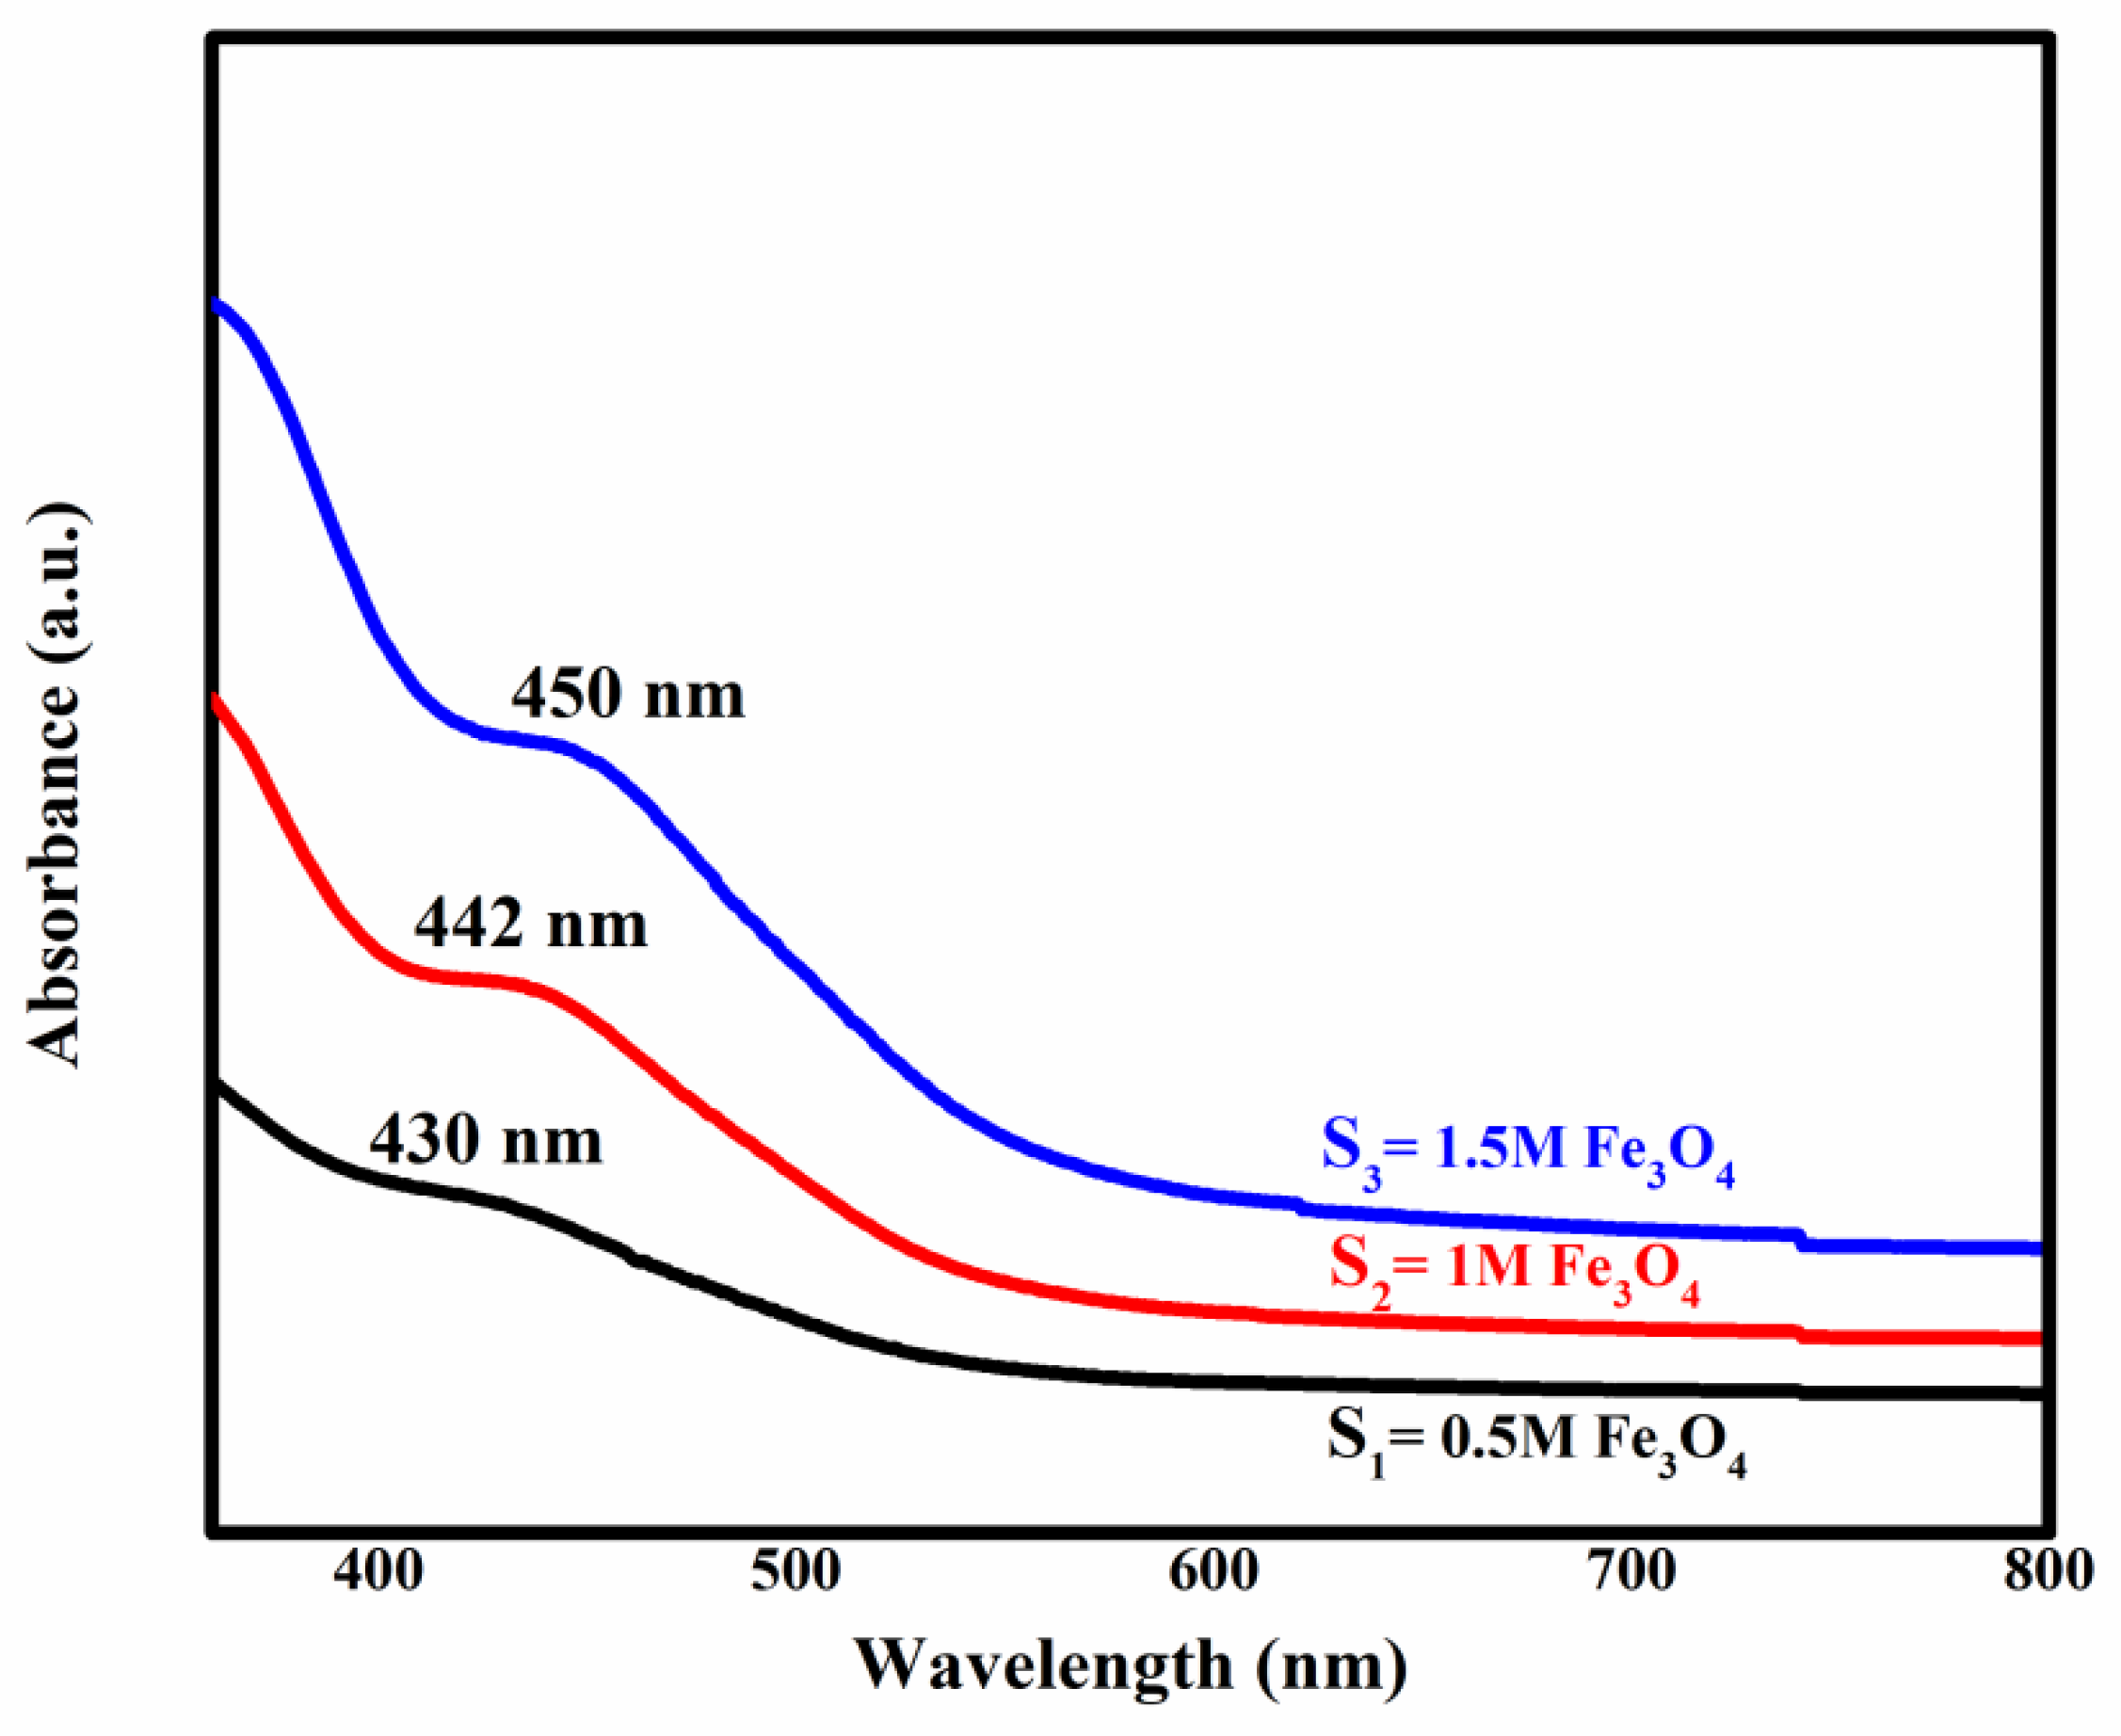
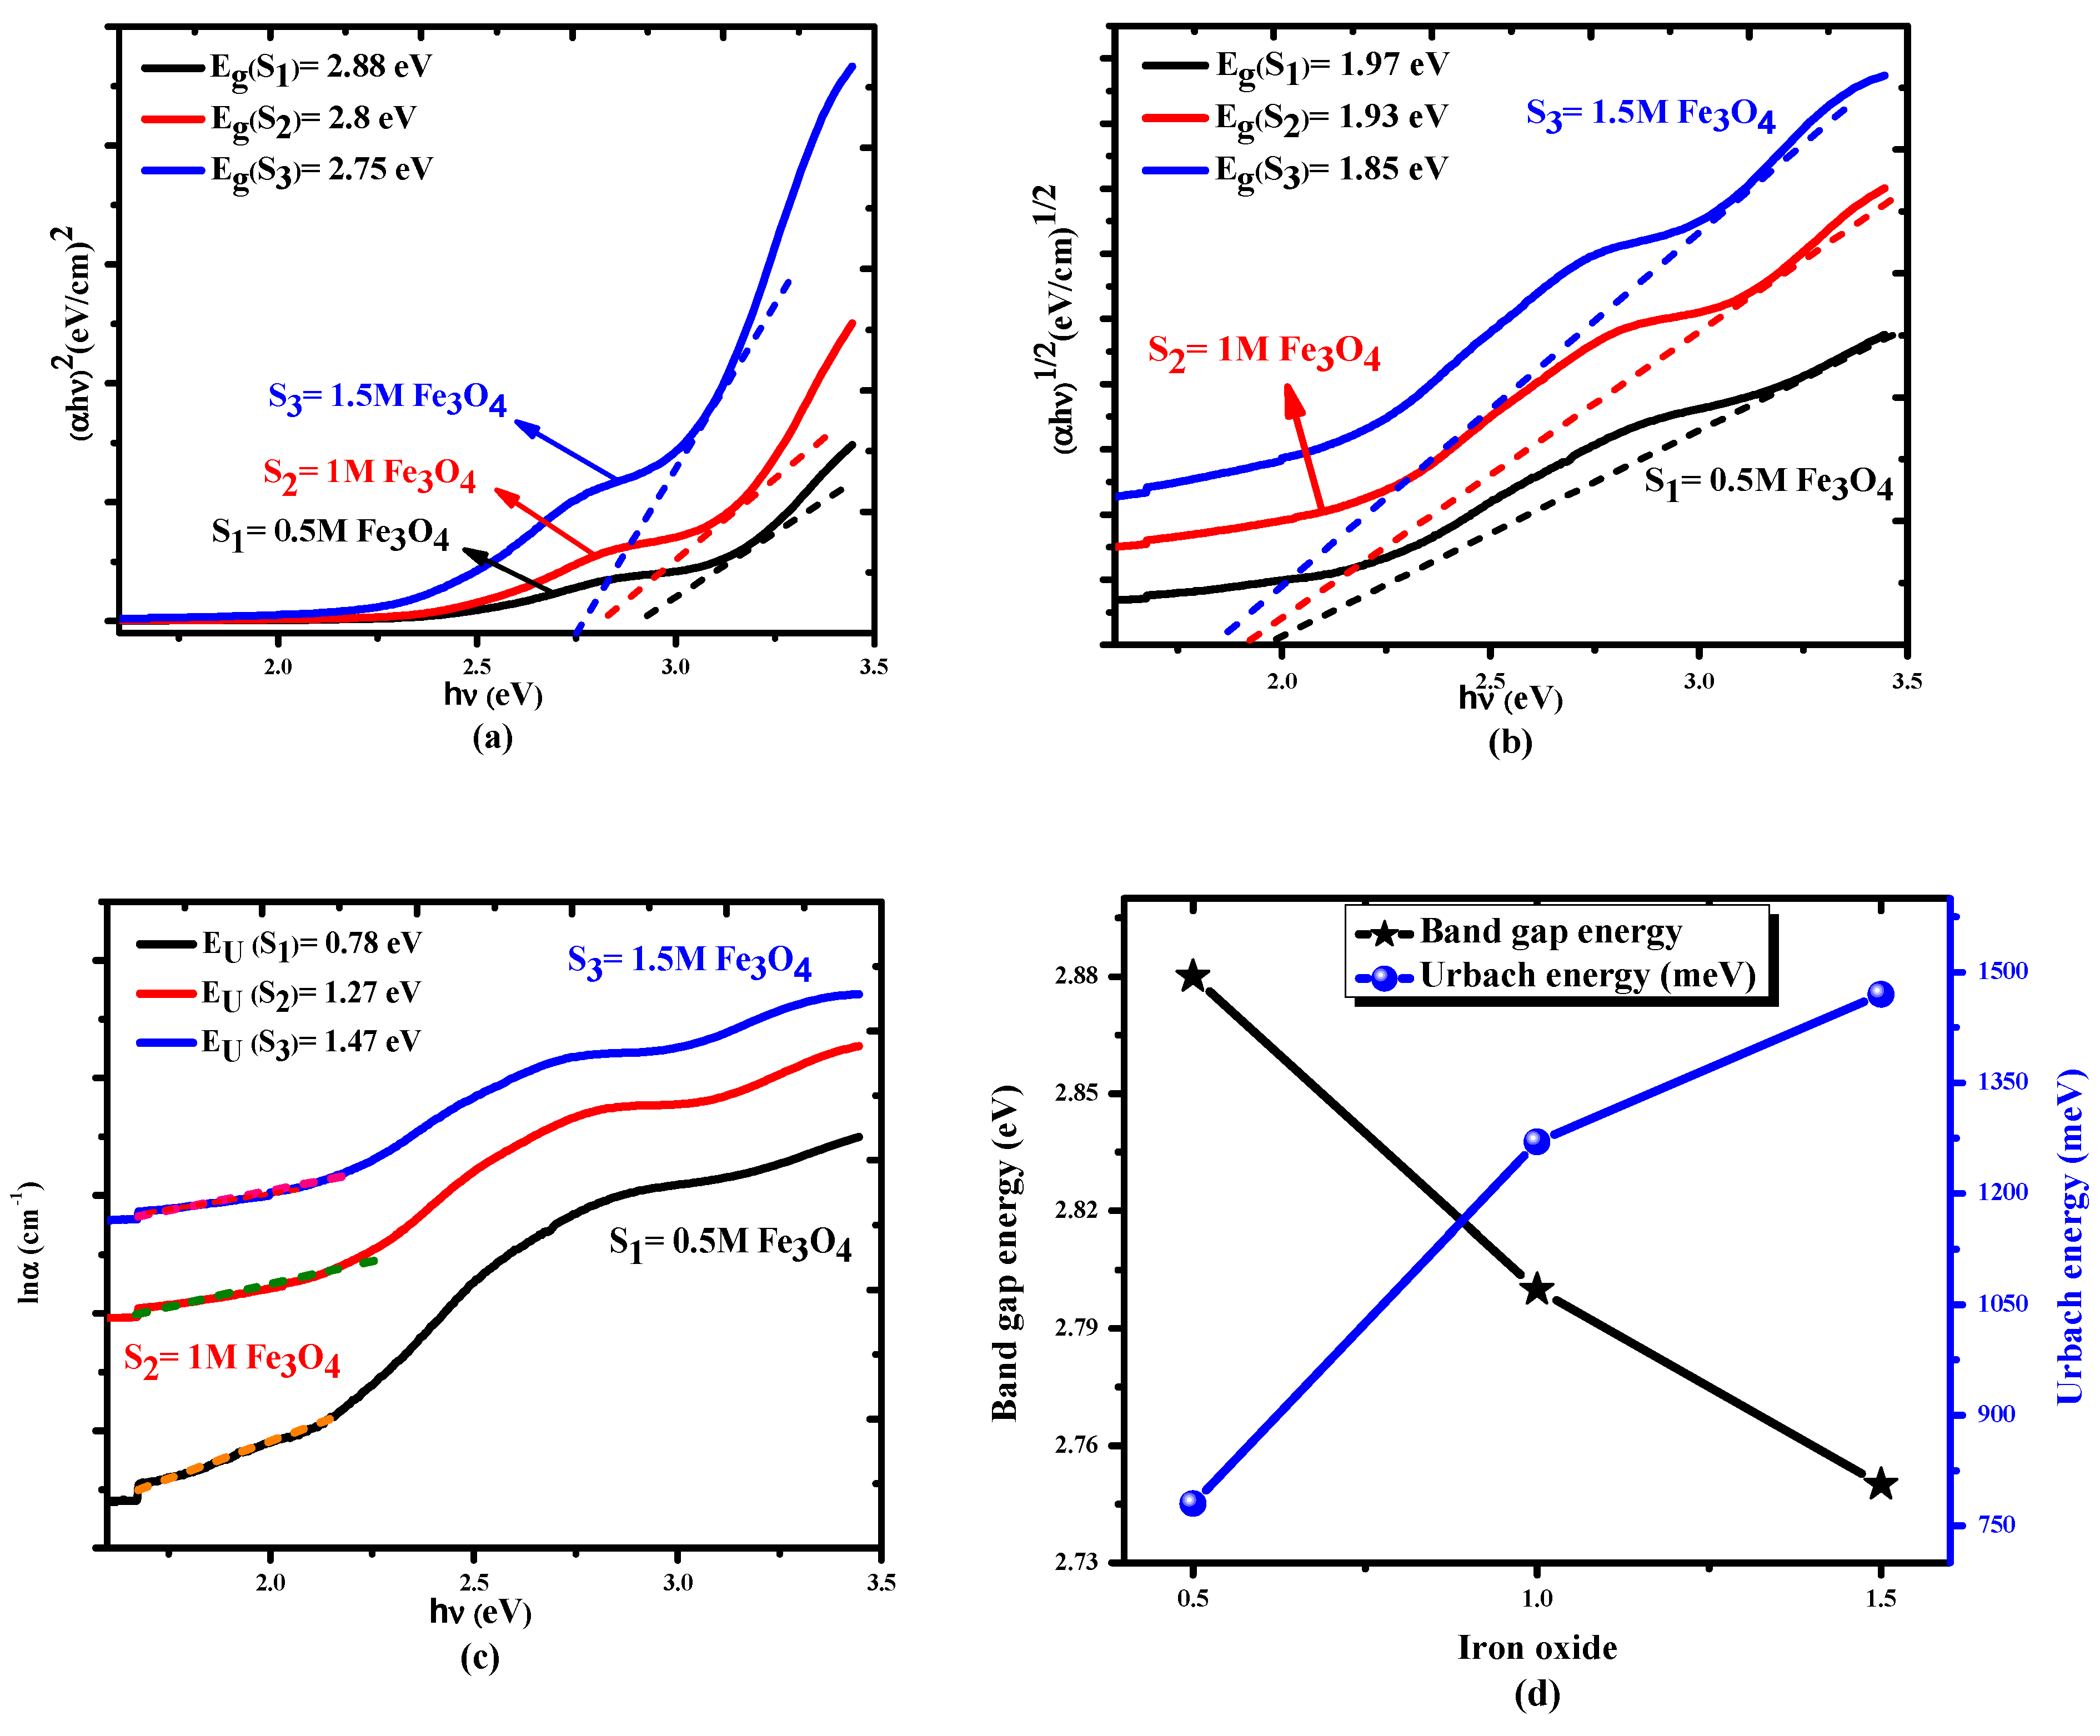
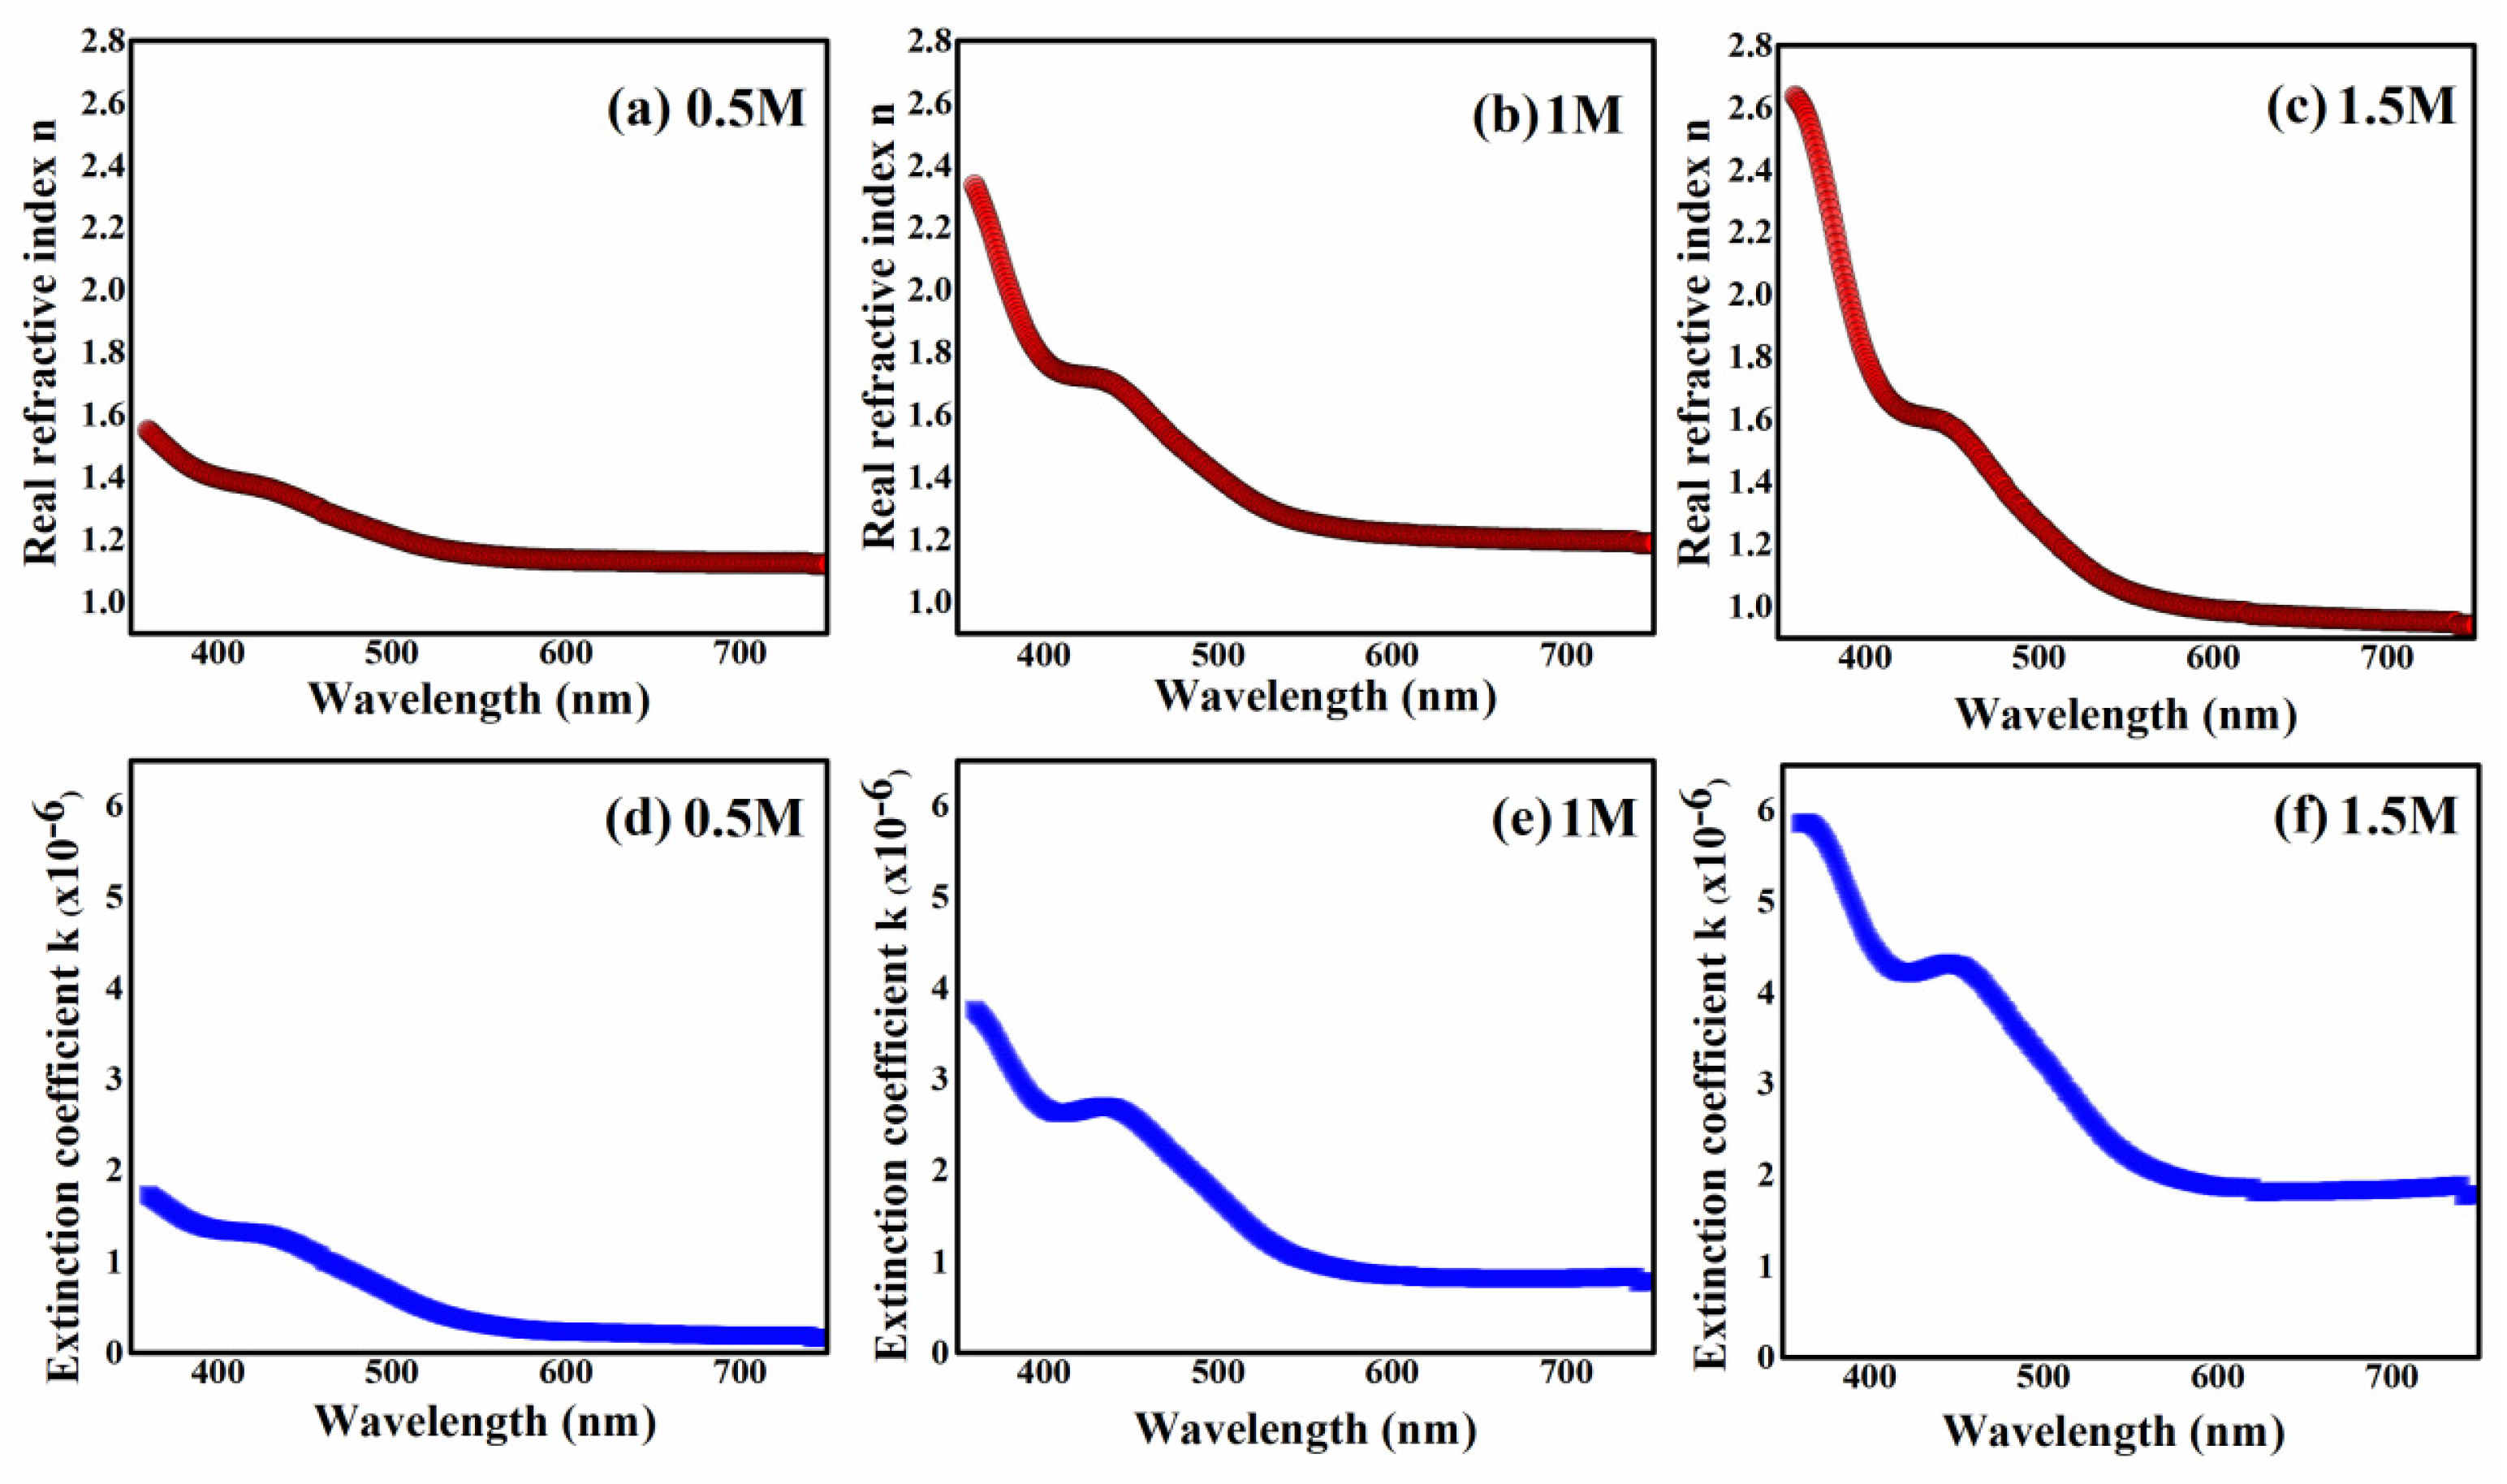
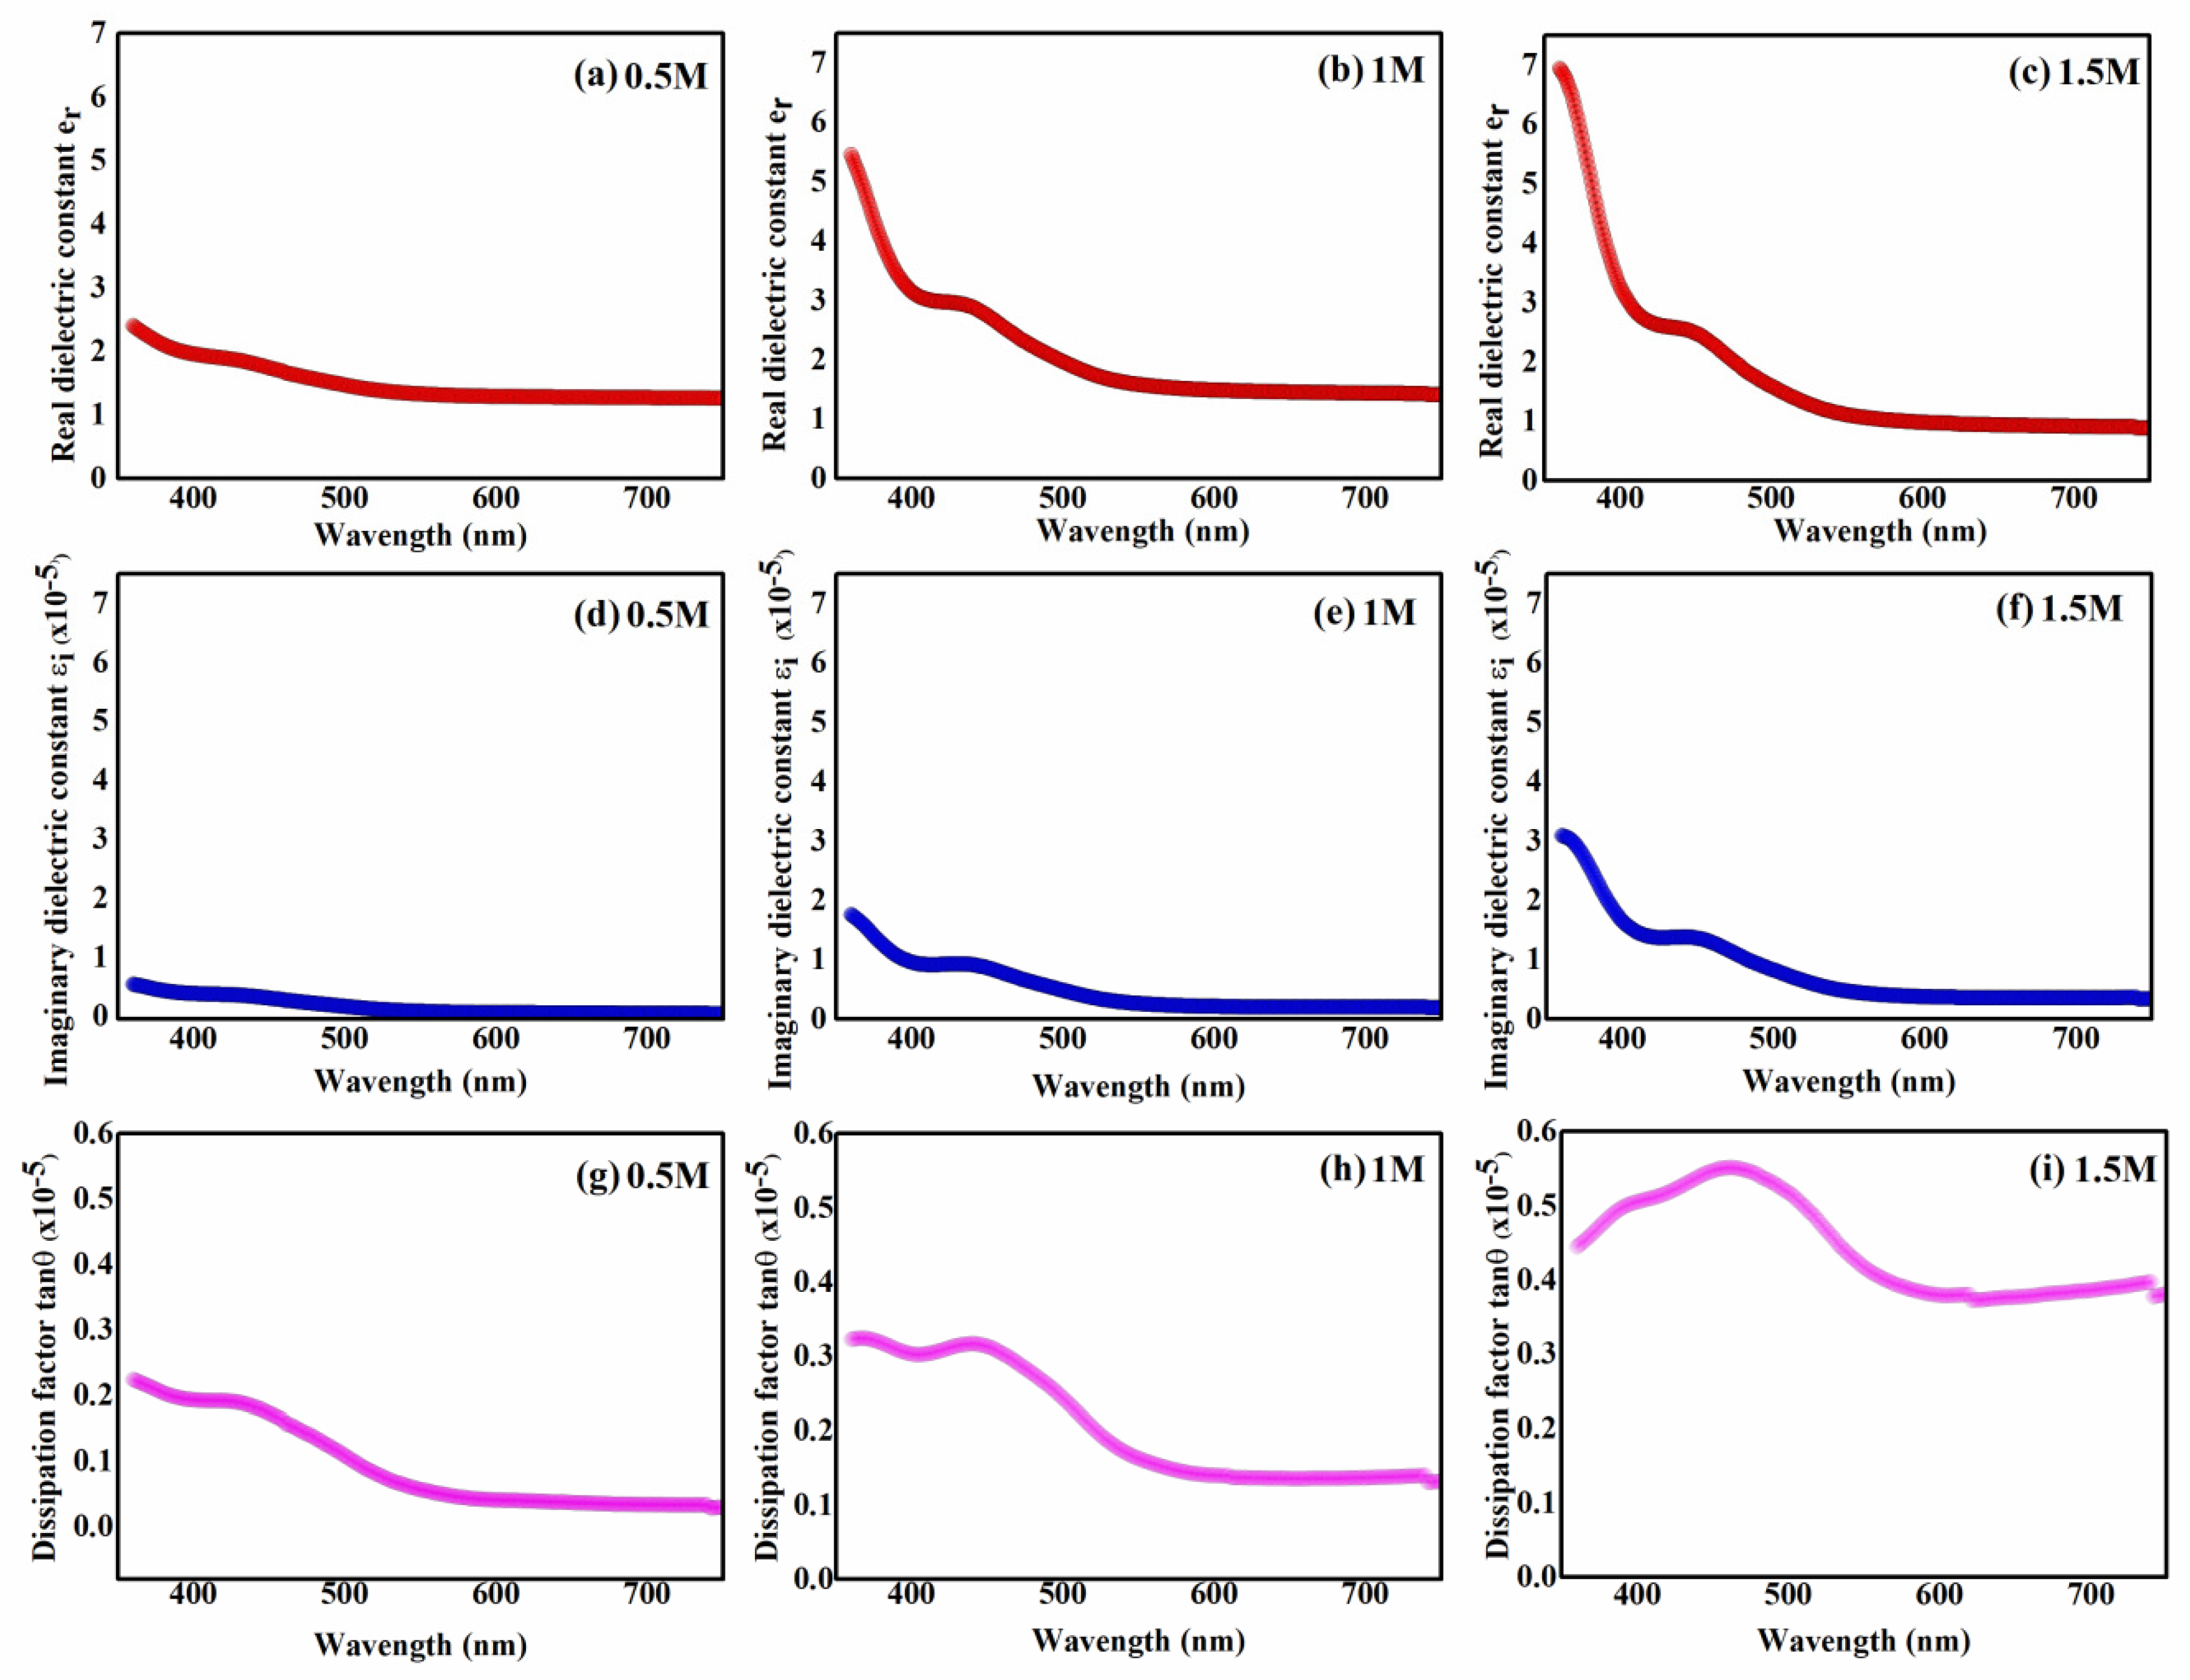
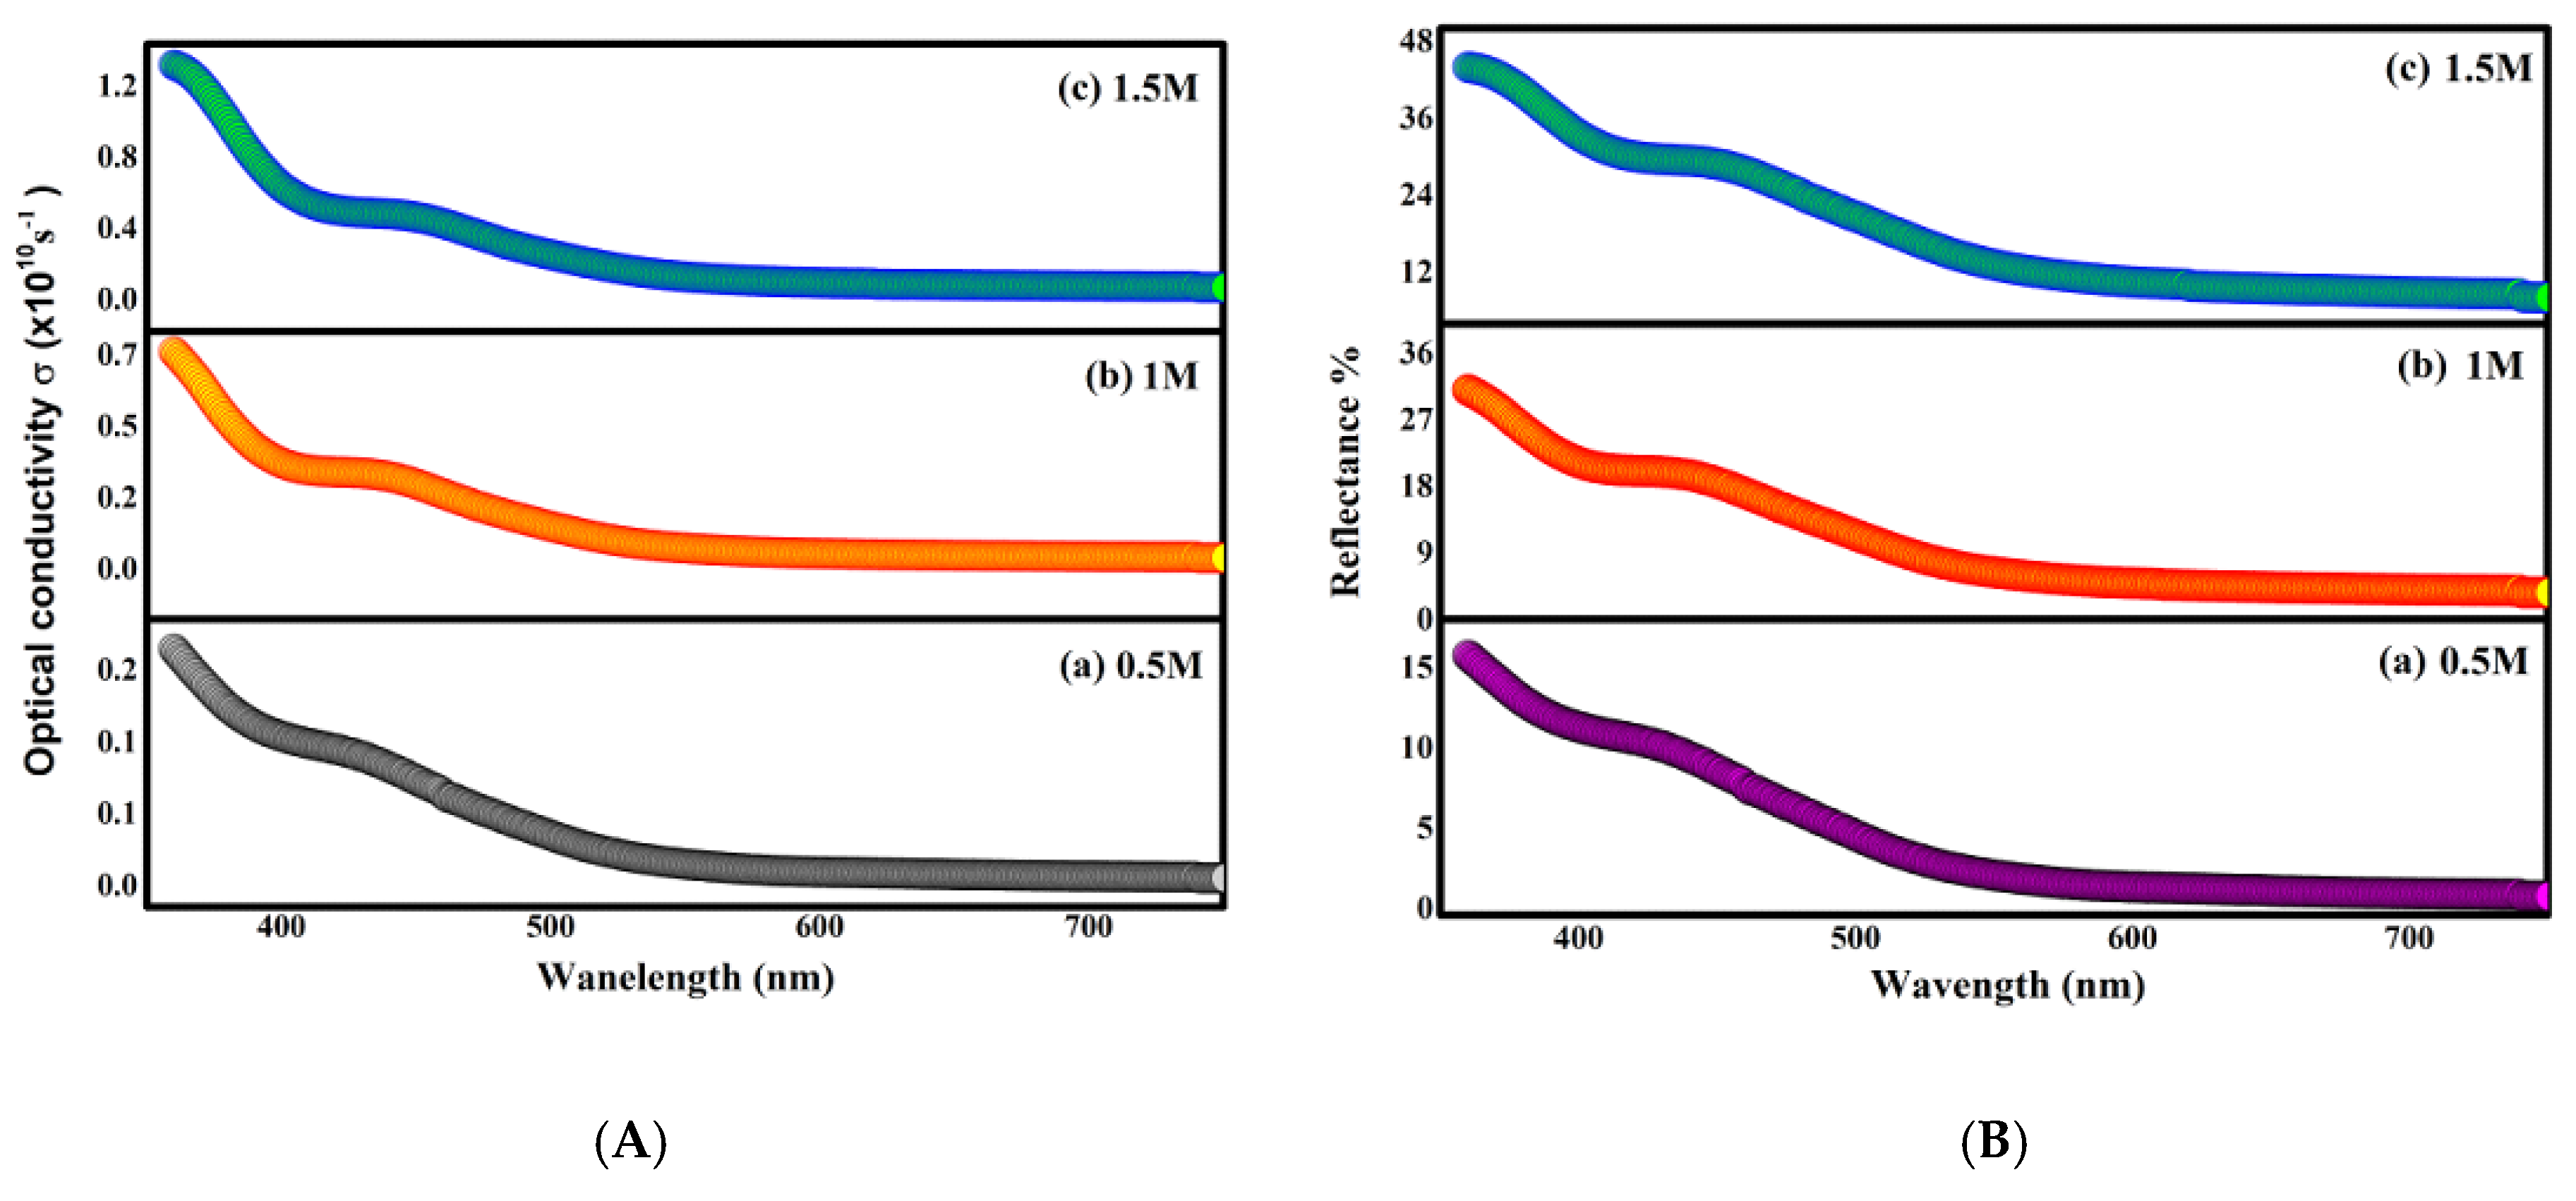
2.4. Optical Results
2.5. Photocatalytic Activity
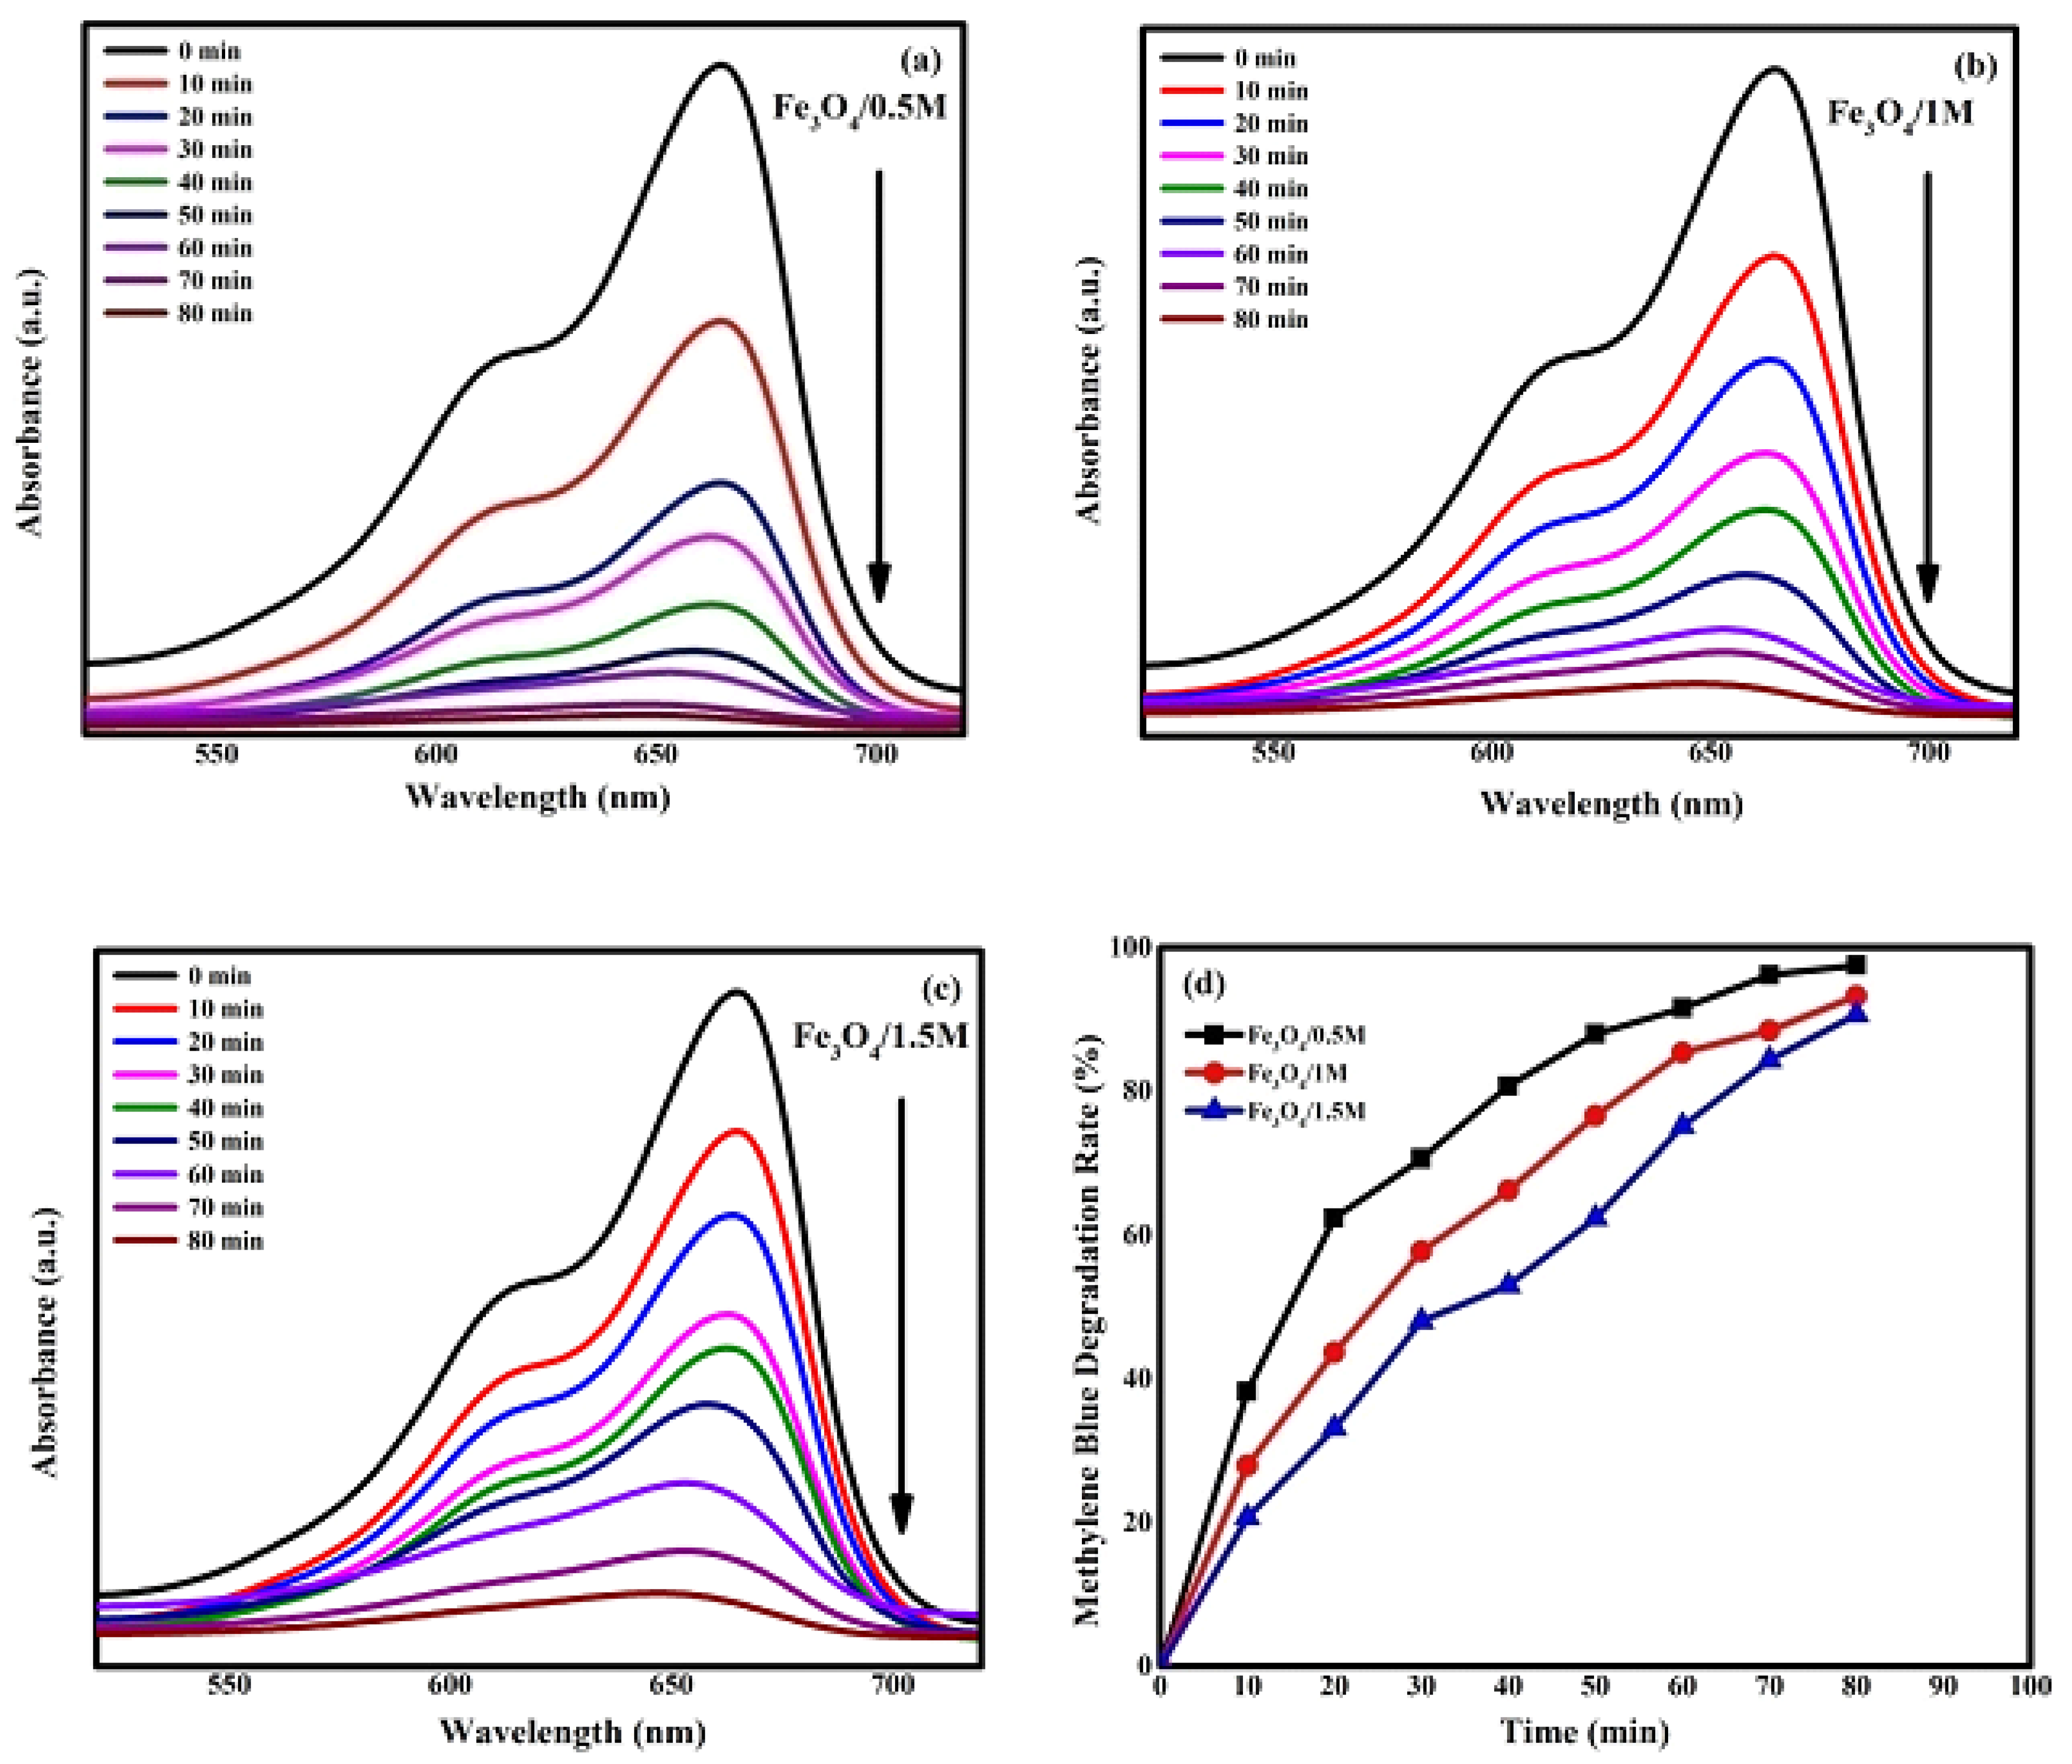
2.5.1. Analysis of Photocatalytic Activity
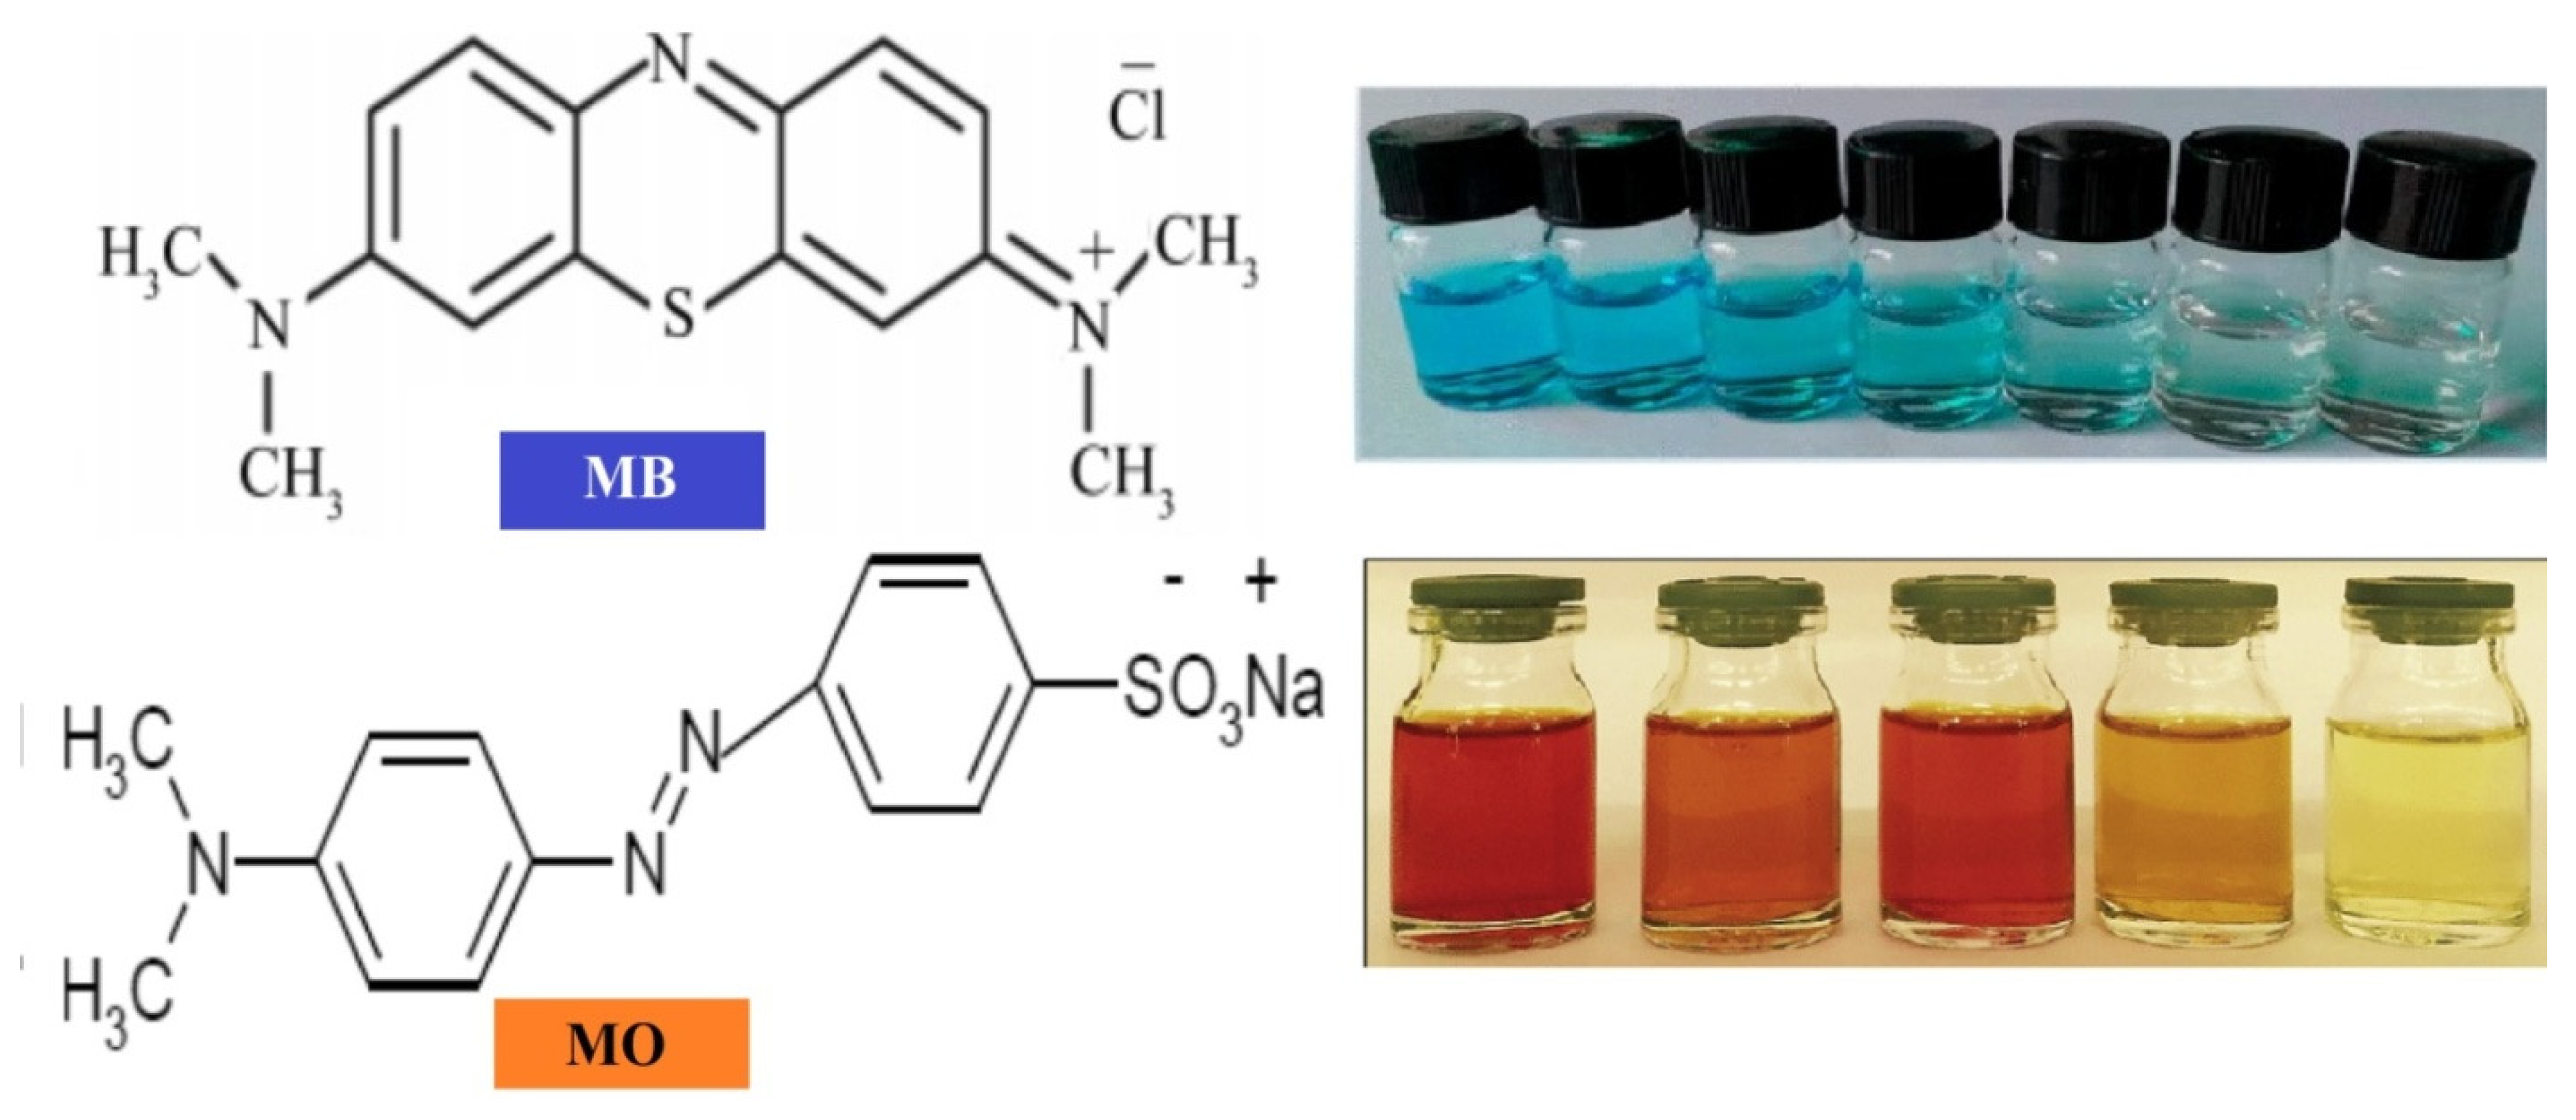
- Molecular Structure Stability: The two dyes differ in the stability of their molecular structures, as illustrated in Figure 11. Methylene blue (MB) shows a greater electron delocalization across larger carbon atoms when compared to the single benzene rings found in methyl orange (MO). This increased delocalization weakens the conjugated single and double bonds in MB, making it easier to remove π-electrons compared to MO.
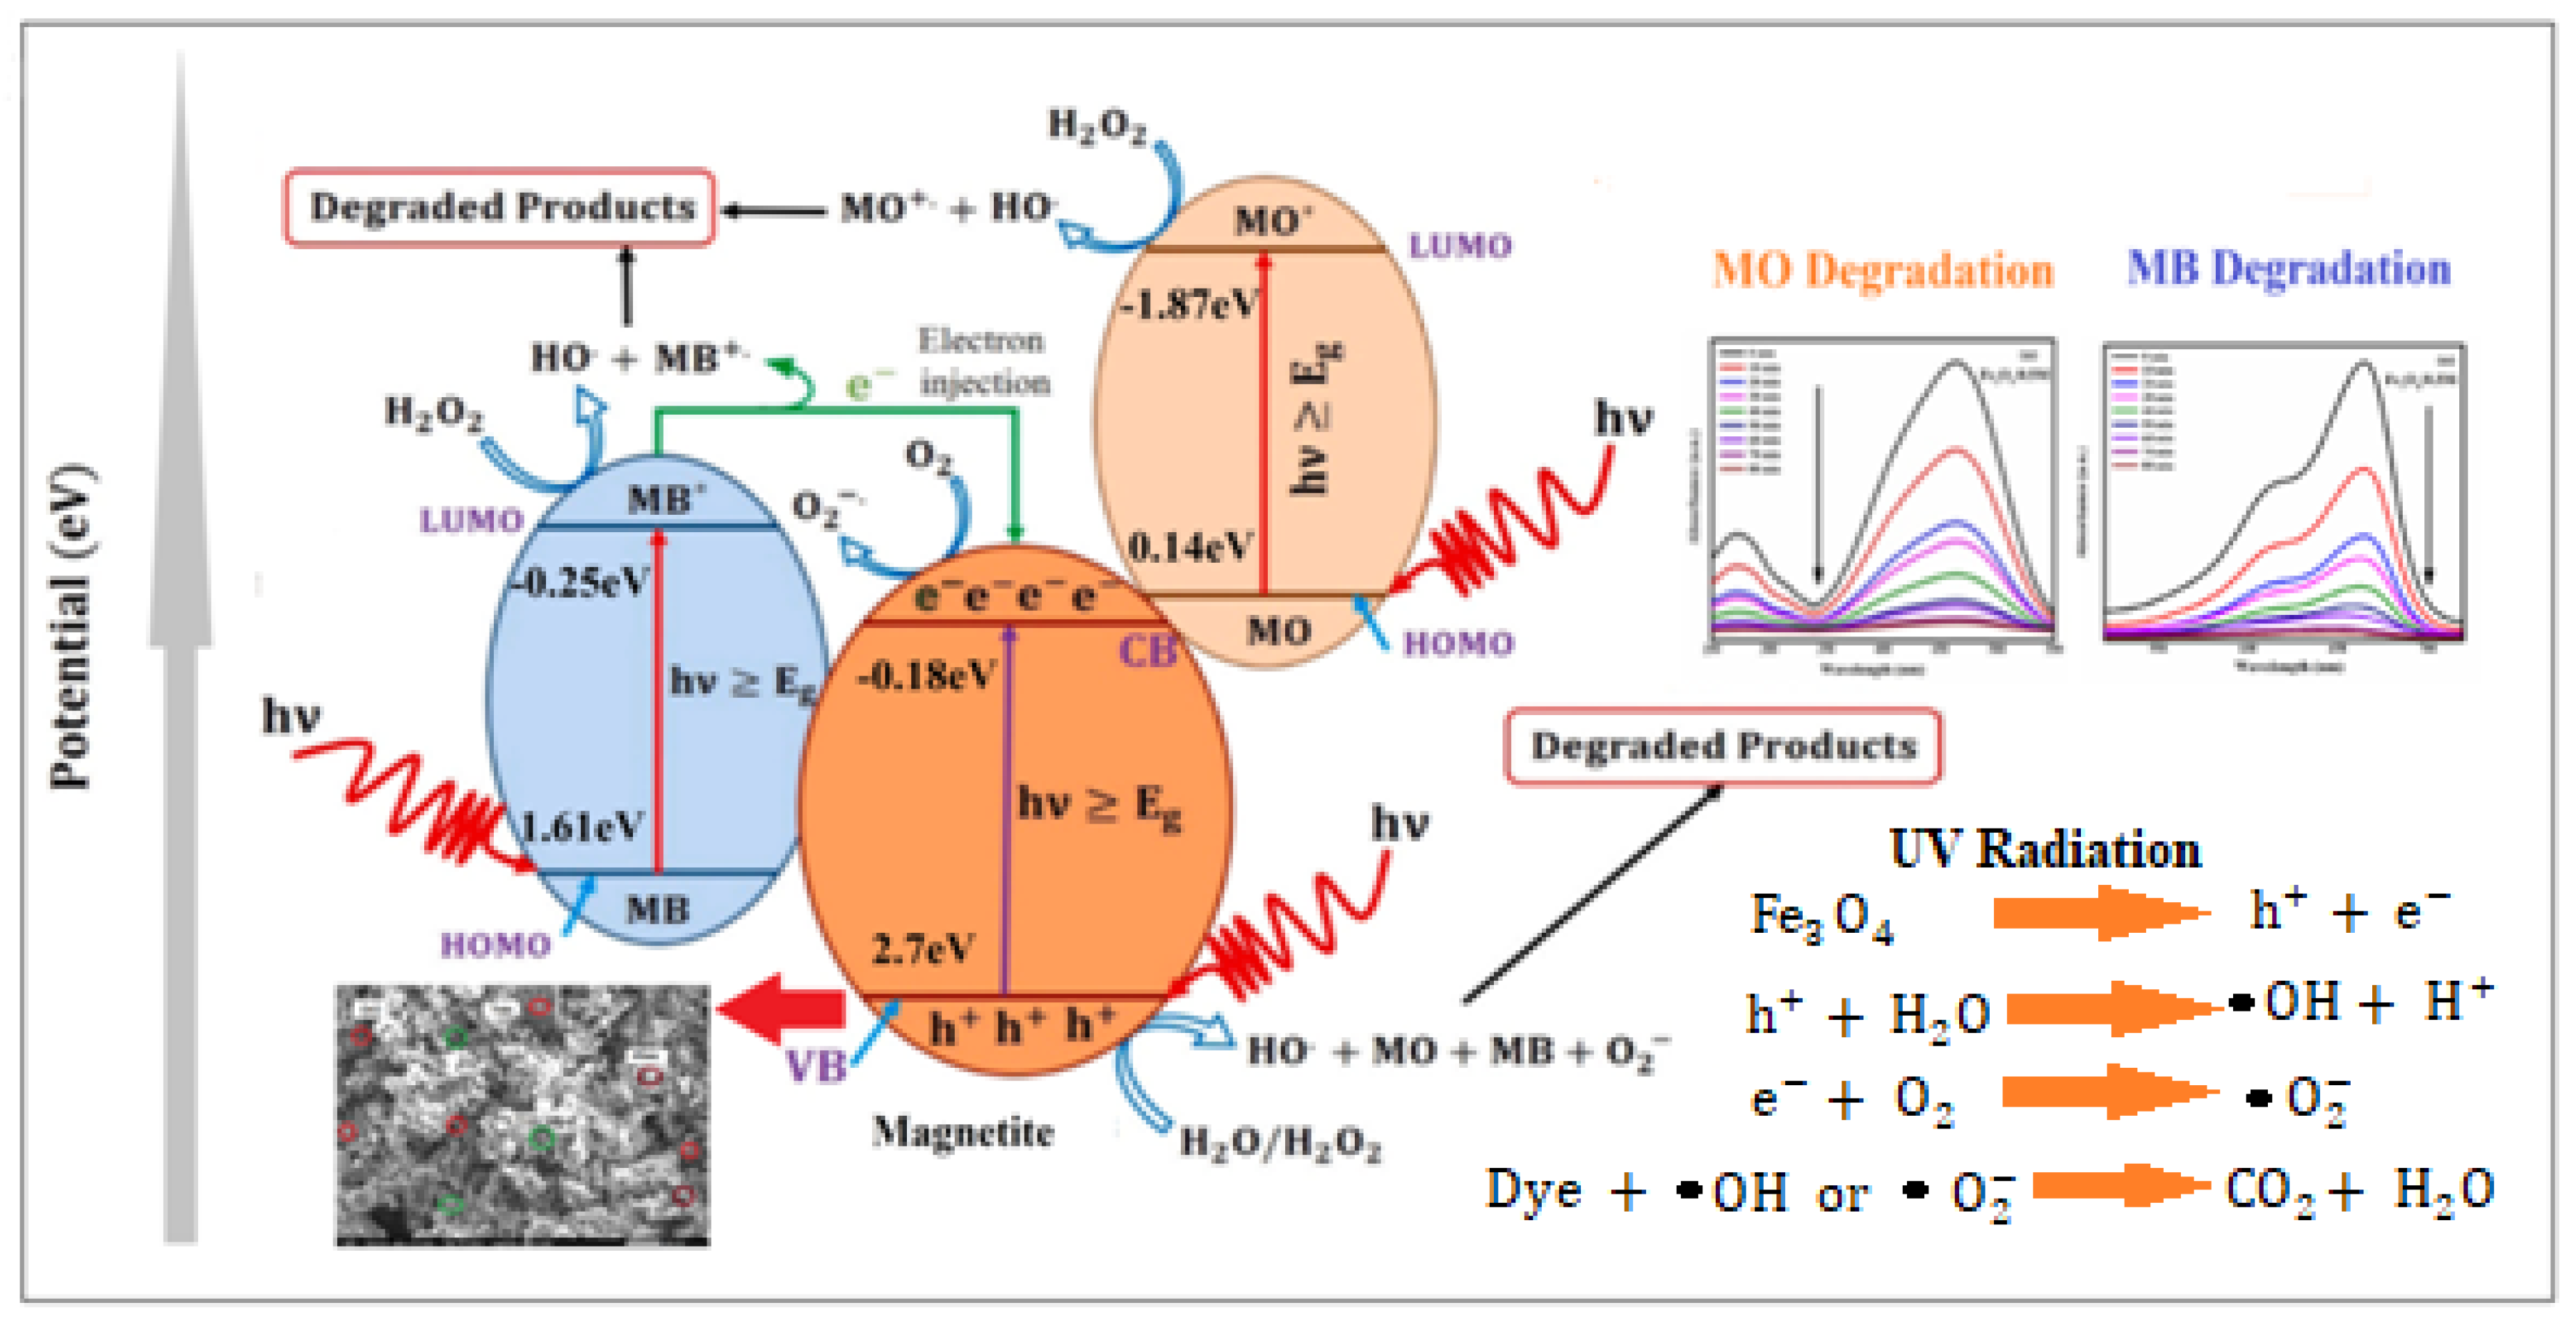
- Energy Level Alignment: The relative positions of the lowest unoccupied molecular orbital (LUMO) and the highest occupied molecular orbital (HOMO) of the dyes, in comparison to the conduction band (CB) and valence band (VB) edge potentials of the NPs, are illustrated in Figure 12. The direction of the potential gradient is indicated by the arrow, pointing from positive to negative values. The CB and VB edge potentials for methylene blue (MB) and methyl orange (MO), as outlined in Table 3, were obtained from the existing literature, while those for the nanoparticles were calculated using standard equations for CB and VB potentials. In the case of MB, electrons transfer more readily from its LUMO to the CB of the catalyst compared to MO, due to the more positive LUMO levels in MB. The CB edge potential for MB is higher than that of MO, and its VB edge potential is significantly lower than that of MO. This alignment promotes rapid redox reactions, generating reactive radicals and enhancing the decomposition rate of MB. The degradation rates for MB and MO achieved in this study are higher than those reported in the literature, as presented in Table 4 and Table 5. These findings demonstrate that NPs serve as highly effective photocatalysts, making them suitable for wastewater treatment to remove pollutants such as MB and MO.
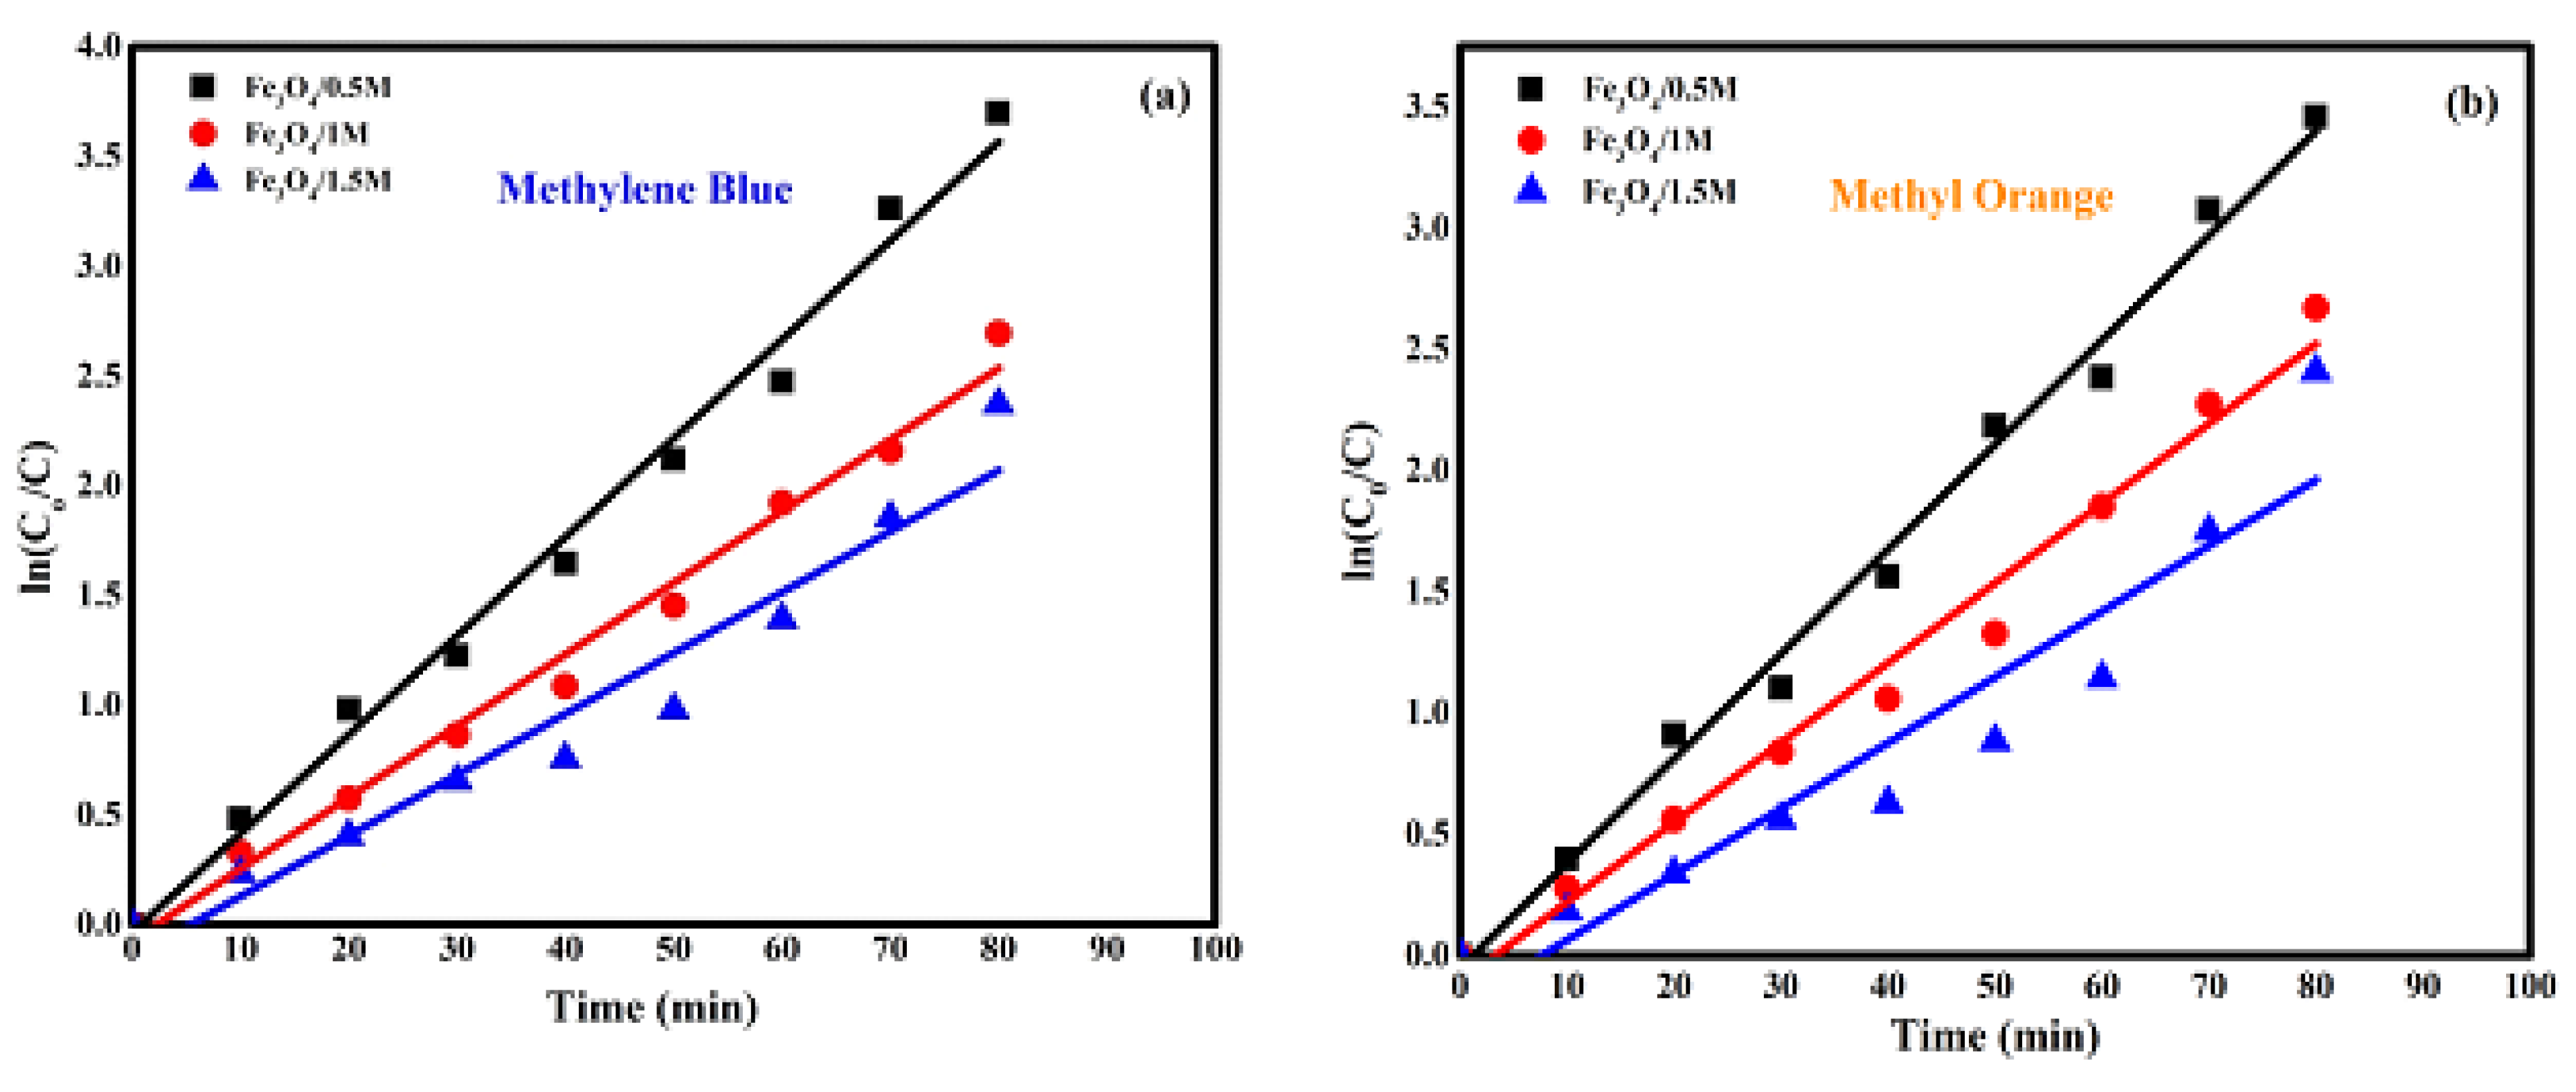
2.5.2. Kinetic Study
2.5.3. Mechanism of Dye Degradation
2.6. Electrochemical Results
2.6.1. Cyclic Voltammetric Results


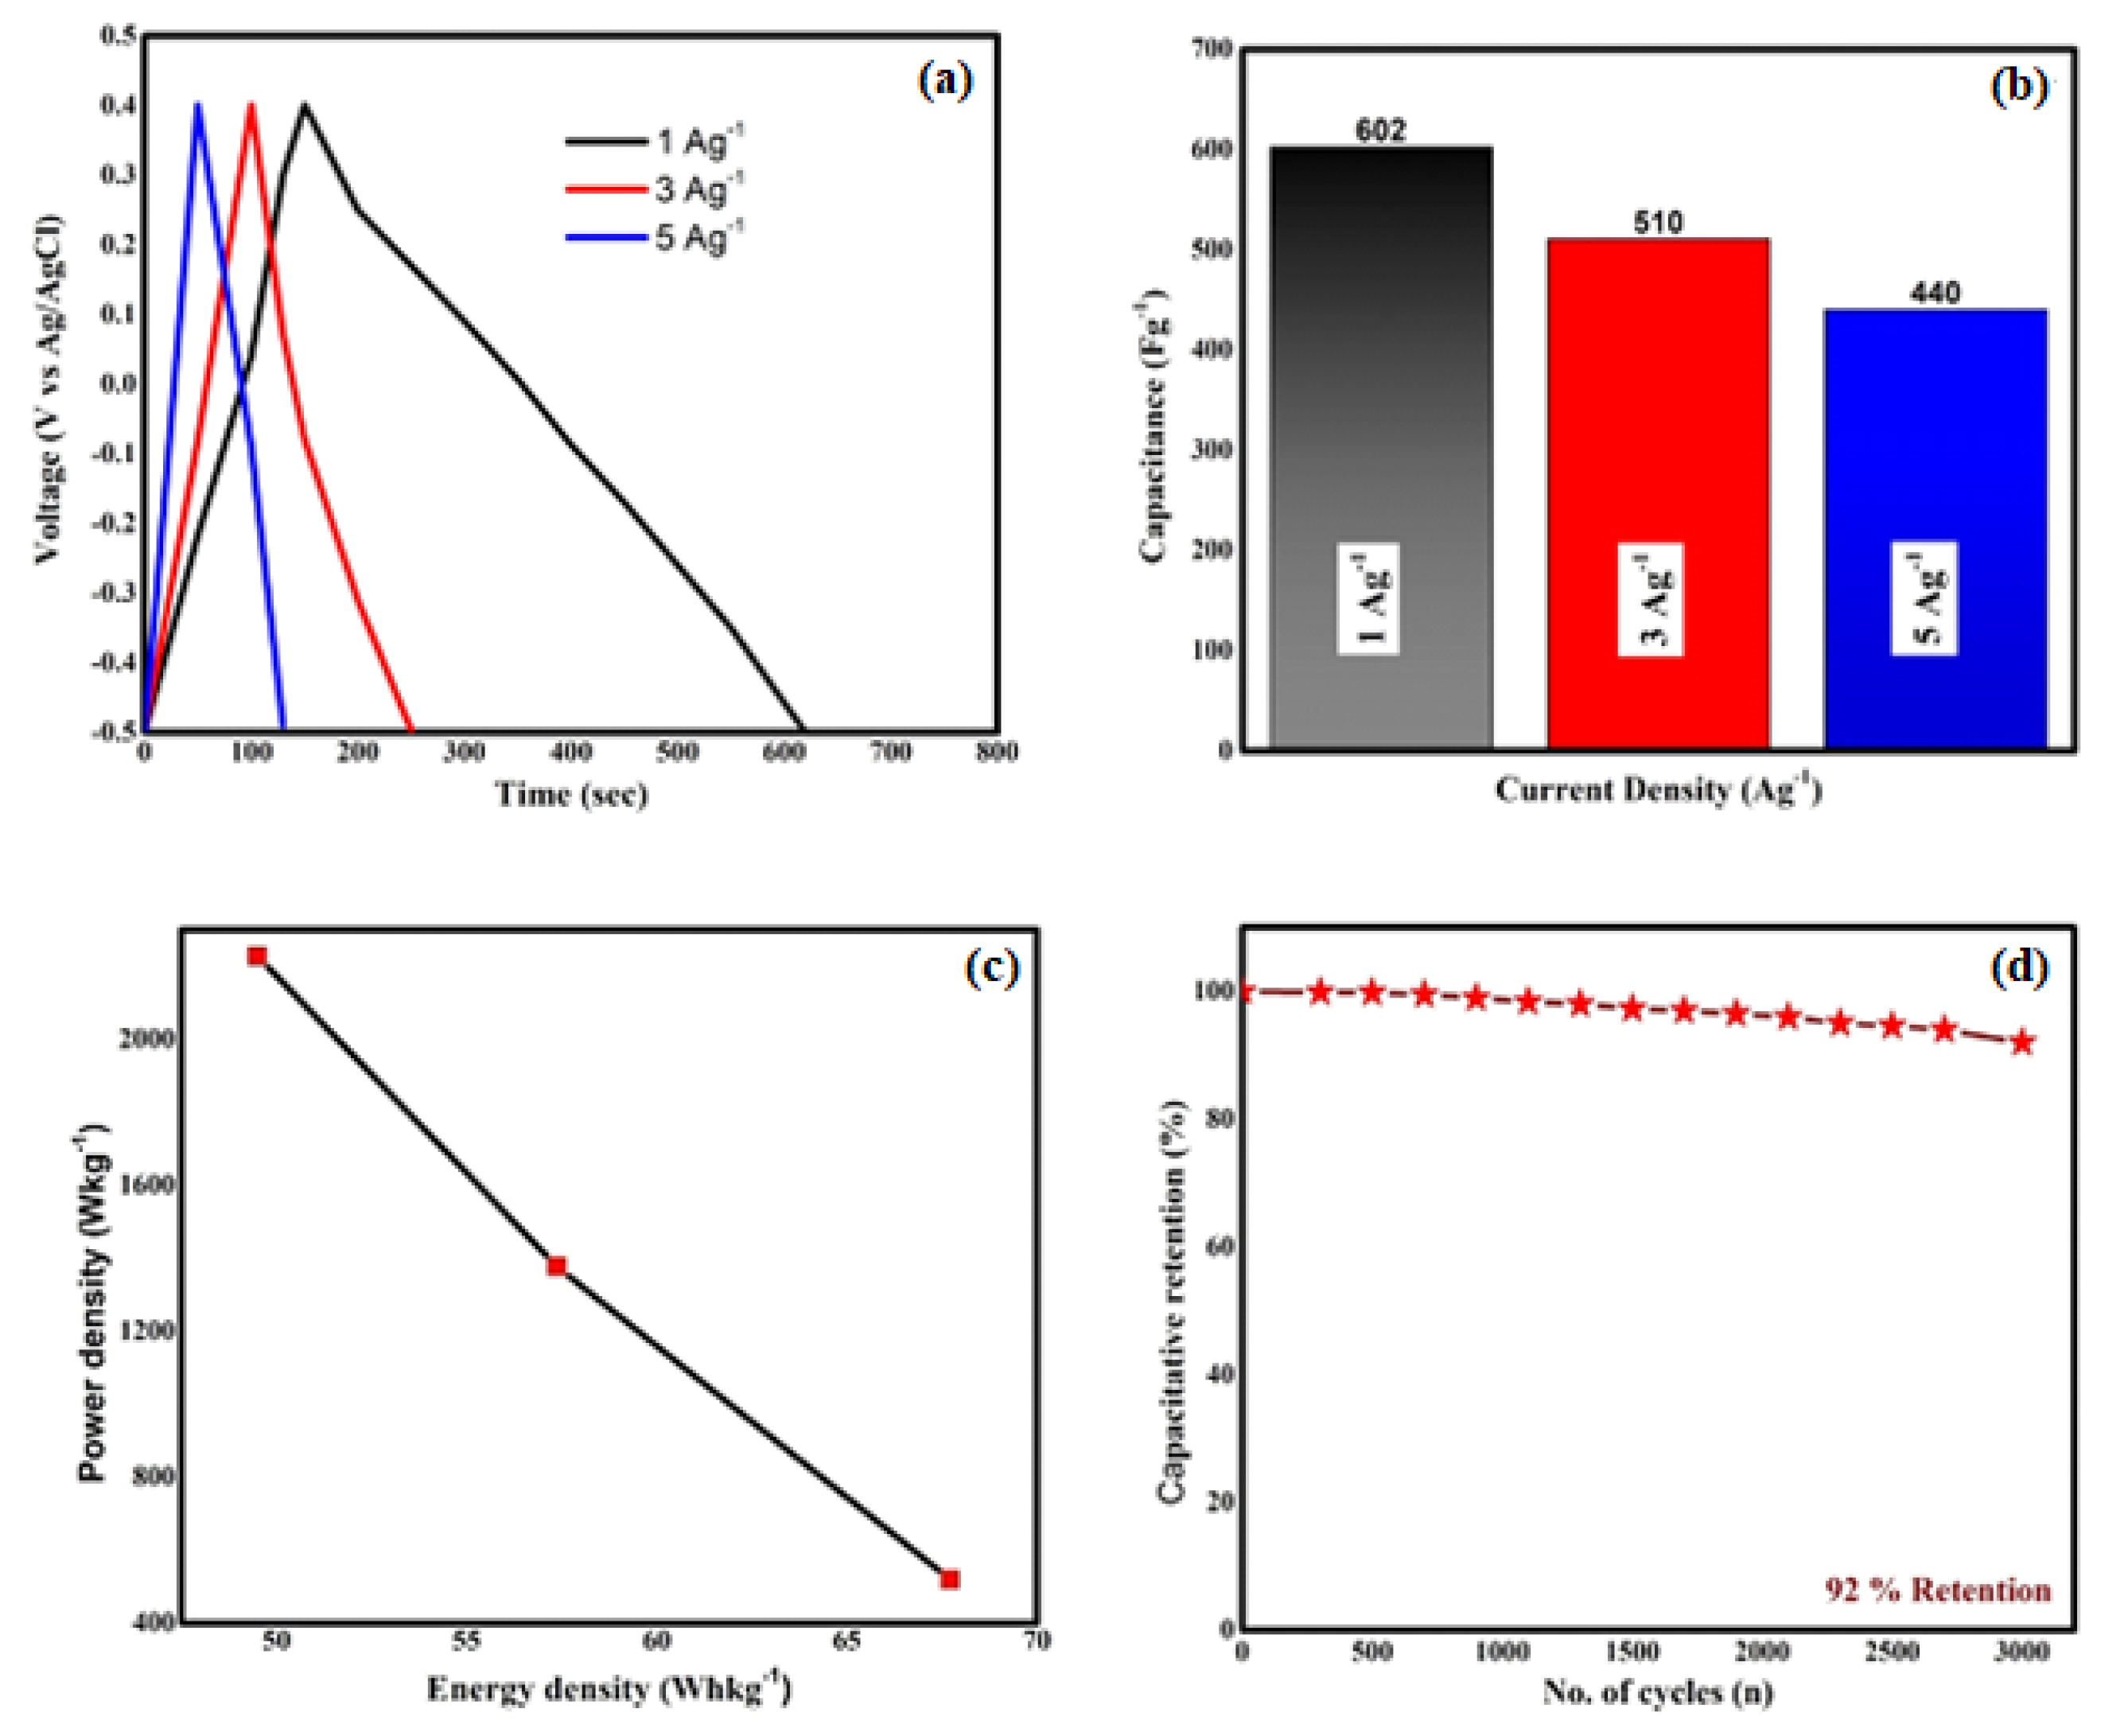
2.6.2. Galvanostatic Charge–Discharge Results
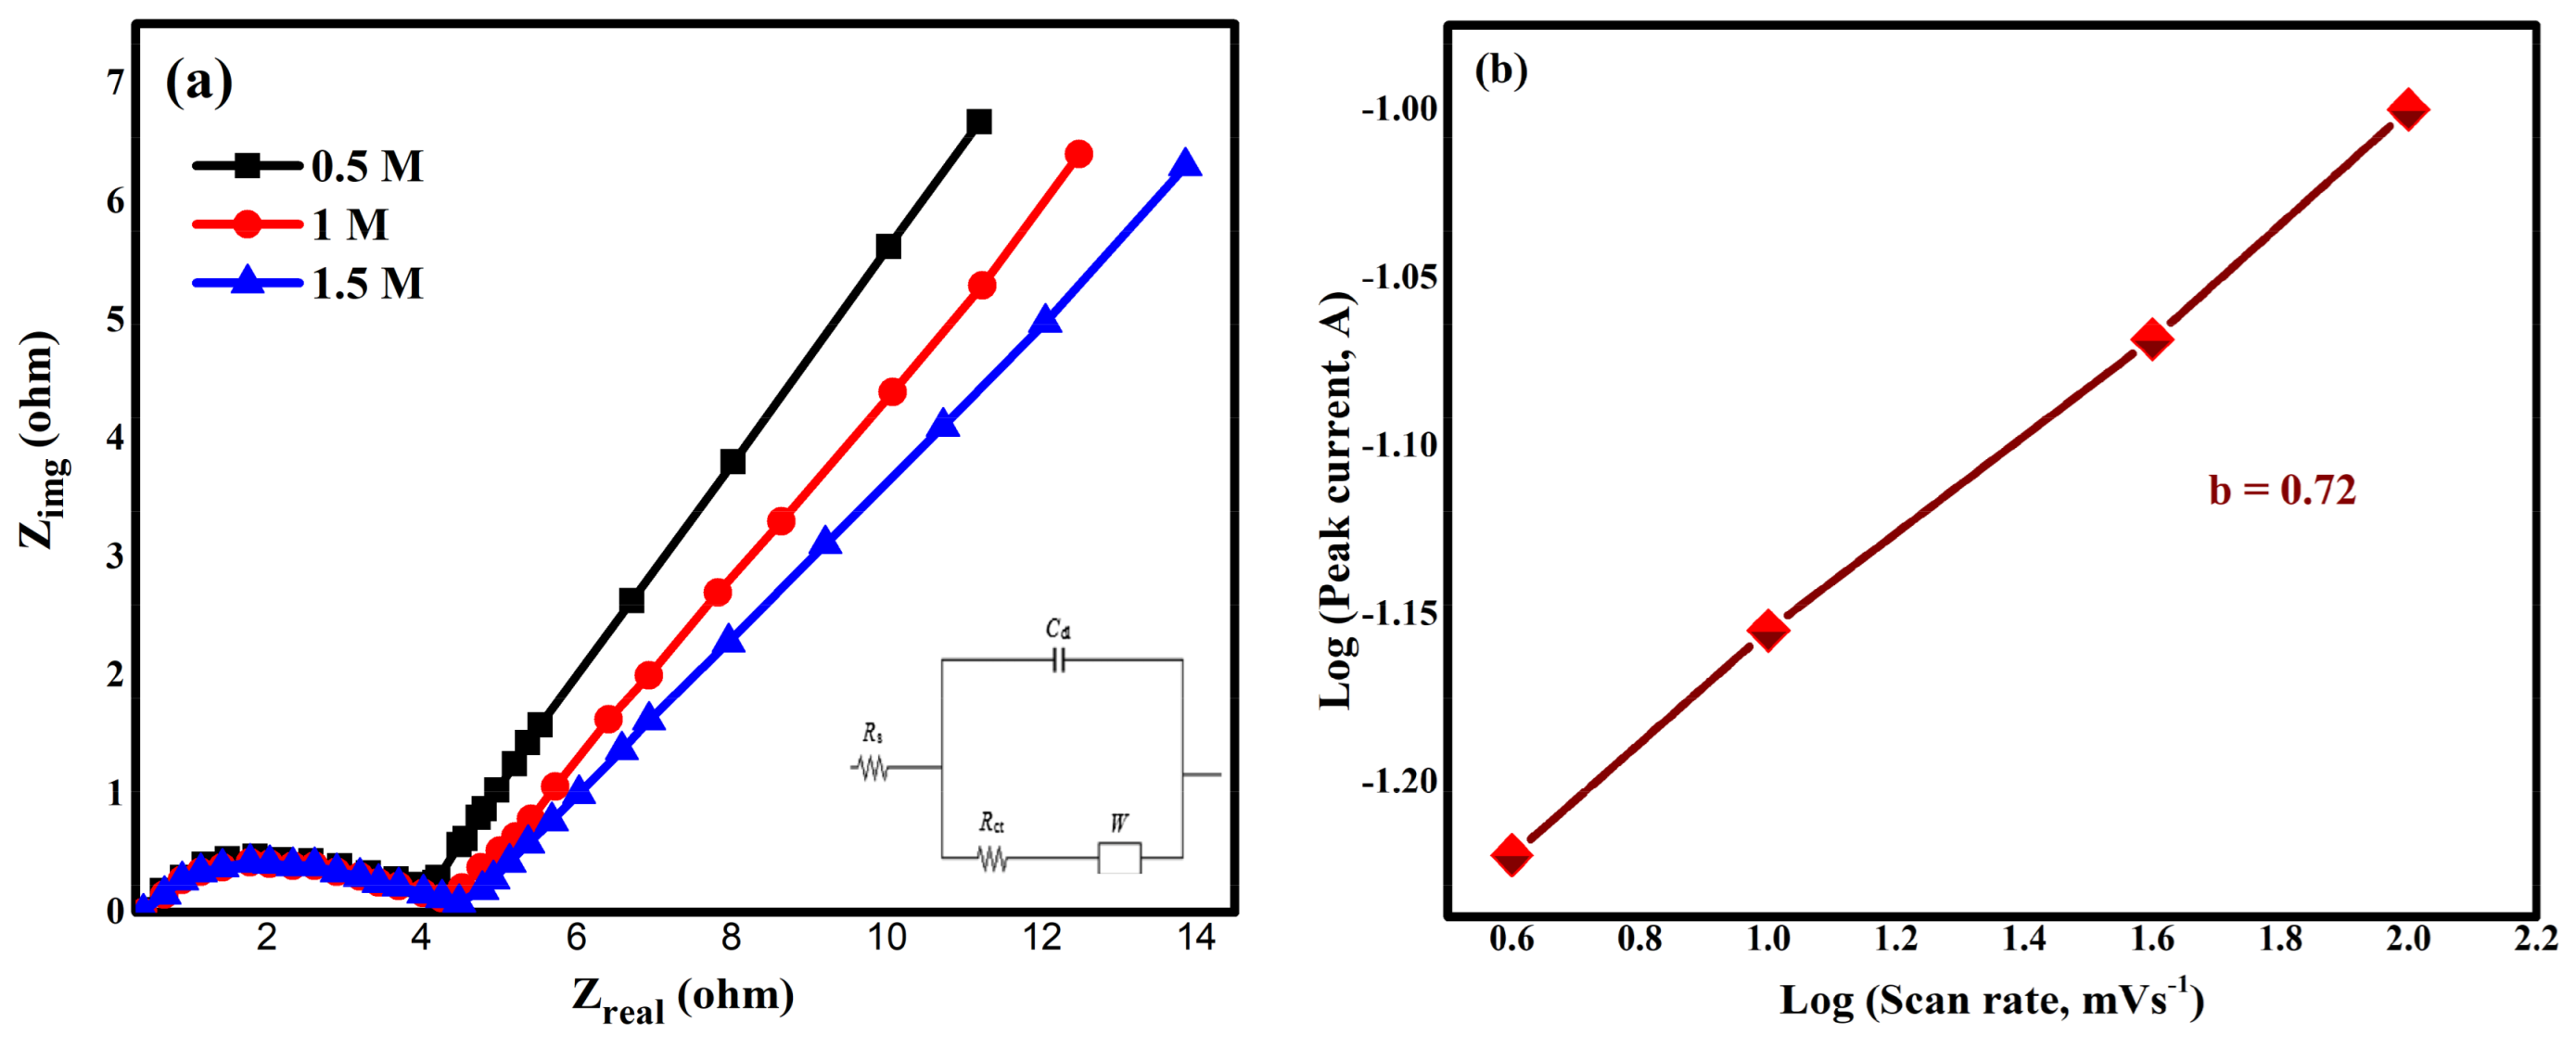
2.6.3. EIS Results
3. Materials and Methods
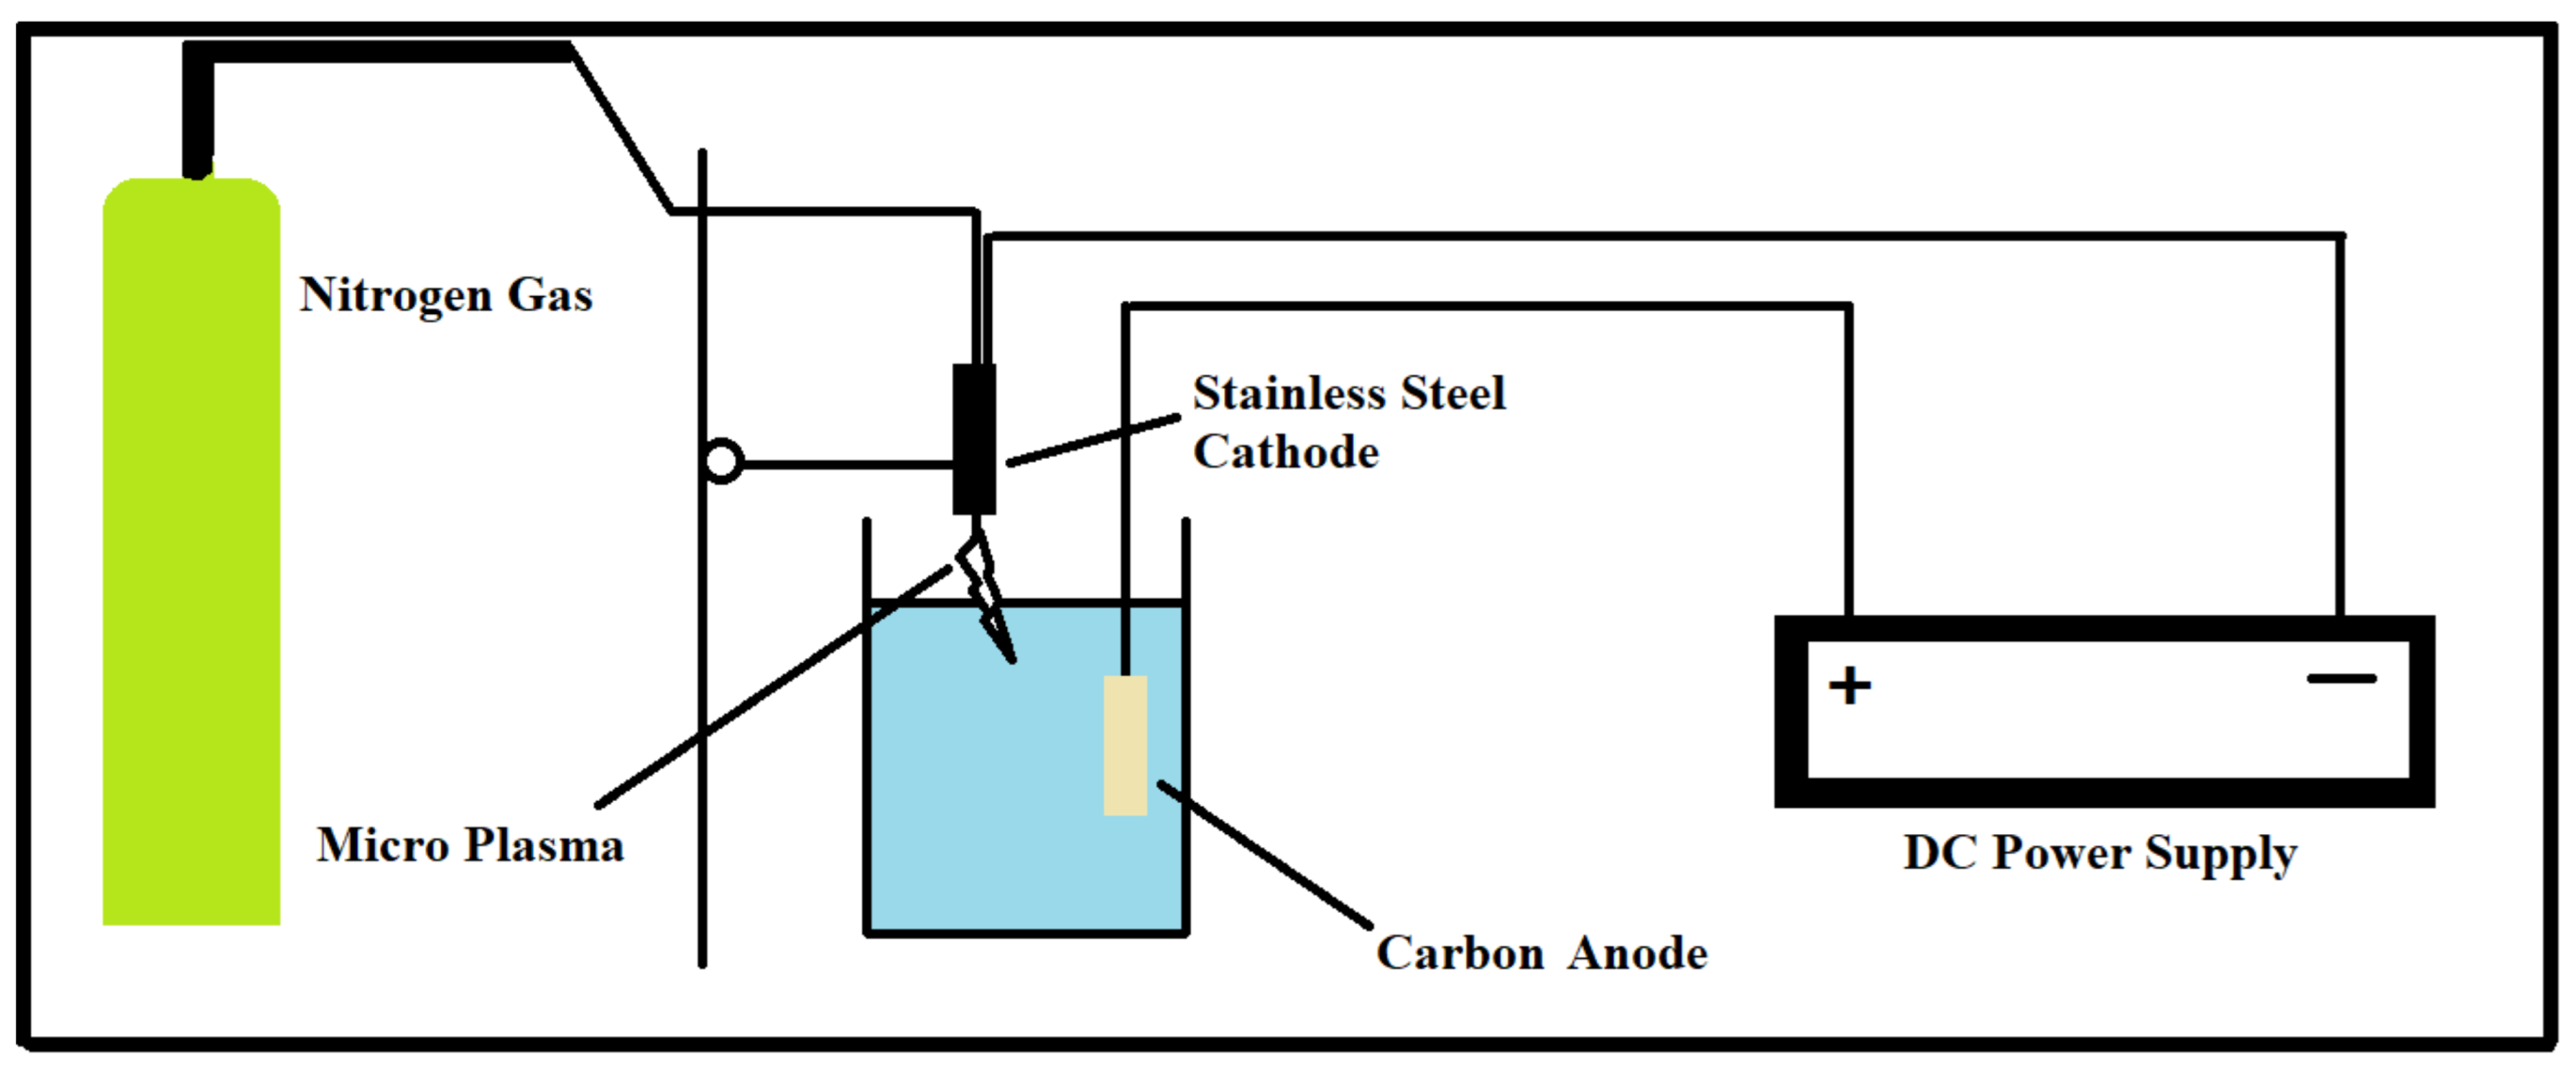
3.1. Experimental Setup
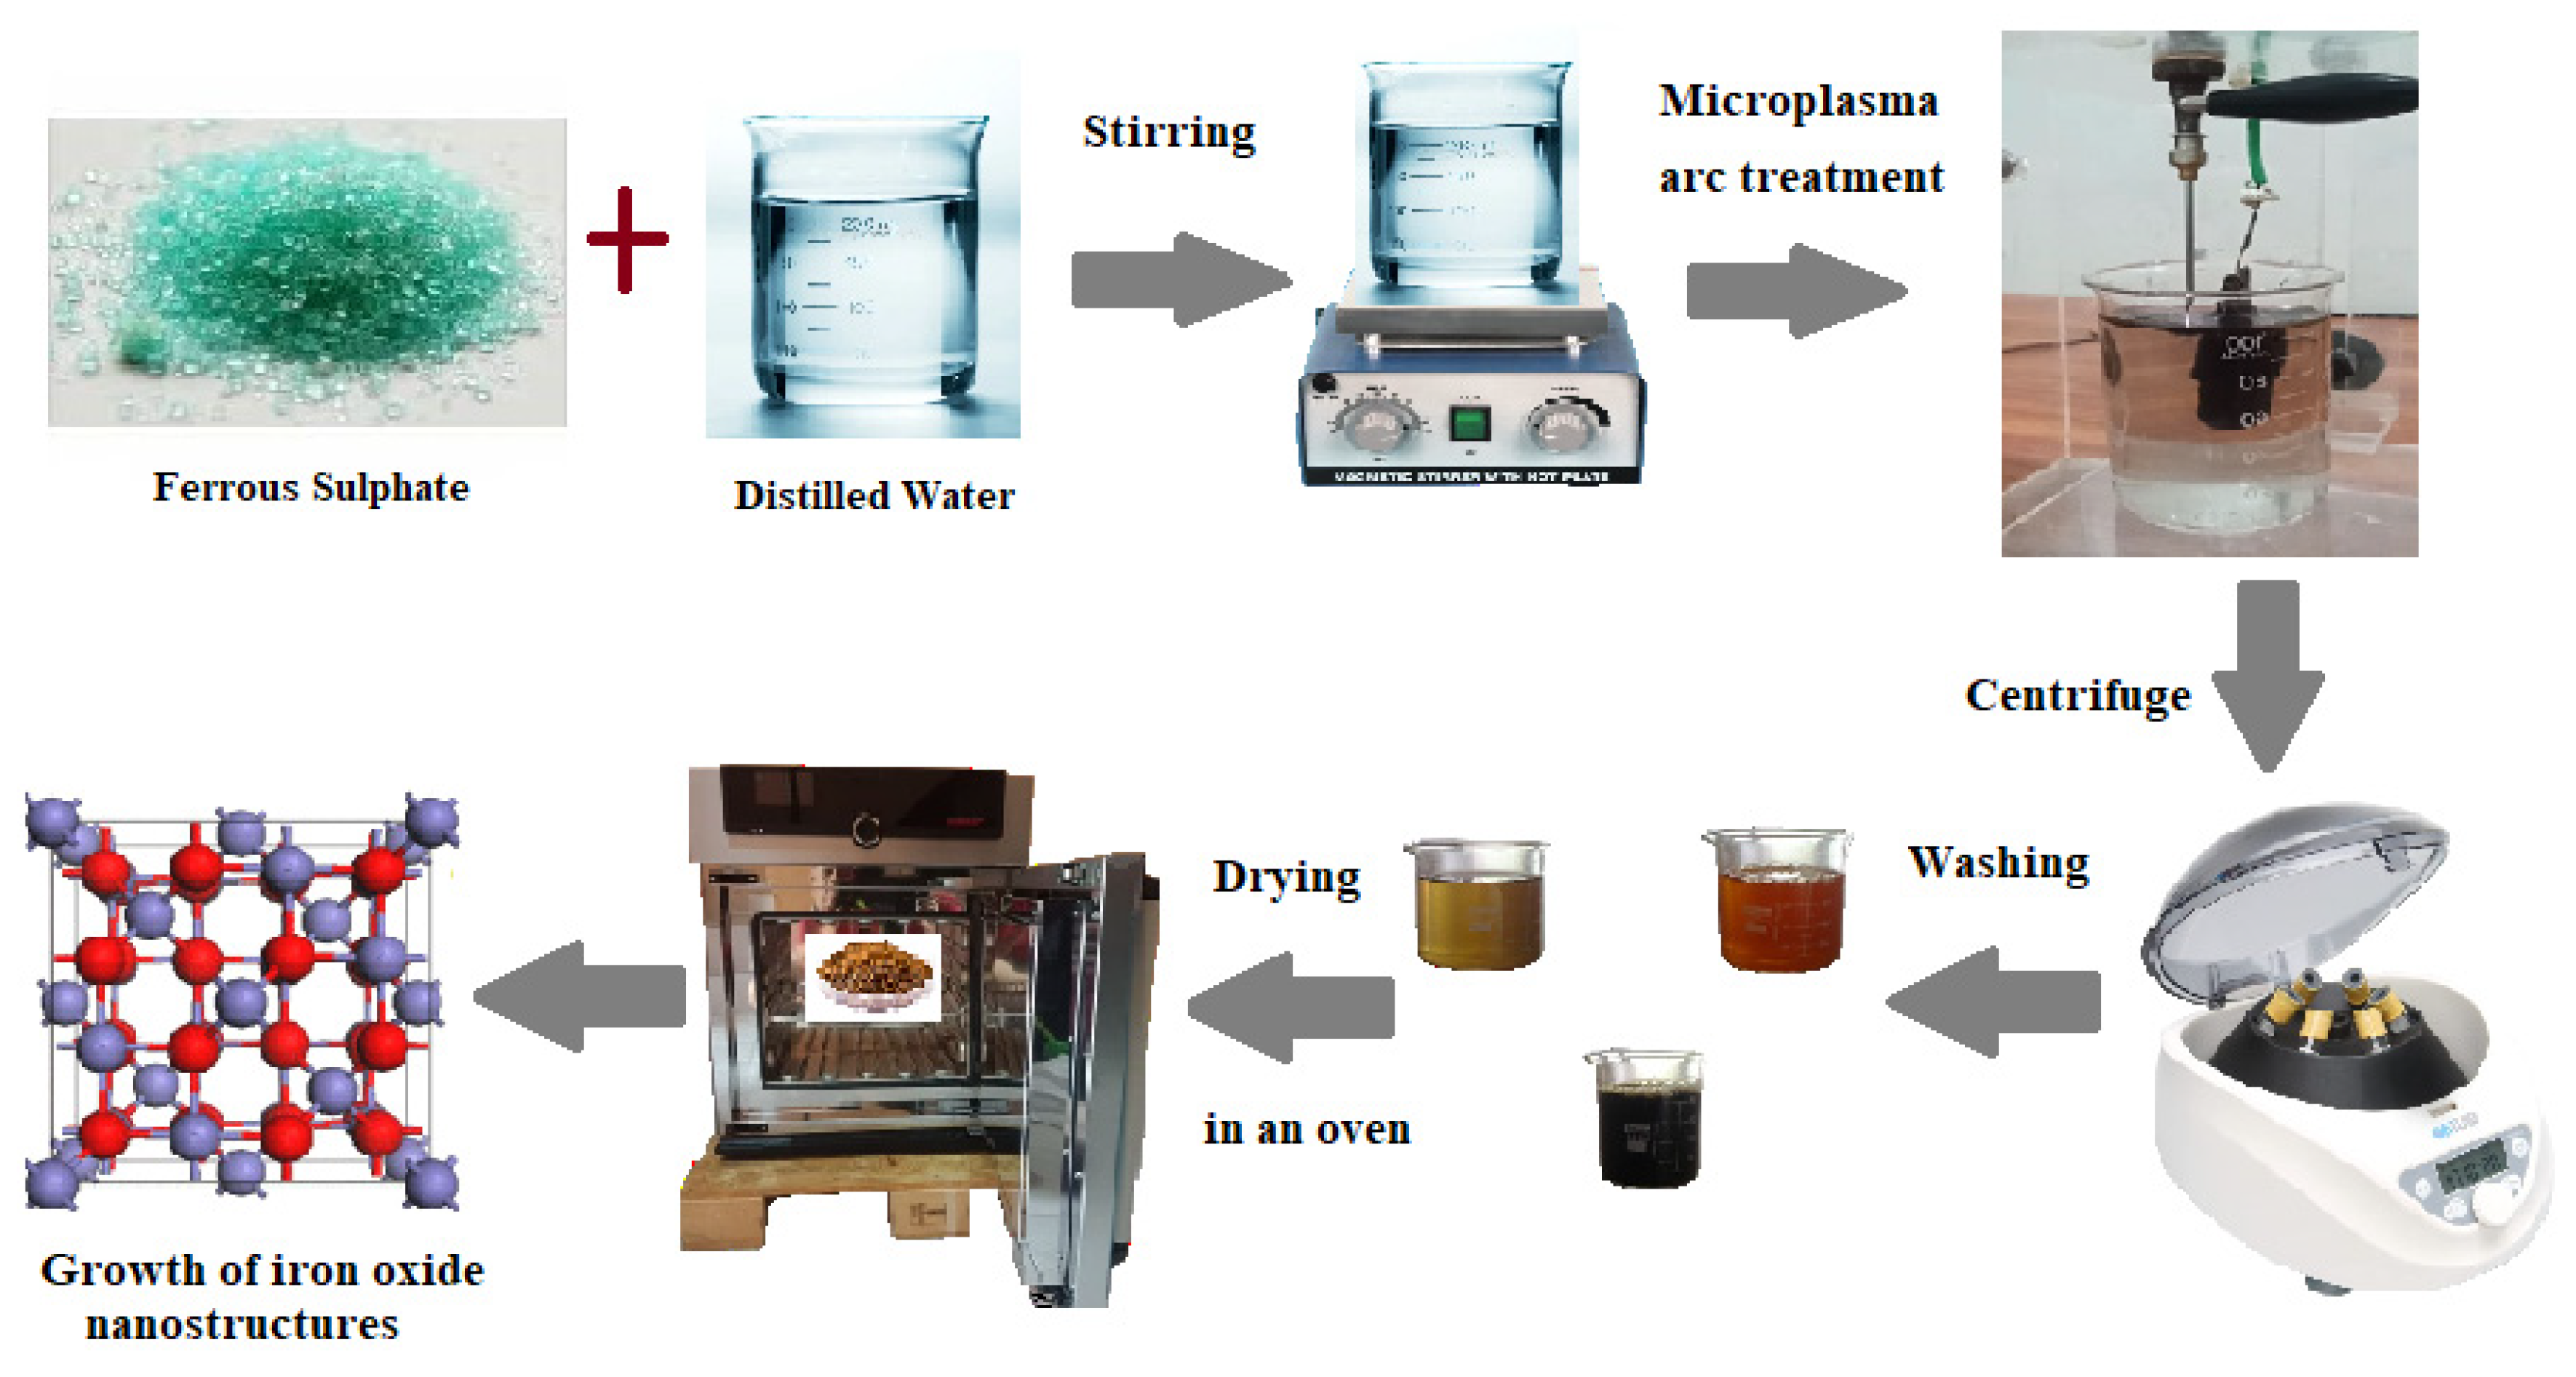
3.2. Procedure
3.3. Characterizations of Nanoparticles
3.4. Photocatalytic Activity
3.5. Electrochemical Study
4. Conclusions
Author Contributions
Funding
Data Availability Statement
Acknowledgments
Conflicts of Interest
References
- Dissanayake, K.; Kularatna-Abeywardana, D. A review of supercapacitors: Materials, technology, challenges, and renewable energy applications. J. Energy Storage 2024, 96, 112563. [Google Scholar] [CrossRef]
- Hsu, Y.-K.; Mondal, A.; Su, Y.-Z.; Sofer, Z.; Anuratha, K.S.; Lin, J.-Y. Highly hydrophilic electrodeposited NiS/Ni3S2 interlaced nanosheets with surface-enriched Ni3+ sites as binder-free flexible cathodes for high-rate hybrid supercapacitors. Appl. Surf. Sci. 2022, 579, 151923. [Google Scholar] [CrossRef]
- Al-Shetwi, A.Q. Sustainable development of renewable energy integrated power sector: Trends, environmental impacts, and recent challenges. Sci. Total Environ. 2022, 822, 153645. [Google Scholar] [CrossRef] [PubMed]
- Kebede, A.A.; Kalogiannis, T.; Van Mierlo, J.; Berecibar, M. A comprehensive review of stationary energy storage devices for large scale renewable energy sources grid integration. Renew. Sustain. Energy Rev. 2022, 159, 112213. [Google Scholar] [CrossRef]
- Kim, M.; Kim, W.J.; Kim, M.K.; Seo, J.; Song, S.; Kim, D.I.; Sim, B.; Lee, H.; Lee, M.; Ryu, G.H. Enhanced Wire-Shaped Micro-Supercapacitor Treated with a Continuous Surface Atmospheric Pressure Plasma Jet Approach. Small 2025, 21, 2409050. [Google Scholar] [CrossRef] [PubMed]
- Zhao, J.; Burke, A.F. Review on supercapacitors: Technologies and performance evaluation. J. Energy Chem. 2021, 59, 276–291. [Google Scholar] [CrossRef]
- Kavitha, E.; Meiyazhagan, S.; Yugeswaran, S.; Suresh, K. Expeditious and single step synthesis of ceria quantum dots by microplasma discharge method for supercapacitor applications. Mater. Chem. Phys. 2024, 318, 129319. [Google Scholar] [CrossRef]
- Abdel Maksoud, M.I.A.; Fahim, R.A.; Shalan, A.E.; Abd Elkodous, M.; Olojede, S.O.; Osman, A.I.; Farrell, C.; Al-Muhtaseb, A.A.H.; Awed, A.S.; Ashour, A.H.; et al. Advanced materials and technologies for supercapacitors used in energy conversion and storage: A review. Environ. Chem. Lett. 2021, 19, 375–439. [Google Scholar] [CrossRef]
- Sun, J.; Xu, C.; Chen, H. A review on the synthesis of CuCo2O4-based electrode materials and their applications in supercapacitors. J. Mater. 2021, 7, 98–126. [Google Scholar] [CrossRef]
- Jayakumar, S.; Santhosh, P.C.; Mohideen, M.M.; Radhamani, A. Compounds. A comprehensive review of metal oxides (RuO2, Co3O4, MnO2 and NiO) for supercapacitor applications and global market trends. J. Alloy. Compd. 2024, 976, 173170. [Google Scholar] [CrossRef]
- Patowary, B.B.; Brahma, D.; Mondal, A. Study of RuO2-and MnO2-based electrode materials and their performance review in conjunction with PANi for supercapacitor applications. Ionics 2024, 31, 67–115. [Google Scholar] [CrossRef]
- Liang, R.; Du, Y.; Xiao, P.; Cheng, J.; Yuan, S.; Chen, Y.; Yuan, J.; Chen, J. Transition metal oxide electrode materials for supercapacitors: A review of recent developments. Nanomaterials 2021, 11, 1248. [Google Scholar] [CrossRef] [PubMed]
- Dutta, D.; Arya, S.; Kumar, S. Industrial wastewater treatment: Current trends, bottlenecks, and best practices. Chemosphere 2021, 285, 131245. [Google Scholar] [CrossRef] [PubMed]
- Chan, S.H.S.; Yeong Wu, T.; Juan, J.C.; Teh, C.Y. Biotechnology. Recent developments of metal oxide semiconductors as photocatalysts in advanced oxidation processes (AOPs) for treatment of dye waste-water. J. Chem. Technol. Biotechnol. 2011, 86, 1130–1158. [Google Scholar] [CrossRef]
- Boruah, P.K.; Yadav, A.; Das, M.R. Magnetic mixed metal oxide nanomaterials derived from industrial waste and its photocatalytic applications in environmental remediation. J. Environ. Chem. Eng. 2020, 8, 104297. [Google Scholar] [CrossRef]
- Theerthagiri, J.; Chandrasekaran, S.; Salla, S.; Elakkiya, V.; Senthil, R.; Nithyadharseni, P.; Maiyalagan, T.; Micheal, K.; Ayeshamariam, A.; Arasu, M.V. Recent developments of metal oxide based heterostructures for photocatalytic applications towards environmental remediation. J. Solid State Chem. 2018, 267, 35–52. [Google Scholar] [CrossRef]
- Nikam, A.; Prasad, B.; Kulkarni, A. Wet chemical synthesis of metal oxide nanoparticles: A review. CrystEngComm 2018, 20, 5091–5107. [Google Scholar] [CrossRef]
- Chiang, W.H.; Mariotti, D.; Sankaran, R.M.; Eden, J.G.; Ostrikov, K. Microplasmas for advanced materials and devices. Adv. Mater. 2020, 32, 1905508. [Google Scholar] [CrossRef]
- Guo, J.; Wu, J.; Xu, L.; Yuan, X.; Tan, C.; Wang, Q.; Xiong, X. Microplasma-assisted construction of cross-linked network hierarchical structure of NiMoO4 nanorods@ NiCo-LDH nanosheets for electrochemical sensing of non-enzymatic H2O2 in food. Food Chem. 2024, 461, 140940. [Google Scholar] [CrossRef]
- Chiang, W.-H.; Richmonds, C.; Sankaran, R.M. Technology. Continuous-flow, atmospheric-pressure microplasmas: A versatile source for metal nanoparticle synthesis in the gas or liquid phase. Plasma Sources Sci. Technol. 2010, 19, 034011. [Google Scholar] [CrossRef]
- McKenna, J.; Patel, J.; Mitra, S.; Soin, N.; Švrček, V.; Maguire, P.; Mariotti, D. Synthesis and surface engineering of nanomaterials by atmospheric-pressure microplasmas. Eur. Phys. J. Appl. Phys. 2011, 56, 24020. [Google Scholar] [CrossRef]
- Lin, L.; Starostin, S.A.; Wang, Q.; Hessel, V. An atmospheric pressure microplasma process for continuous synthesis of titanium nitride nanoparticles. Chem. Eng. J. 2017, 321, 447–457. [Google Scholar] [CrossRef]
- Lin, L.; Wang, Q. Microplasma: A new generation of technology for functional nanomaterial synthesis. Plasma Chem. Plasma Process. 2015, 35, 925–962. [Google Scholar] [CrossRef]
- Abdullah, E.A.; Anber, A.A.; Edan, F.F.; Fraih, A. Synthesis of ZnO Nanoparticles by Using an Atmospheric-Pressure Plasma Jet. Open Access Libr. J. 2018, 5, 1–7. [Google Scholar] [CrossRef]
- Lin, L.; Starostin, S.A.; Hessel, V.; Wang, Q. Synthesis of iron oxide nanoparticles in microplasma under atmospheric pressure. Chem. Eng. Sci. 2017, 168, 360–371. [Google Scholar] [CrossRef]
- Khalid, A.; Naeem, M.; Atrooz, O.; Mozafari, M.; Anari, F.; Taghavi, E.; Rashid, U.; Aziz, B. State of the Art Synthesis of Ag-ZnO-Based Nanomaterials by Novel Atmospheric Pressure Microplasma Techniques. Surfaces 2024, 7, 680–697. [Google Scholar] [CrossRef]
- Balasubramanian, C.; Joseph, B.; Gupta, P.; Saini, N.L.; Mukherjee, S.; Di Gioacchino, D.; Marcelli, A. X-ray absorption spectroscopy characterization of iron-oxide nanoparticles synthesized by high temperature plasma processing. J. Electron Spectrosc. Relat. Phenom. 2014, 196, 125–129. [Google Scholar] [CrossRef]
- Zainuri, M. Hematite from natural iron stones as microwave absorbing material on X-band frequency ranges. In The IOP Conference Series: Materials Science and Engineering, Proceedings of the 3rd International Conference on Functional Materials Science 2016, Sanur-Bali, Indonesia, 19–20 October 2016; IOP Publishing Ltd.: Bristol, UK, 2017; p. 012008. [Google Scholar]
- Monshi, A.; Foroughi, M.R.; Monshi, M.R. Modified Scherrer equation to estimate more accurately nano-crystallite size using XRD. World J. Nano Sci. Eng. 2012, 2, 154–160. [Google Scholar] [CrossRef]
- Ayers, J. The measurement of threading dislocation densities in semiconductor crystals by X-ray diffraction. J. Cryst. Growth 1994, 135, 71–77. [Google Scholar] [CrossRef]
- Nakashima, K.; Suzuki, M.; Futamura, Y.; Tsuchiyama, T.; Takaki, S. Limit of dislocation density and dislocation strengthening in iron. In Materials Science Forum; Trans Tech Publications Ltd.: Stäfa, Switzerland, 2006; pp. 627–632. [Google Scholar]
- Dudchenko, N.; Pawar, S.; Perelshtein, I.; Fixler, D. Magnetite nanoparticles: Synthesis and applications in optics and nanophotonics. Materials 2022, 15, 2601. [Google Scholar] [CrossRef]
- Supattarasakda, K.; Petcharoen, K.; Permpool, T.; Sirivat, A.; Lerdwijitjarud, W. Control of hematite nanoparticle size and shape by the chemical precipitation method. Powder Technol. 2013, 249, 353–359. [Google Scholar] [CrossRef]
- Tajabadi, M.; Khosroshahi, M. Applications. Effect of alkaline media concentration and modification of temperature on magnetite synthesis method using FeSO4/NH4OH. Int. J. Chem. Eng. Appl. 2012, 3, 206. [Google Scholar]
- Huang, X.; Zhong, X.; Lu, Y.; Li, Y.; Rider, A.; Furman, S.; Ostrikov, K. Plasmonic Ag nanoparticles via environment-benign atmospheric microplasma electrochemistry. Nanotechnology 2013, 24, 095604. [Google Scholar] [CrossRef]
- Endres, S.C.; Ciacchi, L.C.; Mädler, L. A review of contact force models between nanoparticles in agglomerates, aggregates, and films. J. Aerosol Sci. 2021, 153, 105719. [Google Scholar] [CrossRef]
- Saqib, S.; Munis, M.F.H.; Zaman, W.; Ullah, F.; Shah, S.N.; Ayaz, A.; Farooq, M.; Bahadur, S. technique. Synthesis, characterization and use of iron oxide nano particles for antibacterial activity. Microsc. Res. Tech. 2019, 82, 415–420. [Google Scholar] [CrossRef]
- Bryszewska, M.A. Comparison study of iron bioaccessibility from dietary supplements and microencapsulated preparations. Nutrients 2019, 11, 273. [Google Scholar] [CrossRef] [PubMed]
- Nalbandian, L.; Patrikiadou, E.; Zaspalis, V.; Patrikidou, A.; Hatzidaki, E.; N Papandreou, C. Magnetic nanoparticles in medical diagnostic applications: Synthesis, characterization and proteins conjugation. Curr. Nanosci. 2016, 12, 455–468. [Google Scholar] [CrossRef]
- Farahmandjou, M.; Soflaee, F. Synthesis and characterization of α-Fe2O3 nanoparticles by simple co-precipitation method. Phys. Chem. Res. 2015, 3, 191–196. [Google Scholar]
- Mazumdar, H.; Haloi, N. A study on biosynthesis of iron nanoparticles by Pleurotus sp. J. Microbiol. Biotechnol. Res. 2011, 1, 39–49. [Google Scholar]
- Mishra, D.; Arora, R.; Lahiri, S.; Amritphale, S.S.; Chandra, N. Synthesis and characterization of iron oxide nanoparticles by solvothermal method. Prot. Met. Phys. Chem. Surf. 2014, 50, 628–631. [Google Scholar] [CrossRef]
- Gordon, D. Mie scattering by optically active particles. Biochemistry 1972, 11, 413–420. [Google Scholar] [CrossRef] [PubMed]
- Dolgonos, A.; Mason, T.O.; Poeppelmeier, K.R. Direct optical band gap measurement in polycrystalline semiconductors: A critical look at the Tauc method. J. Solid State Chem. 2016, 240, 43–48. [Google Scholar] [CrossRef]
- Abdullah, B.J. Size effect of band gap in semiconductor nanocrystals and nanostructures from density functional theory within HSE06. Mater. Sci. Semicond. Process. 2022, 137, 106214. [Google Scholar] [CrossRef]
- Arshad, M.; Ansari, M.M.; Ahmed, A.S.; Tripathi, P.; Ashraf, S.; Naqvi, A.; Azam, A. Band gap engineering and enhanced photoluminescence of Mg doped ZnO nanoparticles synthesized by wet chemical route. J. Lumin. 2015, 161, 275–280. [Google Scholar] [CrossRef]
- Strehlow, W.; Cook, E.L. Compilation of energy band gaps in elemental and binary compound semiconductors and insulators. J. Phys. Chem. Ref. Data 1973, 2, 163–200. [Google Scholar] [CrossRef]
- Boubaker, K. A physical explanation to the controversial Urbach tailing universality. Eur. Phys. J. Plus 2011, 126, 1–4. [Google Scholar] [CrossRef]
- El-Diasty, F.; El-Sayed, H.; El-Hosiny, F.; Ismail, M. Complex susceptibility analysis of magneto-fluids: Optical band gap and surface studies on the nanomagnetite-based particles. Curr. Opin. Solid State Mater. Sci. 2009, 13, 28–34. [Google Scholar] [CrossRef]
- Hardesty, J.H.; Attili, B. Spectrophotometry and the Beer-Lambert Law: An important analytical technique in chemistry. Collin Coll. Dep. Chem. 2010, 1–6. [Google Scholar]
- Indrayana, I.P.T.; Tuny, M.T. Particles size and lattice strain effect on the optical constants of Fe3O4 nanoparticles. Indones. Phys. Rev. 2021, 4, 23–42. [Google Scholar] [CrossRef]
- Gherbi, R.; Bessekhouad, Y.; Trari, M. Compounds. Structure, optical and transport properties of Mg-doped ZnMn2O4. J. Alloy. Compd. 2016, 655, 188–197. [Google Scholar] [CrossRef]
- He, C.; Hu, Y.; Yin, L.; Tang, C.; Yin, C. Effects of particle size and surface charge on cellular uptake and biodistribution of polymeric nanoparticles. Biomaterials 2010, 31, 3657–3666. [Google Scholar] [CrossRef] [PubMed]
- Yuan, D.; Liu, G.; Qi, F.; Wang, J.; Kou, Y.; Cui, Y.; Bai, M.; Li, X. Kinetic study on degradation of micro-organics by different UV-based advanced oxidation processes in EfOM matrix. Environ. Sci. Pollut. Res. 2022, 29, 45314–45327. [Google Scholar] [CrossRef] [PubMed]
- Weldegebrieal, G.K.; Sibhatu, A.K. Photocatalytic activity of biosynthesized α-Fe2O3 nanoparticles for the degradation of methylene blue and methyl orange dyes. Optik 2021, 241, 167226. [Google Scholar] [CrossRef]
- Nadimi, M.; Saravani, A.Z.; Aroon, M.; Pirbazari, A.E. Photodegradation of methylene blue by a ternary magnetic TiO2/Fe3O4/graphene oxide nanocomposite under visible light. Mater. Chem. Phys. 2019, 225, 464–474. [Google Scholar] [CrossRef]
- Rehman, A.; Daud, A.; Warsi, M.F.; Shakir, I.; Agboola, P.O.; Sarwar, M.I.; Zulfiqar, S. Nanostructured maghemite and magnetite and their nanocomposites with graphene oxide for photocatalytic degradation of methylene blue. Mater. Chem. Phys. 2020, 256, 123752. [Google Scholar] [CrossRef]
- Shenoy, M.R.; Ayyasamy, S.; Reddy, M.V.V.; Kadarkarai, G.; Suryakanth, J.; Tamilarasan, S.; Thangavelu, S.; Jeyaramane, A.C. The effect of morphology-dependent surface charges of iron oxide on the visible light photocatalytic degradation of methylene blue dye. J. Mater. Sci. Mater. Electron. 2020, 31, 17703–17717. [Google Scholar] [CrossRef]
- Vu, X.H.; Phuoc, L.H.; Dien, N.D.; Pham, T.T.H.; Thanh, L.D. Photocatalytic degradation of methylene blue (MB) over α-Fe2O3 nanospindles prepared by a hydrothermal route. J. Electron. Mater. 2019, 48, 2978–2985. [Google Scholar] [CrossRef]
- Afkari, M.; Masoudpanah, S.; Hasheminiasari, M.; Alamolhoda, S. Effects of iron oxide contents on photocatalytic performance of nanocomposites based on g-C3N4. Sci. Rep. 2023, 13, 6203. [Google Scholar] [CrossRef]
- Olusegun, S.J.; Larrea, G.; Osial, M.; Jackowska, K.; Krysinski, P. Photocatalytic degradation of antibiotics by superparamagnetic iron oxide nanoparticles. Tetracycline case. Catalysts 2021, 11, 1243. [Google Scholar] [CrossRef]
- Razip, N.I.M.; Lee, K.M.; Lai, C.W.; Ong, B.H. Recoverability of Fe3O4/TiO2 nanocatalyst in methyl orange degradation. Mater. Res. Express 2019, 6, 075517. [Google Scholar] [CrossRef]
- Asenjo, N.G.; Santamaría, R.; Blanco, C.; Granda, M.; Álvarez, P.; Menéndez, R. Correct use of the Langmuir–Hinshelwood equation for proving the absence of a synergy effect in the photocatalytic degradation of phenol on a suspended mixture of titania and activated carbon. Carbon 2013, 55, 62–69. [Google Scholar] [CrossRef]
- Nabi, G. Cost effective Cr-doped Co(OH)2 nano-flower assemblies exhibiting excellent electrochemical performance for supercapacitors. J. Energy Storage 2024, 79, 110181. [Google Scholar]
- Karpagavinayagam, P.; Vedhi, C. Green synthesis of iron oxide nanoparticles using Avicennia marina flower extract. Vacuum 2019, 160, 286–292. [Google Scholar] [CrossRef]
- Thakur, A.; Lokhande, B.J. Dip time-dependent SILAR synthesis and electrochemical study of highly flexible PPy-Cu(OH)2 hybrid electrodes for supercapacitors. J. Solid State Electrochem. 2017, 21, 2577–2584. [Google Scholar] [CrossRef]
- Nabi, G.; Ali, W.; Majid, A.; Alharbi, T.; Saeed, S.; Albedah, M. Controlled growth of Bi-Functional La doped CeO2 nanorods for photocatalytic H2 production and supercapacitor applications. Int. J. Hydrogen Energy 2022, 47, 15480–15490. [Google Scholar] [CrossRef]
- Nallappan, M.; Gopalan, M. Fabrication of CeO2/PANI composites for high energy density supercapacitors. Mater. Res. Bull. 2018, 106, 357–364. [Google Scholar] [CrossRef]
- Tipsawat, P.; Wongpratat, U.; Phumying, S.; Chanlek, N.; Chokprasombat, K.; Maensiri, S. Magnetite (Fe3O4) nanoparticles: Synthesis, characterization and electrochemical properties. Appl. Surf. Sci. 2018, 446, 287–292. [Google Scholar] [CrossRef]
- Thakur, A.; Lokhande, B. Electrolytic anion affected charge storage mechanisms of Fe3O4 flexible thin film electrode in KCl and KOH: A comparative study by cyclic voltammetry and galvanostatic charge–discharge. J. Mater. Sci. Mater. Electron. 2017, 28, 11755–11761. [Google Scholar] [CrossRef]
- O’Neill, L.; Johnston, C.; Grant, P.S. Enhancing the supercapacitor behaviour of novel Fe3O4/FeOOH nanowire hybrid electrodes in aqueous electrolytes. J. Power Sources 2015, 274, 907–915. [Google Scholar] [CrossRef]
- Pang, S.C.; Khoh, W.H.; Chin, S.F. Nanoparticulate magnetite thin films as electrode materials for the fabrication of electrochemical capacitors. J. Mater. Sci. 2010, 45, 5598–5604. [Google Scholar] [CrossRef]
- Aghazadeh, M.; Karimzadeh, I.; Ganjali, M.R. Electrochemical evaluation of the performance of cathodically grown ultra-fine magnetite nanoparticles as electrode material for supercapacitor applications. J. Mater. Sci. Mater. Electron. 2017, 28, 13532–13539. [Google Scholar] [CrossRef]
- Sarno, M.; Ponticorvo, E.; Cirillo, C. High surface area monodispersed Fe3O4 nanoparticles alone and on physical exfoliated graphite for improved supercapacitors. J. Phys. Chem. Solids 2016, 99, 138–147. [Google Scholar] [CrossRef]
- Nguyen, T.; Montemor, M.F. Metal oxide and hydroxide–based aqueous supercapacitors: From charge storage mechanisms and functional electrode engineering to need-tailored devices. Adv. Sci. 2019, 6, 1801797. [Google Scholar] [CrossRef] [PubMed]
- Wei, L.; Deng, W.; Li, S.; Wu, Z.; Cai, J.; Luo, J. Sandwich-like chitosan porous carbon Spheres/MXene composite with high specific capacitance and rate performance for supercapacitors. J. Bioresour. Bioprod. 2022, 7, 63–72. [Google Scholar] [CrossRef]
- Bhatkhande, D.S.; Pangarkar, V.G.; Beenackers, A.A.C.M. Photocatalytic degradation for environmental applications–a review. J. Chem. Technol. Biotechnol. Int. Res. Process Environ. Clean Technol. 2002, 77, 102–116. [Google Scholar] [CrossRef]
- Nabi, G. Tungsten doping role in structural modification and boosting electrochemical efficiency of Co(OH)2 dandelion assemblies. Mater. Sci. Eng. B 2024, 299, 117015. [Google Scholar]
- Zhai, T.; Lu, X.; Wang, H.; Wang, G.; Mathis, T.; Liu, T.; Li, C.; Tong, Y.; Li, Y. An electrochemical capacitor with applicable energy density of 7.4 Wh/kg at average power density of 3000 W/kg. Nano Lett. 2015, 15, 3189–3194. [Google Scholar] [CrossRef]


| Molar Ratios | ) |
|---|---|
| 0.5 M | 8.32 |
| 1 M | 8.33 |
| 1.5 M | 8.34 |
| Optical Parameters | |||
|---|---|---|---|
| 0.5 M | 1 M | 1.5 M | |
| (eV) | 2.88 | 2.8 | 2.75 |
| (eV) | 1.97 | 1.93 | 1.85 |
| (eV) | 0.78 | 1.27 | 1.47 |
| n | 1.54 | 2.33 | 2.63 |
| k | |||
| 2.39 | 5.45 | 6.94 | |
| tanθ | 0.22 | 0.32 | 0.44 |
| σ | |||
| R% | 15.7% | 31% | 43.9% |
| Dye/Oxide | (nm) | (eV) | (eV) | (eV) | Ref. |
|---|---|---|---|---|---|
| MB | 664 | 1.86 | −0.25 | 1.61 | [55] |
| MO | 464 | 2.01 | −1.87 | 0.14 | [55] |
| /0.5 M | - | 2.88 | −0.18 | 2.7 | Present work |
| /1 M | - | 2.8 | −0.14 | 2.66 | Present work |
| /1.5 M | - | 2.75 | −0.115 | 2.635 | Present work |
| Catalyst | Concentration of MB Dye (grams) | Time of Degradation (min) | % Value of Photo Degradation | Reference |
|---|---|---|---|---|
| 0.02 | 90 | 15% | [56] | |
| 0.05 | 60 | 77.7% | [57] | |
| 0.01 | 180 | 86% | [58] | |
| 0.02 | 360 | 78% | [59] | |
| 0.03 | 80 | 97.5% | Present study |
| Catalyst | Concentration of MO Dye (grams) | Time of Degradation (min) | % Value of Photo Degradation | Reference |
|---|---|---|---|---|
| 0.005 | 60 | 58% | [60] | |
| 0.01 | 40 | 70% | [61] | |
| 0.04 | 210 | 81% | [61] | |
| 0.02 | 60 | 23% | [62] | |
| 0.03 | 80 | 96.8% | Present Study |
| Samples | Degradation Efficiency (%) | Degradation Rate Constant K (min−1) | Half Life (min) | |
|---|---|---|---|---|
| /0.5 M | 97.5 | 0.04503 | 15 | 0.98813 |
| /1 M | 93.5 | 0.03628 | 19 | 0.9868 |
| /1.5 M | 91 | 0.02986 | 23 | 0.94083 |
| Samples | Degradation Efficiency (%) | Degradation Rate Constant (min−1) | Half Life (min) | |
|---|---|---|---|---|
| /0.5 M | 96.8 | 0.04372 | 16 | 0.98773 |
| /1 M | 93.1 | 0.03406 | 20 | 0.97836 |
| /1.5 M | 90.2 | 0.02933 | 24 | 0.93423 |
| Sr.No | Specimen | Morphology | Synthesis Route | Scan Rate/Current Density | Specific Capacitance F/g | Ref. |
|---|---|---|---|---|---|---|
| 1 | Nano spheres | Solvothermal method | 396 | [69] | ||
| 2 | Thin film | Nano grains | SILAR deposition | 487.84 | [70] | |
| 3 | Nanowires | Hydrothermal method | 48 | [71] | ||
| 4 | Nano films | Co-precipitation method | 82 | [72] | ||
| 5 | Nano spheres | Electrodeposition technique | 201.3 | [73] | ||
| 6 | Monolayered structure | Thermal decomposition | 300 | [74] | ||
| 7 | Nano spheres | Microplasma technology | 627 | This work |
Disclaimer/Publisher’s Note: The statements, opinions and data contained in all publications are solely those of the individual author(s) and contributor(s) and not of MDPI and/or the editor(s). MDPI and/or the editor(s) disclaim responsibility for any injury to people or property resulting from any ideas, methods, instructions or products referred to in the content. |
© 2025 by the authors. Licensee MDPI, Basel, Switzerland. This article is an open access article distributed under the terms and conditions of the Creative Commons Attribution (CC BY) license (https://creativecommons.org/licenses/by/4.0/).
Share and Cite
Tabasum, N.; Saeed, A.; Shafiq, R.; Khan, B.S.; Bashir, M.; Yousaf, M.; Rafiq, S.; Shaik, M.R.; Khan, M.; Alwarthan, A.; et al. Synthesis of Iron Oxide Nanoparticles via Atmospheric Pressure Microplasma for High-Performance Energy Storage and Environmental Applications. Catalysts 2025, 15, 444. https://doi.org/10.3390/catal15050444
Tabasum N, Saeed A, Shafiq R, Khan BS, Bashir M, Yousaf M, Rafiq S, Shaik MR, Khan M, Alwarthan A, et al. Synthesis of Iron Oxide Nanoparticles via Atmospheric Pressure Microplasma for High-Performance Energy Storage and Environmental Applications. Catalysts. 2025; 15(5):444. https://doi.org/10.3390/catal15050444
Chicago/Turabian StyleTabasum, Nafeesa, Adnan Saeed, Rizwana Shafiq, Babar Shahzad Khan, Mahwish Bashir, Muhammad Yousaf, Shahid Rafiq, Mohammed Rafi Shaik, Mujeeb Khan, Abdulrahman Alwarthan, and et al. 2025. "Synthesis of Iron Oxide Nanoparticles via Atmospheric Pressure Microplasma for High-Performance Energy Storage and Environmental Applications" Catalysts 15, no. 5: 444. https://doi.org/10.3390/catal15050444
APA StyleTabasum, N., Saeed, A., Shafiq, R., Khan, B. S., Bashir, M., Yousaf, M., Rafiq, S., Shaik, M. R., Khan, M., Alwarthan, A., & Siddiqui, M. R. H. (2025). Synthesis of Iron Oxide Nanoparticles via Atmospheric Pressure Microplasma for High-Performance Energy Storage and Environmental Applications. Catalysts, 15(5), 444. https://doi.org/10.3390/catal15050444