Article

Optimization of Acid-Catalyzed Hydrolysis and Simultaneous Saccharification and Fermentation for Enhanced Ethanol Production from Sweet Stalk Sorghum

by
Torpong Kreetachat
1,2,
Nopparat Suriyachai
1,2,3,
Punjarat Khongchamnan
4,
Kowit Suwannahong
5,
Surachai Wongcharee
6,
Chainarong Sakulthaew
7,
Chanat Chokejaroenrat
8 and
Saksit Imman
1,2,*
1
School of Energy and Environment, University of Phayao, Phayao 56000, Thailand
2
Integrated Biorefinery Excellence Center (IBC), School of Energy and Environment, University of Phayao, Phayao 56000, Thailand
3
BIOTEC-JGSEE Integrative Biorefinery Laboratory, National Center for Genetic Engineering and Biotechnology, Innovation Cluster 2 Building, Pathumthani 12120, Thailand
4
The Joint Graduate School for Energy and Environment (JGSEE), King Mongkut’s University of Technology Thonburi, Prachauthit Road, Bangmod, Bangkok 10140, Thailand
5
Faculty of Public Health, Burapha University, Tambon Saensuk, Amphur Muang, Chonburi 20131, Thailand
6
Department of Environmental Engineering, Faculty of Engineering, Mahasarakham University, Mahasarakham 44150, Thailand
7
Department of Veterinary Technology, Faculty of Veterinary Technology, Kasetsart University, Bangkok 10900, Thailand
8
Department of Environmental Technology and Management, Faculty of Environment, Kasetsart University, Bangkok 10900, Thailand
*
Author to whom correspondence should be addressed.
Catalysts 2025, 15(4), 379; https://doi.org/10.3390/catal15040379
Submission received: 19 February 2025 / Revised: 28 March 2025 / Accepted: 11 April 2025 / Published: 13 April 2025

Abstract

:
This study aims to identify the best conditions for liquid hot water pretreatment (LHW) of sweet stalk sorghum and the optimization method using the response surface method (RSM) with varying parameters, including temperature, reaction time, and acid catalysts, to enhance the enzymatic hydrolysis of pretreated sweet stalk sorghum. This study presents a novel approach by optimizing LHW pretreatment using RSM to maximize the glucose yield and minimize sugar degradation, in contrast to the widely used method of sulfuric acid hydrolysis combined with SSF. The goal is to achieve the highest glucose yield for ethanol production under optimal conditions. The results show that after the LHW pretreatment under optimal conditions, the optimal actual values have the highest glucose yield of 91.09% in a solid fraction at a sulfuric acid catalyst concentration of 0.90% with a pretreatment temperature of 110 °C for 90 min. The results of the statistical analysis of the glucose yield show an R-squared value of 0.9964 or 99.64%, which is statistically significant. In addition, the optimized pretreatment conditions significantly improved the accessibility of the enzyme. Pretreatment for ethanol production in sweet stalk sorghum samples was carried out with an H2SO4 catalyst concentration of 0.90% using the SSF method with the yeast strain S. cerevisiae. The results show that during the fermentation period of 0–96 h, the maximum ethanol concentration of 23.1 g/L occurred at 72 h under 25 FPU/g substrate at pH 4.8 and decreased 72 h after fermentation. In conclusion, sweet stalk sorghum is a promising candidate for ethanol production due to its high glucose yield and efficient enzymatic hydrolysis, making it a viable alternative for biomass-based energy production.

1. Introduction

Energy is an essential component of human life, shaping global society, and driving economic growth. It plays a pivotal role in improving living standards, supporting technological advancements, and fostering the progress of civilization for people across the globe [1]. Energy demand continues to increase as a result of population growth, urbanization, and industrial development, exerting significant pressure on natural resources and the environment. Consequently, transitioning to sustainable and renewable energy systems has become a pressing global priority [2]. The growth of the biorefinery industry necessitates a cost-effective and sustainable supply of sugars to support the production of chemical and biological products in the future [2]. Because of the critical role of the pretreatment process and the great selectivity of enzymes for cellulose hydrolysis into sugars, the pretreatment of biomass with subsequent enzymatic hydrolysis is now considered a promising technique for the extraction of sugar products (C5–C6) from biomass derivatives. These include 6-carbon atoms, e.g., glucose, xylose, fructose, and galactose, and 5-carbon atoms (e.g., arabinose and xylose), which are essential intermediates for various downstream applications [3,4,5].
Currently, the first critical step in biomass processing involves implementing an efficient and environmentally friendly pretreatment method. This step aims to minimize energy consumption and chemical waste while maximizing the digestibility of the substrate. To achieve these objectives, various pretreatment techniques have been developed to produce cellulase-digestible substrates by enhancing the disruption of the biomass structure and improving enzyme accessibility. These advancements not only facilitate the enzymatic hydrolysis process but also contribute significantly to improving ethanol yields in subsequent production stages. Several pretreatment procedures have been devised to create cellulase-digestible substrates, including thermal pretreatment, catalytic liquid hot water treatment, microwave-assisted acid treatment, ultrasonic treatment, organosolv pretreatment, dilute acid pretreatment, alkali pretreatment, steam explosion, solvothermal fractionation, biological pretreatment, and others [6,7,8]. Each pretreatment technique has its unique advantages and challenges depending on the type of biomass, the transformation process, and the desired end products. Thermal- and acid-based methods are well known for their efficiency in removing hemicellulose and lignin. At the same time, these methods are considered environmentally benign when applied appropriately. Therefore, selecting the most suitable pretreatment method during the initial stage of biomass processing is crucial for enhancing the efficiency of subsequent enzymatic hydrolysis. Moreover, this selection plays a significant role in improving the overall sugar yield, which is essential for ensuring the economic feasibility of biorefinery operations. In addition, for economic and environmental reasons, post-treatment processes and solvent reuse are required to reduce the environmental impact [9].
The liquid hot water pretreatment process is one of the lignocellulose pretreatment processes that is very effective in the production of glucose for conversion into bioethanol [10]. The LHW process is a pretreatment method that utilizes hot water under elevated pressure, exceeding atmospheric levels, to treat biomass. It has been observed that after pretreatment, the compositions of lignin and hemicellulose are significantly affected. Typically, the LHW process promotes the disruption of the lignocellulosic structure in biomass, particularly targeting components such as hemicellulose and lignin. At the same time, it enhances the accessibility of enzymes to the cellulose structure, thereby facilitating subsequent enzymatic hydrolysis. Currently, bioethanol is regarded as a clean, renewable, and environmentally friendly energy source, making it a viable alternative to fossil fuels [11].
Previous studies investigated pretreatment with hot liquid water and the enzymatic hydrolysis of Italian green pepper waste to produce sugars that can eventually be fermented. The research demonstrated that pretreatment at 180 °C for 40 min achieved a maximum glucose yield of 61.02%. Nevertheless, it was observed that higher temperatures and prolonged pretreatment durations may result in the degradation of sugars, leading to lower glucose yields. Therefore, it is essential to control the key parameters involved in pretreatment under optimal conditions to regulate sugar yields effectively. This highlights the necessity of further optimizing parameters such as temperature, acid catalyst concentration, and pretreatment time to improve glucose production efficiency while minimizing undesirable side reactions [12].
The target of this study is to understand the LHW process and the optimization methodology using the response surface method for three factors under different optimal conditions. The paper aims to study the optimum conditions for LHW under different parameters, i.e., temperature, reaction time, and acid catalyst concentration, to improve the enzymatic hydrolysis of pretreated sweet stalk sorghum with the highest glucose yield for conversion to ethanol production under optimum conditions. To overcome these challenges, this study recognizes the importance of developing sustainable biofuel production and energy production processes under appropriate conditions; therefore, it aims to replace non-renewable petroleum products. While sulfuric acid hydrolysis combined with the SSF method has been widely accepted, our study introduces a novel approach by optimizing LHW pretreatment using RSM to maximize the glucose yield and minimize sugar degradation, contributing to more efficient bioethanol production.

2. Results and Discussion

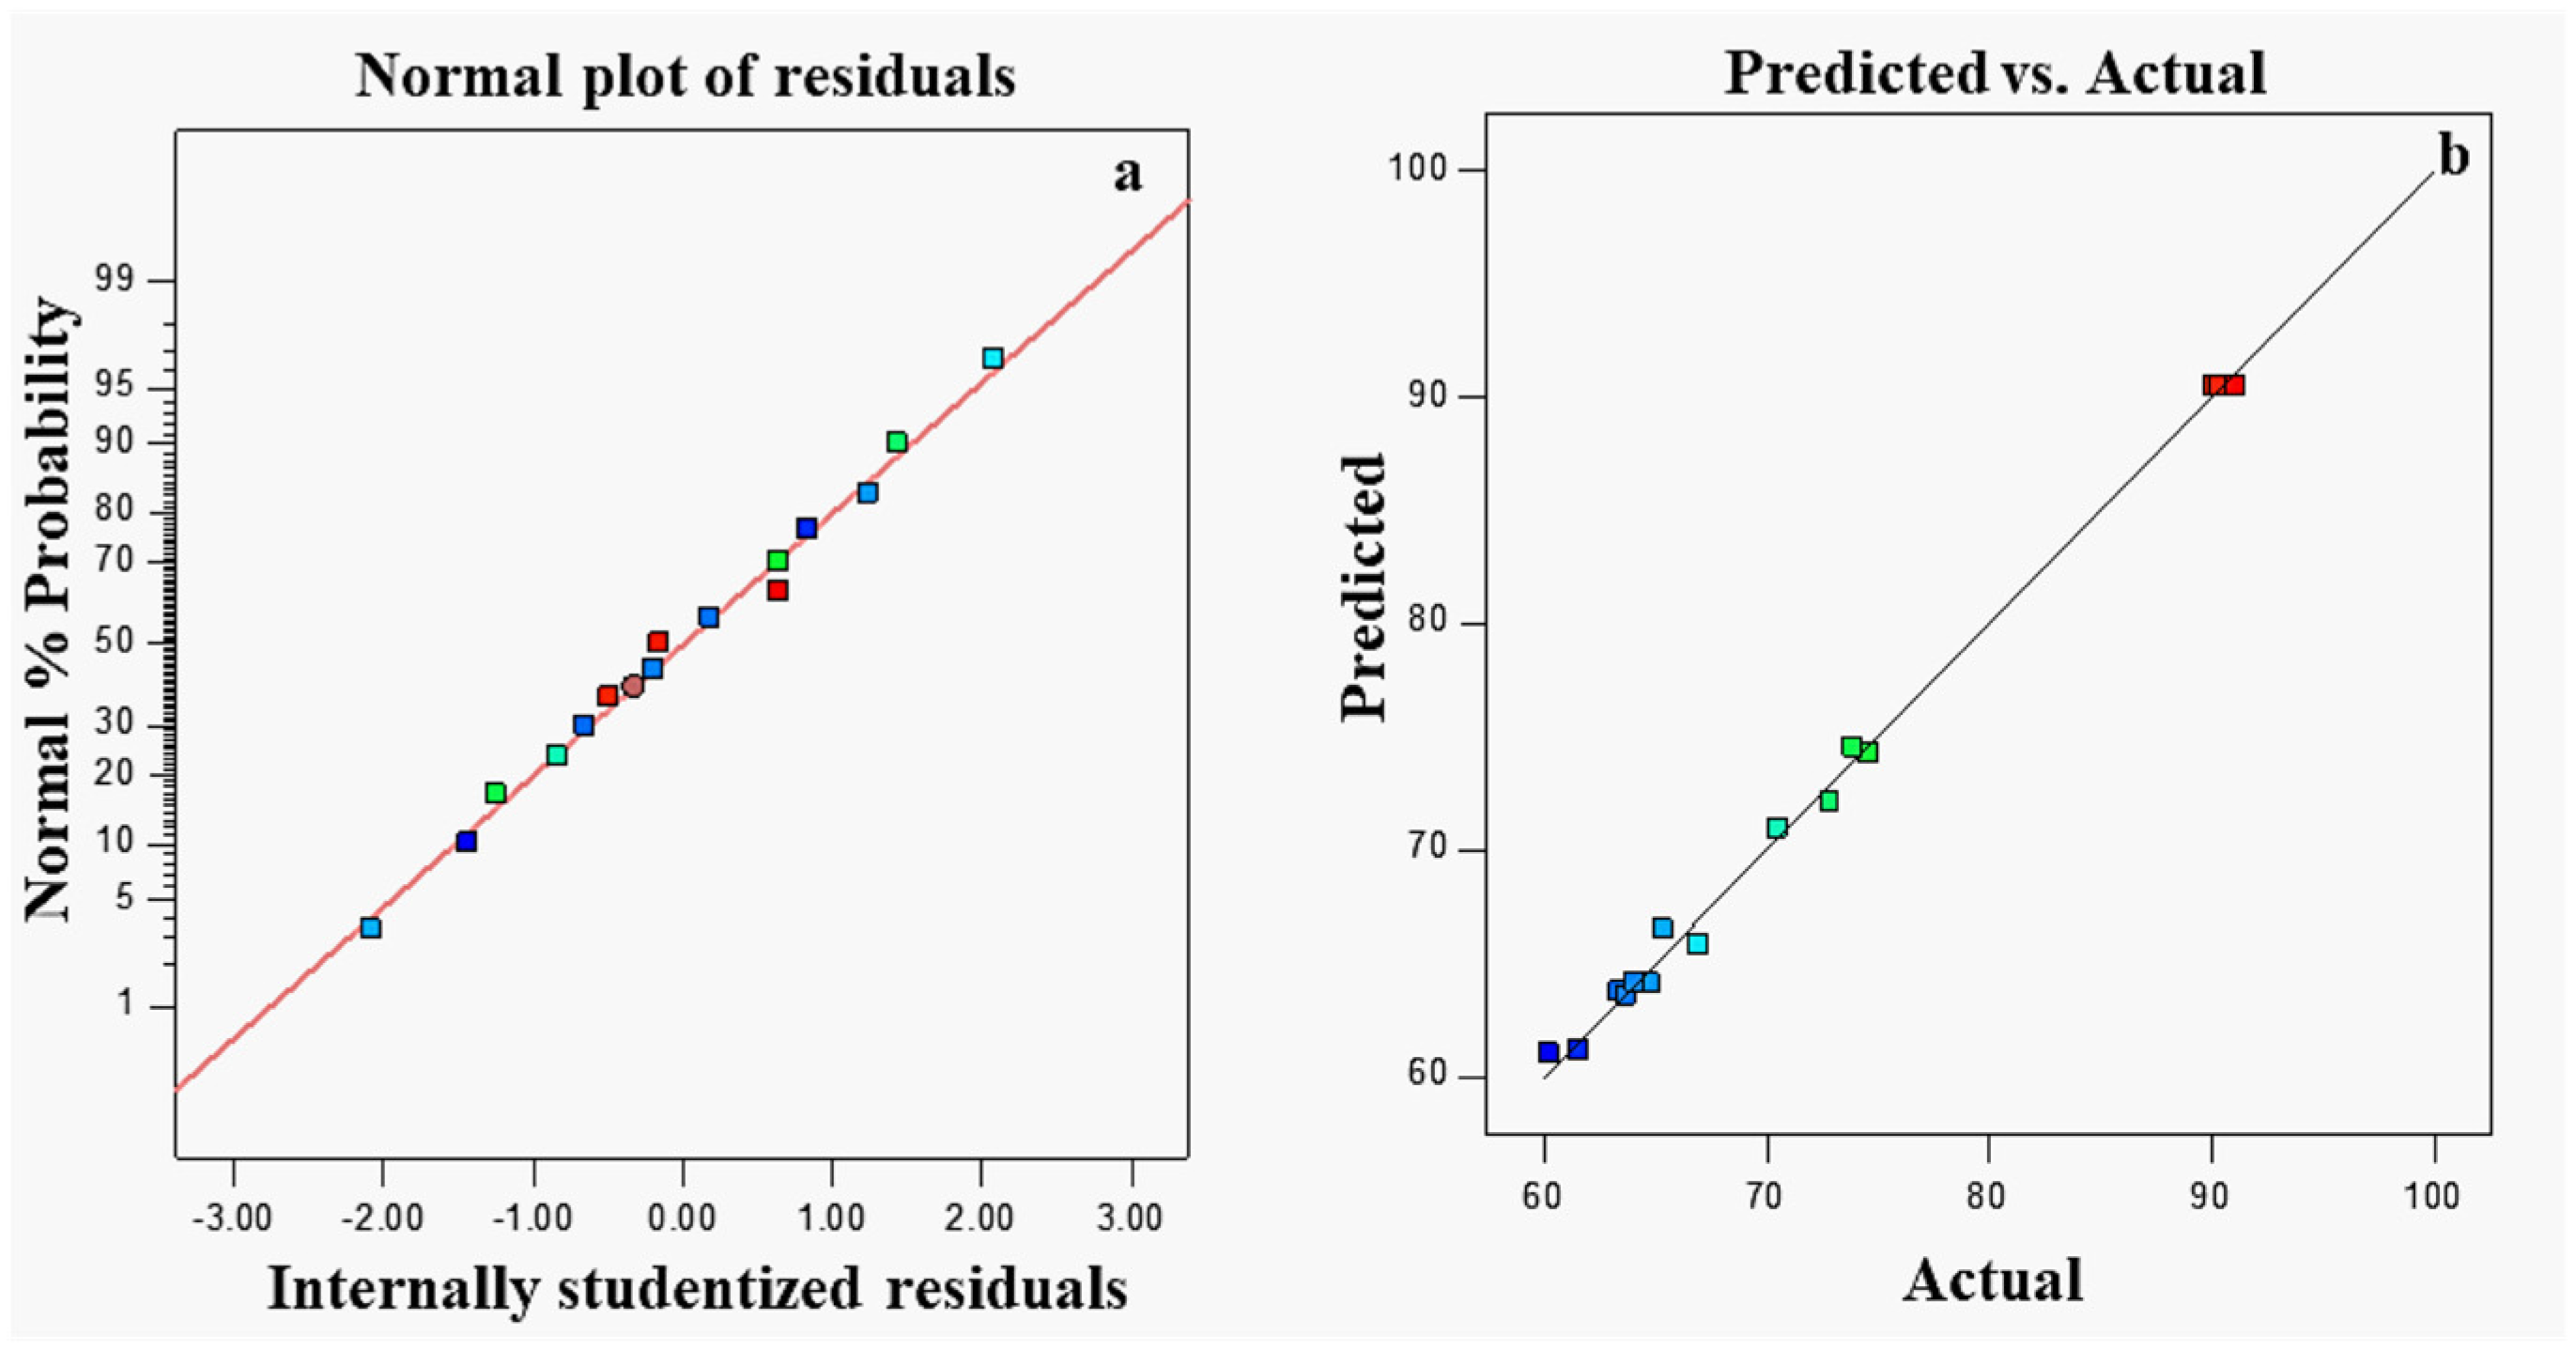
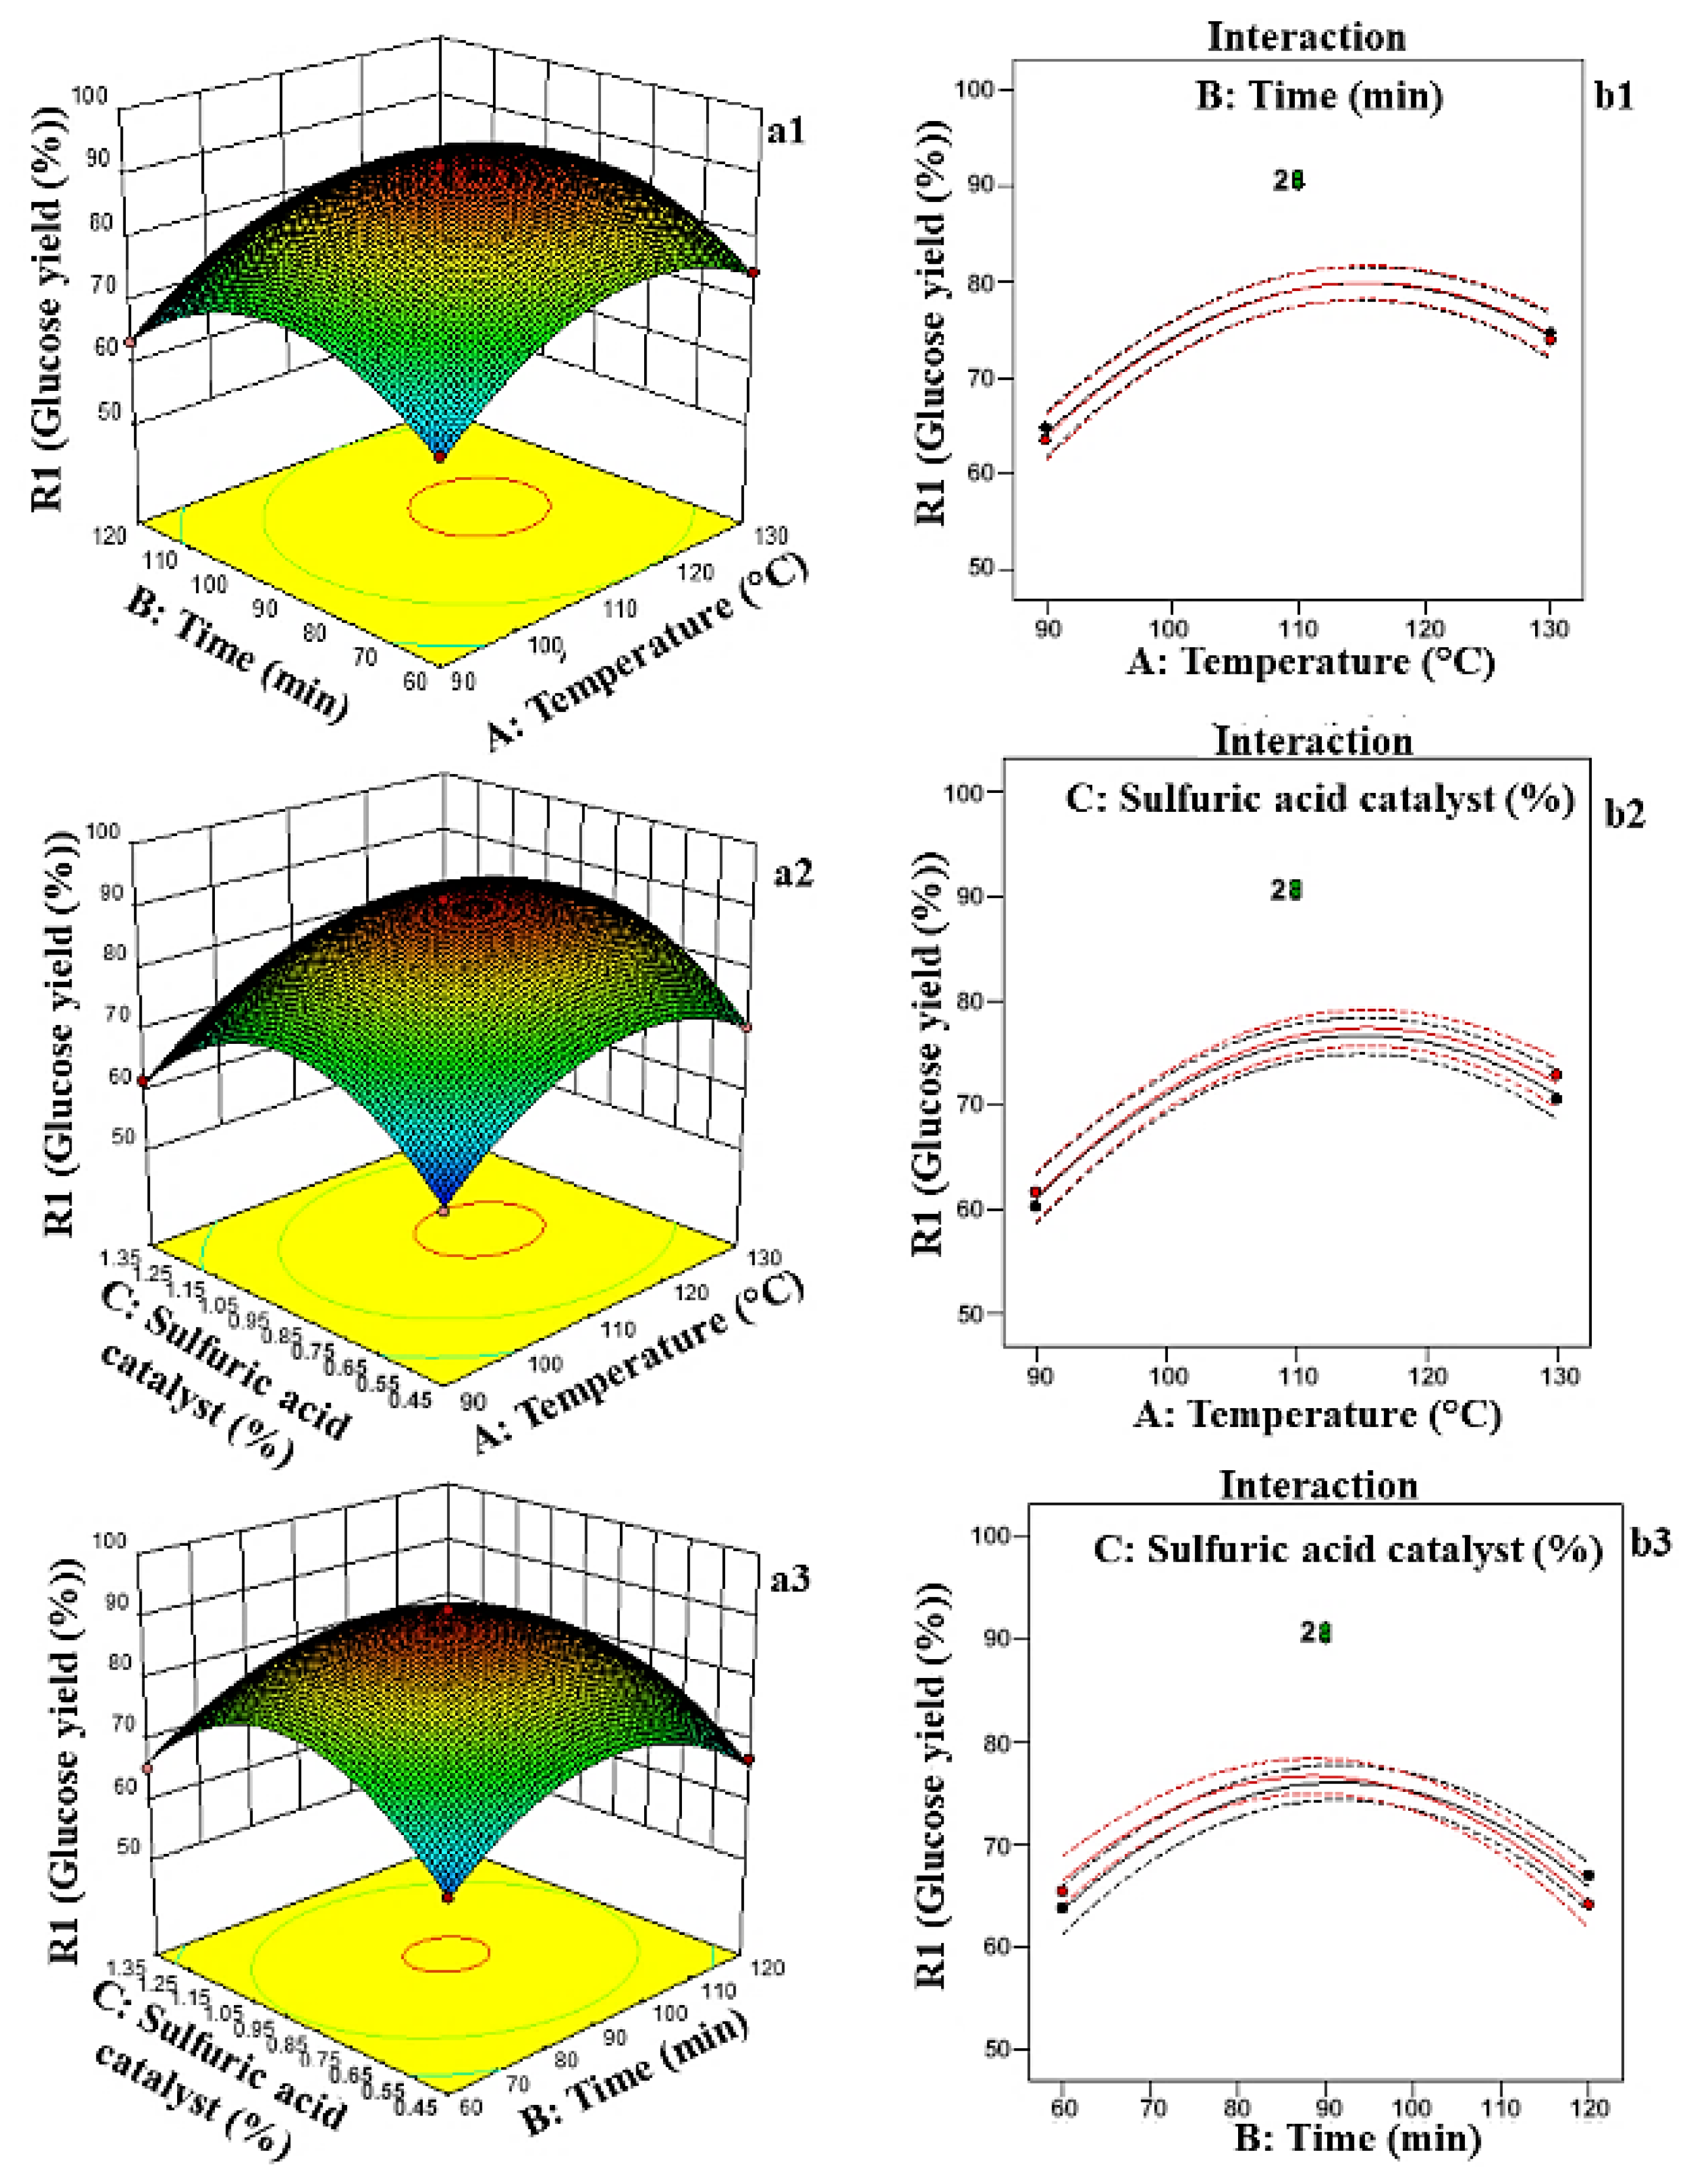
2.1. The Optimization of the Glucose Yield Using the RSM

In this study, the pretreatment yield and recovery efficiency were evaluated, including solid recovery (67.2%), xylose recovery (75.3%), and glucose yield (91.09%), respectively. Additionally, the composition of the acid-catalyzed pretreated solids was analyzed. The results demonstrate that after liquid hot water (LHW) pretreatment, hemicellulose was largely removed under optimal conditions, while the cellulose content significantly increased. A compositional analysis of the pretreated solids (expressed as a weight percentage on a dry basis) revealed the following contents: cellulose (60.5 ± 0.21%), hemicellulose (3.91 ± 0.80%), acid-insoluble lignin (22.4 ± 0.69%), acid-soluble lignin (6.9 ± 0.15%), ash (3.08 ± 0.06%), and other components (3.21 ± 0.72%). The high cellulose content after pretreatment indicates an enhanced conversion to glucose, making it a highly suitable substrate for simultaneous saccharification and fermentation (SSF) in ethanol production.
The glucose yield from 15 experimental runs with the LHW pretreatment method was analyzed under optimal conditions using the RSM (Table 1). The analysis showed a positive trend in the experimental values, demonstrating the influence of the analyzed factors on the glucose yield (%) from sweet stalk sorghum. Figure 1 shows both the actual and predicted values, showing that the highest glucose yield of 91.09% was achieved under optimal conditions. This was attained at an H2SO4 catalyst concentration of 0.9% at a pretreatment temperature of 110 °C for a reaction time of 90 min.
The ANOVA statistical values for the quadratic model of the reaction surface show that the model is appropriate and reliable. Parameters A, B, and C represent the inputs for the model, i.e., temperature, reaction time, and H2SO4 catalyst concentration, respectively. The resultant equation in terms of real components was used to generate quadratic models for glucose yield (%) using the BBD. An example equation obtained for the LHW process of sweet stalk sorghum stalk using three factors is as follows:
R1 = (Glucose yield (%)) = 402.70 + 5.73A + 2.311B + 131.36C − 0.00024AB − 0.0275AC − 0.0831BC − 0.02509A2 − 0.0125B2 − 70.1193C2
Table 2 shows the accuracy of the model equation. A statistical analysis of the glucose yield gave an R-squared value of 0.9964, which means that the model could explain 99.64% of the variability in glucose yield. The adjusted R-squared value was 0.9901 and explained 99.01% of the variance in glucose yield. Additionally, the model had a predicted R-squared value of 0.9482, which covered 94.82% of the variance in glucose yield, indicating a good fit. This high value indicates that the model is an excellent fit and accurately explains the variability of the response.
There is a reasonable agreement between the experimental and predicted glucose yield values, as evidenced by an R-squared value of approximately 1, indicating the high accuracy and reliability of the RSM model employed in this study. This strong correlation not only validates the experimental data but also highlights the statistical significance of the p-values obtained for glucose yield in the LHW pretreatment process. Furthermore, the robustness of the RSM model underscores its effectiveness in optimizing process parameters and predicting outcomes with high precision, thereby demonstrating its potential as a valuable tool for enhancing sweet stalk sorghum pretreatment efficiency.
In addition, the ANOVA for the quadratic model of glucose yield after the LHW pretreatment process (Table 3) demonstrates statistically significant results, further validating the model’s effectiveness.
In this study, the model shows a p-value of less than 0.050, which is well below the 95% confidence threshold, indicating that the model is significant, and the parameters used for glucose yield prediction are reliable. Additionally, the high R-squared value suggests a strong correlation between the experimental data and the predicted outcomes, confirming the robustness of the model. Specifically, the glucose yield was found to be significantly influenced by the temperature (A), time (B), and sulfuric acid catalyst concentration (C), as well as their respective quadratic and interaction effects. Among these, the temperature (A) and time (B) parameters had the most substantial influence, as evidenced by their low p-values (<0.0001). Interaction terms such as AB and BC showed minimal influence, with p-values of 0.7893 and 0.0887, respectively, suggesting that they were not statistically significant. The results presented in Table 2 highlight the importance of optimizing temperature and time parameters to achieve the maximum glucose yield under conditions suitable for fermentation. Furthermore, these findings confirm the accuracy of the predictions made by the RSM model, demonstrating its effectiveness in identifying the optimal process conditions for glucose production.

2.2. The Effect of Three Parameters on the Yield of Glucose

The response surface and interaction plots illustrate the combined effects of temperature, reaction time, and sulfuric acid catalyst concentration on glucose yield. The interaction of the H2SO4 catalyst with temperature for 90 min showed that the highest glucose production at 110 °C was about 0.90% (Figure 2a1–a3,b1–b3). The ANOVA test showed that the interaction of sulfuric acid concentration was more significant (p < 0.05) than that of temperature and residence time, indicating that the acid concentration has a great influence on the liquid hot water process. Figure 2 shows the 3D surface plots regarding the effects of temperature, reaction time, and H2SO4 catalysts on the glucose yield. Based on the surface plots, the results for all three parameters show that the percentage glucose yield increases with temperature at 110 °C for 90 min with a H2SO4 concentration of 0.90%, where it reaches its maximum values. The interaction between residence time and H2SO4 catalyst concentration shows that prolonged durations and higher catalyst levels boost the glucose yield, although extreme conditions may result in side reactions. These results support the use of this quadratic model for further experiments and the optimization of the LHW process for glucose production.
The increase in glucose yield with the sulfuric acid concentration can be attributed to the role of acid in facilitating the hydrolysis of hemicellulose and disrupting the lignocellulosic structure. Sulfuric acid acts as a proton donor, breaking glycosidic bonds within polysaccharides and enhancing cellulose accessibility for enzymatic or acid hydrolysis [13]. At moderate concentrations, acid hydrolysis effectively depolymerizes hemicellulose into fermentable sugars while also partially hydrolyzing cellulose into glucose. The acid concentration also influences the balance between hydrolysis efficiency and sugar degradation [14]. Higher acid concentrations can accelerate the breakdown of cellulose into glucose by increasing proton availability and enhancing reaction kinetics. Nevertheless, excessive acid levels and prolonged exposure can promote secondary reactions, leading to sugar degradation and the formation of inhibitory byproducts [15,16]. The results underscore the importance of optimizing these parameters to achieve high glucose yields while maintaining process efficiency and minimizing byproduct formation.
In comparison to other studies, our glucose yield at moderate conditions (110 °C, 90 min, and 0.90% H2SO4) is relatively high. For instance, in [16], higher acid concentration (1.5% H2SO4) and temperature (140 °C) were used, which resulted in a higher glucose yield of 92% but with significant side product formation, including furfural and HMF, which inhibited fermentation. Similarly, [17] reported a glucose yield of 95% using more extreme conditions (160 °C, 2.0% H2SO4, and 60 min), but at the cost of higher energy consumption and increased sugar degradation. These studies suggest that while higher temperatures and acid concentrations can improve the glucose yield, they often lead to undesirable byproducts and higher operational costs. Our results indicate that a more moderate approach can achieve a balanced yield without the detrimental side effects observed in more extreme conditions.

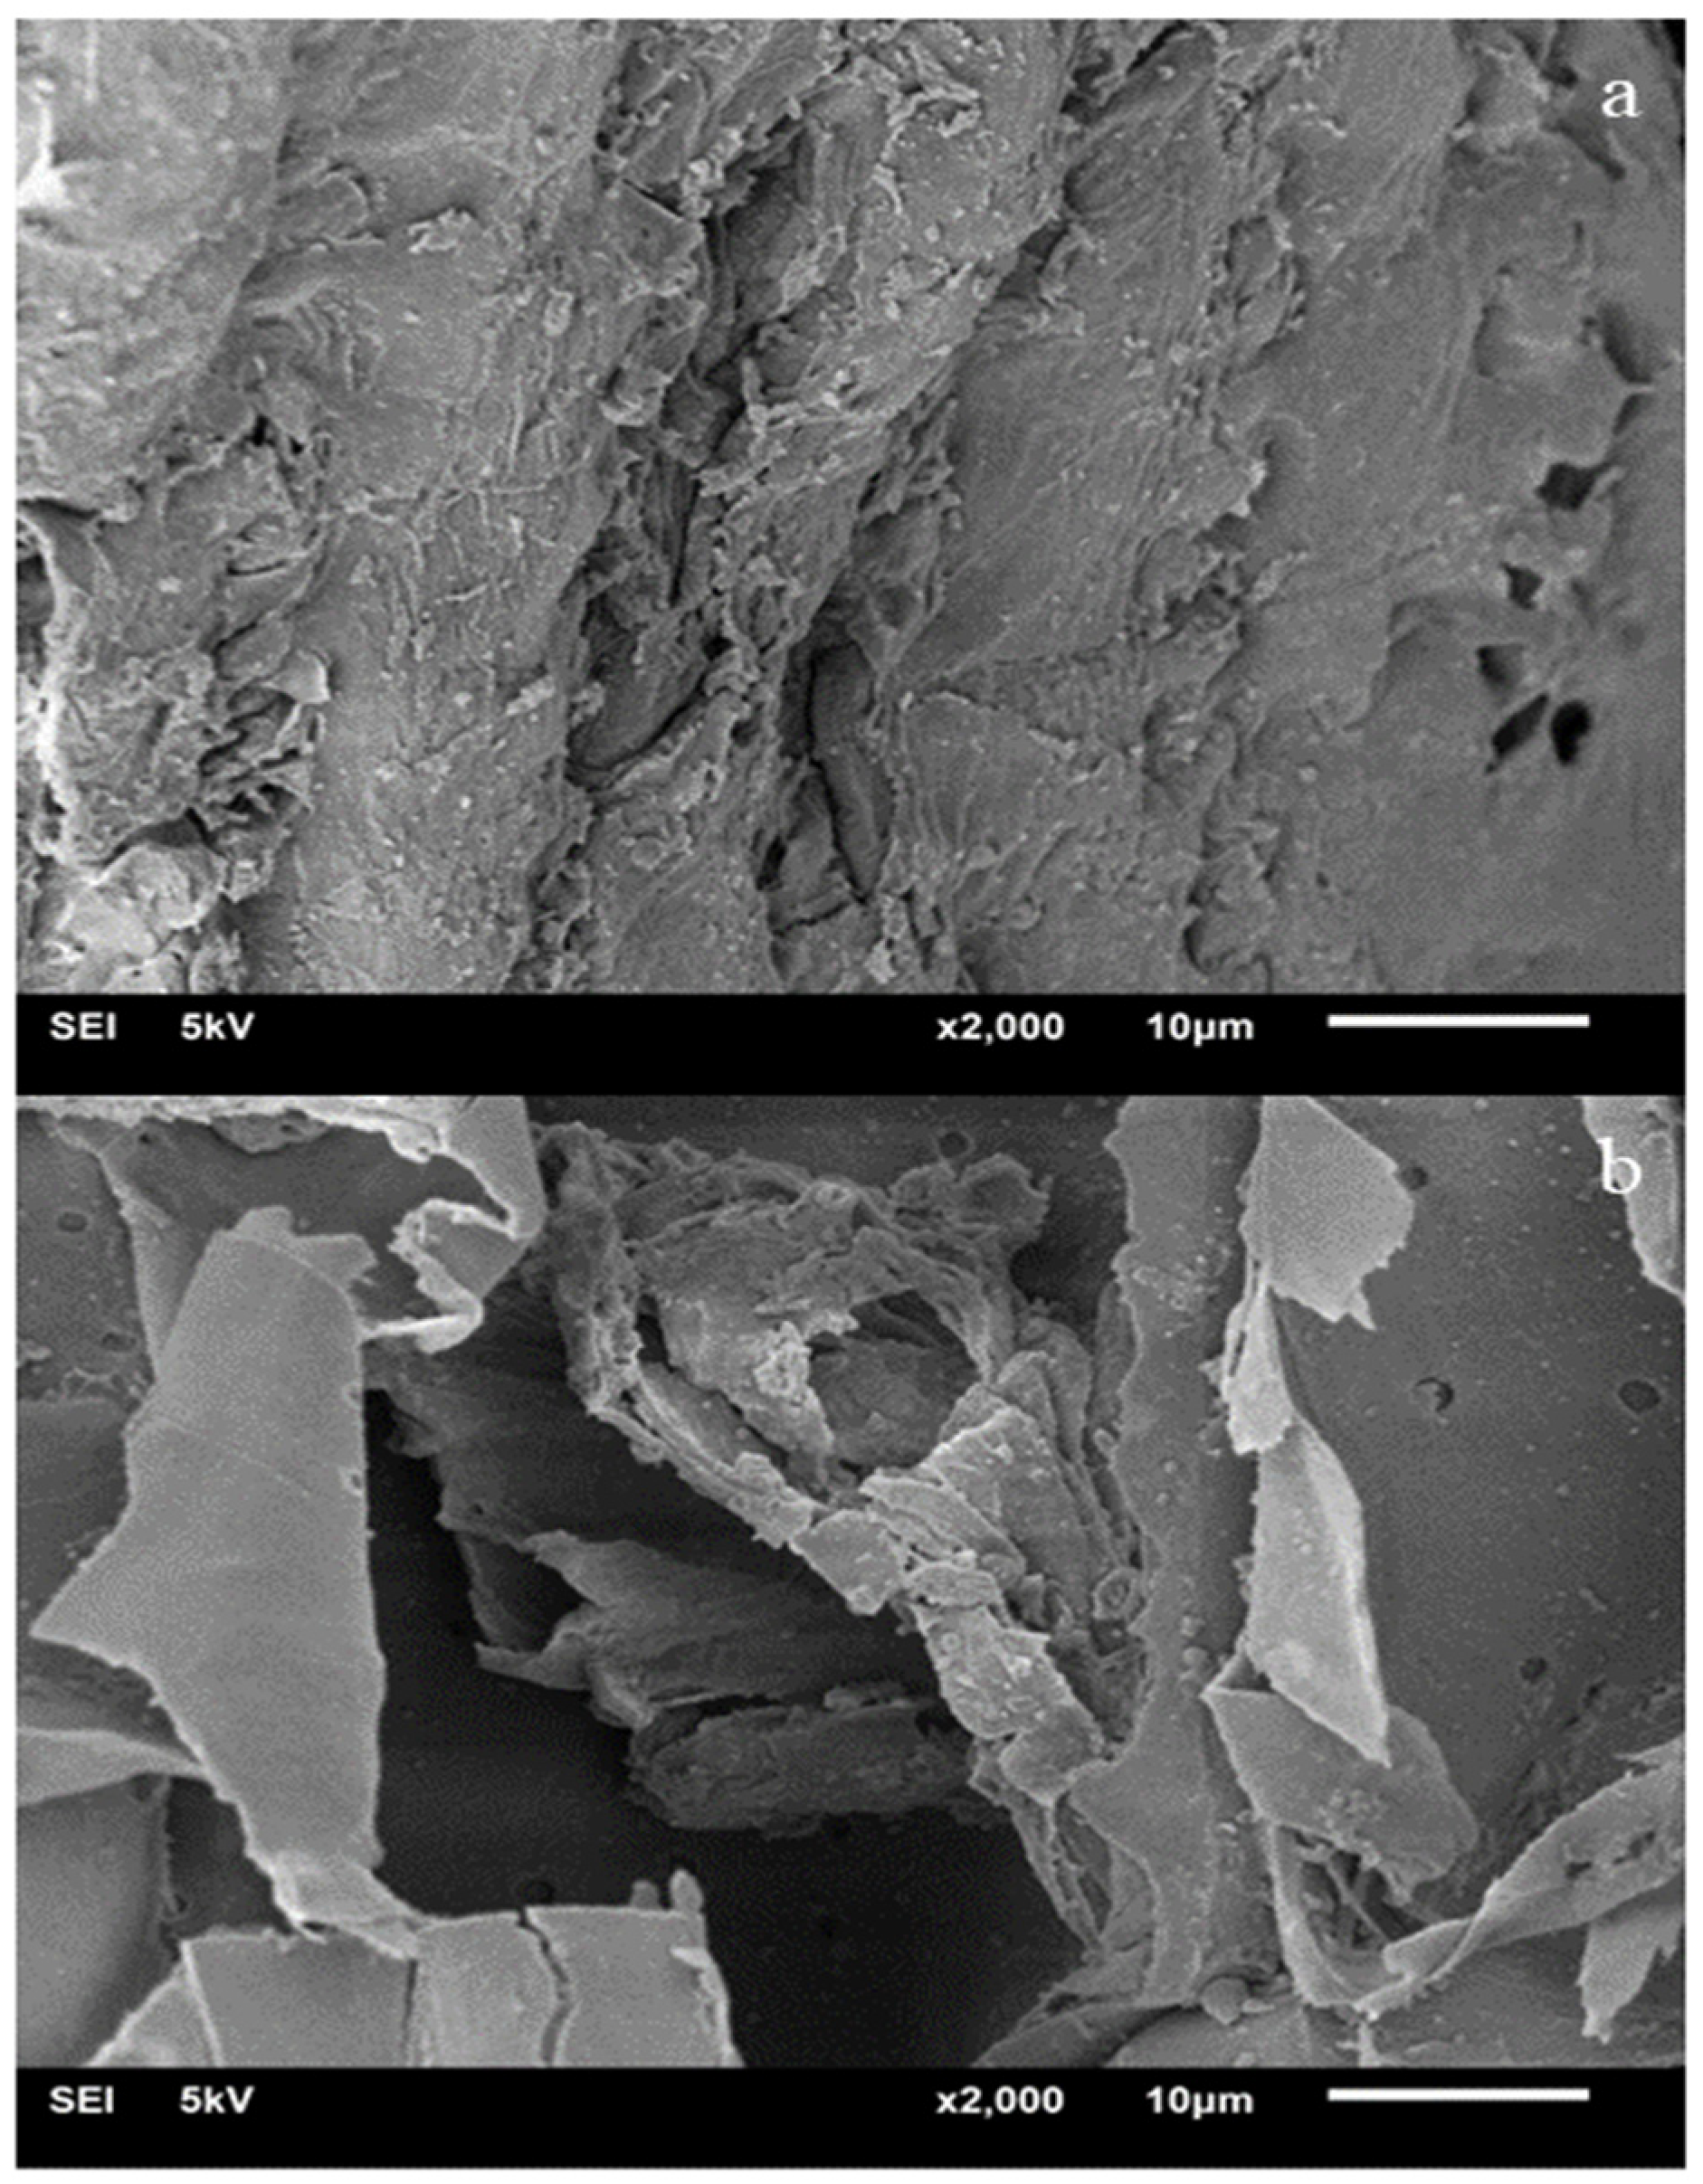
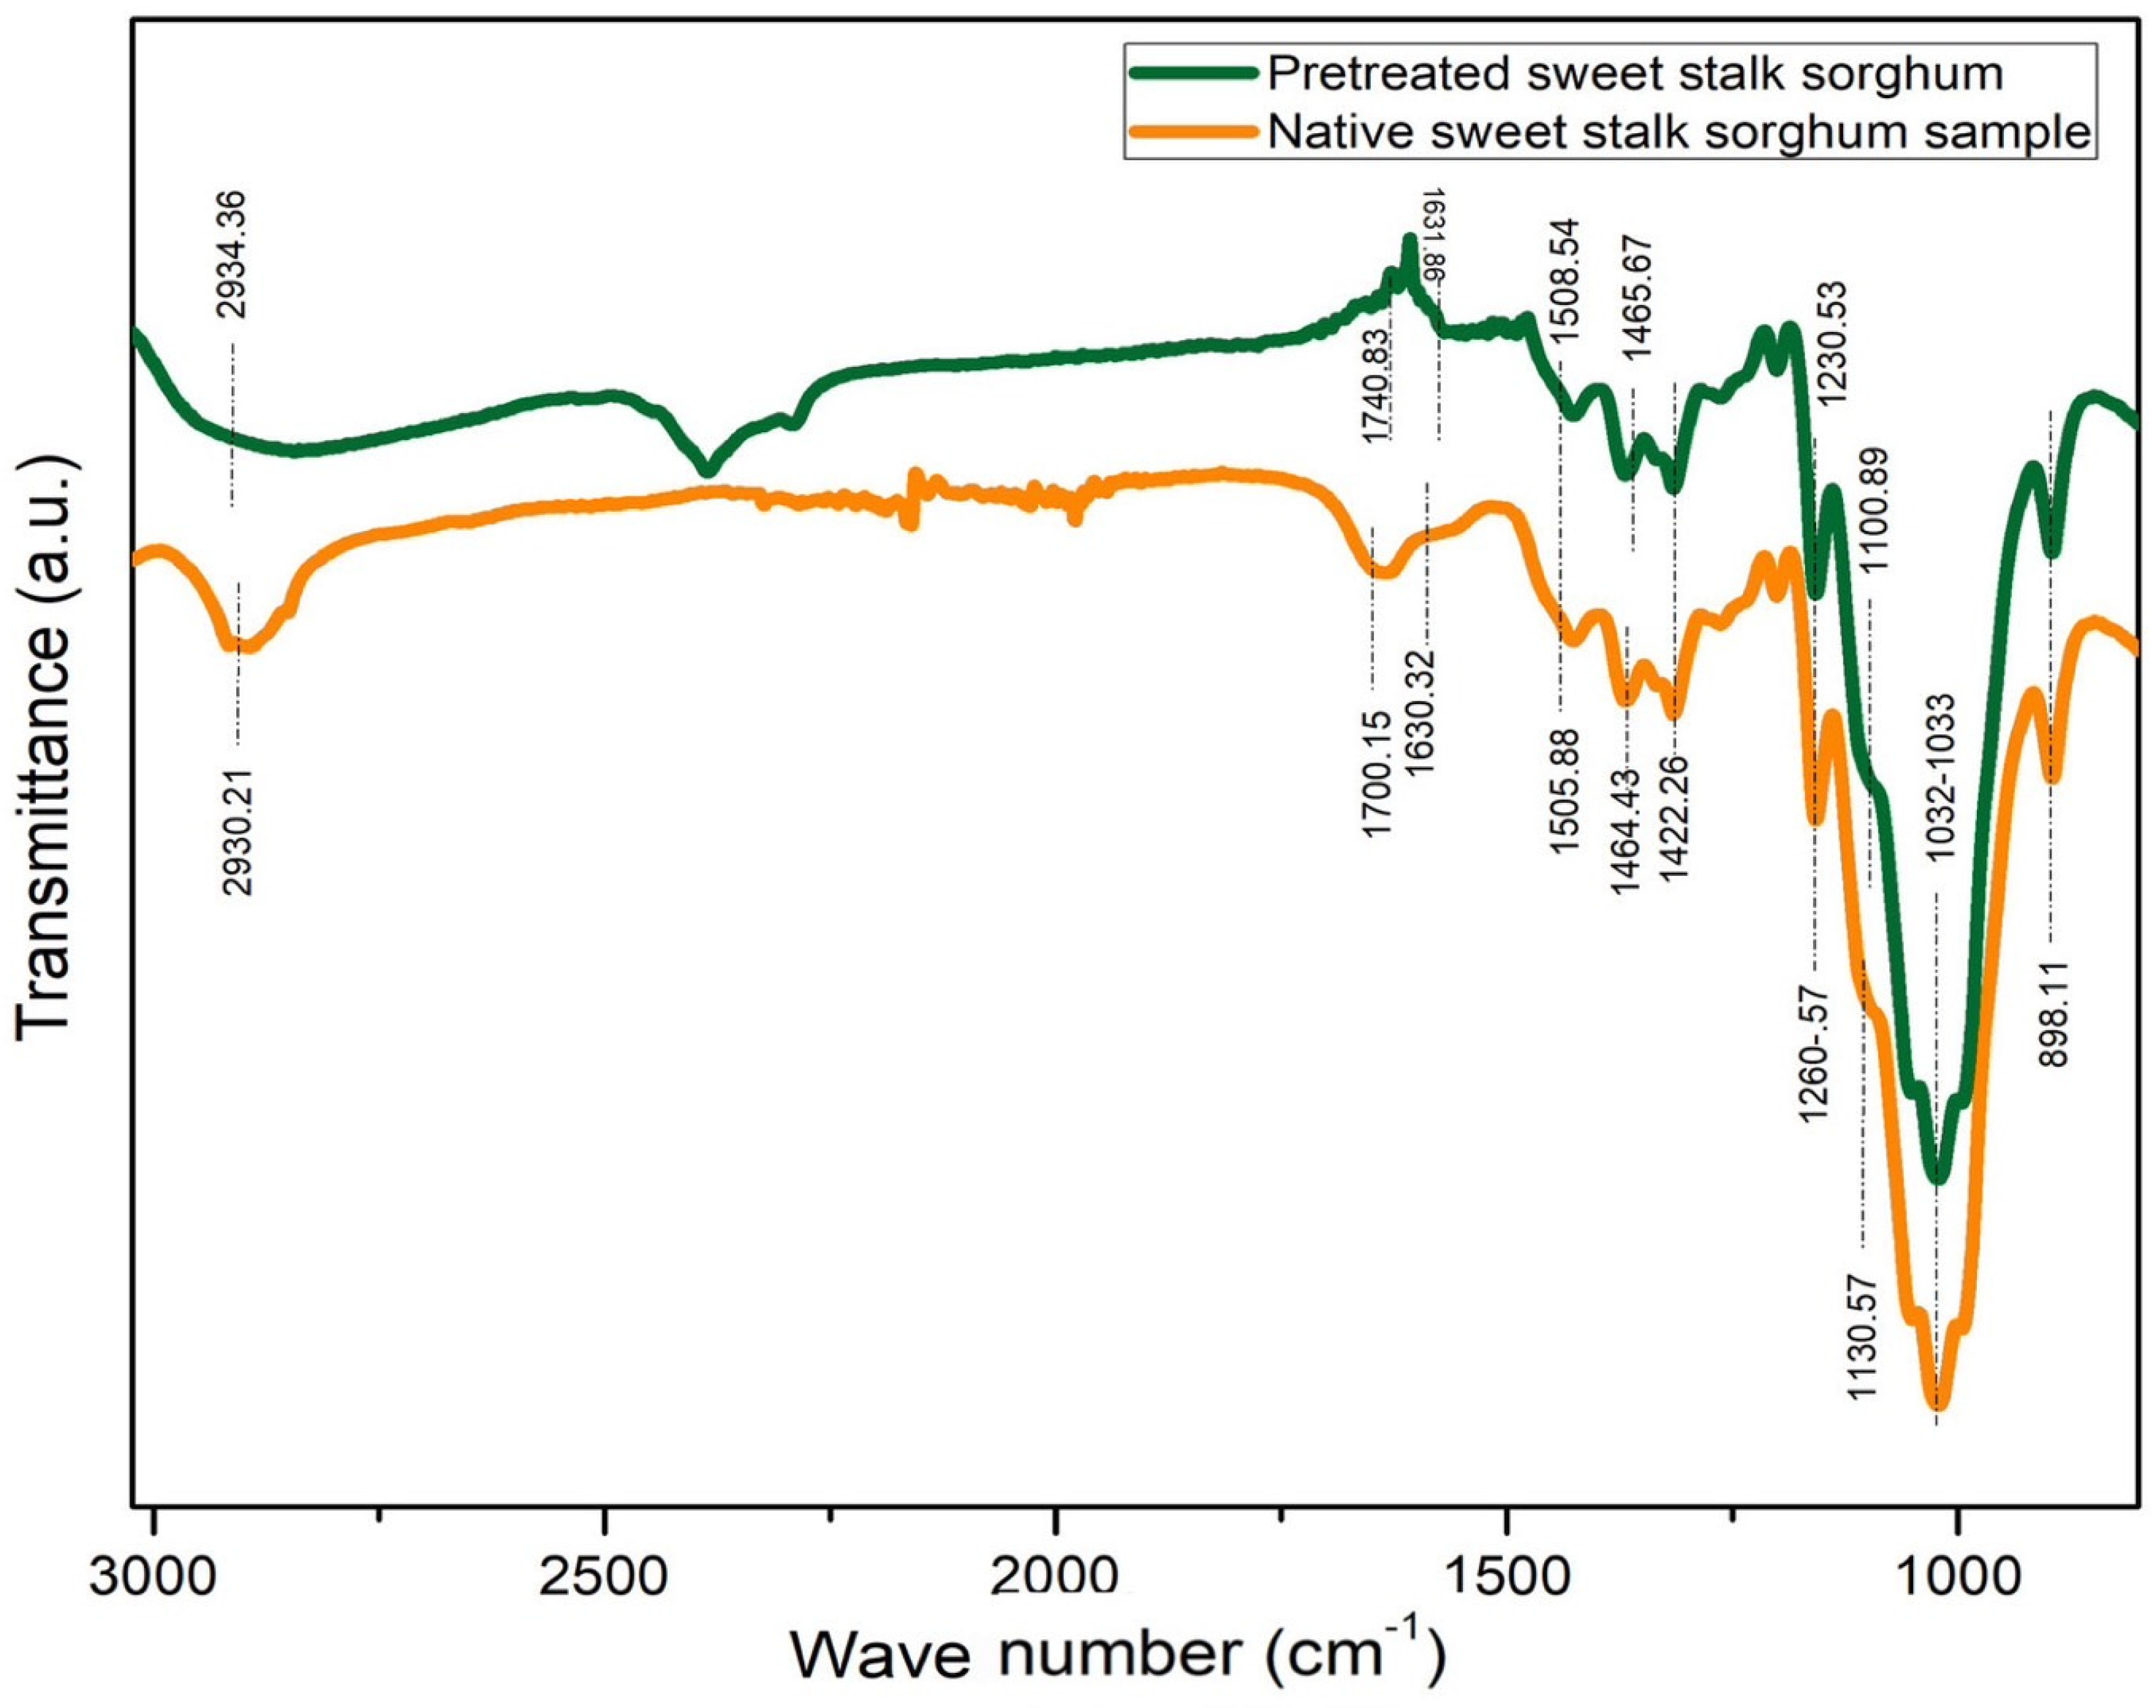
2.3. Characterization of Solid Residues from LHW Pretreatment Process

The structural changes in sweet stalk sorghum pretreated with LHW were analyzed under optimal conditions at a temperature of 110 °C for 90 min with a sulfuric acid concentration of 0.90% obtained using an SEM analysis in comparison to native sorghum (see Figure 3).
Figure 3 shows the scanning electron microscopy images showing a) the native sweet stalk sorghum sample and b) the solid residues after pretreatment with 0.90% sulfuric acid catalyst at 110 °C for 90 min. The results show that the surface images of native sweet stalk sorghum display an intact physical structure, no cracks, a smooth surface, and an orderly arrangement (Figure 3a). After pretreatment with a sulfuric acid catalyst, the structure of the sweet stalk sorghum was changed (Figure 3b). After the LHW pretreatment under optimal conditions, significant structural changes were observed. The SEM images reveal the exposure of cellulose fibers, indicating the removal of hemicellulose and lignin from the outer surface. This structural alteration enhances enzyme accessibility, facilitating enzymatic hydrolysis. The observed morphological changes align with previous findings, supporting the effectiveness of LHW pretreatment in improving cellulose availability for subsequent bioconversion [18]. However, it should be noted that the molecular weights of cellulose, hemicellulose, and lignin were not directly measured in this study. The conclusions regarding component removal are based on SEM analysis, which visually confirms the disruption of the lignocellulosic matrix and increased cellulose exposure. This supports the potential for increased glucose yields in the ethanol production process using the simultaneous saccharification and fermentation process [18].
The optimal LHW involved using an acid catalyst with 0.90% H2SO4 at 110 °C for 90 min under a pressure of 20 bar. The effects of this pretreatment on the crystallinity index and the crystalline size of sweet stalk sorghum were analyzed using XRD (Table 4 and Figure 4). The results show a significant increase in the crystallinity index from 56.32% to 67.10%, while the crystal size decreased from 2.83 nm to 2.51 nm. The removal of hemicellulose, water-soluble substances, and partial lignin enhances cellulose accessibility for enzymatic hydrolysis in the simultaneous saccharification and fermentation process, improving the conversion of cellulose into fermentable sugars. Therefore, these changes indicate that the optimal LHW pretreatment process not only increases glucose yields but also improves the overall efficiency of the biofuel production process. This is attributed to the removal of amorphous hemicellulose and lignin fractions, which aligns with the observations from the SEM analysis [19].
An FTIR analysis was conducted to determine the chemical bonds of the solid residue after pretreatment under optimal conditions (Figure 5 and Table 5). The FTIR analysis revealed the presence of hydroxyl groups (OH), as indicated by the absorption band in the region of 3445–3420 cm−1. Additionally, the band around 2930–2800 cm−1 suggests the existence of C–H stretching vibrations, providing insights into the chemical bonds present after pretreatment under optimal conditions [20]. The band observed at 1743 cm−1 can be attributed to the C–O stretching vibrations present in acetyl groups and carboxylic acids of hemicellulose [21]. The band around 1631 cm−1 indicates the presence of absorbed water, while absorption at 1464 cm−1 suggests the existence of aromatic group stretching [22]. The intense peak at 1508 cm−1 is related to C = C–C aromatic ring stretching [23]. Additionally, the peak at 1160 cm−1 is characteristic of C–O antisymmetric stretching in the hemicellulose structure [24]. Absorption peaks at 1100 cm−1 are associated with the cellulose structure, and the region between 1032 and 1033 cm−1 is related to the aromatic C–H groups of the lignin structure. Similarly, the band at 898 cm−1 signals the glycosidic linkages β–(1 → 4) in hemicellulose and cellulose structures [23]. Therefore, the FTIR analysis confirms the presence of key functional groups in cellulose, including hydroxyl (–OH) groups, C–H stretching vibrations, glycosidic β–(1 → 4) linkages, and C–O stretching. These functional groups indicate the structural integrity of cellulose and its retention after pretreatment.
Simultaneously, the elemental composition presented in Table 6 shows a slight decrease in the carbon (C) content from 56.31% in native sweet stalk sorghum to 55.70% after the pretreatment process. This indicates a minor reduction in carbon-rich compounds. Similarly, the hydrogen (H) content marginally decreased from 3.92% to 3.87%. In contrast, the nitrogen (N) content significantly declined from 0.64% to 0.23%, suggesting the effective removal of nitrogenous compounds. Meanwhile, the oxygen (O) content increased from 38.85% to 39.96%, reflecting an enrichment of oxygen-containing functional groups, which could be attributed to the removal of lignin and hemicellulose. The sulfur (S) content also slightly decreased from 0.28% to 0.24% for both native and pretreated samples, confirming the consistency of the analysis. The increase in the oxygen content corresponds to the relative enrichment of cellulose in the solid phase as cellulose contains a higher oxygen content compared to lignin and hemicellulose. These changes collectively highlight the impact of the LHW pretreatment in selectively modifying the biomass composition [25].
The results of the thermal decomposition analysis performed using the thermogravimetric technique are presented in Figure 6, which compares native sweet stalk sorghum and pretreated sweet stalk sorghum after undergoing the LHW pretreatment process. From the graph, it is evident that the pretreated sweet stalk sorghum exhibits distinct decomposition behavior compared to the native sweet stalk sorghum. In the temperature range of 200–350 °C, which indicates the decomposition of hemicellulose and part of the cellulose, it can be observed that the pretreated sample decomposes slightly slower than the native sample [26]. This slower decomposition is attributed to structural modifications in the hemicellulose and the reduction in lignin bonds that hold the structure together. These changes enhance the stability of hemicellulose and the disordered regions of cellulose, specifically in the C–O–C glycosidic bonds and C–H bonds [27].
In the temperature range of 350–450 °C, which represents the primary decomposition of cellulose, both pretreated and native samples exhibit rapid decomposition rates. This observation is consistent with the reduction in the lignin content due to the LHW process, which facilitates increased cellulose accessibility and minimizes bonds that hinder decomposition [27]. At temperatures above 450 °C, corresponding to lignin decomposition, both samples demonstrate similar thermal stability. This is due to lignin decomposing over a broad temperature range. The modifications induced by the LHW process, such as the reductions in hemicellulose and lignin, contribute to the enhanced thermal stability of cellulose in the pretreated sample. Consequently, the reductions in the hemicellulose and lignin contents through the LHW process improve enzyme accessibility to the cellulose structure in the pretreated sweet stalk sorghum [28,29].
Comparative studies corroborate these findings. The authors of [30] reported that cellulose pyrolysis initiates around 300 °C and peaks between 342 and 354 °C, while lignocellulose decomposition starts near 200 °C and extends up to 1000 °C, reflecting its complex structure and stability. Similarly, the authors of [31] observed that lignocellulose degradation occurs within the 300–550 °C range, with the highest conversion rate being seen at 451 °C. These consistent thermal degradation patterns across different studies reinforce the impact of the LHW pretreatment in reducing the lignin content, thereby enhancing cellulose decomposition and improving enzymatic accessibility in biomass materials.

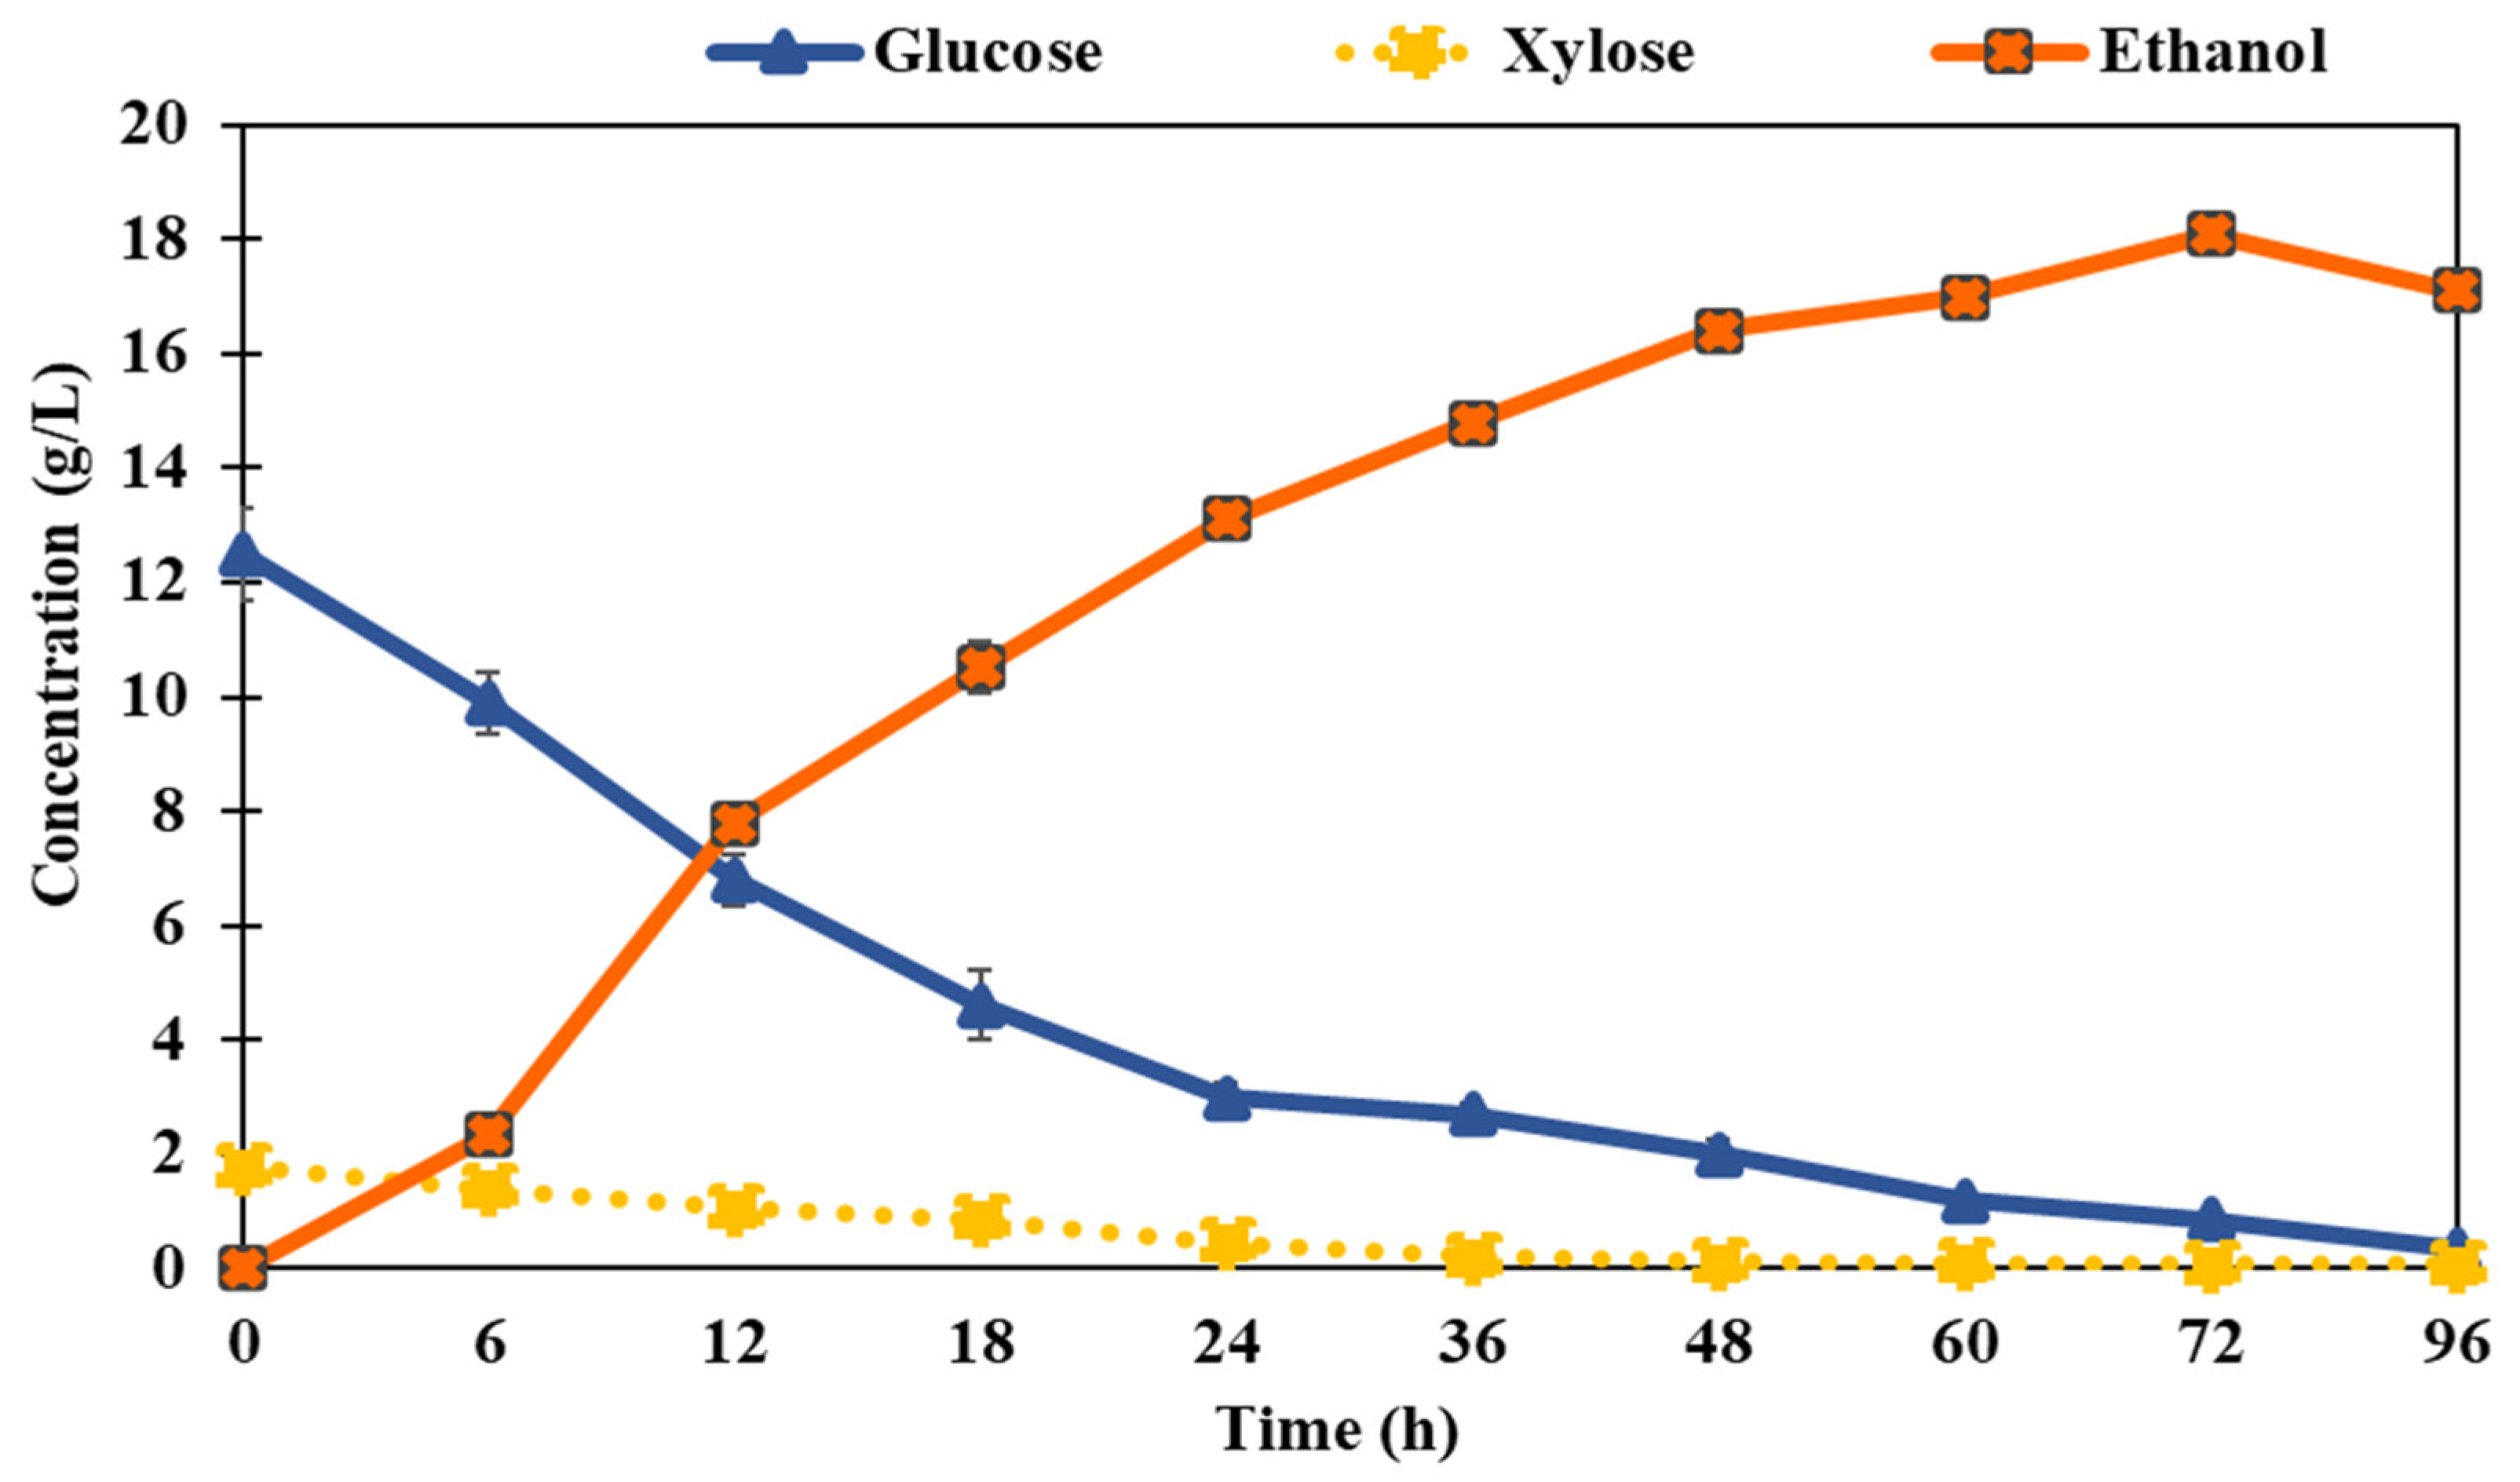
2.4. Ethanol Fermentation After the LHW Pretreatment Process

Ethanol production in sweet stalk sorghum samples pretreated with an H2SO4 concentration of 0.90% was carried out using the SSF method with the yeast strain Saccharomyces cerevisiae. As seen in the experimental results, all reducing sugars (glucose) were efficiently utilized during fermentation. Additionally, the process exhibited the lowest residual sugar concentration of 0.80 g/L, indicating efficient fermentation, as shown in Figure 7. These findings demonstrate the effectiveness of the pretreatment and fermentation process in maximizing the ethanol yield. The total content of reducing sugars ranged from 13.0 to 0.35 g/L during the 0–96 h pretreatment period with 0.90% H2SO4 catalyst and the highest ethanol concentration, 18.1 g/L, which occurred at 72 h under 25 FPU/g of substrate at pH 4.8. It was also observed that the ethanol concentration showed a decreasing rate after 72 h of fermentation at pH 4.8 and remained constant after 72 h. Meanwhile, the concentration of xylose (~1 g/L) remained constant throughout the process, indicating that the microorganism used in the system was unable to efficiently ferment xylose. This limitation could be a critical drawback of the SSF process when utilizing feedstocks with a significant xylose content.
The optimal pH value for ethanol production in fermentation reactors, particularly with the yeast strain Saccharomyces cerevisiae, is around 5 [31]. Previous studies have examined the conversion of lignocellulose to biofuel using alkaline and acidic chemical pretreatment processes prior to the enzymatic hydrolysis and yeast fermentation of cotton stalks. The findings indicate that pretreatment with H2SO4 resulted in the highest ethanol production, yielding 3.956 g/L, while the reducing sugar yield after enzymatic hydrolysis was measured at 178 mg/g [32]. These results highlight the effectiveness of acidic pretreatment in enhancing the availability of fermentable sugars for ethanol production.
Therefore, the results indicate that the SSF process has high potential for ethanol production from cellulose-rich feedstocks derived from the LHW pretreatment under optimal conditions. However, enhancing the efficiency of this process, particularly by employing microorganisms capable of fermenting xylose or improving the process environment, could further increase feedstock utilization and ethanol yield in the future.

3. Materials and Methods

3.1. Materials

Sweet stalk sorghum was collected from Si Mongkhon, Bung Samphan, Phetchabun, Thailand. The sweet stalk sorghum sample was dried at 70 °C within 24 h in a hot oven. The sweet stalk sorghum sample was shipped into small pieces and sieved to sizes ranging from 0.25 to 2.5 mm. The moisture content was determined by measuring the weight loss after drying the samples in an oven set at 105 °C. For this study, the prepared sweet stalk sorghum samples were stored in sealed plastic bags at room temperature. The procedures established by the National Renewable Energy Laboratory (NREL) were followed to analyze the chemical composition of both the native and pretreated sweet stalk sorghum [33]. Sulfuric acid (H2SO4, 98% purity) was selected as an acid catalyst in this study. The biomass composition of raw sweet stalk sorghum before pretreatment was analyzed using the NREL method, considering its major components. The composition of raw sweet stalk sorghum was found to contain cellulose (39.54 ± 0.12%), hemicellulose (23.31 ± 0.37%), acid-insoluble lignin (20.10 ± 0.83%), acid-soluble lignin (6.60 ± 0.91%), ash (6.05 ± 0.17%), and other components (4.40 ± 0.09%), expressed on a dry weight basis (wt%, dry basis).

3.2. LHW Pretreatment Process

LHW pretreatment of the sweet stalk sorghum sample was performed in a 700 mL batch reactor. The pretreatment used a ratio of 10 g/100 mL native sweet stalk sorghum to water with varying concentrations of H2SO4 catalyst (0.45–1.35%), temperatures (90–130 °C), and reaction times (60–120 min). Once the desired temperature and time were reached, the reaction was halted by immersing the reactor in a water bath. The pretreated solid biomass obtained after the LHW process was separated from the liquid phase using Whatman filter paper. The remaining solid was then washed with distilled water to remove impurities, neutralized to a pH of 7, dried in an oven at 70 °C for 24 h, and stored for future analysis. The monomeric sugars and inhibitory products in liquid fraction were analyzed using HPLC.

3.3. The Optimization for Cellulose Fractionation by RSM

The trial design process begins with a statistical analysis using the Box–Behnken design (BBD) approach and Design Expert software version 10.0.1. In the BBD, three levels of independent parameters were examined: temperature, residence time, and H2SO4 catalysts. The examination of the temperature (X1, 90–130 °C), residence time (X2, 60–120 min), and H2SO4 catalysts (X3, 0.45–1.35%), each coded at three levels (−1, 0, 1) of 15 experiments, including 3 replicates in the middle, was performed randomly. An analysis of variance was carried out for linear interaction and quadratic components. In addition, the second-order polynomial equation is presented as follows:
Y = β0 + β1X1 + β2X2 + β3X3 + β12 X1 X2 +β13 X1 X3 + β23 X2 X3 + β11 X21 +β22X22 +β33 X23
where Y is the projected response, while X1, X2, and X3 are the independent variables. The constant term is β0, while the linear coefficients are β1, β2, and β3. The interaction coefficients are β12, β13, and β23, while the quadratic coefficients are β11, β22, and β33, respectively.

3.4. Analysis of Cellulose

The elemental composition of the solid fraction was determined using the standard National Renewable Energy Laboratory (NREL) method [33]. Prior to analysis, the samples were dried to a constant weight to eliminate moisture. Subsequently, the solid samples were analyzed to assess the effectiveness of the pretreatment process and to ensure consistency in the characterization of the primary lignocellulosic components.

3.5. Analysis of Derivative Product in Aqueous Phase

The derivative products in the aqueous phase were analyzed using a liquid chromatograph (LDC model 4100, Shimadzu, Kyoto, Japan), which was equipped with a refractive index detector, a UV/Vis detector, and an Aminex HPX-87H column (Bio-Rad, Hercules, CA, USA). The fermentable sugars and inhibitory by-products were evaluated at 65 °C with a consistent flow rate of 0.5 mL/min in a mobile phase of 5 mM H2SO4.

3.6. Characterization of Native Sweet Stalk Sorghum Sample and Solid Residues After LHW

3.6.1. Elemental Analysis

The elemental composition of the native sweet stalk sorghum and the solid residues after pretreatment was quantified using an elemental analyzer CHNS-628 (LECO, Saint Joseph, MI, USA). The samples were placed in a vacuum evaporator and dried at 60 °C, 20 bars, to eliminate moisture. Afterward, the sample (0.1 g) was placed in a container and its carbon, hydrogen, and nitrogen contents were measured. For sulfur analysis, a 0.5 g sample was placed in a ceramic boat furnace and incinerated at 1350 °C, using a sulfur infrared (IR) cell to determine the sulfur content.

3.6.2. Scanning Electron Microscopy Analysis (SEM)

The microstructures of native and pretreated sweet stalk sorghum were analyzed using a JSM-6301 F scanning electron microscope (JEOL, Tokyo, Japan) to investigate morphological changes induced by the pretreatment process. Prior to imaging, the samples were thoroughly dried to eliminate residual moisture, thereby preventing potential artifacts. A thin layer of gold was then sputter-coated onto the samples to enhance electrical conductivity and mitigate charging effects. The microstructural characteristics were subsequently examined using a 5 kV electron beam to obtain high-resolution surface images.

3.6.3. X-Ray Diffraction Analysis (XRD)

Prepared and pretreated samples of native sweet stalk sorghum were subjected to X-ray crystallinity analysis. Crystallinity indexes were analyzed using an X’Pert PRO device (Panalytical, Almelo, The Netherlands) with Cu Kα radiation (λ = 0.1540 nm). The samples were scanned from 10° to 60° at a speed of 5°/min, and crystallinity was calculated using the following equation:
CrI = I 002 I amorphous I 002   ×   100
where I002 is the intensity for the crystalline portion of biomass (i.e., cellulose) at 2ϴ = 22.4, and Iamorphous is the peak of the amorphous portion (i.e., cellulose, hemicellulose, and lignin) at 2ϴ = 18.0.

3.6.4. Fourier-Transform Infrared Spectroscopy (FTIR)

The molecular structure and functional groups of the native sweet stalk sorghum stalk sample and solid residues were analyzed using Fourier-Transform Infrared (FTIR) spectroscopy to identify chemical bonds and structural modifications resulting from the pretreatment process. An FTIR spectrometer (model Perkin Elmer, Waltham, MA, USA) was used to evaluate materials at 400–4000 cm¹, with 32 scans for each sample.

3.6.5. Thermogravimetric Analysis (TGA)

The thermal stability of both the native and pretreated sweet stalk sorghum samples was analyzed using a TA Q50 thermogravimetric analyzer (TA Instruments Inc., New Castle, DE, USA). The analysis was performed under a controlled nitrogen atmosphere to prevent oxidative degradation, allowing for the assessment of weight loss as a function of temperature and the determination of thermal degradation profiles.
Samples, weighing 50 mg, were placed on an aluminum pan and heated from room temperature to approximately 1000 °C at a controlled rate of 5 °C/min under a nitrogen gas flow of 20–35 mL/min. The weight of the specimens was monitored as a function of temperature. A weight loss curve was generated, and its derivative was calculated to identify the temperature at which the maximum rate of weight loss occurred.
% Weight   Loss = Wi Wf Wi   ×   100
where Wi = the initial weight of the sample (mg); Wf = the final weight of the sample after decomposition (mg).

3.7. Procedures for Enzymatic Hydrolysis and Ethanol Product

Ethanol production from the pretreatment of sweet stalk sorghum was carried out in a 2.0 L reactor with a total working volume of 1.0 L (Biostat®b 2, B. Braun Bangkok, Thailand). The fermentation medium was prepared with 1 g of yeast extract, 5 g of (NH4)2SO4, and 0.025 g/L of MgSO4-7H2O, adjusted to pH 4.5, and included 6.25% pretreated sweet stalk sorghum under optimal conditions following the LHW procedure. Subsequently, the yeast medium was autoclaved at 121 °C for 15 min. The remaining solid residue was pre-digested at 50 °C with 25 FPU/g Cellic Ctec2, followed by 6 h of hydrolysis at 300 rpm. The yeast strain used in this study was S. cerevisiae (No. TISTR 5339). The sprout cells of this microorganism were injected into agar plates and incubated at 35 °C for 24 h. The mixture was then transferred to 150 mL Erlenmeyer flasks containing YPD media (H3PO4 and NH4OH, pH 4.8), incubated in a rotary shaker at 35 °C and 150 rpm, and fermented for 120 h. The concentrations of glucose and xylose, as well as ethanol, were measured using a high-performance liquid chromatograph model, Aminex HPX-87H column (Bio-Rad, Hercules, CA, USA). Additionally, the ethanol yield may be estimated as a percentage of ethanol production based on the experiment’s glucose concentration (0.511 g/g sugar) [34].
P e r c e n t a g e o f t h e p o t e n t i a l e t h a n o l y i e l d = e x p e r i m e n t a l   e t h a n o l   y i e l d g e t h a n o l g g l u c o s e t h e   p o t e n t i a l   e t h a n o l   y i e l d g e t h a n o l g g l u c o s e × 100
E x p e r i m e n t a l e t h a n o l y i e l d = e t h a n o l   c o n c e n t r a t i o n g L i n i t i a l   g l u c o s e   c o n c e n t r a t i o n g L

4. Conclusions

This study investigates the optimal conditions for the LHW pretreatment of sweet stalk sorghum using an acid catalyst. The pretreatment was carried out with 0.90% H2SO4 at 110 °C for 90 min under a pressure of 20 bar. In addition, the physical properties of the amorphous structure of the wheat bran before and after pretreatment were analyzed by SEM, XRD, and FTIR. Furthermore, the effects of this pretreatment on the crystallinity index and crystalline size of sweet stalk sorghum were analyzed. The results showed a significant increase in the crystallinity index from 56.32% to 67.10%, while the crystal size decreased from 2.83 nm to 2.51 nm, indicating an increase in crystallinity. The reason for this is that pretreatment with acid strongly disturbs the structure. The higher structure of the substrate leads to the digestibility of the cellulase and, thus, to a higher sugar yield. These findings highlight the effectiveness of the acid-catalyzed LHW pretreatment in enhancing the structural properties of sweet stalk sorghum, resulting in improved enzymatic digestibility and sugar yield. This study provides valuable insights into optimizing pretreatment conditions for efficient biomass conversion, which could contribute to the development of sustainable bioethanol production processes.

Author Contributions

Conceptualization, T.K., P.K. and S.I.; methodology, N.S.; software, C.C.; validation, K.S., T.K. and S.W.; formal analysis, P.K.; investigation, S.W.; resources, C.S.; data curation, S.I.; writing—original draft preparation, S.I.; writing—review and editing, S.I. and P.K.; visualization, K.S.; supervision, N.S.; project administration, T.K. and S.I.; funding acquisition, S.W. All authors have read and agreed to the published version of the manuscript.

Funding

This research was funded by Fundamental Fund 68 (5055/2567).

Data Availability Statement

Data are contained within the article.

Conflicts of Interest

The authors declare no conflicts of interest.

Abbreviations

LHWLiquid hot water pretreatment
RSMResponse surface method
NRELNational Renewable Energy Laboratory
SEMScanning electron microscopy analysis
XRDX-ray diffraction analysis
FTIRFourier-transform infrared spectroscopy
TGAThermogravimetric analysis

References

  1. Millward-Hopkins, J.; Steinberger, J.K.; Rao, N.D.; Oswald, Y. Providing decent living with minimum energy: A global scenario. Glob. Environ. Chang. 2020, 65, 102168. [Google Scholar] [CrossRef]
  2. Louw, J.; Dogbe, E.S.; Yang, B.; Görgens, J.F. Prioritisation of biomass-derived products for biorefineries based on economic feasibility: A review on the comparability of techno-economic assessment results. Renew. Sustain. Energy Rev. 2023, 188, 113840. [Google Scholar] [CrossRef]
  3. Kobayashi, H.; Fukuoka, A. Synthesis and utilisation of sugar compounds derived from lignocellulosic biomass. Green Chem. 2013, 15, 1740–1763. [Google Scholar] [CrossRef]
  4. Qi, B.; Vu, A.; Wickramasinghe, S.R.; Qian, X. Glucose production from lignocellulosic biomass using a membrane-based polymeric solid acid catalyst. Biomass Bioenergy 2018, 117, 137–145. [Google Scholar] [CrossRef]
  5. Chareonlimkun, A.; Champreda, V.; Shotipruk, A.; Laosiripojana, N. Reactions of C5 and C6-sugars, cellulose, and lig-nocellulose under hot compressed water (HCW) in the presence of heterogeneous acid catalysts. Fuel 2010, 89, 2873–2880. [Google Scholar] [CrossRef]
  6. Zhang, Q.; Wei, Y.; Han, H.; Weng, C. Enhancing bioethanol production from water hyacinth by new combined pre-treatment methods. Bioresour. Technol. 2018, 251, 358–363. [Google Scholar] [CrossRef] [PubMed]
  7. Nurfahmi; Ong, H.C.; Jan, B.M.; Tong, C.W.; Fauzi, H.; Chen, W.-H. Effects of organosolv pretreatment and acid hydrolysis on palm empty fruit bunch (PEFB) as bioethanol feedstock. Biomass Bioenergy 2016, 95, 78–83. [Google Scholar] [CrossRef]
  8. Saif Rehman, M.; Kim, I.; Chisti, Y.; Han, J.I. Use of ultrasound in the production of bioethanol from lignocellulosic biomass. Energy Educ. Sci. Technol. 2013, 30, 1391–1410. [Google Scholar]
  9. Klotz, M.; Oberschelp, C.; Salah, C.; Subal, L.; Hellweg, S. The role of chemical and solvent-based recycling within a sustainable circular economy for plastics. Sci. Total. Environ. 2023, 906, 167586. [Google Scholar] [CrossRef]
  10. Bhutto, A.W.; Qureshi, K.; Harijan, K.; Abro, R.; Abbas, T.; Bazmi, A.A.; Karim, S.; Yu, G. Insight into progress in pre-treatment of lignocellulosic biomass. Energy 2017, 122, 724–745. [Google Scholar] [CrossRef]
  11. Deshavath, N.N.; Veeranki, V.D.; Goud, V.V. Lignocellulosic feedstocks for the production of bioethanol availability, structure, and composition. Sustain. Bioenergy Adv. Impacts 2019, 1–19. [Google Scholar] [CrossRef]
  12. Martín-Lara, M.; Chica-Redecillas, L.; Pérez, A.; Blázquez, G.; Garcia-Garcia, G.; Calero, M. Liquid Hot Water Pretreatment and Enzymatic Hydrolysis as a Valorization Route of Italian Green Pepper Waste to Delivery Free Sugars. Foods 2020, 9, 1640. [Google Scholar] [CrossRef]
  13. Świątek, K.; Gaag, S.; Klier, A.; Kruse, A.; Sauer, J.; Steinbach, D. Acid Hydrolysis of Lignocellulosic Biomass: Sugars and Furfurals Formation. Catalysts 2020, 10, 437. [Google Scholar] [CrossRef]
  14. Bukhari, N.A.; Luthfi, A.A.I.; Rahim, N.A.; Nasrin, A.B.; Sukiran, M.A.; Loh, S.K. Biomass Deacetylation at Moderate Solid Loading Improves Sugar Recovery and Succinic Acid Production. Fermentation 2023, 9, 235. [Google Scholar] [CrossRef]
  15. Martín, C.; Dixit, P.; Momayez, F.; Jönsson, L.J. Hydrothermal Pretreatment of Lignocellulosic Feedstocks to Facilitate Biochemical Conversion. Front. Bioeng. Biotechnol. 2022, 10, 846592. [Google Scholar] [CrossRef]
  16. Xie, H.; Zhang, J.; Wang, Z. Enzymatic hydrolysis of lignocellulosic biomass from low to high solids loading. Biotechnol. Biofuels 2016, 9, 204. [Google Scholar]
  17. Zhang, J.; Chen, M.; Yang, R. Surfactant-assisted alkaline pretreatment and enzymatic hydrolysis of Miscanthus sinensis to improve sugar recovery. Front. Bioeng. Biotechnol. 2019, 7, 256. [Google Scholar]
  18. Kłosowski, G.; Mikulski, D. Changes in various lignocellulose biomasses structure after microwave-assisted hydrotropic pretreatment. Renew. Energy 2023, 219, 119387. [Google Scholar] [CrossRef]
  19. Meng, X.; Ragauskas, A.J. Recent advances in understanding the role of cellulose accessibility in enzymatic hydrolysis of lignocellulosic substrates. Curr. Opin. Biotechnol. 2014, 27, 150–158. [Google Scholar] [CrossRef]
  20. Hall, M.; Bansal, P.; Lee, J.H.; Realff, M.J.; Bommarius, A.S. Cellulose crystallinity—A key predictor of the enzymatic hydrolysis rate. FEBS J. 2010, 277, 1571–1582. [Google Scholar] [CrossRef]
  21. Thite, V.S.; Nerurkar, A.S. Valorization of sugarcane bagasse by chemical pretreatment and enzyme mediated decon-struction. Sci. Rep. 2019, 9, 15904. [Google Scholar] [CrossRef]
  22. Horikawa, Y.; Hirano, S.; Mihashi, A.; Kobayashi, Y.; Zhai, S.; Sugiyama, J. Prediction of Lignin Contents from Infrared Spectroscopy: Chemical Digestion and Lignin/Biomass Ratios of Cryptomeria japonica. Appl. Biochem. Biotechnol. 2019, 188, 1066–1076. [Google Scholar] [CrossRef] [PubMed]
  23. Popescu, C.M.; Vasile, C.; Popescu, M.C.; Singurel, G. Analytical methods for lignin characterization. II. Spectroscopic studies. Cellulose Chem. Technol. 2006, 40, 597–622. [Google Scholar]
  24. Zhuang, J.; Li, M.; Pu, Y.; Ragauskas, A.J.; Yoo, C.G. Observation of Potential Contaminants in Processed Biomass Using Fourier Transform Infrared Spectroscopy. Appl. Sci. 2020, 10, 4345. [Google Scholar] [CrossRef]
  25. Shi, J.; Xing, D.; Lia, J. FTIR Studies of the Changes in Wood Chemistry from Wood Forming Tissue under Inclined Treatment. Energy Procedia 2012, 16, 758–762. [Google Scholar] [CrossRef]
  26. Ragauskas, A.J.; Beckham, G.T.; Biddy, M.J.; Chandra, R.; Chen, F.; Davis, M.F.; Davison, B.H.; Dixon, R.A.; Gilna, P.; Keller, M.; et al. Lignin Valorization: Improving Lignin Processing in the Biorefinery. Science 2014, 344, 1246843. [Google Scholar] [CrossRef]
  27. Abolore, R.S.; Jaiswal, S.; Jaiswal, A.K. Green and sustainable pretreatment methods for cellulose extraction from lignocellulosic biomass and its applications: A review. Carbohydr. Polym. Technol. Appl. 2023, 7, 100396. [Google Scholar] [CrossRef]
  28. Long, Y.; Yu, Y.; Chua, Y.W.; Wu, H. Acid-catalysed cellulose pyrolysis at low temperatures. Fuel 2017, 193, 460–466. [Google Scholar] [CrossRef]
  29. Li, X.; Shi, Y.; Kong, W.; Wei, J.; Song, W.; Wang, S. Improving enzymatic hydrolysis of lignocellulosic biomass by bio-coordinated physicochemical pretreatment—A review. Energy Rep. 2022, 8, 696–709. [Google Scholar] [CrossRef]
  30. Zhou, H.; Long, Y.; Meng, A.; Chen, S.; Li, Q.; Zhang, Y. A novel method for kinetics analysis of pyrolysis of hemicellulose, cellulose, and lignin in TGA and macro-TGA. RSC Adv. 2015, 5, 26509–26516. [Google Scholar] [CrossRef]
  31. Singh, R.K.; Soni, B.; Patel, U.; Joshi, A.K.; Patel, S.K.S. Boosted Bio-Oil Production and Sustainable Energy Resource Recovery Through Optimizing Oxidative Pyrolysis of Banana Waste. Fuels 2025, 6, 3. [Google Scholar] [CrossRef]
  32. Malik, K.; Salama, E.-S.; Kim, T.H.; Li, X. Enhanced ethanol production by Saccharomyces cerevisiae fermentation post acidic and alkali chemical pretreatments of cotton stalk lignocellulose. Int. Biodeterior. Biodegradation 2020, 147, 104869. [Google Scholar] [CrossRef]
  33. Sluiter, A.; Hames, B.; Ruiz, R.; Scarlata, C.; Sluiter, J.; Templeton, D.; Crocker, D. Determination of structural carbohy-drates and lignin in biomass. In Laboratory Analytical Procedure (LAP); National Renewable Energy Laboratory: Golden, CO, USA, 2008. [Google Scholar]
  34. Khongchamnan, P.; Suriyachai, N.; Kreetachat, T.; Laosiripojana, N.; Weerasai, K.; Champreda, V.; Imman, S. Optimization of Liquid Hot Water Pretreatment and Fermentation for Ethanol Production from Sugarcane Bagasse Using Sac-charomyces cerevisiae. Catalysts 2022, 12, 463. [Google Scholar] [CrossRef]
Figure 1. (a) Normal plot of residuals; (b) predicted vs. actual.
Catalysts 15 00379 g001
Figure 2. (a1a3) Optimization of glucose yield using 3D RSM graphs of glucose yield (%) and (b1b3) interaction between temperature, time, and sulfuric catalyst concentration.
Catalysts 15 00379 g002
Figure 3. Scanning electron microscopy images showing (a) the native sweet stalk sorghum sample and (b) the solid residues that were pretreated with 0.90% sulfuric acid catalyst at 110 °C for 90 min, highlighting the formation of cellulose whiskers.
Catalysts 15 00379 g003
Figure 4. XRD analysis of pretreated sweet stalk sorghum compared to native sweet stalk sorghum following LHW pretreatment.
Catalysts 15 00379 g004
Figure 5. FTIR analysis of pretreated sweet stalk sorghum compared to native sweet stalk sorghum.
Catalysts 15 00379 g005
Figure 6. TGA of pretreated sweet stalk sorghum and native sweet stalk sorghum obtained after LHW pretreatment under optimal conditions.
Catalysts 15 00379 g006
Figure 7. Simultaneous saccharification and fermentation process for ethanol production.
Catalysts 15 00379 g007
Table 1. The influence of the factors of study on the glucose yield (%) of sweet stalk sorghum using the LHW pretreatment.
RunFactor AFactor BFactor CResponse Glucose
Yield (%) a
Temp
(°C)
Time (min)H2SO4 (%)Actual
Value
Predicted
Value
1110900.990.1190.53
2901200.963.4363.77
31301200.973.8974.55
4110900.991.0990.53
5130600.974.6274.27
61101201.3564.0964.19
790901.3561.5761.12
8110601.3565.3566.45
9110600.4563.6963.58
10130901.3572.8672.09
11110900.990.490.53
1290600.964.7664.10
13130900.4570.5370.97
141101200.4566.9265.81
1590900.4560.2360.99
a: Values based on the relative contents of cellulose in pretreated solids.
Table 2. Model accuracy details of glucose yield.
LitsAdj R-SquaredPred R-SquaredR-Squared
Glucose yield0.99010.94820.9964
Table 3. Response 1: ANOVA for response surface quadratic model of glucose yield after LHW pretreatment.
SourceSSdfMSF-Testp-Value
Model1610.689.00178.96157.91<0.0001
A-Temp219.561.00219.56193.72<0.0001
B-Time0.001.000.000.000.9773
C-H2SO40.781.000.780.690.4442
AB0.091.000.090.080.7893
AC0.251.000.250.220.6615
BC5.041.005.044.450.0887
A^2371.941.00371.94328.18<0.0001
B^2473.281.00473.28417.59<0.0001
C^2744.431.00744.43656.84<0.0001
Table 4. XRD analysis of pretreated sweet stalk sorghum compared to native sweet stalk sorghum.
LitsCrystallinity Index (%)Crystalline Size (nm)
Native sweet stalk sorghum56.322.83
Pretreated sweet stalk sorghum67.102.51
Table 5. FTIR analysis of pretreated sweet stalk sorghum compared to native sweet stalk sorghum under optimal conditions.
Wave Number (cm−1)Assignment
3445–3420Hydroxyl group (OH)
2930–2800C–H stretching vibrations
1743–1700C–O stretching vibrations
1631Absorbed water
1464Aromatic groups
1466–1508C = C–C aromatic ring stretching
1260–1230C–O stretching
1160C–O antisymmetric stretching
1130–1100Cellulose structure
1032–1033Aromatic C–H groups
898Glycosidic linked β–(1 → 4)
Table 6. Elemental analysis of native sweet stalk sorghum and pretreated sweet stalk sorghum sample in solid phase.
SampleElemental Analysis (wt.%)
CHNOSTotal (%)
Native sweet stalk sorghum56.313.920.6438.850.28100
Pretreated sweet stalk sorghum55.703.870.2339.960.24100
Disclaimer/Publisher’s Note: The statements, opinions and data contained in all publications are solely those of the individual author(s) and contributor(s) and not of MDPI and/or the editor(s). MDPI and/or the editor(s) disclaim responsibility for any injury to people or property resulting from any ideas, methods, instructions or products referred to in the content.

