Article

Enhanced Nitrate Production via Electrocatalytic Nitric Oxide Oxidation Reaction over MnO2 with Different Crystal Facets

1
Key Laboratory of Marine Chemistry Theory and Technology, Ministry of Education, College of Chemistry and Chemical Engineering, Ocean University of China, Qingdao 266100, China
2
Key Laboratory of Biofuels, Qingdao Institute of Bioenergy and Bioprocess Technology, Chinese Academy of Sciences, Qingdao 266101, China
3
Institute for New Energy Materials and Low-Carbon Technologies, Tianjin University of Technology, Tianjin 300384, China
*
Author to whom correspondence should be addressed.
Catalysts 2025, 15(4), 342; https://doi.org/10.3390/catal15040342
Submission received: 13 February 2025 / Revised: 13 March 2025 / Accepted: 24 March 2025 / Published: 1 April 2025
(This article belongs to the Section Electrocatalysis)

Abstract

:
The synthesis of nitrate (NO3) via electrocatalytic nitric oxide oxidation reaction (NOOR) is a green and efficient strategy for nitrogen fixation, which has great advantages over conventional nitrate synthesis. Notably, it also presents a promising solution for the remediation of NO pollutants. In this study, the structure–performance correlations of α-, β-, and δ-MnO2 catalysts were investigated. These three polymorphs of MnO2 exhibited disparate surface chemistries, NO adsorption capabilities, and NOOR catalytic activities. In a 1.0 M KOH electrolyte, α-MnO2, characterized by its large-sized (2 × 2) one-dimensional tunnel structure, demonstrated the most outstanding NOOR catalytic performance, which achieved a remarkable NO3 yield of 665.2 mg·h−1·mgcat−1 at a potential of 1.9 V, along with excellent stability and durability. Furthermore, a Zn-NO system was constructed, employing α-MnO2 as the anode and a Zn plate as the cathode. This innovative setup integrated an energy storage system with NO electrochemical capture, yielding a NO3 production rate of 265.5 mg·h−1·mgcat−1. The density functional theory calculations confirm the NO adsorption performance and catalytic activity of three different crystal forms of MnO2.

1. Introduction

Nitric oxide (NO) is a significant air pollutant in the atmosphere, and it can react with O2 to form NO2 [1,2,3], causing serious environmental problems, such as acid rain, photochemical smog, and ozone holes, and posing health hazards to the population [3,4,5]. Therefore, treating atmospheric NO has become a key strategy to control air pollution [6]. The most popular selective catalytic reduction (SCR) technology and the newly developed photocatalytic technology still suffer from problems like severe conditions, high cost, and limited efficiency [7,8]. Therefore, room temperature electrocatalytic denitrification is considered a sustainable route, with the advantages of mild conditions, green and low carbon, and high NO removal efficiency, addressing both energy and the environment concerns.
Recently, nitrate synthesis from NO has also been regarded as an effective approach for NO removal, in addition to NH3 synthesis through electrocatalytic NO reduction [8,9,10]. The traditional industrial nitrate synthesis process mainly generates NH3 from N2 and H2 through the Haber–Bosch process and then obtains nitrate through the oxidation of NH3 (Ostwald process), which requires high temperatures and pressures, increases energy consumption, and emits many greenhouse gases [11]. The electrocatalytic nitrate synthesis under mild conditions is green and sustainable, which could be an alternative approach to the traditional Haber–Bosch and Ostwald processes [12]. Compared with electrochemical nitrogen oxidation reaction (NOR), with limited efficiency and nitrate yield, electrocatalytic NO oxidation reaction (NOOR) is an easier approach to converting NO pollutant into high-value nitrate because NO has lower bond energy than the high dissociation energy of N≡N bonds [5,13]. In NOR, a Sr0.9RuO3 catalyst shows a NO3 yield of only 17.9 μmol·h−1·mgcat−1 [14], while RuO2@TiO2 as a NOOR catalyst achieves a NO3 yield of 95.22 mg·cm−2·h−1.
Although various precious metals and their related compounds have excellent NOOR performance, their drawbacks, such as limited reserves and high prices, greatly restrict their further development [15]. In contrast, abundant and inexpensive transition metal oxides exhibit excellent redox activity and have unfilled d-orbitals to gain and lose electrons. Therefore, they have critical applications in various fields, such as CO catalytic oxidation and methane-reforming oxidation [16], as well as NO oxidation [17]. The reported Co3O4/Ti is a suitable NOOR electrocatalyst with a maximum yield of 115.45 mg·cm−2·h−1 [17]. Other transition metal oxides have also been investigated, showing a thermal catalytic NO oxidation activity order of Mn > Cr > Co > Cu, among which MnOx has the most outstanding performance [13,18]. The catalytic activity of MnOx heavily relies on its chemical composition and crystal structure. Wang et al. found that the NO oxidation performances followed the order of MnO2 > Mn2O3 > Mn3O4, of which MnO2 had the highest NO oxidation activity [19]. The MnO2 crystalline phase is composed of octahedral [MnO6] units, and the diversity of [MnO6] connection modes leads to a relatively complex crystal structure of MnO2 [20,21]. The different phase structures result in different gas adsorption, diffusion, and catalytic reactions, significantly affecting the catalytic activity of MnO2 [22,23]. Liang et al. found that α-MnO2 has the best catalytic oxidation effect for CO oxidation [24]. Yang et al. analyzed the key factors affecting the catalytic activity of α-, β-, γ-, and δ-MnO2 for toluene oxidation [25]. Chen et al. also confirmed that MnO2@CeO2, with a high density of active oxygen vacancies, can exhibit significant thermal catalytic activity in NO oxidation reactions [26]. However, recent studies on NO oxidation by MnO2 have focused on thermal catalysis, and investigations into electrocatalytic NO oxidation are still insufficient.
Herein, we prepared α-, β-, and δ-MnO2 via a hydrothermal method and applied them as electrocatalysts for room temperature NOOR. Their electrocatalytic oxidation performance for NO was investigated in a three-electrode system. The effects of the quantity of low-valent Mn on the surface of various crystal structures, oxygen vacancies, and the NO adsorption properties on the catalytic activity of NOOR were systematically investigated by XPS, HRTEM, Raman characterization, and DFT calculations. Moreover, taking advantage of the outstanding catalytic ability of α-MnO2, a Zn-NO reaction device that integrates an energy-storage system with NOOR was demonstrated. This device not only enables the electrochemical capture and resource utilization of NO exhaust gas but also can form a zinc-NO3 battery to release electrical energy. In this way, it transforms pollutants into value-added products, showing great application prospects.

2. Results and Discussion

The typical crystalline phases and morphology of as-prepared MnO2 were investigated to probe the effect of its crystalline structure and electrochemical NOOR activity. The TXRD results (Figure 1a) confirm the successful synthesis of α-, β-, and δ-MnO2 catalysts, according to JCPDS 44-0141 (cryptomelane), JCPDS 24-0735 (pyrolusite), and JCPDS 80-1098 (birnessite), respectively. The sharp and narrow peaks of α- and β-MnO2 were attributed to their better crystallinity. In contrast, δ-MnO2 exhibited broad bands and lower crystallinity. This phenomenon was also evident in the HRTEM results and was consistent with previous research findings [21,25,27,28]. The SEM image of α-MnO2 (Figure 1b) presented a stacking-nanoneedle structure with a thickness of about 35 nm. Clear lattice stripes were observed in the HRTEM (Figure 1e), and the crystal plane spacing of 0.152 nm, 0.239 nm, and 0.181 nm corresponded to the α-MnO2 (521), (211), and (411) planes, respectively. β-MnO2 exhibited coarser and shorter size nanorods compared to α-MnO2, and HRTEM (Figure 1f), its regular lattice of dotted stripes, and the precise and uniform 0.311 nm crystallographic spacing matched well with the (110) facet, suggesting a high degree of ordering of β-MnO2. The δ-MnO2 manifested as polymerized flower-like nanosheets composed of thin nanosheets with a thickness of 10 nm. The HRTEM images (Figure 1g) displayed crystalline facet spacings of 0.218 nm and 0.225 nm, corresponding to the (−112) and (201) facet spacings. When compared with α- and β-MnO2, it was observed that δ-MnO2 was poorly crystallized and less ordered. This finding was in perfect accordance with what the XRD pattern indicated. Moreover, the TEM images (Figure S1) of the three catalysts exhibited a morphology resembling that observed in the SEM images.
The crystal structure of the crystalline phase of MnO2 generally consists of [MnO6] octahedral units, which form different tunneling or lamellar structures by sharing edges or corners [21,27]. α-MnO2 and β-MnO2 are the typical 1D tunneling structures of MnO2, and the common 2D layered structure is mainly δ-MnO2 (Figure S2). The structural and electronic properties of α-MnO2, β-MnO2, and δ-MnO2 were further investigated using XPS and Raman spectroscopy. As shown in Figure 2a, the XPS surface scanning spectra of α- and δ-MnO2 showed K elemental spikes, whereas β-MnO2 did not, and this result was consistent with that in previous reports [21,25]. This suggests that the 1D tunnel or 2D layer structures of α-MnO2 and δ-MnO2 could accommodate the presence of K+, and K+ was vital in balancing the charges of α- and δ-MnO2 in the crystal cells. In contrast, the β-MnO2 tunneling structure was narrow and could not accommodate the presence of K+ and the crystal structure. In addition to this, α- and δ-MnO2 had considerable lattice defects due to their intrinsic crystal defects or heterocations in tunnels, and a large number of [MnO6] edges were exposed in the structure, which tended to form more Mn2+ and Mn3+ on their surface [29], while β-MnO2 showed lower catalytic activity due to its regular [MnO6] octahedral arrangement, fewer ectopic sites, and a low percentage of Mn2+ and Mn3+ on the surface. Figure 2b shows the XPS spectra of Mn 2p3/2 for MnO2, and the peaks at 642.7 eV, 641.7 eV, and 640.6 eV could be attributed to Mn4+, Mn3+, and Mn2+, respectively [25,30]. The content of low-valence Mn (Mn3+ and Mn2+) was in the following descending order: α-MnO2 > δ-MnO2 > β-MnO2. The presence of Mn2+ and Mn3+ induced the generation of oxygen vacancies in the MnO2 skeleton to maintain electrostatic neutrality. Thus, the content of low-valence Mn was regarded as a characteristic parameter for the catalytic activity of the MnO2 surface [31,32]. Moreover, the bonds of Mn2+–O and Mn3+–O were weaker than that of Mn4+–O, and the presence of a large amount of low-valent manganese on the surface of α-MnO2 led to the weakening of the Mn–O bonds, which allowed the oxygen atoms on its surface to be more easily released for participation in oxidation [25]. Recent studies had found that K+ in the unique tunneling structure of MnO2 increased its electronic conductivity [33]. A low K/Mn atomic ratio was one of the reasons for the high Mn4+ ratio [21,34]. The XPS spectra of the O 1s of the samples are shown in Figure 2c, and the peaks at 533.4 eV, 531.7 eV, and 529.4 eV could be attributed to the surface hydroxyl oxygen (OadsO-H), surface adsorbed oxygen (Oads), and lattice oxygen (Olatt), respectively [25,29]. α-MnO2 showed the most Oads proportion, and Oads reacted more in oxidation reactions due to its high shift electrophilicity than Olatt [26]. The Raman spectrum in Figure 2d demonstrated that the band shifts of α-, β-, and β-MnO2 are at 630.8, 629.3, and 621.8 cm−1. The band shift could be ascribed to the enhanced symmetric stretching vibration [31]. According to the electroneutrality principle, oxygen vacancy formation is related to Mn3+ and Mn2+, and oxygen-added substances are mainly located on surface oxygen vacancies [35,36]. Therefore, the above results suggest that α-MnO2 might have higher activity in NO oxidation due to the many low-valent Mn cations and adsorbed oxygen.
The electrochemical properties of different crystalline phases of α-, β-, and δ-MnO2 were investigated by electrochemical tests. The electrochemically active surface area (ECSA) indicated the effective area of the electrode involved in the catalytic reaction, which was calculated and fitted by the CV curves of the catalysts at different scanning rates (Figure S3). As shown in Figure 3a, the slopes of the fitted curves for α-MnO2 were more significant than those for β-MnO2 and δ-MnO2, which suggests that α-MnO2 had a larger ECSA and a more substantial central activity. Regarding the electrochemical impedance spectroscopy (EIS) test, the Nyquist plots of α-, β-, and δ-MnO2 are shown in Figure 3b. The curve radius of α-MnO2 was the smallest, indicating that it had a lower charge-transfer impedance and faster electron-transfer rate, which were favorable for the electrocatalytic performance of α-MnO2. The electrocatalytic performances of different crystalline phases of MnO2 for NO oxidation was tested in a gas-tight electrolytic cell. Figure 3c presents the LSV curves of α-, β-, and δ-MnO2 for the NO oxidation reaction in a 1 M KOH solution. These curves clearly demonstrate that within the potential range of 1.0~2.4 V (vs. RHE), α-MnO2 exhibited a higher current density, greater surface oxidation activity, and more effective engagement in the reaction. When comparing the LSV curves obtained in an Ar-saturated 1 M KOH electrolyte, Figure 3d revealed a substantial increase in the current density of α-MnO2 in a NO atmosphere. This significant enhancement strongly implies that the NOOR reaction took place on the surface of the α-MnO2 electrode. A comparison of the LSV curves of bare carbon paper (CP) in a NO atmosphere (Figure 3e) showed that the current density of the bare CP at the same potential was significantly lower than that of the α-MnO2/CP electrode. This finding strongly suggests that the vast majority of the NOOR likely occurred on the surface of the α-MnO2 catalyst rather than on the surface of the CP. To evaluate and compare the electrocatalytic performance of the three catalysts for NOOR, the α-, β-, and δ-MnO2 electrodes were subjected to the NOOR reaction tests. These tests were carried out within the potential range of 1.6~2.0 V, with a constant NO gas flow rate maintained at 20 mL·min−1. The chronoamperometry curves for the reactions are presented in Figure 3f and Figure S4. In these curves, it can be observed that the current densities of all three samples rose as the potential increased. As anticipated, at the same potential, the α-MnO2 electrode exhibited the highest current density, while the β-MnO2 electrode showed the lowest. This observation is in line with the trend depicted in the LSV plot of Figure 3c.
The yields of the product NO3 and the by-product NO2 were essential indicators for evaluating the NOOR performance of the three catalysts to determine the optimum operating potential. The calibrated concentration–absorption peak curves of standard NaNO3 and NaNO2 solutions at different concentrations and the corresponding standard curves of NO3 and NO2 are shown in Figures S5 and S6. Figure 4a,b illustrates the yields of NO3 and NO2 for α-, β-, and δ-MnO2 catalysts at various potentials. Regarding the product NO3, the yields of β- and δ-MnO2 initially increased and then decreased as the potential rose within a specific range, reaching their maximum values at 1.9 V. In contrast, the NO3 yield of α-MnO2 showed a positive correlation with the applied potential, increasing steadily as the voltage varied from 1.6 V to 2.0 V. Evidently, at the same potential, the NO3 yield of α-MnO2 surpassed those of β- and δ-MnO2. Especially at 1.9 V and 2.0 V, the yields of α-MnO2 were 665.2 and 703.3 mg·h−1·mgcat−1, respectively, significantly higher than those of the other two catalysts. Regarding the by-product NO2, the yields of all three catalysts rose as the voltage increased. The yields of α-MnO2 were slightly higher than those of β- and δ-MnO2. Specifically, the yield of α-MnO2 reached 103.5 mg·h−1·mgcat−1 at 1.9 V and 128.6 mg·h−1·mgcat−1 at 2.0 V. At 1.9 V and 2.0 V, the NO3 yields of α-MnO2 showed little difference. However, there was a more significant disparity in the yields of the by-product. Taking into account the reaction economy and electrocatalytic activity, α-MnO2 emerged as the optimal electrocatalyst for the NOOR, and 1.9 V was identified as the optimal reaction potential. At the optimal potential, the bare CP in the control experimental group exhibited only a trace amount of NO3 output. Moreover, the yield of α-MnO2/CP was negligible under OCP in an Ar atmosphere (Figure 4c). It was hypothesized that the trace NO3 yield of the electrode in the Ar atmosphere can be attributed to the N2 dissolved in the electrolyte. The NO3 yields of bare CP were also measured at different potentials ranging from 1.6 V to 2.0 V (Figure S8), and the obtained yields were significantly lower than those of α-MnO2. Therefore, it can be concluded that the product nitrate is primarily generated via the NOOR taking place on the surface of the α-MnO2 catalyst. Compared to previously reported NOOR electrocatalytic materials, α-MnO2 exhibited the highest NO3 yield (Table S1).
Repeatability and stability are also important for assessing the NOOR performance of catalysts. The NOOR reaction was conducted at the α-MnO2 electrode for six cycles, each for 30 min, using LSV and chronoamperometry curves under optimal voltage and identical experimental conditions to evaluate the reproducibility and cyclic stability of α-MnO2 electrode. As shown in Figure S9, in the six-cycle experiments, the LSV and chronoamperometry curves of α-MnO2 overlapped, and the yields (Figure 4d) were nearly identical. This suggests that the α-MnO2 electrode demonstrated excellent stability and repeatability within a certain range. Furthermore, the long-term stability of the α-MnO2 electrode was tested for 12 h in a fixed volume electrolyte, with a constant NO intake maintained at 20 mL·min−1. Figure 4e showed a decreasing trend in the current density at the electrode during 12 h of continuous electrolysis, with a decrease of 18% before and after the reaction. It is hypothesized that part of this decrease can be attributed to the increase in the electrolyte mass-transfer resistance caused by the gradual rise in the product concentration in the electrolyte, which tends toward saturation. To eliminate this interference, the performance of the α-MnO2 electrode in the fresh electrolyte was tested both before and after the 12 h electrolysis. As depicted in the inset of Figure 4e, compared with the unreacted electrode, the electrode after 12 h of prolonged electrolysis did not show a significant decline in the LSV curve. The NO3 yields of the electrodes before and after electrolysis were examined separately to evaluate their electrocatalytic NOOR performance changes. Figure 4f showed that the NO3 yield of the α-MnO2 electrode decreased by about 6.1% after 12 h of continuous use, and the catalytic performance of the electrode decreased slightly, but not significantly. In conclusion, the α-MnO2 electrode exhibited excellent long-term reaction stability.
Inspired by the remarkable advancements in Zn-air batteries, we developed a Zn-NO reaction device, building upon previous studies [37,38]. This device harnesses the outstanding electrocatalytic capabilities of α-MnO2 for the NOOR, ingeniously integrating an energy storage system with the electrochemical capture of NO. By using NO as an energy carrier, it can effectively store renewable energy. During the discharge of the Zn-nitrate battery, NO is simultaneously converted into a high-value product NH3. In the operation process, NO was first directed through the Zn-NO reaction device to undergo the NOOR. As illustrated in Figure 5a, this device was separated by an anion-exchange membrane and employed α-MnO2 as the anode, Zn plate as the cathode, and 1 M KOH as the electrolyte. In the charge process, NO conducted a continuous oxidation reaction at the α-MnO2 electrode: NO + 4OH → NO3 + 3e + 2H2O. Additionally, the cathode reaction was 2H+ + 2e → H2. The produced NO3 can be further converted into NH4OH by the self-powered Zn-NO3 battery. In the discharge process, the Zn anode was consumed to produce electricity and discharge products (Figure 5b) through the following reactions: Zn + 2H+ → Zn2+ + H2 + 2e and NO3 + 7H2O + 8e → NH4OH + 9OH. The electrical energy released by this process could light up the light-emitting diode (Figure S10). Therefore, the Zn-NO device offered a two-fold advantage. On one hand, it effectively achieved the resource recovery and environmentally-friendly utilization of NO. On the other hand, it can function as a Zn-NO3 battery to generate and release electrical energy. Through this dual-function mechanism, it successfully accomplished the conversion of pollutants into valuable substances, thus demonstrating considerable application potential. The electrochemical performance of the Zn-NO cell was investigated. The OCV of the Zn-NO device was 1.4 V (vs. Zn), as shown in Figure 5c. The Zn-NO device was charged using multi-current steps at current densities of 0.0003, 0.005, 0.025, 0.07, and 0.12 mA· cm−2, which corresponded to the current densities in the three-electrode system at 1.6 V, 1.7 V, 1.8 V, 1.9 V, and 2.0 V (vs. RHE). As shown in Figure 5d, the device voltage remained stable throughout the reaction, reaching 1.84 V, 2.41 V, 3.07 V, 4.02 V, and 5.00 V (vs. Zn), respectively. The reaction achieved an optimum NO3 yield of 265.5 mg·h−1·mgcat−1 at 0.07 mA·cm−2, which was consistent with the optimal response current density in the three-electrode system. The α-MnO2-based Zn-nitrate battery with strong stability can power multiple light-emitting diodes (as shown in Figure S10), indicating its promising application prospects.
DFT calculations were carried out to explore the microstructure of these three MnO2. Previous studies had demonstrated a general correlation between the work functions of metal oxide cations in oxidized and reduced states. Specifically, cations in the oxidized state exhibited higher work functions than those in the reduced state [39]. Based on the characteristic XRD peaks of the three MnO2 in Figure 1a, the work functions of the (211) crystallographic plane of α-MnO2, the (101) plane of β-MnO2, and the (−111) plane of δ-MnO2 were calculated respectively. As illustrated in Figure 6, the work function of α-MnO2 (7.086 eV) was greater than that of β-MnO2 (4.968 eV) and δ-MnO2 (6.026 eV), indicating that the α-MnO2 had a stronger oxidizing property. The surface energies of the catalyst crystals and the chemisorption energies of the adsorbates were closely associated with the degree of antibonding filling in the surface–adsorbate interaction. Specifically, the higher the degree of antibonding filling, the weaker the interaction between the surface and the adsorbate [40]. Therefore, the bonding strength of NO molecules at different adsorption sites in the three-phase MnO2 can be quantified by the crystal-orbital Hamiltonian population (COHP). To this end, the integrated crystal-orbital Hamiltonian population (ICOHP) and the density of states (DOS) of Mn were calculated for the adsorption sites of α-, β-, and δ-MnO2. Figure 6d–f show the contribution of different adsorption sites of the three MnO2 to bonding (ICOHP > 0). In comparison with β- and δ-MnO2, α-MnO2 exhibited a more significant increase in the bonding strength between the substrate and the complex (as shown in Figure 6d). This indicates that there was a stronger interaction between NO and α-MnO2. The DOS calculation results (Figure S12) were consistent with this. After NO adsorption, the center of the d-band of α-MnO2 shifted positively, indicating that the catalyst surface had stronger adsorption for NO. This enhanced adsorption improved the catalytic ability of the catalyst [41]. Adsorption energy was used to indicate the strength of adsorption of an intermediate to a surface, with negative or positive adsorption energy indicating that the adsorption energy was energetically favorable or unfavorable to adsorption to the surface [42,43]. To further investigate the adsorption performance of different crystalline phases of MnO2 towards NO, the adsorption energies of NO adsorbed on three adsorption sites were calculated by taking the (001) crystalline surface of three phases of MnO2, as shown in Table 1. The NO adsorption energy of the three MnO2 followed the order α-MnO2 < δ-MnO2 < β-MnO2. α-MnO2 exhibited the lowest adsorption energy, and the adsorption and capture of NO were most likely at its adsorption site, which greatly enhanced the catalytic activity. From these results, it can be inferred that under the same reaction conditions, the differences in the oxidation capacities of the three crystalline phases of MnO2 towards NO may be associated with their distinct oxidation activities and surface adsorption energies.

3. Experiments

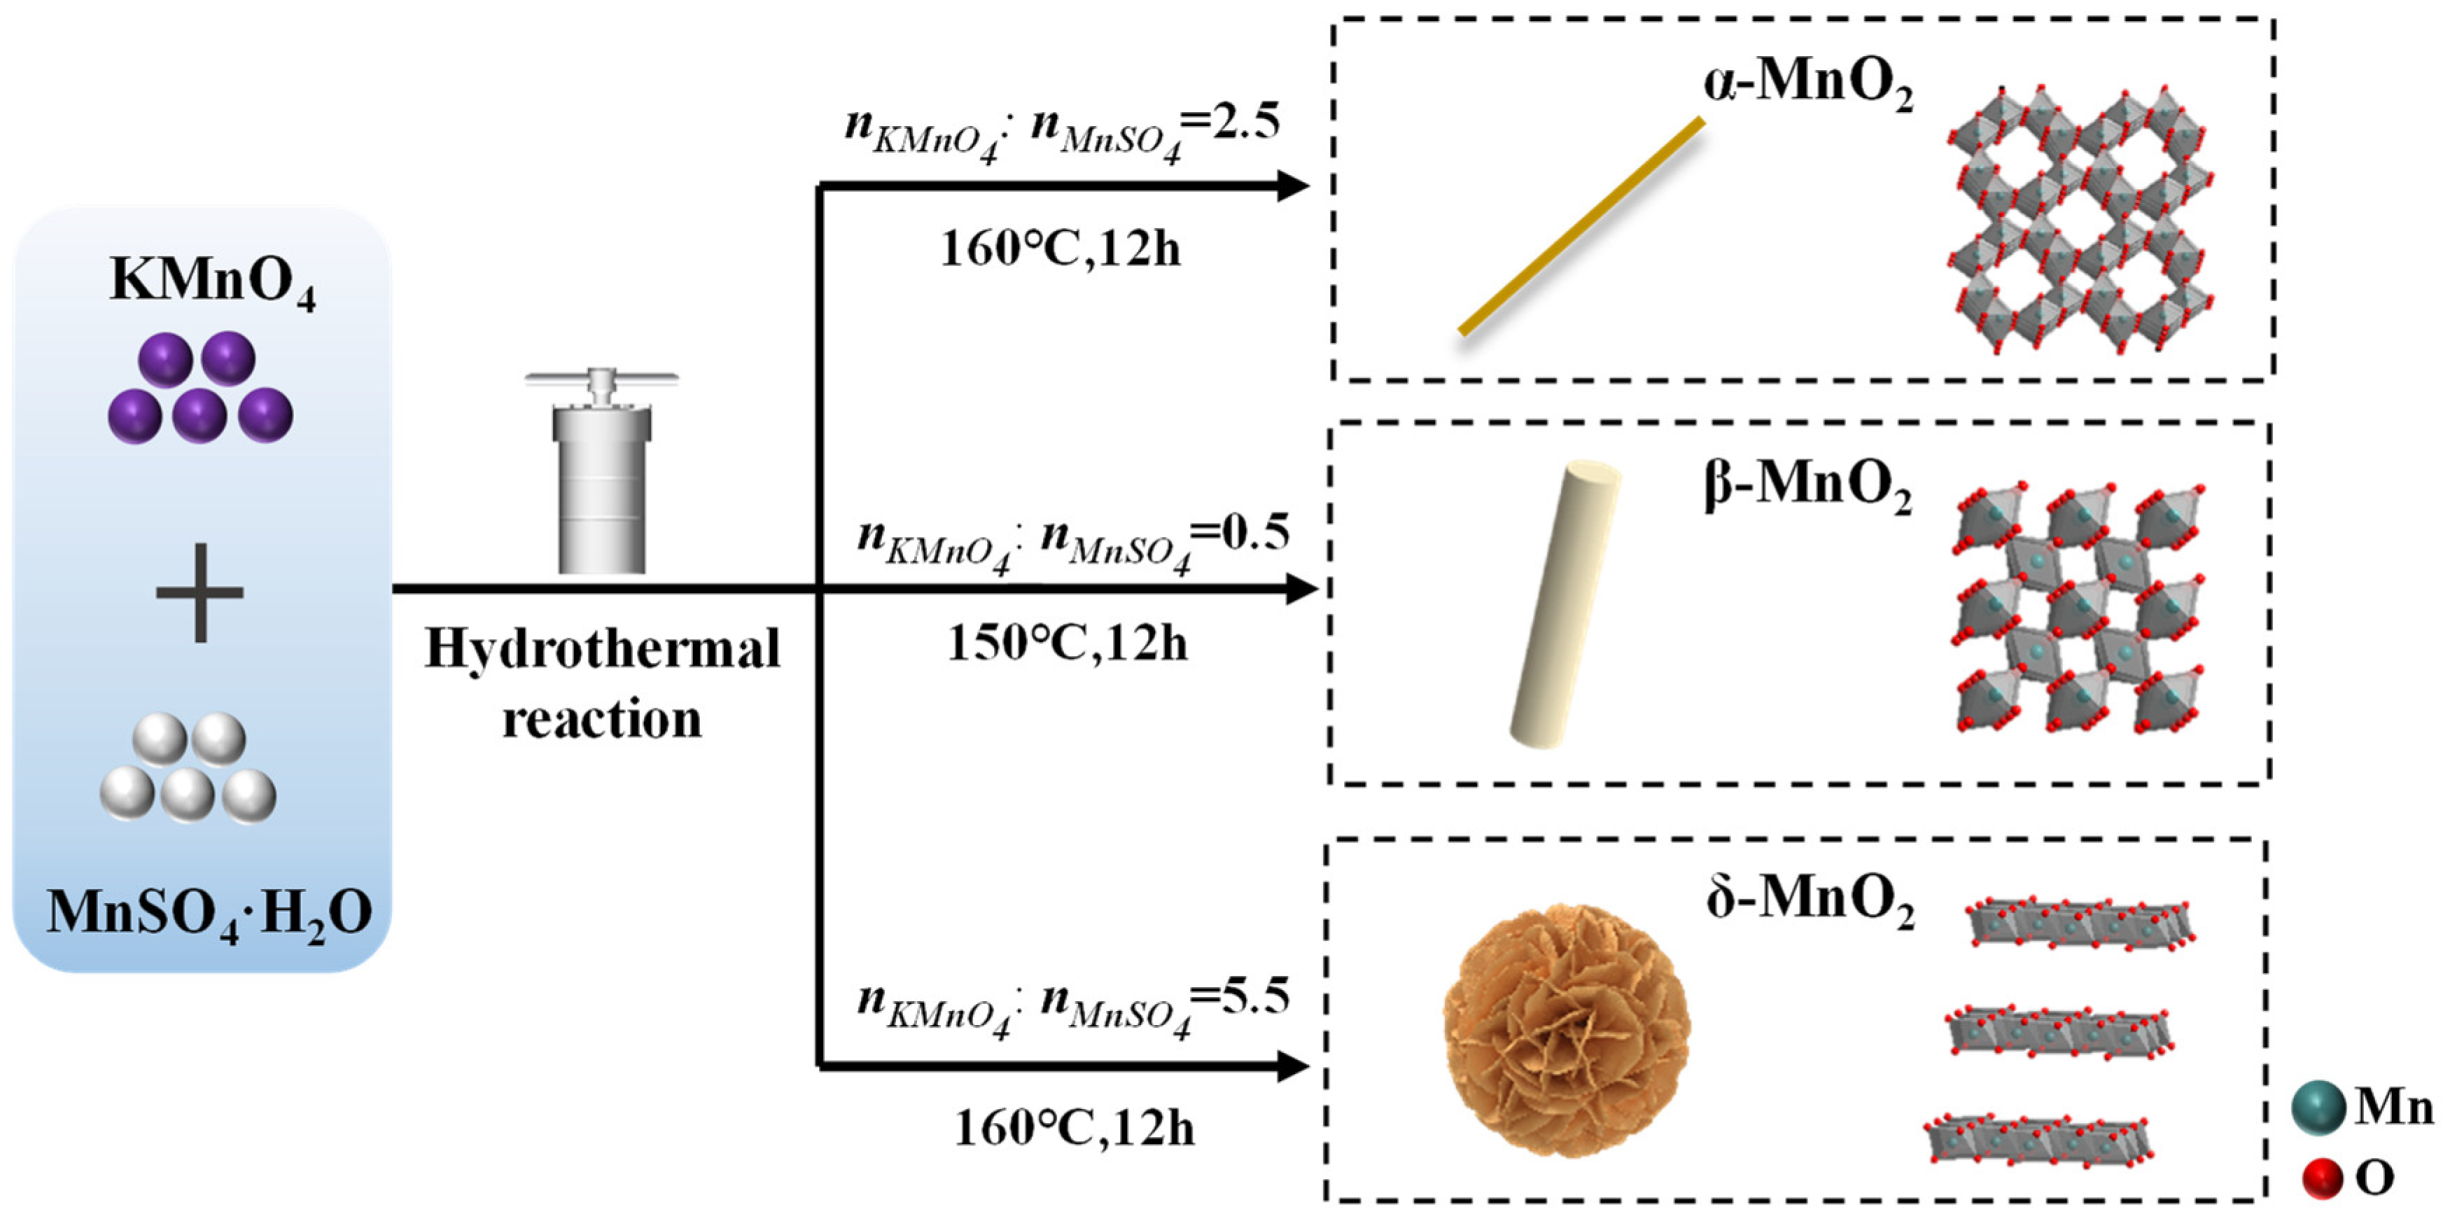
3.1. Synthesis Methods

We used a simple one-step hydrothermal method to synthesize α-, β- and δ-MnO2, respectively [25,44]. The typical procedures are illustrated in Figure 7, in which three MnO2 catalysts with different crystal structures were prepared by adjusting the molar ratios of KMnO4 and MnSO4·H2O (nKMnO4:nMnSO4·H2O = 2.5, 0.5, and 5.5) and then maintaining them at different reaction temperatures for 12h. The obtained catalysts were calcined in an air atmosphere at 360 °C for 2 h with a heating rate of 5 °C·min−1. Subsequently, α-, β-, and δ-MnO2 electrodes were fabricated on a carbon paper substrate. All electrochemical tests were carried out at room temperature under a NO gas flow rate of 20 mL·min−1. For specific details, please refer to the Supplementary Information (SI).

3.2. Material Characterization

The morphologies were characterized by scanning electron microscopy (SEM, Hitachi S-4800, Hitachi High-Tech Corporation, Tokyo, Japan) and high-resolution transmission electron microscopy (HRTEM, Jeol 2100F, JEOL Ltd., Tokyo, Japan). X-ray diffraction (XRD) patterns were collected by PANalytical X’pert PRO (Almelo, Netherlands) with Cu Kα radiation to determine the crystal phase of the catalyst samples. X-ray photoelectron spectroscopy (XPS) from the Thermo Scientific ESCALAB 250 Xi (Walthan, MA, USA) system analyzed the surface chemical state. Raman spectroscopy was performed on a Finder Vista Laser micro-Raman Spectroscopy (Zolix Instruments CO., Ltd., Wuhan, China). Absorption spectra were obtained using a UV–visible spectrophotometer (UV-1800, Shimadzu Corporation, Tokyo, Japan).

3.3. Electrochemical Measurement

The electrochemical performances of the α-, β-, and δ-MnO2 electrodes were tested using an electrochemical workstation (CS300, Corrtest Instruments, Wuhan, China). Electrochemical tests such as linear scanning voltammetry (LSV), cyclic voltammetry (CV), chronoamperometry (CA), electrochemical impedance spectroscopy (EIS), and electrochemically active surface area (ECSA) of the catalysts were accomplished under ambient conditions at room temperature and atmospheric pressure. The NOOR experiments were performed in a 1.0 M KOH electrolyte using a three-electrode H-cell system consisting of a piece of the MnO2 electrode, a platinum rod, and a Hg/HgO electrode as the working, counter, and reference electrodes, respectively. The α-, β-, and δ-MnO2 catalysts were loaded on carbon paper (CP) with an area of 1 × 1.5 cm2. All potentials were converted to the RHE:
E RHE = E Hg / HgO + 0.098   V + 0.059 × pH
Before the start of the experiment, Ar was passed at a flow rate of 15 mL·min−1 to expel the air from the electrolytic cell and to avoid the influence of N2 on the accuracy of the experiment. During the NOOR experiment, NO (10 vol%) gas flowed uniformly into the electrolytic cell at a 20 mL·min−1 flow rate. Magnetic stirring at 500 rpm was used to assist in the complete dissolution of NO and to ensure the accuracy of the results during sampling and testing. The LSV was scanned at a rate of 10 mV·s−1, and CV measured the ECSA of the catalyst in the non-Faraday region at scanning rates of 10, 20, 40, 60, 80, and 100 mV·s−1, respectively. The EIS was tested over the frequency range of 1000 kHz–0.1 Hz.

3.4. Catalyst Activity Evaluation

The NOOR activity of the electrocatalysts was assessed by calculating the product NO3 and the by-product NO2 yield rate (mg·h−1·mgcat−1). The yield rate was computed using the following equations:
NO 3   yield = c NO 3 × V / t × m cat
NO 2   yield = c NO 2 × V / t × m cat
where c (mg·mL−1) is the measured concentration of NO3 and NO2, determined by UV spectrophotometry, V (mL) is the electrolyte volume, t (h) is the electrolysis time, and mcat is the mass of the catalyst.

3.5. Computational Details

The electronic and microstructural analysis of MnO2 in three different crystalline phases was performed using CASTEP and Dmol3 of the Materials Studio. Based on the XRD of the three MnO2, the work function was calculated to explore their electron release capabilities. A differential charge density analysis was performed to investigate the electronic density of the (001) crystal plane of the three MnO2 phases. The adsorption capacity of NO at the top site, bridge site, and hollow site exposed to the (001) plane of three MnO2 was investigated, and the N=O bonding strengths and the changes in the density of states and d-band centers of Mn atoms before and after NO adsorption were investigated. The adsorption sites in the (001) surface of the three MnO2 are shown in Figure 8. The following formula calculates the adsorption energy.
E ad = E total E NO E *
where Ead, Etotal, ENO, and E* represent the adsorption energy, the total energy of the catalyst and NO in the model, the energy of the NO molecule, and the catalyst’s energy, respectively. The truncation energy used in the calculations is 641.7 eV, and the k-point is set in 3 × 3 × 2.

4. Conclusions

In this paper, the different catalytic properties of three different crystalline MnO2 for NOOR were investigated. Electrochemical tests showed that α-, β-, and δ-MnO2 with disparate structures exhibited different surface chemistries and NOOR activities. In the 1.0 M KOH electrolyte, α-MnO2 possessed the best NOOR catalytic ability, with a NO3 yield of 665.2 mg·h−1·mgcat−1 at a potential of 1.9 V, and has good stability and durability. In the Zn-NO device assembled with α-MnO2 as the anode, the optimum NO3 yield was 265.5 mg·h−1·mgcat−1 by combining the energy storage system with NOOR. In addition, the adsorption behavior of NO adsorption by three MnO2 was investigated using DFT calculations, and the adsorption energies, work functions, and densities of states were calculated for the different crystalline surfaces and adsorption structures. The study of the adsorption activity yielded that the catalytic activity of MnO2 for NOOR showed α-MnO2 > β-MnO2 > δ-MnO2, which was basically consistent with the experimental results. It is hoped that these results can provide some research ideas for the utilization of MnO2 for NO electrochemical capture and pollutant resource utilization.

Supplementary Materials

The following supporting information can be downloaded at https://www.mdpi.com/article/10.3390/catal15040342/s1. Figure S1: SEM and TEM images under low magnification of α-MnO2 (a-b), β-MnO2 (c-d), 和δ-MnO2 (e-f); Figure S2: Structures of manganese oxide reported here in this study: (a) α-MnO2 (2 × 2 tunnel, cryptomelane), (b) β-MnO2 (1 × 1 tunnel, pyrolusite), and (c) δ-MnO2 (layered, birnessite); Figure S3: CV curves at various scan rates (10, 20, 40, 60, 80, and 100 mV/s) for (a) α-MnO2, (b) β-MnO2, and (c) δ-MnO2; Figure S4: i-t curves for (a) δ-MnO2 and (b) β-MnO2 in 1M KOH electrolytes; Figure S5: (a) UV-vis absorption spectra of various nitrate concentrations. (b) The calibration curve was used to quantify nitrate concentration; Figure S6: (a) UV-vis absorption spectra of various nitrite concentrations. (b) The calibration curve was used to quantify nitrite concentration; Figure S7: XPS spectra of C 1s; Figure S8: Nitrate yield of bare CP at different potentials; Figure S9: LSV curves of the α-MnO2 electrode cyclic tests (inset: i-t curves of the electrode at 1.9V potential); Figure S10: (a) Zn-NO device charging stability; (b) LED lights are illuminated with the assembled Zn-nitrate battery; Figure S11: Differential charge density on the (001) plane of (a), (d) α-MnO2; (b), (e) β-MnO2; (c), (f) δ-MnO2; Figure S12: (a) α-MnO2, (b) β- MnO2, and (c) δ-MnO2 protocells, DOS, and d-band centers of Mn at the top, bridge, and hollow adsorption sites; Table S1: Comparison of the nitrate yield of α-MnO2 with the recently reported NOOR catalysts [45].

Author Contributions

Conceptualization, X.Q. and W.W.; investigation, X.Q., Q.L., and M.W.; formal analysis, X.Q., Q.L., and M.W.; resources, D.S., X.L., and M.W.; data curation, X.Q.; writing—original draft preparation, X.Q. and W.W.; writing—review and editing, W.W.; project administration, W.W.; supervision, W.W.; funding acquisition, W.W. All authors have read and agreed to the published version of the manuscript.

Funding

The authors acknowledge the support from the Natural Science Foundation of Shandong Province (ZR2021MB075); the National Natural Science Foundation of China (51602297); and the Fundamental Research Funds for the Central Universities, Ocean University of China (grant number 202461021 and 202364004).

Data Availability Statement

The data are contained within this article and its Supporting Information.

Conflicts of Interest

The authors declare no conflicts of interest.

References

  1. Wang, D.; He, N.; Xiao, L.; Dong, F.; Chen, W.; Zhou, Y.; Chen, C.; Wang, S. Coupling Electrocatalytic Nitric Oxide Oxidation over Carbon Cloth with Hydrogen Evolution Reaction for Nitrate Synthesis. Angew. Chem. Int. Ed. 2021, 60, 24605–24611. [Google Scholar] [CrossRef]
  2. Li, S.; Shang, H.; Tao, Y.; Li, P.; Pan, H.; Wang, Q.; Zhang, S.; Jia, H.; Zhang, H.; Cao, J.; et al. Hydroxyl Radical-Mediated Efficient Photoelectrocatalytic NO Oxidation with Simultaneous Nitrate Storage Using a Flow Photoanode Reactor. Angew. Chem. Int. Ed. 2023, 62, e202305538. [Google Scholar]
  3. Long, J.; Chen, S.; Zhang, Y.; Guo, C.; Fu, X.; Deng, D.; Xiao, J. Direct Electrochemical Ammonia Synthesis from Nitric Oxide. Angew. Chem. Int. Ed. 2020, 59, 9711–9718. [Google Scholar] [CrossRef]
  4. Adalder, A.; Paul, S.; Ghorai, U.K. Progress of Electrochemical Synthesis of Nitric Acid: Catalyst Design, Mechanistic Insights, Protocol and Challenges. J. Mater. Chem. A 2023, 11, 10125–10148. [Google Scholar] [CrossRef]
  5. Yan, C.; Tham, Y.J.; Nie, W.; Xia, M.; Wang, H.; Guo, Y.; Ma, W.; Zhan, J.; Hua, C.; Li, Y.; et al. Increasing Contribution of Nighttime Nitrogen Chemistry to Wintertime Haze Formation in Beijing Observed during COVID-19 Lockdowns. Nat. Geosci. 2023, 16, 975–981. [Google Scholar] [CrossRef]
  6. Sumathi, S.; Bhatia, S.; Lee, K.T.; Mohamed, A.R. Selection of Best Impregnated Palm Shell Activated Carbon (PSAC) for Simultaneous Removal of SO2 and NOx. J. Hazard. Mater. 2010, 176, 1093–1096. [Google Scholar] [CrossRef]
  7. Xiao, S.; Wan, Z.; Zhou, J.; Li, H.; Zhang, H.; Su, C.; Chen, W.; Li, G.; Zhang, D.; Li, H. Gas-Phase Photoelectrocatalysis for Breaking Down Nitric Oxide. Environ. Sci. Technol. 2019, 53, 7145–7154. [Google Scholar] [CrossRef]
  8. Li, B.; Shen, D.; Xiao, Z.; Li, Q.; Yao, S.; Wang, W.; Liu, L. The In Situ Decoration of Ti3C2 Quantum Dots on Cu Nanowires for Highly Efficient Electrocatalytic Reduction of Nitric Oxide to Ammonia. Inorg. Chem. Front. 2023, 10, 5927–5936. [Google Scholar] [CrossRef]
  9. Luo, R.; Li, B.-J.; Wang, Z.-P.; Chen, M.-G.; Zhuang, G.-L.; Li, Q.; Tong, J.-P.; Wang, W.-T.; Fan, Y.-H.; Shao, F. Two-Dimensional MOF Constructed by a Binuclear-Copper Motif for High-Performance Electrocatalytic NO Reduction to NH3. JACS Au 2024, 4, 3823–3832. [Google Scholar] [CrossRef]
  10. Hao, M.; Shen, D.; Li, Q.; Xiao, Z.; Liu, L.; Li, C.; Wang, W. The Combination of Hydrogen Evolution, Nitric Oxide Oxidation and Zn-Nitrate Battery for Energy Conversion and Storage by an Efficient Nitrogen-Dopped CoOX Electrocatalyst with Turing Structure. J. Colloid Interface Sci. 2025, 683, 477–488. [Google Scholar] [CrossRef]
  11. Chen, J.G.; Crooks, R.M.; Seefeldt, L.C.; Bren, K.L.; Bullock, R.M.; Darensbourg, M.Y.; Holland, P.L.; Hoffman, B.; Janik, M.J.; Jones, A.K.; et al. Beyond Fossil Fuel–Driven Nitrogen Transformations. Science 2018, 360, eaar6611. [Google Scholar] [CrossRef] [PubMed]
  12. Guo, M.; Fang, L.; Zhang, L.; Li, M.; Cong, M.; Guan, X.; Shi, C.; Gu, C.; Liu, X.; Wang, Y.; et al. Pulsed Electrocatalysis Enabling High Overall Nitrogen Fixation Performance for Atomically Dispersed Fe on TiO2. Angew. Chem. Int. Ed. 2023, 135, e202217635. [Google Scholar] [CrossRef]
  13. Miao, R.; Chen, D.; Guo, Z.; Zhou, Y.; Chen, C.; Wang, S. Recent Advances in Electrocatalytic Upgrading of Nitric Oxide and Beyond. Appl. Catal. B Environ. 2024, 344, 123662. [Google Scholar] [CrossRef]
  14. Zheng, H.; Ma, Z.; Liu, Y.; Zhang, Y.; Ye, J.; Debroye, E.; Zhang, L.; Liu, T.; Xie, Y. Perovskite Oxide as A New Platform for Efficient Electrocatalytic Nitrogen Oxidation. Angew. Chem. Int. Ed. 2024, 63, e202316097. [Google Scholar] [CrossRef]
  15. Zhang, L.; Liang, J.; He, X.; Yang, Q.; Luo, Y.; Zheng, D.; Sun, S.; Zhang, J.; Yan, H.; Ying, B.; et al. Integrating RuO2@TiO2 Catalyzed Electrochemical Chlorine Evolution with a NO Oxidation Reaction for Nitrate Synthesis. Inorg. Chem. Front. 2023, 10, 2100–2106. [Google Scholar] [CrossRef]
  16. Wu, F.; Huang, Y.; Wang, D. Experimental Study on Supported MnO2-Based Catalysts for NO Oxidation. React. Kinet. Mech. Cat. 2023, 136, 251–266. [Google Scholar] [CrossRef]
  17. Liang, J.; Zhang, L.; He, X.; Wang, Y.; Luo, Y.; Zheng, D.; Sun, S.; Cai, Z.; Zhang, J.; Ma, K.; et al. Redox Mediators Promote Electrochemical Oxidation of Nitric Oxide toward Ambient Nitrate Synthesis. J. Mater. Chem. A 2023, 11, 1098–1107. [Google Scholar] [CrossRef]
  18. Boningari, T.; Pappas, D.K.; Smirniotis, P.G. Metal Oxide-Confined Interweaved Titania Nanotubes M/TNT (M = Mn, Cu, Ce, Fe, V, Cr, and Co) for the Selective Catalytic Reduction of NOx in the Presence of Excess Oxygen. J. Catal. 2018, 365, 320–333. [Google Scholar] [CrossRef]
  19. Wang, H.; Chen, H.; Wang, Y.; Lyu, Y.-K. Performance and Mechanism Comparison of Manganese Oxides at Different Valence States for Catalytic Oxidation of NO. Chem. Eng. J. 2019, 361, 1161–1172. [Google Scholar] [CrossRef]
  20. Li, Y. The Exploration and Comparison of Adsorption Mechanisms in MnO2 with Different Crystal Structures for Capacitive Deionization. Desalination 2024, 577, 117387. [Google Scholar] [CrossRef]
  21. Meng, Y.; Song, W.; Huang, H.; Ren, Z.; Chen, S.-Y.; Suib, S.L. Structure-Property Relationship of Bifunctional MnO2 Nanostructures: Highly Efficient, Ultra-Stable Electrochemical Water Oxidation and Oxygen Reduction Reaction Catalysts Identified in Alkaline Media. J. Am. Chem. Soc. 2014, 136, 11452–11464. [Google Scholar] [CrossRef] [PubMed]
  22. Yang, R.; Guo, Z.; Cai, L.; Zhu, R.; Fan, Y.; Zhang, Y.; Han, P.; Zhang, W.; Zhu, X.; Zhao, Q.; et al. Investigation into the Phase–Activity Relationship of MnO2 Nanomaterials toward Ozone-Assisted Catalytic Oxidation of Toluene. Small 2021, 17, 2103052. [Google Scholar] [CrossRef] [PubMed]
  23. Chen, L.; Ren, S.; Xing, X.; Yang, J.; Li, J.; Yang, J.; Liu, Q. Effect of MnO2 Crystal Types on CeO2@MnO2 Oxides Catalysts for Low-Temperature NH3-SCR. J. Environ. Chem. 2022, 10, 108239. [Google Scholar] [CrossRef]
  24. Liang, S.; Teng, F.; Bulgan, G.; Zong, R.; Zhu, Y. effect of phase structure of MnO2 Nanorod Catalyst on the Activity for CO Oxidation. J. Phys. Chem. C 2008, 112, 5307–5315. [Google Scholar] [CrossRef]
  25. Yang, W.; Su, Z.; Xu, Z.; Yang, W.; Peng, Y.; Li, J. Comparative Study of α-, β-, γ- and δ-MnO2 on Toluene Oxidation: Oxygen Vacancies and Reaction Intermediates. Appl. Catal. B Environ. 2020, 260, 118150. [Google Scholar] [CrossRef]
  26. Chen, L.; Zhang, C.; Li, Y.; Chang, C.-R.; He, C.; Lu, Q.; Yu, Y.; Duan, P.; Zhang, Z.; Luque, R. Hierarchically Hollow MnO2 @CeO2 Heterostructures for NO Oxidation: Remarkably Promoted Activity and SO2 Tolerance. ACS Catal. 2021, 11, 10988–10996. [Google Scholar] [CrossRef]
  27. Yang, R.; Fan, Y.; Ye, R.; Tang, Y.; Cao, X.; Yin, Z.; Zeng, Z. MnO2—Based Materials for Environmental Applications. Adv. Mater. 2021, 33, 2004862. [Google Scholar] [CrossRef]
  28. Yang, J.; Ren, S.; Zhou, Y.; Hu, G.; Jiang, L.; Cao, J.; Liu, W.; Yao, L.; Kong, M.; Yang, J.; et al. Insight into N2O Formation Over Different Crystal Phases of MnO2 During Low-Temperature NH3–SCR of NO. Catal. Lett. 2021, 151, 2964–2971. [Google Scholar] [CrossRef]
  29. Su, H.; Liu, J.; Hu, Y.; Ai, T.; Gong, C.; Lu, J.; Luo, Y. Comparative Study of α- and β-MnO2 on Methyl Mercaptan Decomposition: The Role of Oxygen Vacancies. Nanomaterials 2023, 13, 775. [Google Scholar] [CrossRef]
  30. Xu, J.; Wu, Z.; Gao, E.; Zhu, J.; Yao, S.; Li, J. Revealing the Role of Oxygen Vacancies on α-MnO2 of Different Morphologies in CO Oxidation Using Operando DRIFTS-MS. Appl. Surf. Sci. 2023, 618, 156643. [Google Scholar] [CrossRef]
  31. Fu, Z.; Wang, D.; Yao, Y.; Gao, X.; Liu, X.; Wang, S.; Yao, S.; Wang, X.; Chi, X.; Zhang, K.; et al. Local Electric Field Induced by Atomic-Level Donor–Acceptor Couple of O Vacancies and Mn Atoms Enables Efficient Hybrid Capacitive Deionization. Small 2023, 19, 2205666. [Google Scholar] [CrossRef]
  32. Zhu, G.; Zhu, W.; Lou, Y.; Ma, J.; Yao, W.; Zong, R.; Zhu, Y. Encapsulate α-MnO2 Nanofiber within Graphene Layer to Tune Surface Electronic Structure for Efficient Ozone Decomposition. Nat. Commun. 2021, 12, 4152. [Google Scholar] [CrossRef] [PubMed]
  33. Yuan, Y.; Zhan, C.; He, K.; Chen, H.; Yao, W.; Sharifi-Asl, S.; Song, B.; Yang, Z.; Nie, A.; Luo, X.; et al. The Influence of Large Cations on the Electrochemical Properties of Tunnel-Structured Metal Oxides. Nat. Commun. 2016, 7, 13374. [Google Scholar] [CrossRef] [PubMed]
  34. Zhu, G.; Zhu, J.; Li, W.; Yao, W.; Zong, R.; Zhu, Y.; Zhang, Q. Tuning the K+ Concentration in the Tunnels of α-MnO2 to Increase the Content of Oxygen Vacancy for Ozone Elimination. Environ. Sci. Technol. 2018, 52, 8684–8692. [Google Scholar] [CrossRef]
  35. Zhang, T. Electrospun YMn2O5 Nanofibers: A Highly Catalytic Activity for NO Oxidation. Appl. Catal. B Environ. 2019, 247, 133141. [Google Scholar] [CrossRef]
  36. Wang, F.; Dai, H.; Deng, J.; Bai, G.; Ji, K.; Liu, Y. Manganese Oxides with Rod-, Wire-, Tube-, and Flower-Like Morphologies: Highly Effective Catalysts for the Removal of Toluene. Environ. Sci. Technol. 2012, 46, 4034–4041. [Google Scholar] [CrossRef]
  37. Ma, L.; Chen, S.; Yan, W.; Zhang, G.; Ying, Y.; Huang, H.; Ho, D.; Huang, W.; Zhi, C. A High-Energy Aqueous Zn‖NO2 Electrochemical Cell: A New Strategy for NO2 Fixation and Electric Power Generation. Energy Environ. Sci. 2023, 16, 1125–1134. [Google Scholar] [CrossRef]
  38. Li, Q.; Xiao, Z.; Jia, W.; Li, Q.; Li, X.; Wang, W. Copper Nanowires Decorated with TiO2−x from MXene for Enhanced Electrocatalytic Nitrogen Oxidation into Nitrate under Vacuum Assistance. Nano Res. 2023, 16, 12357–12362. [Google Scholar] [CrossRef]
  39. Greiner, M.T.; Chai, L.; Helander, M.G.; Tang, W.; Lu, Z. Transition Metal Oxide Work Functions: The Influence of Cation Oxidation State and Oxygen Vacancies. Adv. Funct. Mater. 2012, 22, 4557–4568. [Google Scholar] [CrossRef]
  40. Guo, L.; Li, R.; Jiang, J.; Zou, J.-J.; Mi, W. Electrocatalytic Performance of Mn-Adsorbed g-C3N4: A First-Principles Study. J. Mater. Chem. A 2021, 9, 26266–26276. [Google Scholar] [CrossRef]
  41. Ye, X.; Jiang, X.; Chen, L.; Jiang, W.; Wang, H.; Cen, W.; Ma, S. Effect of Manganese Dioxide Crystal Structure on Adsorption of SO2 by DFT and Experimental Study. Appl. Surf. Sci. 2020, 521, 146477. [Google Scholar] [CrossRef]
  42. Zhang, J.; Yang, H.B.; Zhou, D.; Liu, B. Adsorption Energy in Oxygen Electrocatalysis. Chem. Rev. 2022, 122, 17028–17072. [Google Scholar] [CrossRef] [PubMed]
  43. Wang, Y.; Qiu, W.; Song, E.; Gu, F.; Zheng, Z.; Zhao, X.; Zhao, Y.; Liu, J.; Zhang, W. Adsorption-Energy-Based Activity Descriptors for Electrocatalysts in Energy Storage Applications. Natl. Sci. Rev. 2018, 5, 327–341. [Google Scholar] [CrossRef]
  44. Ong, Y.-P.; Ho, L.-N.; Ong, S.-A.; Banjuraizah, J.; Ibrahim, A.H.; Thor, S.-H.; Yap, K.-L. A Highly Sustainable Hydrothermal Synthesized MnO2 as Cathodic Catalyst in Solar Photocatalytic Fuel Cell. Chemosphere 2021, 263, 128212. [Google Scholar] [CrossRef]
  45. Wu, A.; Lv, J.; Xuan, X.; Zhang, J.; Cao, A.; Wang, M.; Wu, X.; Liu, Q.; Zhong, Y.; Sun, W.; et al. Electrocatalytic Disproportionation of Nitric Oxide Toward Efficient Nitrogen Fixation. Adv. Energy Mater. 2023, 13, 2204231. [Google Scholar] [CrossRef]
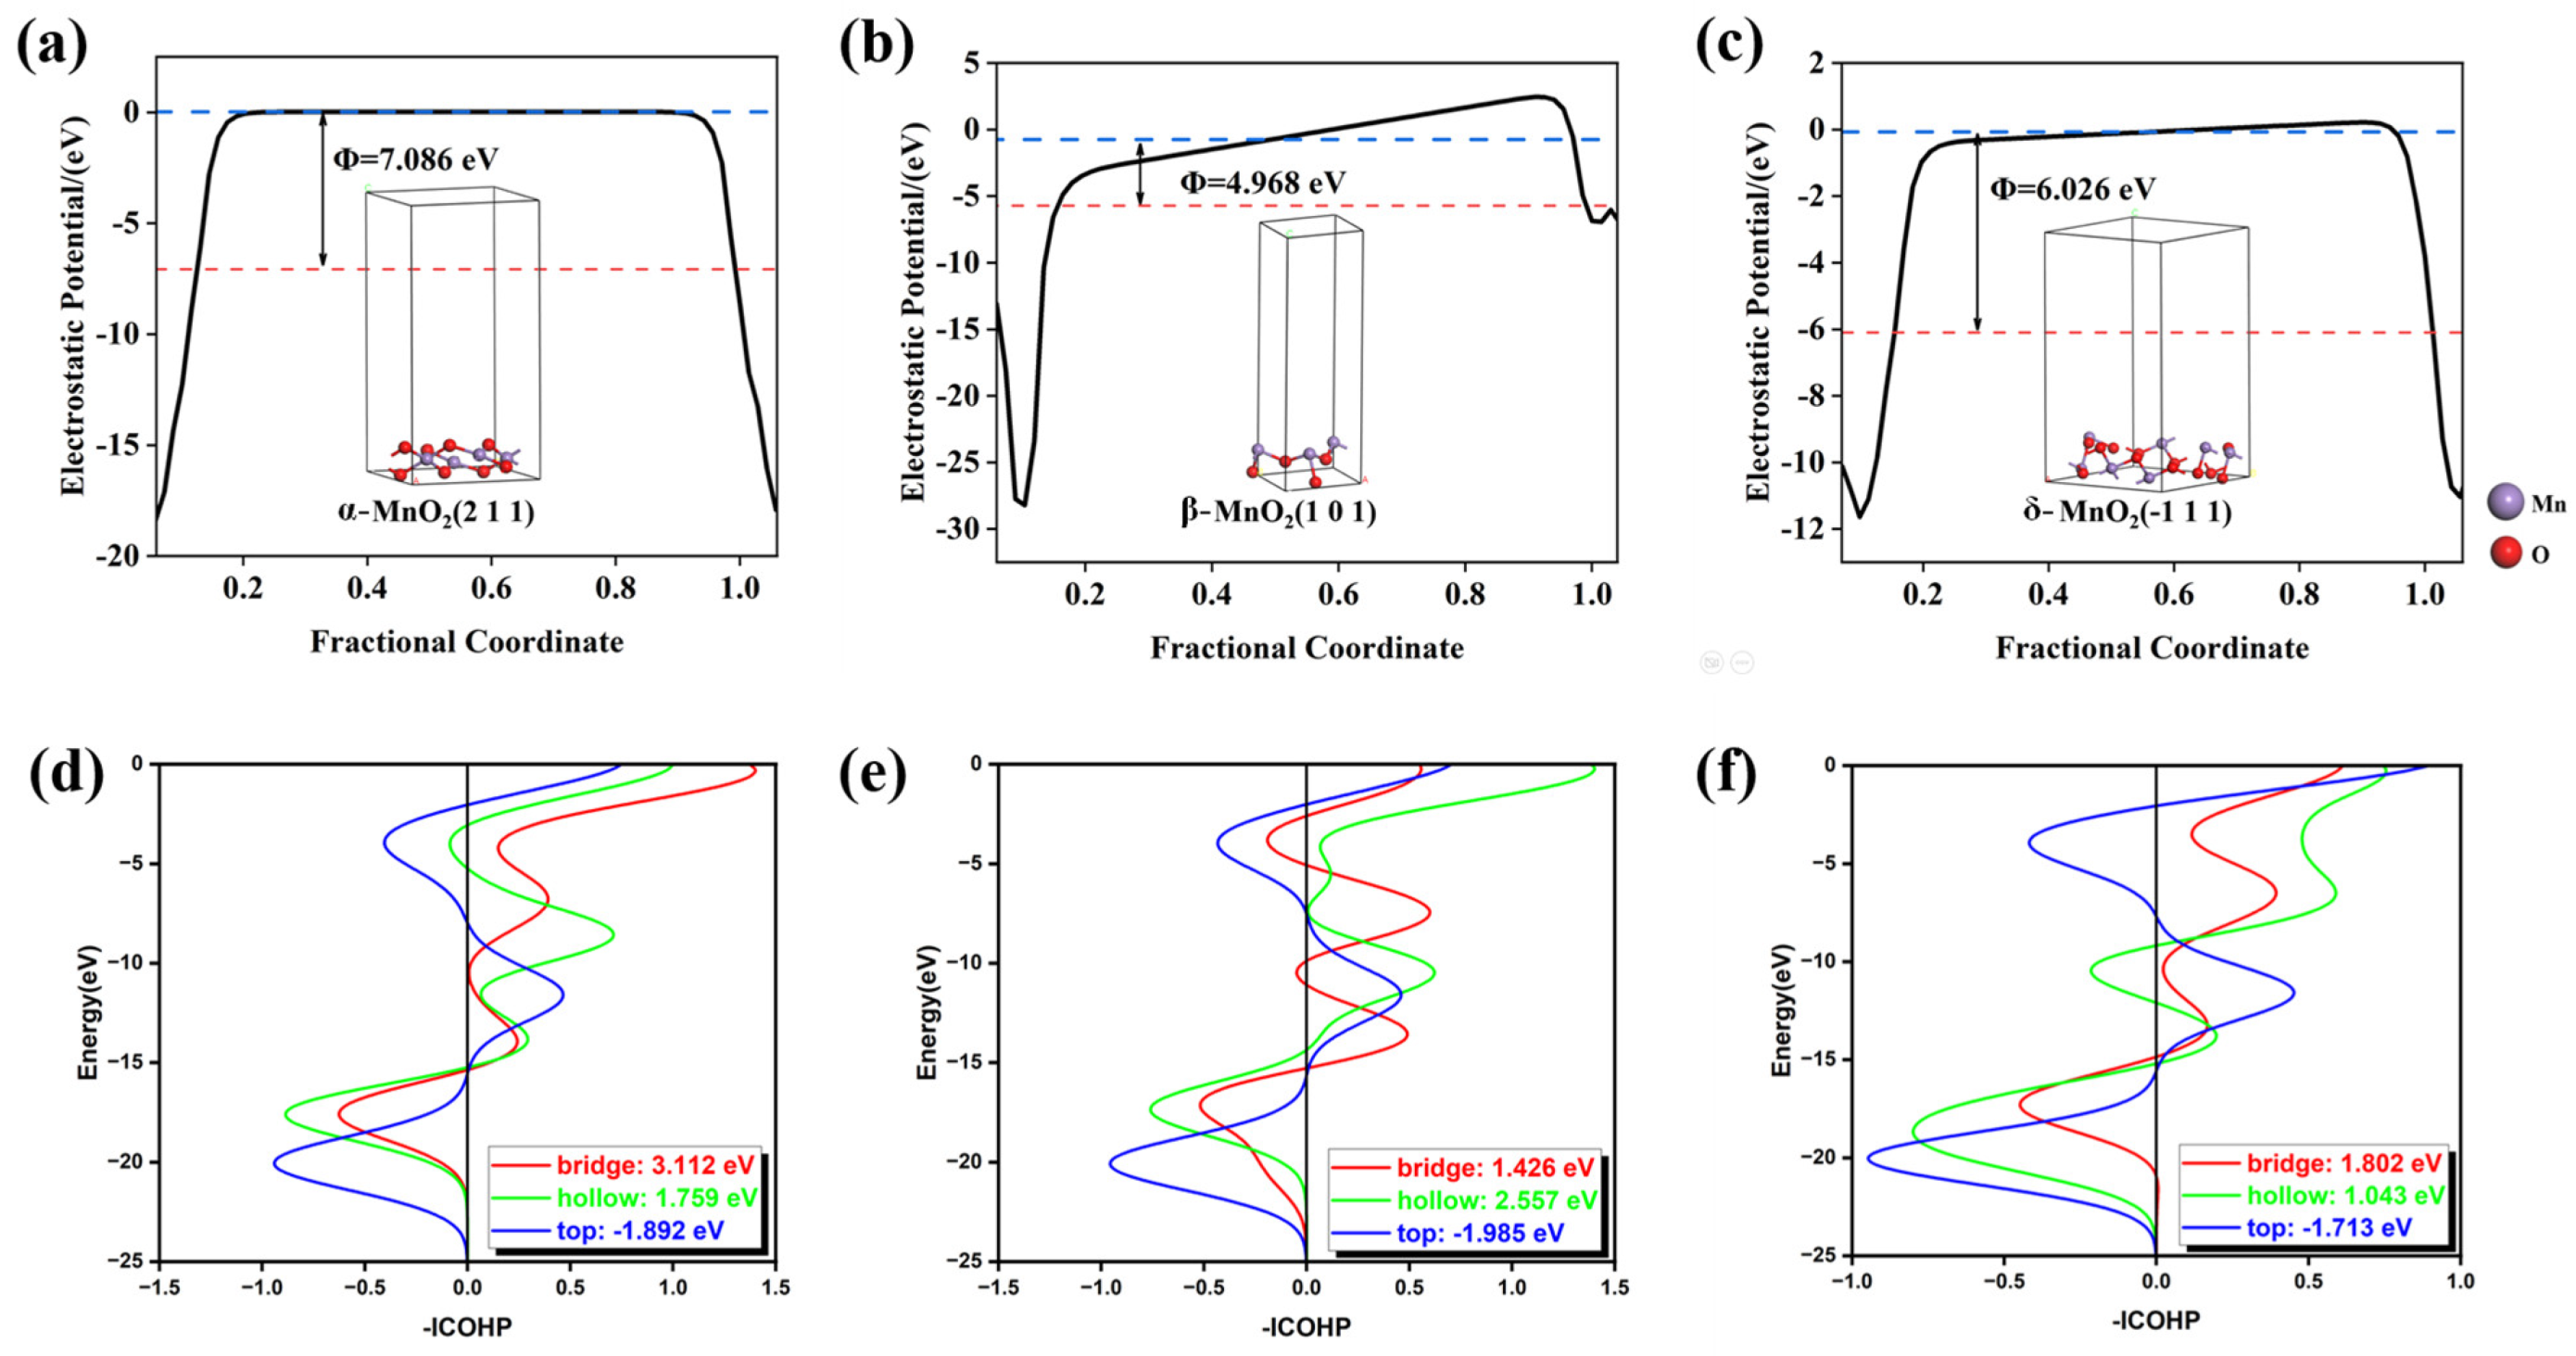
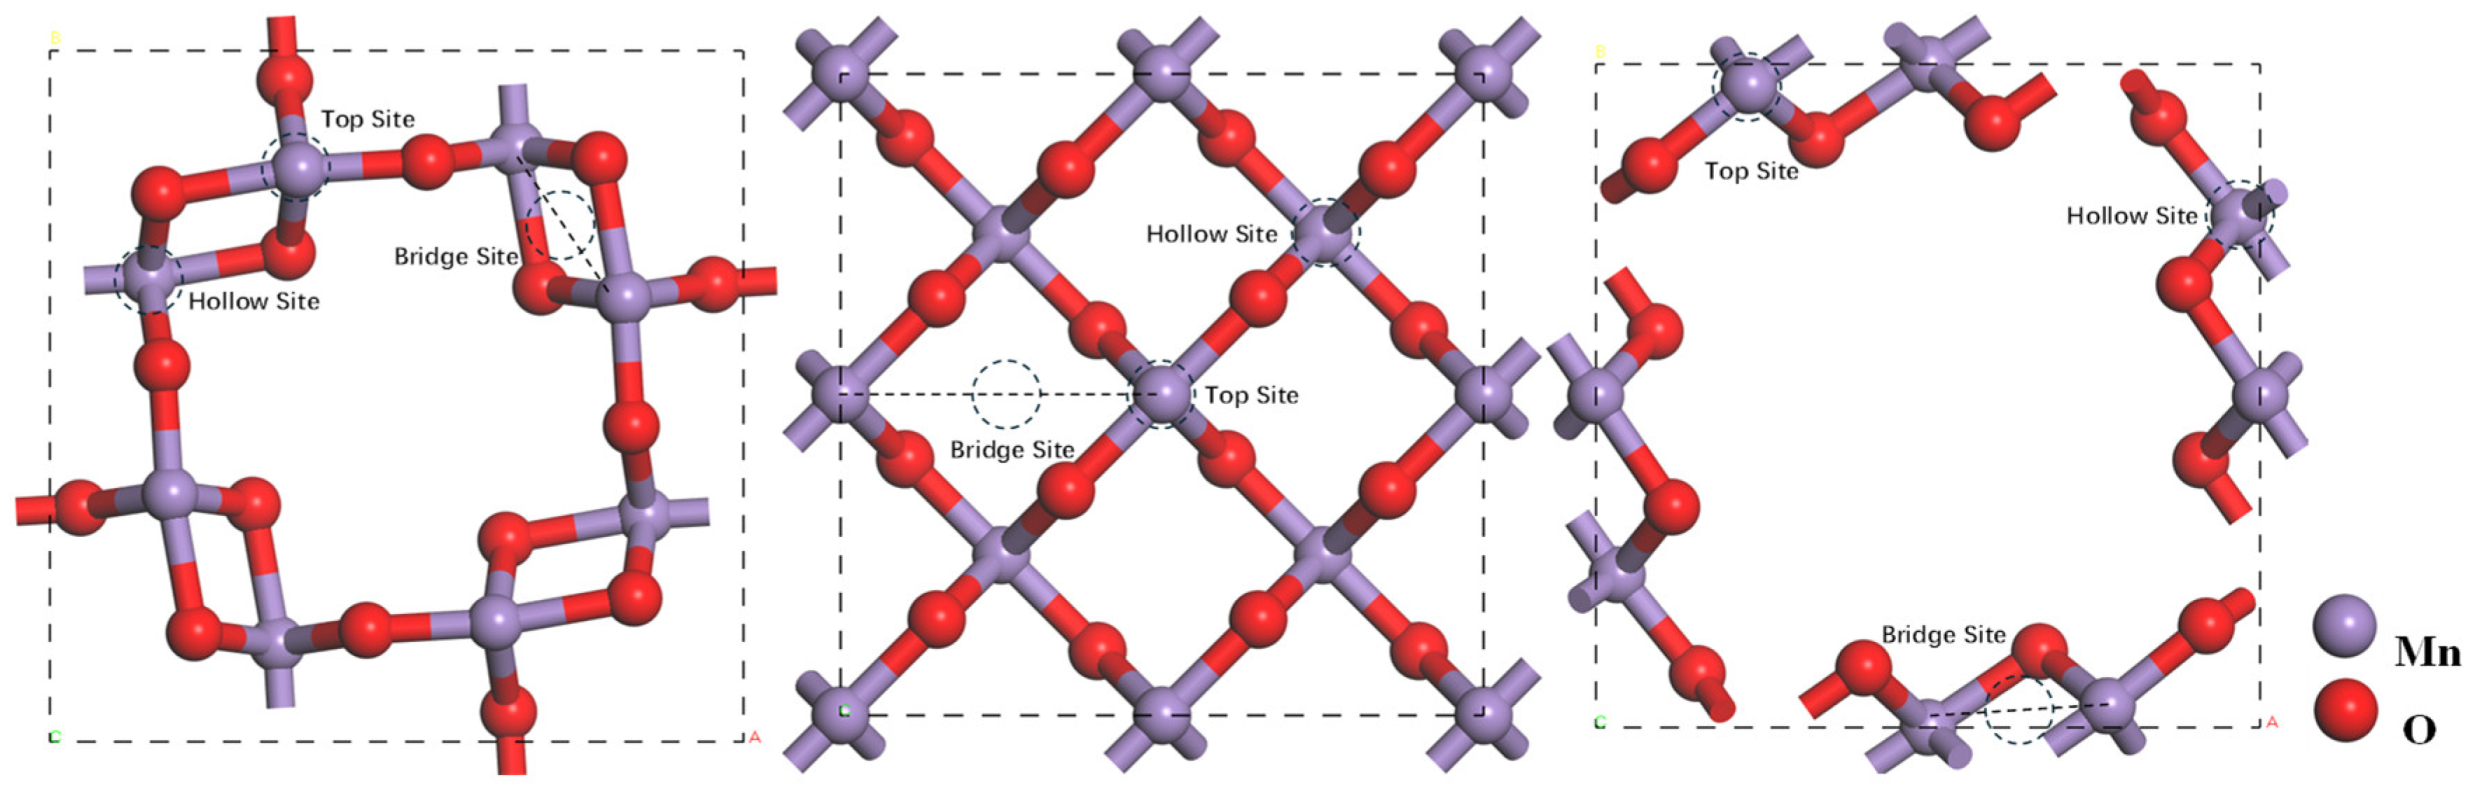
Figure 1. (a) XRD patterns of three MnO2 catalysts; SEM and HRTEM images of (b,e) α-MnO2, (c,f) β-MnO2, and (d,g) δ-MnO2.
Catalysts 15 00342 g001
Figure 2. XPS spectra of α-, β-, and δ-MnO2: (a) full spectrum, (b) Mn 2p3/2, (c) O 1s; (d) Raman shift for α-, β-, and δ-MnO2.
Catalysts 15 00342 g002
Figure 3. α-, β-, and δ-MnO2: (a) a curve of the current density against scanning rates; (b) Nyquist plots; (c) LSV curves in 1.0 M KOH electrolyte under NO; (d) LSV curves of α-MnO2 under NO and Ar; (e) LSV curves of α-MnO2/CP and bare CP under NO; (f) chronoamperometry curves of α-MnO2 at different potentials (vs. RHE).
Catalysts 15 00342 g003
Figure 4. (a) NO3 yield and (b) NO2 yield of α-, β-, and δ-MnO2 at different potentials; (c) NO3 yields of the α-MnO2 electrode at OCP, Ar, NO, and bare CP at NO; (d) cycle stability tests; (e) long-term stability test (inset: LSV curves of the α-MnO2 electrode before and after the 12 h test); (f) chronoamperometry curves and yield at 1.9 V before and after the stability test.
Catalysts 15 00342 g004
Figure 5. Schematic diagrams of (a) Zn-NO cell and (b) Zn-nitrate battery; (c) OCV of α-MnO2-based Zn-nitrate battery; (d) charge tests and NO3 yield at different current densities.
Catalysts 15 00342 g005
Figure 6. Work functions for (a) α-MnO2 (211), (b) β-MnO2 (101), and (c) δ-MnO2 (−111); ICOHP of NO at different adsorption sites of (d) α-MnO2, (e) β-MnO2, and (f) δ-MnO2.
Catalysts 15 00342 g006
Figure 7. Schematic illustration for the synthesis procedures of the three MnO2 catalysts.
Catalysts 15 00342 g007
Figure 8. Adsorption sites on the (001) plane of three MnO2.
Catalysts 15 00342 g008
Table 1. Adsorption energy (eV) of different adsorption sites on the (001) plane of α-, β-, and δ-MnO2.
CatalystsTop SiteBridge SiteHollow Site
α-MnO2−10.417−1.1455−0.8948
β-MnO20.81847.948911.1268
δ-MnO20.84940.849413.1298
Disclaimer/Publisher’s Note: The statements, opinions and data contained in all publications are solely those of the individual author(s) and contributor(s) and not of MDPI and/or the editor(s). MDPI and/or the editor(s) disclaim responsibility for any injury to people or property resulting from any ideas, methods, instructions or products referred to in the content.

