Article

Application of Clay-Based Catalysts in Co-Conversion and Co-Pyrolysis of Chlorella and Oil Shale

by
Xianglong Meng
1,2,
Ranran Song
3 and
Junjie Bian
3,*
1
State Energy Center for Shale Oil Research and Development, SINOPEC, Beijing 102206, China
2
Sinopec Petroleum Exploration and Production Research Institute, SINOPEC, Beijing 102206, China
3
School of Chemistry and Chemical Engineering, Ocean University of China, Qingdao 266100, China
*
Author to whom correspondence should be addressed.
Catalysts 2025, 15(4), 322; https://doi.org/10.3390/catal15040322
Submission received: 5 March 2025 / Revised: 23 March 2025 / Accepted: 25 March 2025 / Published: 27 March 2025
(This article belongs to the Special Issue Biomass Catalytic Conversion to Value-Added Chemicals)

Abstract

:
In this study, natural clay-like silicate minerals were used as precursors to prepare highly acid-catalytic hydrophobic catalysts. A series of sulfonic acid-functionalized attapulgite catalysts, SO3H-APG, were fabricated by the ball-milling–oxidation method. The catalytic performance in the co-liquefaction and co-pyrolysis of Chlorella and oil shale was investigated. The catalysts were analyzed using hydrophobicity evaluation, TEM, BET, FTIR, and other characterization methods. The SO3H-APG catalysts exhibited good hydrophobicity and dispensability. Sulfonation grafting improved their excellent hydrocarbon conversion activity. According to the GC–MS results, the addition of the SO3H-APG catalysts shifted the co-liquefaction products of microalgae and oil shale towards lower carbon numbers, with the majority of the products concentrated between C5 and C12, and a content of 84.9% in the range of C5–C11, while the content of products in the range of C12–C20 was only 15.1%. In the co-pyrolysis experiments, the addition of the catalysts promoted the thermal decomposition reaction. The synergistic effect between oil shale and microalgae facilitated the production of more hydrocarbon compounds with a higher H/C atomic ratio. The development of this type of catalyst provides an economically favorable approach for the co-conversion of algae and oil shale. The oil shale pyrolysis kinetic diagram shows that adding the APG clay-based catalyst significantly reduces the time for achieving the same conversion rate, especially below 300 °C, where the in situ catalytic effect is most pronounced.

1. Introduction

Biomass, as an abundant organic-carbon-containing renewable resource, shows promising potential for replacing traditional fossil fuels [1,2,3]. Among various biomass sources, microalgae, characterized by their rapid growth rate, hold significant potential for producing heat, electricity, fuels, and chemicals [4,5]. Hydrothermal liquefaction (HTL) is currently the most widely used technology for converting microalgae biomass into bio-crude oil [6,7]. Extensive research has been conducted both domestically and internationally to optimize HTL reaction conditions, focusing on the effects of water, reaction temperature, reaction atmosphere, and feedstock characteristics on the composition and distribution of liquid-phase products (bio-crude oil) and aqueous-phase products [8,9]. However, bio-crude oil derived from microalgae suffers from several drawbacks, including low calorific value, poor stability, high viscosity, high nitrogen and oxygen contents, and strong corrosiveness, necessitating further deoxygenation and upgrading to meet industrial application requirements [10].
Oil shale, a sedimentary rock rich in combustible organic matter with high ash content, is considered a potential alternative energy source to address the growing energy supply–demand imbalance [11,12]. The organic matter in oil shale, known as kerogen, contains large amounts of macromolecular hydrocarbons and exhibits a high H/C atomic ratio, making it an effective hydrogen donor [13,14,15]. When co-processed with biomass, kerogen can react with oxygen-containing functional groups in biomass, reducing the oxygen content in the oil and increasing its calorific value [16,17]. Additionally, studies have shown that metal oxides such as TiO2, CeO2, ZrO2, and MgO possess catalytic capabilities for converting and cracking macromolecules to upgrade bio-oil [18]. The mineral ash in oil shale can also act as a deoxygenation “catalyst”, suggesting that synergistic effects between biomass and oil shale can improve oil quality [19,20].
Researchers worldwide have conducted pioneering work on the co-liquefaction of biomass and oil shale. For instance, Li et al. [21] investigated the hydrothermal co-liquefaction conversion process of oil shale and Chlorella co-pyrolysis. Using a 5 wt% Ce-loaded Ce/HZSM-5 catalyst, at 300 °C for 30 min of reaction time, the oil yield reached 32.63%. Additionally, the alkane content increased from 7.43% to 41.63%, while the ketone content decreased from 48.18% to 10.56%. Ce-modified HZSM-5 catalyst significantly affects product distribution by adjusting acidity and pore structure, making it easier for small molecule ketones (such as C3–C7) to enter the pores of the catalyst for reaction, thereby increasing its conversion rate. Chang et al. [22] conducted non-catalytic and in-situ catalytic co-pyrolysis experiments on Huadian oil shale (OS) and microalgae powder (MP) using a modified aluminum retort. By comparing the yields and compositions of non-catalytic and catalytic pyrolysis products, they identified Al2O3 as the most suitable catalyst for OS and MP co-pyrolysis. Yu et al. [23] observed synergistic effects during the fast pyrolysis of microalgae and oil shale, where minerals and trace metals in oil shale catalyzed hydrocarbon generation. The maximum synergy for increasing aliphatic and aromatic hydrocarbon yields occurred at a 3% oil shale ratio.
During the catalytic conversion of microalgae biomass, water molecules often cover the active sites of catalysts, leading to reduced catalytic performance. Therefore, the development of highly hydrophobic catalysts has become a research hotspot. Yin et al. [24] prepared an SBA-15 catalyst containing hydrophobic methoxy groups, phosphotungstic acid groups, and -SO3H Brønsted acid sites. The enhanced hydrophobicity of this catalyst was demonstrated in the conversion of cellulose to 5-hydroxymethylfurfural in aqueous solvent, with low yields of levulinic acid and formic acid (below 10%) confirming its water resistance. Li et al. [25] developed a renewable solid acid catalyst, FDCA/SA-Hf, using a solvent-free assembly method based on biomass-derived materials. This catalyst, with its inherent hydrophobicity, achieved a 98.6% biodiesel yield from abundant free fatty acids and non-edible oils at low temperatures. The organic matter in shale is mainly derived from aliphatic biopolymers derived from microalgae, such as green algae and flagellates, which can be converted into oil-like substances [26,27]. Although these algae make up only a small fraction of the sedimentary organic matter, they are highly resistant to microbial decomposition and diagenetic action, and could therefore survive and become immersed into the kerogen [28]. Thus, catalytic conversion of kerogen was a challenging task for oil shale exploration.
Clay minerals, a class of natural micro-mesoporous materials composed of aluminosilicates containing elements such as Al and Mg, are widely used as catalyst supports and adsorbents due to their abundance, low cost, and high thermochemical stability [29,30,31]. Luo et al. [32] evaluated the thermal reaction behavior of oxidation and pyrolysis of oil containing montmorillonite (M), kaolinite (K), chlorite (C), and illite (I) catalysts using differential scanning calorimetry (DSC) technology. By combining dynamic calculation methods, the catalytic effects of various clay minerals in the thermal reactions involving oxidized oil and pyrolysis of oil during in situ combustion (ISC) were studied. The results showed that all four clay minerals were able to shorten the temperature range during the low-temperature oxidation (LTO) stage of oxidized oil. The oxidized oil containing montmorillonite showed a significant decrease in peak temperature during the LTO stage. In addition, especially during the high-temperature oxidation (HTO) stage, the oxidized oil containing montmorillonite and illite exhibited higher peak heat flux and generated more heat during combustion. Aris et al. [29] used kinetic calculation methods such as Friedman, KAS, and Vyazovkin to investigate the catalytic effect of clay rock as a matrix on heavy-oil combustion during in situ combustion (ISC) to improve oil recovery. The experimental results indicate that clay rock, as a substrate for heavy-oil combustion in the ISC process, can enhance the catalytic effect of oil recovery. It can be seen that clay-based catalysts have a positive promoting effect on the catalytic conversion of oil. However, the above research focused on the LTO or HTO of crude oil, which inevitably consumes energy and generates pollution waste. If clay-based catalysts are graft-reformed with active groups and applied to the HTL reaction of oil shale and microalgae, it will reduce energy consumption and improve the catalytic efficiency of oil shale.
Ball milling is considered a green and powerful tool for preparing new materials and chemicals, making it suitable for large-scale production of cost-effective catalysts [33,34].
Functionalizing natural clay minerals by grafting -SO3H groups via ball milling provides a simple and feasible method for introducing acidic sites [35]. This approach not only maintains the structural properties of the original materials but also enhances surface hydrophobicity and hydrothermal stability, offering an excellent method for preparing natural mineral-based acid catalysts.
This study employed attapulgite (APG), kaolin, and clinoptilolite (clin) as raw materials to prepare clay-based catalysts (SO3H-APG, SO3H-kaolin, and SO3H-clin) through a simple and efficient ball-milling method for sulfonic acid-group grafting and hydrophobization. The morphology, structure, and acid–base properties of the catalysts were analyzed using hydrophobic evaluation, TEM, FT-IR, and other characterization techniques. Based on previous experiments [20,21], the catalytic performance of these clay-based catalysts was investigated for the co-liquefaction (co-pyrolysis) of Chlorella and oil shale. Kerogen catalytic pyrolysis was also investigated to identify the hydrocarbon generation potential with the catalytic promotion.

2. Results and Discussion

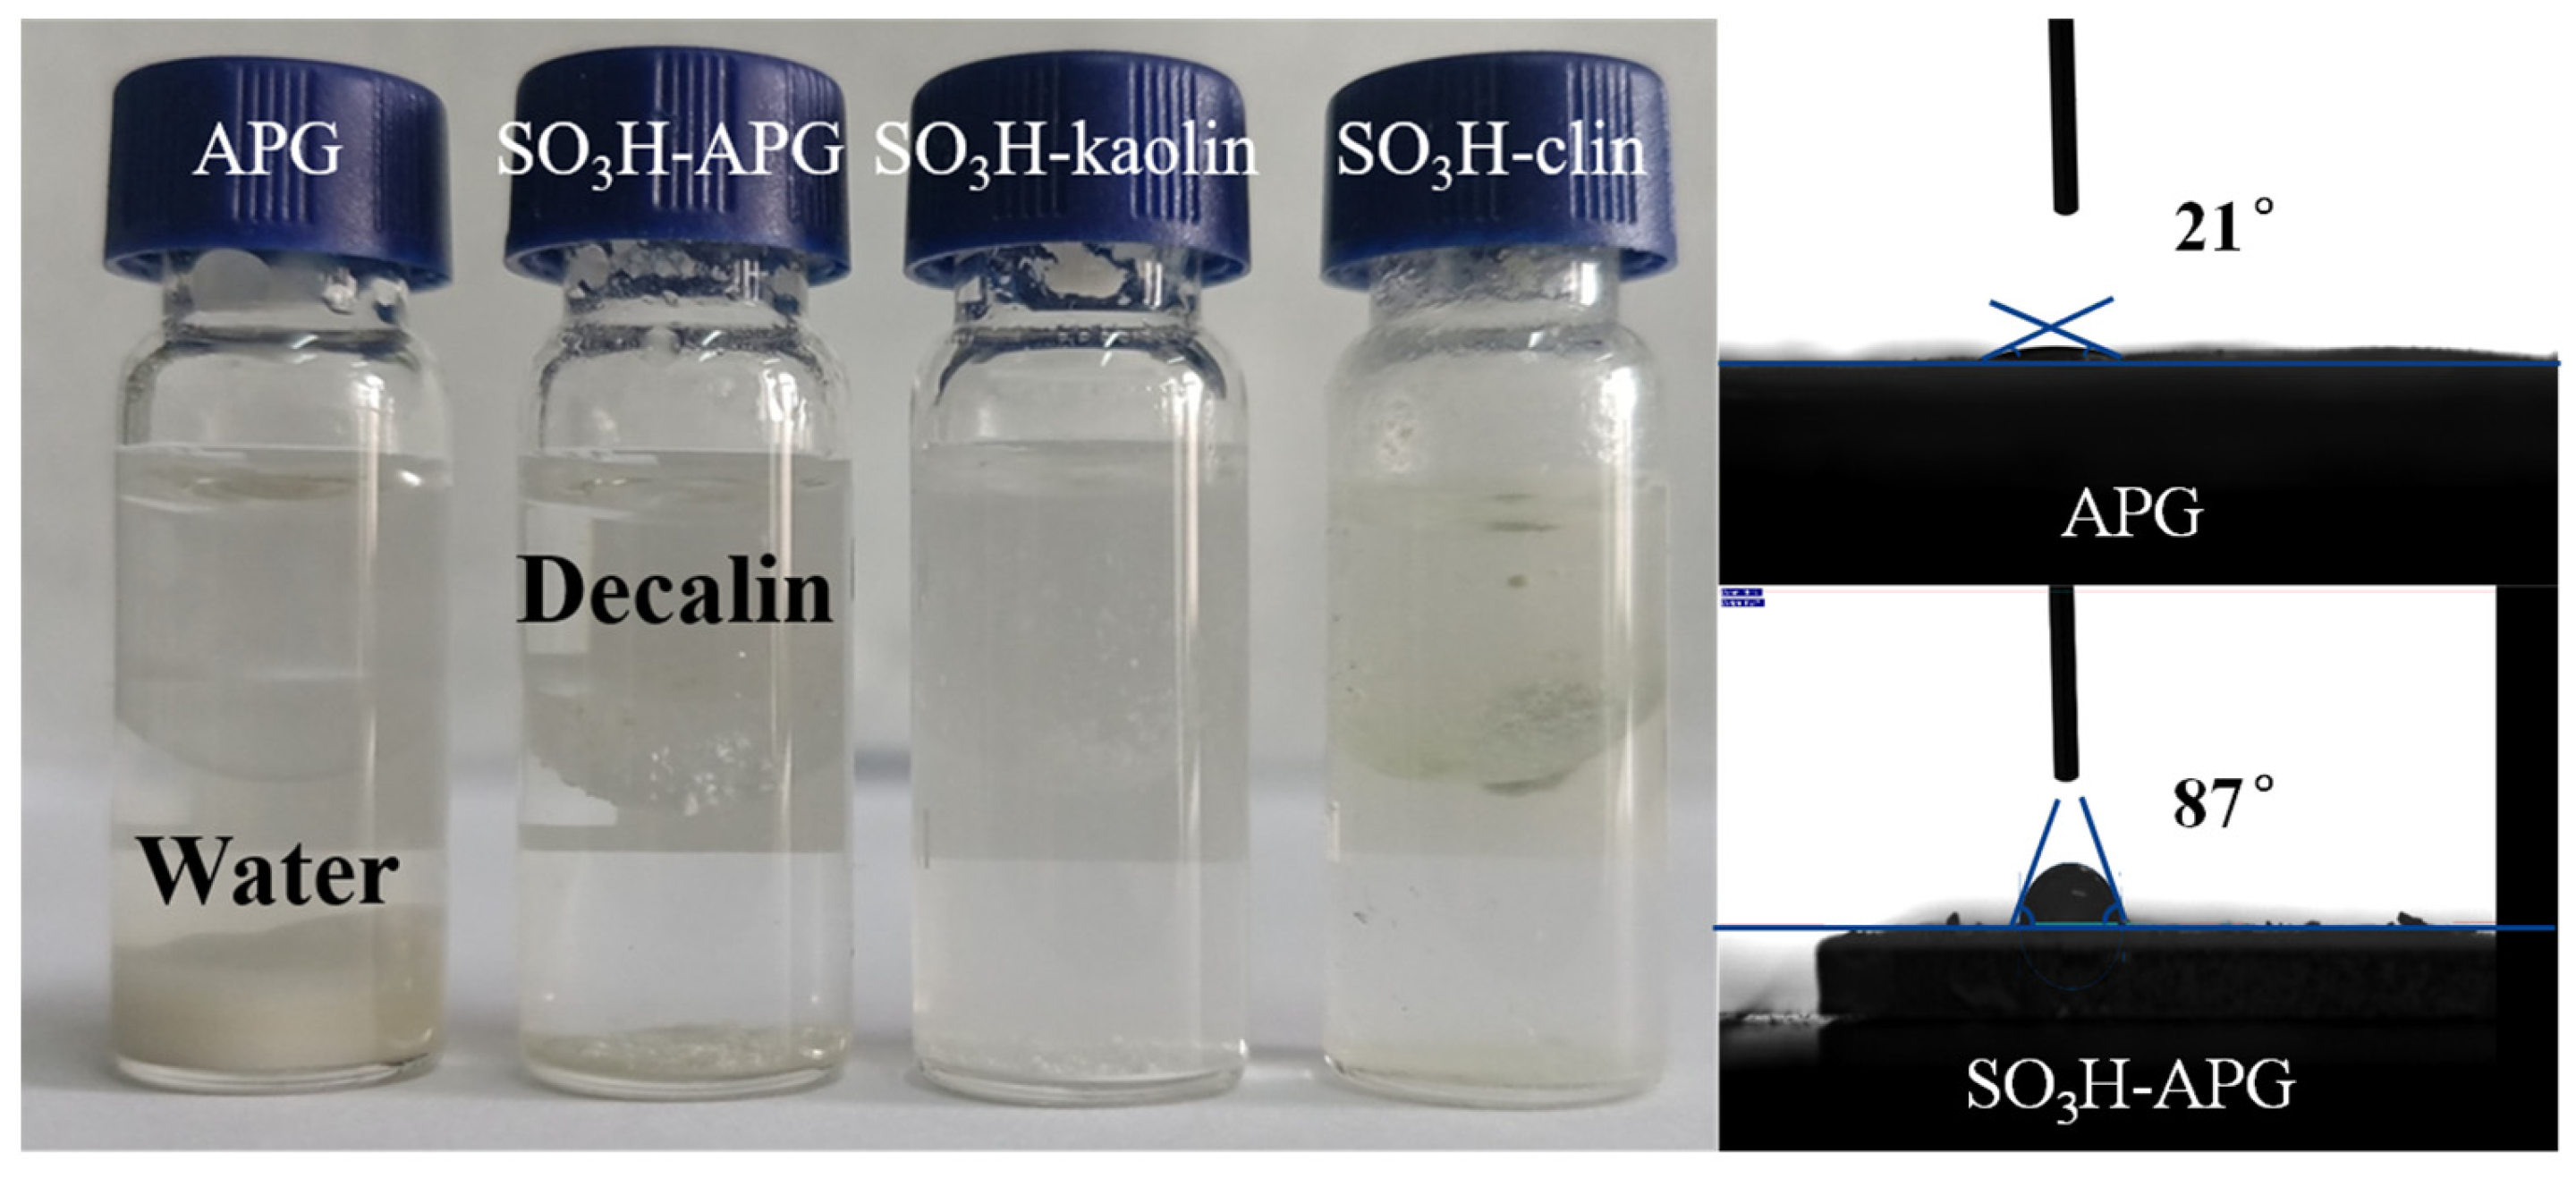
2.1. Hydrophobicity Tests of Clay-Based Catalysts

The hydrophobicity results are shown in Figure 1. As can be seen from the figure, in an emulsion system composed of water and decalin, the unmodified APG clay (without grafted organic groups, i.e., -SO3H groups) exhibited hydrophilic properties and was completely submerged in water. In contrast, the SO3H-APG, SO3H-kaolin, and SO3H-clin catalysts, which were grafted with sulfonic acid groups via ball milling, demonstrated a certain degree of hydrophobicity. This was further verified by contact-angle measurements. On untreated APG clay, water droplets wet the catalyst surface (contact angle of 21°), indicating strong hydrophilicity. After grafting -SO3H groups, water droplets on the SO3H-APG catalyst surface formed a hemispherical shape (contact angle of 87°), representing an approximately fourfold increase, which confirmed enhanced hydrophobicity. Hydrophobic treatment of the catalysts aims to protect their framework structure by preventing contact with liquid water, thereby maintaining their catalytic activity [36,37].

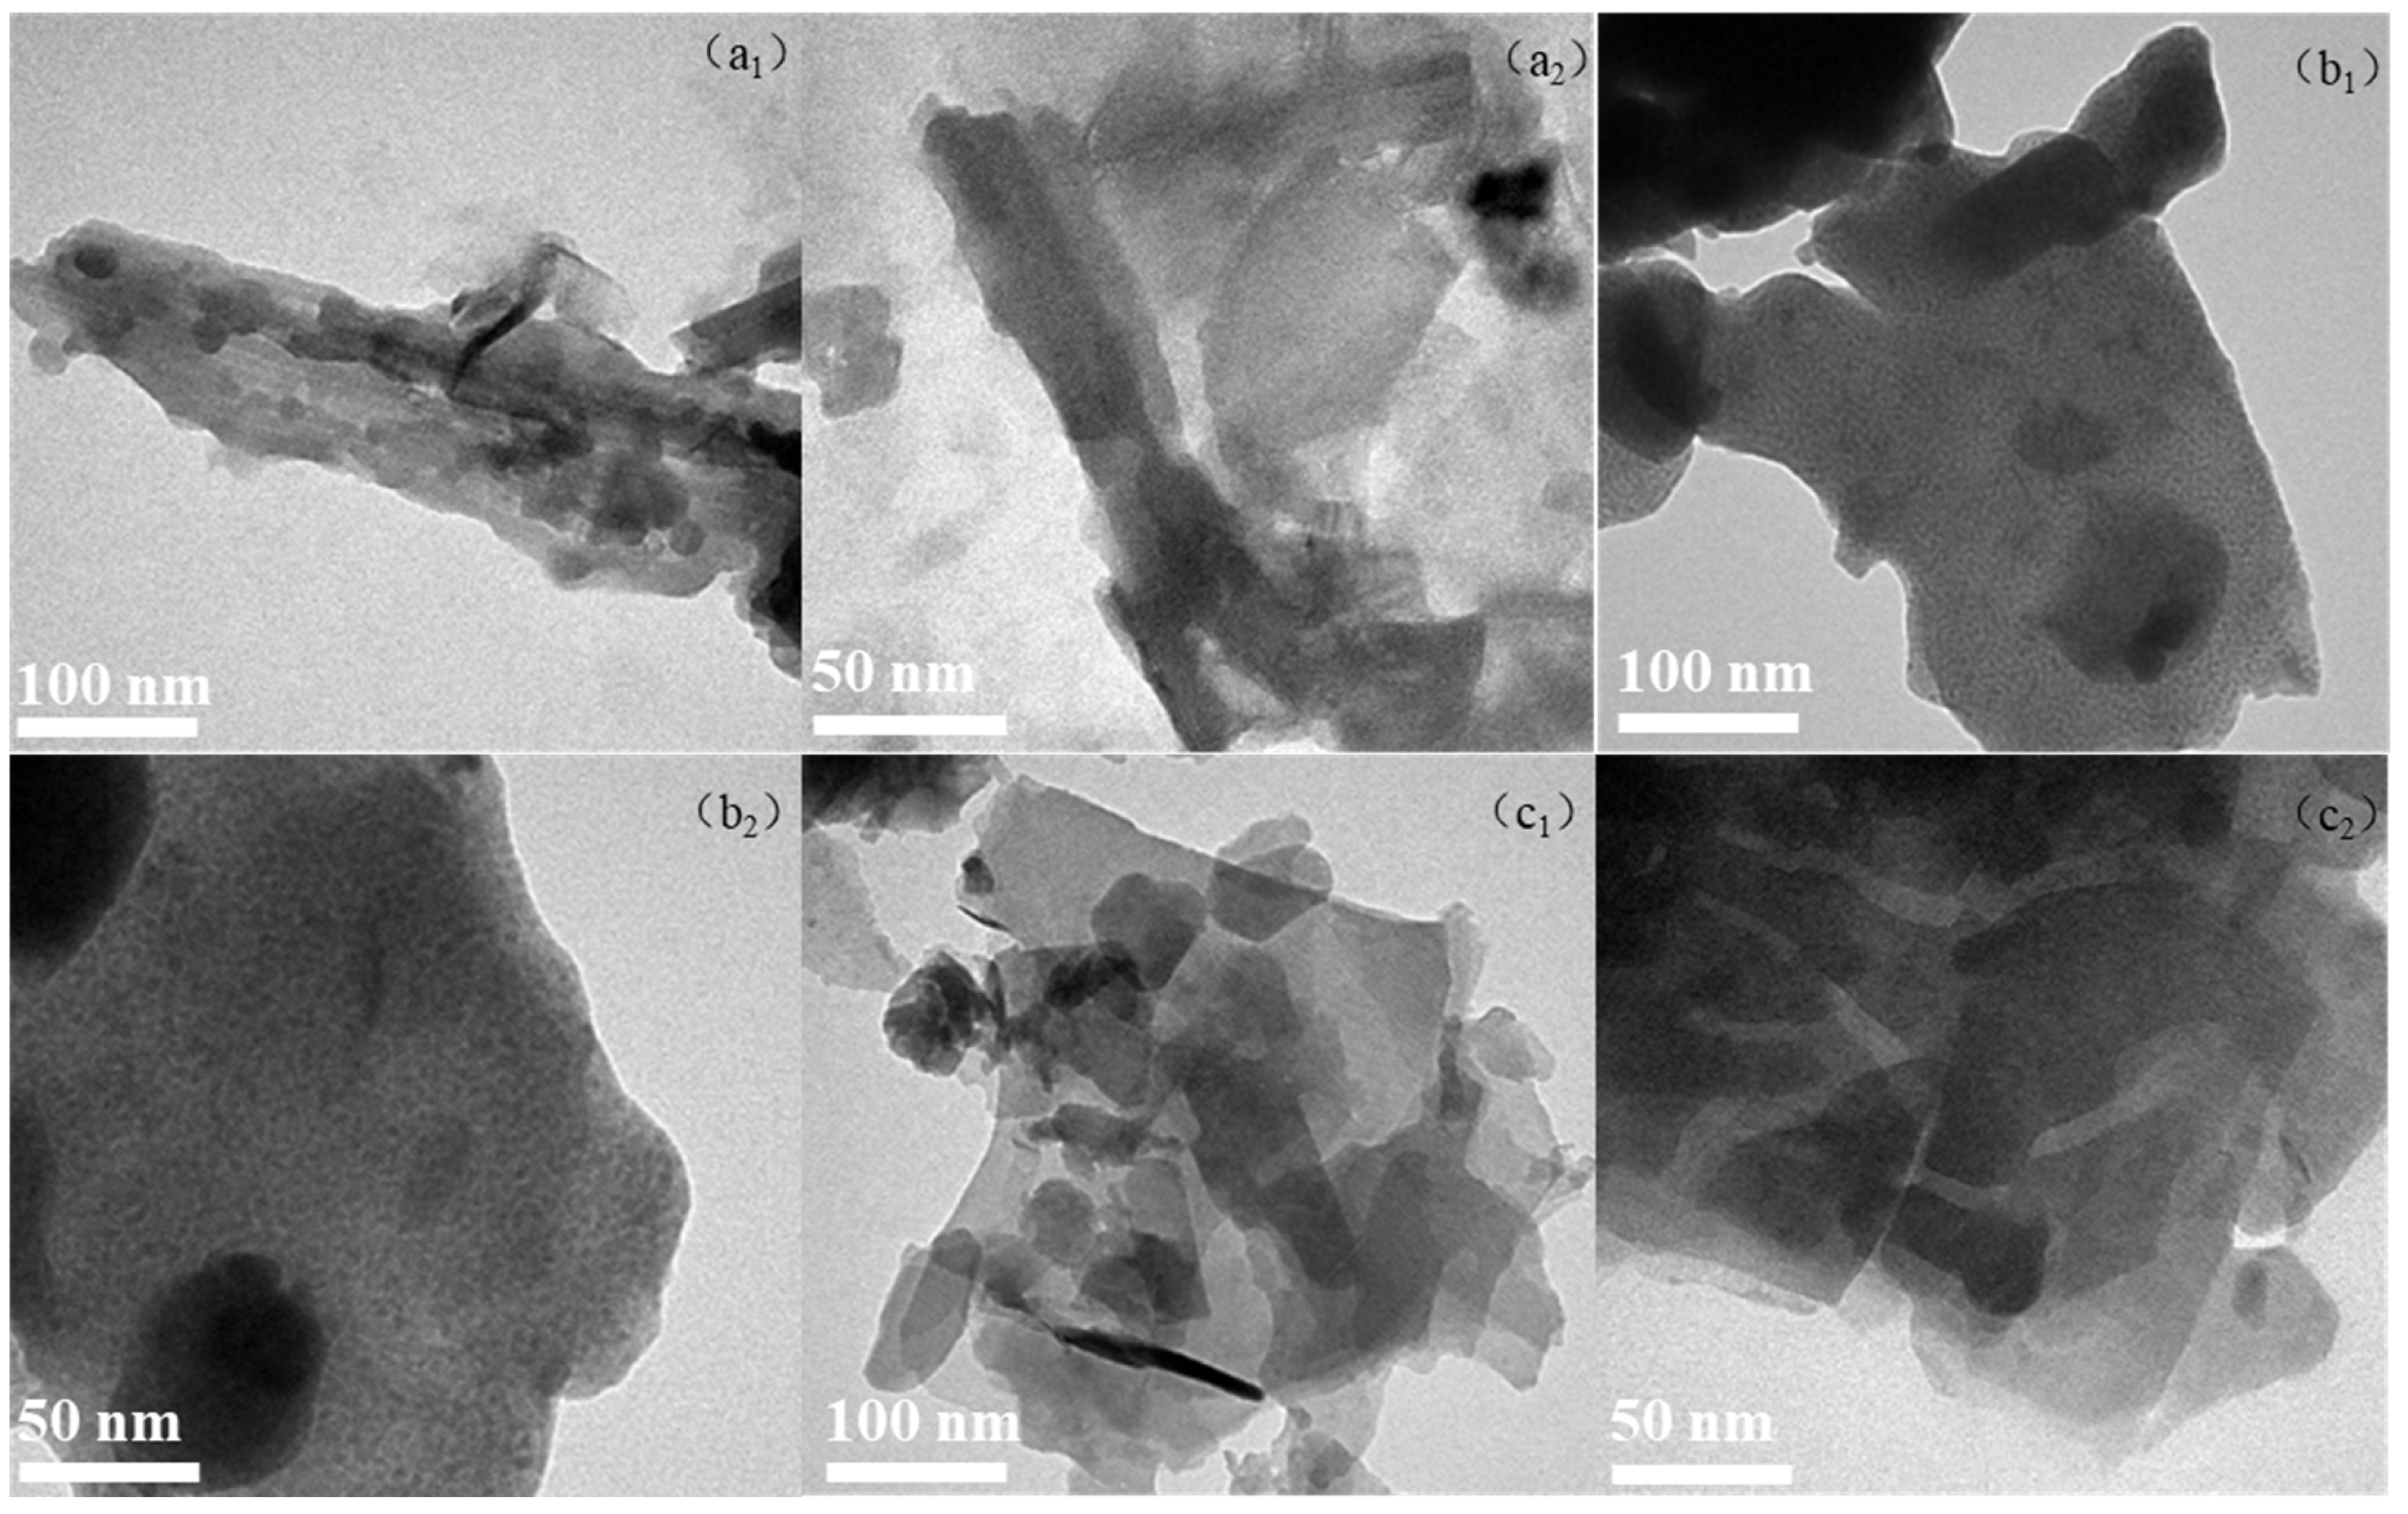
2.2. TEM Images of Clay-Based Catalysts

The morphology and structure of the prepared SO3H-APG, SO3H-kaolin, and SO3H-clin catalysts were observed using transmission electron microscopy (TEM), as shown in Figure 2. From the images, the following observations can be made: The SO3H-APG catalyst, after ball-milling modification, exhibited a rod-like structure with crystals stacked together and a fibrous surface. The TEM image of the SO3H-kaolin catalyst revealed the formation of relatively regular pore channels on the surface, presenting a fine granular aggregate structure. The SO3H-clin catalyst consisted of flaky crystals and displayed a morphology of flaky aggregates.

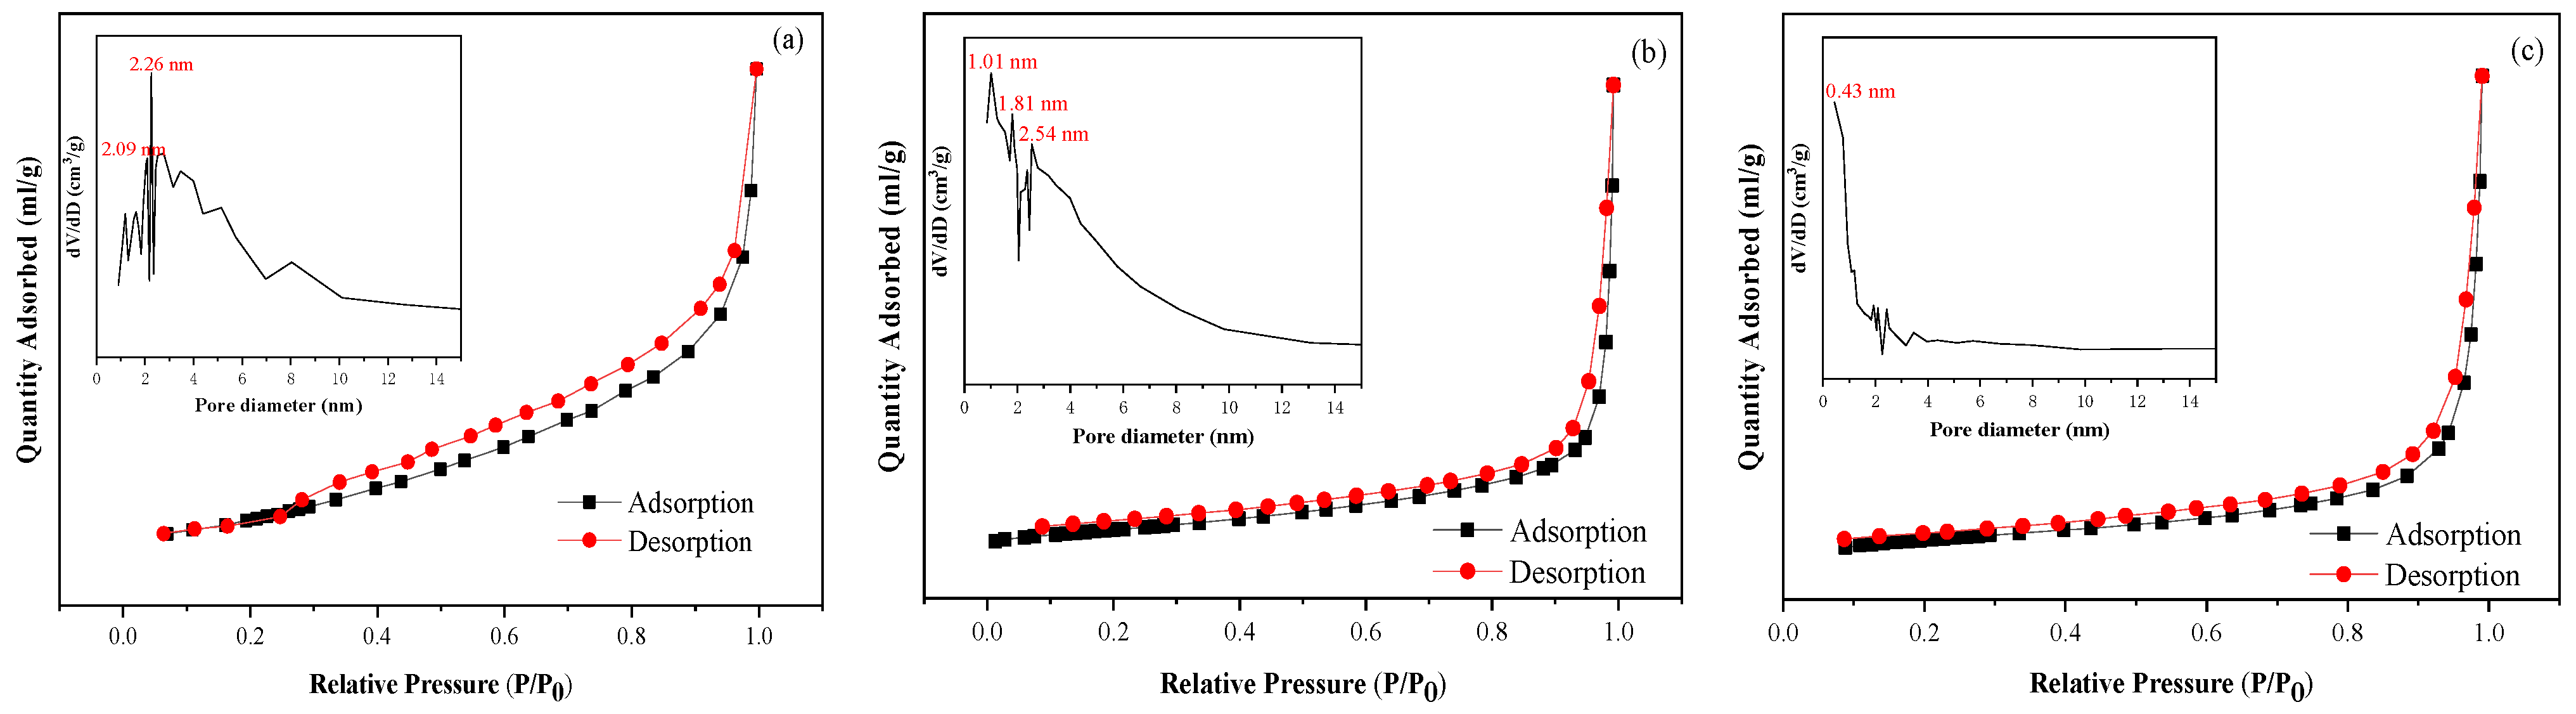
2.3. BET Analysis of Clay-Based Catalysts

The N2 adsorption–desorption isotherms and pore-size distribution curves calculated using the NLDFT model for the clay-based catalysts SO3H-APG, etc., are shown in Figure 3. From the figure, it can be observed that these catalysts exhibited relatively complete adsorption–desorption hysteresis loops. Additionally, the pore-size distribution curves indicate that these clay-based catalysts possessed both micropores and mesopores. The physical structural parameters of the pore channels for the three catalysts are summarized in Table 1. As shown in the table, the SO3H-APG catalyst had the largest specific surface area (127.08 m2/g), with mesopores concentrated around 2.26 nm. The sulfonic acid groups grafted on the external surface of the catalyst provided good accessibility to active centers, and the larger specific surface area and pore size helped expose more active sites, thereby promoting the catalytic conversion of Chlorella and oil shale. In contrast, the SO3H-kaolin catalyst had micropores concentrated at 1.01 nm, and the SO3H-clin catalyst had micropores concentrated at 0.43 nm, indicating a smaller pore structure compared with the SO3H-APG catalyst.

2.4. FTIR Analysis of Clay-Based Catalysts

The Fourier-transform infrared (FT-IR) spectrum of the clay-based catalyst SO3H-APG is shown in Figure 4. From the spectrum, a broad absorption peak at 3442 cm−1 can be observed, which is attributed to the stretching vibration of hydroxyl groups (-OH) from adsorbed water on the particle surface. Absorption peaks at 455 cm−1 and 520 cm−1 correspond to the bending vibrations of Si-O bonds, which are characteristic absorption peaks of clay [38]. Peaks at 798 cm−1 and 1022 cm−1 are assigned to the stretching vibrations of Si-O-Si bonds. Peaks at 1726 cm−1 and 1153 cm−1 are attributed to the stretching vibrations of O=S=O bonds in the -SO3H groups, indicating that the -SH groups have been successfully oxidized to -SO3H and grafted onto the APG surface. Additionally, the absorption peak at 2895 cm−1 arises from the stretching vibration of C-H bonds in methylene groups. It provides clear evidence of the chemical modifications and functional group transformations in the SO3H-APG catalyst, supporting its potential catalytic activity.

2.5. Co-Liquefaction of Chlorella and Oil Shale

Figure 5 shows the carbon-number distribution and boiling-point distribution of the co-liquefaction products of Chlorella and oil shale. Based on the GC–MS results, the addition of the catalyst shifts the co-liquefaction products toward lower carbon numbers, with the products mainly concentrated in the C6–C12 range. Under the action of the SO3H-APG catalyst, the content of C5–C11 products reaches 84.9%, while the content of C12–C20 products decreases to 15.1%. Additionally, the boiling points of the co-liquefaction products shift toward lower temperature regions with the addition of the catalyst. Specifically, under the action of the SO3H-APG catalyst, the naphtha content increases from 61.58% to 84.7%, while the middle distillate content decreases from 38.42% to 15.3%. This indicates that the catalyst effectively promotes deoxygenation reactions, improving the quality and performance of the oil products.
The product distribution and elemental analysis of the co-liquefaction of Chlorella and oil shale are shown in Table 2. As can be seen from the table, the co-liquefaction products are mainly divided into hydrocarbons, oxygen-containing compounds (alcohols, ketones, phenols, acids, and esters), and nitrogen-containing compounds [39]. The addition of the catalyst increases the content of hydrocarbons in the liquefaction products while significantly reducing the content of oxygen-containing and nitrogen-containing compounds. Compared with the case without a catalyst, the SO3H-APG catalyst demonstrates the most significant deoxygenation effect. The hydrocarbon content in the co-liquefaction products increases from 31.28% to 53.21%, the nitrogen-containing compounds decrease by 8.6%, and the oxygen-containing compounds are significantly reduced, with ketones and acids decreasing by 4.67% and 5.5%, respectively. This indicates that the SO3H-APG catalyst exhibits excellent deoxygenation and aromatization performance, effectively increasing the H/C atomic ratio (1.75) and reducing the O/C atomic ratio (0.04). The degree of deoxygenation reaches 49.81%, and the calorific value of the product oil increases from 38.93 MJ/kg to 43.2 MJ/kg, demonstrating an improvement in oil quality [40,41].
Under co-liquefaction conditions, compared with the bio-oil obtained from the liquefaction of Chlorella alone [42], the co-liquefaction product oil of Chlorella and oil shale exhibits an increased H/C atomic ratio and a significantly reduced O/C atomic ratio, as shown in Figure 6. Under the catalytic action of SO3H-APG, the H/C atomic ratio of the co-liquefaction product oil increases from 1.69 (bio-oil) to 1.75, and its calorific value increases from 42.33 MJ/kg (bio-oil) to 43.2 MJ/kg. This is because oil shale itself has a high H/C atomic ratio and can act as a hydrogen donor, combining with oxygen-containing functional groups in the bio-oil. This promotes the formation of hydrocarbons and the decomposition of oxygen-containing components, thereby improving the quality of the oil product.

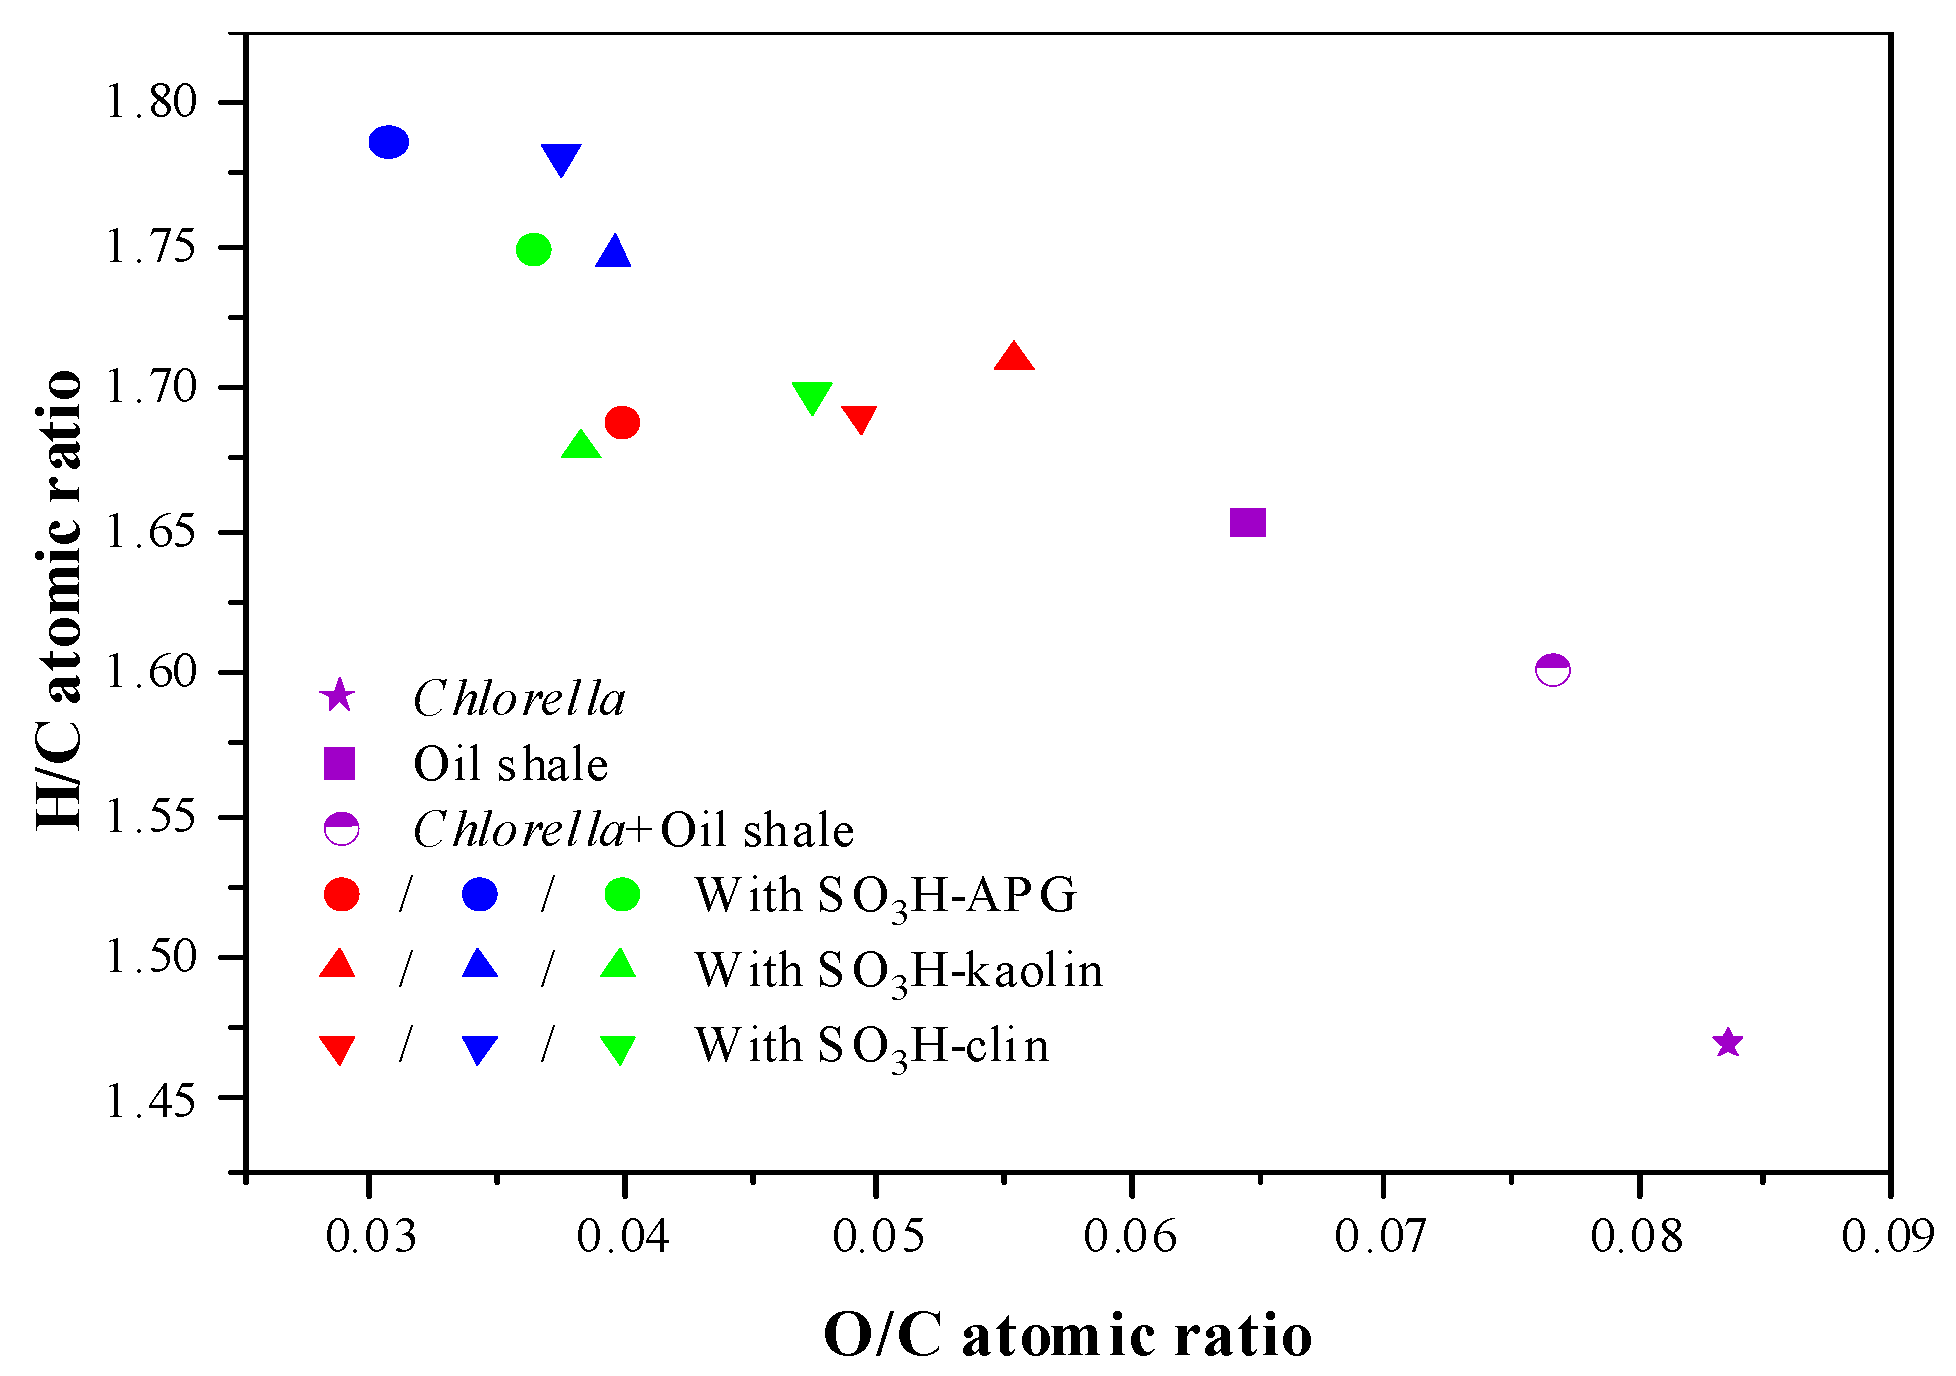
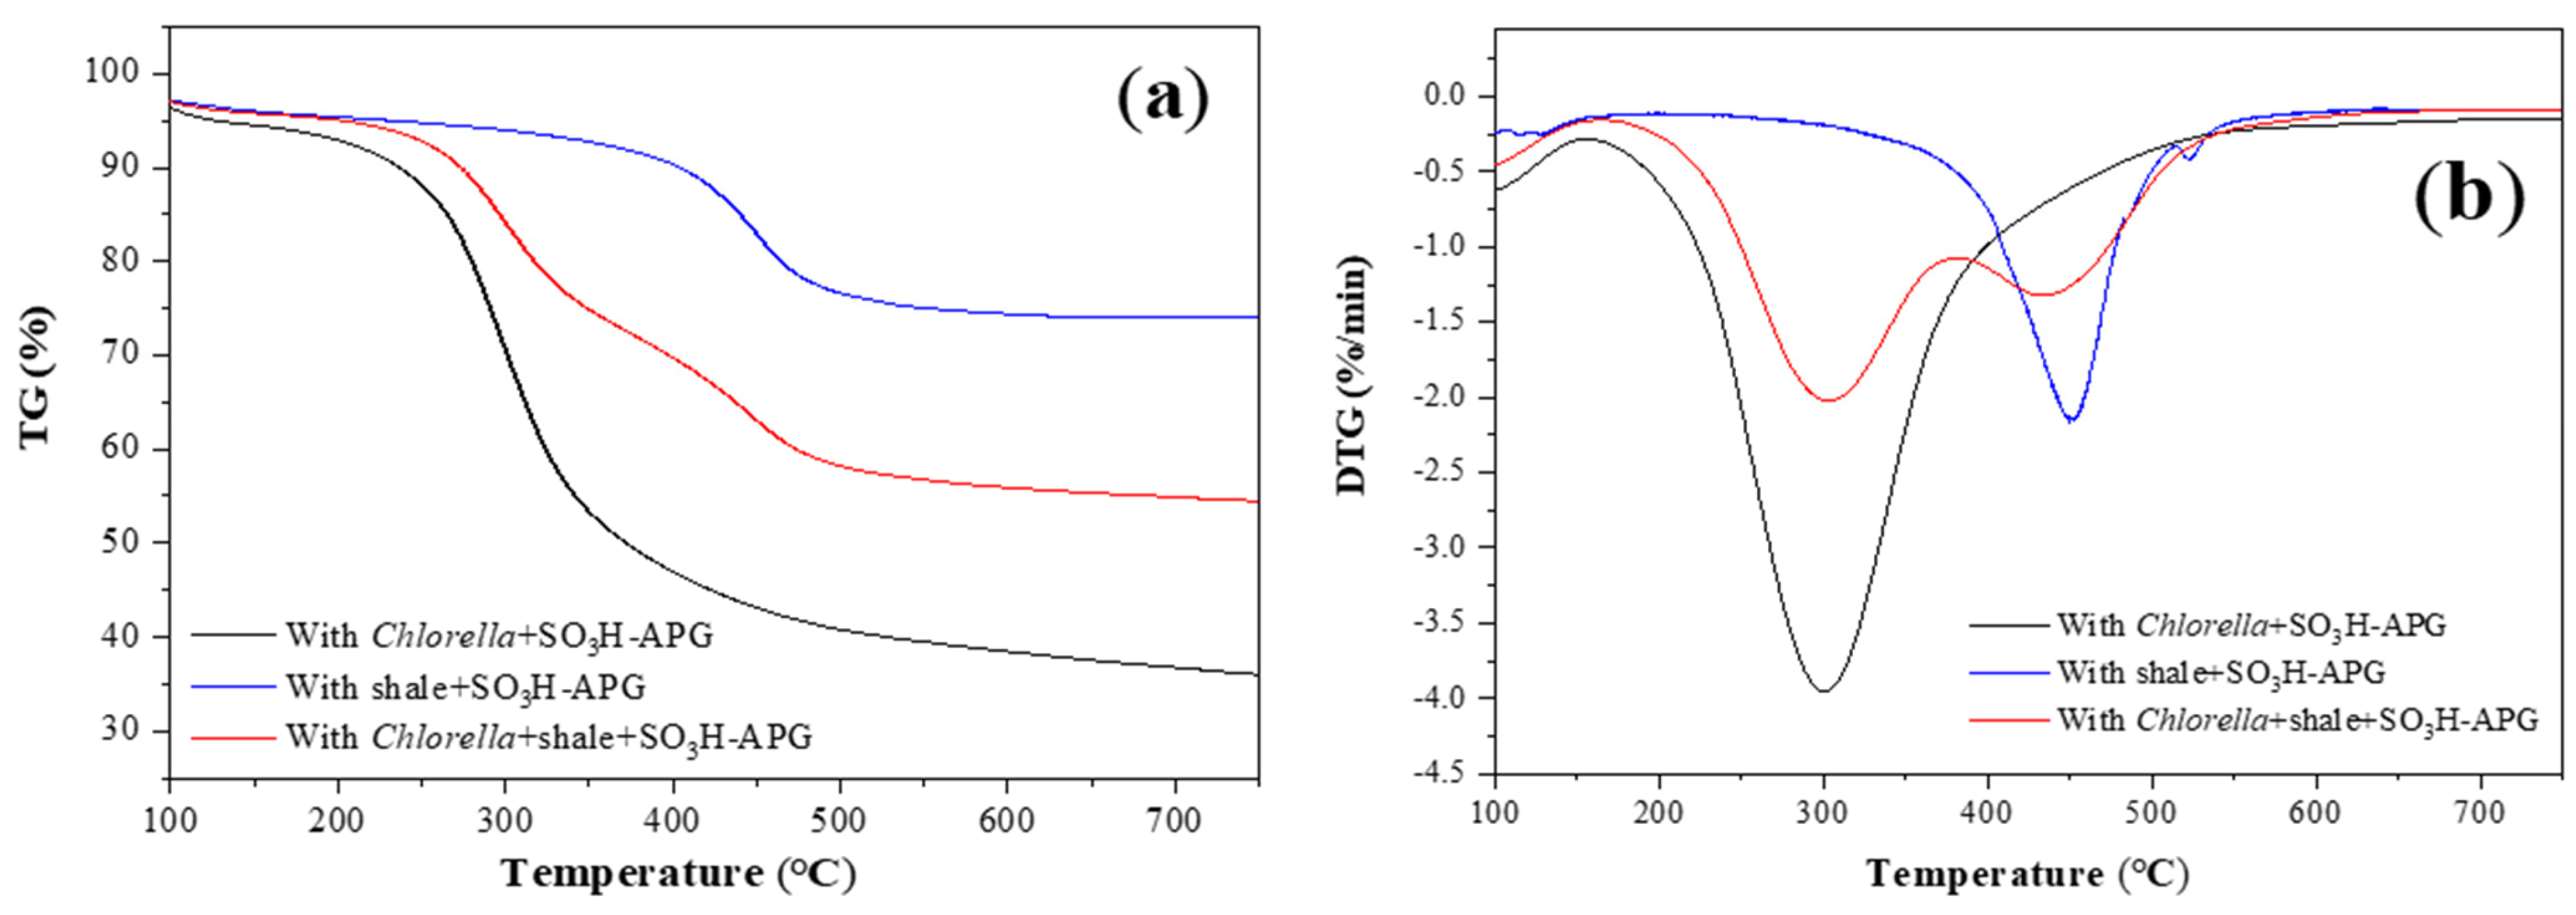
2.6. Co-Pyrolysis of Chlorella and Oil Shale

Based on the co-liquefaction reaction of Chlorella and oil shale, co-pyrolysis analysis was conducted to further investigate the synergistic effects between the two. Co-pyrolysis experiments of Chlorella and oil shale were performed under the same SO3H-APG catalyst and a heating rate of 10 °C/min. The thermogravimetric (TG) and derivative thermogravimetric (DTG) curves of the pyrolysis process are shown in Figure 7, and the kinetic parameters of the co-pyrolysis are summarized in Table 3. From the TG curves, it can be observed that the catalytic pyrolysis of Chlorella alone can be divided into three stages: drying, devolatilization, and carbonization. At temperatures below 150 °C, the weight loss in this stage is mainly caused by the evaporation of internal moisture and light volatile substances. As the temperature increases, macromolecular organic compounds gradually undergo depolymerization and decomposition. Significant mass loss is observed in the TG curve within the temperature range of 150–500 °C, and the DTG curve shows a maximum weight loss peak at 300 °C, primarily due to the pyrolysis reactions of macromolecular components in Chlorella, such as carbohydrates, proteins, and lipids. When the temperature exceeds 500 °C, the carbonization stage of Chlorella begins, during which the weight loss process gradually slows down, and the TG and DTG curves level off [43].
The catalytic pyrolysis of oil shale alone can also be divided into three stages: dehydration, organic matter pyrolysis, and mineral decomposition. From the TG curves, it can be seen that before 350 °C, the weight loss increases slowly with temperature, mainly due to the volatilization of moisture. The most significant weight loss occurs in the temperature range of 350–500 °C, which is primarily attributed to the pyrolysis of organic matter (kerogen) in oil shale. Kerogen undergoes covalent bond cleavage and polycondensation reactions to generate shale oil, gas, and carbonaceous residues, releasing a large amount of low-molecular-weight hydrocarbons. The DTG curve shows a maximum weight loss peak at 449 °C, which is approximately 149 °C later than the peak observed in Chlorella pyrolysis. When the temperature exceeds 500 °C, the pyrolysis of organic matter is essentially complete, and the TG curve levels off. This stage mainly involves the decomposition of a small amount of minerals and the secondary decomposition of intermediate products.
The mixed co-pyrolysis curve of Chlorella and oil shale lies between their individual pyrolysis curves, and the mass loss trends are similar. When oil shale and Chlorella are mixed in equal proportions, the co-pyrolysis curve exhibits the pyrolysis characteristics of both materials in different temperature ranges. From the DTG curve, it can be observed that the weight loss process during co-pyrolysis mainly occurs in the temperature range of 150–500 °C, with two maximum weight loss peaks appearing. Since Chlorella has higher volatile matter and fixed carbon content compared with oil shale, it exhibits an earlier and sharper weight loss peak. The pyrolysis behavior in the low-temperature region (150–400 °C) is primarily controlled by the components of Chlorella, with the maximum weight loss peak occurring at approximately 300 °C. In the high-temperature region (above 400 °C), the pyrolysis behavior is dominated by oil shale, with the maximum weight loss peak occurring at around 435 °C, which is earlier than the peak observed during the pyrolysis of oil shale alone. This may be due to the fact that the components of Chlorella are more easily decomposed than those of oil shale. From the characteristic parameters of the co-pyrolysis of Chlorella and oil shale listed in Table 3 it can be seen that the activation energy is lower compared with individual pyrolysis. In addition to the catalytic effect promoting pyrolysis, there may also be hydrogen exchange between oil shale, which has a higher H/C atomic ratio, and Chlorella, thereby promoting the formation of hydrocarbon compounds.

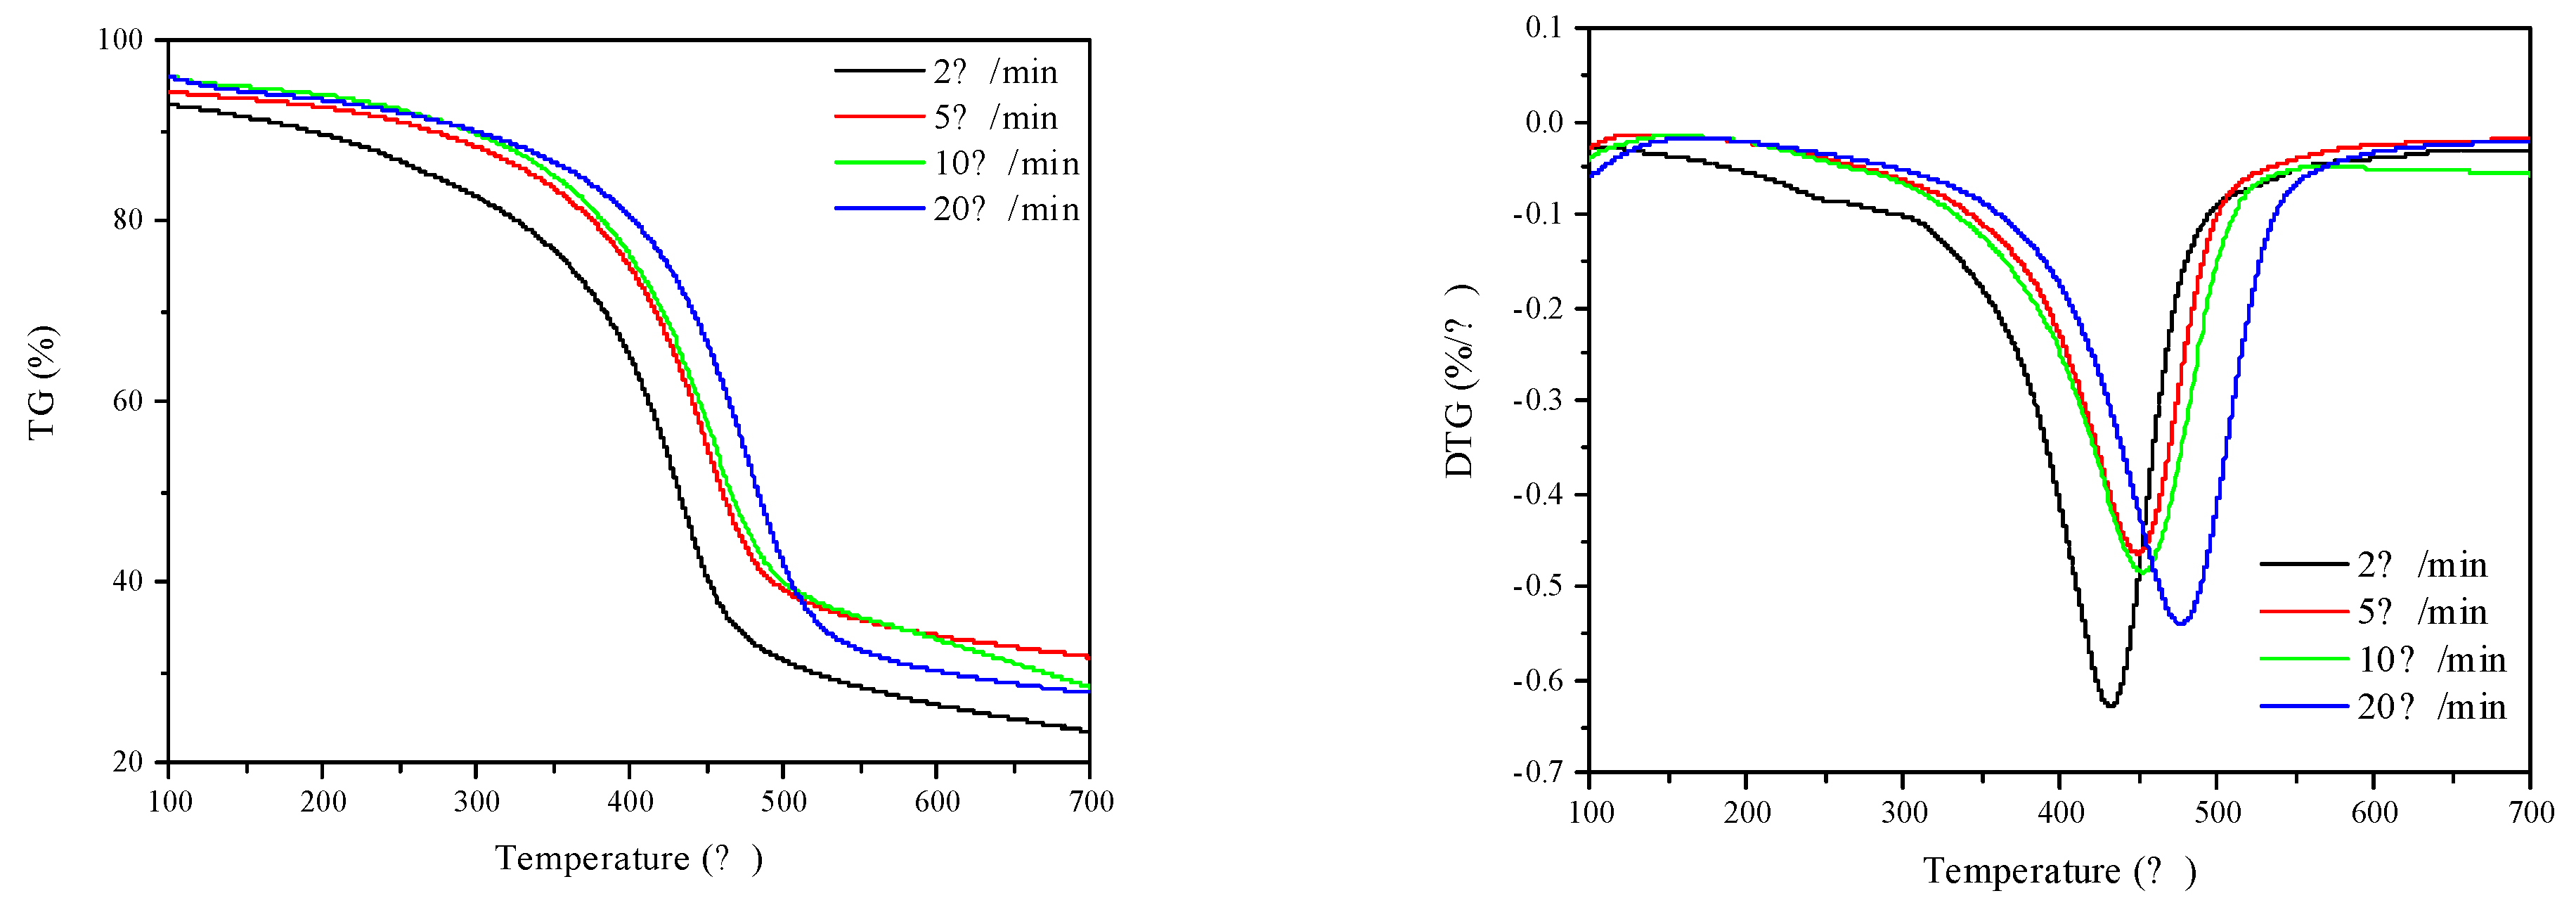
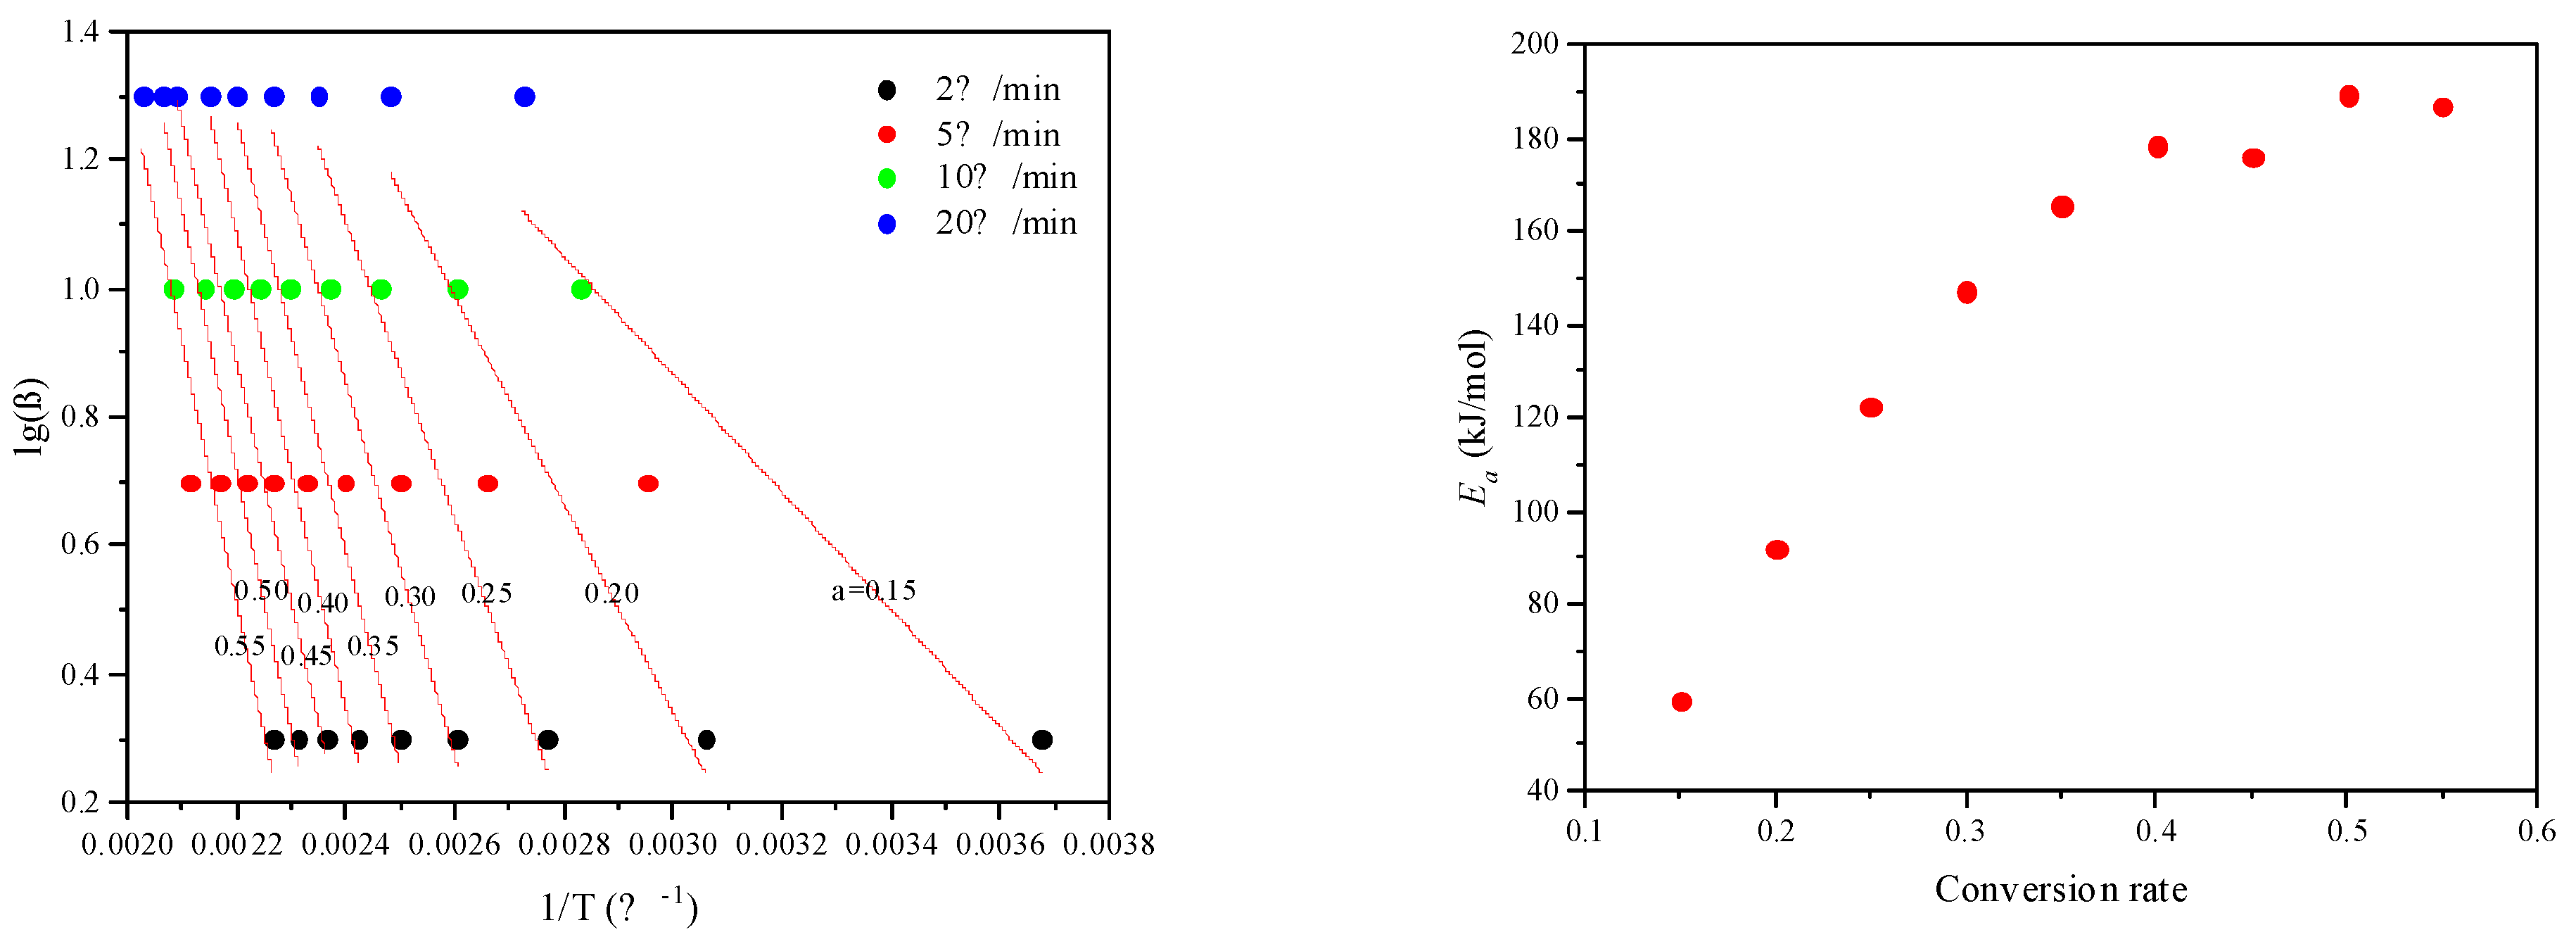
2.7. Kerogen Catalytic Pyrolysis

The TG and DTG curves of the mixture of kerogen and SO3H-APG catalyst are shown in Figure 8 and Figure 9 and Table 4 displays the pyrolysis activation energy calculated using the FWO method for the kerogen pyrolysis process, with correlation coefficients greater than 0.92, indicating high accuracy of the results. It can be observed that the thermal decomposition of the sample can be divided into three stages [44]. The first stage, with a temperature range of 35–300 °C and a conversion rate of 0.05–0.15, corresponds to the evaporation of moisture and the release of adsorbed gases, requiring less energy. The second stage, within the temperature range of 300–400 °C and a conversion rate of 0.20–0.35, shows a rapid increase in Ea from 92.05 kJ/mol to 165.49 kJ/mol, due to the decomposition of organic matter in kerogen, where reactions such as cracking, polymerization, and aromatization require more energy. When the conversion rate reaches 0.40–0.55 and the temperature exceeds 400 °C, Ea increased further, to approximately 180 kJ/mol. This stage mainly involves the secondary degradation of organic matter and the decomposition of complex minerals, with tar fully released, requiring substantial energy.

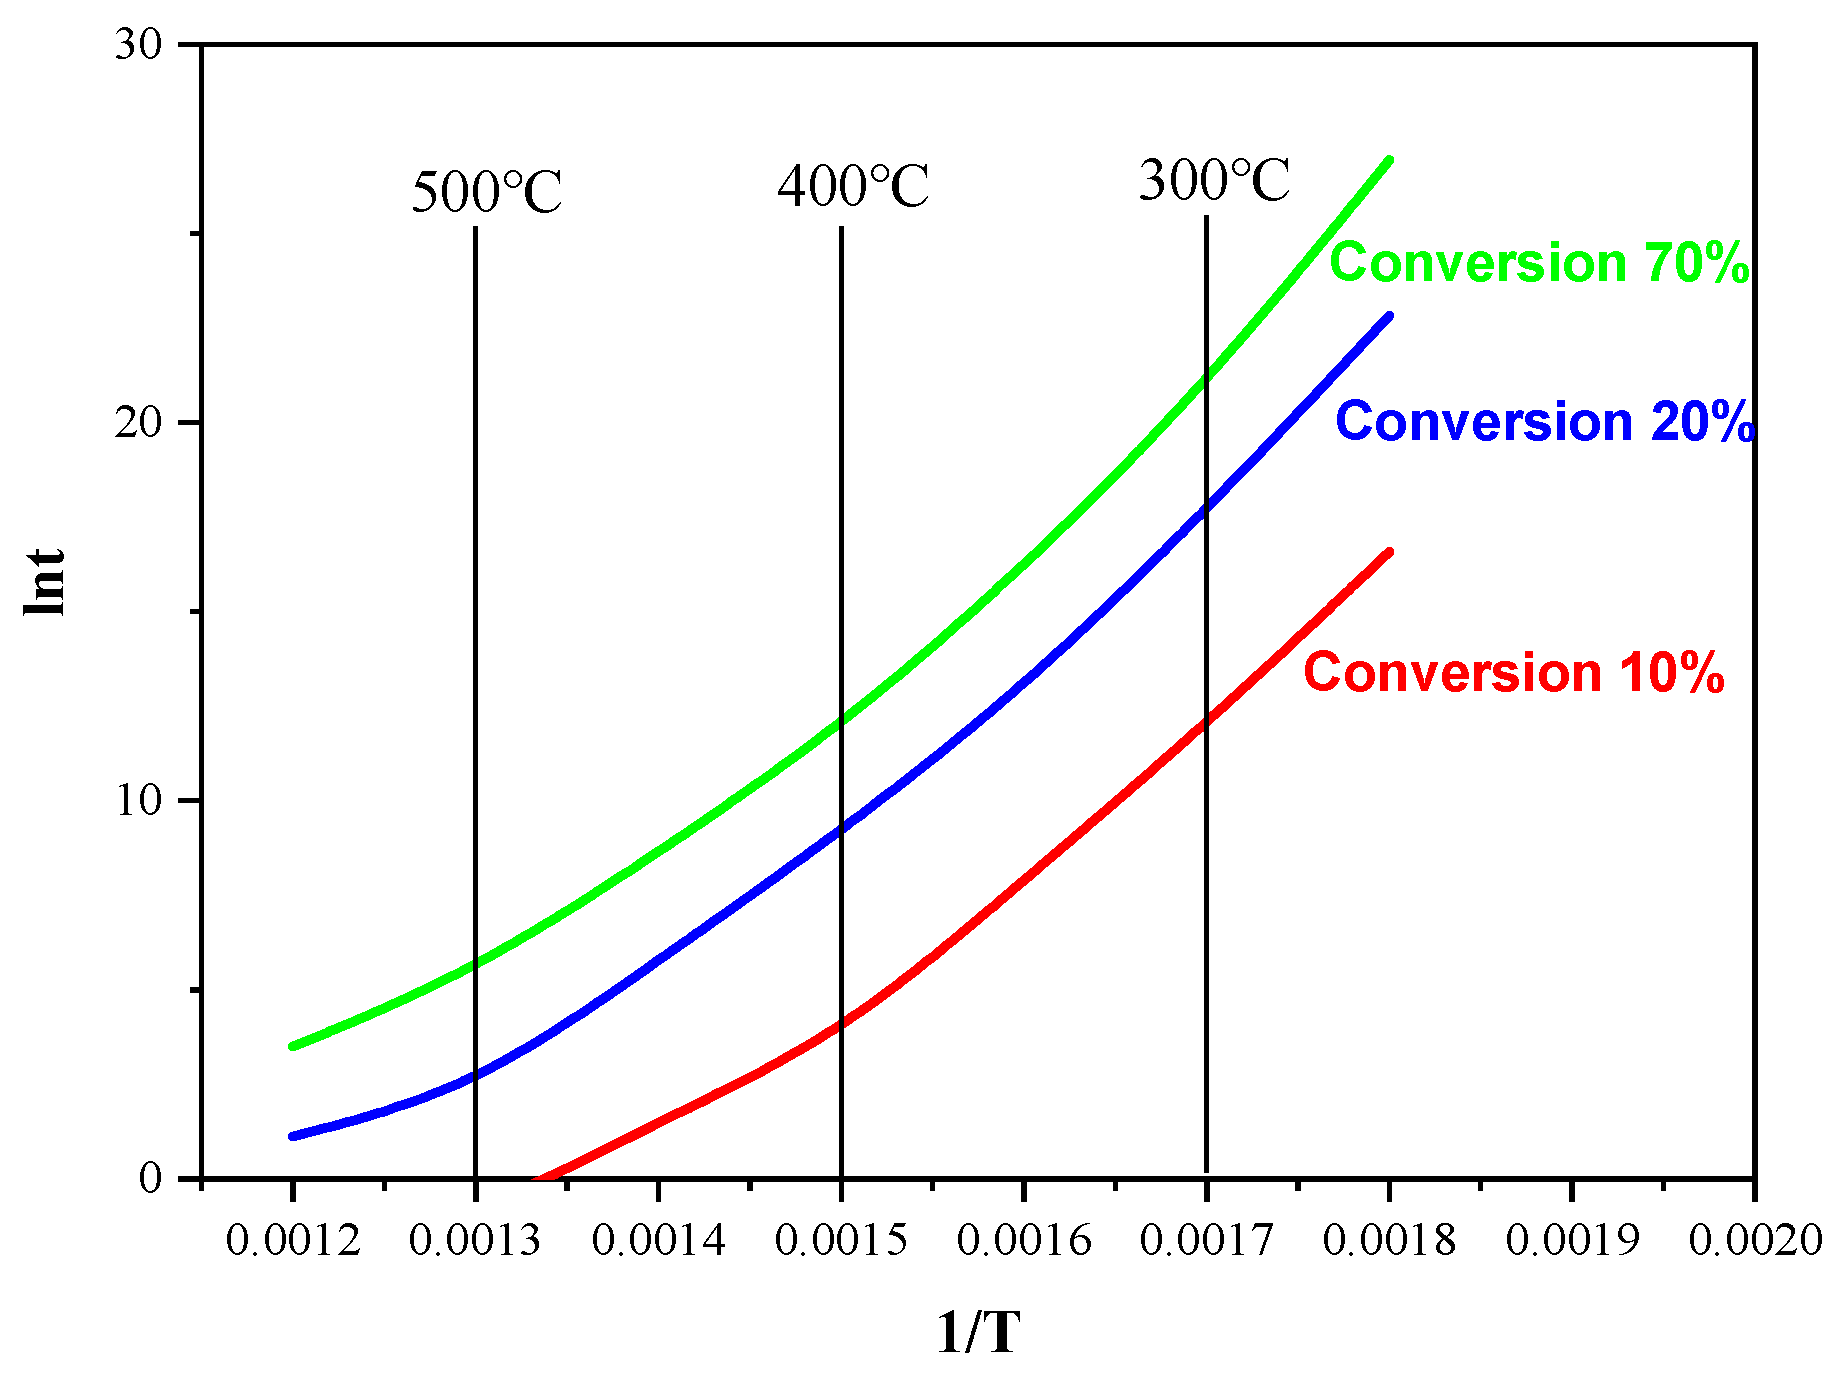
2.8. Temperature–Time-Conversion Diagram

The process of oil shale organic matter (including kerogen) evolving to generate oil and gas can be approximated as a thermal cracking reaction with first-order reaction characteristics. A temperature–time-conversion diagram has been established for the in-situ catalytic upgrading for oil shale conversion.
First, the changes in pyrolysis yield at different heating rates were recorded using a rock pyrolysis analyzer. The pyrolysis data from three different heating rates were inputted into kinetic simulation software to obtain the relationship between the pyrolysis activation energy distribution and the pyrolysis hydrocarbon yield of the oil shale. Finally, based on the correspondence between pyrolysis hydrocarbon yield and conversion rate, as well as the relationship between pyrolysis activation energy and pyrolysis hydrocarbon yield, a curve depicting the relationship between pyrolysis activation energy and conversion rate was established (Figure 10). The process of oil shale organic matter (kerogen) evolving to generate oil and gas was approximated as a first-order thermal cracking reaction, where the reaction rate is proportional to the first power of the reactant concentration. The obtained data on the relationships between pyrolysis activation energy, conversion rate, and frequency factor were substituted into the linear model represented by the expression: l n t = E R T A = 1 T × E R A , resulting in a diagram showing the relationship between the reciprocal of temperature (1/T) and the logarithm of time (lnt) for different conversion rates (Figure 10). This diagram allows for the prediction and determination of the temperature and time required for the in-situ conversion of the oil shale to achieve specific conversion rates, as shown in Table 5 and Table 6. After adding the APG clay-based catalyst, the time required to achieve the same organic matter conversion rate was significantly reduced, especially in the low-temperature region below 300 °C, where the in situ catalytic effect was particularly pronounced.

3. Experimental Section

3.1. Reagents and Instruments

Chlorella: Purchased from Dongying Dazhen Biotechnology Co., Dongying, China. Oil shale: Provided by the Sinopec Petroleum Exploration and Production Research Institute, Beijing, China. 3-Mercaptopropyltrimethoxysilane (MPTMS): Analytical grade, purchased from Aladdin Reagent (Shanghai) Co., Ltd. Attapulgite (APG): 400 mesh, purchased from Changzhou Dingbang Mineral Products Technology Co., Ltd. Kaolin: Purchased from Jinan Xinyi Chemical Co., Ltd. Clinoptilolite (Clin): Purchased from Qingdao Laixi Jinshan Chemical Factory. Hydrogen peroxide (H2O2): Analytical grade, purchased from Sinopharm Chemical Reagent Co., Ltd. Decalin: High purity, purchased from Aladdin Reagent (Shanghai) Co., Ltd. Ammonia (NH3): Analytical grade, purchased from Sinopharm Chemical Reagent Co., Ltd. Ball mill: PM planetary ball mill, purchased from Zhuodi Instrument Co., Ltd.

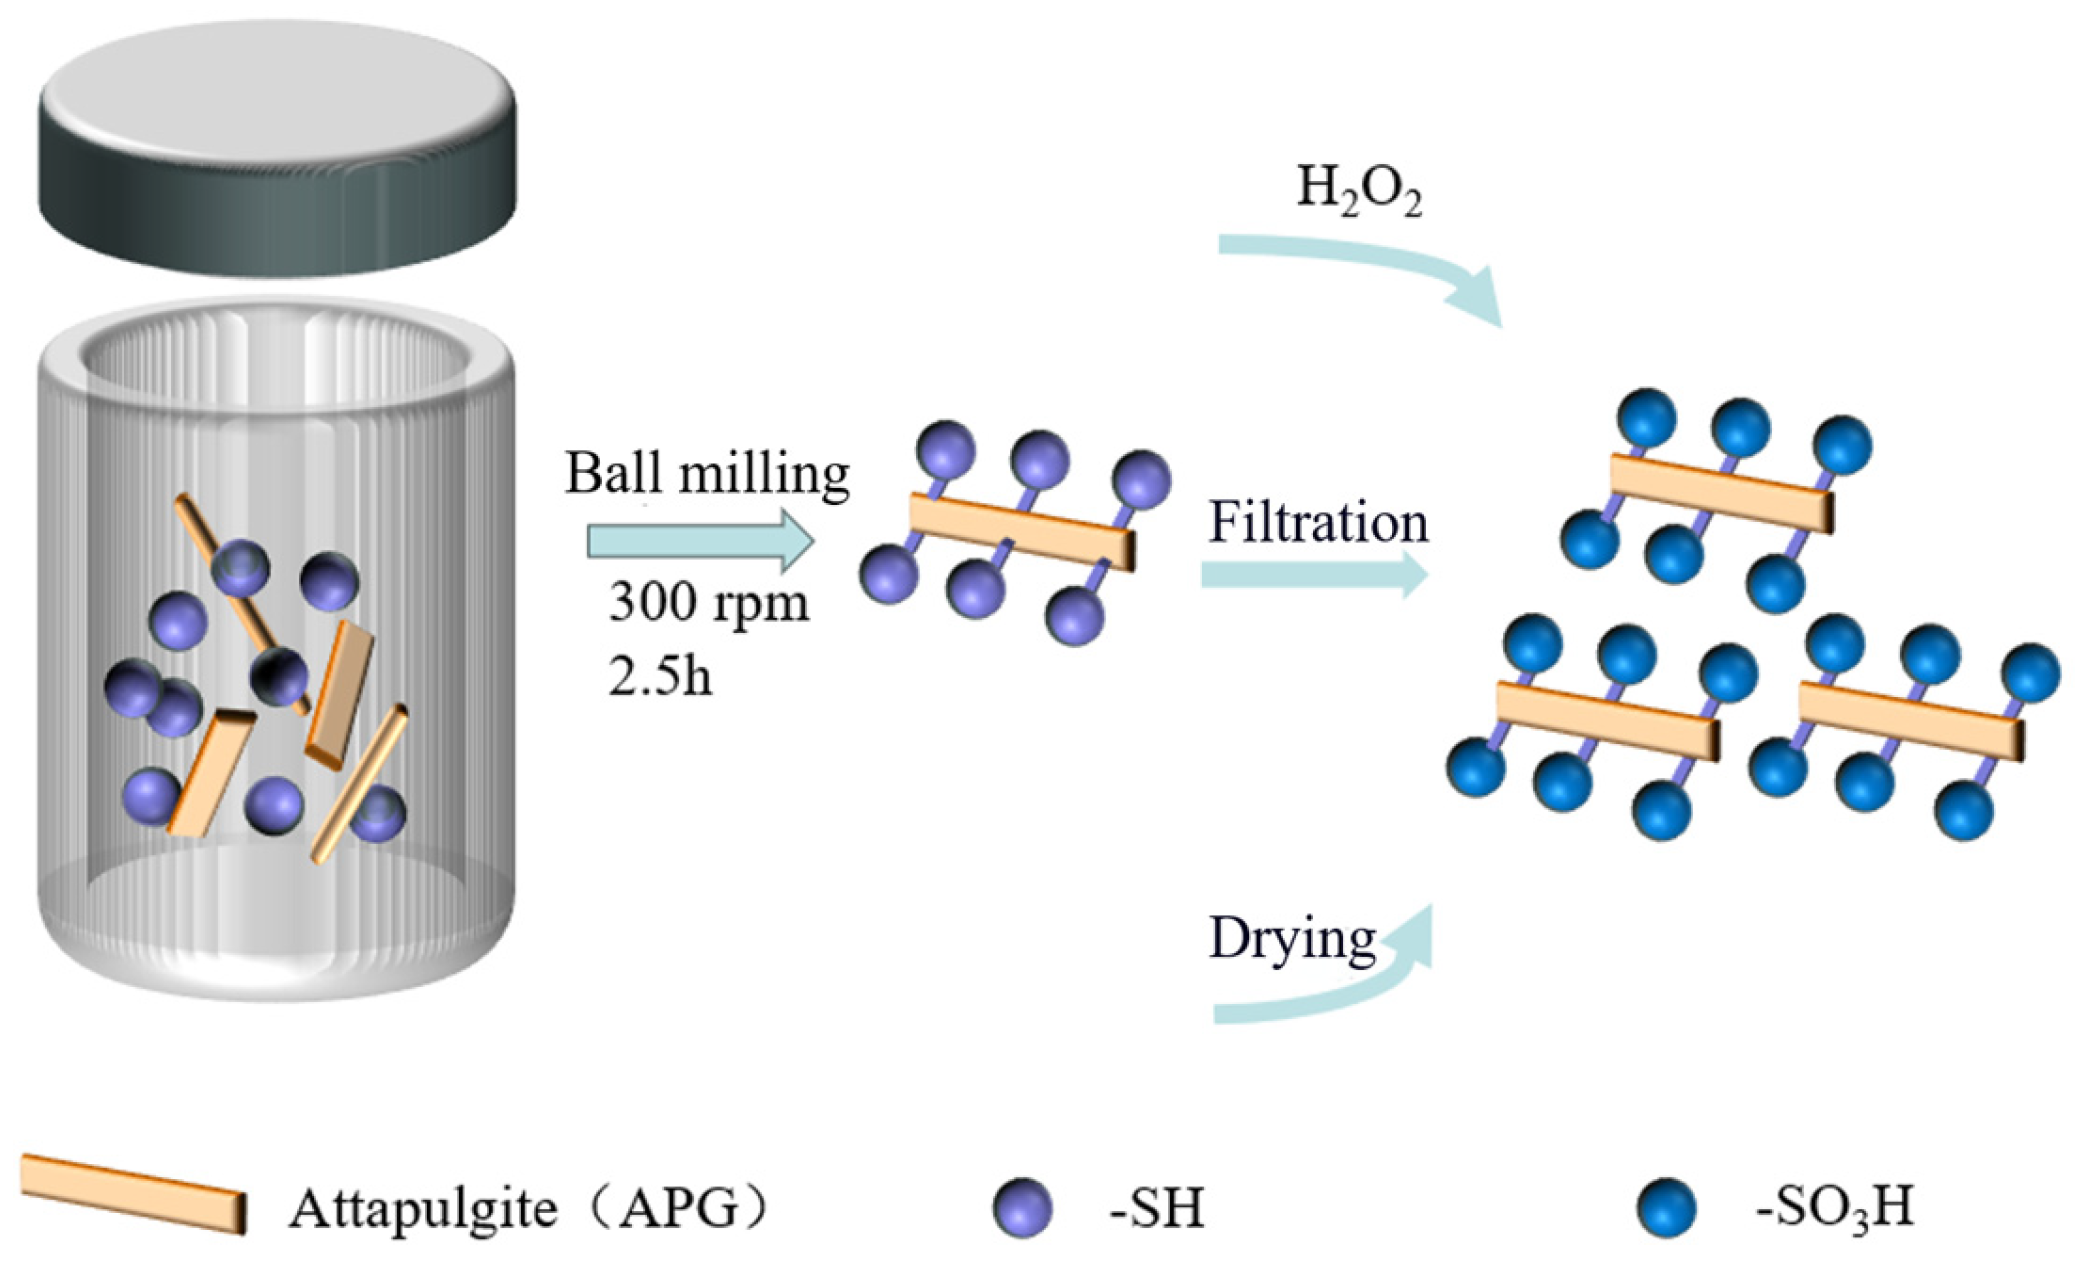
3.2. Catalyst Preparation

The clay-based SO3H-APG catalyst was prepared using a ball-milling method, as shown in the Figure 11. First, -SH groups were grafted onto natural attapulgite (APG) via wet ball milling with 3-mercaptopropyltrimethoxysilane (MPTMS). Then, the -SH groups were oxidized to -SO3H groups using H2O2 solution at room temperature. The specific synthesis procedure is as follows:
Grafting -SH Groups: Add 2 g of attapulgite, 1.6 mL of MPTMS, and 10 mL of water into a 50 mL resin jar. Perform ball milling at 300 rpm for 2.5 h. After the reaction, wash the product three times with distilled water to remove unreacted MPTMS from the catalyst surface. Filter under vacuum and dry at 85 °C for 12 h to obtain APG-SH.
Oxidation to -SO3H Groups: Add the prepared APG-SH to 30 mL of a 15% H2O2 aqueous solution. Stir at room temperature for 12 h. Wash with distilled water and filter under vacuum. Dry at 120 °C to obtain the SO3H-APG catalyst.
The preparation processes for SO3H-kaolin and SO3H-clin catalysts are similar to that of SO3H-APG and can be referenced accordingly.

3.3. Catalyst Activity Evaluation

Add 2 g of Chlorella powder, 2 g of oil shale powder, 0.4 g of catalyst, and 10 mL of water into a parallel high-pressure reactor. Purge the reactor three times with N2 and then seal it. Program the temperature to rise to 280 °C and maintain for 2 h. After cooling, extract the liquefaction products using dichloromethane. Identify the chemical components of the products using gas chromatography-mass spectrometry (GC–MS).

3.4. Catalyst Characterization Methods

Contact-Angle Measurement: DSA100 contact-angle measuring instrument. The droplet size is 5 μL, and the contact angle calculation method is Young–Laplace method. X-ray Diffraction (XRD): Bruker D8 Advance X-ray diffractometer. Fourier-Transform Infrared Spectroscopy (FT-IR): Nicolet 6700 FT-IR spectrometer, and scanning range: 400–4000 cm−1, to identify functional groups based on characteristic peaks in the infrared spectra.
Scanning Electron Microscopy (SEM): ZEISS GeminiSEM 300, to observe the morphology of the catalysts. Transmission Electron Microscopy (TEM): Thermo Fisher Talos F200i, to analyze the high-resolution morphology and pore structure of the catalysts.
BET Surface-Area and Pore-Size Distribution: BSD-PM2 surface analyzer. Pretreatment: Degas the samples at 150 °C for 4 h before analysis. Brunauer–Emmett–Teller (BET) method for surface area. Non-local density functional theory (NLDFT) model for pore-size distribution.

3.5. Analytical and Computational Methods

Gas Chromatography–Mass Spectrometry (GC–MS): Agilent 7890-5975C GC–MS (HP-5 capillary column, FID detector). Operating Conditions: Injection volume: 1 μL. Split Ratio: 5:1. Injection Port Temperature: 300 °C. Carrier Gas: Nitrogen. Temperature Program: Hold at 50 °C for 1 min, ramp at 25 °C/min to 200 °C, and ramp at 3 °C/min to 280 °C and hold for 10 min. Solvent delay: 3 min.
Boiling-point distribution analysis follows the Sinopec SY-T 5779-2008 standard [45]. Elemental analysis of shale oil is done by following standards: GB/T 19143-2017 [46] and GB/T 37160-2019 [47]. Based on GC–MS results, calculate HHV and DOD (degree of deoxygenation) using Equations (1) and (2):
HHV MJ / kg = 0.3383 C + 1.422 ( H O 8 )
DOD = 1 O x y g e n   c o n t e n t   i n   f e e d s t o c k O x y g e n   c o n t e n t   i n   p r o d u c e d   o i l × 100 %
Thermogravimetric Analysis (TGA): Netzsch TG209. Conditions: Atmosphere: Nitrogen. Heating Rates: 5, 10, and 20 °C/min. Temperature Range: room temperature to 650 °C. Sample Preparation: Mix shale powder and catalyst in a 10:1 ratio (or bio-oil and catalyst in a 5:1 ratio). Distribute the mixture evenly on an alumina crucible to ensure good dispersion and minimize heat/mass transfer limitations. The kinetic parameters for the catalytic conversion of bio-oil and oil shale at different heating rates are calculated using the Flynn–Wall–Ozawa (FWO) method [23]. The FWO method is a model-free approach widely used to determine the activation energy (E) of thermal decomposition reactions. It is based on the relationship between the heating rate (β) and the temperature (T) at a fixed conversion rate (α). The FWO equation is expressed as:
lg β = lg A E a RG ( α ) 2.315 0.4567 E a RT
where β is the heating rate (K/min), A is the pre-exponential factor (s−1), E is the activation energy (kJ/mol), R is the universal gas constant (8.314 J/(mol·K)), T is the absolute temperature (K), and g(α) is the integral form of the reaction model.

4. Conclusions

Using natural clay-based aluminosilicate minerals as raw materials, sulfonic acid (-SO3H) groups were grafted via ball milling to introduce acidic sites. Co-liquefaction and co-pyrolysis studies of Chlorella and oil shale were conducted on catalysts such as SO3H-APG. Compared with the catalytic liquefaction of Chlorella alone, the co-liquefaction product oil exhibited an increased H/C atomic ratio of 1.75, a deoxygenation degree of 49.81%, and a higher calorific value of 43.2 MJ/kg. Co-pyrolysis analysis also revealed that the synergistic effect between the two materials reduced the activation energy compared with their individual pyrolysis. Oil shale, with its inherently high H/C atomic ratio, acts as a hydrogen donor, combining with oxygen-containing functional groups in the bio-oil to promote the formation of hydrocarbons. Catalytic pyrolysis experiments of kerogen demonstrated that in the conversion rate range of 0.20–0.35, the activation energy (Ea) rapidly increased from 92.05 kJ/mol to 165.49 kJ/mol, indicating the highest in situ hydrocarbon generation rate during this stage. Based on the oil shale pyrolysis kinetic diagram, it is predicted that the addition of the APG clay-based catalyst significantly reduces the time required to achieve the same organic matter conversion rate, particularly in the low-temperature region below 300 °C, where the in situ catalytic effect is highly pronounced.

Author Contributions

X.M.: conceptualization, investigation, data curation, writing—original draft. R.S.: investigation, formal analysis, validation, writing—review and editing. J.B.: methodology, supervision, writing—review and editing. All authors have read and agreed to the published version of the manuscript.

Funding

This research was funded by State Energy Center for Shale Oil Research and Development (G5800-18-ZS-KFNY007), the National Key R & D Program of China under Grant (2019YFA0705503), and Shandong Provincial Natural and Scientific funding (ZR2022MB049).

Data Availability Statement

Data are contained within the article.

Conflicts of Interest

Author Xianglong Meng is employed by the company SINOPEC. The remaining authors declare that the research was conducted in the absence of any commercial or financial relationships that could be construed as a potential conflict of interest.

References

  1. Alazaiza, M.Y.D.; Alzghoul, T.M.; Ramu, M.B.; Nassani, D.E. Catalysis in Biofuel Production and Biomass Valorization: Trends, Challenges, and Innovations Through a Bibliometric Analysis. Catalysts 2025, 15, 227. [Google Scholar] [CrossRef]
  2. Ahmed, E.M.; Samuel, D.; Cedric Karel Fonzeu, M.; Hao, W.; Ahmed, I.O.; Zhen-Yu, T. Catalytic production of aviation jet biofuels from biomass: A review. Environ. Chem. Lett. 2025, 23, 419–461. [Google Scholar] [CrossRef]
  3. Faizan, M.; Song, H. Critical review on catalytic biomass gasification: State-of-Art progress, technical challenges, and perspectives in future development. J. Clean. Prod. 2023, 408, 137224. [Google Scholar] [CrossRef]
  4. de Deus Junior, J.O.; Alves, J.L.F.; de Melo e Melo, V.R.; de Oliveira, Â.A.S.; de Oliveira, K.F.S.; de Araújo Melo, D.M.; Braga, R.M. Conversion of microalgae into renewable hydrocarbons through catalytic pyrolysis: A bibliometric analysis. Algal Res. 2024, 81, 103602. [Google Scholar] [CrossRef]
  5. Raíssa Aparecida da Silveira, R.; Janaína Miranda, B.; Marcos Antonio de Souza, B.; Luiz Gustavo Martins, V. Catalytic solar hydropyrolysis of the Chlamydomonas reinhardtii microalgae. Biomass Bioenergy 2021, 152, 106183. [Google Scholar] [CrossRef]
  6. Elhassan, M.; Abdullah, R.; Kooh, M.R.R.; Chou Chau, Y.-F. Hydrothermal liquefaction: A technological review on reactor design and operating parameters. Bioresour. Technol. Rep. 2023, 21, 101314. [Google Scholar] [CrossRef]
  7. Ocampo, E.; Beltrán, V.V.; Gómez, E.A.; Ríos, L.A.; Ocampo, D. Hydrothermal liquefaction process: Review and trends. Curr. Res. Green Sustain. Chem. 2023, 7, 100382. [Google Scholar] [CrossRef]
  8. Shahbeik, H.; Kazemi Shariat Panahi, H.; Dehhaghi, M.; Guillemin, G.J.; Fallahi, A.; Hosseinzadeh-Bandbafha, H.; Amiri, H.; Rehan, M.; Raikwar, D.; Latine, H.; et al. Biomass to biofuels using hydrothermal liquefaction: A comprehensive review. Renew. Sustain. Energy Rev. 2024, 189, 113976. [Google Scholar] [CrossRef]
  9. Goswami, G.; Makut, B.B.; Das, D. Sustainable production of bio-crude oil via hydrothermal liquefaction of symbiotically grown biomass of microalgae-bacteria coupled with effective wastewater treatment. Sci. Rep. 2019, 9, 15016. [Google Scholar] [CrossRef]
  10. Piyatilleke, S.; Thevarajah, B.; Nimarshana, P.H.V.; Ariyadasa, T.U. Microalgal biofuels: Challenges and prospective in the framework of circular bioeconomy. Energy Nexus 2025, 17, 100338. [Google Scholar] [CrossRef]
  11. Taheri-Shakib, J.; Kantzas, A. A comprehensive review of microwave application on the oil shale: Prospects for shale oil production. Fuel 2021, 305, 121519. [Google Scholar] [CrossRef]
  12. Hu, S.; Zhao, W.; Hou, L.; Yang, Z.; Zhu, R.; Wu, S.; Bai, B.; Jin, X. Development potential and technical strategy of continental shale oil in China. Pet. Explor. Dev. 2020, 47, 877–887. [Google Scholar] [CrossRef]
  13. Zhan, H.; Yang, Q.; Qin, F.; Meng, Z.; Chen, R.; Miao, X.; Zhao, K.; Yue, W. Comprehensive preparation and multiscale characterization of kerogen in oil shale. Energy 2022, 252, 124005. [Google Scholar] [CrossRef]
  14. Wang, Q.; Hou, Y.; Wu, W.; Liu, Q.; Liu, Z. The structural characteristics of kerogens in oil shale with different density grades. Fuel 2018, 219, 151–158. [Google Scholar] [CrossRef]
  15. Gong, M.; Jiang, W.; Wang, S.; Liu, P.; Xu, F.; Wang, W.; Fan, Y. Bio-oil production from hydrothermal liquefaction of algal biomass: Effects of feedstock properties and reaction parameters. J. Environ. Chem. Eng. 2024, 12, 114010. [Google Scholar] [CrossRef]
  16. Cui, S.; Yang, T.; Zhai, Y.; Zhu, Y.; Yu, Z.; Kai, X. Investigation on the characteristics and interaction of co-pyrolysis of oil shale and peanut shell. Fuel 2023, 340, 127502. [Google Scholar] [CrossRef]
  17. Xian, S.; Xu, Q.; Feng, Y. Simultaneously remove organic pollutants and improve pyrolysis gas quality during the co-pyrolysis of soybean straw and oil shale. J. Anal. Appl. Pyrolysis 2022, 167, 105665. [Google Scholar] [CrossRef]
  18. Wu, A.; Wu, J.; Chen, L.; Su, J.; Yu, W. Recent Progress on In Situ Catalytic Conversion Catalysts for Oil Shale. ACS Omega 2024, 9, 36904–36916. [Google Scholar] [CrossRef]
  19. Li, D.; Pan, H.; Di, X.; Liu, X.; Hu, H. Progress in Catalytic Pyrolysis of Oil Shale. Scanning 2021, 2021, 6759176. [Google Scholar] [CrossRef]
  20. Huang, L.; Zhang, Y.; Zhang, L.; Zhang, X.; Sun, G. Effects of shale ash and FCC catalyst on adjusting secondary reaction of volatiles in oil shale pyrolysis. CIESC J. 2017, 68, 3770–3778. [Google Scholar] [CrossRef]
  21. Li, J.; Li, C.; Ma, X.; Tang, X.; Meng, X.; Wang, X. Investigation of catalytic hydrothermal co-liquefaction of oil shale and algal biomass. J. Anal. Appl. Pyrolysis 2025, 186, 106974. [Google Scholar] [CrossRef]
  22. Chang, Z.; Wang, X.; Hao, C.; Kuang, W.; Wang, C.; Zhou, L.; Chu, M. Non-catalytic and In-situ catalytic co-pyrolysis of Huadian oil shale and microalgae using several additives as catalyst. J. Anal. Appl. Pyrolysis 2023, 172, 106012. [Google Scholar] [CrossRef]
  23. Yu, Z.; Dai, M.; Huang, M.; Fang, S.; Xu, J.; Lin, Y.; Ma, X. Catalytic characteristics of the fast pyrolysis of microalgae over oil shale: Analytical Py-GC/MS study. Renew. Energy 2018, 125, 465–471. [Google Scholar] [CrossRef]
  24. Yin, Y.; Qi, Y.; Ma, C.; Li, W.; Luo, S.; Liu, S. Efficient conversion of cellulose to 5-hydroxymethylfurfural using a bifunctional hydrophobic SBA-15 catalyst: The effects of hydrophobicity, morphology and acidity. Fuel Process. Technol. 2023, 245, 107752. [Google Scholar] [CrossRef]
  25. Li, Y.; Zhu, K.; Jiang, Y.; Chen, L.; Zhang, H.; Li, H.; Yang, S. Biomass-derived hydrophobic metal-organic frameworks solid acid for green efficient catalytic esterification of oleic acid at low temperatures. Fuel Process. Technol. 2023, 239, 107558. [Google Scholar] [CrossRef]
  26. Zhang, Z.; Volkman, J.K.; Xie, X.; Snowdon, L.R. Stepwise pyrolysis of the kerogen from the Huadian oil shale, NE China: Algaenan-derived hydrocarbons and mid-chain ketones. Org. Geochem. 2016, 91, 89–99. [Google Scholar] [CrossRef]
  27. Veski, R.; Veski, S. Aliphatic dicarboxylic acids from oil shale organic matter–historic review. Oil Shale 2019, 36, 76–95. [Google Scholar] [CrossRef]
  28. Gelin, F.; Volkman, J.K.; Largeau, C.; Derenne, S.; Sinninghe Damsté, J.S.; De Leeuw, J.W. Distribution of aliphatic, nonhydrolyzable biopolymers in marine microalgae. Org. Geochem. 1999, 30, 147–159. [Google Scholar] [CrossRef]
  29. Ariskina, K.A.; Yuan, C.; Abaas, M.; Emelianov, D.A.; Rodionov, N.; Varfolomeev, M.A. Catalytic effect of clay rocks as natural catalysts on the combustion of heavy oil. Appl. Clay Sci. 2020, 193, 105662. [Google Scholar] [CrossRef]
  30. Abeyta, K.P.; Silva, M.L.A.d.; Silva, C.L.S.; Pontes, L.A.M.; Teixeira, L.S.G. Clay-based catalysts applied to glycerol valorization: A review. Sustain. Chem. Pharm. 2024, 40, 101641. [Google Scholar] [CrossRef]
  31. Khadijeh, R. Recent Application of Clay-Based Heterogeneous Catalyst in Organic Reactions. J. Inorg. Organomet. Polym. Mater. 2025, 1–22. [Google Scholar] [CrossRef]
  32. Luo, C.; Liu, H.; Zhou, S.; Li, J.; Li, X.; Huang, Y. Catalytic role of various clay minerals during the thermal reaction process with oxidized and pyrolyzed oils. J. Therm. Anal. Calorim. 2024, 149, 8681–8691. [Google Scholar] [CrossRef]
  33. Rinaudo, M.G.; Beltrán, A.M.; Fernández, M.A.; Cadús, L.E.; Morales, M.R. Tailoring materials by high-energy ball milling: TiO2 mixtures for catalyst support application. Mater. Today Chem. 2020, 17, 100340. [Google Scholar] [CrossRef]
  34. Huang, F.; Wang, H.; Chen, J.-S.; Yang, B. Dry ball milling and wet ball milling for fabricating copper–yttria composites. Rare Met. 2018, 37, 859–867. [Google Scholar] [CrossRef]
  35. Mañosa, J.; Alvarez-Coscojuela, A.; Maldonado-Alameda, A.; Chimenos, J.M. A Lab-Scale Evaluation of Parameters Influencing the Mechanical Activation of Kaolin Using the Design of Experiments. Materials 2024, 17, 4651. [Google Scholar] [CrossRef] [PubMed]
  36. Meng, J.; Wang, J.; Wang, L.; Lyu, C.; Chen, H.; Lyu, Y.; Nie, B. Preparation and performance of superhydrophobic surfaces with low surface energy modified attapulgite. J. Mol. Struct. 2024, 1295, 136586. [Google Scholar] [CrossRef]
  37. Xue, S.; Li, B.; Mu, P.; Li, J. Designing attapulgite-based self-healing superhydrophobic coatings for efficient corrosion protection of magnesium alloys. Prog. Org. Coat. 2022, 170, 106966. [Google Scholar] [CrossRef]
  38. Li, X.; Yang, R.; Wang, D.; Li, G. Study on surface modification of attapulgite. In Proceedings of the IOP Conference Series: Earth and Environmental Science, Qingdao, China, 12–14 June 2020. [Google Scholar] [CrossRef]
  39. Che, C.; Wu, J.; Shen, Z.; Ning, H.; Tang, R.; Liang, S.; Zhang, J.; Jiang, H.; Yuan, S. Catalytic Conversion of Oil Shale over Fe or Ni Catalysts under Sub-Critical Water. Processes 2024, 12, 949. [Google Scholar] [CrossRef]
  40. Durak, H.; Genel, S. Catalytic hydrothermal liquefaction of lactuca scariola with a heterogeneous catalyst: The investigation of temperature, reaction time and synergistic effect of catalysts. Bioresour. Technol. 2020, 309, 123375. [Google Scholar] [CrossRef]
  41. Lu, J.; Wu, J.; Zhang, L.; Liu, Z.; Wu, Y.; Yang, M. Catalytic hydrothermal liquefaction of microalgae over mesoporous silica-based materials with site-separated acids and bases. Fuel 2020, 279, 118529. [Google Scholar] [CrossRef]
  42. Yu, C.; Qi, Z.; Bian, J.; Song, R.; Wang, W.; Li, C. Insight into acid-base bifunctional catalysts for microalgae liquefaction and bio-oil pyrolysis: Product characteristics, energy recovery and kinetics. J. Anal. Appl. Pyrolysis 2021, 155, 105086. [Google Scholar] [CrossRef]
  43. Cui, Z.; Lu, Y.; Cao, R.; Huang, D.; Zhang, G.; Zhang, Y. Synergistic effect and hydrogen migration during co-pyrolysis of oil shale and cherry pit. Fuel 2024, 365, 131275. [Google Scholar] [CrossRef]
  44. Baruah, B.; Tiwari, P. Investigation of co-pyrolysis mechanism of oil shale and rubber seed shell, product yield and optimization of pyrolysis parameter using response surface methodology. Fuel 2022, 317, 123441. [Google Scholar] [CrossRef]
  45. SY-T 5779-2008. Available online: https://codeofchina.com/standard/SYT5779-2008.html (accessed on 22 March 2025).
  46. GB/T 19143-2017. Available online: https://codeofchina.com/standard/GBT19143-2017.html (accessed on 22 March 2025).
  47. GB/T 37160-2019. Available online: https://www.chinesestandard.net/PDF.aspx/GBT37160-2019 (accessed on 22 March 2025).
Figure 1. Hydrophobization evaluation of clay-based catalysts.
Catalysts 15 00322 g001
Figure 2. TEM images of catalysts: (a1,a2) SO3H-APG, (b1,b2) SO3H-kaolin, and (c1,c2): SO3H-clin.
Catalysts 15 00322 g002
Figure 3. N2 adsorption–desorption and pore-size distribution curves of catalysts: (a) SO3H-APG, (b) SO3H-kaolin, and (c) SO3H-clin.
Catalysts 15 00322 g003
Figure 4. FT-IR spectra of SO3H-APG catalyst.
Catalysts 15 00322 g004
Figure 5. Carbon number (a) and boiling point (b) distribution of Chlorella and oil shale co-liquefaction products. (280 °C, 2 h; Chlorella:oil shale:water:catalyst = 2:2:10:0.4).
Catalysts 15 00322 g005
Figure 6. Van-Krevelen diagram of Chlorella and oil shale co-liquefaction products (red: Chlorella; blue: oil shale; green: Chlorella + oil shale).
Catalysts 15 00322 g006
Figure 7. TG (a) and DTG (b) curves of Chlorella and oil shale co-pyrolysis (N2, atmospheric pressure; the heating rate 10 °C/min).
Catalysts 15 00322 g007
Figure 8. The TG and DTG curves of kerogen with different heating rates.
Catalysts 15 00322 g008
Figure 9. Demonstration for kerogen pyrolysis conversion vs. temperature from kinetic-free model.
Catalysts 15 00322 g009
Figure 10. Oil shale organic matter catalytic conversion: temperature–time-conversion diagram.
Catalysts 15 00322 g010
Figure 11. Preparation route of SO3H-APG catalyst.
Catalysts 15 00322 g011
Table 1. Pore-structure parameters of catalysts.
Surface Area (m2/g)Pore Volume (cm3/g)Pore Diameter DFT (nm)
DmicroDmeso
APG11520.22--
SO3H-APG1270.031.642.26
Kaolin620.30--
SO3H-kaolin1170.141.012.54
clin2600.76--
SO3H-clin1110.260.432.09
Table 2. Product distribution (wt%) and elemental composition of Chlorella and oil shale co-liquefaction.
HydrocarbonsN-Containing Compounds Alcohols Ketones Phenols Organic Acids Esters
Without catalyst31.2829.744.7315.374.8610.343.68
With SO3H-APG53.2121.143.1710.612.404.844.63
With SO3H-kaolin49.6823.553.0711.493.924.973.32
With SO3H-clin45.8326.232.8612.582.665.464.38
Element/wt%Atomic RatioHHV
(MJ/kg)
DOD
(%)
CHONH/CO/C
Without catalyst76.3410.197.755.721.60180.076538.93--
With SO3H-APG80.4311.733.893.951.75010.036343.2049.81
With SO3H-kaolin79.5311.134.065.281.67940.038342.0147.61
With SO3H-clin78.3211.084.955.651.69770.047441.3736.13
Table 3. Characteristic parameters of Chlorella and oil shale co-pyrolysis.
Feed + CatalystMaximum Weight Loss TM (°C)Active Energy Ea (kJ·mol−1)Correlation Coefficient R2Pre-Exponential Factor A (h−1)Temperature Range (°C)
Chlorella + SO3H-APG299.9976.890.985.45 × 106150–500
shale + SO3H-APG449.17107.740.992.79 × 109350–500
Chlorella + shale + SO3H-APG300.0868.050.982.92 × 105180–380
435.08100.430.991.72 × 109380–500
Table 4. Characteristic temperatures (°C) of kerogen pyrolysis on SO3H-APG at different heating rates and kinetic parameters.
Conversion Rateβ (°C/min)Ea (kJ/mol)r
251020
0.0558.185.1138.17123.64-<0.92
0.10191.54271.07295.77298.89-<0.92
0.15272.08338.57353.35367.2459.490.9338
0.20326.92375.99384.04403.1092.050.9546
0.25361.10400.01405.81425.61122.430.9653
0.30383.87416.95421.62441.66147.290.9706
0.35400.22430.05435.45454.24165.490.9762
0.40412.82440.94446.30464.88178.260.9782
0.45423.2450.82456.15478.23175.970.9803
0.50432.41460.70467.01483.85189.320.9792
0.55441.55472.62479.81493.70186.940.9714
0.60452.14493.92501.45505.82-<0.92
0.65469.59572.31575.24525.98-<0.92
0.70520.33780.10672.69606.95-<0.92
Table 5. In situ conversion: temperature–time-conversion relationship.
TemperatureConversion (%)
106070
280 °C7.4 months280 years11,500 years
300 °C2.3 days1.5 years40.12 years
350 °C0.98 h7 days4 months
400 °C0.029 h3.2 h2.4 days
450 °C0.0017 h0.15 h1.87 h
500 °C0.00014 h0.008 h0.089 h
Table 6. In situ catalytic conversion with SO3H-APG: temperature–time-conversion relationship.
TemperatureConversion (%)
106070
280 °C6.2 months260 years11,350 years
300 °C1.9 days1.5 years42.12 years
350 °C0.76 h5 days4 months
400 °C0.012 h2.7 h1.8 days
450 °C0.0013 h0.09 h1.56 h
500 °C0.0001 h0.003 h0.068 h
Disclaimer/Publisher’s Note: The statements, opinions and data contained in all publications are solely those of the individual author(s) and contributor(s) and not of MDPI and/or the editor(s). MDPI and/or the editor(s) disclaim responsibility for any injury to people or property resulting from any ideas, methods, instructions or products referred to in the content.

