Article

Assessing the CO2 Capture and Electro-Reduction in Imidazolium-Based Ionic Liquids: Role of the Ion Exchange Membrane

by
Mario Gallone
1,
Alessia Fortunati
1,2 and
Simelys Hernández
1,*
1
CREST Group, Department of Applied Science and Technology (DISAT), Politecnico di Torino, Corso Duca degli Abruzzi 24, 10129 Turin, Italy
2
Istituto Italiano di Tecnologia, Via Livorno 60, 10144 Turin, Italy
*
Author to whom correspondence should be addressed.
Catalysts 2025, 15(4), 318; https://doi.org/10.3390/catal15040318
Submission received: 20 February 2025 / Revised: 16 March 2025 / Accepted: 17 March 2025 / Published: 26 March 2025
(This article belongs to the Special Issue Green Heterogeneous Catalysis for CO2 Reduction)

Abstract

:
The electrochemical CO2 reduction (eCO2RR) to valuable chemicals offers a promising method to combat global warming by recycling carbon. Among the possible products, syngas—a CO and H2 mixture—is especially valuable for industrial reactions. The use of Room Temperature Ionic Liquids (RTILs) electrolytes presents a promising pathway for eCO2RR because of the lower overpotential required and the increased CO2 solubility with respect to the aqueous ones. Ensuring a constant CO/H2 production is essential, and it relies on both the catalyst and reactor design. This study explores eCO2RR in RTIL mixtures of 1-butyl-3-methyl imidazolium trifluoromethanesulfonate (good for CO2 conversion) and 1-butyl-3-methyl imidazolium acetate (good for CO2 capture), with various amounts of water as a proton source. We evaluated syngas production stability across different electrochemical cells and ion exchange membranes after determining the appropriate electrolyte mixture for a suitable CO/H2 ratio near 1:1. The two-chamber cell configuration outperformed single-cell designs by reducing oxidative RTILs degradation and by-products formation. Using a bipolar membrane (BPM) in forward mode led to catholyte acidification, causing an increase of HER relative to eCO2RR over time, confirmed by Multiphysics modeling. Conversely, an anionic exchange membrane (AEM) maintained constant syngas production over extended periods. This work offers guidelines for syngas generation in RTIL-based systems from waste-CO2 reduction, which can be useful for other green chemical synthesis processes.

Graphical Abstract

1. Introduction

Increasing CO2 atmospheric concentration (from 280 ppm during the pre-industrial era to 426 ppm reached in 2024) is a crucial threat to humankind, leading to global warming. To face this challenge, many efforts have been dedicated to valorizing waste CO2 to obtain value-added products. Electrochemistry plays a pivotal role since CO2 can be reduced to other chemical species, such as CO [1,2,3], HCOOH [4,5,6], CH4 [7,8,9], C2H4 [10,11,12,13], and CH3OH [14,15,16] via the electrochemical CO2 reduction reaction (eCO2RR). In particular, the simultaneous production of CO and H2, defined syngas, is a crucial reagent for industrially relevant reactions [17,18,19,20,21,22,23] When investigating the conversion of CO2 dissolved in the liquid electrolyte, aqueous-based electrolytes suffer from low CO2 solubility (30 mM) [17], leading to sluggish reaction kinetics and competing side reactions, like the H2 evolution reaction (HER). Therefore, organic solvents such as acetonitrile [18] (CH3CN) are used, enabling a higher CO2 solubility (0.02 mol%) [19], but usually entailing low conductivity and lack of stability under electrochemical conditions because of electrode passivation or solvent degradation. However, overcoming these challenges requires the development of electrolytes that provide improved CO2 transport, stability, and tailored interactions with reaction intermediates. In this scenario, Room Temperature Ionic Liquids (RTIL) have been studied as effective electrolytes for eCO2RR applications [20,21,22,23,24]. RTILs are molten salts at ambient conditions. Their ionic nature makes RTILs very conductive. However, due to the strong ionic interactions between the cations and the anions, they usually suffer from high viscosity. Thus, dissolving RTILs in an organic solvent (e.g., CH3CN or 3-methoxypropionitrile, 3-MPN) is a good strategy for obtaining highly conductive electrolytes. RTILs offer superior CO2 solubility and a wider electrochemical stability window compared to other non-aqueous electrolytes, making them the ideal choice for CO2 capture and conversion applications; they act as co-catalysts by interacting with CO2 and stabilizing the intermediate CO2•− radical anion (generally considered to be the rate-determining step for CO2 activation), lowering the eCO2RR overpotential [25,26]. Imidazolium-based RTILs have shown excellent CO2 capture properties [19], and high conversion efficiencies [27,28]. The capture properties are related to the ability of the imidazolium cation to release a proton, forming a highly reactive carbene species; this carbene can interact with CO2, forming a Bmim-CO2 complex. The ability to form the carbene species is controllable by choosing the right anion, as highlighted by the work of Fortunati et al. [29,30].
Not only the electrolyte or the electrocatalyst design [31,32], but the reactor setup also plays an important role [33,34]. The electrochemical configurations (e.g., the type of electrochemical cell employed) strongly influence the outcome of the process. A single-compartment cell is a simple, easy-to-operate setup commonly used in lab experiments exploiting RTILs. It requires a few amount of electrolyte and bypasses the anolyte optimization process. However, coexistence in the same cathodic and anodic processes environment can lead to undesired oxidation/reduction of the cathodic/anodic products. Besides, the electrolyte should be optimized to be simultaneously suitable for eCO2RR at the cathode and Oxygen Evolution reaction (OER) at the anode [35,36]. Instead, the membrane is a decisive parameter when using two-compartment cells (e.g., H-type cells) [37]. For aqueous-based eCO2RR applications, a bipolar membrane (BPM) is generally preferred to enhance the CO2 single-pass conversion (SPC) with respect to an anionic exchange membrane (AEM). CO2 forms (bi)carbonate anions in water, which migrate from the catholyte to the anolyte through the AEM and re-oxidizes at the anode, causing CO2 loss [38].
The present work studies mixtures of imidazolium-based RTILs, with and without adding water as a proton source, as electrolytes for eCO2RR to syngas on Ag by using laboratory-scale electrochemical cells. Based on a recent work of some of us [30], we selected 1-butyl-3-methyl imidazolium trifluoromethane sulfonate ([Bmim] [CF3SO3]), which promotes highly selective CO production, and 1-butyl-3-methyl imidazolium acetate ([Bmim] [CH3CO2]), which is a good CO2 capture RTIL and promotes HER. Hence, the synergistic effect of the two anions was exploited here to achieve a tunable and constant CO/H2 ratio during syngas production [39,40,41,42]. The system’s selectivity and stability towards syngas evolution depended on configuration parameters such as electrolyte composition and electrochemical cell employed. In the case of the two-compartment H-cell configuration, the role of the membrane employed in the reaction outcome was studied experimentally and with COMSOL 6.1 (COMSOL Srl, Brescia, Italy) Multiphysics modeling.
This work provides guidelines to control the CO/H2 ratio and stability in RTIL-based electrolytes by exploiting their CO2 capture and cocatalyst features. Moreover, we (i) highlight the necessity to take into account the eventual degradation processes of the RTILs, avoidable by separating the anode and cathode chambers; (ii) most importantly, we warn the reader that BPM is not always the right choice when talking about eCO2RR. This work paves the way for developing sustainable integrated RTILs-based technologies for synthesizing fine chemicals (for example, via carbonylation [43,44], hydroformylation or thermocatalytic processes for methanol production), requiring different CO/H2 ratios (from pure CO to CO/H2 = 2 to 0.5), starting from syngas electrochemically generated from CO2 [45,46].

2. Results

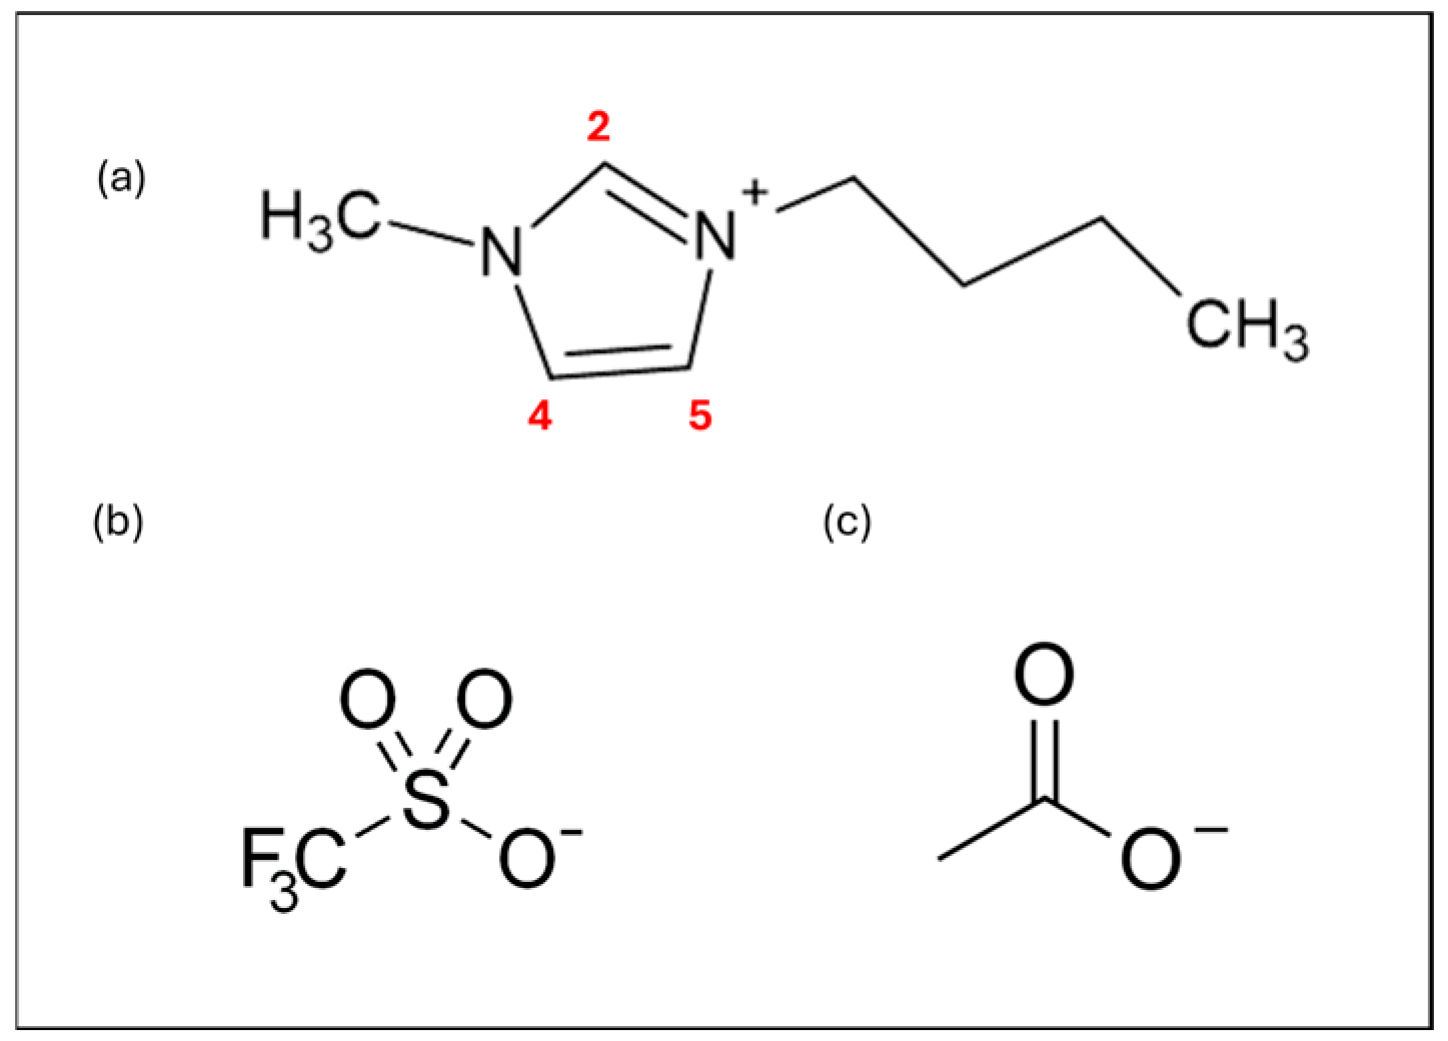
2.1. Electrolyte Preparation

Electrolytes were prepared by mixing two different ILs, i.e., [Bmim] [CH3CO2 and [Bmim] [CF3SO3] (The chemical structures of the RTILs are depicted in Figure 1), in 3-MPN. Different amounts of H2O were added to the mixture to act as a proton source for eCO2RR and HER. In principle, controlling the CO/H2 ratio should be possible by varying the water content. Mixtures of 1.6 M of [Bmim] [CF3SO3] and 2.4 M of [Bmim] [CH3CO2] in 3-MPN were used to maximize the conductivity of each IL component (see Figure S1 in the Supplementary Materials). Then, different volumetric percentages of H2O were added to the original solution, namely 20%v/v, 10%v/v, 5%v/v, and 1%v/v, until a total volume of 50 mL (see molar compositions in Table 1). The different mixes were named based on the water addition (%v/v). MIX0% stands for the electrolyte without any further addition of water (besides water traces < 110 ppm are present, see Section 4.1), while MIX20% contains 20%v/v of H2O. Logically, the molarity of the ILs decreases with the increase in water content. The ratio between triflate’s and acetate’s molarities was kept constant at 2.

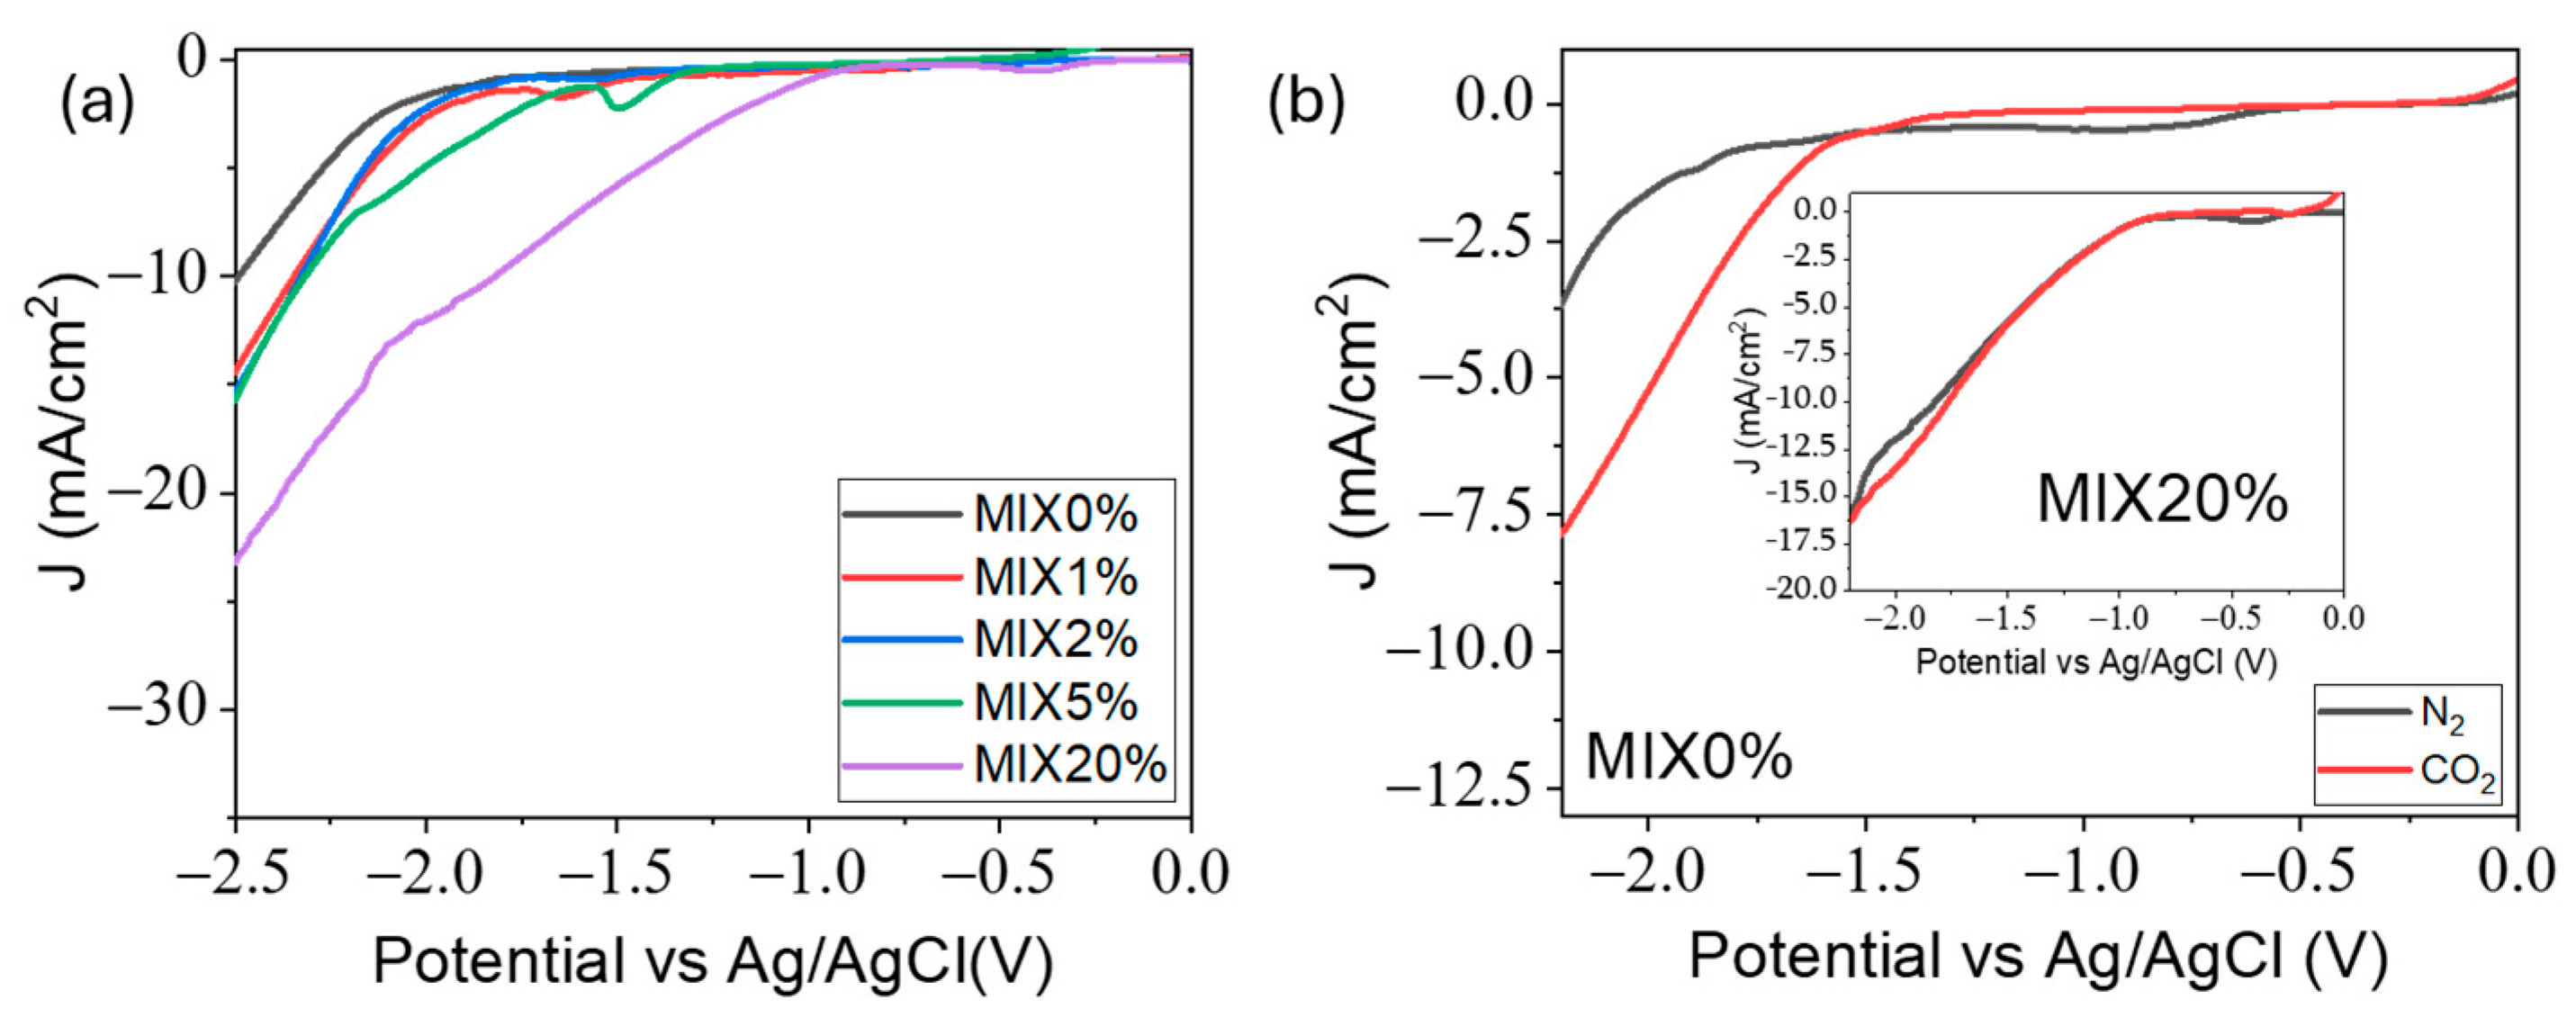
2.2. RTIL-Based Electrolyte Electrochemical Characterization

The activity towards eCO2RR of the electrolyte mixtures was studied in a single compartment cell (Figure S2A, Supplementary Materials) via Linear Sweep Voltammetry (LSV) between 0 and −2.5 V vs. Ag/AgCl with a scan rate of 10 mV/s. In N2-saturated electrolytes, the onset potential shifts toward more positive values for higher water contents (Figure 2a), because of higher HER activity due to the increased concentration of protons. With water traces (MIX0%), a more negative onset potential was observed in the CO2-saturated rather than the N2-saturated, indicating that the eCO2RR is favorably promoted in the RTIL-based electrolyte. This phenomenon was observed for any mixes with water content until 5%. Conversely, analogous onset potentials were reported in the N2- and CO2-saturated MIX20%, indicating that the HER is a non-negligible process at 20% water concentration in the electrolyte (see Figure 2b and inset). The positive shift of the onset potential in the presence of CO2 evidences the reactivity of the electrolytes towards eCO2RR. In N2-saturated electrolyte, every mixture is electrochemically stable until an applied potential of −2 V vs. Ag/AgCl, up to 5%v/v, where the water content becomes high enough to shift the onset potential due to the HER. For more negative potential, the electrochemical reduction of the ILs in the electrolyte began to be the primary Faradaic process.

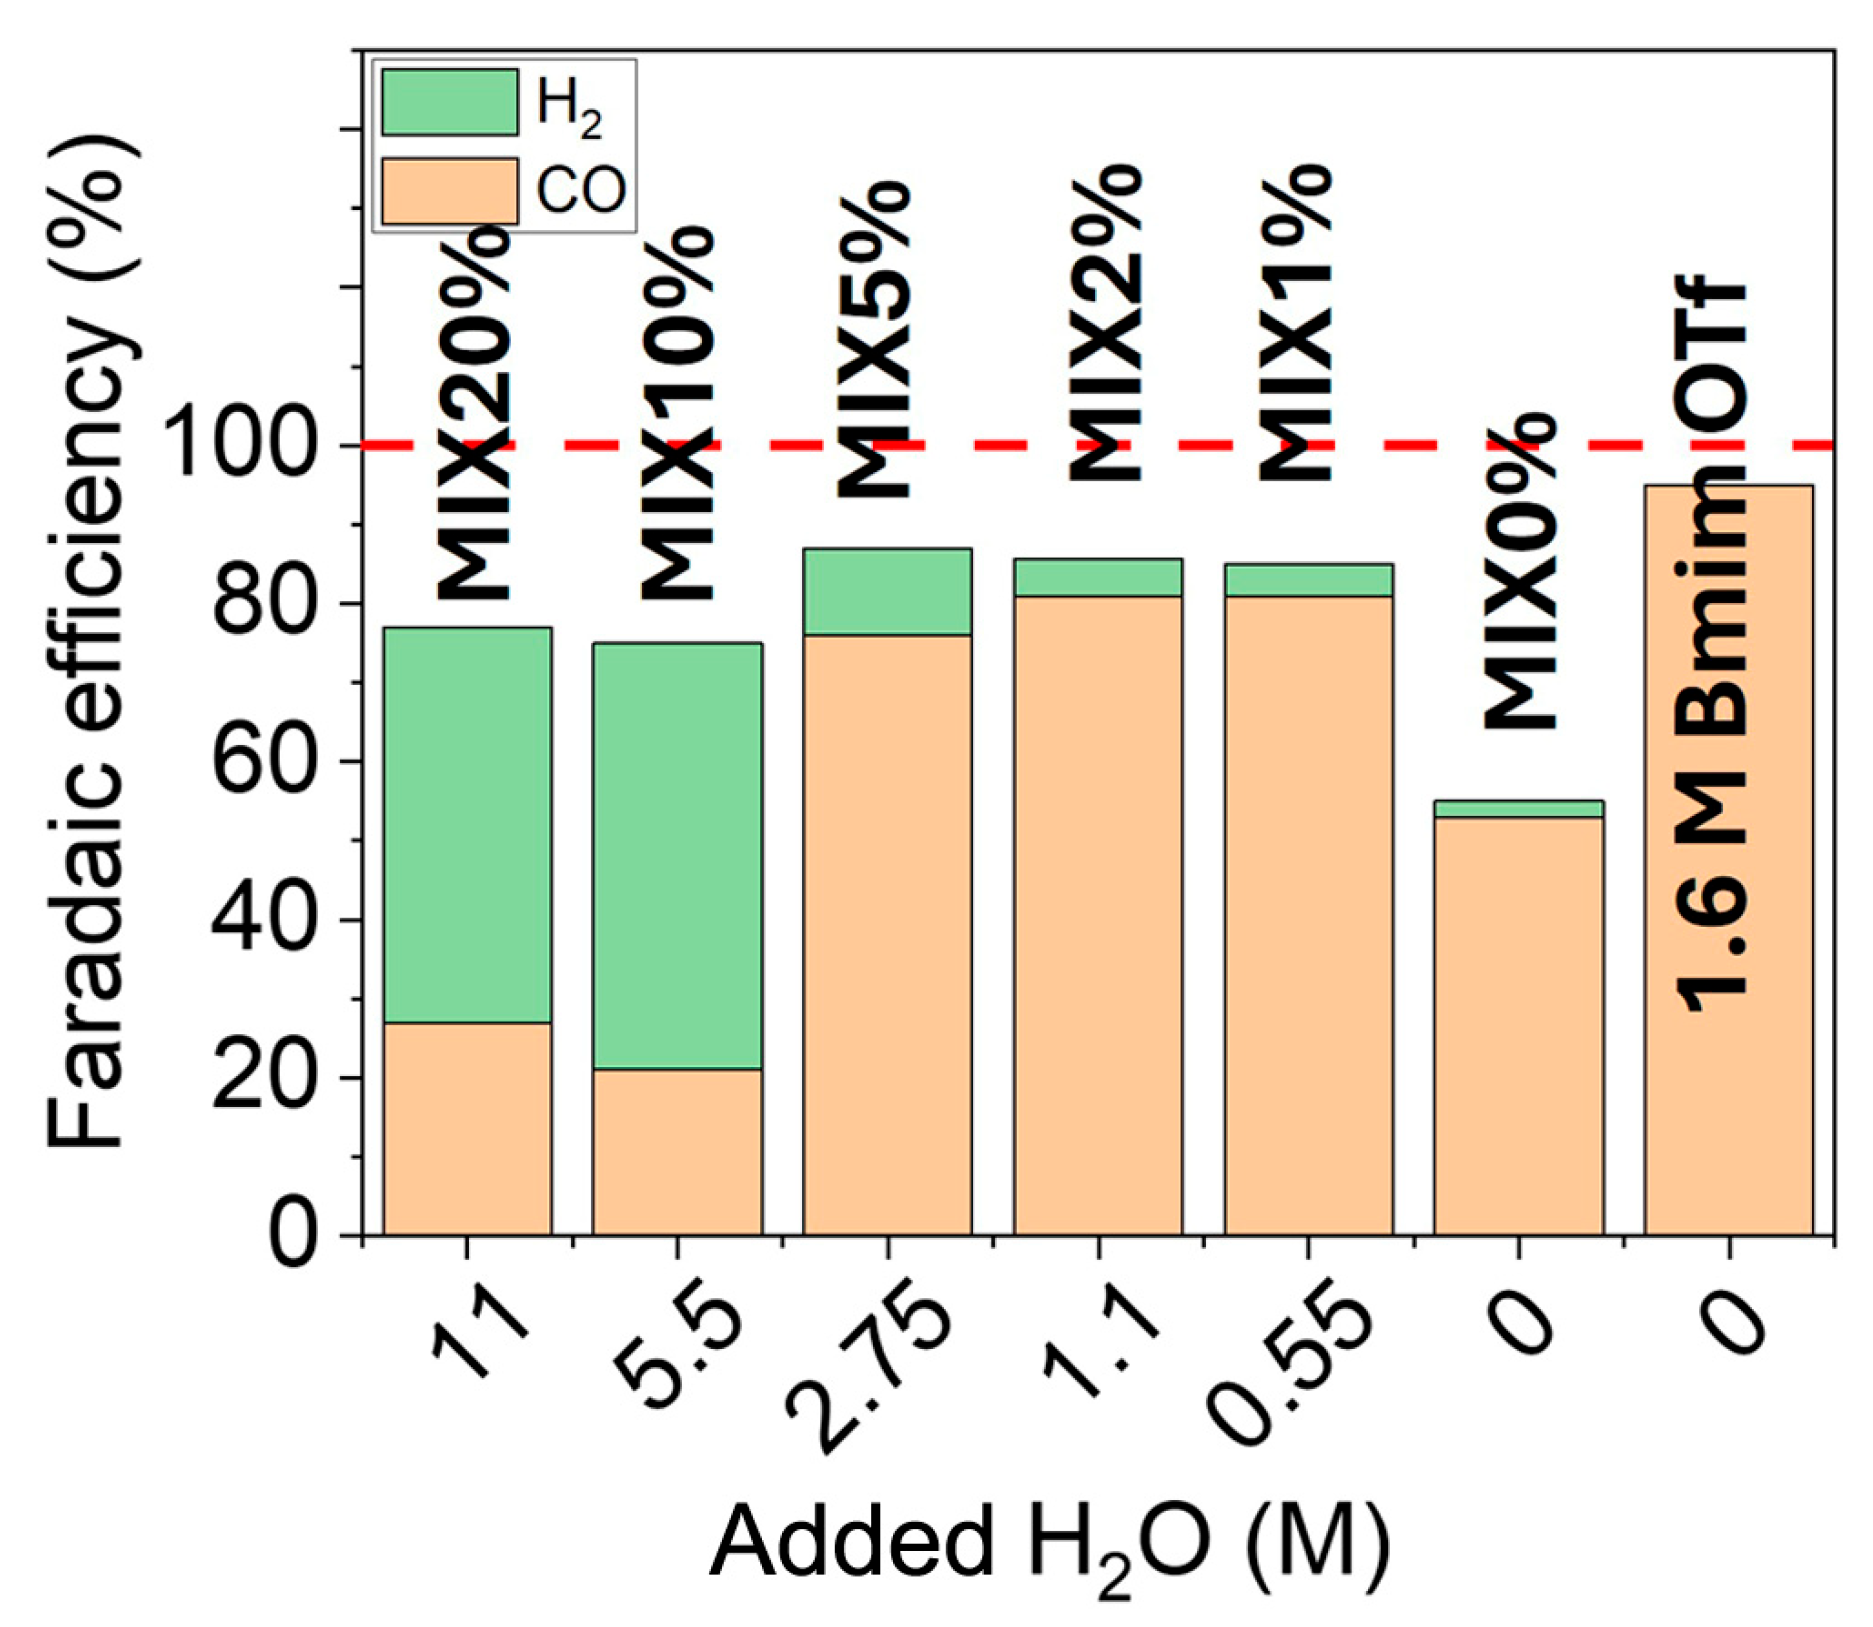
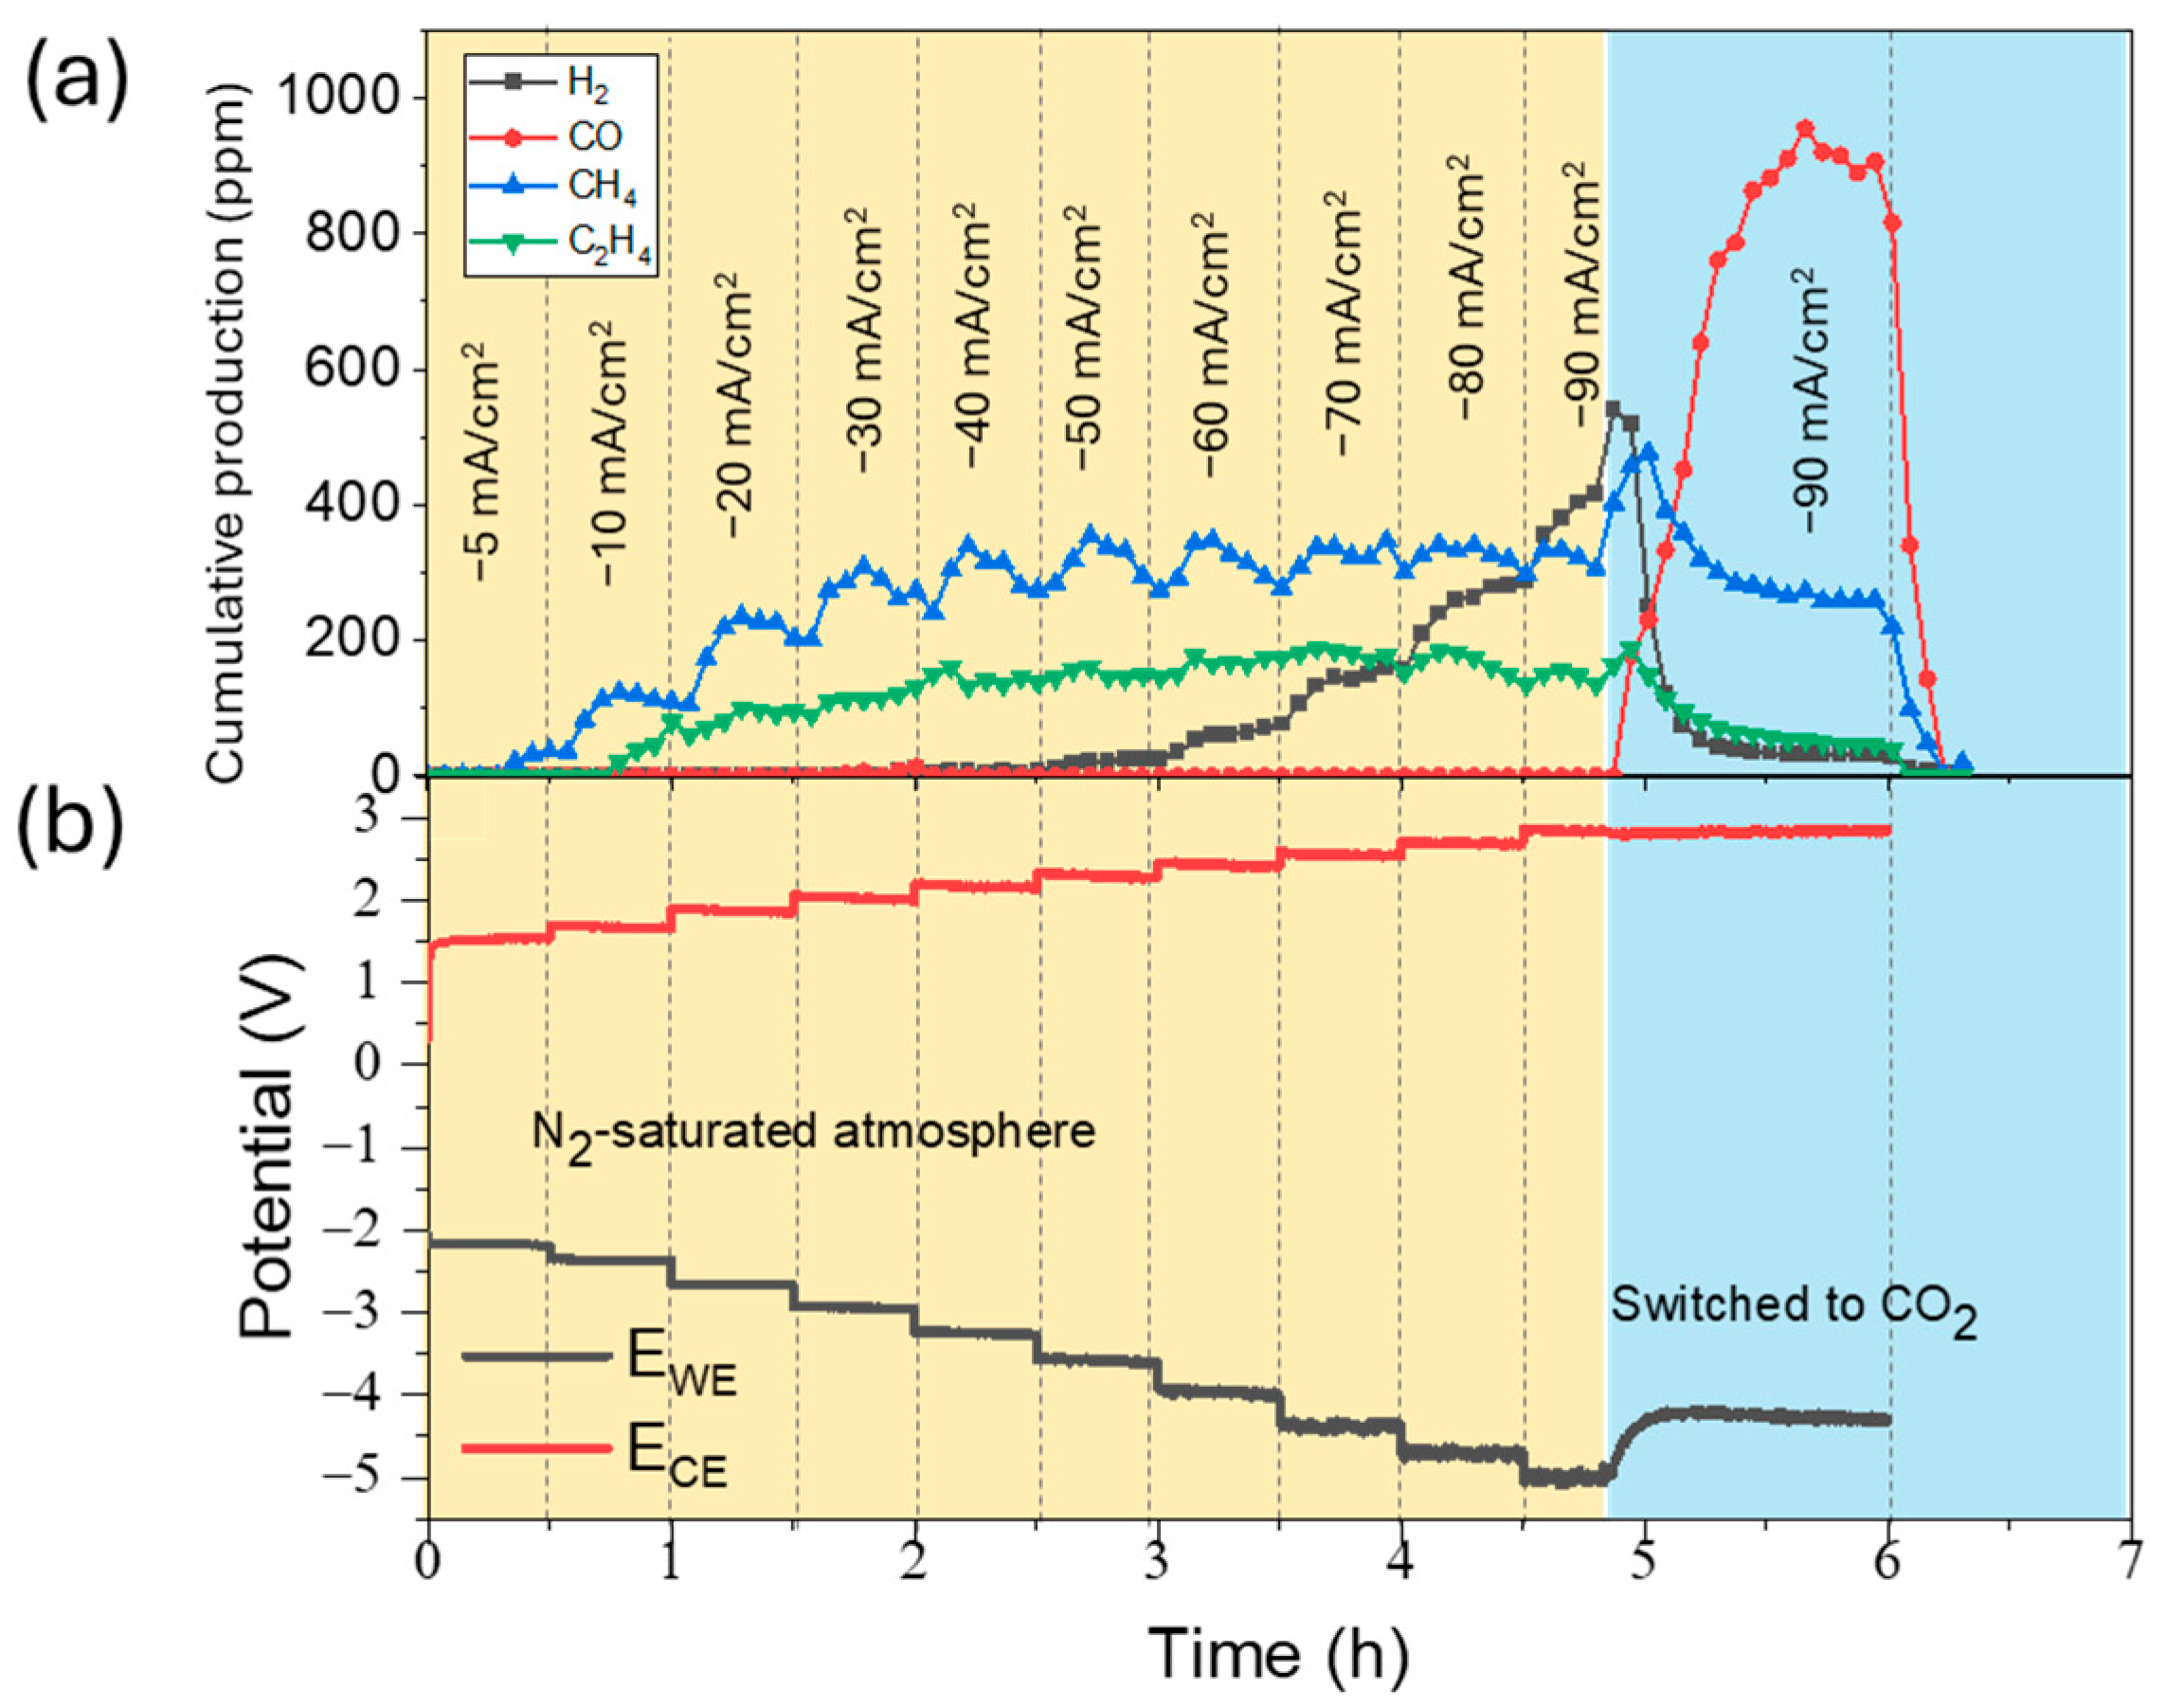
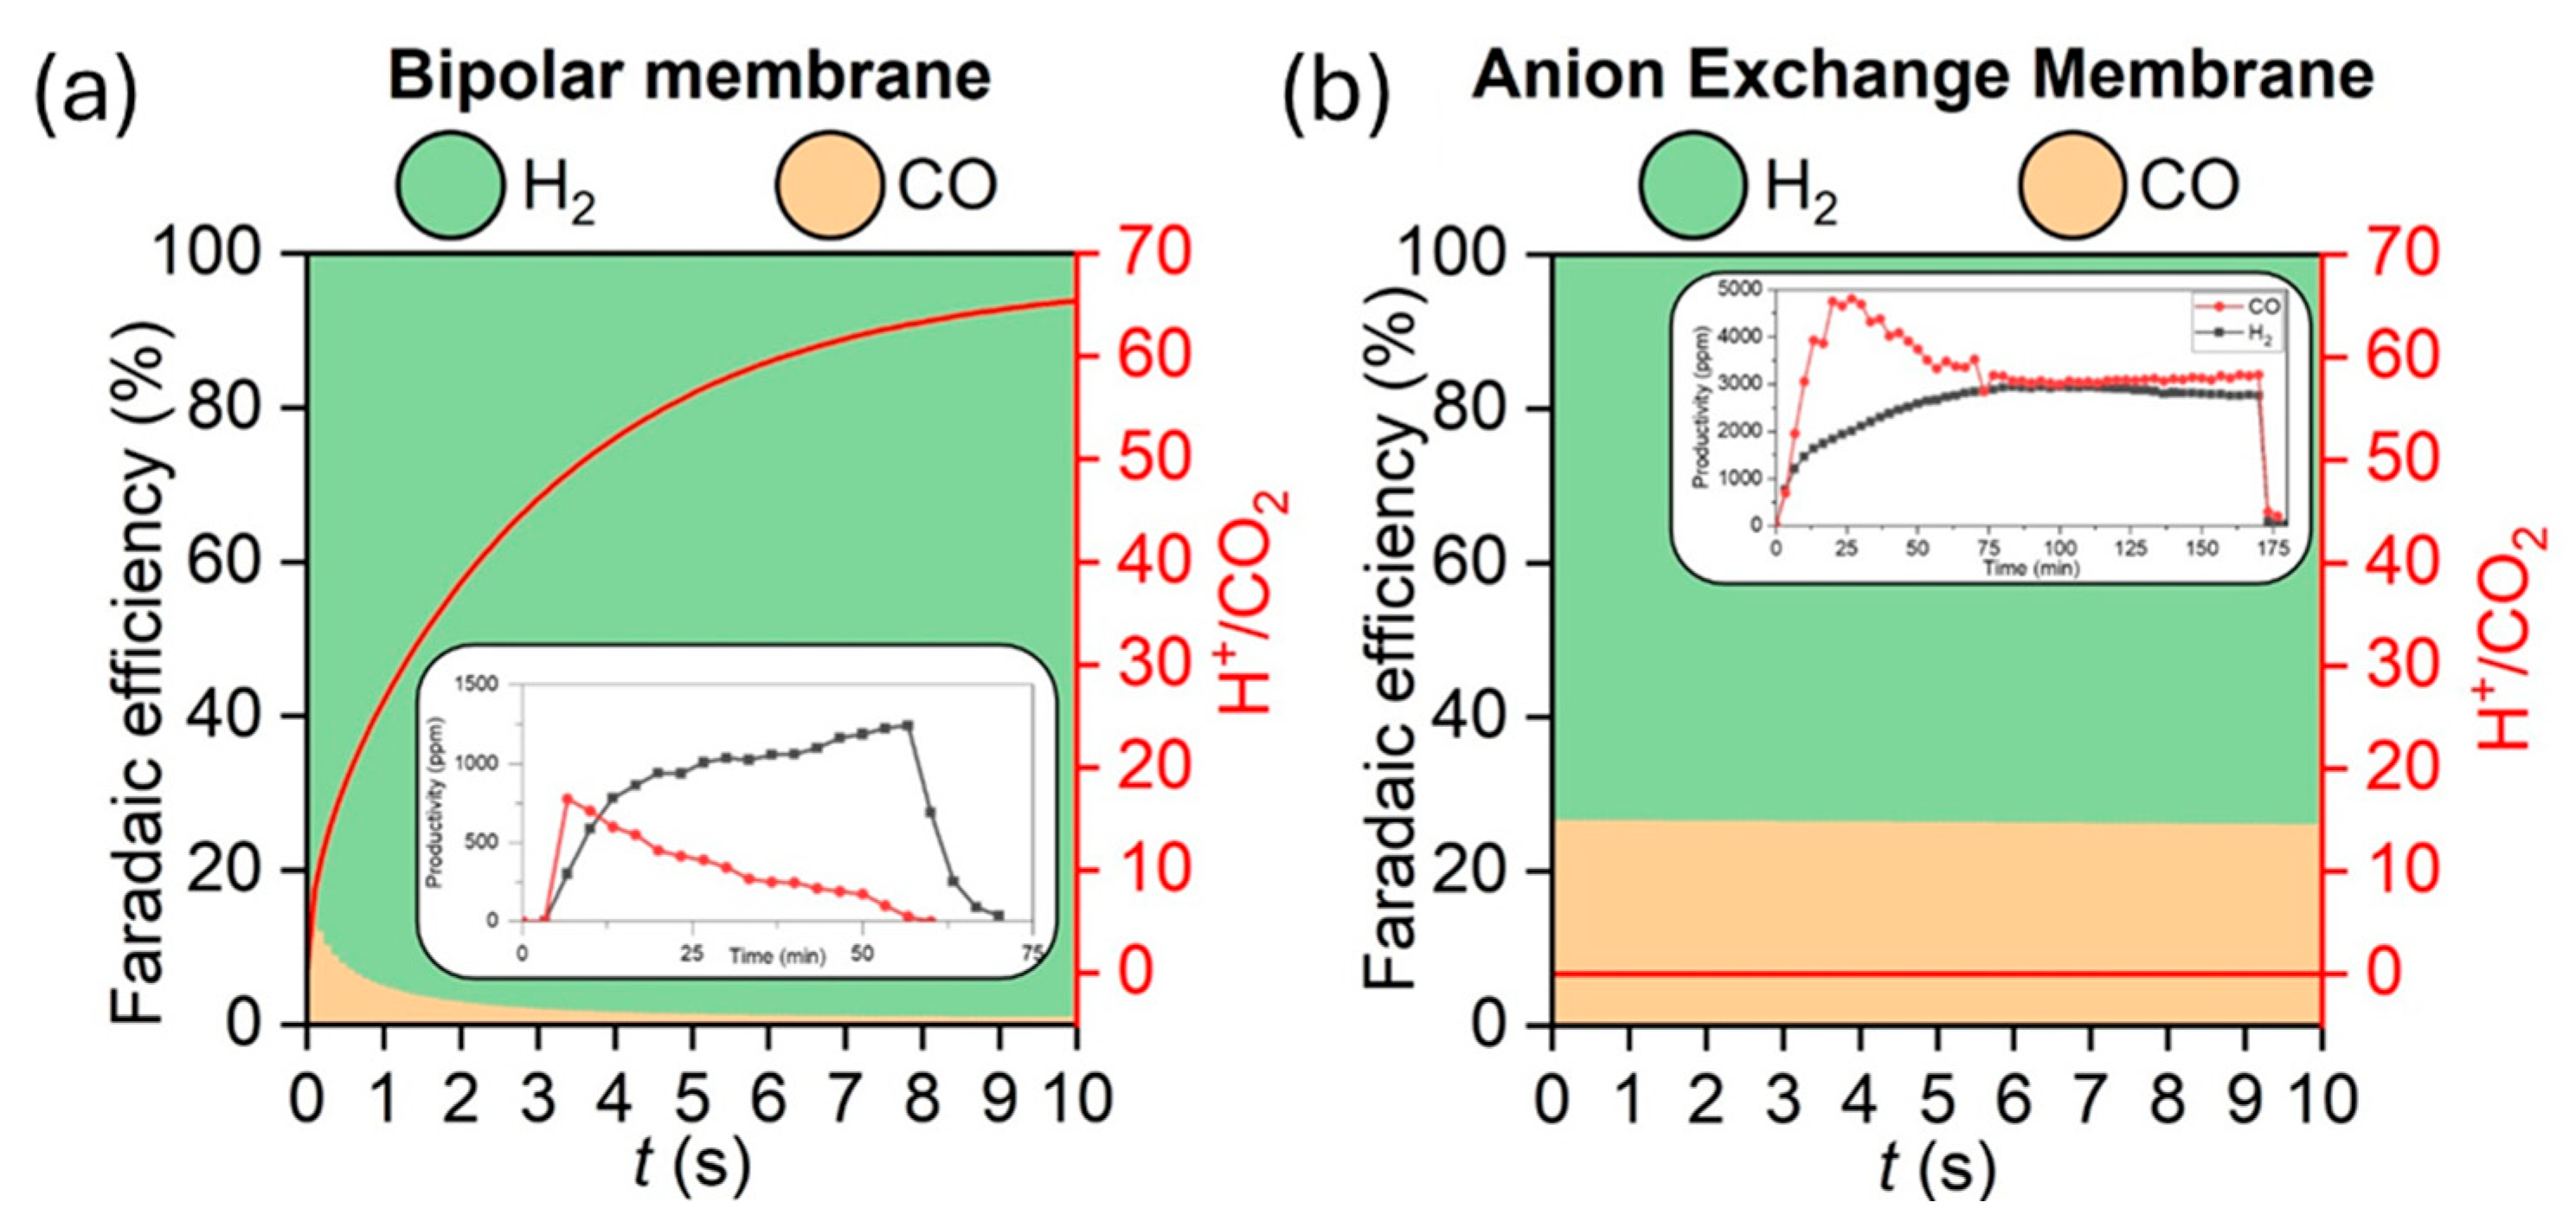
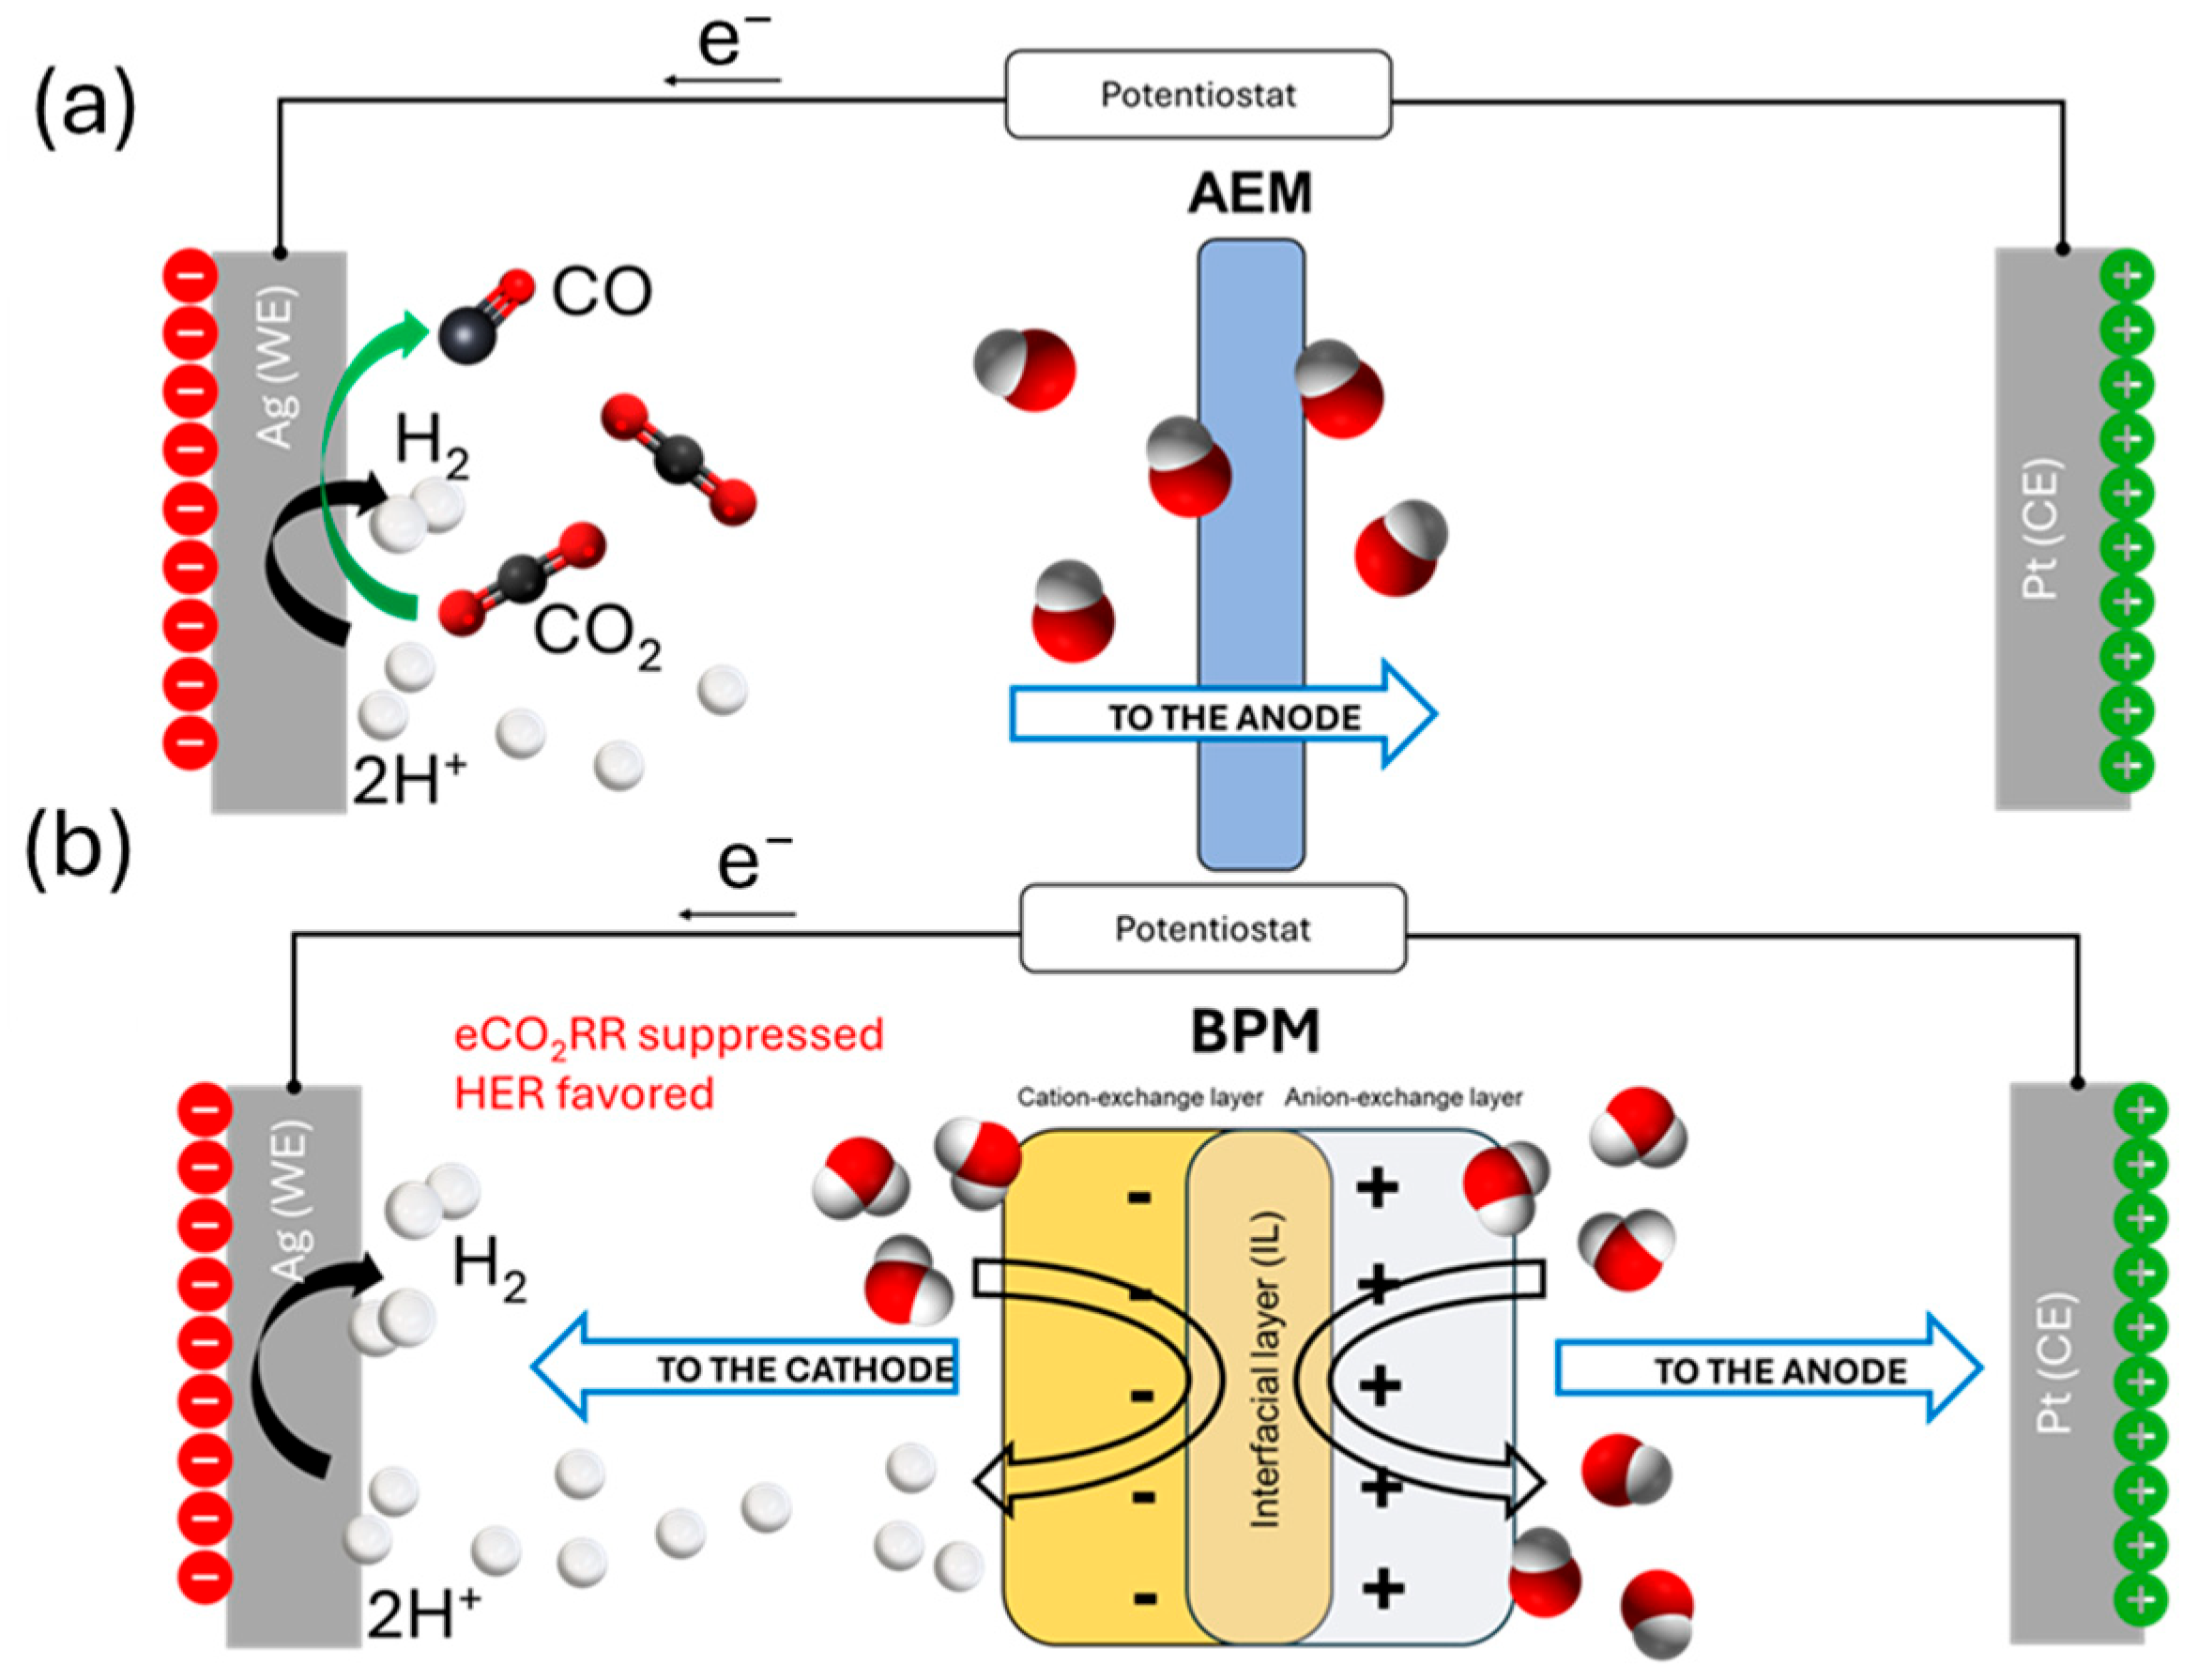
2.3. CO2 Electrolysis Tests

Electrolysis tests were conducted in a single-compartment cell and an H-type (Figure S2B, Supplementary Materials) cell to assess the cell configuration’s influence on selectivity and the CO and H2 production stability in the RTILs-based electrolytes with different water contents. Figure 3 reports the Faradaic Efficiency (FE) of the principal gaseous products during 90 min CP experiments in the single cell at −20 mA/cm2. These results suggest that water is the leading proton donor for HER and eCO2RR. Indeed, by lowering the H2O content in the electrolyte, the FE shifts towards mainly CO production. However, even with traces of water in the electrolyte (no added water for MIX0% and 1.6 M Bmim OTf), the eCO2RR occurs, while the HER is significantly suppressed. Fortunati et al. recently showed that a stronger Lewis base anion (as acetate) turns the C2 proton of the imidazolium cation more acidic. Thus, if released, this proton can serve as a co-proton source for the reaction together with the low amount of water present in the electrolyte.
Moreover, the total Faradaic efficiency decreases following a decrease in water content and applied current (Figure S3, Supplementary Materials). These results may be attributed to the products’ partial reoxidation and the possible presence of other Faradaic processes, such as the degradation of ILs. When a polycrystalline Ag plate is employed as a working electrode, the three detectable reduction products are CO and HCOO− (from eCO2RR) and H2 (from HER). However, as pointed out by the pioneering work of Hori [40], in the potential range explored, in an aqueous system, the selectivity towards CO production on Ag is one order of magnitude higher than HCOO. Moreover, previous work from our group using similar electrolytes and catalysts [30] highlighted how the Ionic Liquid here employed (e.g., Bmim OTf and Bmim OAc) are selective towards producing CO and H2, respectively. No other liquid products (such as HCOO− or alcohols) were detected significantly either by HPLC or GC-MSD. Kroon et al. [47] employed theoretical calculations to predict that cation radicals may form at cathodic potential, causing imidazolium dimerization through C2 hydrogen. Cation dimerization during the reaction is supported by the evident color change in the solution, from pale yellow to dark brown, especially at low water content in the electrolyte (Figure S4, Supplementary Materials). Besides, CH4 and C2H4 were detected when potentials over −2 V were applied in a single-compartment electrochemical cell, and the concentration of these products increased with the applied potential and with the ILs molarity in the mixture (Figure S5, Supplementary Materials), thus suggesting both to be IL’s degradation products. Hence, the electron count is probably closed by a reductive mechanism of Ionic Liquids degradation, as reported by Kroon et al. However, since these RTIL cathodic degradation mechanisms are radical-involved mechanisms, it is difficult to make an exact count to obtain an efficiency value, and this is beyond the scope of the present paper. To confirm this hypothesis, a CP ramp ranging from −5 mA/cm2 to −90 mA/cm2 was conducted in an inert N2 atmosphere (Figure 4), continuously analyzing the outlet gases to confirm whether the C-based products are generated even without CO2. CH4 and C2H4 were detected, while CO was absent, confirming that methane and ethylene are formed as IL degradation products. CO started forming when the electrolyte was saturated with CO2, and a sudden decrease in the cathodic potential, E(we), happened. Since no variation was detected on the anode potential, E(ce), after CO2 saturation of the electrolyte, we hypothesized that the RTILs degradation occurred via oxidation at the Pt anode (placed close to the cathode in the single-compartment cell). Moreover, Ag is known to be selective towards CO production, and only a few works report CH4 and C2H4 production under specific mass transport conditions, further excluding any CO2 reduction origin of those products under the tested conditions [48,49]. As a final note, LSVs carried out before and after electrolysis for the MIX0% showed significant difference (while minor changes occurred for MIX20%, see Figure S6A,B, Supplementary Materials), indicating that the electrolyte degradation strongly depends on IL concentration, being higher at lower water contents.
Previous experimental evidence showed that the separation between the catholyte and the anolyte is of utmost importance, even at the expense of higher cell potential. In this way, the electrolyte degradation at the anode can be prevented, consequently preserving the RTIL-based electrolyte’s stability and the syngas’ purity out-stream and suppressing the evolution of unwanted side products such as CH4 and C2H4. By changing the experimental setup from a single-cell to an H-cell, the membrane employed to separate the cathodic and anodic compartments becomes the primary concern.
From the data obtained in the single cell, MIX20% was selected as the most suitable electrolyte for syngas production, allowing a total CO:H2 ratio close to 1:1. In the single cell, despite the initial high CO selectivity, HER generally increased during operation becoming the primary faradaic process at the end of the test (Figure S7, Supplementary Materials), probably due to the RTIL-electrolyte partial oxidation. To overcome this limitation, the co-electrolysis experiments were performed in an H-type cell (see the Section 4.3) with MIX20%, and the obtained FE values are summarized in Figure S8 (Supplementary Materials). In this configuration, the membrane dramatically influences selectivity over time. When using a bipolar membrane, the CO production was rapidly suppressed, arriving at zero after a few minutes of operation (see Figure 5a). The system’s selectivity becomes stable only when an anionic membrane is employed (Figure 5b). This phenomenon can be ascribed to the proton production at the interface layer of the BPM, which makes the system more selective towards HER. As detailed in the Section 2.4, a descriptive COMSOL model has been built to confirm this hypothesis. Moreover, adding 20% of water to the ILs-based electrolyte also reduced the possibility of the imidazolium cation to act as a proton source and ensured a higher electrolyte stability.
On the other hand, catholyte and anolyte cross-over is a severe issue when a two-compartment cell (e.g., H-cell or Flow cell) is employed, and organic electrolytes can exacerbate such phenomena by destabilizing the polymeric matrix of the membrane. To investigate such phenomena, two samples of the anolyte (KOH aqueous solution) and two samples of the catholyte, were collected before and after several hours of chronopotentiometry with the AEM, and were analyzed by IR spectroscopy. As shown in the Figure S9 (Supplementary Materials), the two anolyte spectra are similar, which confirms the absence of ILs crossover from the catholyte to the anode compartment. Indeed, no peaks related to the RTILs nor the 3-MPN organic solvent are present in the anolyte after 3 h of test: only the vibrational modes of water (between 3000 and 3000 cm−1) related to O-H bonds stretching, and the sharper peak (around 1600 cm−1) related to the H-O-H scissoring vibration are visible. Similarly, Figure S10 (Supplementary Materials) compares the two catholyte spectra before and after the test, demonstrating no appreciable aqueous KOH cross-over during the reaction. The broad O-H band in the region between 3000 and 3500 cm−1 is not visible in the catholyte’s IR spectra at the end of the chronopotentiometry, suggesting that the anolyte crossover is not a severe issue in the proposed setup.

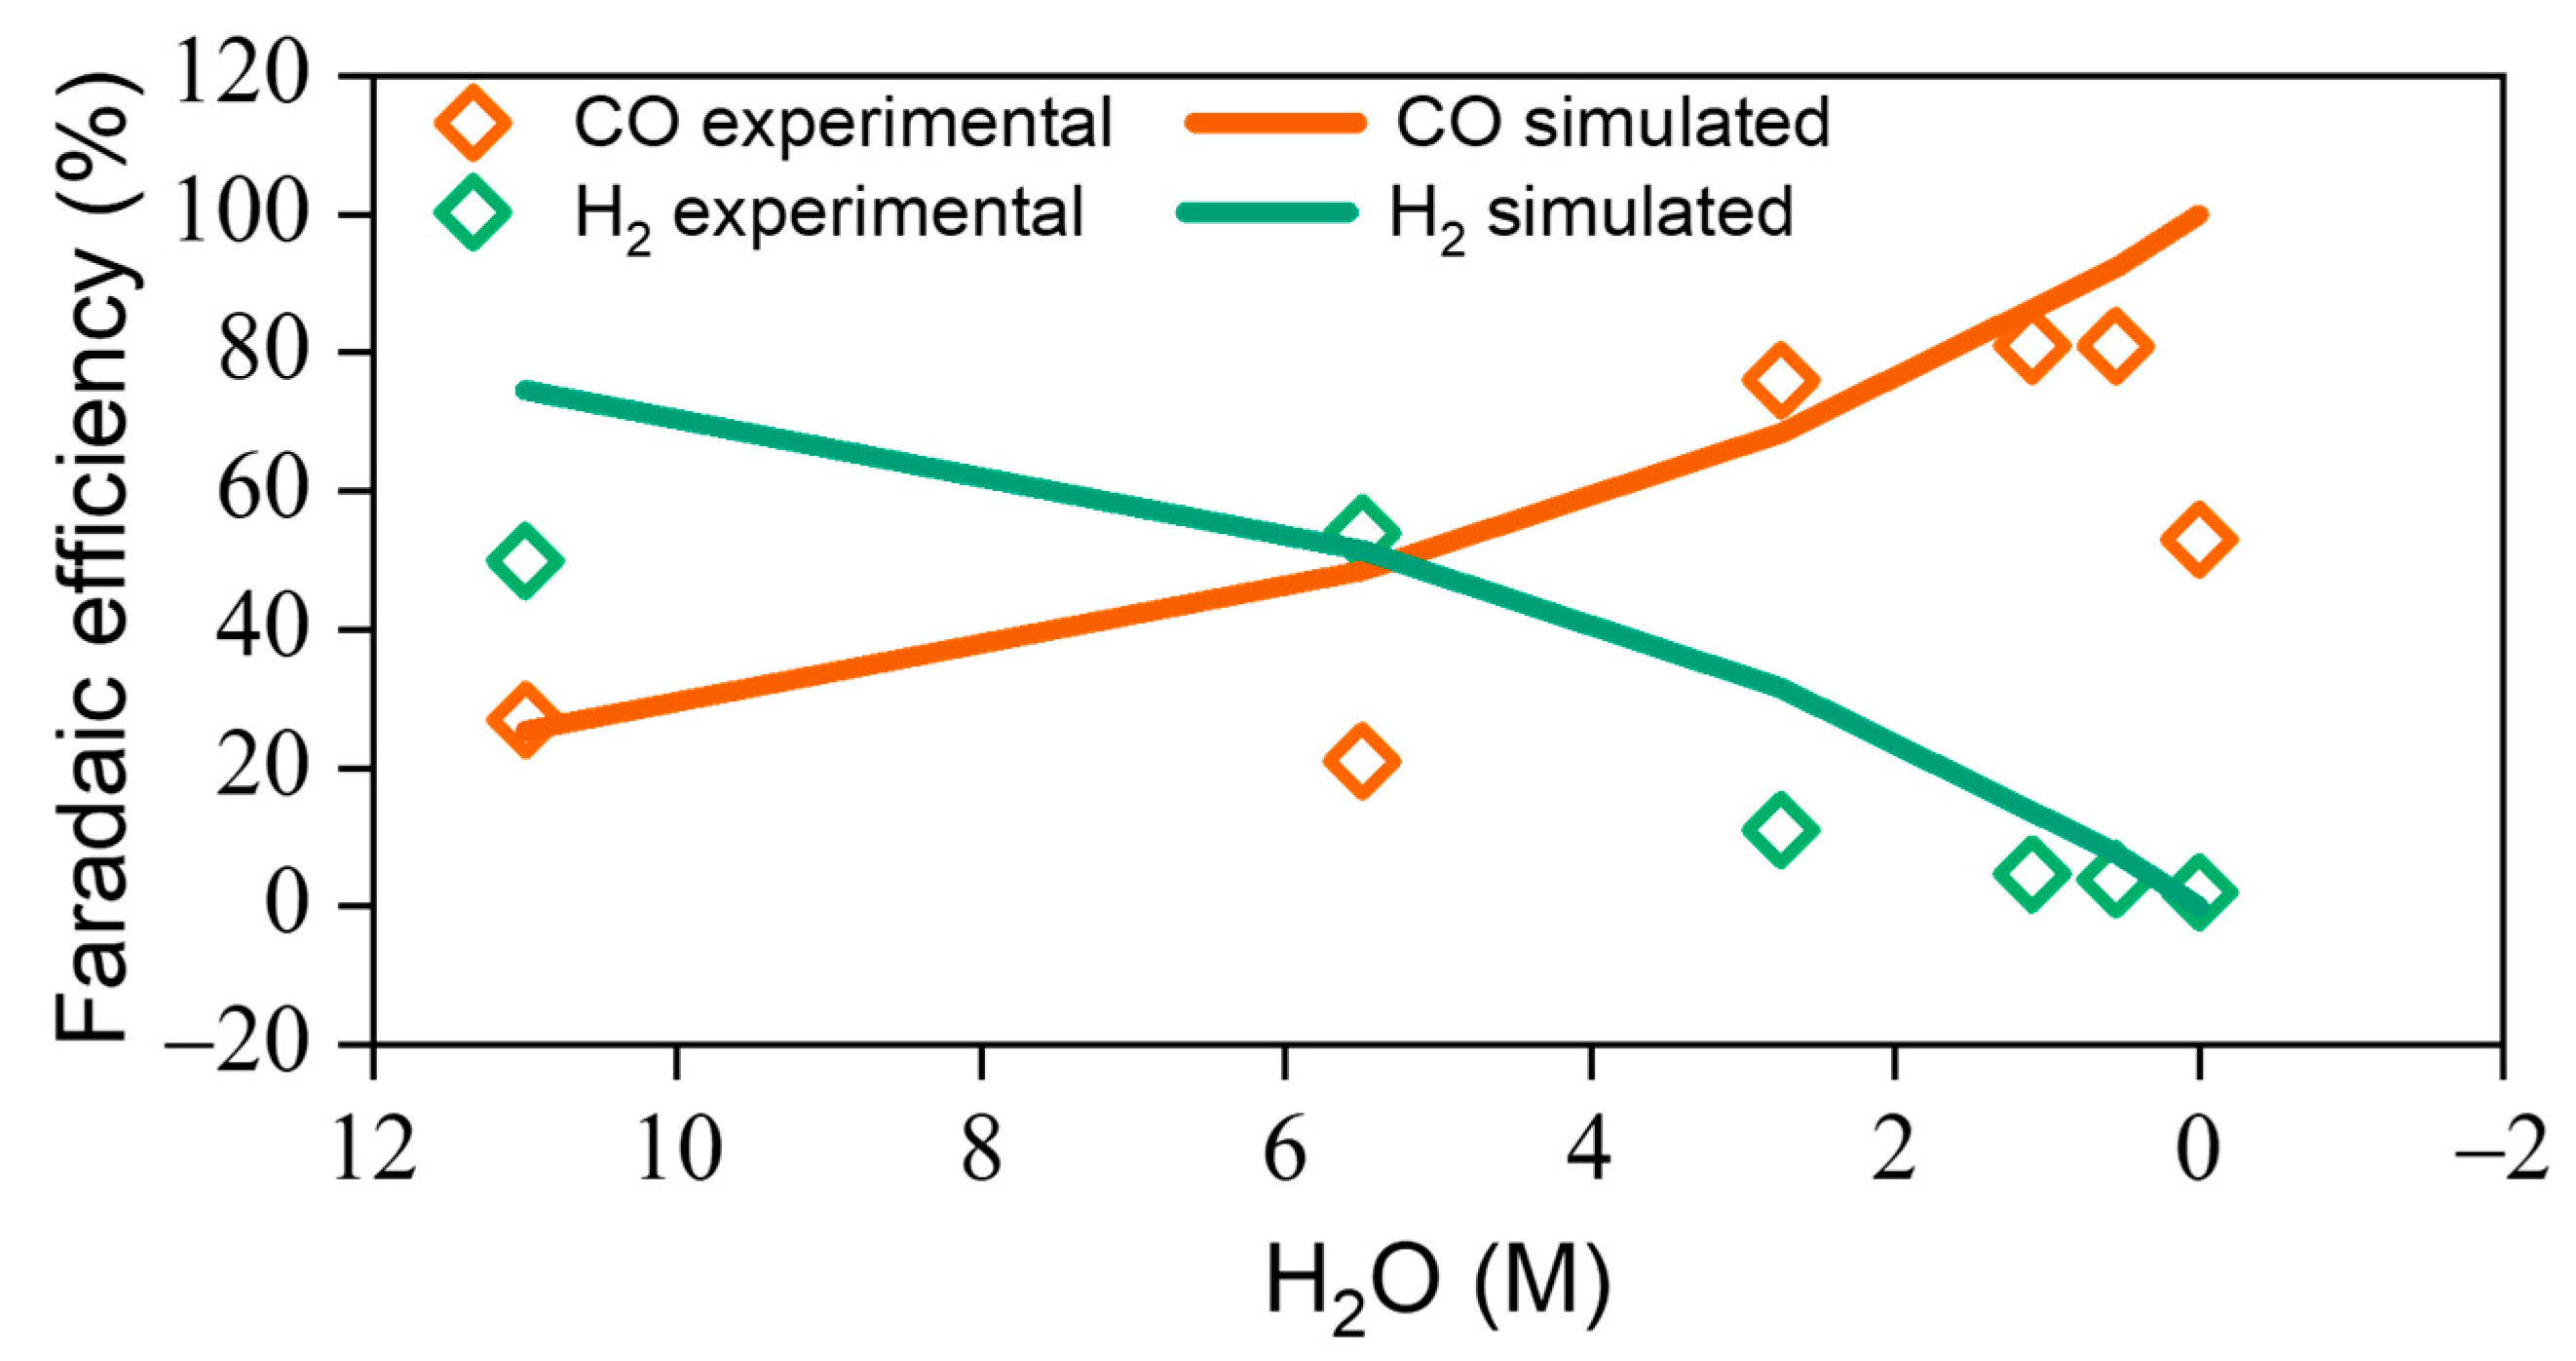
2.4. Computational Modeling

To explain the experimental results shown in Figure 5, we developed a simplified 1-dimensional COMSOL Multiphysics model. In particular, the model aims to validate the following hypothesis: (i) Water is the main proton source for HER; (ii) Protons in the C2 position of the imidazolium cations of the ILs can act as additional proton sources for CO2 reduction when the water concentration is low; (iii) the use of a Bipolar Membrane determines unstable syngas production due to increased proton concentration at the cathode during operation. The structural model included the Ag surface (cathode) as a point electrode, a diffusion layer of 100 µm, and the bulk electrolyte (as a point concentration reference). Since the density of [Bmim][CH3SO3] is equal to 1.2135 kg/L at 292.95 K and CO2 molality in [Bmim][CH3SO3] is 0.4927 mol/kg at 293.2 K [50], then we assumed a CO2 solubility in [Bmim] of 0.60 mol/L, equivalent to 600 mM. This CO2 concentration was then set at the bulk electrolyte, while [H+] and [OH] were generically assumed to be 0 mM, and [CH3SO3], [CO2CH3], and [H2O] bulk concentrations were taken from Table 1. For simplicity, no further species were included in the model. Anode and, consequently, anodic reactions were not considered since the focus was on the catholyte chamber of the H-cell experimentally employed.
As heterogeneous reactions at the cathode, CO and H2 formation were considered, with kinetic parameters, charge transfer coefficients, and equilibrium potentials retrieved from Ref. [51] (see Table 2). The CO exchange current density from Ref [51] was multiplied by a correction factor of 5 to match experimental results. Instead, the kinetic parameters evaluated from our own experimental study were not used due to the significant mass transfer limitations occurring in our system (due to varying H2O content). The proton source for CO2 reduction and Hydrogen Evolution was either [Bmim+] protons (at low water content in the electrolyte, see Equations (1) and (2)) or H2O itself (Equations (3) and (4)). CO and H2 current densities were then modeled via Butler-Vomer equations, including a specific dependence on CO2 (for eCO2RR) and H+/H2O surface concentrations (for HER, depending on the proton source). This mass transfer factor was normalized by a reference concentration of 1 M. The actual conductivity of the bulk electrolyte (data in Table 1) was used in the model.
C O 2 + 2 H + + 2 e y i e l d s C O + H 2 O
2 H + + 2 e y i e l d s H 2
C O 2 + H 2 O + 2 e y i e l d s C O + 2 O H
2 H 2 O + 2 e y i e l d s H 2 + 2 O H
Regarding chemical equilibria reactions at the bulk electrolyte, water self-ionization (Equation (5)), and release of C2 proton (Equations (6) and (7)) were included, assuming the reaction rates reported in Table 3, where values on ionic liquids are taken from our recent density functional theory study [29]. In Equation (7), we set a frequency factor of 1 fs−1. Given the previous considerations, H+ and OH evolution within the electrolytes followed Equations (8) and (9).
H 2 O k w 1 , k w 2 H + + O H
B m i m a n i o n k f o r m ( [ B m i m ] : ) [ B m i m ] : + H + + a n i o n
H + = A e x p G ( [ B m i m ] : ) S O 3 C F 3 k B T S O 3 C F 3 + A e x p G ( [ B m i m ] : ) C O 2 C H 3 k B T [ C O 2 C H 3 ]
R H + = k w 1 H 2 O k w 2 H + O H + k f o r m S O 3 C F 3 S O 3 C F 3 + k f o r m C O 2 C H 3 C O 2 C H 3
R O H = k w 1 H 2 O k w 2 H + O H
The diffusion coefficients and charges reported in Table 4 were used to solve the Nernst- Planck equation. Regarding diffusion coefficients, values estimated in water for H+, OH, and H2O were multiplied by a correction factor obtained as D C O 2 ( [ B m i m ] [ P F 6 ] ) D C O 2 ( [ H 2 O ] ) . Diffusion coefficients for [CH3SO3] and [CO2CH3] were assumed to be 0.1·10−5 cm2/s, while their charges were set to −1 |e|.
By running a stationary simulation assuming the molar compositions in Table 1 and an applied current density of −20 mA/cm2, the model returns values of Faradaic efficiency toward H2 and CO well aligned with the experimental results in Figure 3. As shown in Figure 6, H2 selectivity is close to zero at low water content, suggesting the need for H2O to sustain hydrogen production. Instead, a high selectivity toward CO is observed with very low water content, strengthening the hypothesis of [Bmim] C2-H as an additional proton source for the eCO2RR.
To qualitatively investigate the role of the bipolar membrane in tuning the H2/CO ratio, we included in the model an artificial proton source at the electrode (H+ flux of 0.5 mol/(m2s)) to resemble the water splitting occurring at the BPM. As evident from the time-dependent study shown in Figure 7, after an initial CO2 reduction activity, the diffusion of H+ from the membrane to the cathode leads to high H2 and negligible eCO2RR activity (Figure 7a). Indeed, a very high H+/CO2 concentration ratio is observed at the surface. Instead, by employing the anion exchange membrane (i.e., without any proton flux, Figure 7b), H+ concentration does not increase, as confirmed by the H+/CO2 ratio around 0.

3. Discussion

Our study suggests that several phenomena are responsible for the instability in syngas evolution in RTIL-based electrolytes. The anodic degradation of the RTILs during electrolysis in a single-compartment cell is a severe issue that determines the generation of side products like CH4 and C2H4 and, thus, the unreliable determination of eCO2RR products in single cells. Electrolysis experiments have evidenced acetate anion as the main cause of degradation by-products. Acetic acid electrolysis on Pt at oxidative potential follows a mechanism known as Kolbe reaction. This mechanism leads to the cleavage of the C-C bond of acetic acid with the subsequent coupling of two CH3 radicals to form ethane. Ethylene is reported to be a non-Kolbe product—coming from a side mechanism of the Kolbe reaction [54]. However, the absence of ethane as a gaseous byproduct indicates the existence of another degradation mechanism that has led to the evolution of CH4 and C2H4. The reactivity of acetic acid towards electrolysis on Pt anode leading to a similar Kolbe mechanism supports what is reported in Figure 3, where MIX0% displayed a total FE lower with respect to 1.6 M Bmim OTf. This phenomenon can be explained by the presence in MIX0% of the acetate anion coming from Bmim Acetate. The hypothesis is that when the Pt anode is immersed in the electrolyte within a single cell, the presence of acetate anions increases the probability of radical species formation, thereby raising their concentration. This makes the electrolyte chemically less stable, even at the cathodic interface. When only Bmim OTf is employed as electrolyte, the anion degradation doesn’t occur, and the total FE, which is close to 100%, accounts for only the eCO2RR to CO and HER. The remaining percentage of FE can then be explained by the previously cited cation degradation reported and calculated by Kroon et al. [47] However, the mechanism of anodic RTILs degradation requires additional studies, which will be discussed in a follow-up manuscript. Regarding the identity of the proton source, the selectivity towards HER rises dramatically by increasing the amount of water in the electrolyte. Besides, eCO2RR still happens even in electrolytes containing very low amounts of H2O, such as MIX0% and 1.6 M [Bmim] [CF3SO3], indicating that C2 of the imidazolium cation can serve as an additional proton source. This hypothesis is supported by COMSOL modeling, which shows good agreement with the experimental data (Figure 6). Nearly 100% of Faradaic efficiency toward CO is predicted even when the model assumes the absence of water and the equilibrium reaction in Equation (6), confirming the reliability of the RTIL C2-H as an alternative proton source.
Experimentally, we note that in the case of 1.6 M [Bmim] [CF3SO3], the total FE is over 90%, confirming the hypothesis that the IL with the [CF3SO3] anion is less prone to degradation than with the [CH3CO2] one. CO production remains stable when no [CH3CO2] anion is present in the electrolyte. Under this condition, no other Faradaic process can occur at the Ag surface other than eCO2RR, and the protons coming from the imidazolium cation are selectively employed for CO evolution. When only [CF3SO3] anions are present, the electrode-electrolyte interface is more hydrophobic due to the presence of the -CF3 moiety; thus, less water is present at the surface. Given the high CO selectivity reported, the hypothesis that H from C2 can act as a proton source for eCO2RR is further confirmed. Cation degradation to release C2-H may be an issue regarding the system’s long-term stability since this eventually led to a change in electrolyte composition. Moreover, imidazolium cations at the electrode interface, when losing the proton in C2 position, can form a carbene species that poisons the Ag surface [30], hindering eCO2RR. These processes can be avoided by adding H2O to the electrolyte. Proton evolution from H2O is easier and more favorable than the IL cation disruption.
Regarding the electrochemical setup, changing from a single cell to an H-type cell is crucial to avoid IL oxidative degradation. However, the membrane employed to separate the anodic and cathodic chambers also plays a crucial role in the outcome of the process. When MIX20% was tested in the H-type cell equipped with BPM, syngas was produced, but the CO/H2 ratio was not stable due to the rapid suppression of eCO2RR at the Ag interface. After 1 h of −20 mA/cm2 chronopotentiometry, the system’s selectivity switched towards HER. Conversely, in the same electrolytic condition but equipping the H-cell with an AEM, the CO/H2 ratio reached a steady state after 1.5 h, and the syngas productivity was maintained for up to 3.5 h, after which the system was still fully functioning.
Moreover, as pointed out in Figure 5b, once the stability of the gas evolution is obtained, the syngas composition can be easily tuned by varying potentiometric parameters (Figure S8, Supplementary Materials). This gives a potent tool for online syngas production with on-demand CO/H2 that can be exploited to perform coupled organic reactions that require different syngas compositions. Carbonylation reaction usually requires only the presence of CO as reactant; by contrast, high-pressure and high-temperature hydroformylation require syngas with CO:H2 equal to 1:1.
To explain the cause of syngas instability caused by BPM, Figure 8 depicts a scheme of the process hypothesized to happen at the membrane. BPM comprises a cation exchange layer (CEL) and an anion exchange layer (AEL) pressed together [37,55]. When a bias is applied to the system, water splitting occurs at the interface, and H+ and OH are produced in the catholyte and the anolyte, respectively (if the membrane is operated in forward bias mode, with the CEL facing the cathode). This phenomenon causes progressive acidification of the catholyte with a consequent progressive switching of the selectivity towards HER. The diffusion coefficient of the two electroactive species can also be considered in this scenario. H+ displays a diffusivity almost ten times more than CO2; this would further explain the reason for the total suppression of eCO2RR with time (Table 4). This hypothesis is strongly supported by COMSOL modeling. In fact, from Table 4 it is evident how the diffusion of H+ from the bipolar membrane completely takes over CO2 adsorption at the surface, leading to almost 100% selectivity to H2 during a −20 mA/cm2 chronopotentiometry. Instead, when the AEM is in place, jCO and jH2 become stable after a short time due to an effective depletion of H+ from the catalytic surface.

4. Materials and Methods

4.1. Chemicals

The Ionic liquids (ILs) employed, i.e., 1-Butyl-3-methylimidazolium acetate ([Bmim] [CH3CO2]) and 1-Butyl-3-methylimidazolium trifluoromethansulfonate ([Bmim] [CF3SO3]) were synthesized by IoLiTec Gmbh (Heilbronn, Germany) (high purity grade) and were used without any further purification ([Bmim] cation purity > 99.4%, Triflate anion purity > 99.9%, water content in [Bmim] [CF3SO3] < 110 ppm, Acetate anion purity > 98%, water content in [Bmim] [CH3CO2] < 0.6%). The organic solvent employed, 3-methoxyporpionitrile (3-MPN), was purchased from (Merck KGaA, Darmstadt, Germany). Double-distilled Milli-Q water (R > 18.2 MΩ, 25 °C) was obtained using a Millipore Direct-Q 3 UV system (Merck KGaA, Darmstadt, Germany) and employed as the protic solvent.

4.2. Characterizations

Conductivity measurements were made by using a VWR pHenomenal MU 6100 H Multi-Parameter instrument (VWR International Srl, Milano, Italy), and the results are shown in Figure S1 in the Supplementary Materials. The ATR-IR spectra of the anolytes and catholytes (in shown in Figures S9 and S10) were collected in the range between 400 and 4000 cm−1 with 4 cm−1 resolution, using a Bruker TENSOR 27 spectrometer (Bruker Italia Srl, Milano, Italy).

4.3. Electrochemical Tests

The electrochemical characterization was carried out using a single-compartment electrochemical cell. Linear Sweep Voltammetry (LSV) curves were collected in a single cell with a scan rate of 10 mV/s and are reported hereafter applying the iR drop correction; the uncompensated resistance (Ru/Ω) was measured for each electrolyte via single-frequency (100 mHz) impedance measurement (ZIR). Chronopotentiometries (CPs) were conducted in both a single and an H-type cell. An Ag foil, Ag/AgCl (KCl sat.) and Pt mesh were employed as working electrode (WE), reference electrode (RE) and counter electrode (CE), respectively. Gas inlet/outlet in the cells allowed the outgassing and the saturation of the electrolytes with N2 and CO2. During the CPs, the gas was continuously fed into the cell at a constant rate of 20 NmL/min using a mass flow controller (Bronkhorst EL-FLOW, Bronkhorst, Ruurlo, The Netherlands), and magnetic stirring was maintained to favor the convection of electroactive species towards the electrode-electrolyte interface. In the H-type cell, either a Fumasep BPM membrane or an FAA 3 (thickness 130) µm peek-reinforced AEM were used. An aqueous solution of 0.5 M KOH was employed in the H-type cell as anolyte. All electrochemical measurements were conducted using a Biologic SP-300 potentiostat (supplied from BioLogic, Seyssinet-Pariset, France) and EC-Lab software version 11.50 (released 4 May 2023) for data collection and analysis. The online detection of gaseous products during eCO2RR was done through a Varian 490 micro-gas chromatograph. Further details are provided in the text. All potentials (E) are referred to the Ag/AgCl reference electrode.

5. Conclusions

In this work, we investigated different conditions and setups to achieve a tunable syngas production with a constant CO/H2 ratio. Starting with the electrolyte, we showed how an RTIL-based electrolyte enhances eCO2RR activity. By selecting the proper mix of RTILs, it is possible to balance the two competing reactions (eCO2RR and HER) to produce syngas with a CO/H2 ratio constant over time. This is thanks to the specific choice of the RTILs employed: one (Bmim OAc) is more indicated for the capture and consequently HER, while the other one (Bmim OTf) is selective towards eCO2RR to CO. Water is the preferred proton source for HER; however, eCO2RR can occur even in low-water-concentration electrolytes (few ppm), suggesting that the acidic proton at C2 position of the imidazolium ring can act as well as a co-proton source for CO2 reduction. These data have shown good agreement with modeling results through COMSOL Multiphysics.
When choosing the most suitable cell for the reaction, a two-compartment cell (e.g., H-cells or flow cells) is the best solution. When a single cell was used, it was impossible to maintain the two processes equally stable, with the HER overcoming the eCO2RR in a short time. Although in previous works it was possible to produce CO stably in a single cell with FECO > 90% with Bmim OTf in 3-MPN as the electrolyte, herein, the addition of Bmim OAc led to oxidative phenomena of the RTIL-based electrolyte at the anode, with a negative effect in the eCO2RR. Indeed, while controlling the potential at the cathode, the anodic potential can increase to values that may degrade the RTILs, producing by-products such as ethylene and methane, which can be wrongly attributed to the eCO2RR and reduce the purity of the produced syngas.
The usual average higher cell potential of H-cells due to high ohmic resistances can be avoided using flow cells or better-designed H-cells with a low distance between the electrodes, even if a few works have implemented such a setup to work with RTILs-based electrolytes. Separating the anodic chamber from the cathodic chamber would prevent issues related to the degradation of products and enable the choice of the anodic reaction to lower the overall cell potential further. Besides, we have demonstrated the importance of choosing the right membrane. When a BPM was employed, we observed constant acidification of the catholyte due to water splitting at the CEL, which makes HER favored with time, in agreement with our modeling data supporting such a mechanistic hypothesis. An anionic membrane is preferred in this IL-based system to obtain stable syngas production for hours without losing catalytic activity [45].
A trade-off between the different phenomena in a specific electrochemical cell should be found to optimize the production of the target product. We demonstrated that a stable syngas production could be obtained while exploiting the advantage of the mixture of Bmim OAc and Bmim OTf as electrolytes, i.e., high CO2 solubility and co-catalytic effect, by using a two-chamber electrochemical cell with an AEM. Depending on the application, the syngas CO/H2 ratio can be controlled by changing the electrolyte’s water/ionic liquid ratio. The known issue of the loss of CO2 from the catholyte by bi/carbonates crossover through the anionic membrane should be mitigated differently. For instance, the bi/bicarbonates (being oxidized to CO2 in the anode) can be recovered by caustic washing with KOH of the anodic outgas, producing a bicarbonate solution that can be recirculated and reused as catholyte or by a pressure swing absorption process to separate the CO2 to be recirculated in the gaseous form. The best option should be selected based on techno-economic considerations beyond this work’s scope. Herein, we offer guidelines for syngas generation in RTIL-based systems from waste-CO2 reduction, which can be helpful for the development of novel green chemical synthesis processes.

Supplementary Materials

The following supporting information can be downloaded at: https://www.mdpi.com/article/10.3390/catal15040318/s1: Figure S1. Conductivity trend of 3-MPN solutions prepared starting from a mix of 1.6 M [Bmim][SO3CF3] and 2.4 M [Bmim][CO2CH3] solutions and adding variable amounts of H2O. Raw data in Table 2; Figure S2. Schematic representation of (a) the single cell and (b) the H-cell employed for the electrochemical measurements; Figure S3. Cumulative Faradaic Efficiency (FE) obtained with 90 min Chronopotentiometry (CP) in a single-cell configuration for different electrolytes and applied currents in CO2-saturated electrolytes; Figure S4. MIX0% before (left) and after (right) three 90 min CPs at j = −20, −40, −50 mA/cm2 in a single-compartment cell; Figure S5. Productivity (in mmol) of (a) CH4 and (b) C2H4 for different electrolytes and potentials vs. (Ag/AgCl) in a single cell and N2-saturated electrolyte; Figure S6. Linear Sweep Voltammetry (LSV) collected in CO2-saturated electrolyte before and after three 90-min CPs at J = −20, −40, −50 mA/cm2 in single-compartment cell; Figure S7. Time evolution of H2 and CO productivity (in ppm) during chronopotentiometry at j = −20 mA/cm2 CP for the MIX20% electrolyte in a single-compartment cell configuration; Figure S8. FECO (in orange) and FEH2 (in green) obtained in an H-cell equipped with AEM at different potentials with the MIX20%. Figure S9. IR spectra of the anolyte (0.5 M KOH aqueous solution) before and after 3 h electrolysis at −20 mA/cm2 in H-type cell equipped with an AEM. Figure S10. IR spectra of the catholyte (MIX20%) before and after 3 h electrolysis at −20 mA/cm2 in H-type cell equipped with an AEM.

Author Contributions

M.G. designed the methodology, performed the experimental investigation, and wrote the initial draft of the manuscript. A.F. contributed to the experimental investigation and conceptualization of results. S.H. conceptualized the results, conceived the project, provided the resources and funding, and reviewed and edited the final manuscript. All authors have read and agreed to the published version of the manuscript.

Funding

Projects INTERFACE-E53D23003280006 and SUNCOCHEM-862192 by European Commission.

Data Availability Statement

The raw data supporting the conclusions of this article will be made available by the authors on request.

Acknowledgments

The European Commission supported this work through Next Generation EU, Mission 4 Component 2 Investment 1.1 CUP E53D23003280006 under the PRIN 2022 project Interface and the European Union’s Horizon 2020 Research and Innovation Action program under the SunCOChem project (Grant Agreement No. 862192). We thank Federico Dattila for the support with the modelling work and conceptualizing the results. The ionic liquids were supplied by Iolitec Ionic Liquids Technologies GmBH, Heilbronn, Germany.

Conflicts of Interest

The authors declare no competing interests.

References

  1. Monteiro, M.C.O.; Philips, M.F.; Schouten, K.J.P.; Koper, M.T.M. Efficiency and selectivity of CO2 reduction to CO on gold gas diffusion electrodes in acidic media. Nat. Commun. 2021, 12, 4943. [Google Scholar] [CrossRef] [PubMed]
  2. Marcandalli, G.; Goyal, A.; Koper, M.T.M. Electrolyte effects on the faradaic efficiency of CO2 reduction to co on a gold electrode. ACS Catal. 2021, 11, 4936–4945. [Google Scholar] [CrossRef] [PubMed]
  3. Cuatto, G.; Zoli, M.; Gallone, M.; Guzmán, H.; Castellino, M.; Hernández, S. Standardization of Cu2O nanocubes synthesis: Role of precipitation process parameters on physico-chemical and photo-electrocatalytic properties. Chem. Eng. Res. Des. 2023, 199, 384–398. [Google Scholar] [CrossRef]
  4. Rotundo, L.; Garino, C.; Priola, E.; Sassone, D.; Rao, H.; Ma, B.; Robert, M.; Fiedler, J.; Gobetto, R.; Nervi, C. Electrochemical and Photochemical Reduction of CO2 Catalyzed by Re(I) Complexes Carrying Local Proton Sources. Organometallics 2019, 38, 1351–1360. [Google Scholar] [CrossRef]
  5. Franco, F.; Cometto, C.; Nencini, L.; Barolo, C.; Sordello, F.; Minero, C.; Fiedler, J.; Robert, M.; Gobetto, R.; Nervi, C. Local Proton Source in Electrocatalytic CO2 Reduction with [Mn(bpy–R)(CO)3Br] Complexes. Chem. A Eur. J. 2017, 23, 4782–4793. [Google Scholar] [CrossRef]
  6. Franco, F.; Cometto, C.; Vallana, F.F.; Sordello, F.; Priola, E.; Minero, C.; Nervi, C.; Gobetto, R. A local proton source in a [Mn(bpy-R)(CO)3Br]-type redox catalyst enables CO2 reduction even in the absence of Brønsted acids. Chem. Commun. 2014, 50, 14670–14673. [Google Scholar] [CrossRef]
  7. Wang, Y.; Chen, Z.; Han, P.; Du, Y.; Gu, Z.; Xu, X.; Zheng, G. Single-Atomic Cu with Multiple Oxygen Vacancies on Ceria for Electrocatalytic CO2 Reduction to CH4. ACS Catal. 2018, 8, 7113–7119. [Google Scholar] [CrossRef]
  8. Shen, J.; Kortlever, R.; Kas, R.; Birdja, Y.Y.; Diaz-Morales, O.; Kwon, Y.; Ledezma-Yanez, I.; Schouten, K.J.P.; Mul, G.; Koper, M.T.M. Electrocatalytic reduction of carbon dioxide to carbon monoxide and methane at an immobilized cobalt protoporphyrin. Nat. Commun. 2015, 6, 8177. [Google Scholar] [CrossRef]
  9. Weng, Z.; Jiang, J.; Wu, Y.; Wu, Z.; Guo, X.; Materna, K.L.; Liu, W.; Batista, V.S.; Brudvig, G.W.; Wang, H. Electrochemical CO2 Reduction to Hydrocarbons on a Heterogeneous Molecular Cu Catalyst in Aqueous Solution. J. Am. Chem. Soc. 2016, 138, 8076–8079. [Google Scholar] [CrossRef]
  10. Li, F.; Thevenon, A.; Rosas-Hernández, A.; Wang, Z.; Li, Y.; Gabardo, C.M.; Ozden, A.; Dinh, C.T.; Li, J.; Wang, Y.; et al. Molecular tuning of CO2-to-ethylene conversion. Nature 2020, 577, 509–513. [Google Scholar] [CrossRef]
  11. Hori, Y.; Murata, A.; Takahashi, R.; Suzuki, S. Enhanced formation of ethylene and alcohols at ambient temperature and pressure in electrochemical reduction of carbon dioxide at a copper electrode. ChemInform 1988, 19, 17–19. [Google Scholar] [CrossRef]
  12. Dinh, C.-T.; Burdyny, T.; Kibria, M.G.; Seifitokaldani, A.; Gabardo, C.M.; de Arquer, F.P.G.; Kiani, A.; Edwards, J.P.; De Luna, P.; Bushuyev, O.S.; et al. CO2 electroreduction to ethylene via hydroxide-mediated copper catalysis at an abrupt interface. Science 2018, 360, 783–787. [Google Scholar] [CrossRef] [PubMed]
  13. Zhan, C.; Dattila, F.; Rettenmaier, C.; Bergmann, A.; Kühl, S.; García-Muelas, R.; López, N.; Cuenya, B.R. Revealing the CO coverage-driven C–C coupling mechanism for electrochemical CO2 reduction on Cu2O nanocubes via Operando Raman spectroscopy. ACS Catal. 2021, 11, 7694–7701. [Google Scholar] [CrossRef] [PubMed]
  14. Yang, H.; Wu, Y.; Li, G.; Lin, Q.; Hu, Q.; Zhang, Q.; Liu, J.; He, C. Scalable Production of Efficient Single-Atom Copper Decorated Carbon Membranes for CO2 Electroreduction to Methanol. J. Am. Chem. Soc. 2019, 141, 12717–12723. [Google Scholar] [CrossRef]
  15. Lu, L.; Sun, X.; Ma, J.; Yang, D.; Wu, H.; Zhang, B.; Zhang, J.; Han, B. Highly Efficient Electroreduction of CO2 to Methanol on Palladium–Copper Bimetallic Aerogels. Angew. Chem. Int. Ed. Engl. 2018, 57, 14149–14153. [Google Scholar] [CrossRef]
  16. Albo, J.; Sáez, A.; Solla-Gullón, J.; Montiel, V.; Irabien, A. Production of methanol from CO2 electroreduction at Cu2O and Cu2O/ZnO-based electrodes in aqueous solution. Appl. Catal. B 2015, 176–177, 709–717. [Google Scholar] [CrossRef]
  17. Bohra, D.; Chaudhry, J.H.; Burdyny, T.; Pidko, E.A.; Smith, W.A. Modeling the electrical double layer to understand the reaction environment in a CO2 electrocatalytic system. Energy Environ. Sci. 2019, 12, 3380–3389. [Google Scholar] [CrossRef]
  18. Siritanaratkul, B.; Eagle, C.; Cowan, A.J. Manganese Carbonyl Complexes as Selective Electrocatalysts for CO2 Reduction in Water and Organic Solvents. Acc. Chem. Res. 2022, 55, 955–965. [Google Scholar] [CrossRef]
  19. Cadena, C.; Anthony, J.L.; Shah, J.K.; Morrow, T.I.; Brennecke, J.F.; Maginn, E.J. Why Is CO2 So Soluble in Imidazolium-Based Ionic Liquids? J. Am. Chem. Soc. 2004, 126, 5300–5308. [Google Scholar] [CrossRef]
  20. Feng, J.; Zeng, S.; Feng, J.; Dong, H.; Zhang, X. CO2 Electroreduction in Ionic Liquids: A Review. Chin. J. Chem. 2018, 36, 961–970. [Google Scholar] [CrossRef]
  21. Sun, L.; Ramesha, G.K.; Kamat, P.V.; Brennecke, J.F. Switching the reaction course of electrochemical CO2 reduction with ionic liquids. Langmuir 2014, 30, 6302–6308. [Google Scholar] [CrossRef] [PubMed]
  22. Li, Y.; Li, F.; Laaksonen, A.; Wang, C.; Cobden, P.; Boden, P.; Liu, Y.; Zhang, X.; Ji, X. Electrochemical CO2reduction with ionic liquids: Review and evaluation. Ind. Chem. Mater. 2023, 1, 410–430. [Google Scholar] [CrossRef]
  23. Parada, W.A.; Vasilyev, D.V.; Mayrhofer, K.J.J.; Katsounaros, I. CO2 Electroreduction on Silver Foams Modified by Ionic Liquids with Different Cation Side Chain Length. ACS Appl. Mater. Interfaces 2022, 14, 14193–14201. [Google Scholar] [CrossRef] [PubMed]
  24. Coskun, O.K.; Dongare, S.; Doherty, B.; Klemm, A.; Tuckerman, M.; Gurkan, B. Tailoring Electrochemical CO2 Reduction on Copper by Reactive Ionic Liquid and Native Hydrogen Bond Donors. Angew. Chem. Int. Ed. Engl. 2023, 63, e202312163. [Google Scholar] [CrossRef]
  25. Brennecke, J.F.; Gurkan, B.E. Ionic liquids for CO2 capture and emission reduction. J. Phys. Chem. Lett. 2010, 1, 3459–3464. [Google Scholar] [CrossRef]
  26. Anderson, J.L.; Dixon, J.K.; Brennecke, J.F. Solubility of CO2, CH4, C2H6, C2H4, O2, and N2 in 1-hexyl-3-methylpyridinium bis(trifluoromethylsulfonyl)imide: Comparison to other ionic liquids. Acc. Chem. Res. 2007, 40, 1208–1216. [Google Scholar] [CrossRef]
  27. Papasizza, M.; Yang, X.; Cheng, J.; Cuesta, A. Electrocatalytic reduction of CO2 in neat and water-containing imidazolium-based ionic liquids. Curr. Opin. Electrochem. 2020, 23, 80–88. [Google Scholar] [CrossRef]
  28. Reche, I.; Gallardo, I.; Guirado, G. Electrochemical studies of CO2 in imidazolium ionic liquids using silver as a working electrode: A suitable approach for determining diffusion coefficients, solubility values, and electrocatalytic effects. RSC Adv. 2014, 4, 65176–65183. [Google Scholar] [CrossRef]
  29. Dattila, F.; Fortunati, A.; Zammillo, F.; Guzmán, H.; López, N.; Hernández, S. Descriptors for Electrochemical CO2 Reduction in Imidazolium-Based Electrolytes. ACS Catal. 2024, 14, 16166–16174. [Google Scholar] [CrossRef]
  30. Fortunati, A.; Risplendi, F.; Fiorentin, M.R.; Cicero, G.; Parisi, E.; Castellino, M.; Simone, E.; Iliev, B.; Schubert, T.J.S.; Russo, N.; et al. Understanding the role of imidazolium-based ionic liquids in the electrochemical CO2 reduction reaction. Commun. Chem. 2023, 6, 84. [Google Scholar] [CrossRef]
  31. Zhang, X.; Guo, S.-X.; Gandionco, K.A.; Bond, A.M.; Zhang, J. Electrocatalytic carbon dioxide reduction: From fundamental principles to catalyst design. Mater. Today Adv. 2020, 7, 100074. [Google Scholar] [CrossRef]
  32. Singh, M.R.; Clark, E.L.; Bell, A.T. Effects of electrolyte, catalyst, and membrane composition and operating conditions on the performance of solar-driven electrochemical reduction of carbon dioxide. Phys. Chem. Chem. Phys. 2015, 17, 18924–18936. [Google Scholar] [CrossRef] [PubMed]
  33. Marcandalli, G.; Monteiro, M.C.O.; Goyal, A.; Koper, M.T.M. Electrolyte Effects on CO2 Electrochemical Reduction to CO. Acc. Chem. Res. 2022, 55, 1900–1911. [Google Scholar] [CrossRef] [PubMed]
  34. Liang, S.; Altaf, N.; Huang, L.; Gao, Y.; Wang, Q. Electrolytic cell design for electrochemical CO2 reduction. J. CO2 Util. 2020, 35, 90–105. [Google Scholar] [CrossRef]
  35. Xi, W.; Xi, W.; Yang, P.; Yang, P.; Jiang, M.; Jiang, M.; Wang, X.; Wang, X.; Zhou, H.; Zhou, H.; et al. Electrochemical CO2 reduction coupled with alternative oxidation reactions: Electrocatalysts, electrolytes, and electrolyzers. Appl. Catal. B Environ. 2024, 341, 123291. [Google Scholar] [CrossRef]
  36. Jiang, N.; Zhu, Z.; Xue, W.; Xia, B.Y.; You, B. Emerging Electrocatalysts for Water Oxidation under Near-Neutral CO2 Reduction Conditions. Adv. Mater. 2022, 34, 2105852. [Google Scholar] [CrossRef]
  37. Tufa, R.A.; Chanda, D.; Ma, M.; Aili, D.; Demissie, T.B.; Vaes, J.; Li, Q.; Liu, S.; Pant, D. Towards highly efficient electrochemical CO2 reduction: Cell designs, membranes and electrocatalysts. Appl. Energy 2020, 277, 115557. [Google Scholar] [CrossRef]
  38. Hernández, S.; Farkhondehfal, M.A.; Sastre, F.; Makkee, M.; Saracco, G.; Russo, N. Syngas production from electrochemical reduction of CO2: Current status and prospective implementation. Green Chem. 2017, 19, 2326–2346. [Google Scholar] [CrossRef]
  39. Rosen, J.; Hutchings, G.S.; Lu, Q.; Rivera, S.; Zhou, Y.; Vlachos, D.G.; Jiao, F. Mechanistic Insights into the Electrochemical Reduction of CO2 to CO on Nanostructured Ag Surfaces. ACS Catal. 2015, 5, 4293–4299. [Google Scholar] [CrossRef]
  40. Hoshi, N.; Kato, M.; Hori, Y. Electrochemical reduction of CO, on single crystal electrodes of silver Ag(111), Ag(100) and Agi(110). J. Electroanal. Chem. 1997, 44, 283–286. [Google Scholar]
  41. Hori, Y. Electrochemical CO2 Reduction on Metal Electrodes. In Modern Aspects of Electrochemistry. Modern Aspects of Electrochemistry; Springer: New York, NY, USA, 2008; pp. 89–189. [Google Scholar] [CrossRef]
  42. Mahyoub, S.A.; Qaraah, F.; Chen, C.; Zhang, F.; Yan, S.; Cheng, Z. An overview on the recent developments of Ag-based electrodes in the electrochemical reduction of CO2 to CO. Sustain. Energy Fuels 2019, 4, 50–67. [Google Scholar] [CrossRef]
  43. Jensen, M.T.; Rønne, M.H.; Ravn, A.K.; Juhl, R.W.; Nielsen, D.U.; Hu, X.-M.; Pedersen, S.U.; Daasbjerg, K.; Skrydstrup, T. Scalable carbon dioxide electroreduction coupled to carbonylation chemistry. Nat. Commun. 2017, 8, 489. [Google Scholar] [CrossRef] [PubMed]
  44. Ponsard, L.; Nicolas, E.; Tran, N.H.; Lamaison, S.; Wakerley, D.; Cantat, T.; Fontecave, M. Coupling Electrocatalytic CO2 Reduction with Thermocatalysis Enables the Formation of a Lactone Monomer. ChemSusChem 2021, 14, 2198–2204. [Google Scholar] [CrossRef]
  45. Miró, R.; Fernández-Llamazares, E.; Godard, C.; Bernardos, M.D.d.L.; Gual, A. Synergism between iron porphyrin and dicationic ionic liquids: Tandem CO2 electroreduction–carbonylation reactions. Chem. Commun. 2022, 58, 10552–10555. [Google Scholar] [CrossRef]
  46. Biswas, A.N.; Xie, Z.; Xia, R.; Overa, S.; Jiao, F.; Chen, J.G. Tandem Electrocatalytic–Thermocatalytic Reaction Scheme for CO2 Conversion to C3 Oxygenates. ACS Energy Lett. 2022, 7, 2904–2910. [Google Scholar] [CrossRef]
  47. Kroon, M.C.; Buijs, W.; Peters, C.J.; Witkamp, G.-J. Decomposition of ionic liquids in electrochemical processing. Green Chem. 2006, 8, 241–245. [Google Scholar] [CrossRef]
  48. Dutta, A.; Morstein, C.E.; Rahaman, M.; López, A.C.; Broekmann, P. Beyond Copper in CO2 Electrolysis: Effective Hydrocarbon Production on Silver-Nanofoam Catalysts. ACS Catal. 2018, 8, 8357–8368. [Google Scholar] [CrossRef]
  49. Shiratsuchi, R.; Nogami, G. Pulsed Electroreduction of CO2 on Silver Electrodes. J. Electrochem. Soc. 1996, 143, 582–586. [Google Scholar] [CrossRef]
  50. Kumełan, J.; Kamps, Á.P.-S.; Tuma, D.; Maurer, G. Solubility of CO2 in the ionic liquids [bmim][CH3SO4] and [bmim][PF6]. J. Chem. Eng. Data 2006, 51, 1802–1807. [Google Scholar] [CrossRef]
  51. Bui, J.C.; Kim, C.; Weber, A.Z.; Bell, A.T. Dynamic boundary layer simulation of pulsed CO2 electrolysis on a copper catalyst. ACS Energy Lett. 2021, 6, 1181–1188. [Google Scholar] [CrossRef]
  52. Wang, J.H. Self-Diffusion Coefficients of Water. J. Phys. Chem. 1965, 69, 4412. [Google Scholar]
  53. Moya, C.; Palomar, J.; Gonzalez-Miquel, M.; Bedia, J.; Rodriguez, F. Diffusion coefficients of CO2 in ionic liquids estimated by gravimetry. Ind. Eng. Chem. Res. 2014, 53, 13782–13789. [Google Scholar] [CrossRef]
  54. Liu, S.; Govindarajan, N.; Prats, H.; Chan, K. Understanding the reaction mechanism of Kolbe electrolysis on Pt anodes. Chem Catal. 2022, 2, 1100–1113. [Google Scholar] [CrossRef]
  55. Habibzadeh, F.; Mardle, P.; Zhao, N.; Riley, H.D.; Salvatore, D.A.; Berlinguette, C.P.; Holdcroft, S.; Shi, Z. Ion Exchange Membranes in Electrochemical CO2 Reduction Processes. Electrochem. Energy Rev. 2023, 6, 26. [Google Scholar] [CrossRef]
Figure 1. (a) 1-butyl-3-methylimidaolizum cation. The three carbons of the imidazolium ring are indicated in red. The proton on C2 is the acidic site. Its acidity also depends on the nature of the anion [30]. (b) Triflate ([CF3SO3] or OTf) anion. (c) Acetate ([CH3CO2] or OAc) anion.
Catalysts 15 00318 g001
Figure 2. (a) LSV in N2 of electrolytes with increasing concentration of H2O. (b) LSV MIX0% in N2 and CO2. In the inset of (b), the LSV both in N2- and CO2-saturated atmospheres MIX20% is reported. iR compensation is applied to avoid any conductivity-related bias. Reduction peaks visible in MIX5% and MIX1% are probably related to impurities (since the peak is absent either in MIX0% or MIX2%). However, the assignation of this undefined redox phenomenon is beyond the scope of the manuscript.
Catalysts 15 00318 g002
Figure 3. Dependence of Faradaic Efficiency toward H2 (green) and CO (orange) for different electrolytes during chronopotentiometry in single cell at −20 mA/cm2 for 90 min.
Catalysts 15 00318 g003
Figure 4. (a) gas products collected in single cell during t = 6 h step-electrolysis experiments at different current densities in N2-saturated electrolyte (yellow region) and CO2-saturated electrolyte (blue region); (b) Potentials measured at the Working Electrode (we) and Counter Electrode (ce) during the current ramp from j = −5 mA/cm2 to j = −90 mA/cm2. Potential is referred to Ag/AgCl electrode.
Catalysts 15 00318 g004
Figure 5. (a) Gas production profile obtained with MIX20% during 1 h electrolysis at −20 mA/cm2 in H-type cell equipped with BPM and KOH 0.5 M as anolyte. (b) Gas production profile obtained with MIX20% during 3 h electrolysis at −20 mA/cm2 in H-type cell equipped with an AEM and KOH 0.5 M as anolyte.
Catalysts 15 00318 g005
Figure 6. Experimental (scatters) and predicted (lines) faradaic efficiencies values for H2 (green) and CO (orange) for the 5 ILs mixtures with water addition and only water traces (close to 0 concentrations), at −20 mA/cm2 applied current density.
Catalysts 15 00318 g006
Figure 7. Time-dependent FE toward H2 (green) and CO (orange) depending on the cell membrane, (a) Bipolar (BPM) and (b) Anion Exchange (AEM). Experimental reports are given as inset. Red curves indicate H+/CO2 surface ratio.
Catalysts 15 00318 g007
Figure 8. (a) Scheme of the process using an AEM membrane; (b) schematic of the process proposed as the cause of syngas production instability when a BPM is employed. Water splitting at the interface layer happens, and protons migrate from the membrane to the cathode, switching selectivity toward HER.
Catalysts 15 00318 g008
Table 1. Molar composition of the electrolytes.
NameH2O (%v/v)H2O (mL)H2O (mmol)Added H2O (M)[SO₃CF₃] (mmol)[SO₃CF₃] (M)[CO2CH₃] (mmol)[CO2CH₃] (M)[Anion] (mmol)Conductivity (mS/cm)
MIX20%2010550.011.0480.96240.487221.7
MIX10%105275.05.5541.08270.548118.8
MIX5%52.5137.52.75571.14280.578516.1
MIX1%10.527.50.55591.19290.598812.7
MIX0%~0.20~30591.20300.608911.6
Table 2. Kinetic parameters included in the model.
j0 (mA/cm2)αE0/V vs. RHEReference
H26.36 10−20.140[51]
CO2.01 10−30.35−0.11[51]
Table 3. Homogeneous reaction rates.
ConstantValueReferences
kw1 (mol/m3 s)2.4·10−2[17]
kw2 (m3/mol s)2.4·106[17]
ΔG([Bmim]:)SO3CF3 (eV)1.03[29]
ΔG([Bmim]:)CO2CH3 (eV)2.24[29]
Table 4. Diffusion coefficients assumed in the model.
SpeciesDiffusion Coefficient (cm2/s)Charge (|e|)SolventReference
H+9.311·10−5+1Water[17]
OH5.273·10−5−1Water[17]
H2O2.57·10−50Water[52]
CO21.91·10−50Water[17]
CO22.9·10−60[Bmim][PF6][53]
Disclaimer/Publisher’s Note: The statements, opinions and data contained in all publications are solely those of the individual author(s) and contributor(s) and not of MDPI and/or the editor(s). MDPI and/or the editor(s) disclaim responsibility for any injury to people or property resulting from any ideas, methods, instructions or products referred to in the content.

