Article

A Radio Frequency Plasma-Modified SO42-S2O82/SnO2-Al2O3 Solid Superacid Catalyst Applied for the Esterification of Tyrosine

1
State Key Laboratory of NBC Protection for Civilian, Beijing 102205, China
2
Yibin Push Linko Technology Co., Ltd., Yibin 644000, China
3
School of Chemical Engineering, Ocean and Life Sciences, Dalian University of Technology, Panjin 124221, China
*
Authors to whom correspondence should be addressed.
Catalysts 2025, 15(3), 255; https://doi.org/10.3390/catal15030255
Submission received: 3 January 2025 / Revised: 27 February 2025 / Accepted: 5 March 2025 / Published: 7 March 2025
(This article belongs to the Section Catalysis in Organic and Polymer Chemistry)

Abstract

:
To overcome the limitations of conventional catalysts in sterically hindered esterification reactions, a radio frequency (RF) plasma-modified  S O 4 2 / S 2 O 8 2 /SnO2-Al2O₃ solid superacid catalyst was synthesized via sol-gel and impregnation, followed by RF plasma treatment and calcination. Comprehensive characterization revealed that the RF plasma modification endowed the catalyst with a uniform particle distribution (4.32 nm average size), larger specific surface area (104.44 m2·g−1), elevated total acid content (142.86 μmol·g−1), and increased oxygen vacancy concentration (16.4%), compared to the conventional sol-gel–impregnation–calcination-prepared catalyst. The RF plasma-modified  S O 4 2 - S 2 O 8 2 /SnO2-Al2O3 was subsequently applied to perform the esterification reaction of Tyr, with a higher steric hindrance. Mechanistic studies indicated that the plasma-induced surface etching and electronic redistribution/intensified electron-withdrawing capability of  S O 4 2 / S 2 O 8 2  groups synergistically strengthened Brønsted/Lewis acidity. For the esterification of tyrosine—a sterically demanding substrate—the modified catalyst achieved a 92.1% methyl tyrosine yield under the optimized conditions (180 °C, 0.8 MPa N2, 6 h), where the catalyst exhibited a better mechanical strength and better lifetime with five cycles. This work not only provides a scalable plasma-assisted strategy for tuning solid superacids but also establishes an eco-friendly alternative to traditional catalysts, and was applied to the esterification reactions of some high-steric-hindrance substrates.

Graphical Abstract

1. Introduction

Amino acid esters and their derivatives have been extensively utilized as pharmaceutical intermediates for decades. Numerous application cases of these compounds have been reported, such as antivirals, antitumor agents, antibacterials, etc. In food industry, amino acid esters serve as food additives to enhance flavor profiles and extend the freshness time [1]. In peptide chemistry, amino acid esterification is employed to protect -COOH groups for subsequent peptide synthesis [2].
Low-temperature plasma contains abundant high-energy electrons, ions, excited-state atoms, free radicals, and other active substances. Notably, the high-energy electrons exhibit strong reducibility, enabling interactions with catalyst surface groups to enhance catalyst performance [3]. Owing to its non-thermal equilibrium properties and capacity to drive chemical and physical reactions under “high-energy and low-temperature” conditions, low-temperature plasma has been widely adopted for efficient catalyst synthesis and modification. Compared to conventional thermodynamic methods, plasma treatment improves the catalytic activity, selectivity, and operational lifetime, and reduces the preparation time [4]. Among plasma technologies, radio frequency (RF) plasma generated via the high-frequency discharge ionization of low-pressure gases [5] is particularly effective for surface treatments of catalytic materials, including doping, etching, and surface cleaning, due to the non-equilibrium state at high frequency and low pressure [6,7]. Consequently, RF plasma technology offers a versatile approach to tailor catalytic material properties. Unlike traditional methods such as doping, surface functionalization, alloying, or impregnation, RF plasma simultaneously modulates the morphological characteristics, electronic structures, and material stability with greater convenience.
Recent studies have attempted to optimize plasma catalyst performance through plasma techniques. For instance, Anandan et al. synthesized sulfonated carbon catalysts via plasma treatment and adopted them for the batch esterification of 2-hydroxyisobutyric acid, demonstrating superior performance compared to sol-gel and impregnation methods [8]. Qin et al. applied graphene nanoplatelets (GNPs) with surface modification by nitrogen/argon plasma-induced sulfonation, revealing that plasma significantly enhances sulfonation activity and catalytic stability [9]. Similarly, Liu et al. developed a dielectric barrier discharge plasma technique for template removal in zeolite synthesis, identifying active species (e.g., electrons and excited oxygen) as key drivers of template dissociation [10].
Esterification is an effective method in peptide synthesis, which was used in the design of amino acid-based drugs. Tyrosine (Tyr) carboxylic esters are lipophilic compounds, and some studies suggested that tyrosine alkyl esters are useful lipophilic prodrug candidates for the slow release of Tyr at a target site. Therefore, tyrosine alkyl esters are usually applied as prodrugs or fluorescent sensors for drugs [11,12,13]. However, the esterification of Tyr is hindered by steric effects arising from the covalent bonding between its aromatic side chain and amino acid backbone—a characteristic of aromatic polar α-amino acids [14,15]. Therefore, owing to the higher steric hindrance and amphoteric dissociation of Tyr, it is rather hard to prepare methyl tyrosine (TyrOMe, a typical model compound) through an esterification reaction, which usually adopts a specific catalytic system. Previously, some methods for the esterification of tyrosine have been reported in Table 1. An example is enzyme (alpha-chymotrypsin) catalysis (Entry 1) [16], but this method has high requirements for the catalytic environment, a high cost, and a long reaction cycle, and the enzyme is easy to inactivate and difficult to recover. Homogeneous catalysis is where H2SO4 and SOCl2 catalysis is utilized (Entries 2 and 3) [17,18]. However, these methods have high toxicity and corrosiveness, high requirements for equipment, a cumbersome operation, and very easily cause environmental pollution. In recent years, researchers have tried to use green/sustainable catalysts, such as solid superacids, to catalyze the reaction. For example,  S O 4 2 - S 2 O 8 2 /SnO2-Nd2O3 was used for catalysis (Entry 4) [19], but the catalyst also had a high cost because of the use of rare earth elements. Hence, developing more environmentally friendly and inexpensive solid superacid catalysts to catalyze this type of reaction is an urgent problem that needs to be solved.
In this work, the  S O 4 2 / S 2 O 8 2 /SnO2-Al2O3 solid superacid was first prepared by the sol-gel and impregnation methods. The SnO2-Al2O3 carrier was modified by RF plasma technology to prepare  S O 4 2 / S 2 O 8 2 /SnO2-Al2O3-RF (SSA-RF). Then, a series of methods were used to characterize the catalyst before and after the modification. Finally, SSA-RF was employed to catalyze the esterification of high-steric-hindrance Tyr with methanol to yield TyrOMe. Significantly, the relationship between the effect of RF plasma on the physicochemical properties and the catalytic activity were thereby studied. The results demonstrated that the RF plasma modification refined the catalyst morphology, intensified the electron-withdrawing capability of  S O 4 2 / S 2 O 8 2 , and increased the oxygen vacancy content of the catalyst, which collectively contributed to the high esterification rate of Tyr. This work establishes an economical, efficient, and scalable plasma-assisted strategy for modifying solid superacids and enabling high-steric-hindrance esterification, outperforming traditional methods in both sustainability and practicality.

2. Results and Discussion

2.1. Hammett Titration

All of the acid strengths of the SSA-600 and SSA-RF-600 catalysts were titrated by the Hammett indicator method. The results are shown in Figure 1 and Table 2, and both SSA-600 and SSA-RF-600 caused the indicators 3-NT and 2,4-DNFB to undergo color reactions (as shown in Figure 1), indicating that the Hammett acidity of the two catalysts (H0 ≤ −14.5) was less than that of concentrated H2SO4 (98 wt.%, H0 = −9.36) [20]. As a solid superacid with the Hammett acidity function H0 ˂ −11.93 satisfies this requirement [21], these catalysts belonged to the category of solid superacid as a matter of course.

2.2. XRD

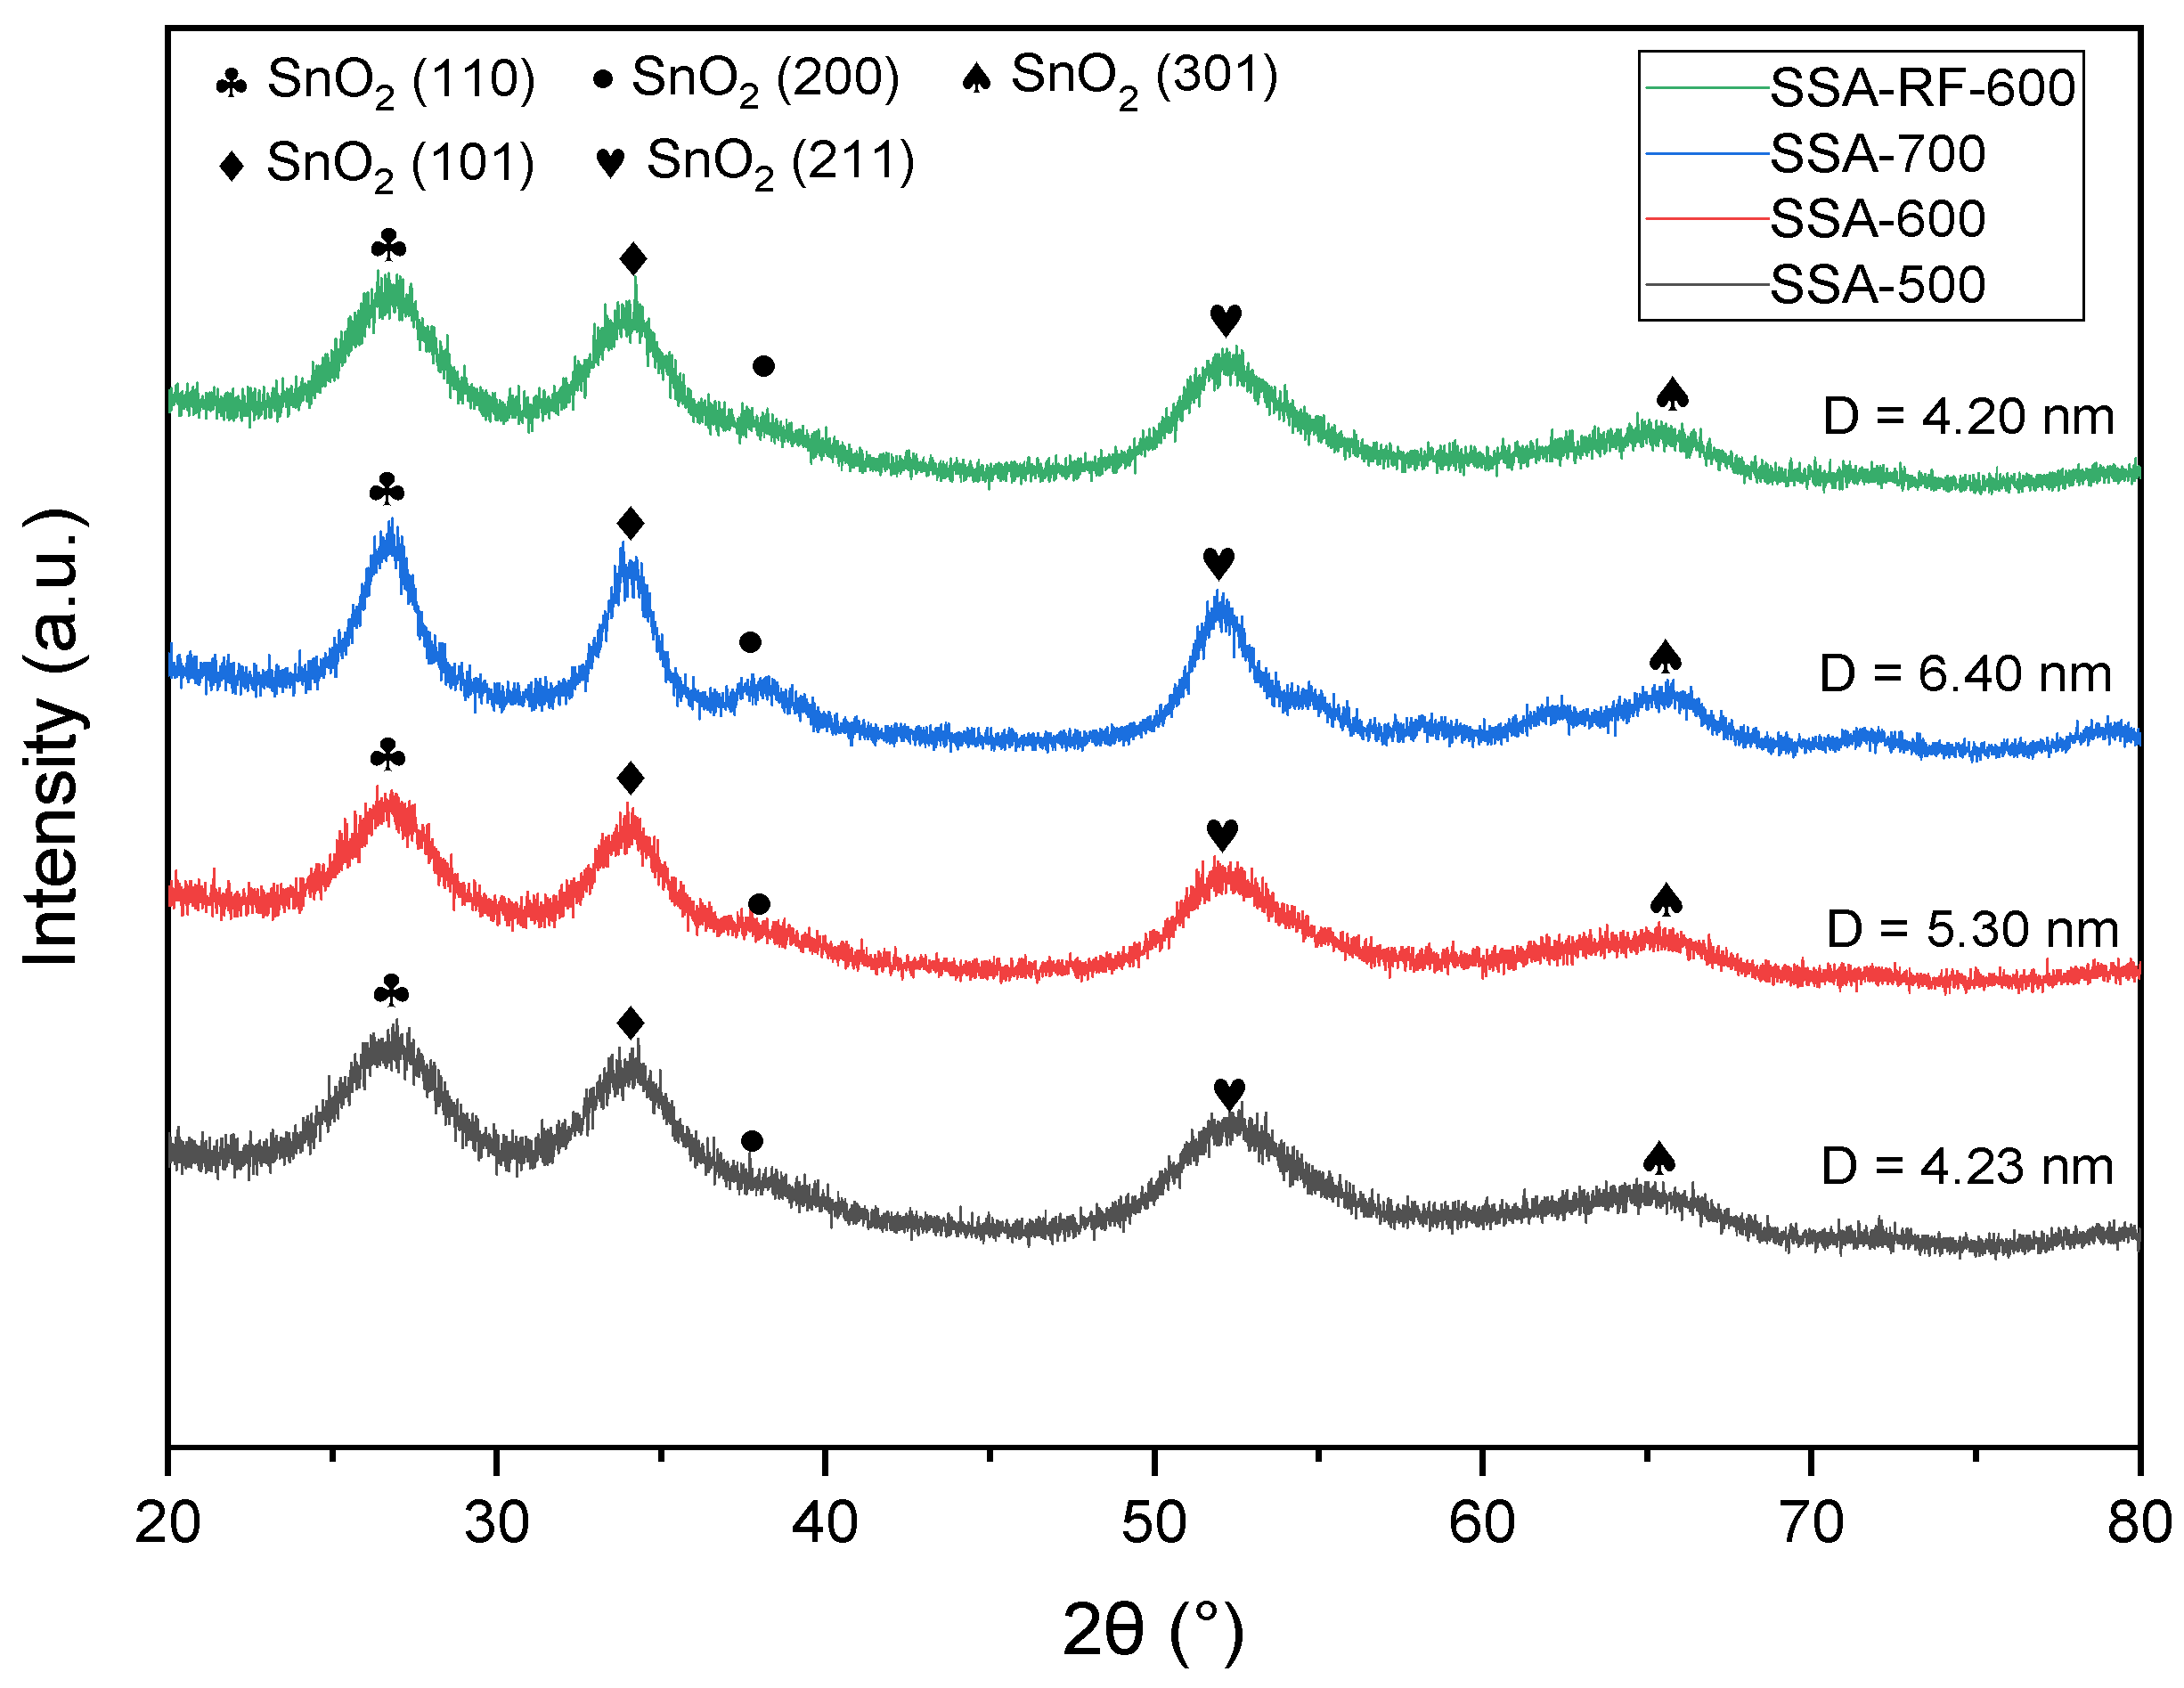
The XRD spectra of the catalysts were analyzed to demonstrate the formation process of the catalysts in Figure 2, wherein the tetragonal crystal form at = 26.6°, 33.8°, 51.8° and 65.4° corresponds to the (110), (200), (101), (211) and (301) crystal planes of SnO2 (JCPDS No. 41-1445), respectively. The diffraction peak of Al2O3 was not observed, which may be due to its higher dispersion and lower doping content. With rising calcination temperatures, the diffraction peak of SnO2 gradually became sharper, the intensity of the diffraction peak of SnO2 decreased, and the FWHM was broadened at the same calcination temperature after RF plasma treatment. According to the Scherrer formula, the wider the diffraction peak at half-peak, the smaller the grain size. The mean particle sizes of SSA-500, SSA-600, SSA-700 and SSA-RF-600 were about 4.23 nm, 5.30 nm, 6.40 nm and 4.20 nm, respectively. With the increase in temperature, the grain size increased due to particle agglomeration. Meanwhile, the grain size of SSA-RF-600 was smaller compared with that of SSA-600, declaring that the RF plasma modification owned the capability of inhibiting the grain growth of the catalyst. This result may be explained by the fact that the high-energy particles (such as ions, electrons, etc.) in the plasma collided with the catalyst particles surface, resulting in an increase of the surface temperature, which caused the surface to melt or soften, and then formed smaller particles under the action of surface tension [22].
For a further investigation of effect of the RF modification on the catalysts, the microscopic morphology, particle size, acidity, and elemental chemical state of the representative catalysts SSA-600 and SSA-RF-600 were characterized by HRTEM, nitrogen adsorption–desorption, Py-IR, NH3-TPD, FT-IT, and XPS.

2.3. HRTEM

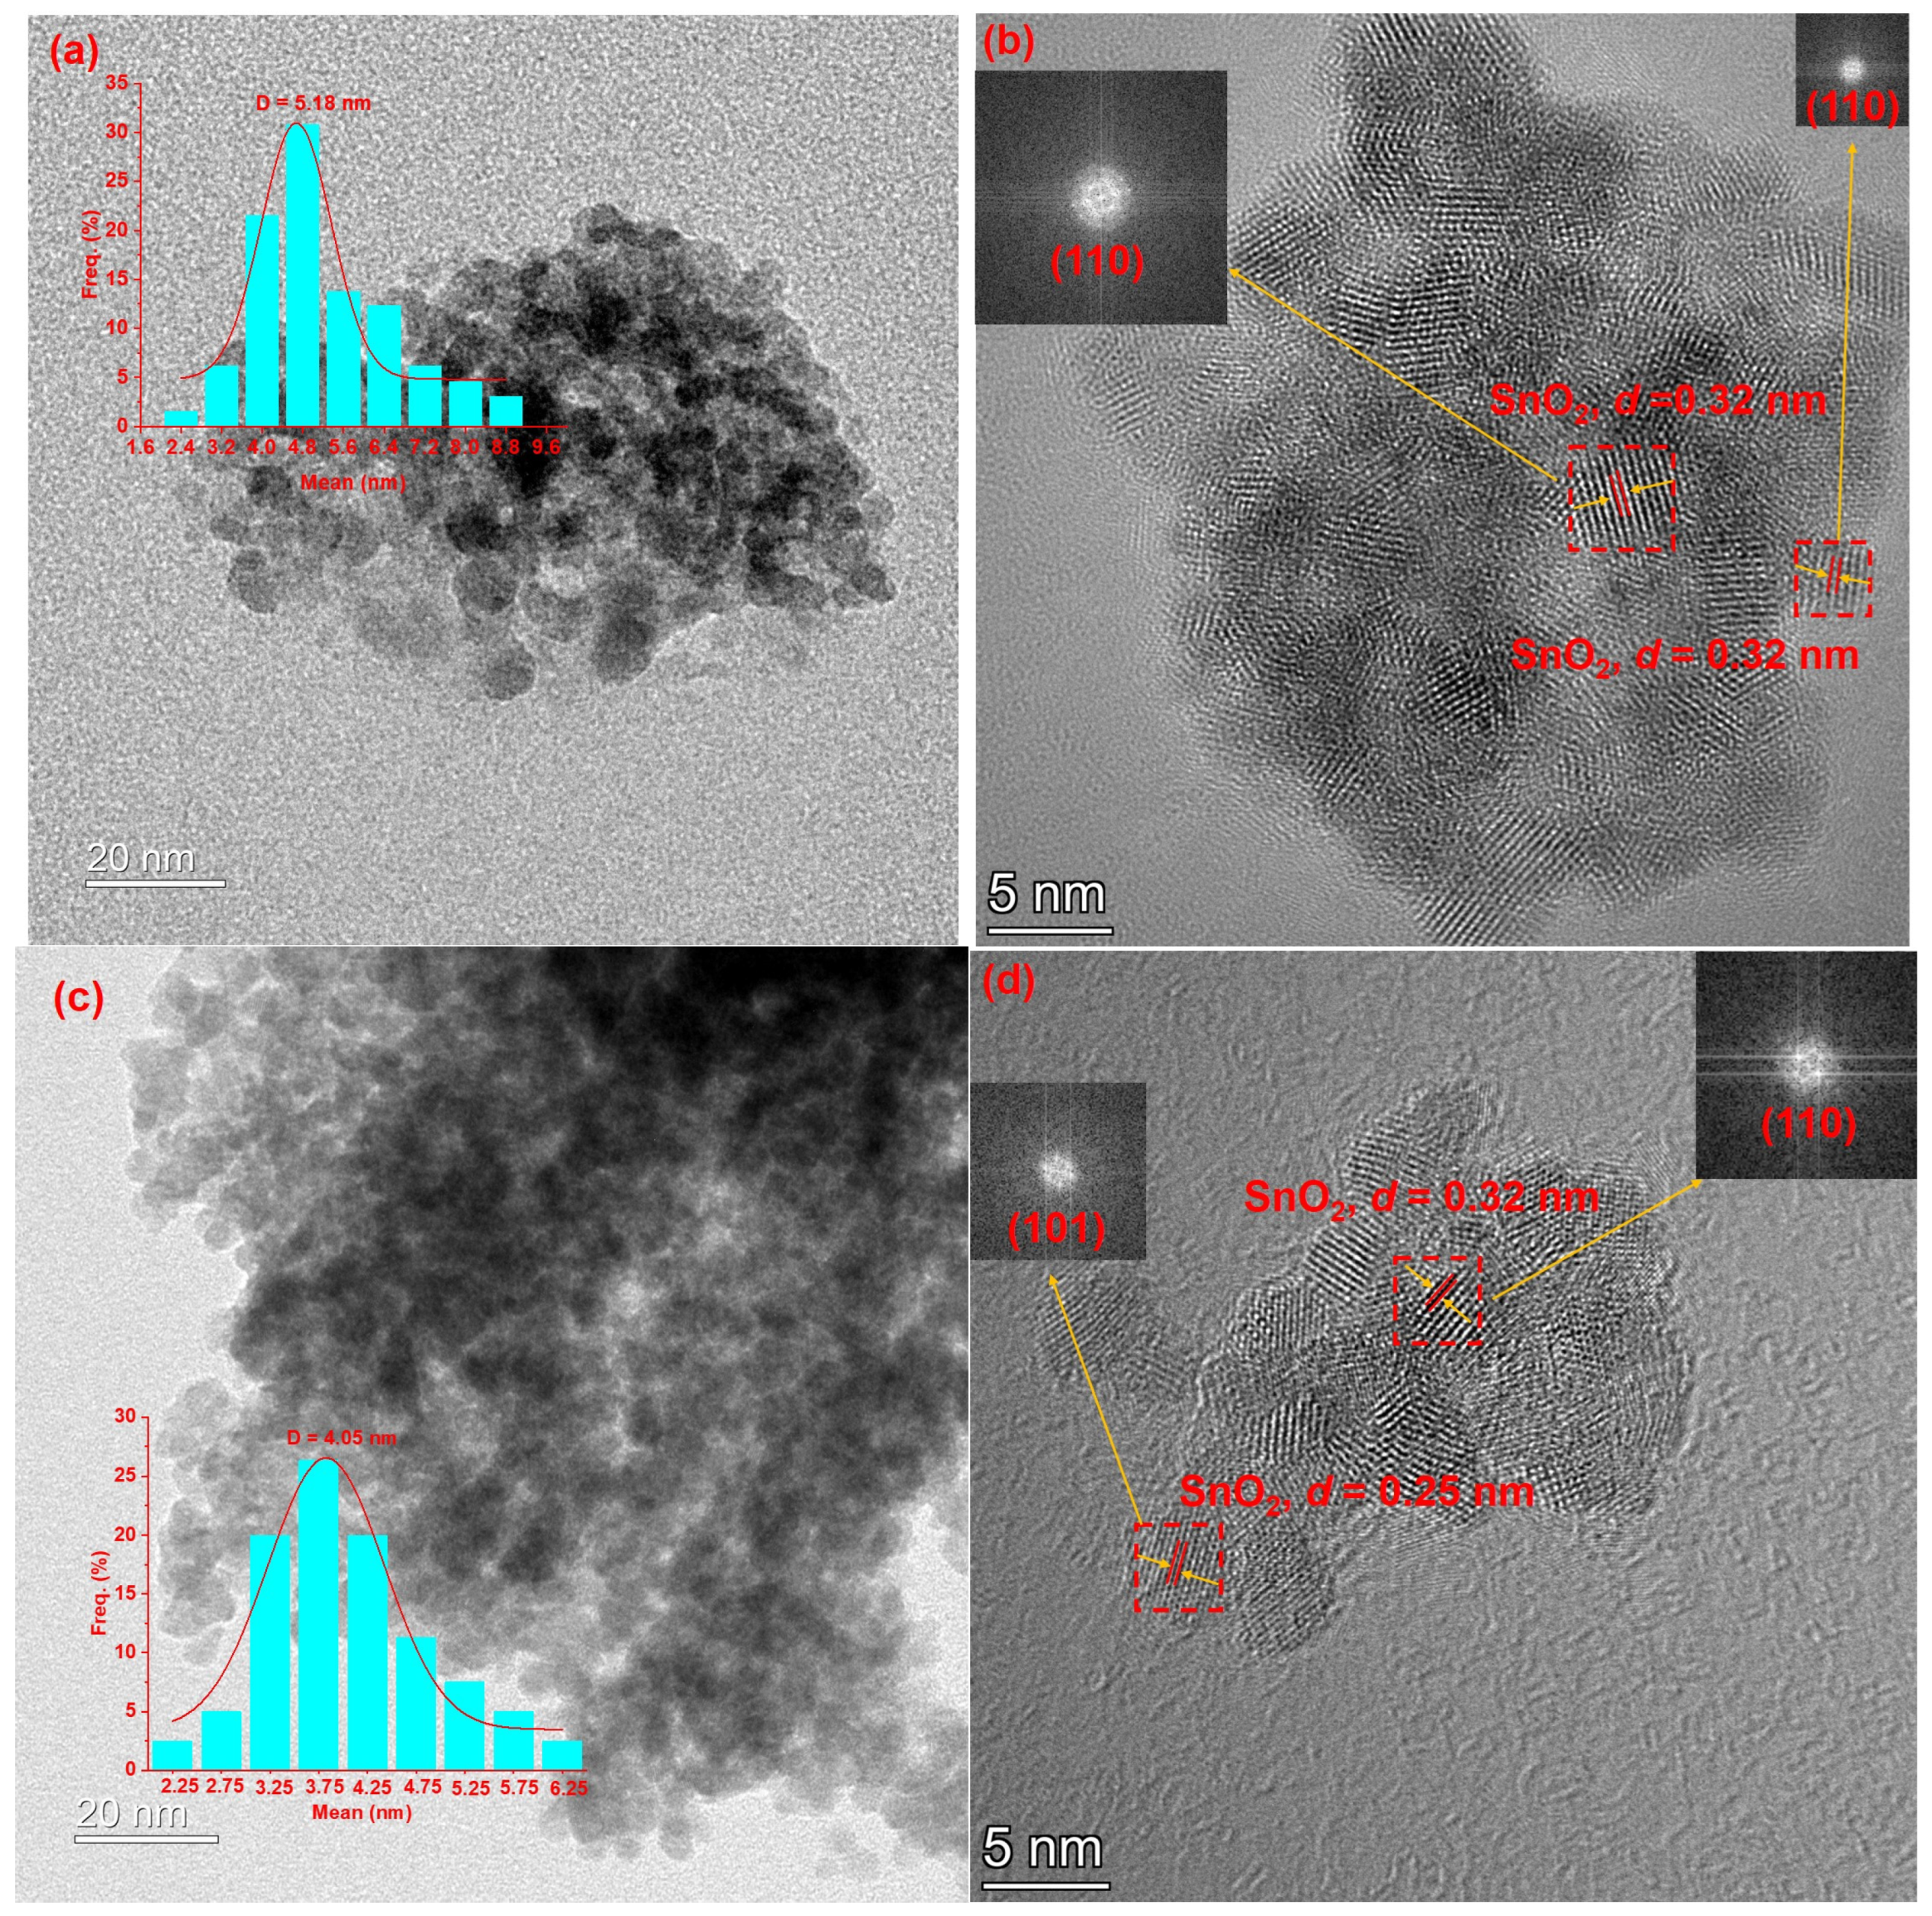
The HRTEM results are presented in Figure 3. In Figure 3a, the particle distribution of the SSA-600 catalyst was relatively distributed due to the obvious agglomeration caused by the increase in the particle size, which usually resulted from the sintering effect. As can be seen in Figure 3c, the particle distribution of SSA-RF-600 was more dispersed, indicating that the degree of grain agglomeration was low, the sintering effect was small, and thereby the particle size was small. Figure 3b,d depict the HRTEM images of SSA-600 and SSA-RF-600, respectively, where the interplanar distance of SnO2 was 0.32 nm, as reckoned by the Fast Fourier Transform (FFT) algorithms, corresponding to the interplanar distance of the (110) facet of SnO2 [23] in Figure 3b, while the inter planar spacing of 0.25 nm matched the (101) plane of tetragonal SnO2 [24], except for the (110) plane in Figure 3d. This phenomenon can be explained by the fact that plasma has the capability to manipulate the crystal plane, as shown in many reports [25,26,27], exposing more (101) planes. The particle size distributions of the two catalysts were analyzed by ImageJ software (version v1.54d, National Institutes of Health, Bethesda, MD, USA), with the mean particle size of SSA-600 being 5.18 nm in the inset of Figure 3a and SSA-RF-600 being 4.05 nm in the inset of Figure 3c, which were almost consistent with the results of the XRD analysis. The above results demonstrated that RF plasma can improve the dispersion and reduce the particle size of the catalyst particles significantly while enriching more (101) planes.

2.4. Nitrogen Adsorption—Desorption

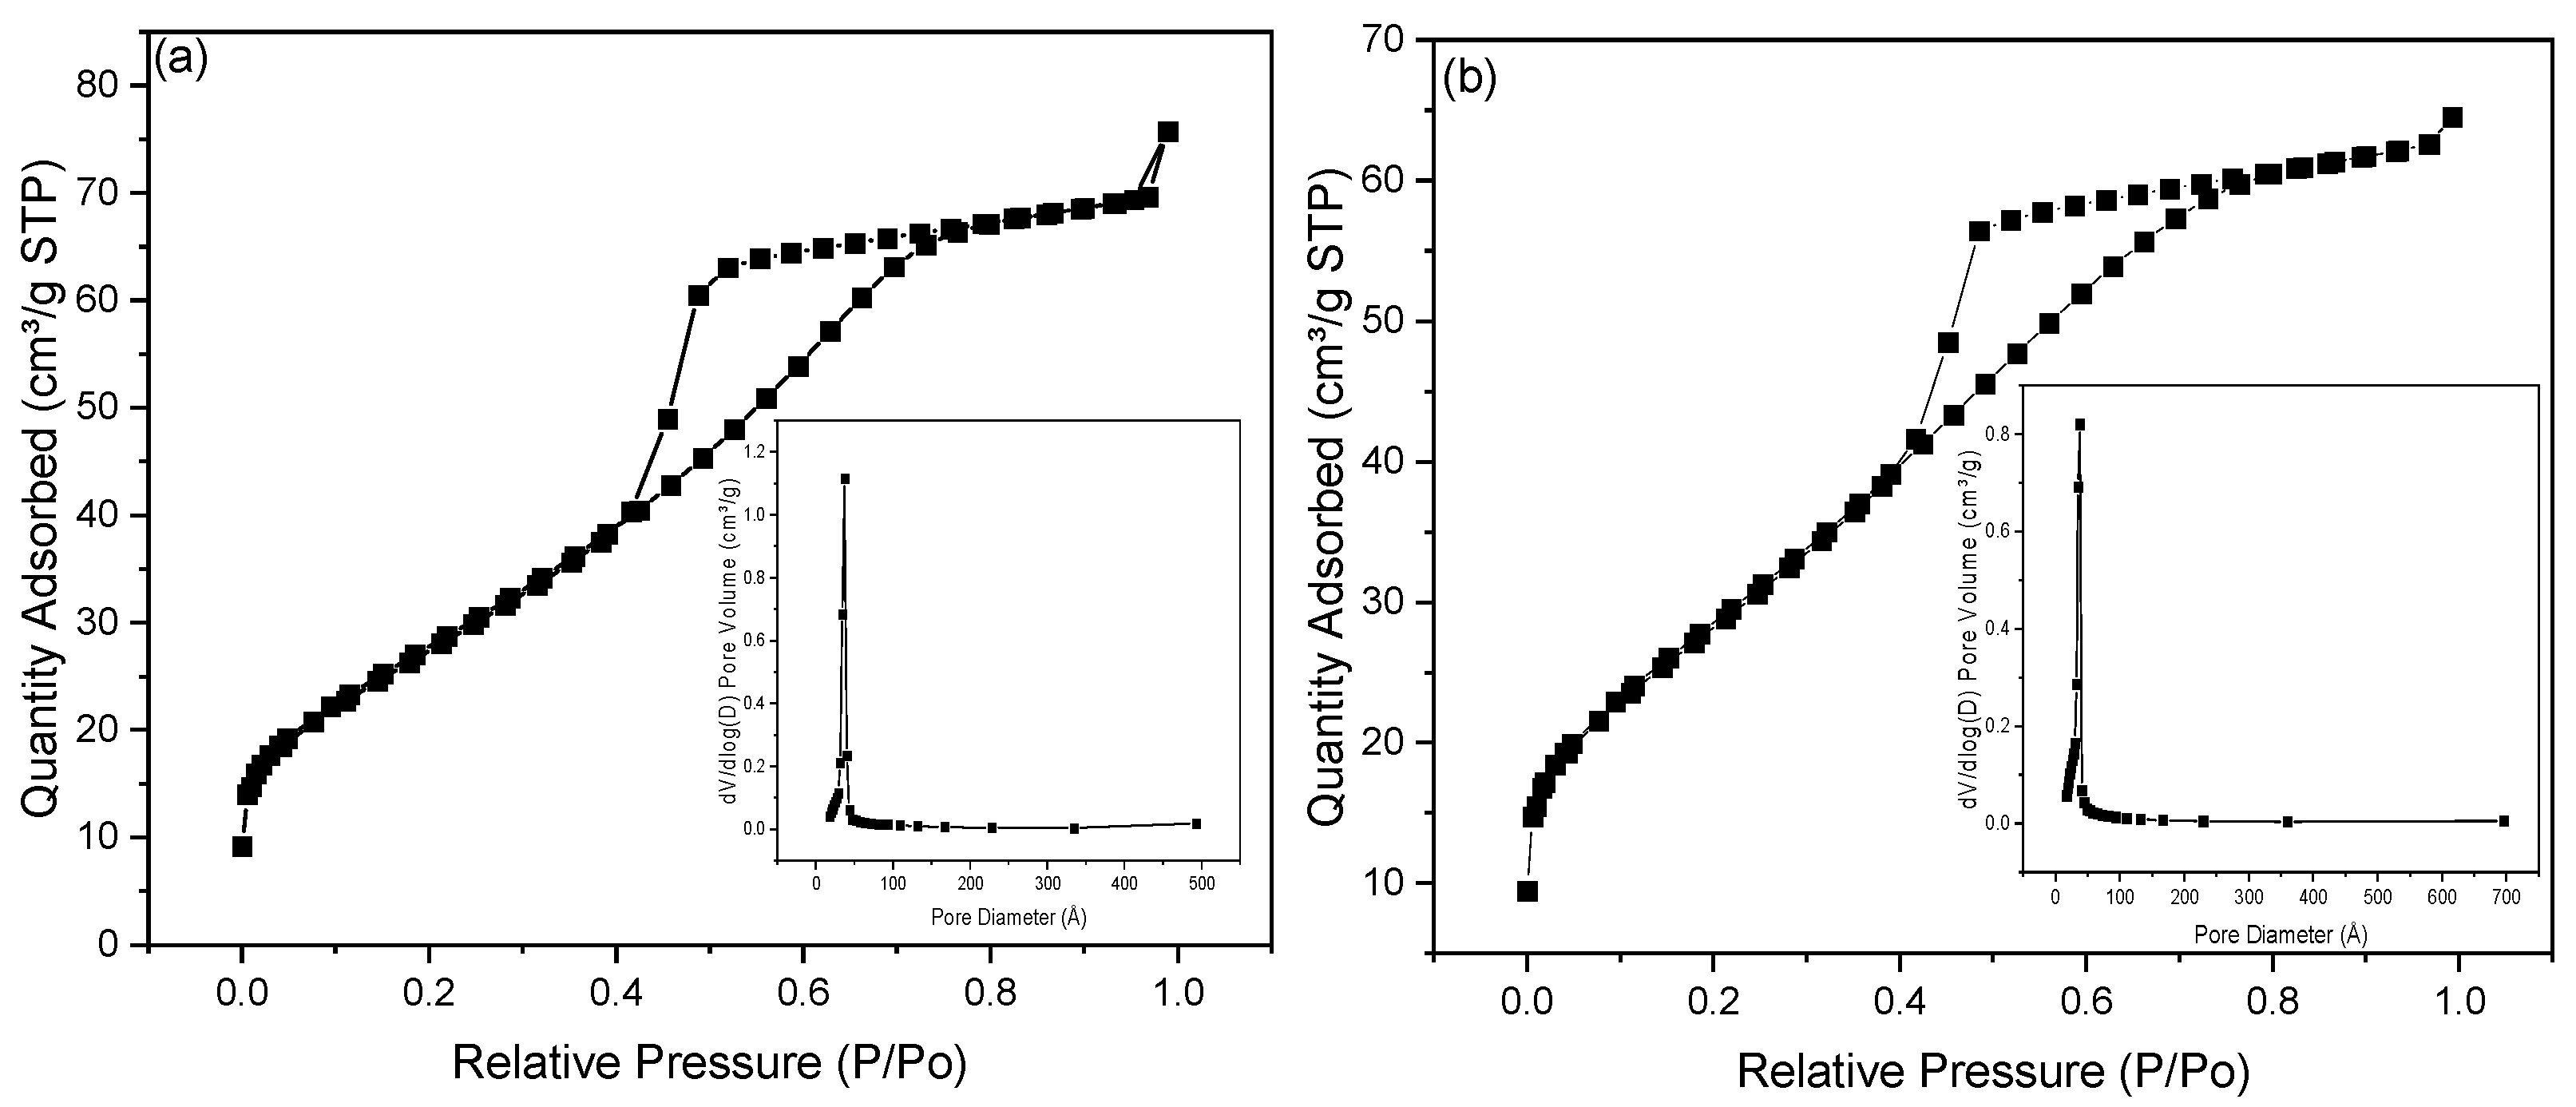
The nitrogen adsorption–desorption curves and pore size distributions of SSA-600 and SSA-RF-600 are shown in Figure 4. As can be seen in Figure 4, according to the classification of adsorption–desorption isotherms by IUPAC, the nitrogen adsorption–desorption curves of SSA-600 and SSA-RF-600 were classical type IV adsorption–desorption isotherms, with an obvious saturation plateau. Additionally, H2 hysteresis loops were formed in all of the adsorption–desorption curves, and the adsorption–desorption isotherms had noticeable jump between the relative pressure P/P0 = 0.4~0.5, indicating that the pore size distribution of the materials was relatively uniform [28]. Apart from this, the pore diameters of SSA-600 and SSA-RF-600 were 3.82 nm and 3.42 nm, respectively, which indicated the existence of a 2~50 nm mesoporous pore structure in the materials (see the insets of Figure 4a,b). The pore structure parameters of the two catalysts are shown in Table 3, the specific surface areas of SSA-600 and SSA-RF-600 were 102.10 m2/g and 104.44 m2/g, respectively, with corresponding pore sizes of 4.60 nm and 3.83 nm. On the other hand, the pore volume and pore size of SSA-600 were both relatively larger, which may be owing to the partial evolution of micropores into mesopores during the high-temperature calcination (>400 °C) [29]. The results showed that the specific surface area of the catalyst prepared by RF plasma modification was enlarged, which provided more active sites and was more conductive to the formation of superacid structure, hence improving the acidity as well as the activity of the catalyst and reducing the pore collapse caused by high-temperature calcination.
The Py-IR spectra of the catalyst are shown in Figure 5. As can be summarized, the bands at 1450 cm−1, 1590 cm−1, and 1620 cm−1 represent Lewis acid (LA) sites, the bands at 1545 cm−1 and 1635 cm−1 indicate Brönsted (BA) sites [30,31], and the attribution of the band around 1480 cm−1 is superimposed bands of Brönsted acid sites and Lewis acid sites [32]. The acid densities of the two catalysts are summarized in Table 4. The Brönsted acid and Lewis acid densities of SSA-600 were 36.61 μmol/g and 92.89 μmol/g, respectively, while the Brönsted acid and Lewis acid densities of SSA-RF-600 were 43.18 μmol/g and 99.68 μmol/g, respectively. The above results suggested that the Brönsted acid and Lewis acid densities, as well as the total amount of the catalyst, could be increased by the RF plasma modification.

2.5. NH3-TPD

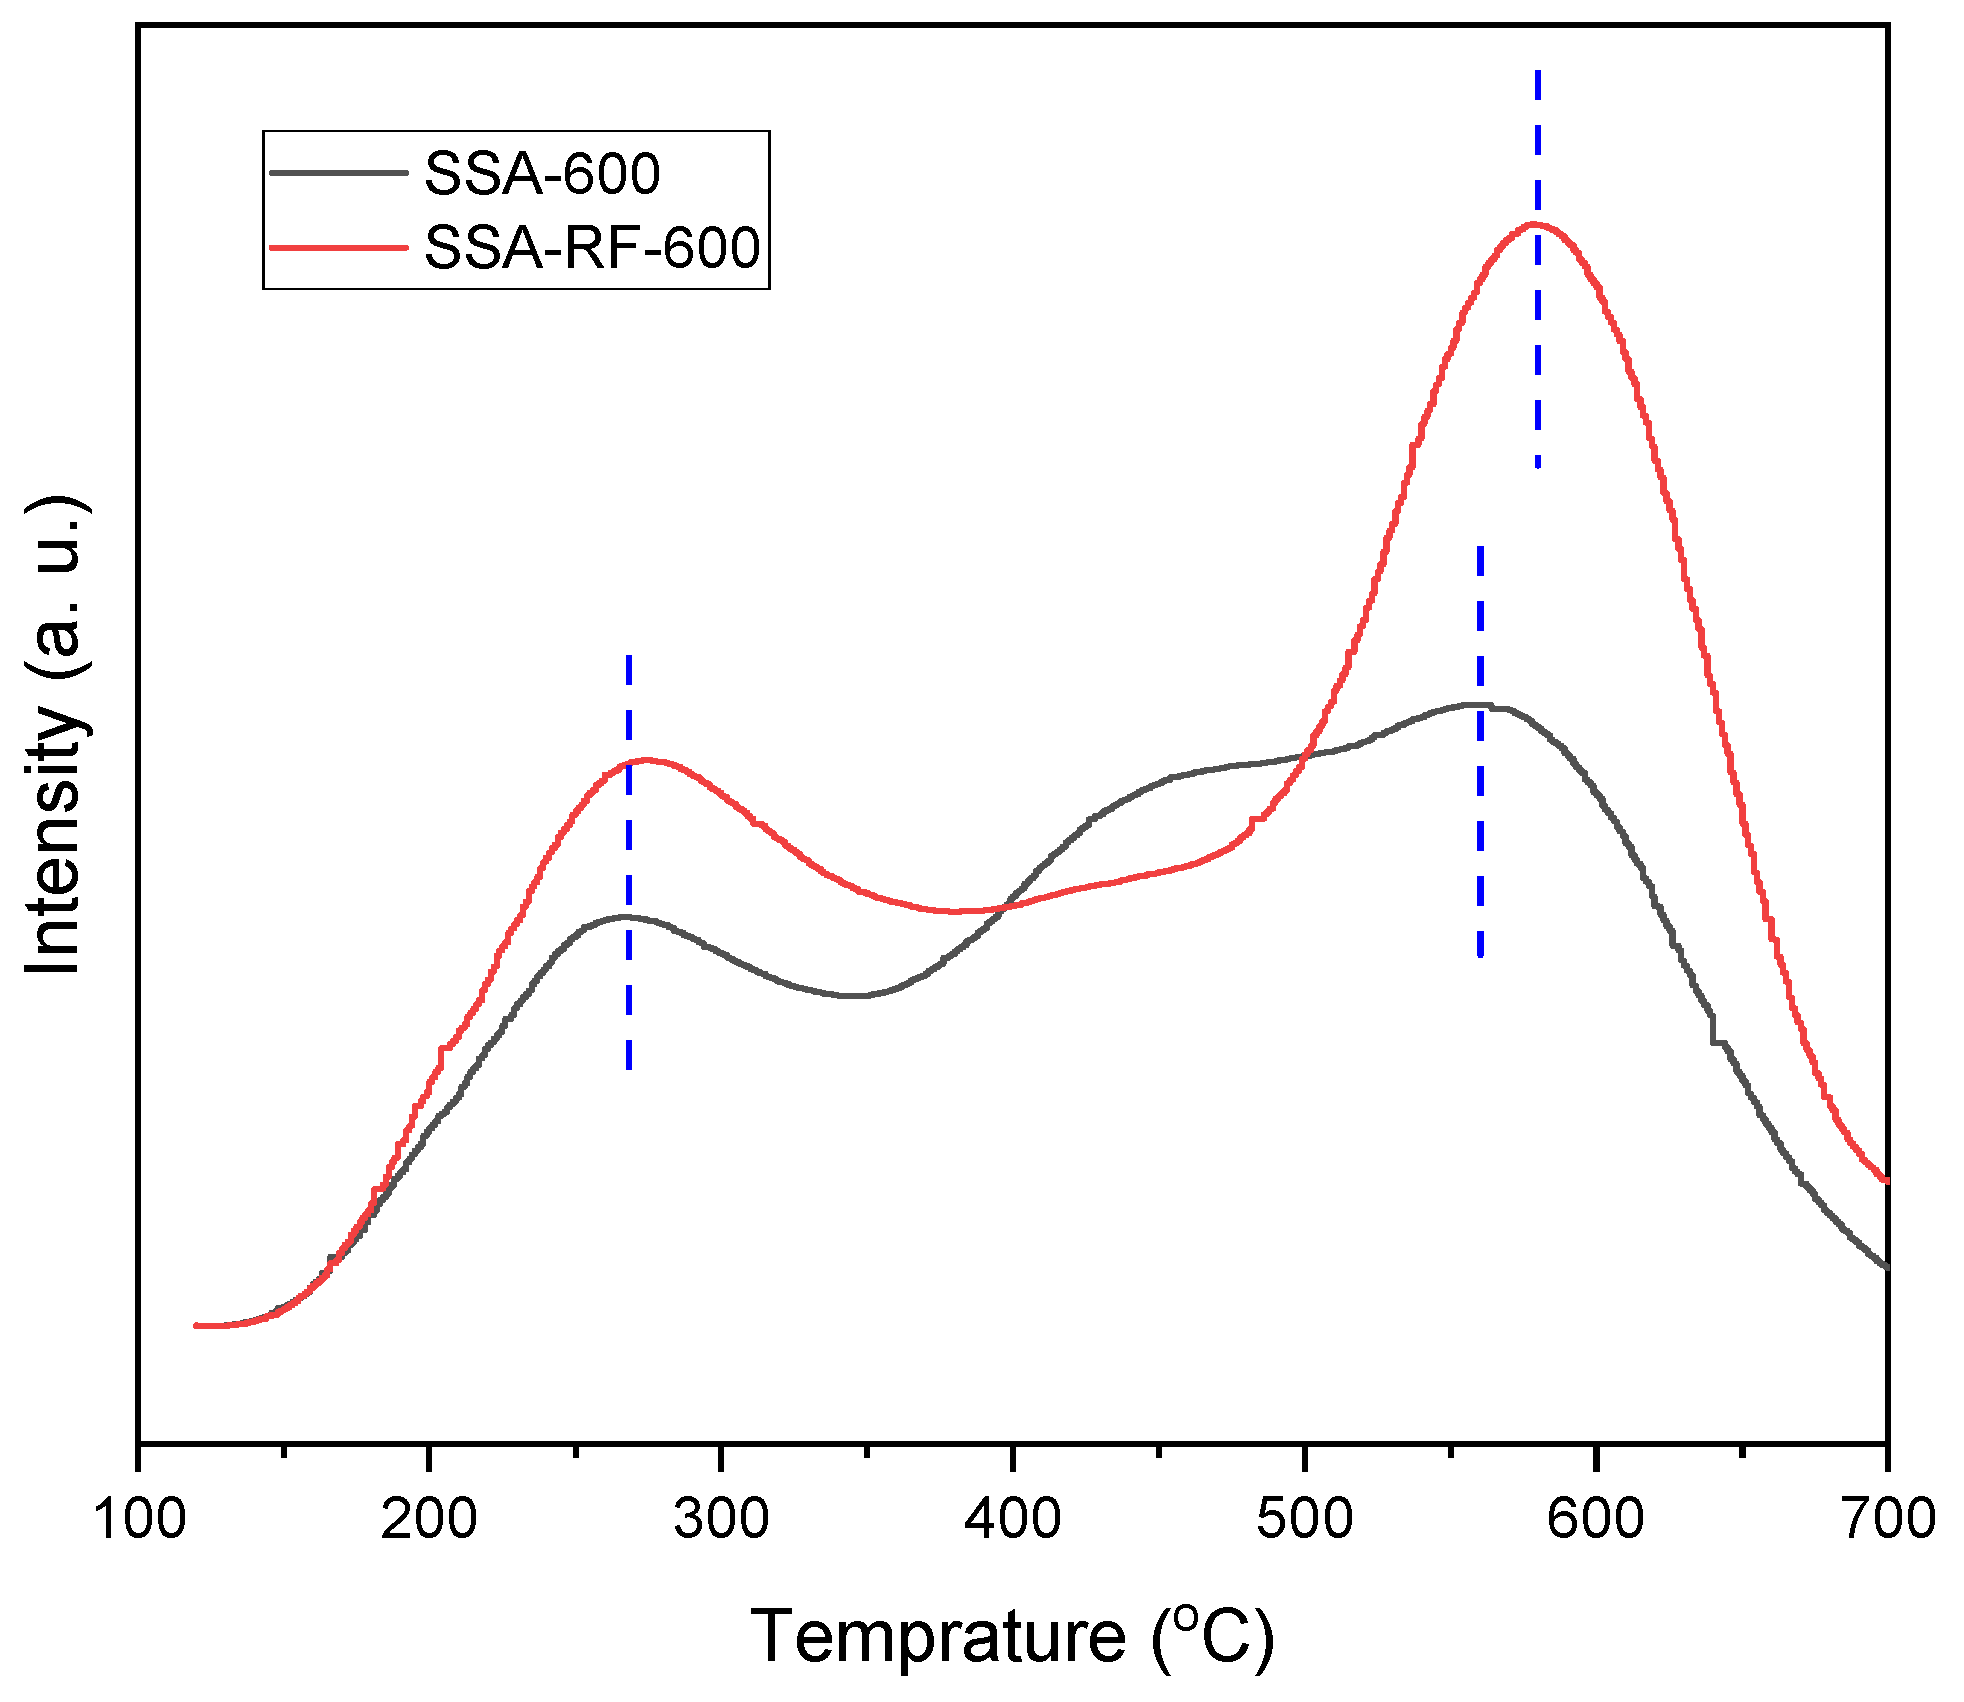
The NH3-TPD files of the catalyst are exhibited in Figure 6. As can be obtained from Figure 6, both SSA-600 and SSA-RF-600 contained two NH3 desorption peaks, of which the desorption peak at around 250 °C was associated with the weak acid center of the catalyst and the desorption peak at around 550 °C was indexed to the strong acid center of the catalyst [33,34]. By comparing the intensities of the NH3 desorption peaks of the two catalysts, the desorption peak of strong acid center over SSA-RF-600 was moved toward higher temperatures (from 550 °C to 580 °C), and it was elucidated that the acid strength of SSA-RF-600 modified by RF plasma was enhanced significantly, which was consistent with the acidity analyzed in the Py-IR spectrum, indicating that the RF plasma modification could increase the amount of acid sites and enhance the acidity of the catalyst likewise.

2.6. XPS

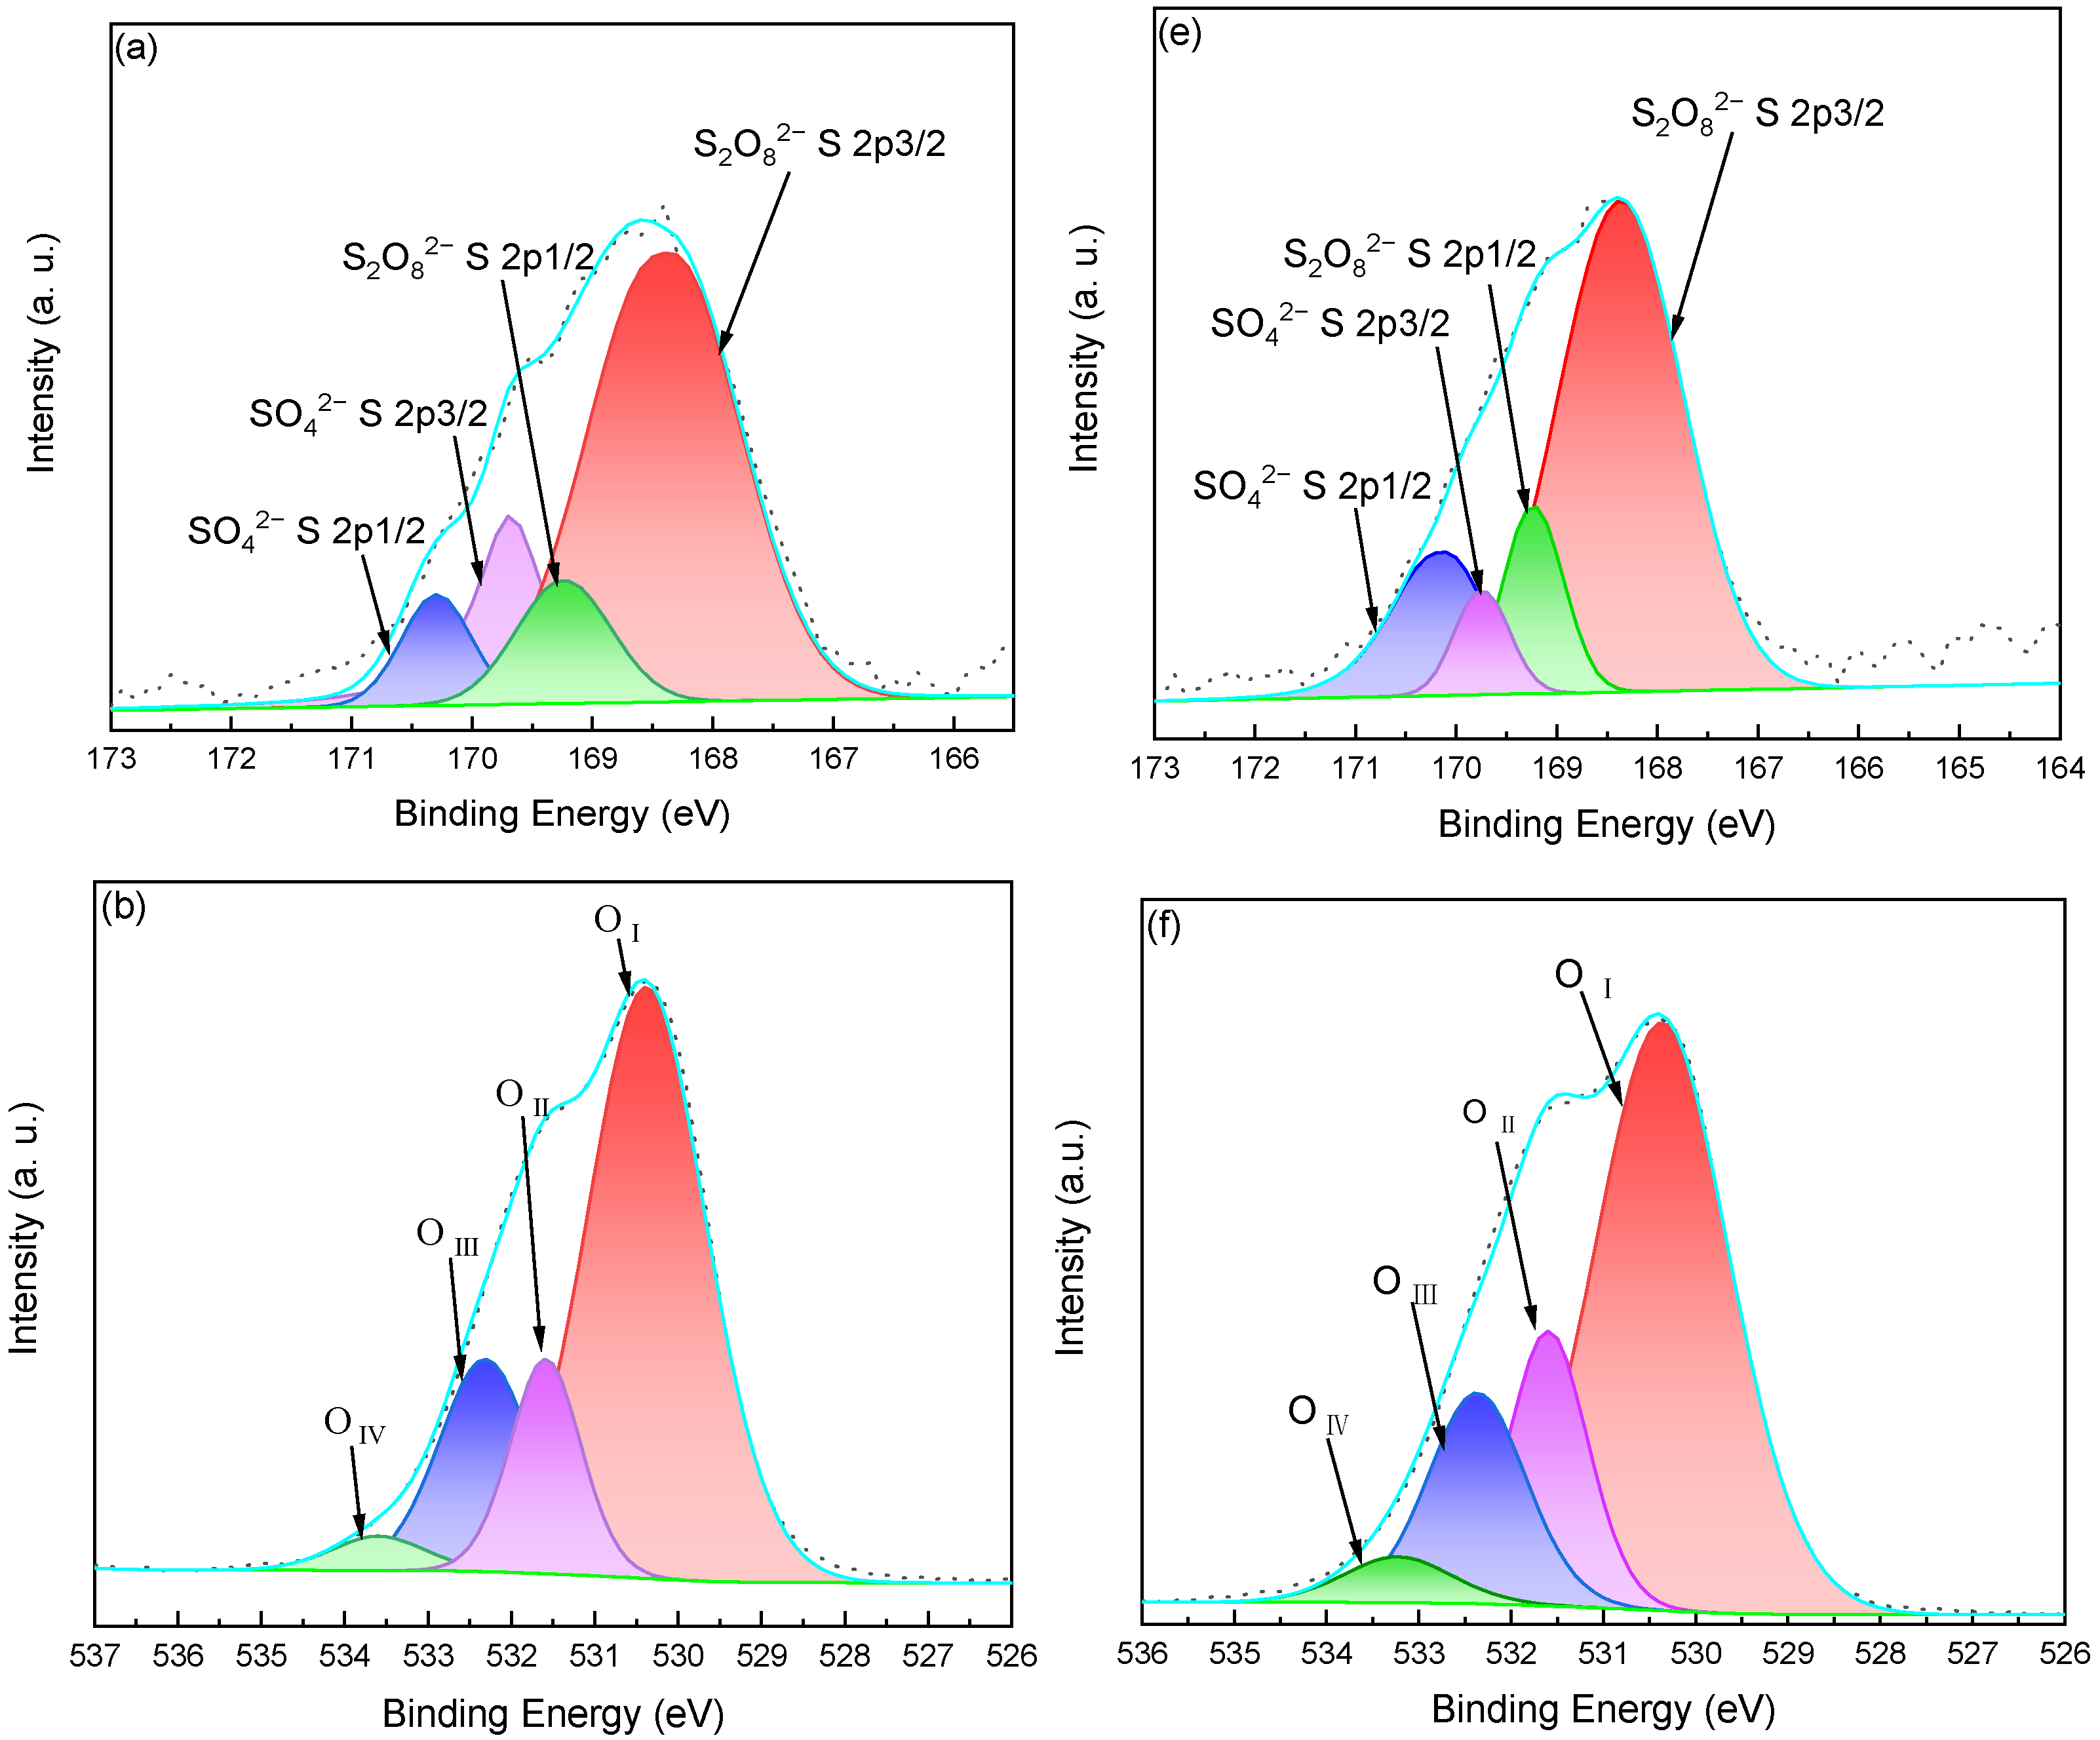
The XPS spectra of SSA-600 and SSA-RF-600 were fitted in Figure 7. In Figure 7a, for the S 2p XPS spectra of SSA-600, the binding energy peaks at around ~170.3 eV and ~169.7 eV were assigned to S 2p1/2 and S 2p3/2 of  S O 4 2  species [35], along with S 2p1/2 and S 2p3/2 of  S 2 O 8 2  species corresponding to ~169.3 eV and ~168.4 eV [36], implying that the surface sulfur component was composed of  S O 4 2  and  S 2 O 8 2 . Consequently,  S 2 O 8 2 , a strong oxidizing agent, was reduced to  S O 4 2  during the calcination process ( S 2 O 8 2  + 2e → 2 S O 4 2 , Eφ = 2.01 V) [37]. Comparatively, the binding energy peaks corresponding to S 2p1/2 and S 2p3/2 of  S O 4 2  species over SSA-RF-600 were ~170.2 eV and ~169.7 eV, and the corresponding S 2p1/2 and S 2p3/2 of  S 2 O 8 2  species were ~169.2 eV and ~168.4 eV in Figure 7e. Comparatively, the binding energy peaks of S 2p1/2 affiliated with  S O 4 2  and  S 2 O 8 2  species over SSA-RF-600 were all decreased, proving that the sulfur received a charge and the electron-cloud density was increased. It was deduced that massive free electrons contained in RF plasma bombarded the catalyst surface, thereby increasing the electron-cloud density and enhancing the electron-withdrawing capability of the sulfur atom. This, in turn, led to the release of H from Sn-OH through the electron-withdrawing effect of the adjacent sulfur atom, which enhanced the strength of Brönsted acid.
The O1s peak of SSA-600 is drawn in Figure 7b, which deconvoluted into four near-Gaussian sub-peaks at 532.6, 531.7, 531.2, and 530.1 eV, respectively. The binding energy peak at 530.1 eV (OI), the main portion (percentage of 64.9%), was identified as the oxide of SnO2 [38]; the binding energy peak at 531.2 eV was associated with oxygen vacancies of lattice oxygen (OVs, OII, occupying 13.6% of the surface oxygen content) [39], which can act as Lewis acid sites [40]; and the O 1s peak at 531.7 eV (OIII, occupying 18.2%) was probably related to -OH groups on the catalyst surface [41]. The position at 532.6 eV (O, percentage of 3.2%) could be assigned to the presence of oxygen in Al2O3 [42]. Comparatively, the contents of OI, OII, OIII, and O were 62.9%, 16.4%, 17%, and 3.8% in Figure 7f, respectively. Notably, the content of OVs increased after the treatment, indicating that the Lewis acid content increased.
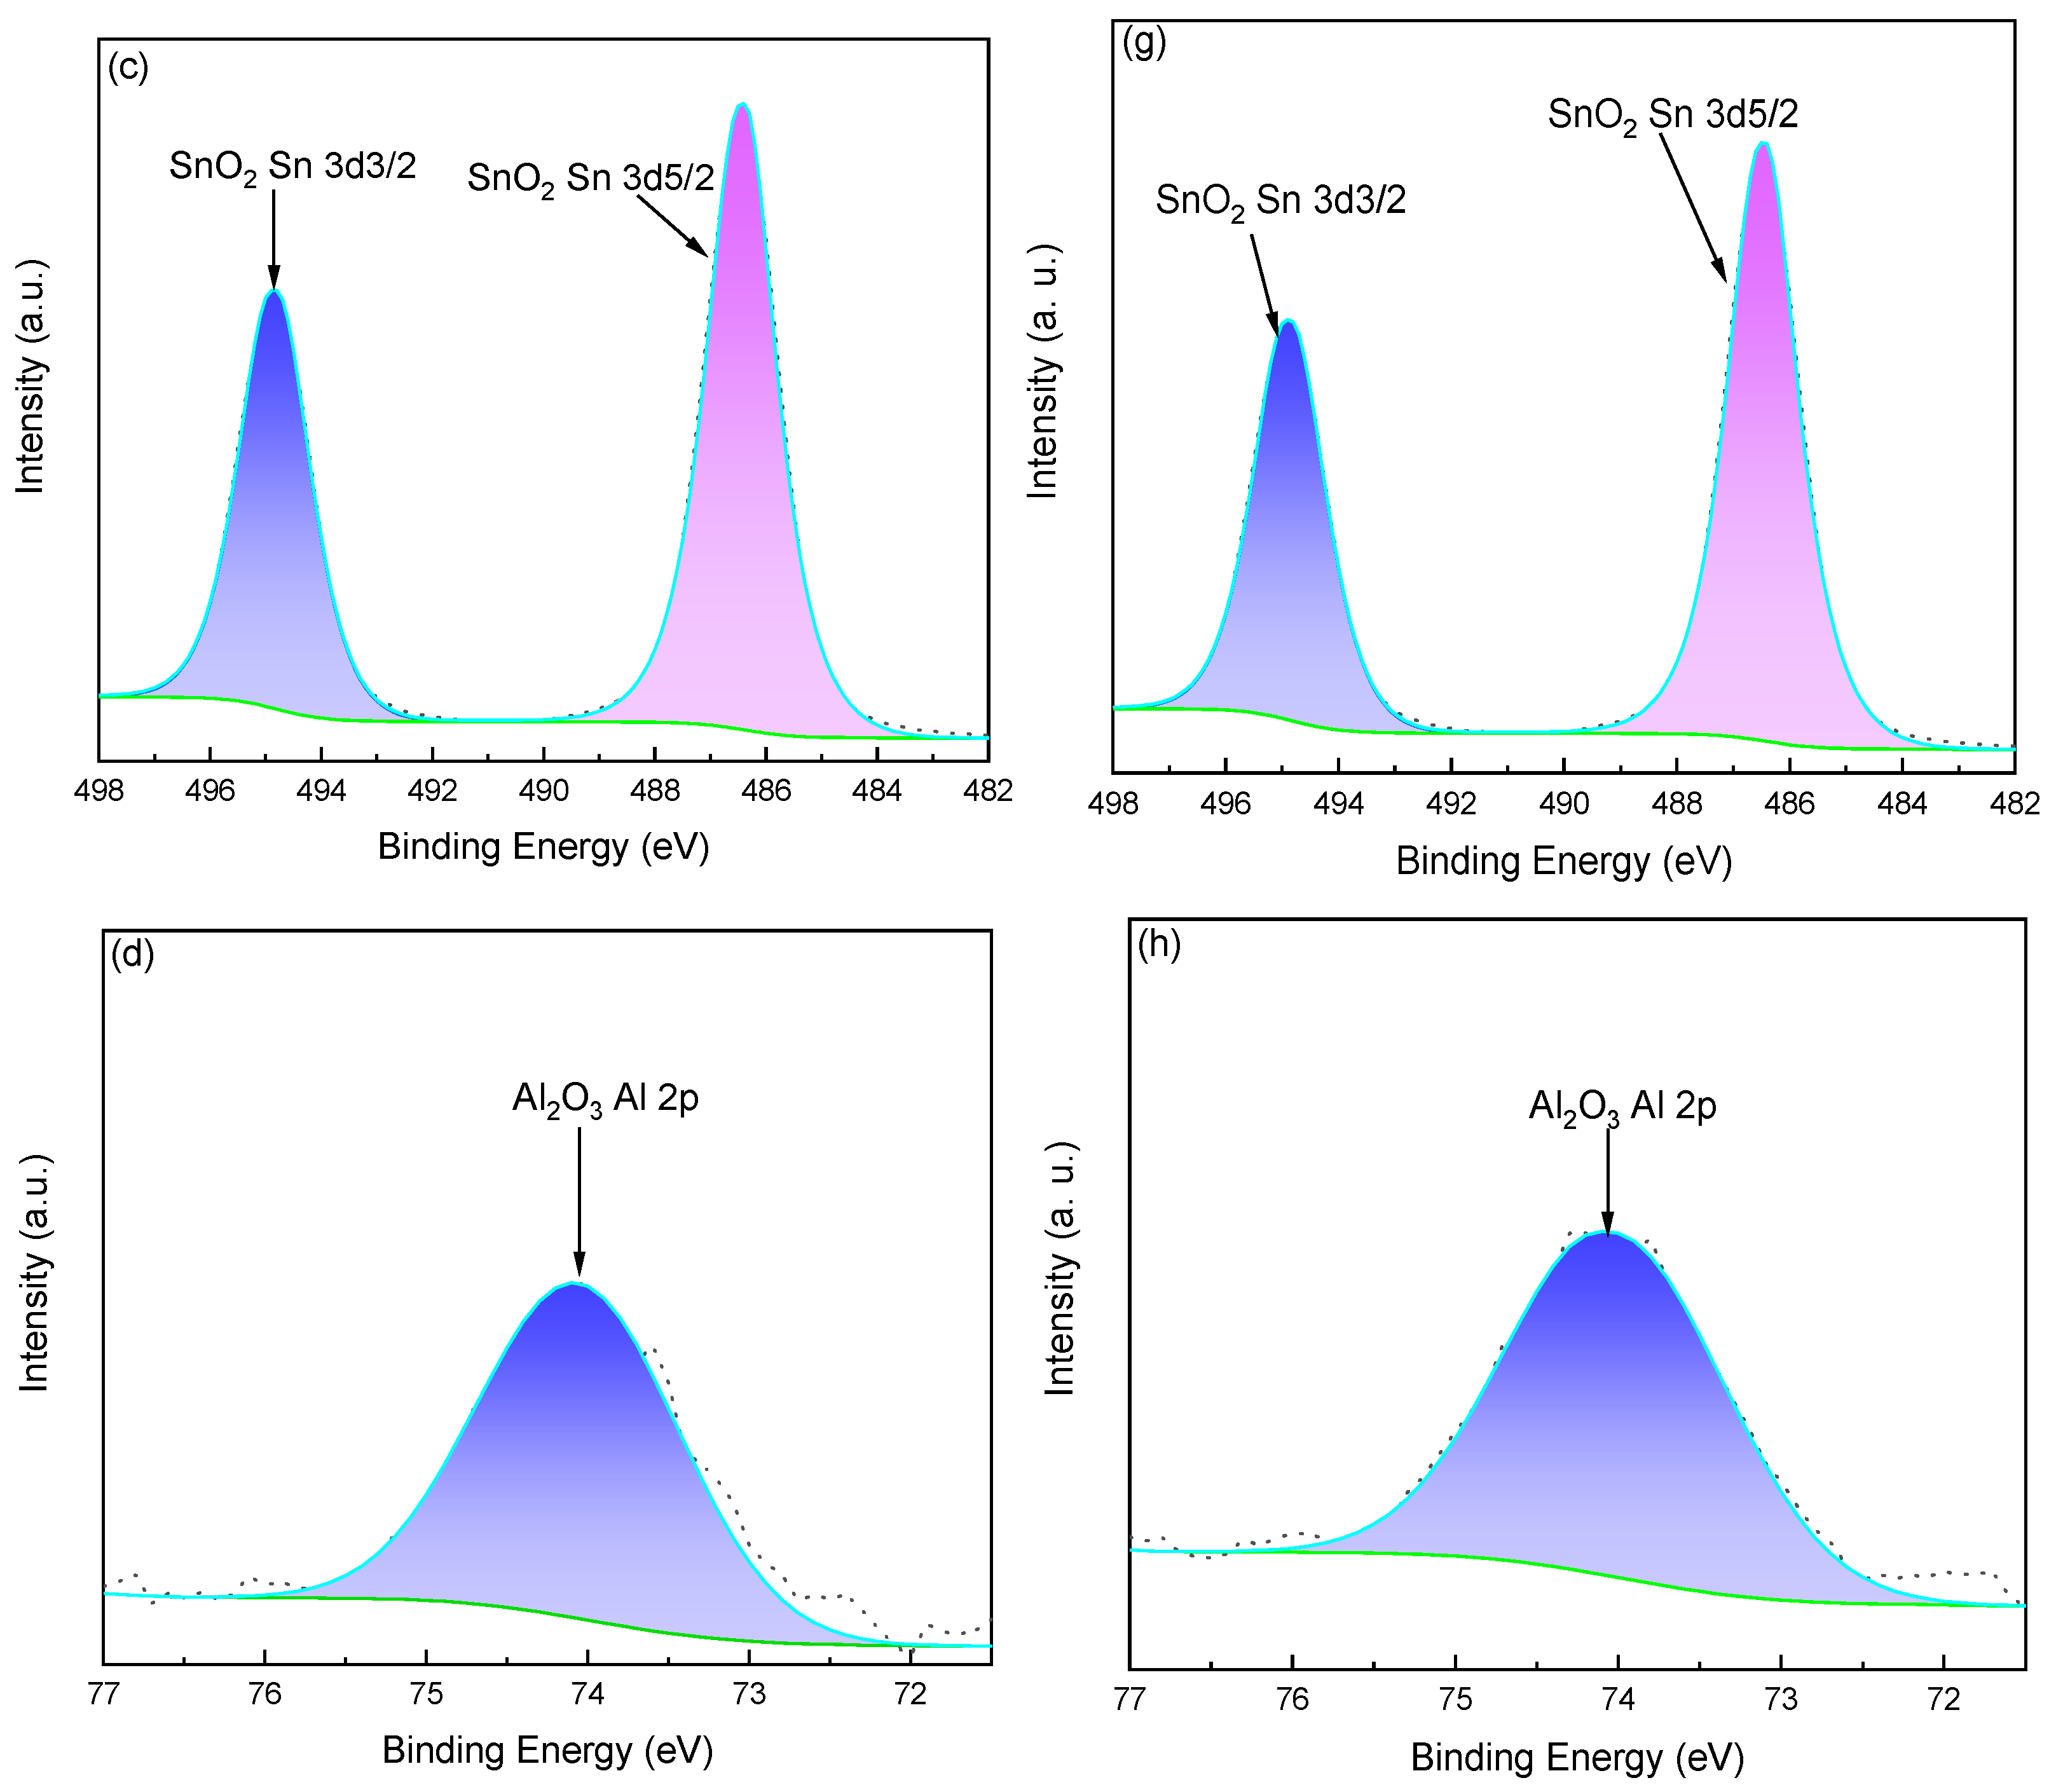
The effect of the RF plasma treatment on the Sn electronic state of the catalysts is shown in Figure 7c,g. The peaks centered at 494.8 eV and 486.4 eV were attributed to Sn 3d3/2 and Sn 3d5/2 of SnO2 in SSA-600 in Figure 7c [43], while the Sn 3d3/2 and Sn 3d5/2 of SnO2 contained in SSA-RF-600 were located at 494.9 eV and 486.5 eV in Figure 7g. All of the binding energy peaks of Sn were increased, confirming that Sn lost its charge while the surrounding electron-cloud density decreased. The reason for this phenomenon was the electron-withdrawing capability of  S O 4 2  and  S 2 O 8 2  species causing a shift in the electron-cloud around Sn species toward the O atom, and this capability was enhanced by RF plasma.
In the case of Al 2p, the peaks of SSA-600 and SSA-RF-600 were fitted in Figure 7d, h, respectively, and 74.1 eV represents the Al 2p of Al2O3 contained in SSA-600 and SSA-RF-600 [44]. The binding energy peak of Al remained, certifying that the external RF plasma field exerted little influence on the trace amounts of Al2O3.
To summarize the results of the XPS analysis, the RF plasma treatment can facilitate the electronic redistribution or intensify the electron-withdrawing capability of  S O 4 2 / S 2 O 8 2  and oxygen vacancy content over SnO2, causing an increase in the Brönsted and Lewis acidity of the catalyst.

2.7. FT-IR

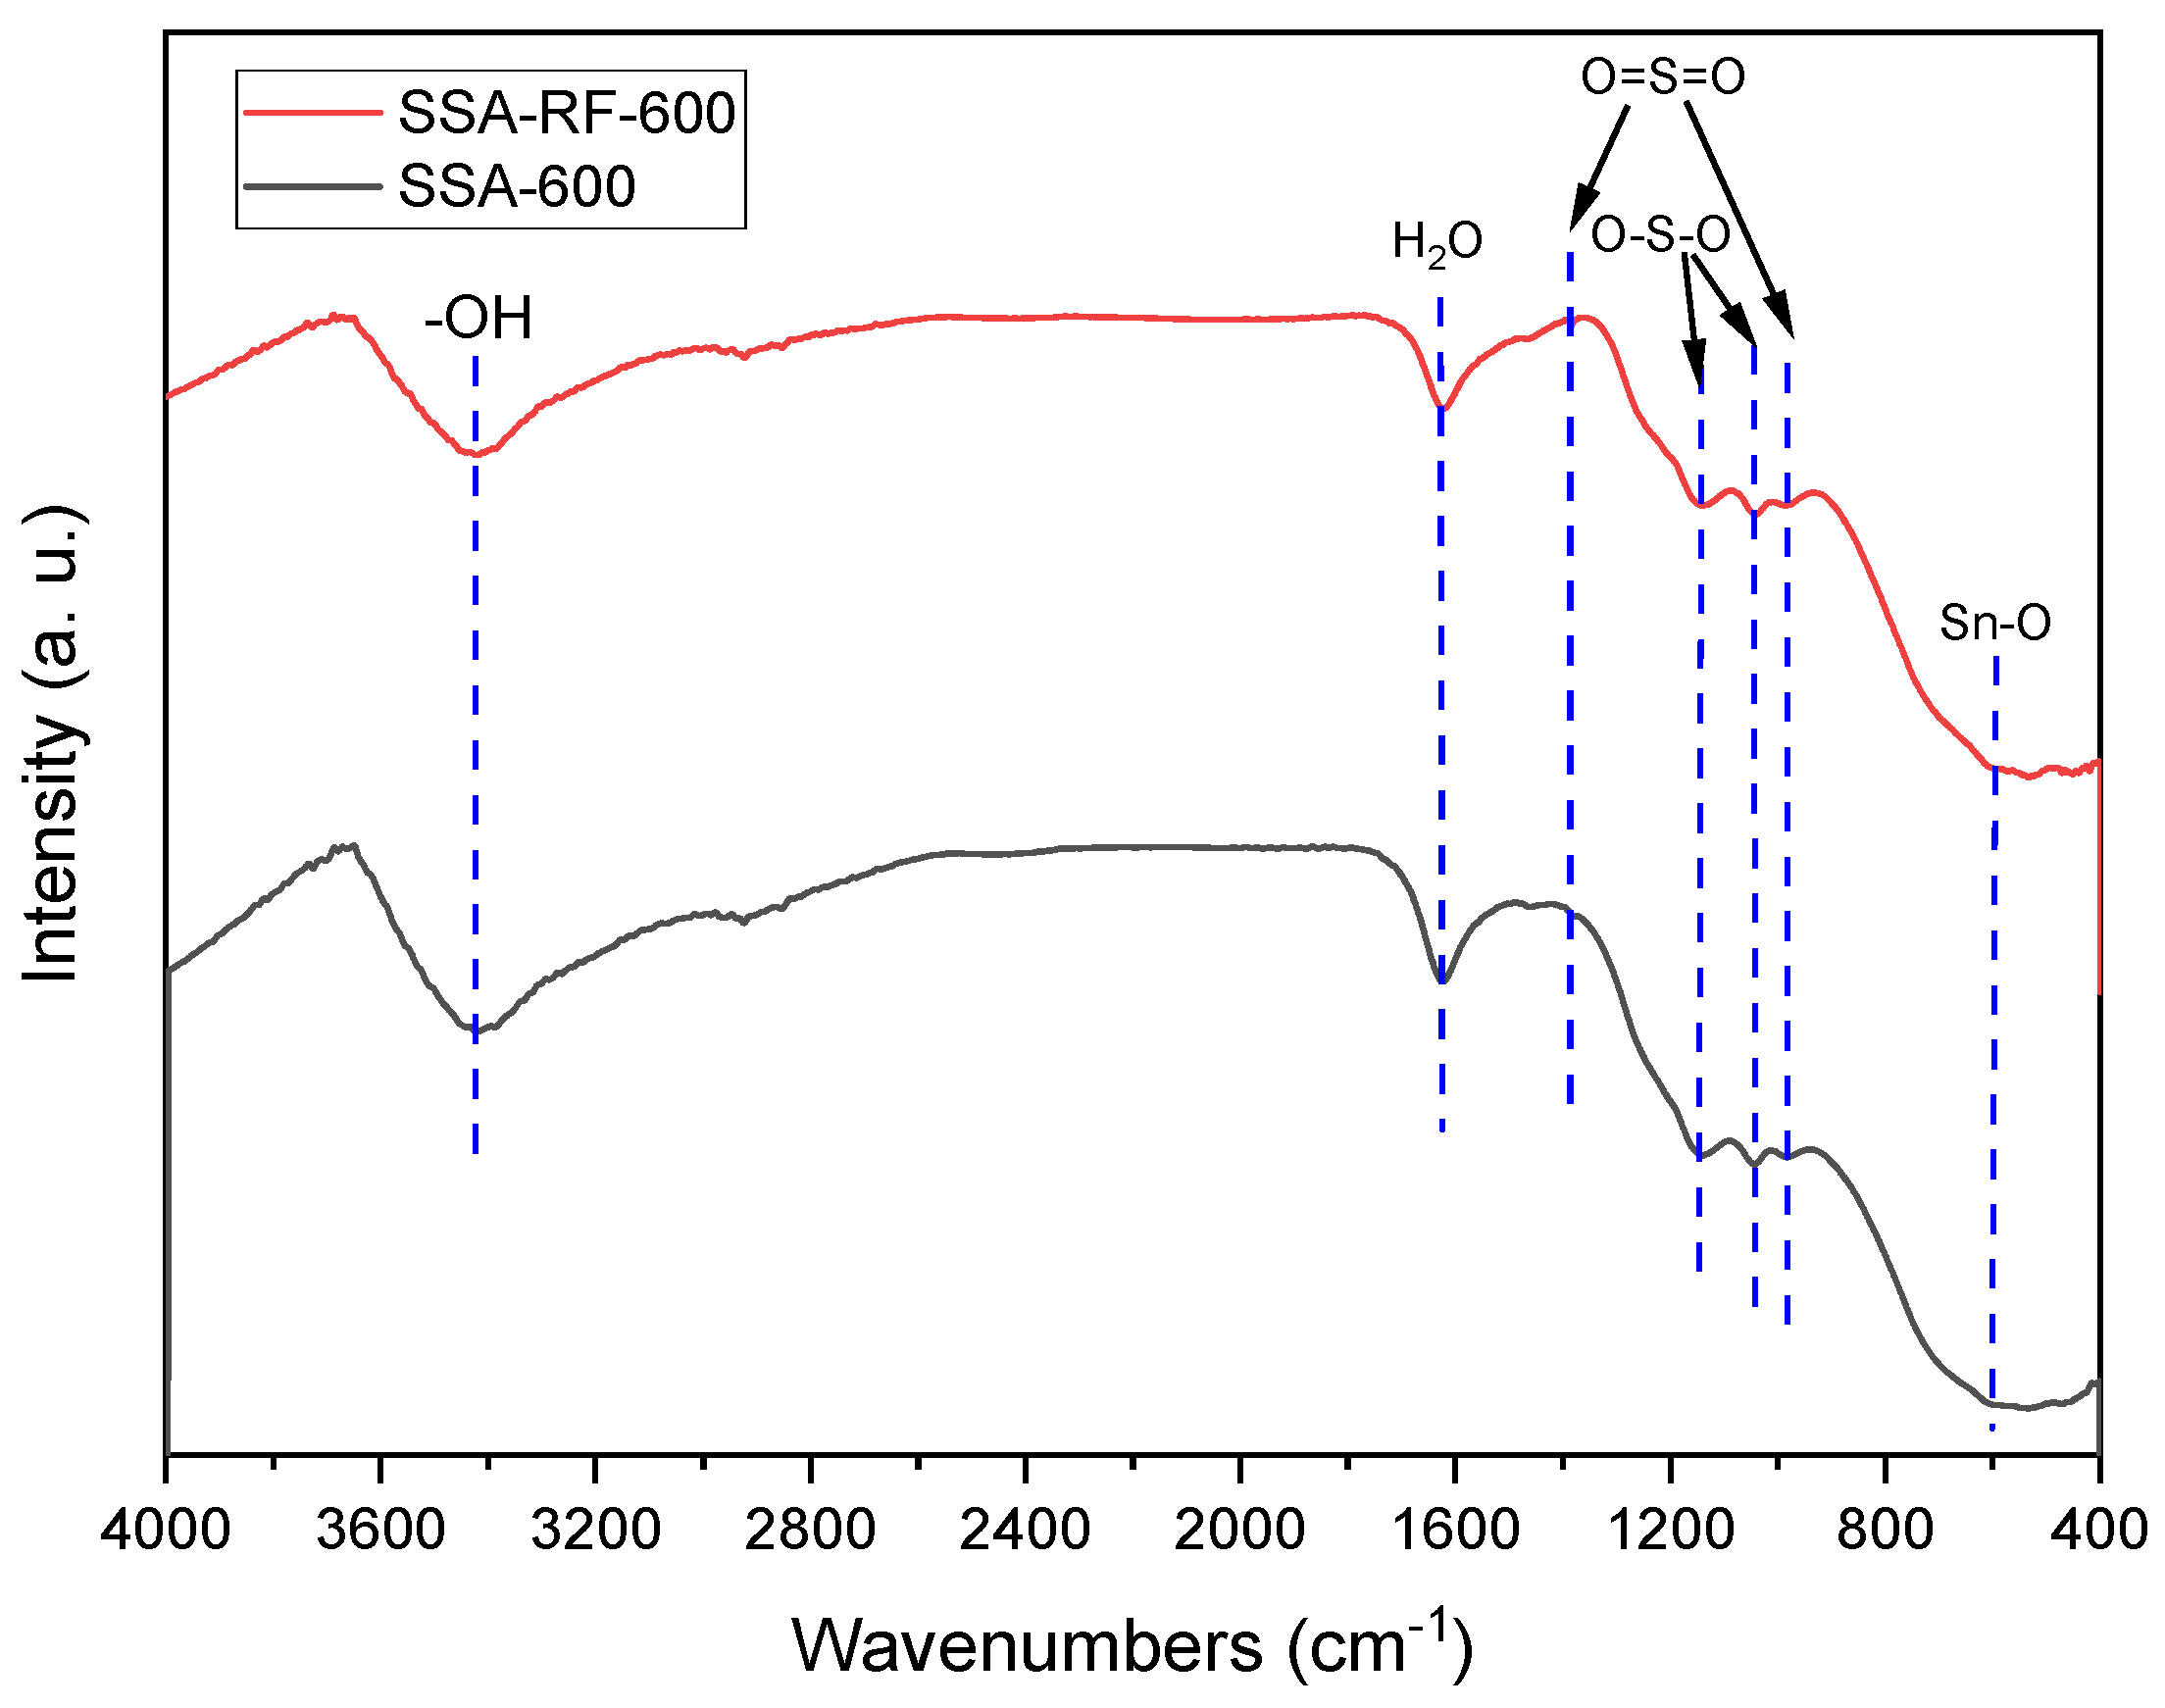
The FT-IR spectra of the catalysts were analyzed to investigate the structural composition of the catalysts in Figure 8. The absorption peak at ~3420 cm−1 denotes the stretching -OH groups vibration and ~1620 cm−1 is ascribed to the deformation vibrations of adsorbed H2O over the catalyst surface, respectively [45], and the absorption peak around 610 cm−1 is related to the vibration of Sn-O bond [46]. The vibration peaks in the 1400~900 cm−1 range are the characteristic peaks of  S 2 O 8 2 /MxOy, wherein the absorption peaks at 1050 cm−1 and 1140 cm−1 are assigned to the symmetrical stretching vibration of O-S-O coordinated to metal ions [47], and the absorption peaks at 1380 cm−1 and 985 cm−1 are ascribed to the antisymmetric stretching vibration peaks of O=S=O [48], displaying the obvious superacid characteristic peaks [47]. Generally,  S 2 O 8 2  is bound to metal ions over metal oxide surfaces with chelating or bridged double-coordination over  S 2 O 8 2 /MxOy-type solid superacids, with the antisymmetric stretching vibration of the bridged double-coordinated S=O (<1200 cm−1) and the antisymmetric stretching vibration of the chelating double-coordinated S=O (>1200 cm−1) [49]. Here, S=O owns a strong electron-withdrawing induction effect, which shifts the electrons of Sn4+ to the O atom in the bridged double-coordination structure, thereby enhancing the Lewis acidity and prompting it to exhibit the characteristics of a superacid. The results implied that  S O 4 2  and  S 2 O 8 2  species were loaded over the catalysts efficiently with chelating and bridged double-coordination forms, also denoting that the RF plasma modification did not transform the coordination form between  S O 4 2  and  S 2 O 8 2  species and Sn.

2.8. Mechanism of Acid Site Formation and Catalysis

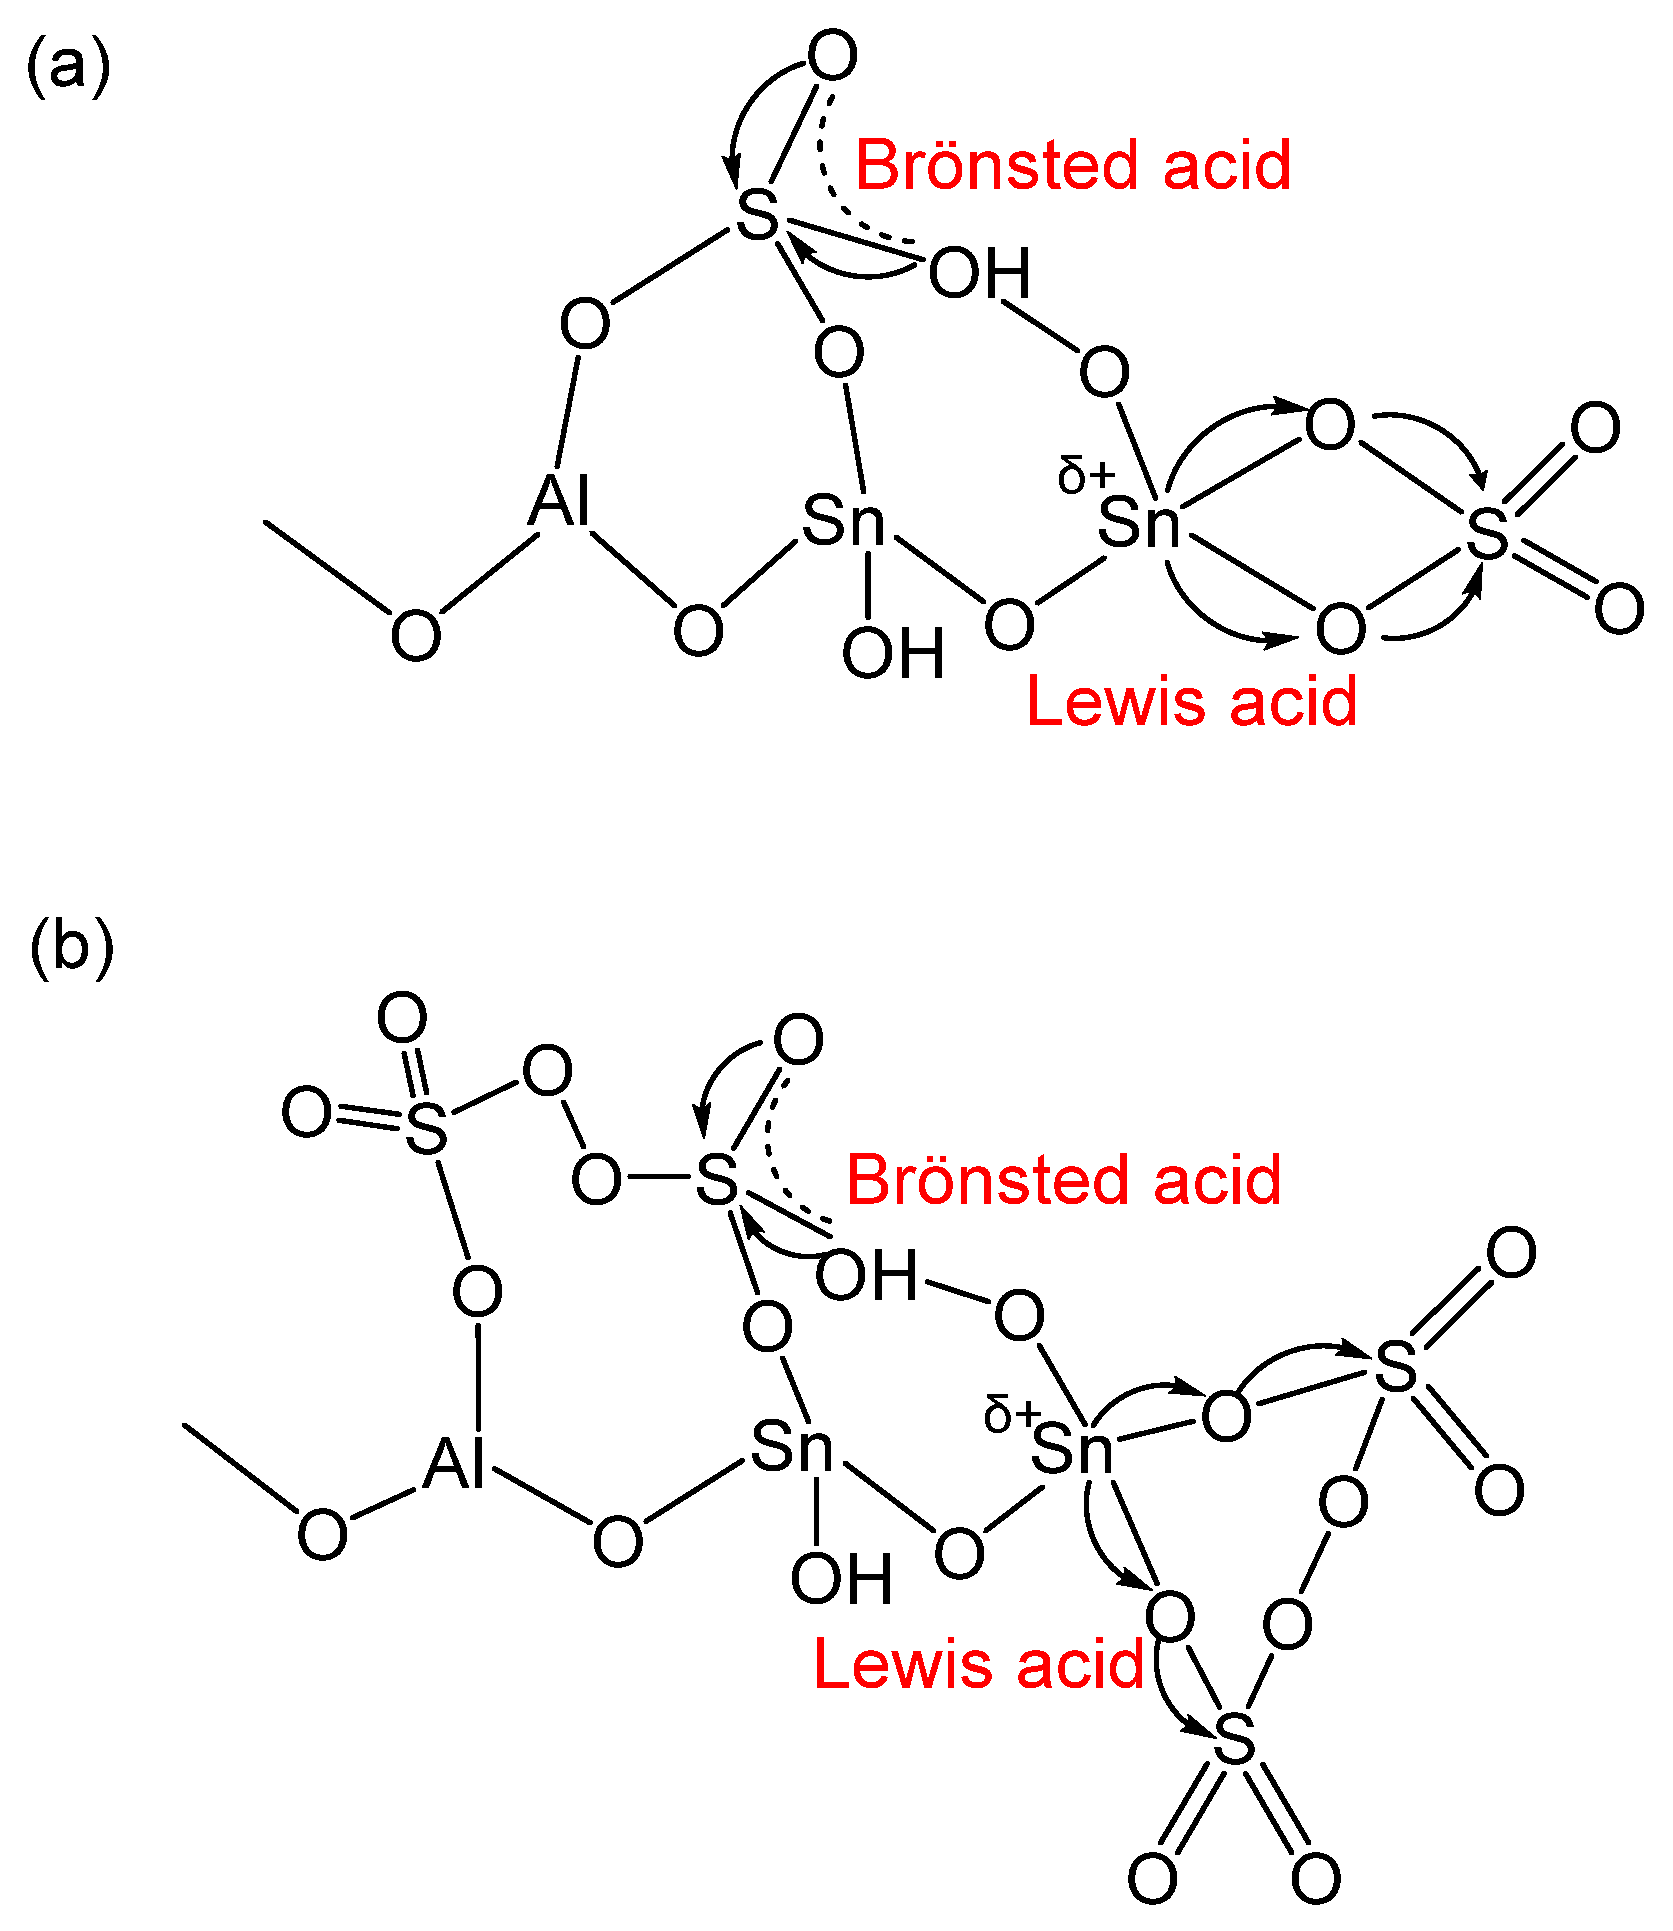
The mechanism of acid site and electron transfer is shown in Scheme 1. (Ⅰ) The unsaturated surface Snδ+ and oxygen vacancies acting as electron-pair acceptors were responsible for Lewis acid site formation [50], and the electron withdrawal by  S O 4 2 / S 2 O 8 2  ( S O 4 2  in Scheme 1a and  S 2 O 8 2  in Scheme 1b) caused the partial shift of the electron-cloud surrounding Snδ+, further leading to its increased Lewis acidity [51]. (Ⅱ) The acidic proton originated from the surface -OH, and then was released due to the electron-withdrawing inductive effect of S=O, hence resulting in a remarkable increase in Brönsted acidity [52,53]. It is reported that the steric effect and amphoteric dissociation of α-aromatic amino acids trigger the rate-determining step of carbocation formation to decelerate, which weakened the esterification reaction efficiency [19]. Anyway, the reaction step was accelerated by the stronger electron-withdrawing capacity of SSA-RF-600.
Briefly, in LA catalysis, the coordination of active sites from Snδ+ to the Tyr carbonyl oxygen enhances electrophilicity at the carbonyl carbon, facilitating the nucleophilic attack of methanol to form esterification intermediates. In BA catalysis, -Sn-OH-mediated protonation of the carboxylic carbonyl oxygen activates the carbonyl carbon for methanol-mediated nucleophilic addition, generating a tetrahedral intermediate. Subsequent proton transfer from the methanol -OH to adjacent hydroxyl groups releases H2O, followed by tetrahedral intermediate collapse (eliminating H2O) and oxonium ion deprotonation to yield TyrOMe. Both pathways regulate carbonyl carbon reactivity via electronic modulation, yet diverge fundamentally in proton transfer mechanisms (coordination vs. Brønsted acid-mediated proton donation).

2.9. Catalytic Performance

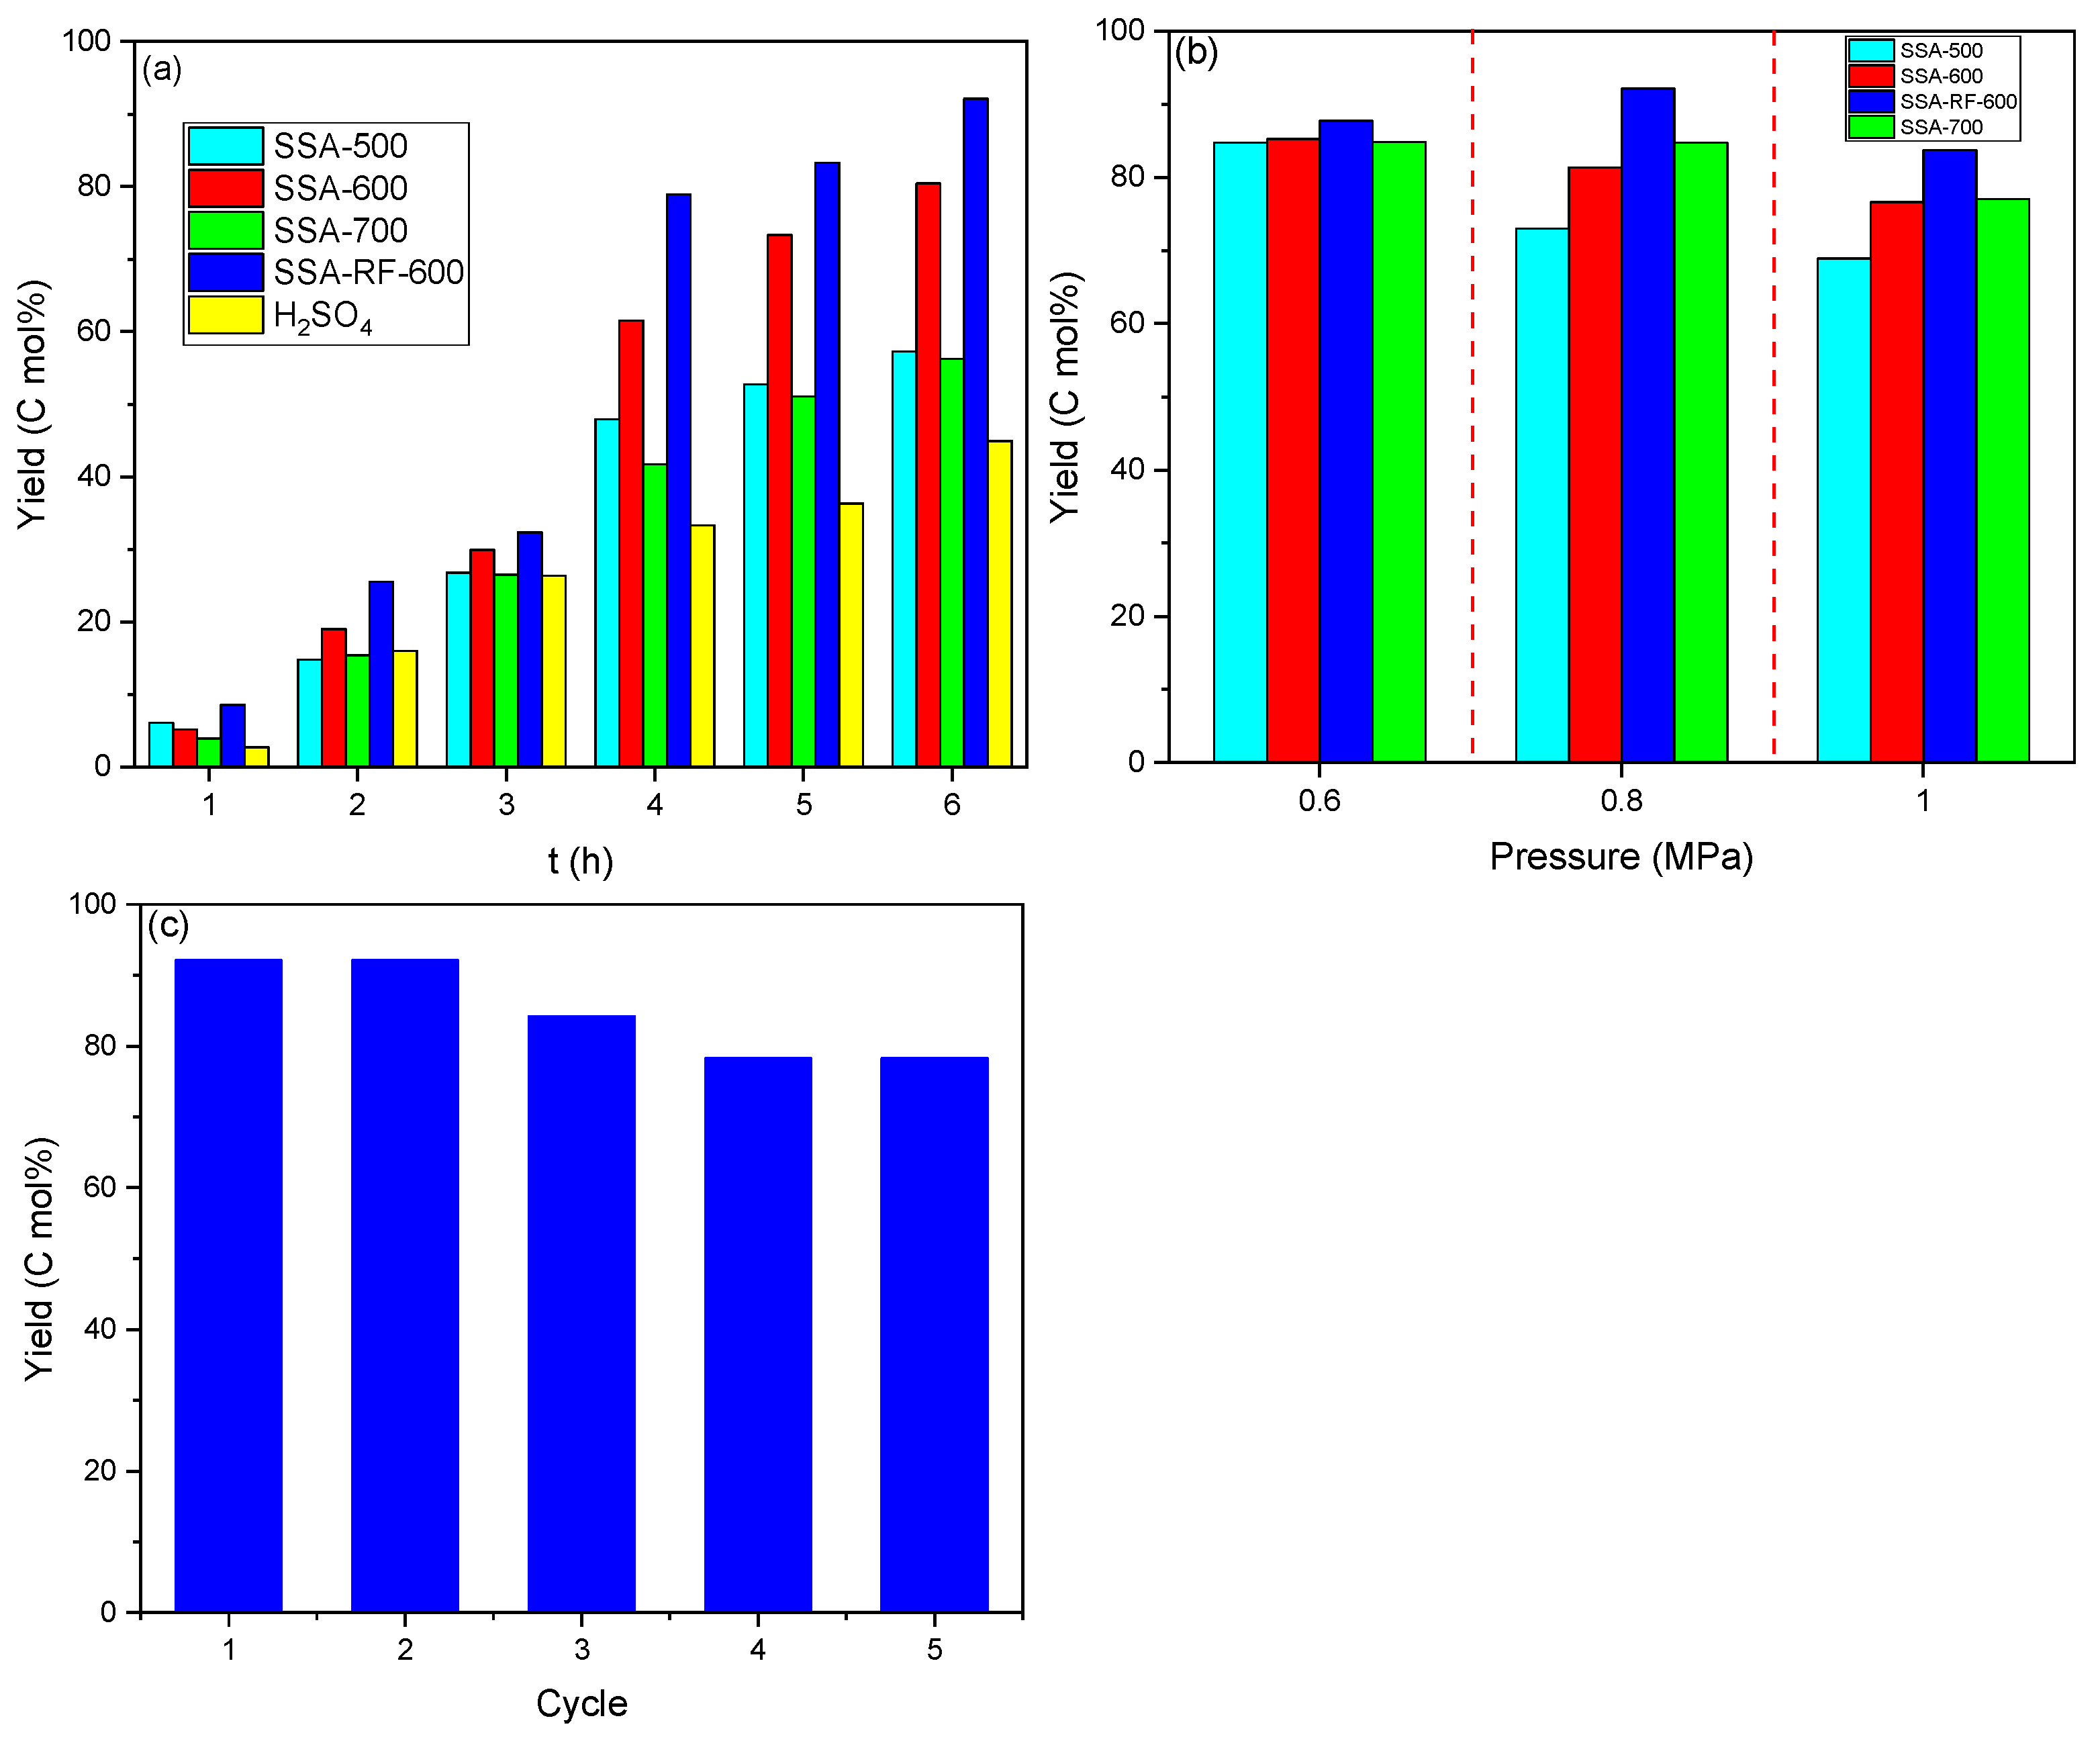
The effects of the all catalysts on the TyrOMe yield were investigated under the specific reaction conditions, with the results illustrated in Figure 9a. It was revealed that TyrOMe yields were elevated with the extension of the reaction time, and the catalytic effect of SSA-600 was obviously improved, with an esterification yield of 80.4% after a 6 h reaction. The above phenomenon can be explained by the fact that as the calcination temperature was relatively low (≤500 °C), the active components  S O 4 2 / S 2 O 8 2  and the carrier SnO2-Al2O3, just like SSA-500, did not form bulk metal oxide (M-O) bonds and a stable textural structure [54], and thereby the catalyst activity was maintained at a low level (with the maximum TyrOMe yield of 57.2% at 180 °C, 0.8 MPa and 6 h). However, when the calcination temperature was relatively higher (>600 °C), the catalyst particles of SSA-700 gradually grew, resulting in decreases in the specific surface area and the active sites; likewise, the elevated temperature also led to the loss of active components, destroying the pore structure of the superacid and reducing the catalyst activity (with the maximum TyrOMe yield of 56.2% at 1180 °C, 0.8 MPa and 6 h) [55,56].
However, SSA-RF-600 exhibited a dominant catalytic effect during all time periods, and the advantage was more obvious after 4 h, when the maximum yield of TyrOMe was 92.1% after a 6 h reaction (a 14.5% growth rate compared with the performance of SSA-600), which may due to the fact that SSA-RF-600 has finer particles, a larger specific surface area, and more (101) planes exposed, as corroborated by the fact that altering the size effect and crystal plane manipulation of the catalyst can affect the catalytic efficiency in many cases [57]. In contrast, the highest yield of TyrOMe was only 45.0% when catalyzed by concentrated H2SO4 under the same conditions, which further confirmed the excellent catalytic properties of SSA-RF-600. Likewise, the higher total acid amount was induced by the increased electron-withdrawing effect of sulfur and oxygen vacancies, and thus the catalyst activity was improved significantly for the above reasons.
In order to understand the effect of RF plasma on the mechanical strength of catalysts, we also tested the catalytic effects of the three types of catalysts at different pressures (0.6 MPa, 0.8 MPa, and 1 MPa) and 180 °C in 6 h reaction in Figure 9b. It was demonstrated that SSA-RF-600 just exhibited excellent resistance at the investigated pressure of 0.6 MPa, 0.8 MPa, and 1 MPa, and the esterification yield descended to 83.7% at 1 MPa, with a 9.1% degree of decline compared with that at 0.8 MPa.
Under the optimized conditions, a lifetime evaluation of the regenerated SSA-RF-600 catalyst was conducted through cycling stability tests. As depicted in Figure 9c, the TyrOMe yield was maintained at 78.3% after five successive catalytic cycles, retaining approximately 85% of the initial catalytic activity. This performance metric demonstrates the material’s notable resistance to deactivation, suggesting structural robustness and sustainable active site accessibility during repetitive reaction sequences. The attenuated activity decay rate (15% over five cycles) further confirms the catalyst’s enhanced anti-deactivation characteristics, which are likely attributable to its optimized regeneration protocol and stabilized active phase configuration.
The above catalytic conversion data indeed showed that the RF plasma-modified SSA-RF-600 can significantly improve its catalytic performance in tyrosine esterification, indicating that RF plasma technology was a relatively convenient material modification means to enhance the catalytic ability of SSA-RF-600.

3. Materials and Methods

3.1. Reagents

SnCl4·5H2O (99.995%) and sodium dodecylbenzene sulfonate (SDBS, purity 95%) were bought from Shanghai Aladdin Biochemical Technology Co., Ltd. (Shanghai, China). Tyrosine (Tyr, 99.0%) was purchased from J&K Technology Co., Ltd. (London, UK). CH3COONH4 (GR, ≥99.0%), NH3·H2O (AR, 25 wt.%), (NH4)2S2O8 (electrophoresis grade, >99.0%), ethanol (AR, 99.7%), methanol (AR, 99.5%), 2,4-dinitrofluorobenzene (2,4-DNFB, GC, 98.0%), benzene (AR, ≥99.5%), and TyrOMe (98%) were purchased from Shanghai Macklin Biochemical Co., Ltd. (Shanghai, China). 3-Nitrotoluene (3-NT, GC, 99.0%) and Al(NO3)3·9H2O (99.5%) were obtained from Shanghai Xianding Biotechnology Co., Ltd. (Shanghai, China). Concentrated H2SO4 (AR, purity 98%) was bought from Tianjin Beichen District Fangzheng Reagent Factory (Tianjin, China).

3.2. Catalyst Preparation

Firstly, a certain amount of SnCl4·5H2O and Al(NO3)3·9H2O were accurately weighed according to n(Sn):n(Al) = 9:1, and dissolved in deionized water to prepare the SnCl4 solution (5 wt.%). Secondly, SDBS was added based on a mass ratio of SDBS to SnCl4 solution of 1:500. Thirdly, the NH3·H2O solution was added dropwise with strong stirring until the solution pH = 9, and stirred for 0.5 h. Subsequently, the precipitate was aged at 0 °C for 24 h, centrifuged (TG16-WS, Hunan Xiangyi Laboratory Instrument Development Co., Ltd., Changsha, China, 10,000 r/min) with the CH3COONH4 solution (4 wt.%) for 8 min, and washed until the filtrate pH = 7. Then, the precipitate was washed twice with ethanol, and vacuum-dried at 110 °C (Shanghai Lichen Instrument Technology Co., Ltd., Shanghai, China) for 6 h. Finally, the precipitate was ground through a 60-mesh standard sieve to obtain the precursor powder.
A part of the precursor powder was dispersed (Soncis VXC800, Sonics & Materials, Newtown, CT, USA) and impregnated with a 1.0 mol/L (NH4)2S2O8 solution (15 mL/g) for 3 h, filtered and vacuum-dried at 110 °C, and calcined at 500 °C, 600 °C and 700 °C in a muffle furnace (GWM4-1200L7, Beijing Saiou Huachuang Technology Co., Ltd., Beijing, China) for 4 h to obtain the  S O 4 2 S 2 O 8 2 /SnO2-Al2O3 solid superacids, denoted as SSA-500, SSA-600 and SSA-700, respectively. The other part of the precursor powder was treated in the RF plasma generator (Shenzhen Arc 3D Technology Co., Ltd., Shenzhen, China, treatment conditions: power = 100 W, Ar flow rate = 500 mL/min, t = 0.5 h), followed by the same impregnation steps as described above, and finally calcined at 600 °C (with heating rate of 5 °C·min−1) in the muffle furnace for 4 h to obtain the RF-modified  S O 4 2 - S 2 O 8 2 /SnO2-Al2O3 solid superacid, labeled as SSA-RF-600.

3.3. Catalyst Characterization

The acidity of the samples was determined by the Hammett indicator method. Typically, the catalysts were heated at 200 °C (for 2 h) to remove the adsorbed water; 25 mg of samples, 25 mg of indicators (3-NT, 2,4-DNFB), and 0.25 mL of dried benzene were added to the test tubes; and the samples were heated in an oil bath (DF-101S, Gongyi Yuhua Instrument Co., Ltd., Gongyi, China) at 60 °C (for 90 min) before the color change of the sample surface was observed.
The crystal structure of the sample was tested by XRD (Rigaku SmartLab 3 kW, Akishima, Tokyo), with Cu radiation (λ = 0.154 nm) at a tube voltage of 40 kV, tube current of 40 mA, scanning speed of 10 °C/min, and scanning range of 20°~80° (RT). The mean particle size of the sample can be calculated from the Scherrer formula D = /(β·cosθ), where D is the crystalline size in nanometers, k is a constant equal to 0.94, λ represents the wavelength of the radiation (λ = 1.54 Å for CuKa radiation), β is the FWHM, and θ is the peak position [58].
Microstructures of the products were observed by high-resolution transmission electron microscopy (HRTEM, FEI TECNAI G2 F20, Cambridge, MA, USA), and the samples were dispersed into ethanol and sonicated for 10 min.
The specific surface area and pore size of the samples were determined by adsorption–desorption experiments with nitrogen (Tristar II 3020 3.02, Micromeritics Instrument Co., Ltd., Norcross, GA, USA). Typically, the samples were dried at 120 °C and then subjected to vacuum desorption at 300 °C for 10 h; the samples were analyzed at −196 °C, the specific surface area of the samples was calculated by the Brunauer–Emmett–Teller (BET) method, and the pore size distribution and pore volume of the samples were calculated by the Barrett–Joiner–Halenda (BJH) model [59].
The chemical structure of the sample was determined by Fourier transform infrared spectroscopy (FT-IR; Nicolet 6700, Nicolet Instrument Company, Orlando, FL, USA) with the KBr pellet method, with a wavenumber range of 400~2000 cm−1, a resolution of 4 cm−1, and 32 scans. The acid density (μmol/g) of the samples was determined by pyridine adsorption Fourier infrared spectrometer (Py-IR). The samples were activated under a vacuum at 300 °C for 30 min and cooled to 50 °C to collect the background spectrum. First, the catalysts were exposed to pyridine vapor for 15 min, and then vacuumed at 150 °C for 30 min. Finally, the Py-IR spectrum was recorded by subtracting the background spectrum (RT). The concentration of Brönsted and Lewis acids were calculated based on the equation C = IAπR2/, where C refers to concentration of Brönsted/Lewis acid sites (mmol/g), IA indicates integral absorbance of the Brönsted/Lewis band (cm−1), R denotes the radius of the catalyst disk (0.65 cm), W refers to the weight of the catalyst disk (g), and ε indicates the extinction coefficient (εB = 1.67 cm/mmol, and εL = 2.22 cm/mmol) [60].
The acid amount of the sample was determined by NH3-programmed temperature desorption (NH3-TPD, TP-5080, Tianjin Xianquan Industry & Trade Development Co., Ltd., Tianjin, China). Firstly, 0.2 g of sample was first pretreated with He (flow rate: 30 mL/min) at 300 °C (heating rate: 10 °C/min) for 1 h, and the temperature was reduced to 120 °C to adsorb NH3 (flow rate: 30 mL/min) for 1 h. Then, the carrier gas was switched to He, purging for 1 h. Finally, the temperature was raised to 850 °C after the baseline was stable (heating rate: 10 °C/min) to obtain the test data.
The X-ray photoelectron spectroscopy (XPS, ESCALAB 250Xi, Thermo Fisher Scientific Inc., Waltham, MA, USA) of the catalyst was performed with X-ray radiation generated by Al (1486.6 eV) and analyzed in a vacuum chamber. The drifted binding energy data were analyzed by Avantage software (version 5.984, Thermo Fisher Scientific Inc.) [61], and calibrated with the carbon reference (C1s = 284.8 eV) of aliphatic hydrocarbon. The XPS spectra were fitted by a Gaussian–Lorentzian product function and analyzed by the Shirley background. In the curve fit of the spectrum, the full-width-at-half-maximum (FWHM) for all peaks was constrained to be equal.

3.4. Catalytic Esterification

Typically, 0.0025 mol of Tyr mixed with 50 mg of catalyst was fed into 0.5 mol of methanol in an autoclave (50 mL, SJ50-Y4W6-C276-GY, Hefei Safety Instrument Co., LTD, Hefei, China) with a rotating speed of 500 rpm. First, the autoclave was purged 3 times with nitrogen (purity ≥ 99.9%) to remove residual air before the test. Then, the experiments were conducted with specific parameters and terminated using an ice-water bath. Finally, the spent catalyst and post-reaction mixture were separated via a nylon Millipore filter (0.22 μm, Jinteng Instrument Factory, Tianjin, China).
The qualitative analysis of the filtrate was carried out by GC-MS (Thermo Fisher Scientific Inc., Waltham, USA), consisting of a gas chromatograph (Trace 1310) coupled with a triple quadrupole mass spectrometer (TSQ 9000). Then, the filtrate was quantitatively tested by an Infinity Ⅱ HPLC equipped with a detector (G7115 UV-DAD, Agilent Technology, Santa Clara, CA, USA) and an Agilent Eclipse Plus C18 column (4.6 × 250 mm, 5 μm) using the following conditions: column temperature of 50 °C, detection wavelength of 280 nm, isocratic elution, mobile phase containing methanol and 5 mM CH3COONH4 (2:3, V/V), and a flow rate of 0.5 mL·min−1. The concentration of TyrOMe (mg·mL−1) was quantified by the external standard method (R2 > 0.999).
The TyrOMe yield was calculated using Equation (1):
T y r O M e   y i e l d   ( mol % ) = C P   × V / M P n × 100 %
where CP denotes the product concentration, V refers to the volume of the post-reaction mixture, MP represents the molar mass of TyrOMe, and n denotes the moles of Tyr.

3.5. Recyclability Test

The deactivated catalyst was recovered and reactivated through calcination at 600 °C for a duration of 4 h. The regenerated catalyst was subsequently employed in esterification reactions to evaluate its cycling stability and assess the retention of catalytic performance over successive reaction cycles.

4. Conclusions

The  S O 4 2 - S 2 O 8 2 /SnO2-Al2O3 solid superacid was synthesized via sol-gel and impregnation methods, modified with RF plasma technology, and subsequently employed to catalyze the methyl esterification reaction of Tyr, a high-steric-hindrance substrate. The RF plasma modified-catalyst (SSA-RF-600) exhibited an optimized morphology and enhanced acid properties. Notably, the electronic redistribution/intensified electron-withdrawing capability of  S O 4 2 / S 2 O 8 2  groups (responsible for reinforcing Brønsted and Lewis acid sites), elevated surface oxygen vacancy concentration (linked to increased Lewis acidity), and exposure of high-activity crystal planes collectively facilitated the esterification reaction. Using SSA-RF-600, the TyrOMe yield (a pharmaceutical precursor) reached 92.1%, retaining 78.3% after five successive catalytic cycles. Compared to traditional catalysis for sterically hindered esterification, this study provides a greener and more operationally efficient approach. Furthermore, RF plasma technology demonstrates potential as a versatile and scalable strategy for enhancing catalytic performance.

Author Contributions

Conceptualization, C.Z., B.T. and W.Z.; methodology, C.Z. and X.Z.; validation, C.Z., W.X. and Y.Z.; formal analysis, C.Z.; investigation, C.Z. and X.Z.; resources, C.Z. and X.Z.; data curation, C.Z. and X.Z.; writing—original draft preparation, C.Z.; writing—review and editing, C.Z.; visualization, C.Z., W.X. and X.Z.; supervision, X.C. and W.Z.; project administration, C.Z. and W.Z.; funding acquisition, C.Z., B.T. and W.Z. All authors have read and agreed to the published version of the manuscript.

Funding

This research was funded by the State Key Laboratory of NBC Protection for Civilians (No. G4301) and Science and Technology Innovation Research Project (No. F4301).

Data Availability Statement

The data presented in this study are available upon request from the corresponding author.

Acknowledgments

The authors wish to acknowledge the financial support from the State Key Laboratory of NBC Protection for Civilians (No. G4301) and Science and Technology Innovation Research Project (No. F4301).

Conflicts of Interest

Author Xudong Zhang was employed by the company Yibin Push Linko Technology Co., Ltd., Yibin, China. The remaining authors declare that the research was conducted in the absence of any commercial or financial relationships that could be construed as a potential conflict of interest.

References

  1. Vinod, V.; Sashidhar, R.; Sarma, V.; Raju, S.S. Comparative amino acid and fatty acid compositions of edible gums kondagogu (Cochlospermum gossypium) and karaya (Sterculia urens). Food Chem. 2010, 123, 57–62. [Google Scholar] [CrossRef]
  2. Anand, R.C.; Vimal. A mild and convenient procedure for the esterification of amino acids. Synth. Commun. 1998, 28, 1963–1965. [Google Scholar] [CrossRef]
  3. He, J.; Wen, X.; Wu, L.; Chen, H.; Hu, J.; Hou, X. Dielectric barrier discharge plasma for nanomaterials: Fabrication, modification and analytical applications. TrAC Trends Anal. Chem. 2022, 156, 116715. [Google Scholar] [CrossRef]
  4. Liu, C.-j.; Vissokov, G.P.; Jang, B.W.-L. Catalyst preparation using plasma technologies. Catal. Today 2002, 72, 173–184. [Google Scholar] [CrossRef]
  5. Xu, L.; Jiang, Q.Q.; Xiao, Z.H.; Li, X.Y.; Dai, L.M. Plasma-engraved Co3O4 nanosheets with oxygen vacancies and high surface area for the oxygen evolution reaction. Angew. Chem. 2016, 128, 5363–5367. [Google Scholar] [CrossRef]
  6. Di, L.; Zhang, J.; Zhang, X.; Wang, H.; Li, H.; Li, Y.; Bu, D. Cold plasma treatment of catalytic materials: A review. J. Phys. D Appl. Phys. 2021, 54, 333001. [Google Scholar] [CrossRef]
  7. Ye, Z.; Zhao, L.; Nikiforov, A.; Giraudon, J.-M.; Chen, Y.; Wang, J.; Tu, X. A review of the advances in catalyst modification using nonthermal plasma: Process, Mechanism and Applications. Adv. Colloid Interface Sci. 2022, 308, 102755. [Google Scholar] [CrossRef]
  8. Sripada, S.; Kastner, J.R. Catalytic esterification using solid acid carbon catalysts synthesized by sustainable hydrothermal and plasma sulfonation techniques. Ind. Eng. Chem. Res. 2022, 61, 3928–3940. [Google Scholar] [CrossRef]
  9. Qin, L.; Takeuchi, N.; Takahashi, K.; Kang, J.; Kim, K.H.; Li, O.L. N2/Ar plasma-induced surface sulfonation on graphene nanoplatelets for catalytic hydrolysis of cellulose to glucose. Appl. Surf. Sci. 2021, 545, 149051. [Google Scholar] [CrossRef]
  10. Liu, Y.; Wang, Z.; Liu, C.-j. Mechanism of template removal for the synthesis of molecular sieves using dielectric barrier discharge. Catal. Today 2015, 256, 137–141. [Google Scholar] [CrossRef]
  11. Nicolaï, B.; Mahé, N.; Céolin, R.; Rietveld, I.B.; Barrio, M.; Tamarit, J.-L. Tyrosine alkyl esters as prodrug: The structure and intermolecular interactions of L-tyrosine methyl ester compared to L-tyrosine and its ethyl and n-butyl esters. Struct. Chem. 2011, 22, 649–659. [Google Scholar] [CrossRef]
  12. Rietveld, I.B.; Barrio, M.; Tamarit, J.L.; Nicolaï, B.; Van de Streek, J.; Mahé, N.; Ceolin, R.; Do, B. Dimorphism of the prodrug L-tyrosine ethyl ester: Pressure–temperature state diagram and crystal structure of phase II. J. Pharm. Sci. 2011, 100, 4774–4782. [Google Scholar] [CrossRef] [PubMed]
  13. Hou, J.; Dong, J.; Zhu, H.; Teng, X.; Ai, S.; Mang, M. A simple and sensitive fluorescent sensor for methyl parathion based on l-tyrosine methyl ester functionalized carbon dots. Biosens. Bioelectron. 2015, 68, 20–26. [Google Scholar] [CrossRef] [PubMed]
  14. Abrash, H.I.; Niemann, C. Steric hindrance in α-chymotrypsin-catalyzed reactions*. Biochemistry 1963, 2, 947–953. [Google Scholar] [CrossRef]
  15. Ruan, C.; Rodgers, M.T. Cation-π interactions:  structures and energetics of complexation of Na+ and K+ with the aromatic amino acids, phenylalanine, tyrosine, and tryptophan. J. Am. Chem. Soc. 2004, 126, 14600–14610. [Google Scholar] [CrossRef]
  16. Theobaldo, F.C.; Lira, E.; Cheng, E.; Irokawa, A.; Tominaga, M. Esterification of n-protected-tyrosine by alpha-chymotrypsin in a high concentration of ethanol. Biotechnol. Tech. 1991, 5, 73–76. [Google Scholar] [CrossRef]
  17. Salvitti, C.; de Petris, G.; Troiani, A.; Managò, M.; Di Noi, A.; Ricci, A.; Pepi, F. Sulfuric acid catalyzed esterification of amino acids in thin film. J. Am. Soc. Mass Spectrom. 2023, 34, 2748–2754. [Google Scholar] [CrossRef]
  18. Boyle, T.P. Design and Synthesis of Novel Cationic Peptide Antibiotics. Ph.D. Thesis, University of Wollongong, Wollongong, Australia, 2004. [Google Scholar]
  19. Zhu, C.; Wang, K.; Luo, J.; Tian, B.; Sun, J.; Liu, X.; Zhu, W.; Zou, Z. Solid superacid SO42−-S2O82−/SnO2-Nd2O3-catalyzed esterification of α-aromatic amino acids. Mol. Catal. 2023, 535, 112833. [Google Scholar] [CrossRef]
  20. Paul, M.A.; Long, F.A. H0 and related indicator acidity function. Chem. Rev. 1957, 57, 1–45. [Google Scholar] [CrossRef]
  21. Yang, P.; Fan, S.; Chen, Z.; Bao, G.; Zuo, S.; Qi, C. Synthesis of Nb2O5 based solid superacid materials for catalytic combustion of chlorinated VOCs. Appl. Catal. B Environ. 2018, 239, 114–124. [Google Scholar] [CrossRef]
  22. Chen, X.; Pfender, E. Behavior of small particles in a thermal plasma flow. Plasma Chem. Plasma Process. 1983, 3, 351–366. [Google Scholar] [CrossRef]
  23. Liu, D.; Li, H.; Song, L.; Zhu, X.; Qin, Y.; Zu, H.; He, J.; Yang, Z.; Wang, F. Modulating electrical and photoelectrical properties of one-step electrospun one-dimensional SnO2 arrays. Nanotechnology 2020, 31, 335202. [Google Scholar] [CrossRef] [PubMed]
  24. Mali, J.M.; Arbuj, S.S.; Ambekar, J.D.; Rane, S.B.; Mulik, U.P.; Amalnerkar, D.P. Synthesis of SnO2 Nano Rods and Their Photocatalytic Properties. J. Nanoeng. Nanomanuf. 2013, 3, 121–125. [Google Scholar] [CrossRef]
  25. Zhang, Y.; Tang, S.; Deng, D.; Deng, S.; Chen, J.; Xu, N. Growth direction manipulation of few-layer graphene in the vertical plane with parallel arrangement. Carbon 2013, 56, 103–108. [Google Scholar] [CrossRef]
  26. Liu, G.; Cai, W. Morphological and structural control of organic monolayer colloidal crystal based on plasma etching and its application in fabrication of ordered gold nanostructured arrays. Crystals 2016, 6, 126. [Google Scholar] [CrossRef]
  27. Hong, S.-K.; Hanada, T.; Ko, H.-J.; Chen, Y.; Yao, T.; Imai, D.; Araki, K.; Shinohara, M.; Saitoh, K.; Terauchi, M. Control of crystal polarity in a wurtzite crystal: ZnO films grown by plasma-assisted molecular-beam epitaxy on GaN. Phys. Rev. B 2002, 65, 115331. [Google Scholar] [CrossRef]
  28. Adelkhani, H.; Ghaemi, M.; Ruzbehani, M. Evaluation of the porosity and the nano-structure morphology of MnO2 prepared by pulse current electrodeposition. Int. J. Electrochem. Sci. 2011, 6, 123–135. [Google Scholar] [CrossRef]
  29. Kleitz, F.; Schmidt, W.; Schüth, F. Evolution of mesoporous materials during the calcination process: Structural and chemical behavior. Microporous Mesoporous Mater. 2001, 44–45, 95–109. [Google Scholar] [CrossRef]
  30. Li, W.; Fan, G.; Yang, L.; Li, F. Surface Lewis acid-promoted copper-based nanocatalysts for highly efficient and chemoselective hydrogenation of citral to unsaturated allylic alcohols. Catal. Sci. Technol. 2016, 6, 2337–2348. [Google Scholar] [CrossRef]
  31. Zhu, C.; Wang, H.; Li, H.; Cai, B.; Lv, W.; Cai, C.; Wang, C.; Yan, L.; Liu, Q.; Ma, L. Selective hydrodeoxygenation of 5-hydroxymethylfurfural to 2, 5-dimethylfuran over alloyed Cu− Ni encapsulated in biochar catalysts. ACS Sustain. Chem. Eng. 2019, 7, 19556–19569. [Google Scholar] [CrossRef]
  32. Borade, R.B.; Clearfield, A. Effect of fluoride ions on the acidic and catalytic properties of beta zeolite. J. Chem. Soc. Faraday Trans. 1995, 91, 539–547. [Google Scholar] [CrossRef]
  33. Shao, J.; Cheng, S.; Li, Z.; Huang, B. Enhanced catalytic performance of hierarchical MnOx/ZSM-5 catalyst for the low-temperature NH3-SCR. Catalysts 2020, 10, 311. [Google Scholar] [CrossRef]
  34. Liu, L.; Xu, K.; Su, S.; He, L.; Qing, M.; Chi, H.; Liu, T.; Hu, S.; Wang, Y.; Xiang, J. Efficient Sm modified Mn/TiO2 catalysts for selective catalytic reduction of NO with NH3 at low temperature. Appl. Catal. A Gen. 2020, 592, 117413. [Google Scholar] [CrossRef]
  35. Du, X.; Wang, L.; Fu, Y.; Wang, H.; Yuan, M.; Xia, Q.; Hu, Q.; Zhou, A. Enhancing the electrochemical performance of d-Mo2CTx MXene in lithium-ion batteries and supercapacitors by sulfur decoration. Ceram. Int. 2023, 49, 19737–19745. [Google Scholar] [CrossRef]
  36. Peng, L.; Shang, Y.; Gao, B.; Xu, X. Co3O4 anchored in N, S heteroatom co-doped porous carbons for degradation of organic contaminant: Role of pyridinic N-Co binding and high tolerance of chloride. Appl. Catal. B Environ. 2021, 282, 119484. [Google Scholar] [CrossRef]
  37. Seid-Mohammadi, A.; Shabanloo, A.; Fazlzadeh, M.; Poureshgh, Y. Degradation of acid blue 113 by US/H2O2/Fe2+ and US/S2O82−/Fe2+ processes from aqueous solutions. Desalination Water Treat. 2017, 78, 273–280. [Google Scholar] [CrossRef]
  38. Supothina, S.; De Guire, M.R. Characterization of SnO2 thin films grown from aqueous solutions. Thin Solid Films 2000, 371, 1–9. [Google Scholar] [CrossRef]
  39. Tabata, K.; Hirano, Y.; Suzuki, E. XPS studies on the oxygen species of LaMn1−xCuxO3+λ. Appl. Catal. A Gen. 1998, 170, 245–254. [Google Scholar] [CrossRef]
  40. Liu, B.; Li, C.; Zhang, G.; Yao, X.; Chuang, S.S.; Li, Z. Oxygen vacancy promoting dimethyl carbonate synthesis from CO2 and methanol over Zr-doped CeO2 nanorods. ACS Catal. 2018, 8, 10446–10456. [Google Scholar] [CrossRef]
  41. Zemlyanov, D.Y.; Savinova, E.; Scheybal, A.; Doblhofer, K.; Schlögl, R. XPS observation of OH groups incorporated in an Ag (111) electrode. Surf. Sci. 1998, 418, 441–456. [Google Scholar] [CrossRef]
  42. Lin, X.; He, L.; Zhang, J.; Wang, X.; Wang, T. Study on surface morphology and microstructure of Al2O3 nano-films prepared by ion beam sputtering deposition. Trans. Mater. Heat Treat. 2009, 30, 166–169. [Google Scholar]
  43. Li, S.; Shi, Z.; Dong, J.; Ma, R. Multifunctional urea in modification of SnO2 interface for high efficiency planar perovskite solar cells. Surf. Interfaces 2024, 46, 104044. [Google Scholar] [CrossRef]
  44. Iatsunskyi, I.; Kempiński, M.; Jancelewicz, M.; Załęski, K.; Jurga, S.; Smyntyna, V. Structural and XPS characterization of ALD Al2O3 coated porous silicon. Vacuum 2015, 113, 52–58. [Google Scholar] [CrossRef]
  45. Bezrodna, T.; Puchkovska, G.; Shymanovska, V.; Baran, J.; Ratajczak, H. IR-analysis of H-bonded H2O on the pure TiO2 surface. J. Mol. Struct. 2004, 700, 175–181. [Google Scholar] [CrossRef]
  46. Zhang, B.; Tian, Y.; Zhang, J.X.; Cai, W. Structural, optical, electrical properties and FTIR studies of fluorine doped SnO2 films deposited by spray pyrolysis. J. Mater. Sci. 2011, 46, 1884–1889. [Google Scholar] [CrossRef]
  47. Song, H.; Zhao, L.; Meng, Y.; Song, H.; Li, F. Comparison of Ni-S2O82–/ZrO2–Al2O3 catalysts prepared by microemulsion and impregnation methods and their performance for isomerisation. Prog. React. Kinet. Mech. 2016, 41, 356–364. [Google Scholar] [CrossRef]
  48. Zhao, Q.; Meng, S.; Wang, J.; Li, Z.; Liu, J.; Guo, Y. Preparation of solid superacid S2O82−/TiO2–exfoliated graphite (EG) and its catalytic performance. Ceram. Int. 2014, 40, 16183–16187. [Google Scholar] [CrossRef]
  49. Liu, X.; Wang, K.; Liu, B.; Guo, Z.; Zhang, C.; Lv, Z. Novel WO3/SO42−-ZrO2–TiO2 double bridge coordination catalyst hfor oxidation of cyclohexene. J. Solid State Chem. 2021, 300, 122239. [Google Scholar] [CrossRef]
  50. Rinaldi, R.; Schüth, F. Design of solid catalysts for the conversion of biomass. Energ. Environ. Sci. 2009, 2, 610–626. [Google Scholar] [CrossRef]
  51. Ma, X.; Guo, D.; Jiang, Q.; Ma, Z.; Ma, Z.; Ye, W.; Li, C. Preparation and characterization of SO42−/TiO2 and S2O82−/TiO2 catalysts. Front. Chem. Sci. Eng. 2007, 1, 45–49. [Google Scholar] [CrossRef]
  52. Su, F.; Guo, Y. Advancements in solid acid catalysts for biodiesel production. Green. Chem. 2014, 16, 2934–2957. [Google Scholar] [CrossRef]
  53. Alaba, P.A.; Sani, Y.M.; Daud, W.M.A.W. Efficient biodiesel production via solid superacid catalysis: A critical review on recent breakthrough. RSC Adv. 2016, 6, 78351–78368. [Google Scholar] [CrossRef]
  54. Wachs, I.E.; Chen, Y.; Jehng, J.-M.; Briand, L.E.; Tanaka, T. Molecular structure and reactivity of the Group V metal oxides. Catal. Today 2003, 78, 13–24. [Google Scholar] [CrossRef]
  55. Zhang, H.; Lu, X.; Li, X.; Wang, B.; Dong, Y.; Sun, F.; Zhou, D.; Xia, Q. Construction of strong Lewis acidity through pre-calcining octahedral Zr-MOF to exhibit high activity for the selective isomerization of α-epoxypinane. Mol. Catal. 2022, 526, 112380. [Google Scholar] [CrossRef]
  56. Zhang, X.; Zhang, Q.; Chen, L.; Xu, Y.; Ma, L. Effect of calcination temperature of Ni/SiO2-ZrO2 catalyst on its hydrodeoxygenation of guaiacol. Chin. J. Catal. 2014, 35, 302–309. [Google Scholar] [CrossRef]
  57. Xue, Y.; Wang, P.; He, M.; Zhang, T.; Yang, C.; Li, Z. Rare earth nanomaterials in electrochemical reduction of carbon dioxide. Coord. Chem. Rev. 2024, 516, 215983. [Google Scholar] [CrossRef]
  58. Khorsand Zak, A.; Majid, W.H.A.; Ebrahimizadeh Abrishami, M.; Yousefi, R.; Parvizi, R. Synthesis, magnetic properties and X-ray analysis of Zn0.97X0.03O nanoparticles (X = Mn, Ni, and Co) using Scherrer and size–strain plot methods. Solid State Sci. 2012, 14, 488–494. [Google Scholar] [CrossRef]
  59. Groen, J.C.; Peffer, L.A.; Pérez-Ramírez, J. Pore size determination in modified micro-and mesoporous materials. Pitfalls and limitations in gas adsorption data analysis. Microporous Mesoporous Mater. 2003, 60, 1–17. [Google Scholar] [CrossRef]
  60. Li, P.; Gu, Y.; Yu, Z.; Gao, P.; An, Y.; Li, J. TiO2-SnO2/SO42− mesoporous solid superacid decorated nickel-based material as efficient electrocatalysts for methanol oxidation reaction. Electrochim. Acta 2019, 297, 864–871. [Google Scholar] [CrossRef]
  61. Baer, D.R.; Artyushkova, K.; Richard Brundle, C.; Castle, J.E.; Engelhard, M.H.; Gaskell, K.J.; Grant, J.T.; Haasch, R.T.; Linford, M.R.; Powell, C.J. Practical guides for X-ray photoelectron spectroscopy: First steps in planning, conducting, and reporting XPS measurements. J. Vac. Sci. Technol. A 2019, 37, 031401. [Google Scholar] [CrossRef]
Figure 1. Hammett titration results with 3-NT and 2,4-DNFB: (a) SSA-600 and (b) SSA-RF-600.
Catalysts 15 00255 g001
Figure 2. XRD patterns of the catalysts.
Catalysts 15 00255 g002
Figure 3. Microstructures and particle size distributions of the catalysts: (a,b) SSA-600 and (c,d) SSA-RF-600.
Catalysts 15 00255 g003
Figure 4. Nitrogen adsorption–desorption curves with the pore size distributions of the catalysts: (a) SSA-600 and (b) SSA-RF-600.
Catalysts 15 00255 g004
Figure 5. Py-IR spectra of the catalysts *. * The dashed lines indicate the desorption peak around the same wavenumbers.
Catalysts 15 00255 g005
Figure 6. NH3-TPD profiles of the catalyst before and after the RF plasma treatment *. * The dashed lines denote the desorption peaks at identical temperatures.
Catalysts 15 00255 g006
Figure 7. XPS spectra of the catalyst components: (a) S 2p XPS spectrum, (b) O 1s XPS spectrum, (c) Sn 3d XPS spectrum, and (d) Al 2p XPS spectrum for SSA-600; and (e) S 2p XPS spectrum, (f) O 1s XPS spectrum, (g) Sn 3d XPS spectrum, and (h) Al 2p XPS spectrum for SSA-RF-600 *. * The dashed line represents the acquired experimental data, while the blue solid line denotes the fitted results, and the background color schemes denote distinct deconvoluted peaks.
Catalysts 15 00255 g007aCatalysts 15 00255 g007b
Figure 8. FT-IR spectra of the catalysts *. * The dashed lines denote the absorption peak associated with the same chemical bonds.
Catalysts 15 00255 g008
Scheme 1. Diagram of acid site formation over (a S O 4 2 /SnO2-Al2O3 and (b S 2 O 8 2 /SnO2-Al2O3 intensified by RF plasma over SSA-RF-600.
Catalysts 15 00255 sch001
Figure 9. Investigation of the process parameters. Reaction conditions: (a) 180 °C, 0.8 MPa, 50 mg of catalyst, 0.0025 mol of Tyr, and 0.5 mol of methanol; (b) 180 °C, 6 h, 50 mg of catalyst, 0.0025 mol of Tyr, and 0.5 mol of methanol; (c) 180 °C, 6 h, 50 mg of SSA-RF-600, 0.0025 mol of Tyr, and 0.5 mol of methanol.
Catalysts 15 00255 g009
Table 1. Case for catalytic tyrosine esterification.
EntryCatalystReaction ConditionsEsterification RateReference
1alpha-chymotrypsin30 °C, 170 rpm, 120 h83%[16]
2H2SO4ESI source, 70 °C43.9%[17]
3SOCl20 °C-RT, 16 h100%[18]
4 S O 4 2 - S 2 O 8 2 /SnO2-Nd2O3180 °C, 500 rpm, 6 h, 1 MPa93.1%[19]
Table 2. Determination of the acid strength by the Hammett indicator *.
Indicator3-NT2,4-DNFB
H0−12.0−14.5
Result for SSA-600++
Result for SSA-RF-600++
* +: the sample surface color changed from light yellow to black.
Table 3. Pore structure parameters of the catalysts.
EntryCat.Specific Surface Area (m2·g−1) Pore Volume (cm3·g−1)Pore Size (nm)
1SSA-600102.100.123.82
2SSA-RF-600104.440.113.43
Table 4. The acid density analysis over the solid superacid.
EntryCat.BA (μmol/g)LA (μmol/g)Total Acid (μmol/g)BA/LA
1SSA-60036.6192.89129.500.39
2SSA-RF-60043.1899.68142.860.43
Disclaimer/Publisher’s Note: The statements, opinions and data contained in all publications are solely those of the individual author(s) and contributor(s) and not of MDPI and/or the editor(s). MDPI and/or the editor(s) disclaim responsibility for any injury to people or property resulting from any ideas, methods, instructions or products referred to in the content.