Article

Simulation of CO2 Catalytic Absorption Process Using Amine Solutions Based on the Lattice Boltzmann Method

School of Energy and Power Engineering, University of Shanghai for Science and Technology, Shanghai 200093, China
*
Author to whom correspondence should be addressed.
Catalysts 2025, 15(11), 1093; https://doi.org/10.3390/catal15111093
Submission received: 20 October 2025 / Revised: 11 November 2025 / Accepted: 18 November 2025 / Published: 20 November 2025
(This article belongs to the Section Environmental Catalysis)

Abstract

Carbon emission reduction strategies are crucial for addressing global climate change, with chemical absorption-based carbon capture technology being one of the core methods for achieving large-scale CO2 mitigation. The current research focus in chemical absorption lies in selecting blended amine–catalyst systems and applying efficient absorption–desorption equipment. This study employs the Lattice Boltzmann Method (LBM) to simulate the catalytic CO2 absorption process within an absorption column, obtaining data such as solution flow velocity, CO2 absorption rate, and temperature distribution. The simulation results align well with experimental data from a continuous pilot-scale setup. Furthermore, the effects of different operating parameters and catalyst conditions on the absorption process were investigated. The findings indicate that higher catalyst volume fractions and smaller catalyst particle sizes enhance CO2 absorption but may also lead to significant temperature rises across the column. Additionally, an optimized ternary amine–catalyst combination should be selected over a single amine to achieve superior CO2 absorption capacity. Provided that the cyclic loading capacity is maintained, the absorbent solution flow rate should be minimized to ensure optimal absorption efficiency.

1. Introduction

CO2 emissions are a major contributor to global climate change, and their volume continues to rise [1,2]. Carbon Capture, Utilization, and Storage technology (CCUS) is one of the most critical technological pathways for achieving CO2 emission reduction [3,4]. Post-combustion carbon capture is an effective and widely adopted decarbonization technology in power plants and chemical factories [5,6]. Among various approaches, chemical absorption has established itself as the predominant method for CO2 capture, owing to its prominent advantages in gas selectivity, scalability, and economic performance [7]. Organic amines, as the most extensively used absorbents in this process, make the study of CO2 absorption using amine solutions highly significant.
Commonly used amine absorbents are categorized into primary amines (monoethanolamine-MEA, 2-butoxyethylamine-BEA, etc.), secondary amines (diethanolamine-DEA, diisopropanolamine-DIPA, ethylaminoethanol-EAE, etc.), tertiary amines (methyldiethanolamine-MDEA, triethanolamine-TEA, N, N-diethylethanolamine-DEEA, etc.), and sterically hindered amines (2-amino-2-methyl-1-propanol-AMP, piperazine-PZ, etc.) [2]. Different types of amines have their own advantages and disadvantages in terms of absorption capacity, absorption rate, and desorption energy consumption, making it difficult to achieve a balance among all these properties [8,9]. In recent years, researchers have attempted to blend two or three commonly used amines into mixed solutions [10,11]. This approach aims to leverage the advantages of each individual amine and even generate additional synergistic effects, resulting in overall performance superior to that of single amines. Such efforts show promise to replace conventional single-amine absorbents in capturing CO2 from industrial flue gases.
Most blended amine absorbents are still created by selecting several components from among primary, secondary, tertiary, and sterically hindered amines, which are mixed in specific proportions. Under optimal combinations and ratios, significant improvements in absorption capacity, absorption rate, and desorption energy consumption can be achieved, such as MEA + MDEA + PZ by 3 + 1.5–2.5 + 0.5–1.5 mol/L [12], MEA + AMP + PZ by 3 + 1.5–2.5 + 0.5–1.5 mol/L [13], AMP + PZ + MEA by 1.5–2.5 + 0.5–1.5 + 3 mol/L [14,15], MEA + BEA + AMP by 0.1–0.5 + 2 + 2 mol/L [16,17], and MEA + EAE + AMP by 0.1–0.5 + 2 + 2 mol/L [18]. Based on a comprehensive perspective, MEA is typically selected as the benchmark to enhance CO2 absorption performance. A tertiary or sterically hindered amine, such as MDEA, DEEA, or AMP, is chosen to improve CO2 desorption performance. And a secondary amine with moderate absorption or desorption capability is added as a CO2 conversion accelerator, which is used to enhance the cyclic capacity [19]. In summary, the internal reactions within blended amine solvents are highly complex. This intricate mechanism enables a substantial enhancement in overall absorption–desorption performance under specific ratios. Key characteristic parameters such as cyclic capacity, regeneration energy consumption, reaction rate, and reactivity demonstrate significant advantages in blended amine systems over single-amine systems.
Building upon the foundation of blended amine absorbents, subsequent research has investigated the amine-based absorption process under various catalytic conditions, leading to the identification of multiple solid catalysts suitable for heterogeneous catalytic absorption. Catalysts can be categorized into acidic and basic types; commonly used acidic catalysts include γ-Al2O3 [20,21], H-ZSM-5, and HND-8 [22], while typical basic catalysts include BaCO3, CaCO3, and K/MgO [23], among others. Studies have shown that the addition of acidic catalysts can significantly enhance both absorption efficiency and cyclic capacity during the CO2 capture process. The application of basic catalysts effectively supplies electron donors to the absorption system, thereby accelerating the CO2 absorption rate from the perspective of reaction kinetics [20,21,22,23].
Most of the aforementioned studies on the CO2 catalytic absorption using blended amines solvents have been conducted in small-scale batch experimental setups. There has been little research on the arrangement of absorbents and catalysts in continuous, reactor-type absorption systems. A complete carbon capture process based on chemical absorption involves not only the selection and formulation of absorbents and catalysts but also the design and optimization of the absorption equipment itself. Key factors include the feeding method of absorbent and mixed gas and environmental parameters such as flow rate and temperature, as well as catalyst type, dosage, and arrangement, all of which are critical to the efficiency and cost-effectiveness of the overall carbon capture process.
The absorption column is the common unit operation employed in the CO2 capture process. Research on this process can be conducted not only through experimental setups but also via simulations. A typical simulation approach for gas–liquid absorption within the column involves coupling fluid flow and heat transfer calculations with chemical reaction kinetics. For large-scale absorption columns, where simulating sizable flow and heat transfer domains is necessary, tools like Fluent are often applied. Li et al. [24,25] used CFD to simulate CO2 absorption in rotating packed beds and microporous tube-in-tube microchannel reactors. Bozonc et al. [26] and Ghasem [27] applied 3D-CFD to model a Hollow Fiber Membrane Contactor system for capturing CO2 into aqueous MEA solution. However, for small laboratory-scale absorbers—particularly those featuring micro-channels packed with dispersed inert marbles or catalysts to extend gas–liquid contact time—the LBM offers distinct advantages.
The LBM is a numerical simulation approach that bridges the macroscopic and microscopic scales, operating from a mesoscopic particle-based perspective. Although there are currently few reports on the application of LBM to simulate the amine-catalyzed CO2 absorption process, its validity has been demonstrated in studies of heterogeneous reactive flow and heat transfer within micro-channels. Yang et al. [28] used a two-dimensional LBM and a cell automation (CA) probabilistic model to investigate the mass transfer of CO2 in nanofluids and found that the Brownian motion and grazing effect both enhance the mass transfer of nanofluids. Guo et al. [29] and Ge et al. [30] simulated the process of CO2 absorption into a horizontal liquid layer with the hybrid LBM–FDM (finite-difference method), and the results showed that prediction of the mass transfer with Rayleigh convection is satisfactory. It is evident that employing the LBM to study the catalytic absorption of CO2 in laboratory-scale absorption columns can reduce experimental costs while yielding reliable results and obtain detailed distribution of macroscopic parameters inside the absorption column, thereby providing valuable guidance for the carbon capture process.
In this study, LBM is employed to simulate the catalytic absorption of CO2, based on the absorption column in a continuous pilot-scale CO2 absorption–desorption system. The simulation aims to predict the distributions of solution flow velocity, temperature, and CO2 concentration within the column and to investigate the effects of various factors, including absorbent flow rate, catalyst volume fraction, particle size, and different absorbent formulations, on the absorption process.

2. Results and Discussion

2.1. Verification of LBM Code Accuracy

Firstly, to verify the accuracy of the LBM code in our work, the standard lid-driven cavity flow was adopted, which is a widely used benchmark for incompressible fluid dynamics. The simulation was performed in a square cavity with side length L = 100, which was filled with fluid. The top boundary moved horizontally to the right at a constant velocity, while the other three walls remained stationary. At steady state, a primary vortex formed in the center of the cavity, with secondary vortices emerging near the bottom left and right corners. Simulations were conducted at Reynolds numbers of 400 and 1000, with a grid resolution of 256 × 256, a lid velocity of 0.1, and relaxation times determined inversely from the Reynolds number. The resulting flow patterns are shown in Figure 1. Quantitative comparisons of the center positions of the primary and secondary vortices were made against results from References [31,32] under identical conditions, as summarized in Table 1. The labels (a)–(c) in the table denote results from Refs. [31,32] and this work, respectively. The close agreement among the three sets of results confirms the correctness of the present LBM code.

2.2. Simulation Results for Full-Length Absorption Column

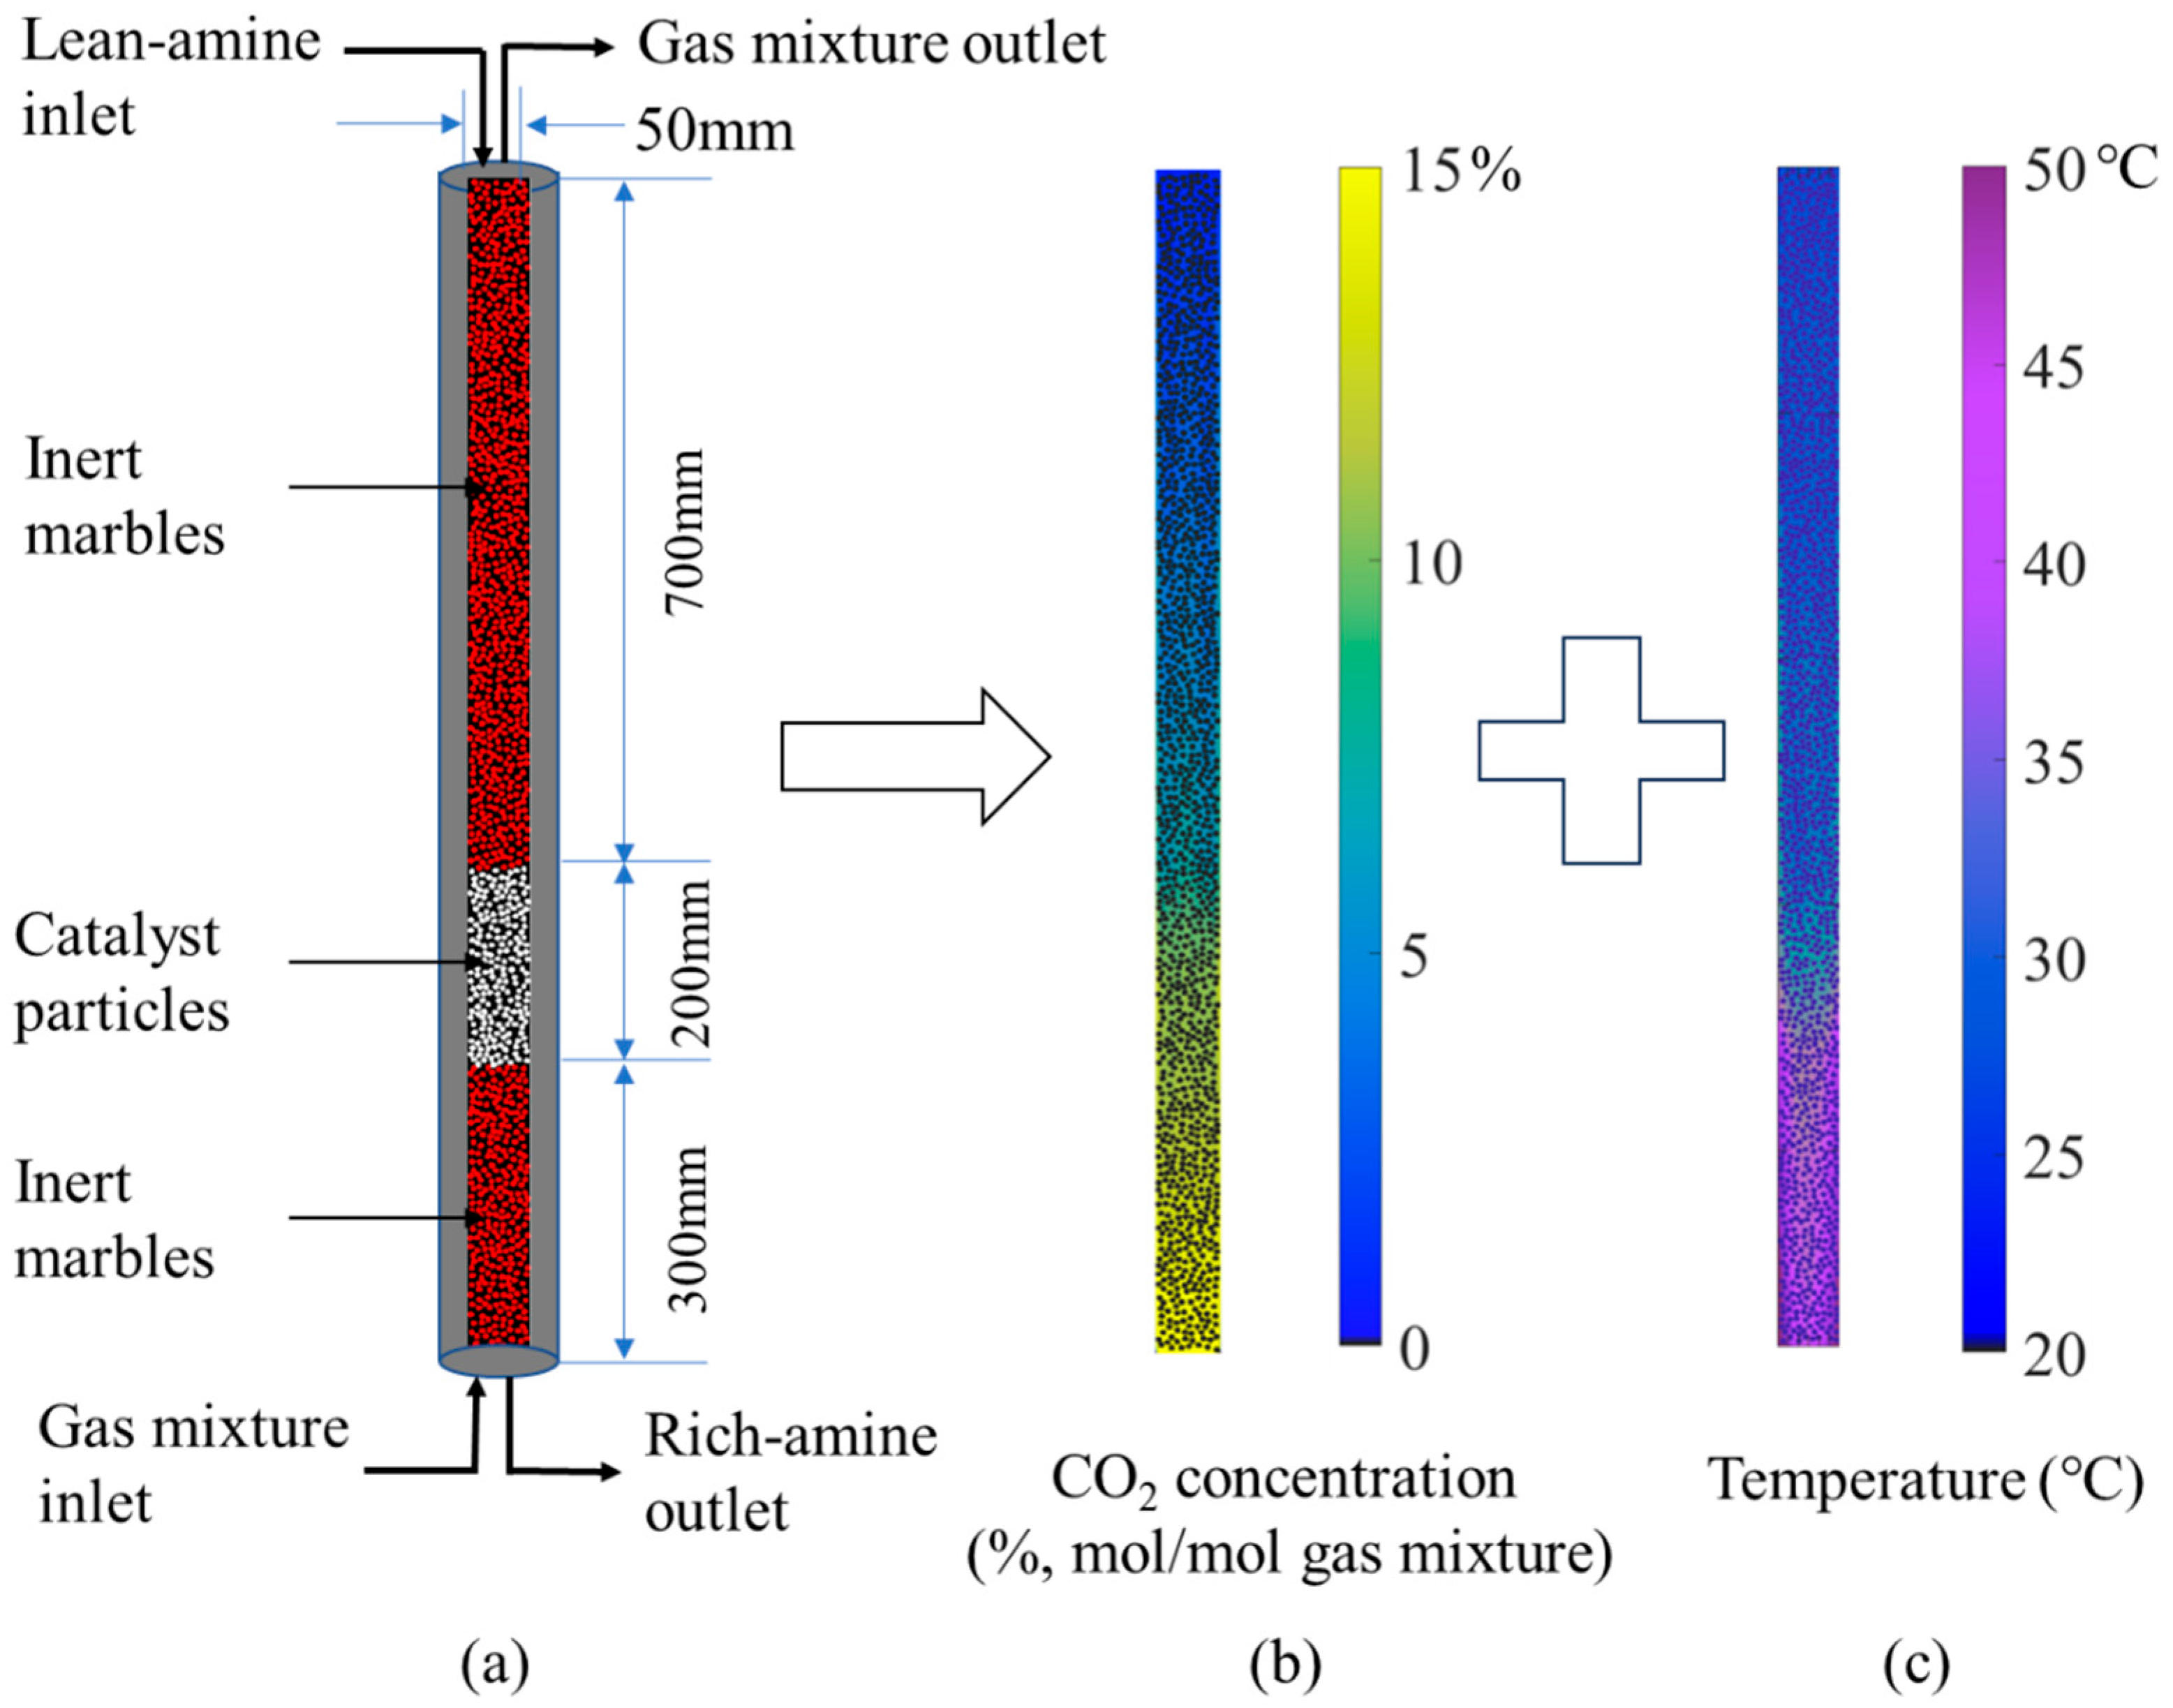
In order to validate the accuracy of the simulation results, LBM calculation was performed based on the full-length dimensions of the absorption column from the pilot-scale setup described in the literature [33]. The resulting CO2 concentration in the gas mixture and absorbent temperature distributions are shown in Figure 2. The computational domain covers the entire reactive region inside the absorption column, including both inert marbles and catalyst particles. The results in Figure 2b show that the CO2 concentration in the gas mixture decreases progressively along the flow direction starting from the gas mixture inlet at the bottom, eventually approaching complete absorption. Figure 2c indicates that the absorbent temperature increases gradually from the lean-amine solution inlet at the top, driven by the exothermic absorption reaction. Furthermore, the pronounced color gradient in the contour plots occurs precisely within the catalyst-packed section, revealing substantially different degrees of CO2 absorption and temperature variation in the catalytic zone compared to the non-catalytic sections.
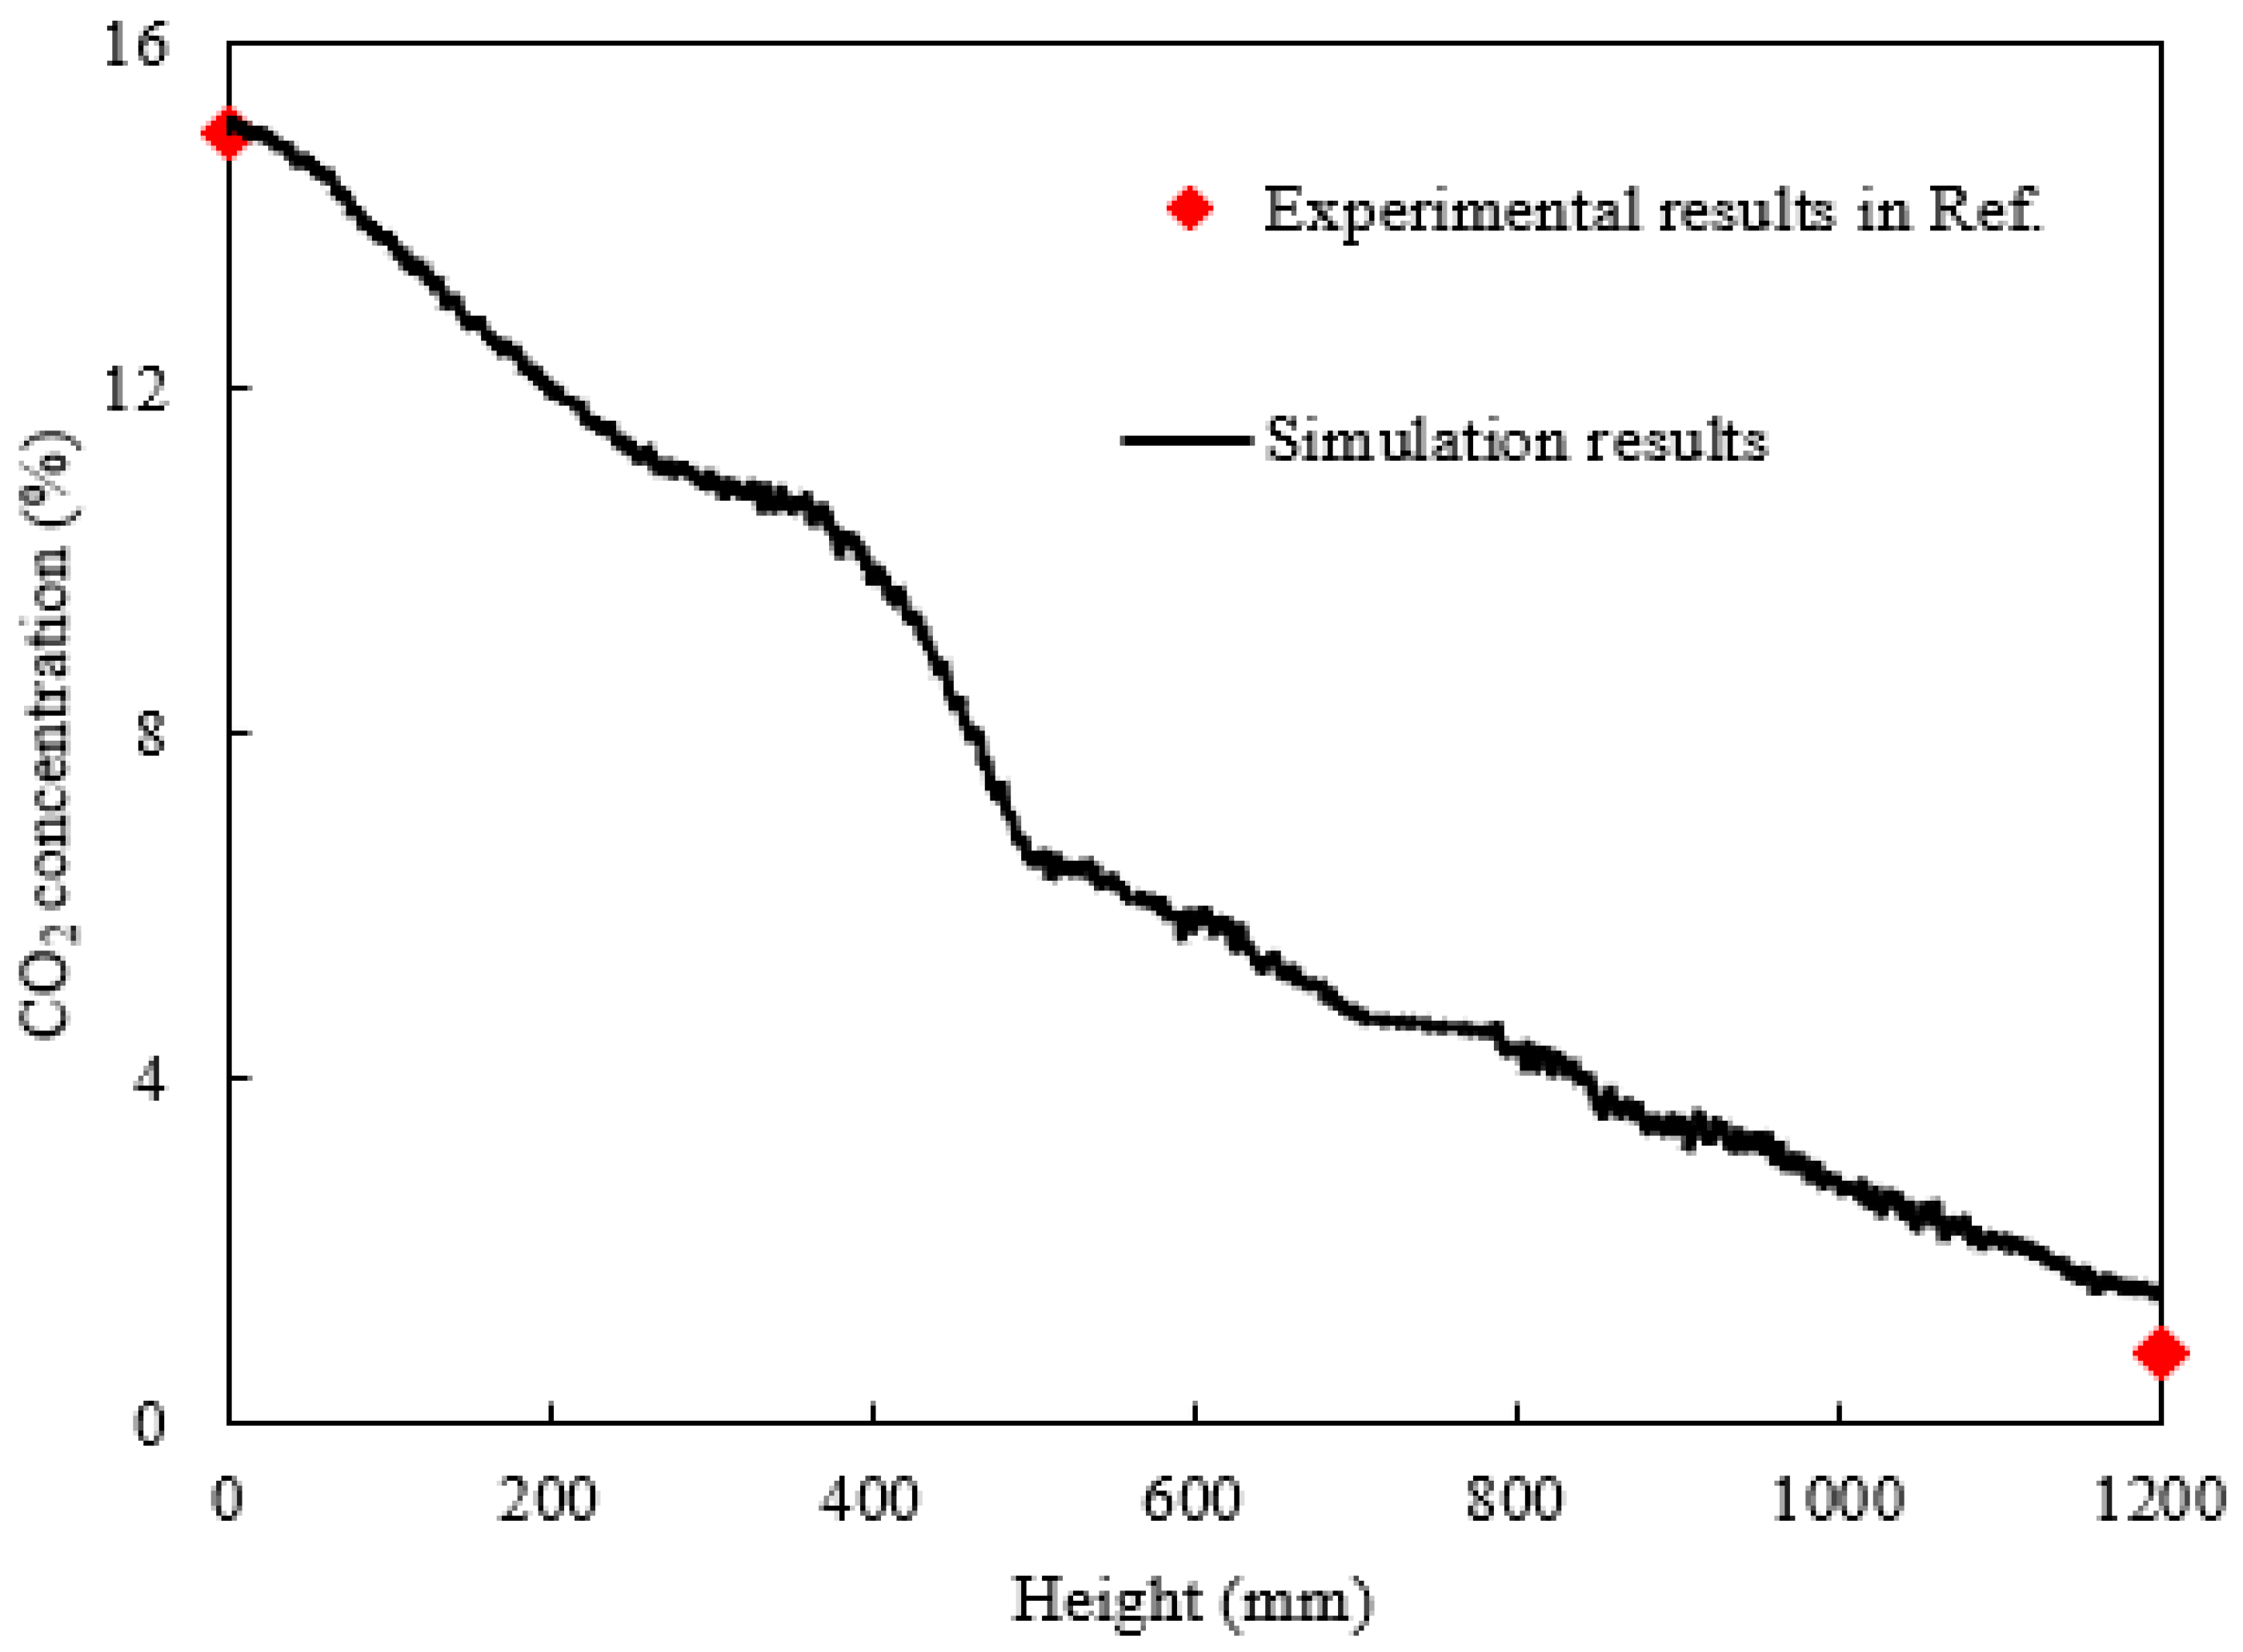
Figure 3 presents detailed simulation results of the average CO2 concentration in gas mixture along the column height, showing a trend consistent with the contour plot in Figure 2b. The profile exhibits a distinct three-stage variation, corresponding precisely to the three-section particle arrangement of marbles–catalyst–marbles along the full length. The magnitude of concentration change in the catalyst segment is significantly greater than that in the non-catalytic sections, indicating a notable enhancement of CO2 absorption due to the catalyst. Furthermore, experimental data from Reference [33] were added for comparison. However, the experimental measurements in the literature could only determine the CO2 concentrations of gas mixture at the inlet and outlet of the column, without resolving the internal concentration distribution. The CO2 concentration at the gas mixture inlet in the present simulation was set to be consistent with the experimental conditions. The simulated average concentration at the outlet is approximately 1.4%, which matches reasonably well with the experimentally measured value of 0.5% reported in Reference [33]. More precise quantitative analysis reveals that the experimental concentration difference between the inlet and outlet was about 14.2%, while the simulated value was 13.4%, yielding a relative error of only 5.6%.
Figure 4 presents detailed simulation results of the average absorbent temperature along the column height, showing a trend consistent with the contour plot in Figure 2c. The temperature profile also exhibits a clear three-stage variation. These simulation results also confirm that the catalyst significantly accelerates the CO2 absorption reaction, thereby releasing more heat and causing a more pronounced temperature change in the catalytic segment compared to the non-catalytic sections. Experimental data from Reference [33] are added for comparison, which were obtained from six thermocouples by evenly distributed along a 1.2 m absorption column. The simulated temperature distribution closely matches the measured experimental values. More precise quantitative analysis reveals that the average temperature deviation across the monitoring points was approximately 0.55 °C, corresponding to a relative error of only 1.8% with respect to the average temperature along the entire length. In summary, the simulated average CO2 concentration of the gas mixture at the outlet and the internal solution temperature distribution match Reference [33]’s data well, thereby validating the reliability of the present simulation.

2.3. Simulation Iteration Results and Convergence Analysis

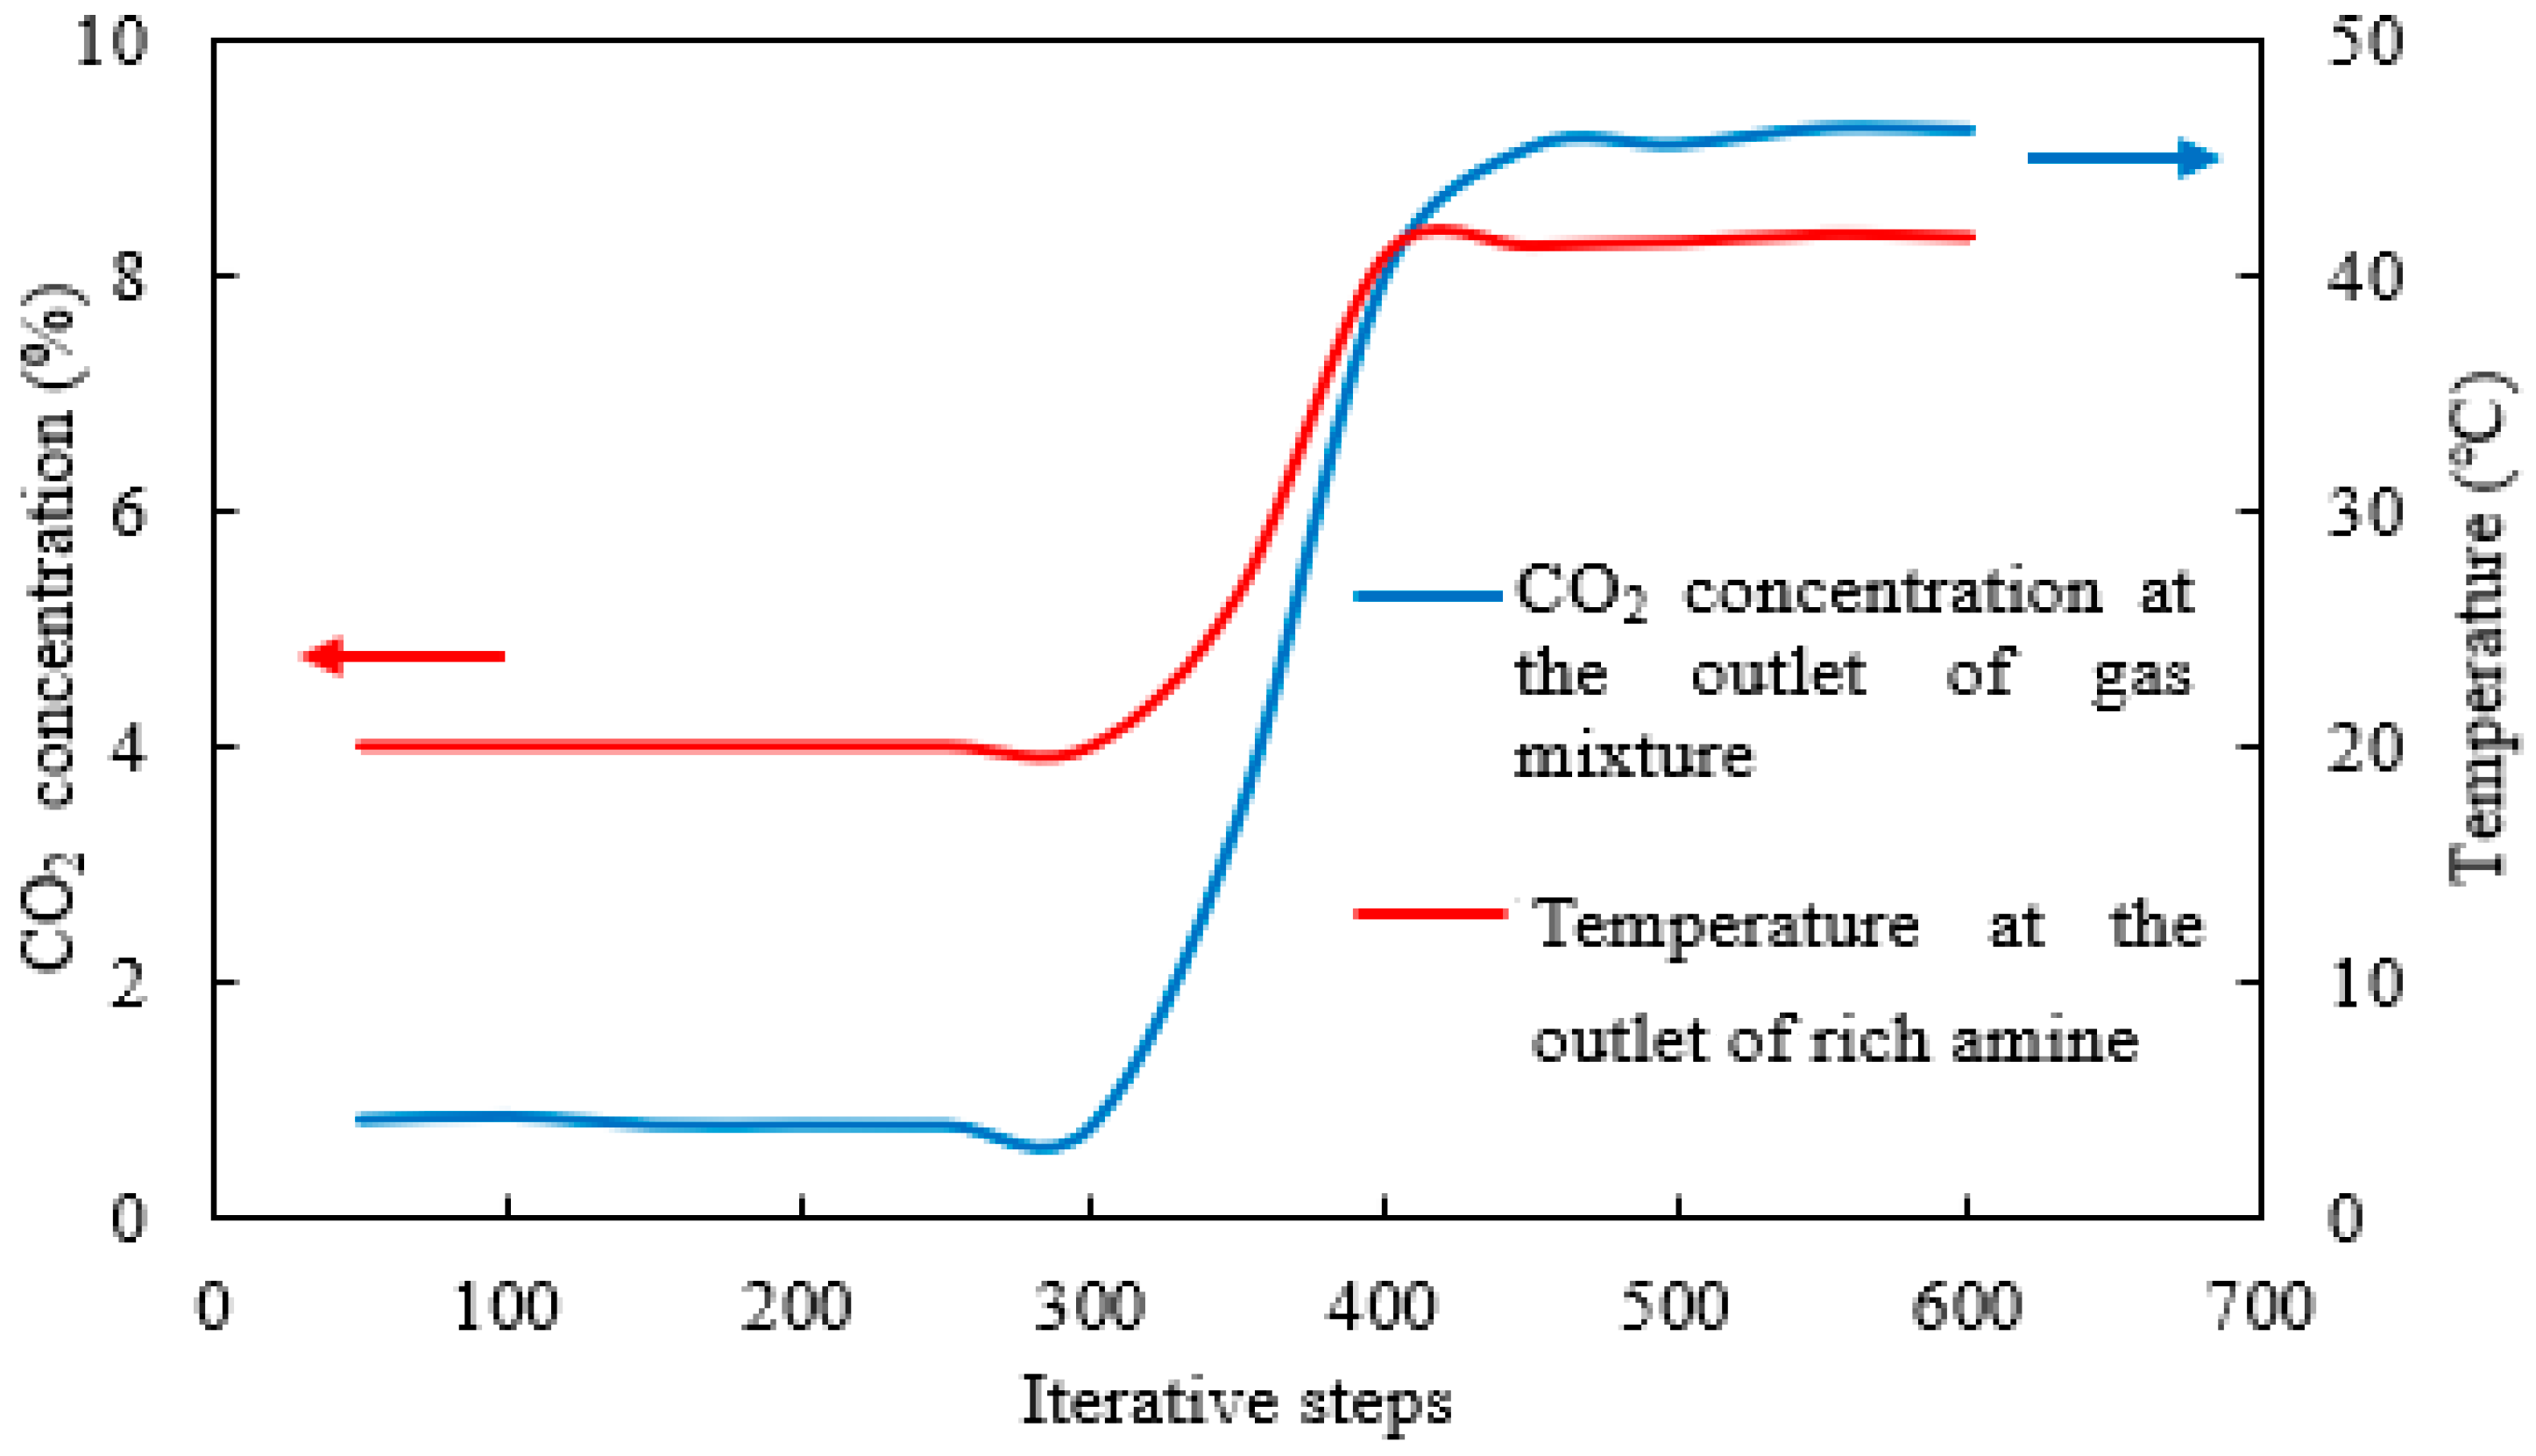
Since the solution achieves adequate dispersion after passing through the extended inert marble section, and the reliability of this approach has been verified via full-length simulation, subsequent control groups were simulated only within a 200 mm catalyst segment to improve computational efficiency and amplify the distribution of characteristic parameters in localized regions. The model structure is illustrated in Figure 5a. As the simulation involved iterative calculations and convergence criterion, the relationship between key parameters and iteration steps under the baseline condition was examined, as shown in Figure 6, focusing on CO2 concentration of gas mixture and absorbent temperature at the outlet. The results indicate that all parameters underwent noticeable changes at around 300 iterations and stabilized after 500 iterations. Therefore, in all subsequent simulations for the catalyst segment, data were collected after 600 iterations, by which point the results were considered converged and the output macroscopic parameters had stabilized.
In addition, this study presents a contour plot of key parameters’ distributions after convergence under the baseline condition, with comparative model schematic diagrams shown in Figure 5. Figure 5b illustrates the velocity distribution of the amine solution within the column. Under the baseline condition, the initial solution velocity is 0.09 cm/s. As the solution passes through the narrow channels between catalyst particles, the flow becomes redistributed, with some regions exhibiting very low velocities while others reach values as high as 0.2 cm/s. These velocity variations influence the CO2 absorption process by affecting both the contact with catalysts and the reaction residence time, thereby impacting the overall absorption rate. Figure 5c shows that the CO2 concentration in the gas mixture gradually decreases along the flow direction, reducing from 15% at the inlet to approximately 9.2% after passing through the 200 mm catalyst segment under baseline conditions. Figure 5d demonstrates that the absorbent temperature exhibits a gradually increasing distribution along the flow direction from the lean-amine inlet, rising from 27 °C at the inlet to about 42 °C through the 200 mm catalyst section. In summary, the contour plots of velocity, concentration, and temperature obtained from the simulation clearly reflect the detailed progression of the catalytic CO2 absorption process within the absorption column. Moreover, the parameter settings for the 200 mm catalytic segment are consistent with those of the full-length model, with the exception of the length. Therefore, the results for the segment are considered reliable.

2.4. Effect of Absorbent Solution Velocity

The absorbent solution flow rate range of 70–90 mL/min in Reference [33] corresponds to a velocity of approximately 0.06–0.08 cm/s based on the inner diameter of the absorption column. In this study, while keeping other operating conditions constant, a velocity gradient ranging from 0.06 to 0.1 cm/s was investigated. The corresponding contour plots are shown in Figure 7. A clear increase in red areas within the microchannels is observed as the solution velocity rises, indicating a notable expansion of high-velocity regions. With the CO2 concentration of gas mixture fixed at 15% at the inlet, the concentration at the outlet can be compared with different cases. As the solution velocity increases, the blue-green area gradually diminishes while the yellow zone expands, reflecting a progressive increase in CO2 concentration at the outlet. Under a constant lean-amine inlet temperature of 27 °C, the temperature at the rich-amine outlet can be compared. It was found that the purple area expands with increasing solution velocity, indicating a clear temperature rise at the outlet.
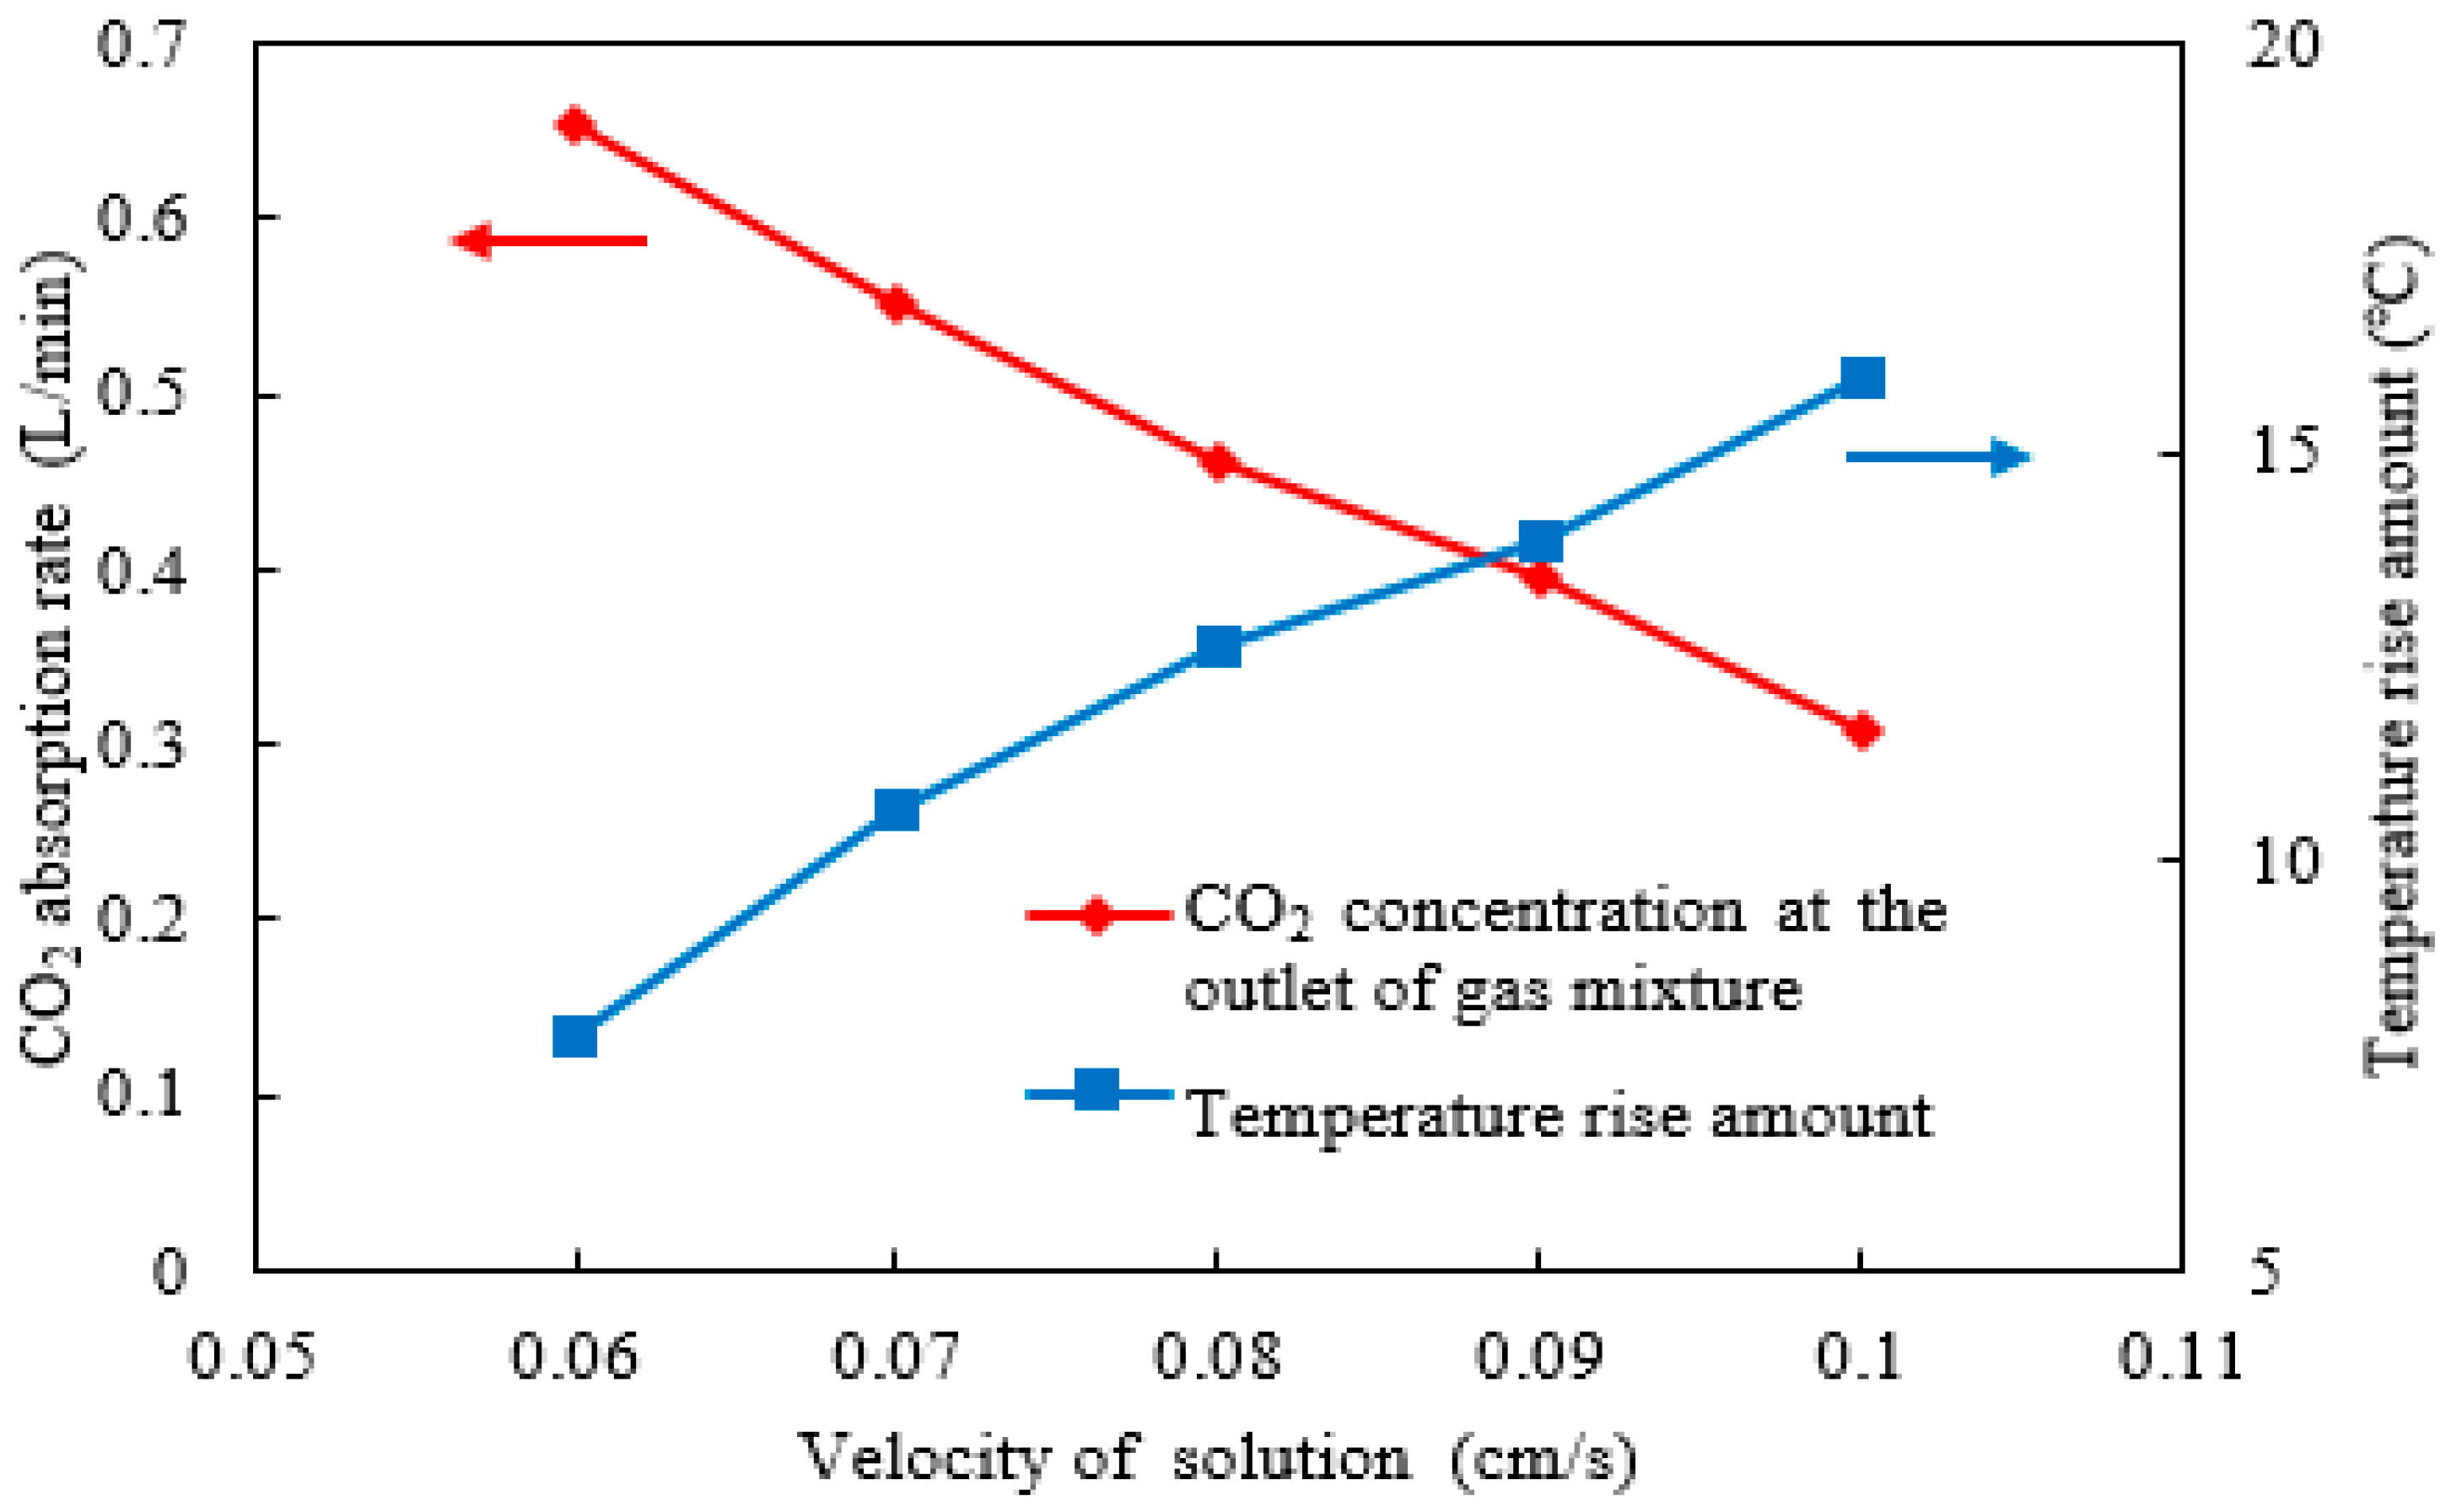
The contour plots of characteristic parameters provide an intuitive understanding of their distribution details within the absorption column. In addition, the quantitative relationships between various influencing factors and these parameters were analyzed in this study. The concepts of the CO2 absorption rate and rise in temperature across the catalyst segment were proposed. Under the initial setting of a gas mixture flow rate of 7 L/min, the CO2 absorption rate in the catalyst segment was calculated by multiplying this flow rate by the difference in the average CO2 concentration between the inlet and outlet of the gas mixture. The rise in temperature of the absorbent in the catalyst segment was defined as the difference between the average temperature at the rich-amine outlet and the lean-amine inlet. Figure 8 shows that as the solution velocity increases from 0.06 to 0.1 cm/s, the CO2 absorption rate decreases from approximately 0.65 to 0.3 L/min, representing a reduction of nearly half. For every 1 cm/s increase in absorbent flow rate, the CO2 absorption rate decreases by approximately 9 L/min. This decline occurs because the increased velocity significantly shortens the residence time of the amine absorbent, reducing its contact time with the catalyst and thereby substantially diminishing the CO2 absorption reaction. Furthermore, the rise in temperature increases from about 7.5 °C to 16 °C, indicating a pronounced effect. For temperature-sensitive absorbents and catalysts, this increase adversely affects absorption performance. Overall, in a continuous CO2 absorption–desorption system, the absorbent solution flow rate should not be excessively high, although this also impacts the cyclic loading capacity. It is advisable to select the lower absorbent solution flow rate provided that the cyclic loading requirement is met.

2.5. Effect of Catalyst Volume Fraction

The catalyst concentration is a critical parameter in catalytic reaction processes. Determining the optimal catalyst loading within a confined space requires urgent investigation. To ensure the absorbent fluid flows smoothly through the particle-packed absorption column without clogging, adequate channel space must be maintained. Thus, the volume fraction of catalysts relative to the total space should not be excessively high. In this study, while keeping other operating conditions constant, the catalyst volume fraction was varied between 30% and 50%. The corresponding contour plots are shown in Figure 9. To ensure uniform dispersion of catalyst particles within the column, a reduced volume of catalyst was filled with inert marbles. In all the figures of the present work, black particles represent the catalyst, and red particles denote inert marbles. The total volume fraction of both particle types remained constant at 50%, resulting in negligible variation in absorbent velocity, which was therefore omitted from the analysis. The results indicate that as the catalyst volume fraction decreased, the blue-green area gradually shrank while the yellow zone expanded, reflecting an increase in CO2 concentration at the gas mixture outlet. Simultaneously, the reduction in catalyst volume fraction led to a contraction of the purple area, indicating a noticeable decrease in absorbent temperature at the rich-amine outlet.
Similarly, the CO2 absorption rate and rise in temperature under different catalyst volume fractions were calculated, as shown in Figure 10. The results demonstrate that as the catalyst volume fraction increases from 30% to 50%, the CO2 absorption rate rises from 0.24 to approximately 0.37 L/min, representing an improvement of about 50%. The increased catalyst loading undoubtedly expands the contact area with the absorbent, thereby enhancing the absorption capacity. This enhancement is particularly pronounced for some absorbents that are highly sensitive to the catalyst. Additionally, the rise in temperature increases from 8 °C to 13.5 °C. For temperature-sensitive absorbents and catalysts, such a temperature increase adversely affects the absorption reaction. In summary, while catalyst particles should be arranged as densely as possible to improve the CO2 absorption rate, precautions must be taken to prevent flow channel blockage and a reduction in catalytic activity caused by a rise in temperature.

2.6. Effect of Catalyst Size

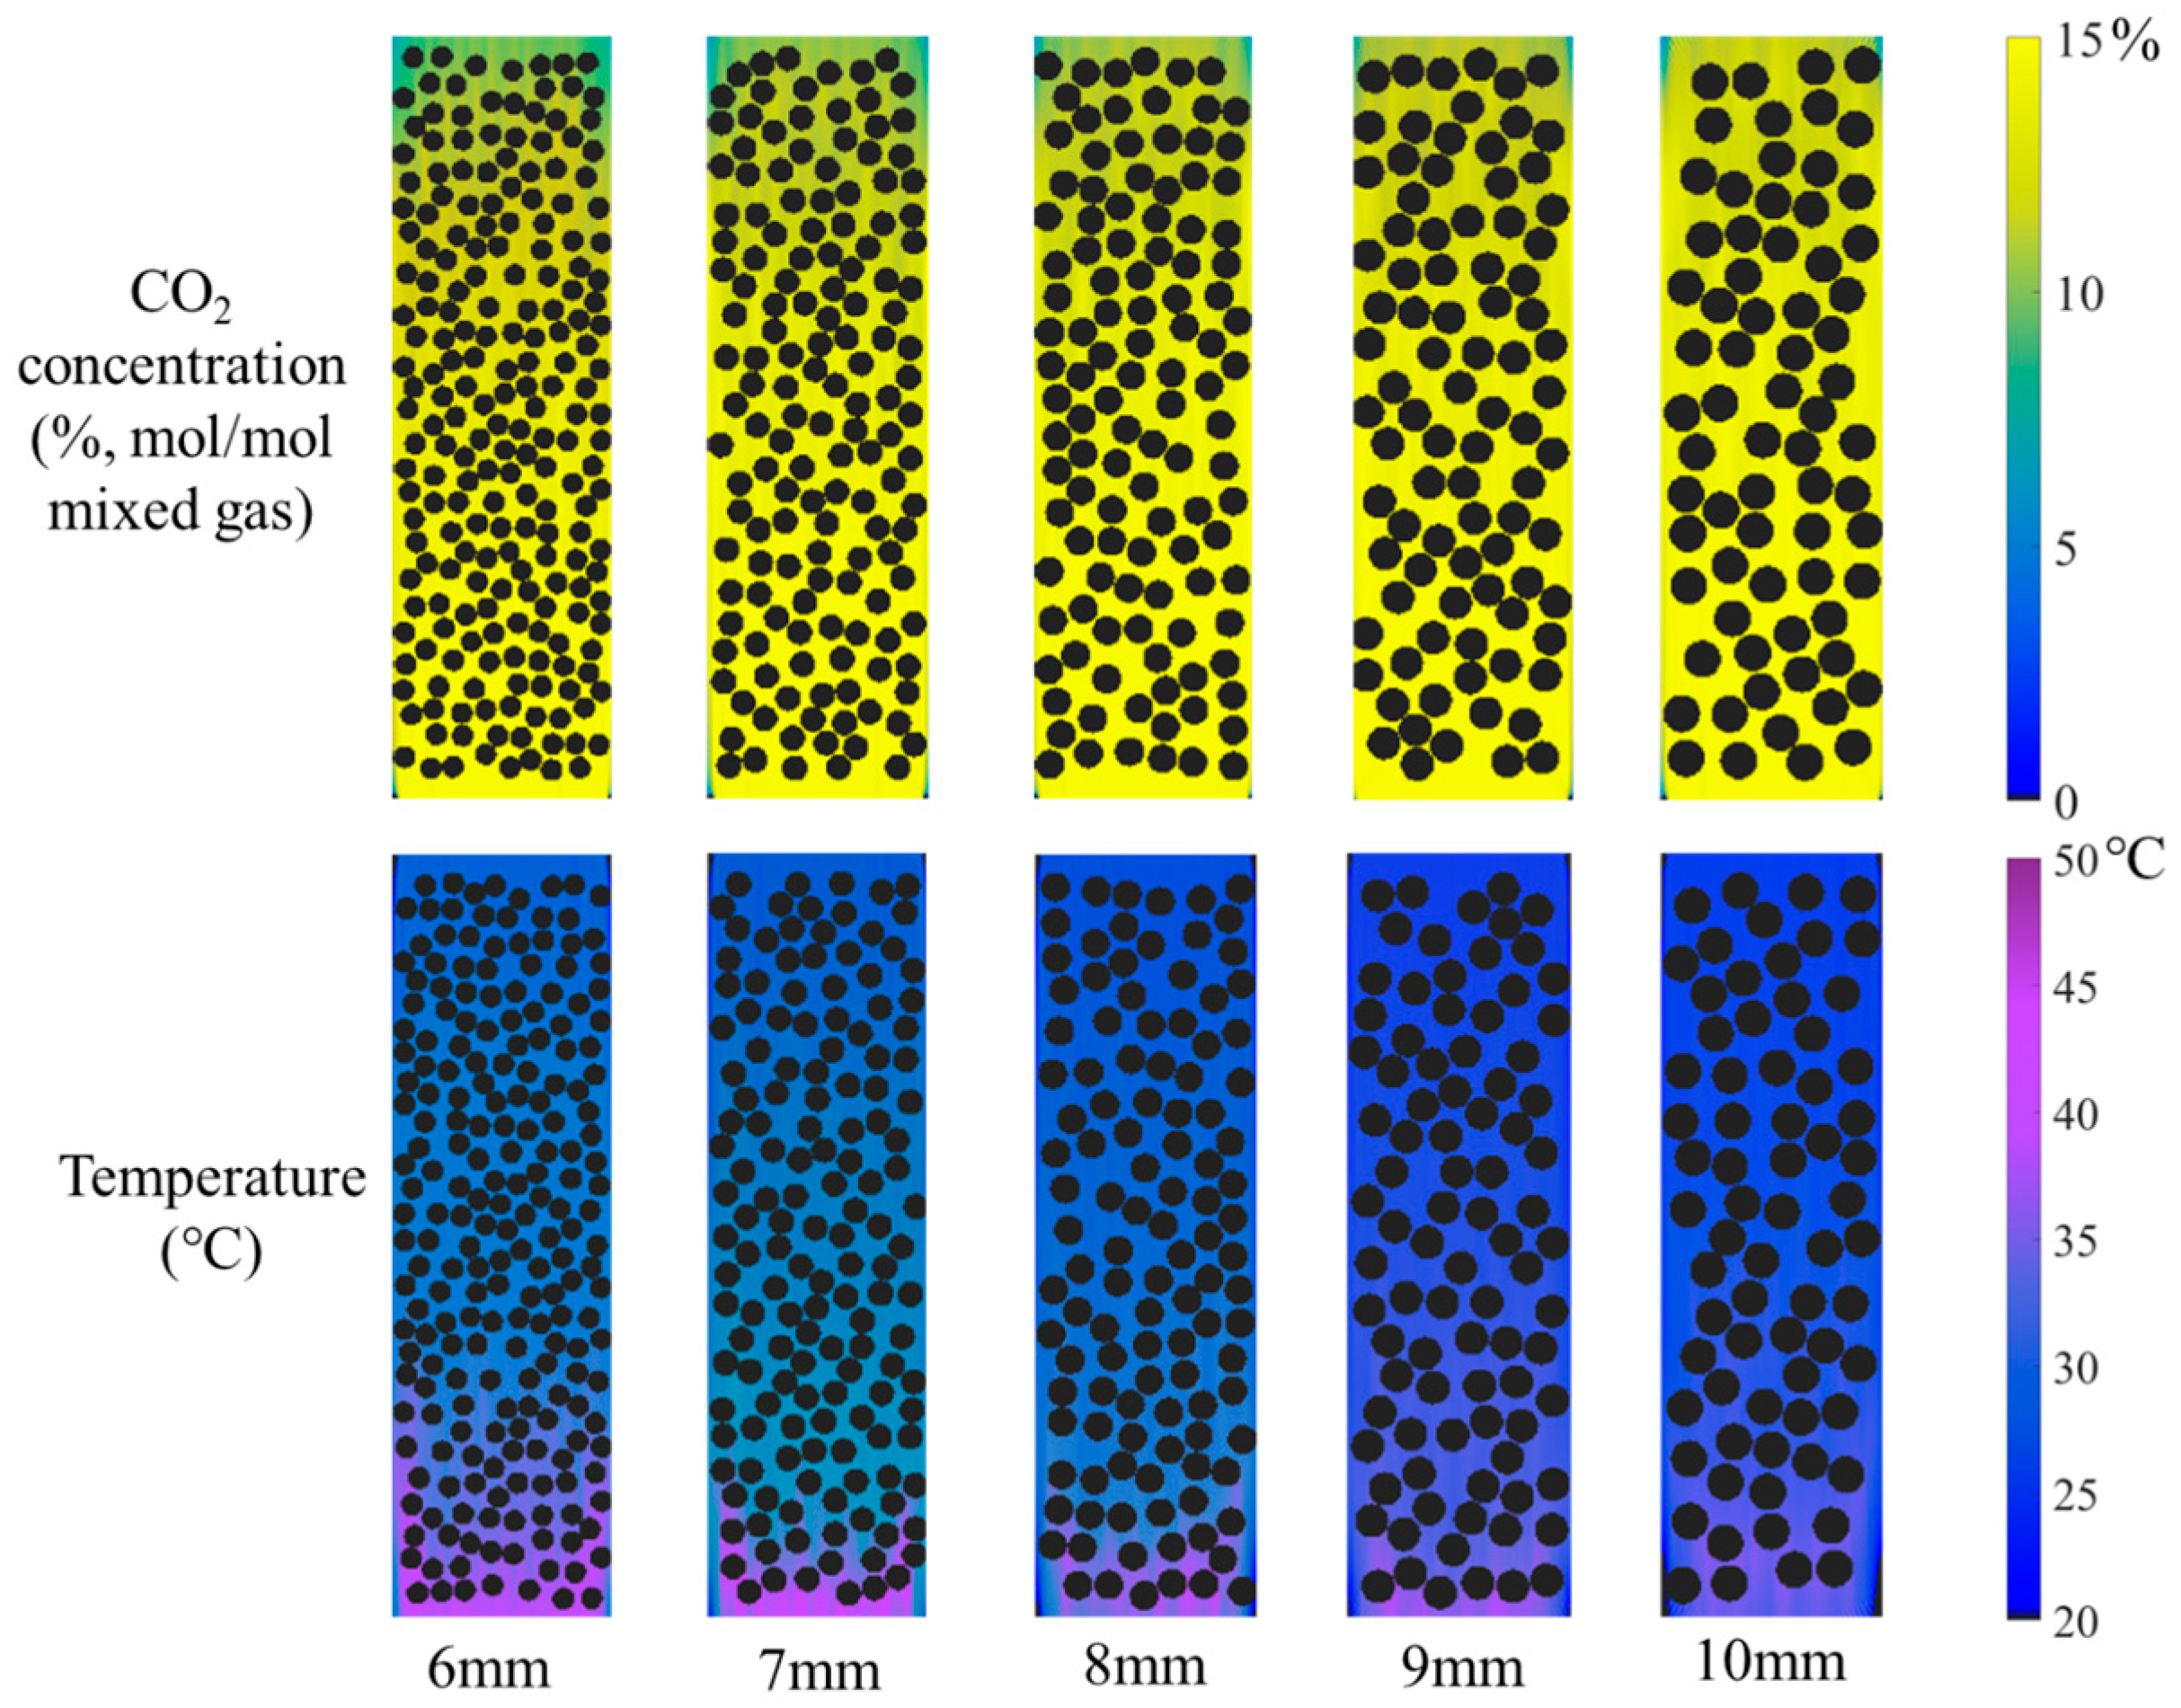
The particle size of the catalyst is a critical parameter influencing its performance. In this study, while maintaining other operating conditions unchanged, the catalyst particle diameter was varied within a range of 6–10 mm. The corresponding contour plots of various parameters are presented in Figure 11. Although the particle size increases, the particles remain spherical, and the catalyst volume fraction relative to the total space is kept constant at 50%. The results show that as the catalyst particle size increases, the blue-green area gradually diminishes while the yellow zone expands, indicating a progressive increase in CO2 concentration at the gas mixture outlet and a corresponding reduction in CO2 absorption. Concurrently, the enlargement of catalyst particles leads to a shrinkage of the purple area, reflecting a noticeable decrease in the absorbent temperature at the rich-amine outlet.
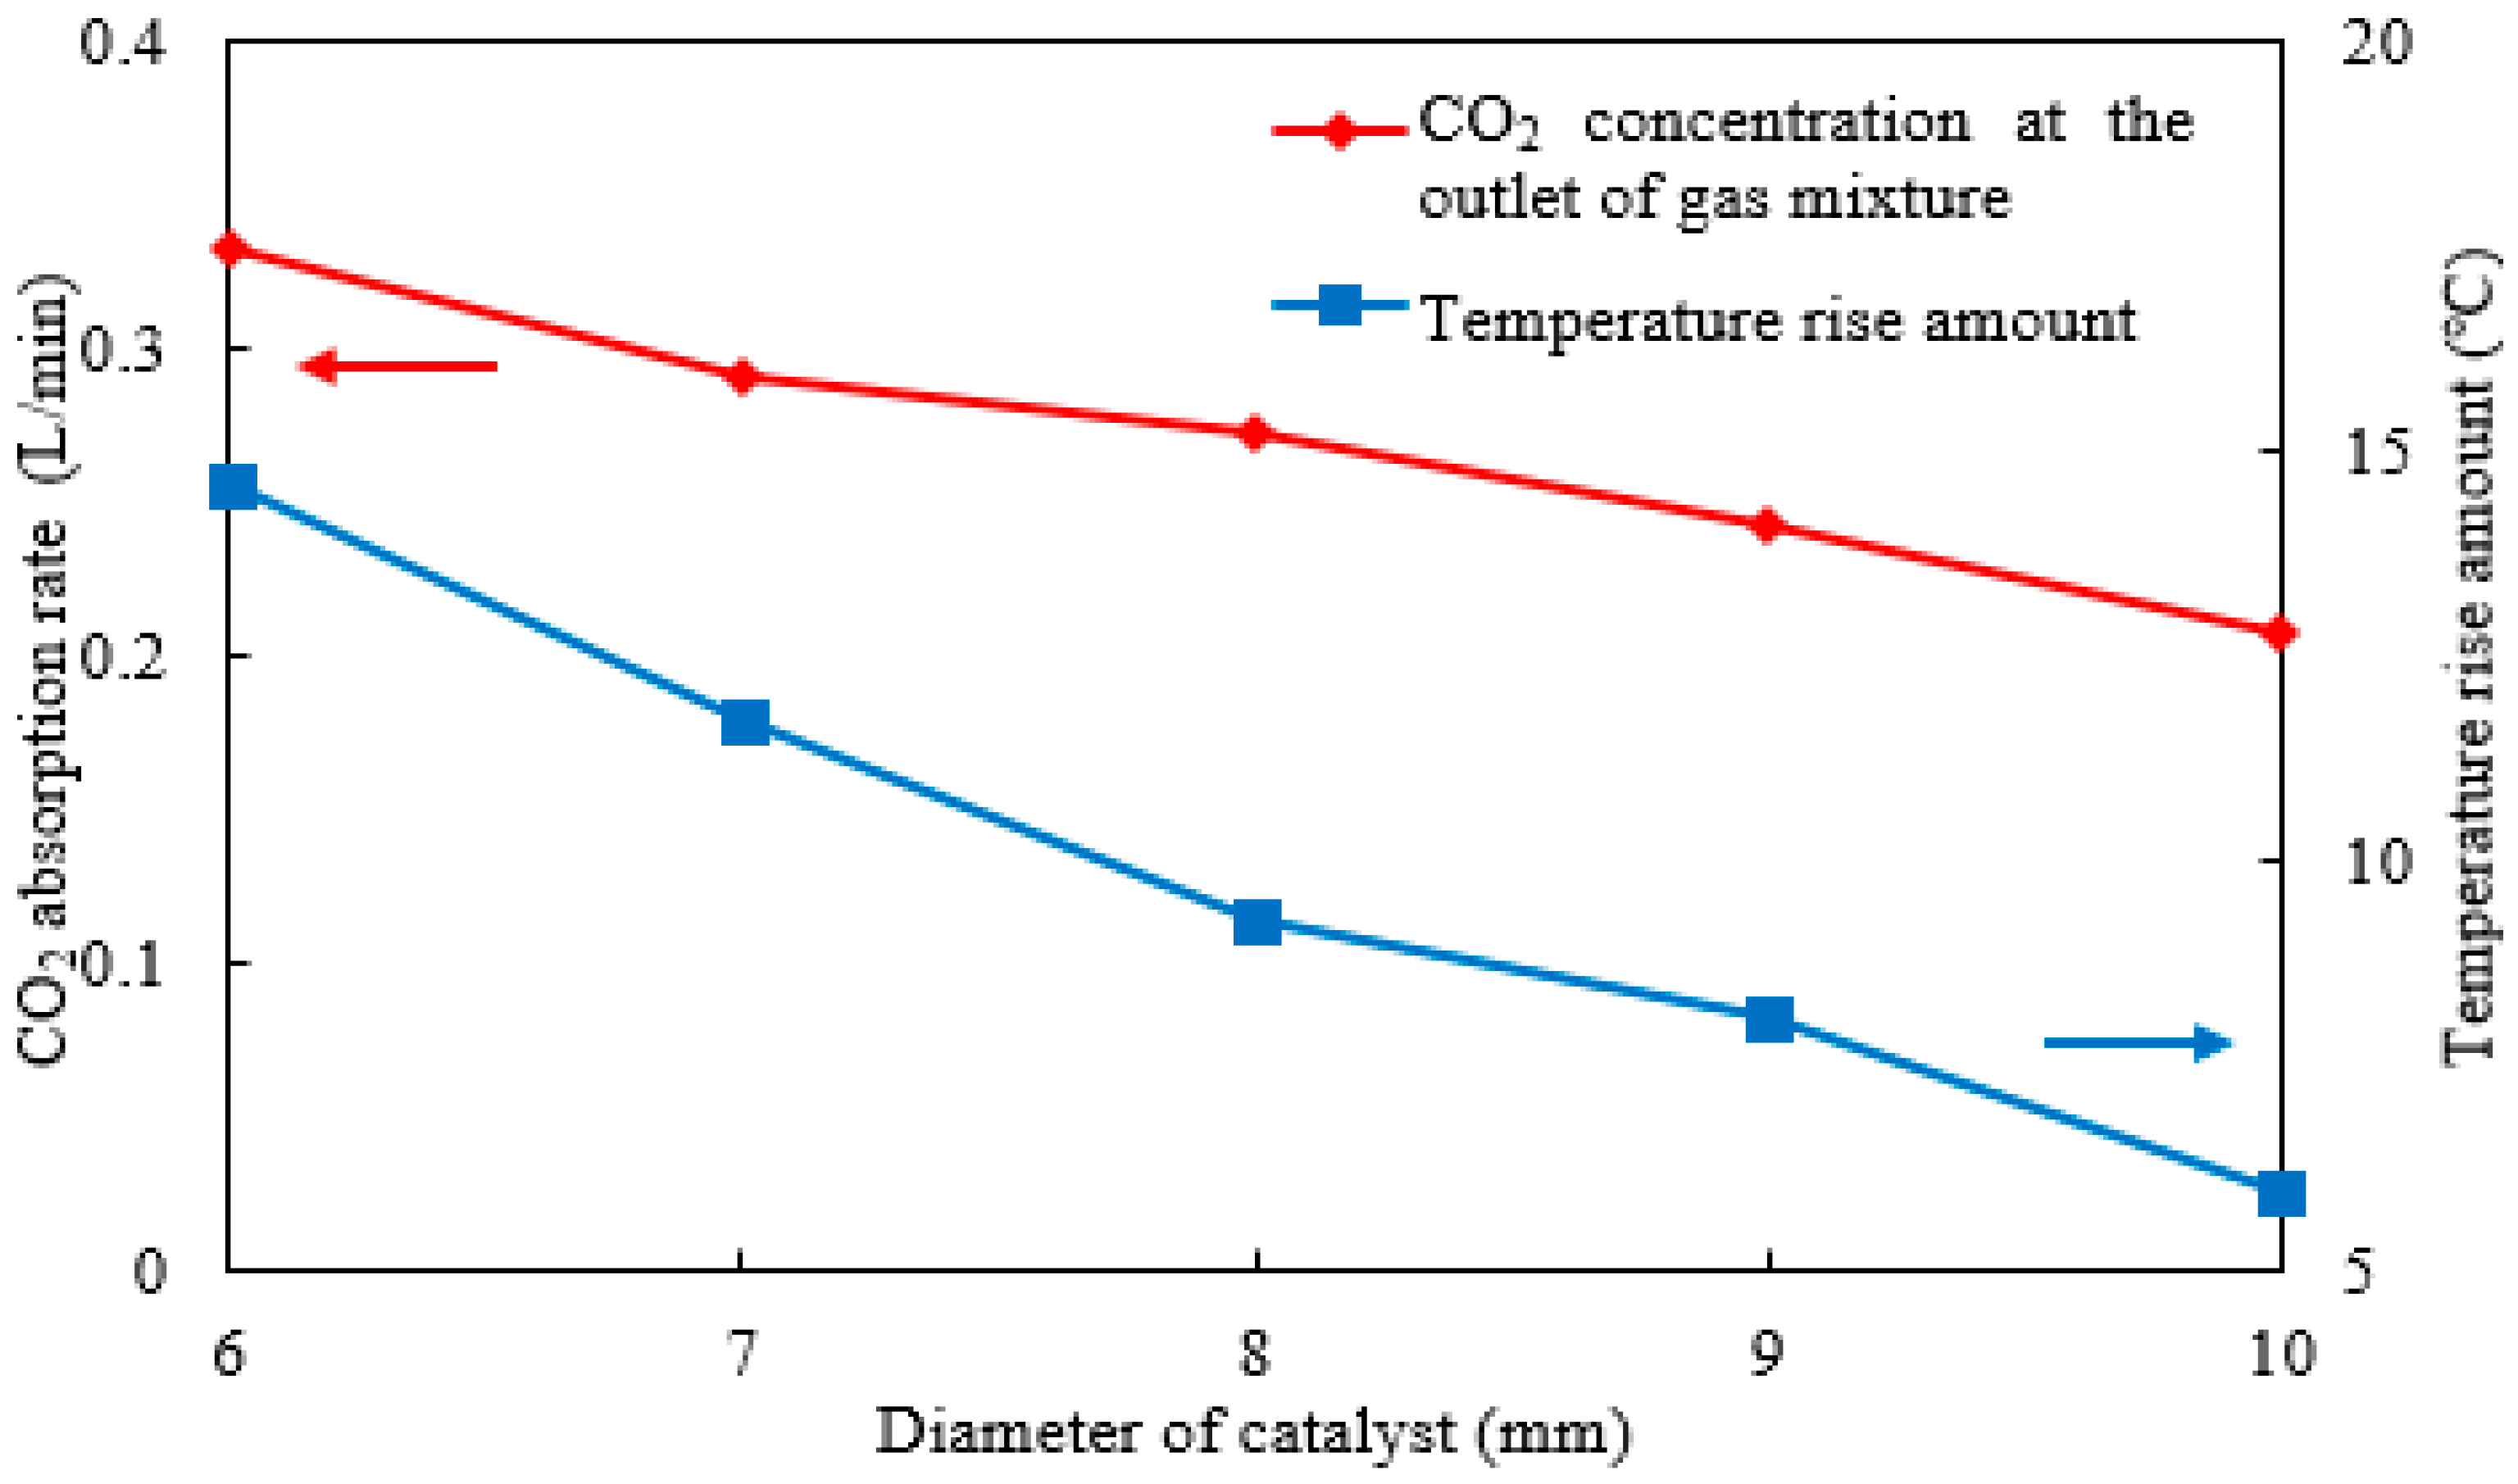
Similarly, the CO2 absorption rate and rise in temperature under different catalyst particle sizes were calculated, as shown in Figure 12. The results indicate that when the catalyst particle size increases from 6 mm to 10 mm, the CO2 absorption rate decreases from 0.34 to approximately 0.21 L/min, representing a reduction of approximately 40%. For every 1 mm increase in spherical catalyst particle size, the absorption rate decreases by about 0.03 L/min. Under the constant catalyst volume fraction, which implies a constant total catalyst mass, the increase in particle size reduces the specific surface area, thereby diminishing the contact area with the absorbent and consequently lowering the CO2 absorption capacity. Furthermore, the rise in temperature decreases from 14 °C to about 6 °C. For the absorption process, this reduction in temperature rise is favorable for the absorption reaction. In conclusion, while smaller catalyst particles should be selected to improve the CO2 absorption rate, attention must be paid to prevent flow channel blockage caused by fine particles and a potential reduction in catalytic activity due to rising temperatures.

2.7. Effect of Absorbent–Catalyst Combination

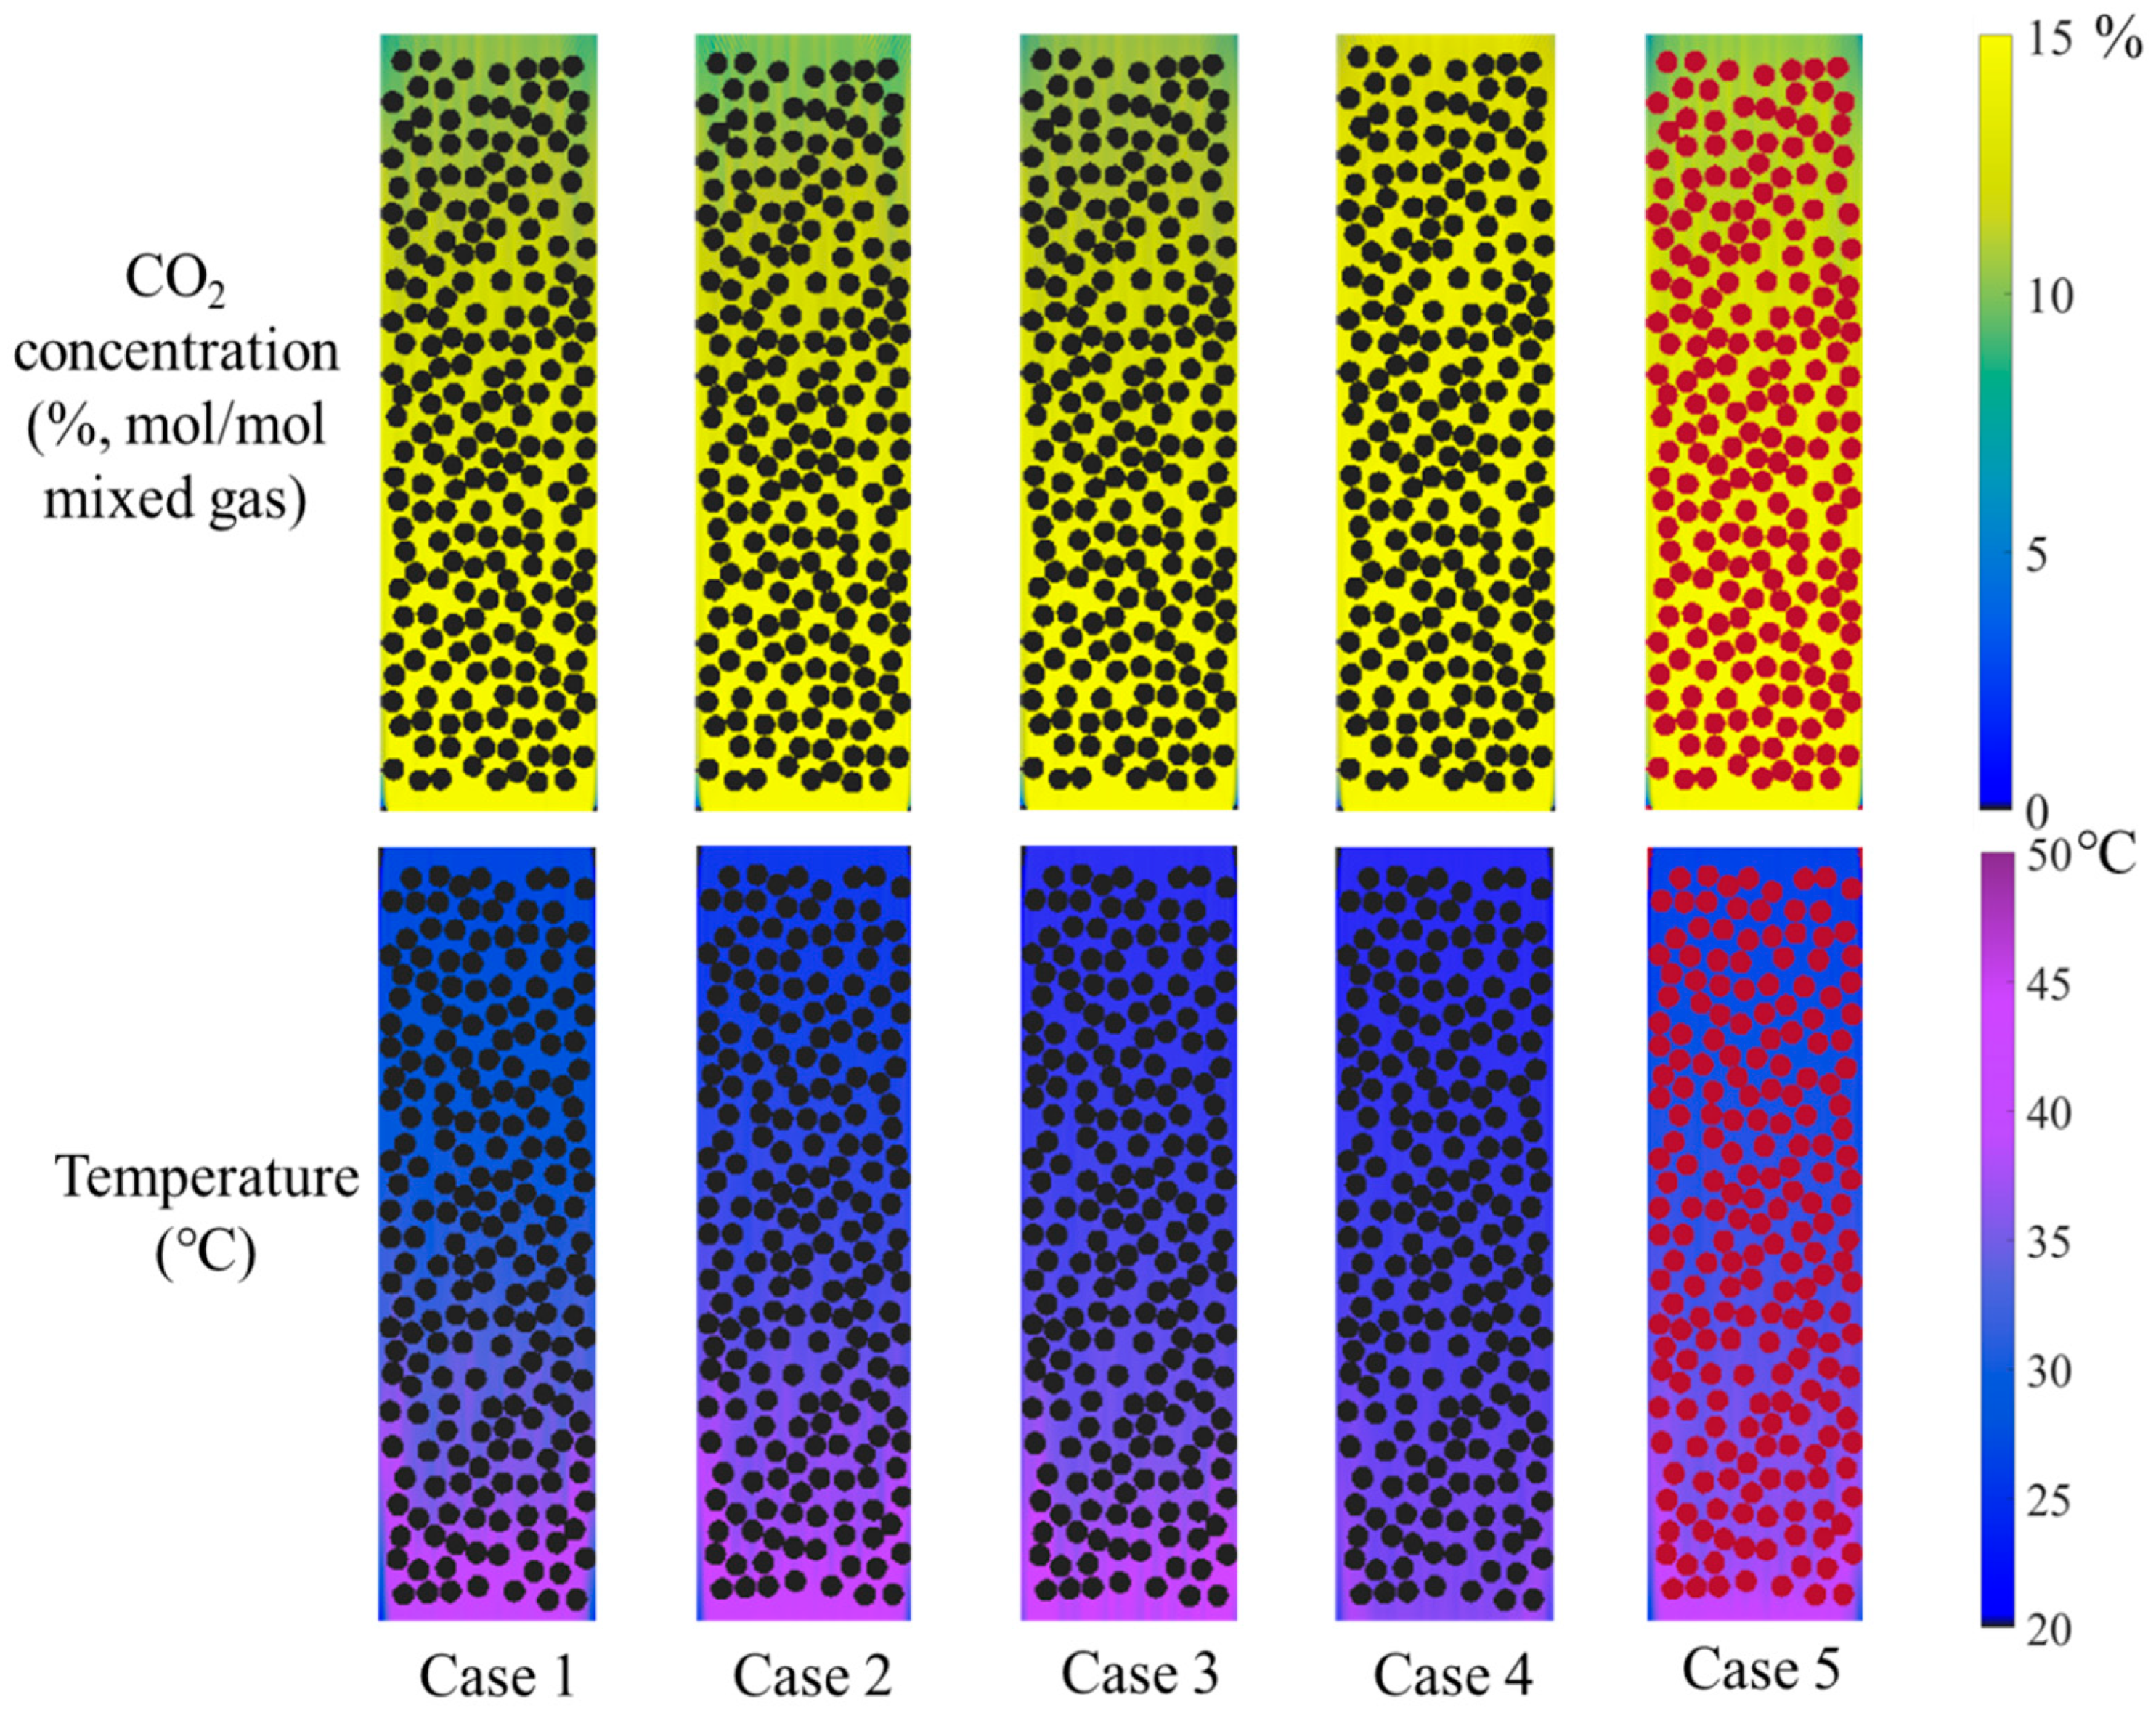
The screening of optimized catalyst–absorbent combinations has become one of the most active research directions in recent years for studying CO2 absorption–desorption processes. In this work, five different catalyst–absorbent combinations were selected based on previous experimental data [33,34,35] to investigate their catalytic absorption behavior inside the absorption column. The corresponding contour plots of parameter distributions are presented in Figure 13. These combinations included ternary amine, binary amine, and single-amine solutions with catalysts, as well as an absorbent-only case without catalysts. In the catalyst-free case, inert marbles (represented by red particles in the figure) were used to replace catalyst particles to ensure uniform flow distribution and sufficient gas-absorbent contact. The color variations in the contour plots reflect the distribution of key parameters, which correlate with the initial CO2 absorption rates of the different combinations. A detailed quantitative analysis of these trends is provided in Figure 14.
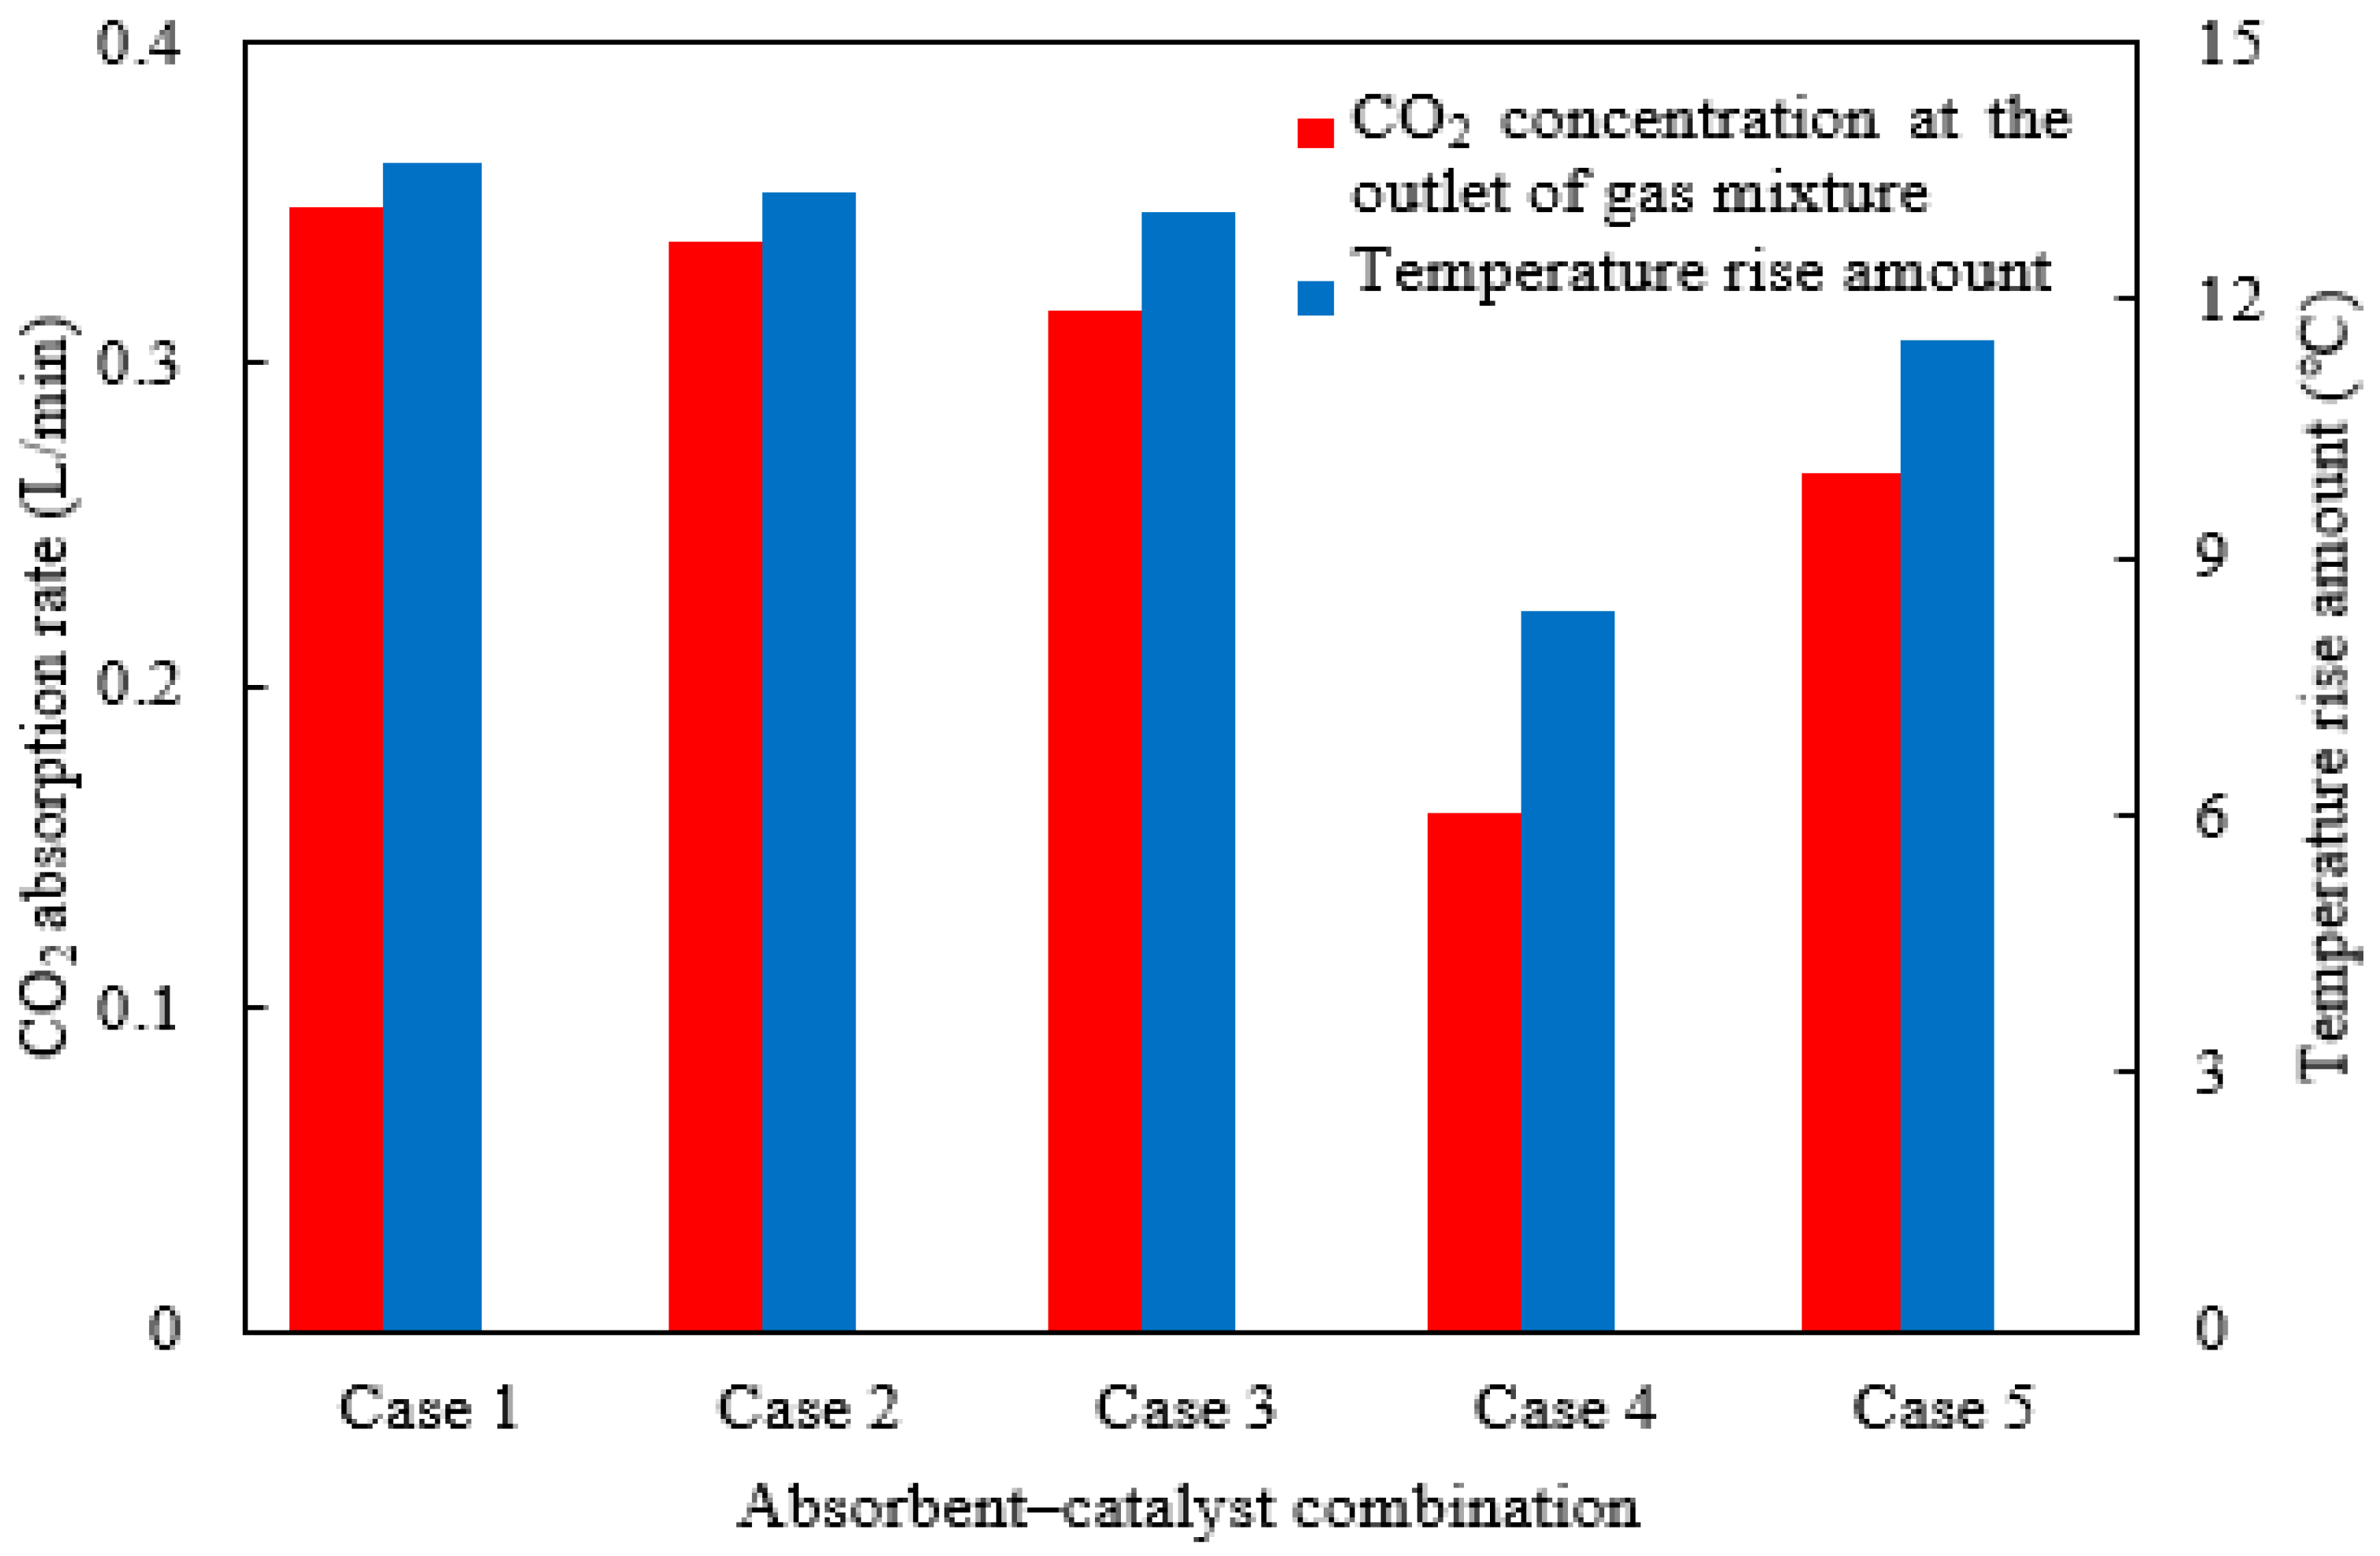
The CO2 absorption rates and the temperature rise amount for the various catalyst–absorbent combinations were shown in Figure 14. Among the two ternary amine absorbents with catalysts (Cases 1 and 2), the one with a higher initial absorption rate in experiments also had a higher CO2 absorption rate in the column, along with a greater rise in temperature. Comparing ternary, binary, and single-amine absorbents (Cases 1, 3, and 4), ternary amines exhibited the best absorption performance, while single amines performed the worst, which was consistent with batch experimental results. The rise in temperature for ternary and binary amines was also significantly higher than that of the single amines. For the same absorbent, the presence or absence of a catalyst (Case 1 vs. Case 5) had a clear influence: the catalyst-free condition led to significantly reduced absorption and a lower temperature rise. The extent of this effect also depends on the specific type of catalyst used; the highly catalyst-sensitive absorbent experienced more pronounced changes.
Established research [33] has formed a consensus on the underlying mechanisms: primary (RNH2) and secondary (R2NH) amines primarily absorb CO2 through a generally accepted mechanism where the nucleophilic nitrogen atom directly reacts with CO2 to form a stable carbamate. While this pathway offers a relatively fast absorption rate, it results in a relatively lower absorption capacity due to stoichiometric limitations. In contrast, tertiary amines (R3N), characterized by the nitrogen atom being bonded to three alkyl groups, exhibit significant steric hindrance and reduced nucleophilicity. Consequently, they are unlikely to directly form stable carbamate with CO2. Their primary role is to act as a base, catalyzing the hydration of CO2 and facilitating proton transfer during the reaction, which promotes the formation of bicarbonate. In a multi-amine system, certain components can function as a “proton shuttle” or provide “base catalysis,” thereby accelerating overall CO2 conversion.
In this simulation, the selected multi-amine system benefits from these synergistic enhancement mechanisms. Furthermore, the configuration of gas–liquid counter-current flow and the arrangement of catalysts collectively intensify these promotional effects. The combined contribution of these multiple factors explains the significantly higher CO2 absorption rate observed compared to that in a single-amine system.
Overall, among the selected combinations, the single-amine absorbent performed significantly worse than the others. The differences in parameter values among the remaining catalyst–absorbent combinations were relatively small. In general, the influence of absorbent–catalyst combination on absorption characteristics was less dominant compared to operating and design parameters such as solution flow rate, catalyst volume fraction, and particle size.

3. Model Description

3.1. Lattice Boltzmann Model

The LBM is a computational fluid dynamics (CFD) approach based on mesoscopic simulation. Compared to traditional CFD methods, LBM can handle complex boundary conditions with relatively simple algorithms and inherent parallelizability [36,37]. It is widely recognized as an effective tool for simulating fluid flow in domains with complex geometries, such as fluid flow in narrow channels within porous media [38]. In this study, the LBM is employed to simulate the distributions of absorbent solution velocity, CO2 concentration, and temperature during the catalytic absorption process within an absorption column.
The BGK model proposed by Bhatnagar et al. [39] is adopted in this study, which simplifies the collision process in the Boltzmann equation. The final discrete form of the comprehensive Boltzmann–BGK equation is as follows [40,41]:
f ( r + r , t ) = 1 τ 0 f ( r , t ) f e q ( r , t ) + δ t F ( r , t )
Equation (1) is the LBM equation. Here, f represents the probability distribution function in spatial vector r and time t. In this study, the probability distribution function f is used to calculate the macroscopic velocity distribution of the absorbent solution; the probability distribution function g is applied to calculate the CO2 concentration distribution; and the q distribution function is employed to determine the temperature distribution of the absorbent solution. Within a finite space or computational grid, the spatial directions are discretized into {f1, f2,…, fN}. τ0 represents the relaxation time, representing the time interval between two consecutive collision processes. F represents external forces or heat sources. Since external forces are not considered in the absorber system and no external heating is applied, this term can be neglected. Actually, the system can be approximately regarded as adiabatic, with no external forces acting on the fluid particles. f eq refers to the equilibrium distribution function, which can be calculated using the DnQm model (expressing m discrete velocity vectors in n -dimensional space) proposed by Qian et al. [42]. Its equation is as follows:
f e q = ρ ω 1 + e u c s 2 + ( e u ) 2 2 c s 4 u 2 2 c s 2
where ρ is the density of a certain unit cell. ω is the weight coefficient in a different direction. Cs is the local sound lattice speed, Cs = Δx/Δt, Δx is the length of the grid, and Δt is the time increment. e is the lattice vector index in a different direction and u is the macroscopic velocity. The D2Q9 model is adopted in this study, which utilizes 9 discrete velocity directions in a 2-dimensional space. D2Q9 more accurately captures realistic fluid flow behavior than lower-order models, offering higher stability and accuracy. Relative to high-accuracy models, D2Q9 significantly outperforms in computational efficiency while providing sufficient precision for the present study. Moreover, three-dimensional simulations incur substantially greater computational cost than their two-dimensional counterparts. Therefore, after comprehensive consideration, the D2Q9 model was selected for this study. The parameters for each direction can be calculated as follows:
e i = ( 0 , 0 ) i = 0 ( cos ( i 1 ) π / 2 , sin ( i 1 ) π / 2 ) i = 1...4 2 ( cos ( i 1 ) π / 2 + π / 4 , sin ( i 1 ) π / 2 + π / 4 ) i = 5...8
ω i = 4 / 9 i = 0 1 / 9 i = 1...4 1 / 36 i = 5...8
The equation for calculating the macroscopic velocity u in the flow field is as follows:
u = 1 ρ i = 0 8 f i e i
In practice, the velocity is typically expressed in component form, and the component velocities are then combined to yield the resultant velocity:
u x = 1 ρ i = 0 8 f i e i , x
u y = 1 ρ i = 0 8 f i e i , y
u = u x 2 + u y 2
Additionally, the formula for calculating density is given by the following:
ρ = i = 0 8 f i
As mentioned earlier, the probability distribution function g is used to calculate the CO2 concentration distribution during the absorption process. Thus, the calculation formula for the concentration C is as follows:
C = i = 0 8 g i
The probability distribution function q is used to calculate the temperature during the absorption reaction, and the calculation formula for the temperature T is as follows:
T = i = 0 8 q i
Furthermore, boundary conditions are crucial for solving most physical problems. While the distribution functions of fluid particles in the interior are determined by collision and streaming processes, a portion of the distribution functions at boundary particles remains unknown and must be constrained through boundary settings. In this study, the boundary conditions that need to be addressed include (1) wall boundary conditions (primarily applied to the sidewalls of the two-dimensional absorption column model), (2) periodic or continuous boundary conditions (mainly applied to the inlet and outlet positions of the two-dimensional absorption column model), and (3) obstacle boundary conditions (mainly deal with the boundary where the fluid comes into contact with the inert marbles and catalyst particles) [43].
When the fluid collides with the wall boundary of the absorption column, catalyst particles, and inert glass beads, its speed remains unchanged while its direction reverses. This represents the common bounce-back boundary condition in LBM, which in the D2Q9 model can be expressed as follows:
f 2 , 5 , 6 ( i , 1 ) = f 4 , 7 , 8 ( i , 1 )
A continuous boundary condition is employed at the inlet of the absorption column, which depends on the preset initial inlet parameters, while a periodic boundary condition is applied at the outlet:
f 1 , 5 , 8 ( N x , j ) = f 1 , 5 , 8 ( 0 , j )
f 3 , 6 , 7 ( N x ,   j ) = f 3 , 6 , 7 ( N x + 1 ,   j )
The relationship between the boundary conditions and the D2Q9 model is depicted schematically in Figure 15. Furthermore, for the probability distribution functions g and q used in CO2 concentration and temperature calculations, their variations at the wall, inlet, and outlet boundaries follow the same trend as the velocity changes. Therefore, the boundary conditions for these are consistent with those applied in the velocity computation.
When a fluid particle moving through the flow field encounters an obstacle, the bounce-back boundary condition is applied to its velocity:
f i * ( x b , t + Δ t ) = f i ( x b , t )
where f * and f represent the probability distribution functions of macroscopic velocity before and after collision, respectively, and x b is the position at the boundary.
Concurrently, changes in CO2 concentration and solution temperature occur synchronously. An attenuation/increment model is applied to calculate these variations in concentration and temperature. When a fluid particle collides with the surface of a catalyst particle, the CO2 concentration is attenuated while the fluid temperature increases because of exothermic absorption reactions. The corresponding probability distribution functions exhibit the following changes:
g i * ( x b , t + Δ t ) = g i ( x b , t ) * γ
q i * ( x b , t + Δ t ) = q i ( x b , t ) * κ
Here, g*, q*, g′, and q′ represent the probability distribution functions for concentration and temperature before and after collision with the catalyst surface, respectively. Additionally, coefficients γ and κ are introduced to calculate the attenuation and increment degree, which depend on the CO2 absorption reaction rate and the heat released upon contact between the absorbent and the catalyst. Their specific values are obtained from the literature for different absorbent–catalyst combinations [33].
Assuming an excess of amine in the absorber, the initial CO2 absorption rate obtained from batch experiments with the same amine formulation is used to derive the catalytic reaction rate or CO2 consumption rate, and this rate remains constant within the absorption column within the temperature range of the catalyst [2]. Assuming the initial CO2 catalytic absorption rate is α mol CO2/L·min and the volume represented by a single lattice unit of length Δx is Δv, the amount of CO2 consumed in a lattice unit over a time step, Δt, is (Δv·Δt·α) mol. This study uses the volumetric percentage of CO2 in the gas mixture as the target macroscopic parameter. Based on the initial conditions, assuming the total gas mixture flow rate entering the absorber is w L/min with a CO2 fraction of 15%, the total moles of CO2 over time Δt are (0.15·w·Δt)/22.4. The ratio (Δv·Δt·α)/(0.15·w·Δt/22.4) = (22.4·Δv·α)/(0.15·w) thus gives the fractional change γ in CO2 concentration percentage per lattice unit after each LBM collision step. Finally, through the micro–macro linkage in the LBM, the changes in microscopic probability distribution functions are reflected onto the local macroscopic CO2 concentration variations after contact with catalyst particles.
Similarly, assuming the initial CO2 catalytic absorption rate of α mol CO2/L·min corresponds to a heat release or temperature increase in β °C/L·min, the temperature rise in a lattice unit over time step Δt is (Δv·Δt·β) °C. With an initial temperature, T0, the ratio (Δv·Δt·β)/T0 gives the fractional change κ in temperature per lattice unit after each LBM collision step. Through the micro–macro linkage in the LBM, the changes in microscopic probability distribution functions are reflected onto the local macroscopic solution temperature variations after contact with catalyst particles.
Furthermore, even in the absence of contact with the catalyst, the absorbent continues to react with CO2 and release heat. Thus, the coefficients γ1 and κ1 are used to represent the corresponding attenuation and increment coefficients, and their respective probability distribution functions exhibit the following changes:
g o u t ( x b , t + Δ t ) = g i n ( x b , t ) * γ 1
q o u t ( x b , t + Δ t ) = q i n ( x b , t ) * κ 1
where gout, qout, gin, and qin represent the probability distribution functions for concentration and temperature before and after the collision step during normal flow (without catalyst contact), respectively.
The residual equations for the velocity, temperature, and concentration parameters (Equations (20)–(23)) were adopted as detailed convergence criteria. Convergence was considered achieved when all residuals fell below 10−7, at which point the solution was deemed stable.
E r r o r u = i , j u x ( i , j , t + Δ t ) u x ( i , j , t ) 2 + u y ( i , j , t + Δ t ) u y ( i , j , t ) 2 x [ u x ( i , j , t + Δ t ) 2 + u y ( i , j , t + Δ t ) 2 ]
E r r o r T = i , j T ( i , j , t + Δ t ) T ( i , j , t ) 2 x [ T ( i , j , t + Δ t ) 2 ]
E r r o r C = i , j C ( i , j , t + Δ t ) C ( i , j , t ) 2 i , j [ C ( i , j , t + Δ t ) 2 ]
E r r o r = M a x { E r r o r u , E r r o r T , E r r o r C } 10 7

3.2. Simulation Conditions

This study performs a numerical simulation of CO2 catalytic absorption based on the packing absorbing column within a continuous CO2 absorption–desorption process [33]. The column has a height of 1.2 m and an inner diameter of 0.05 m, with a schematic diagram of the structural model shown in Figure 2a. The lean-amine solution is fed into the top of the column, while the rich-amine solution exits from the bottom. The mixture gas enters from the lower end, flowing counter-currently to the liquid solution. The column is packed with inert marbles and catalyst particles to disperse the absorbent solution and enhance CO2 absorption. To account for the effects of catalyst porosity, catalyst particles would need to be treated as porous structures, which would considerably increase modeling complexity. Alternatively, introducing a porosity correction factor would require incorporating parameters such as porosity, specific surface area, and fluid diffusion coefficients, significantly complicating the current model. Therefore, both the inert marbles and the baseline catalyst particles have a diameter of 6 mm, and it is assumed that they are approximately spherical and the internal pores are not considered. The inert marbles and the catalyst particles are dispersing fillers, which account for approximately 50% of the total volume of the entire column.
Given that the typical CO2 concentration in post-combustion flue gas from coal-fired power plants ranges between 10% and 15%, the feed gas mixture in this study was set consistent with the literature [33], comprising 85% N2 and 15% CO2, with a total flow rate of 7 L/min. The simulation assumed an excess of amine; therefore, the initial CO2 absorption rate obtained from some batch experimental data in the literature was adopted as the CO2 consumption rate in this model. Furthermore, the lean-amine solution inlet temperature was set to 25 °C (ambient temperature), and the wall surface was under adiabatic conditions. A temperature rise coefficient, as shown in Equations (17) and (19), was incorporated during the simulation, which depended on the baseline reaction heating and catalytic reaction heating rates derived from previous studies. The model parameters are summarized in Table 2. In order to investigate the influence of different operating conditions, control groups were established by varying specific parameters while keeping other baseline conditions unchanged. To enhance computational efficiency and amplify the distribution of characteristic parameters in localized regions, the control groups were simulated solely within a 200 mm catalyst segment. This approach is justified as the fluid achieved uniform dispersion and the flow field essentially stabilized after passing through the extended section of inert marbles. These include absorbent flow rate, catalyst volume fraction, particle size, and different absorbent–catalyst combinations. Based on the absorption column dimensions and the catalyst placement area of the pilot-scale absorption column [33], a full-length simulation domain with a projected size of 1.2 × 0.05 m was discretized using a 2D-grid of 2400 × 120. To improve computational efficiency and better amplify the distribution of macroscopic parameters in local regions, a 200 mm catalytic segment was separately simulated with the same width, corresponding to a grid size of 400 × 120. All grid configurations were subsequently verified for grid independence. The specific parameters in the basic operation conditions and the control group operation conditions are shown in Table 3. It is noteworthy that when setting control groups for particle size variation, the total volume fraction was maintained to be constant. Conversely, for control groups examining changes in volume fraction, the reduced volume was filled with inert marbles to ensure uniform dispersion of solid particles within the column. The data for these catalyst–absorbent combinations were sourced from various studies, as listed in Table 4. As described previously, the initial CO2 absorption rate obtained from batch experiments was adopted to represent its concentration consumption rate in the absorption column. Five absorbent–catalyst combinations were selected for comparison: two ternary blended amines (Cases 1 and 2), one binary blended amine (Case 3), one single-amine absorbent (Case 5), and one catalyst-free absorbent (Case 4).

3.3. Simulation Methods

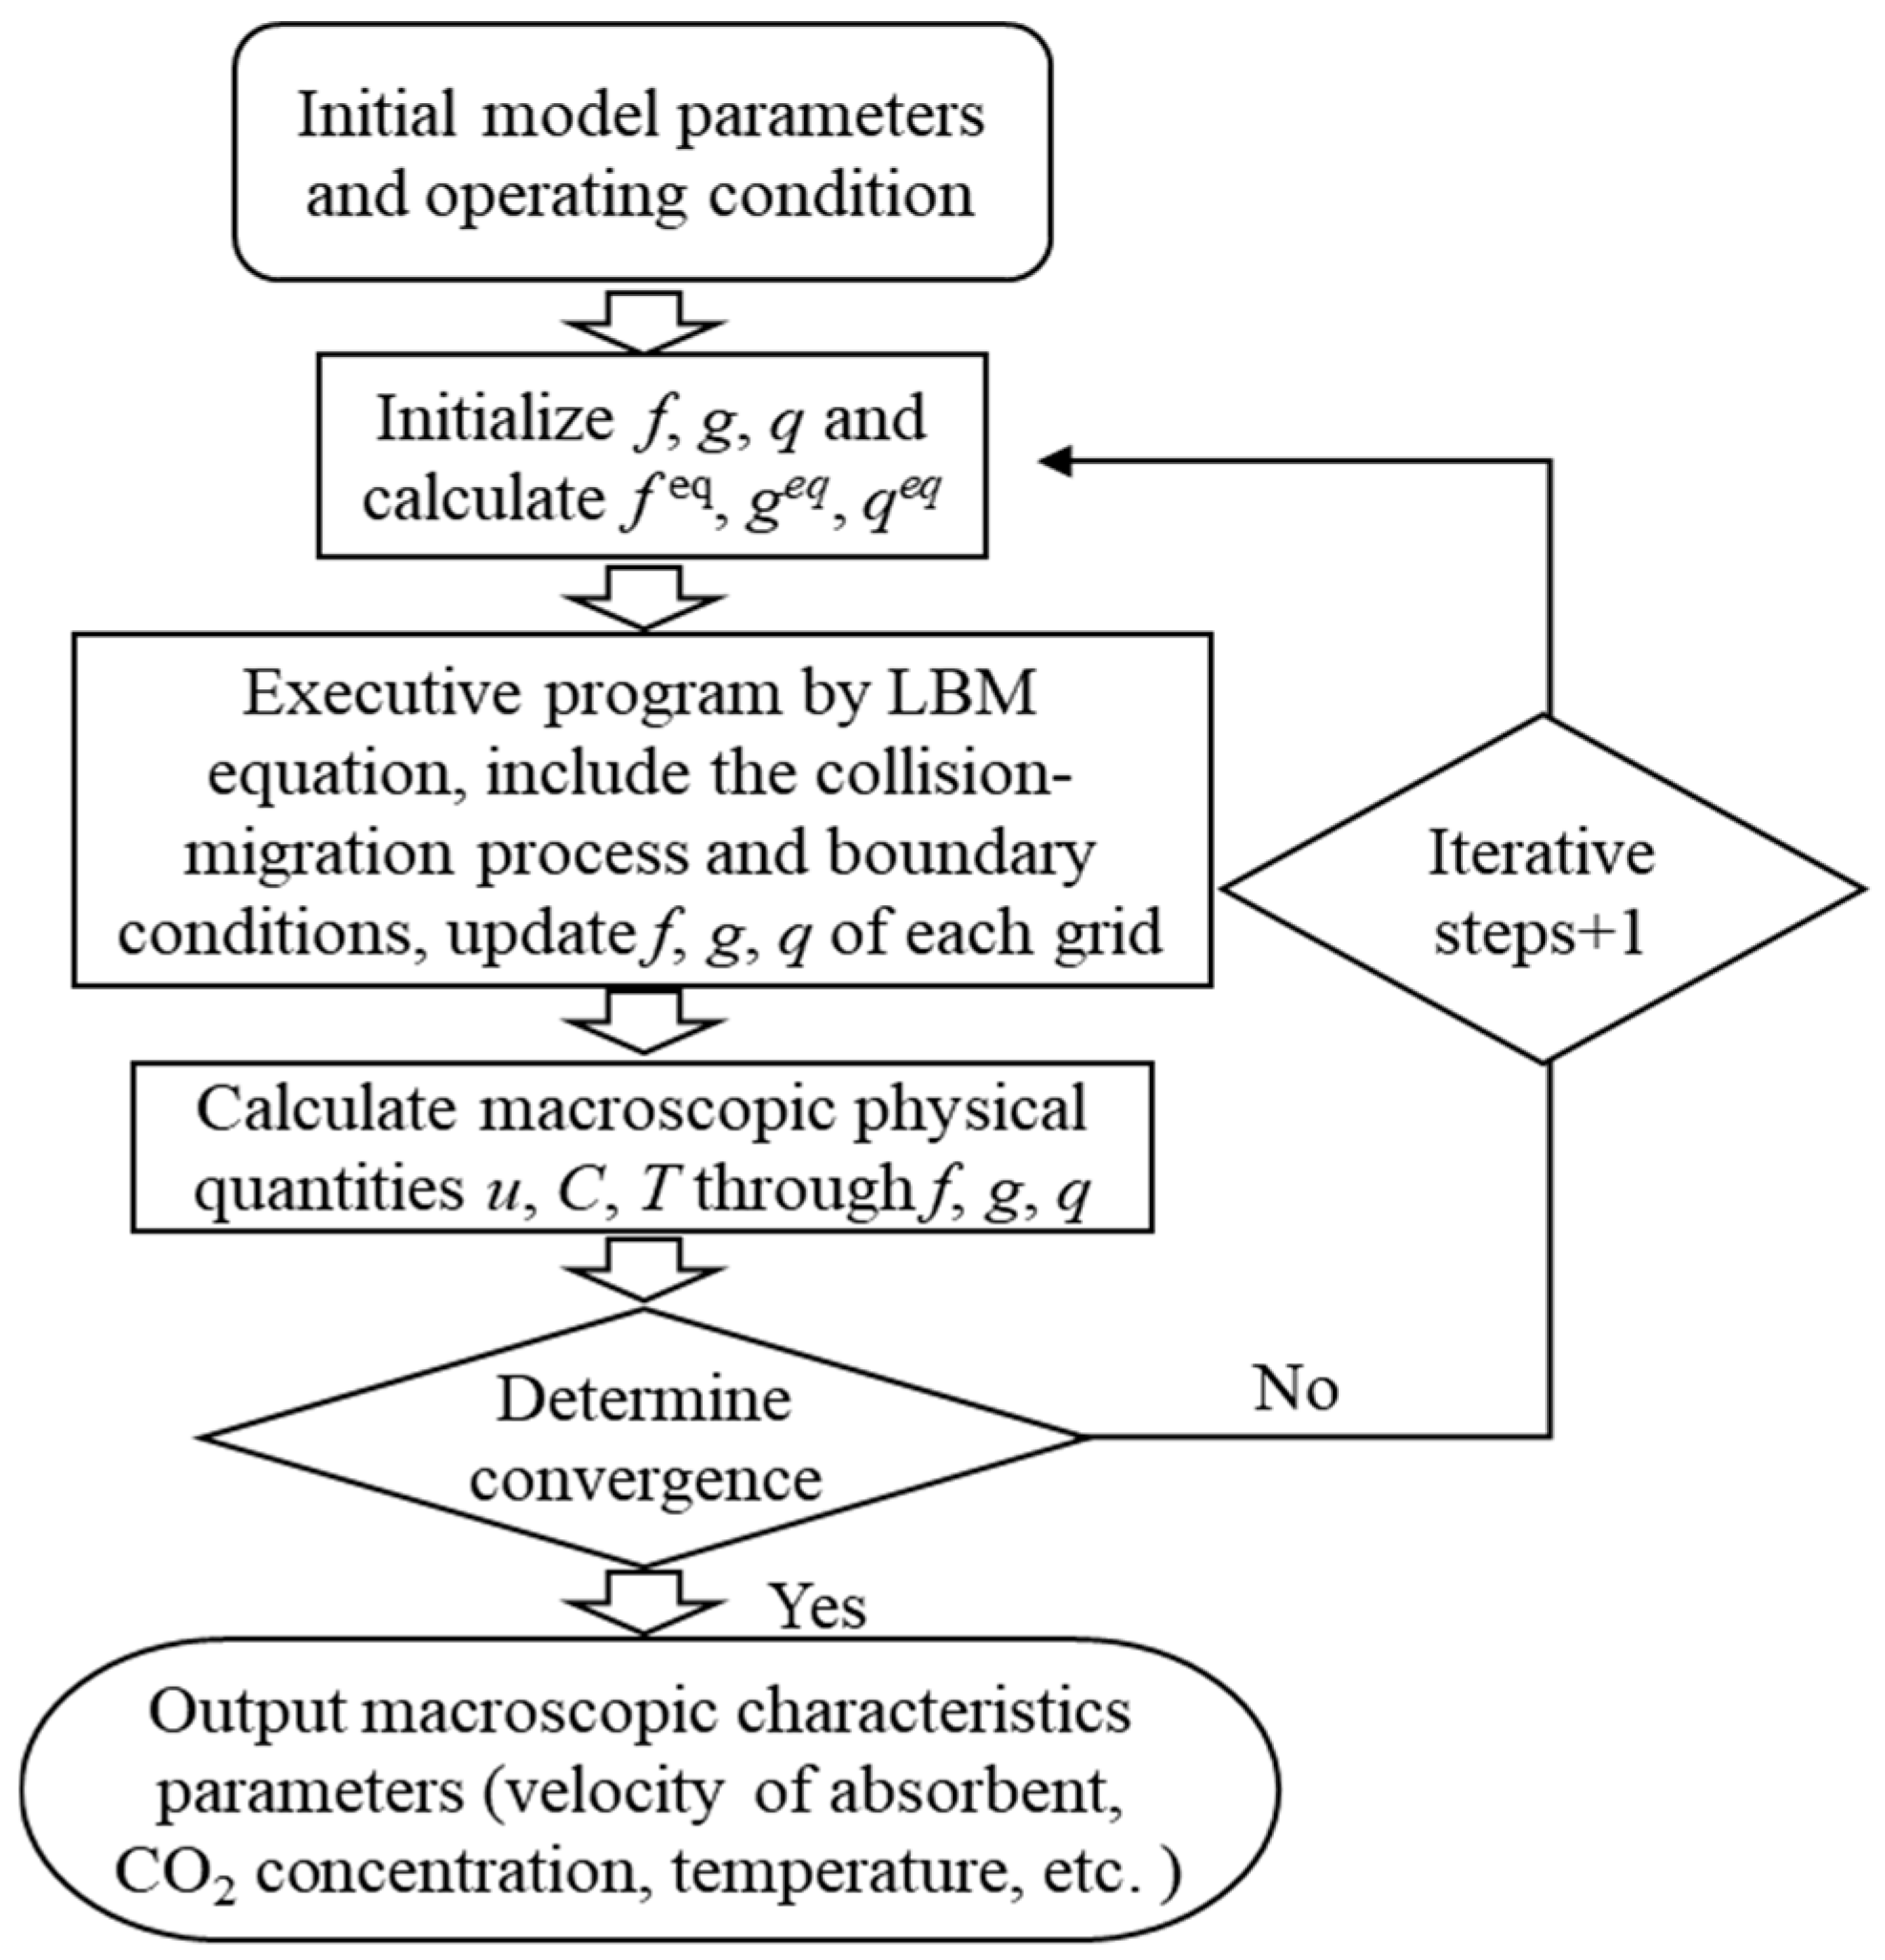
The numerical simulation of the CO2 absorption process in this study was established within the LBM framework. The flow of the absorbent solution, the CO2 absorption reaction, and the coupled heat transfer were simulated within the complex narrow channels of an absorption column packed with fine particles. The computational procedure is illustrated in Figure 16. Following the configuration of model parameters and initial operating conditions, the computational domain was discretized into a mesh, and the probability distribution functions (f, g, h) were initialized along with the calculation of their equilibrium distribution functions (feq, geq, qeq). The LBM equations were then solved by executing the collision-migration steps, updating the values of f, g, and h for each grid. Subsequently, we handled the boundary conditions equations, including those for walls, inlets/outlets, and obstacle particles, followed by another update of the f, g, and h values. The updated values of f, g, and h were used to calculate macroscopic physical quantities such as absorbent velocity, CO2 concentration, and temperature. The error between two consecutive computational results was checked against the convergence criterion. If the error exceeded the specified tolerance, the process returned to the second step for further iteration; if the error fell below the threshold, the solution was considered converged, and final characteristic parameters were output, which included absorbent velocity distribution, CO2 concentration distribution, and temperature distribution. The calculation program based on the LBM was implemented using Matlab R2024a software.

4. Conclusions

The numerical simulation of the CO2 absorption process in an absorption column of a continuous pilot-scale CO2 absorption–desorption system was established by the LBM. The simulation results included distributions of solution flow velocity, temperature, and CO2 concentration of the gas mixture within the column. Moreover, the effects of various factors were investigated, including the absorbent solution flow rate, catalyst volume fraction, particle size, and different absorbent–catalyst combinations. The simulation results for all lengths of the absorption column align well with experimental data from a continuous pilot-scale setup. The results for 200 mm catalyst section indicate that, for every 1 cm/s increase in absorbent flow rate, the CO2 absorption rate decreases by approximately 9 L/min. When the catalyst volume fraction increases from 30% to 50%, the CO2 absorption rate increases by 50%. For every 1 mm increase in spherical catalyst particle size, the absorption rate decreases by about 0.03 L/min. These results are valid only under the current absorbent formulation and the condition of uniformly dispersed spherical catalyst particles. Ensuring that catalyst activity and a sufficient cyclic loading capacity are maintained, the absorbent solution flow rate is minimized, and catalyst size is small and catalysts are in sufficient quantity will ensure optimal CO2 absorption efficiency.
Additionally, an optimized ternary amine–catalyst combination should be selected instead of a single amine to achieve superior CO2 absorption capacity. However, research on the catalytic absorption process of carbon dioxide is still far from sufficient. Future studies may investigate catalysts of different shapes or further explore the influence of internal pore structures within catalysts.

Author Contributions

Conceptualization, B.Z., N.S. and J.J.; methodology, M.L.; software, N.S.; validation, B.Z. and H.S.; formal analysis, M.L.; investigation, B.Z. and N.S.; resources, H.S.; data curation, N.S.; writing—original draft preparation, B.Z. and N.S.; writing—review and editing, B.Z.; visualization, B.Z.; supervision, Q.W.; project administration, Q.W.; funding acquisition, J.J. and B.Z. All authors have read and agreed to the published version of the manuscript.

Funding

This study was supported by the National Nature Science Fund of China (NSFC 22208216) and the Shanghai Committee of Science and Technology (No. 23010503500).

Data Availability Statement

No new data were created or analyzed in this study. Data sharing is not applicable to this article.

Conflicts of Interest

The authors declare no conflicts of interest.

Nomenclature

CCO2 concentration (mol/L)
csThe local sound lattice speed
eThe lattice vector
αInitial catalytic absorption efficiency (mol CO2/L·min)
βHeat release or temperature increase(°C/L·min)
fProbability distribution function
FExternal forces or heat sources
feqThe equilibrium distribution function
fProbability distribution functions after collision
f* Probability distribution functions before collision
gProbability distribution function
ginProbability distribution function before collision step during normal flow
goutProbability distribution function after collision step during normal flow
gProbability distribution function after collision
g*Probability distribution function before collision
iThe ith direction in D2Q9 model
NLength of the calculation domain
qProbability distribution function
qinProbability distribution function before collision step during normal flow
qoutProbability distribution function after collision step during normal flow
qProbability distribution function after collision
q*Probability distribution function before collision
rThe spatial vector
tTime (s)
TTemperature (°C)
uThe macroscopic velocity (m/s)
uxThe macroscopic velocity in x direction (m/s)
uyThe macroscopic velocity in y direction (m/s)
xbThe grid positions at the boundary
ΔxThe length of the grid (m)
ΔtThe time increment (s)
τ0The relaxation time (s)
ρDensity (kg/m3)
ωThe weight coefficient
κIncrement coefficient with catalytic absorption
κ1Increment coefficient with non-catalytic absorption
γAttenuation coefficient with catalytic absorption
γ1Attenuation coefficient with non-catalytic absorption

References

  1. Li, Y.; Chen, Z.; Yuan, B.; Xing, L.; Zhan, G.; Peng, Y.; Wang, L.; Li, J. Synergistic promotion for CO2 absorption and solvent regeneration by fine waste red mud particles on in amine-based carbon capture: Performance and mechanism. Sep. Purif. Technol. 2023, 304, 122380. [Google Scholar] [CrossRef]
  2. Rochelle, G.T. Amine Scrubbing for CO2 Capture. Science 2009, 325, 1652–1654. [Google Scholar] [CrossRef]
  3. Zhang, R.; Liu, R.; Barzagli, F.; Sanku, M.G.; Li, C.; Xiao, M. CO2 absorption in blended amine solvent: Speciation, equilibrium solubility and excessive property. Chem. Eng. J. 2023, 466, 143279. [Google Scholar] [CrossRef]
  4. Akhdhar, A.; Al-Bogami, A.S.; Akhtar, N.; El-Said, W.A. Progress in Post-Combustion Carbon Dioxide Capture, Direct Air Capture, and Utilization. Catalysts 2025, 15, 807. [Google Scholar] [CrossRef]
  5. Cao, K.; Cao, K.; Abdillah, O.; Septiani, E.; Hirano, T.; Nguyen, N.; Ogi, T. Correlation between pore characteristics and high-performance carbon dioxide capture of sustainable porous carbon derived from kraft lignin and potassium carbonate. Energy Fuels 2025, 39, 6372–6387. [Google Scholar] [CrossRef]
  6. Bernhardsen, I.M.; Knuutila, H.K. A review of potential amine solvents for CO2 absorption process: Absorption capacity, cyclic capacity and pKa. Int. J. Greenh. Gas Control 2017, 61, 27–48. [Google Scholar] [CrossRef]
  7. Li, Y.; Chen, Z.; Zhan, G.; Yuan, B.; Wang, L.; Li, J. Inducing efficient proton transfer through Fe/Ni@COF to promote aminebased solvent regeneration for achieving low-cost capture of CO2 from industrial flue gas. Sep. Purif. Technol. 2022, 298, 121676. [Google Scholar] [CrossRef]
  8. Sakwattanapong, R.; Aroonwilas, A.; Veawab, A. Behavior of Reboiler heat duty for CO2 capture plants using regenerable single and blended alkanolamines. Ind. Eng. Chem. Res. 2005, 44, 4465–4473. [Google Scholar] [CrossRef]
  9. Li, T.; Keener, T.C. A review: Desorption of CO2 from rich solutions in chemical absorption processes. Int. J. Greenh. Gas Control 2016, 51, 290–304. [Google Scholar]
  10. Liang, Z.; Fu, K.; Idem, R.; Tontiwachwuthikul, P. Review on current advances, future challenges and consideration issues for post-combustion CO2 capture using amine-based absorbents. Chin. J. Chem. Eng. 2016, 24, 278–288. [Google Scholar] [CrossRef]
  11. Liang, Z.; Rongwong, W.; Liu, H.; Fu, K.; Gao, H.; Cao, F.; Zhang, R.; Sema, T.; Henni, A.; Sumon, K. Recent progress and new developments in post-combustion carbon-capture technology with amine based solvents. Int. J. Greenh. Gas Control 2015, 40, 26–54. [Google Scholar] [CrossRef]
  12. Nwaoha, C.; Supap, T.; Idem, R.; Tontiwachwuthikul, P.; Al-Marri, M.J.; Benamor, A. Regeneration energy analysis of aqueous tri-solvent blends containing AMP, MDEA and DETA for CO2 capture. Energy Procedia 2017, 114, 2039–2046. [Google Scholar]
  13. Zhang, R.; Zhang, X.; Yang, Q.; Yu, H.; Liang, Z.; Luo, X. Analysis of the reduction of energy cost by using MEA-MDEA-PZ solvent for post-combustion CO2 capture (PCC). Appl. Energy 2017, 205, 1002–1011. [Google Scholar]
  14. Zhang, X.; Liu, H.; Liang, Z.; Idem, R.; Tontiwachwuthikul, P.; Al-Marri, M.J.; Benamor, A. Reducing energy consumption of CO2 desorption in CO2-loaded aqueous amine solution using Al2O3/HZSM-5 bifunctional catalysts. Appl. Energy 2018, 229, 562–576. [Google Scholar] [CrossRef]
  15. Alivand, M.S.; Mazaheri, O.; Wu, Y.; Stevens, G.W.; Scholes, C.A.; Mumford, K.A. Catalytic Solvent Regeneration for Ener-gyEfficient CO2 Capture. ACS Sustain. Chem. Eng. 2020, 8, 18755–18788. [Google Scholar]
  16. Zhang, X.; Zhang, R.; Liu, H.; Gao, H.; Liang, Z. Evaluating CO2 desorption performance in CO2-loaded aqueous tri-solvent blend amines with and without solid acid catalysts. Appl. Energy 2018, 218, 417–429. [Google Scholar] [CrossRef]
  17. Zhang, X.; Huang, Y.; Gao, H.; Luo, X.; Liang, Z.; Tontiwachwuthikul, P. Zeolite catalyst-aided tri-solvent blend amine regeneration: An alternative pathway to reduce the energy consumption in amine-based CO2 capture process. Appl. Energy 2019, 240, 827–841. [Google Scholar] [CrossRef]
  18. Shi, H.; Cui, M.; Fu, J.; Dai, W.; Huang, M.; Han, J.; Quan, L.; Tontiwachwuthikul, P.; Liang, Z. Application of “coordinative ef-fect” into tri-solvent MEA+BEA+AMP blends at concentrations of 0.1 + 2 + 2∼0.5 + 2 + 2 mol/L with absorption, desorption and mass transfer analyses. Int. J. Greenh. Gas Control 2021, 107, 103267. [Google Scholar]
  19. Muchan, P.; Saiwan, C.; Narku-Tetteh, J.; Idem, R.; Supap, T.; Tontiwachwuthikul, P. Screening tests of aqueous alkanolamine solutions based on primary, secondary, and tertiary structure for blended aqueous amine solution selection in post com-bustion CO2 capture. Chem. Eng. Sci. 2017, 170, 574–582. [Google Scholar] [CrossRef]
  20. Srisang, W.; Pouryousefi, F.; Osei, P.A.; Decardi-Nelson, B.; Akachuku, A.; Tontiwachwuthikul, P.; Idem, R. Evaluation of the heat duty of catalyst-aided amine-based post combustion CO2 capture. Chem. Eng. Sci. 2017, 170, 48–57. [Google Scholar] [CrossRef]
  21. Srisang, W.; Pouryousefi, F.; Osei, P.A.; Decardi-Nelson, B.; Akachuku, A.; Tontiwachwuthikul, P.; Idem, R. CO2 capture efficiency and heat duty of solid acid catalyst-aided CO2 desorption using blends of primary-tertiary amines. Int. J. Greenhouse Gas Control 2018, 69, 52–59. [Google Scholar] [CrossRef]
  22. Natewong, P.; Prasongthum, N.; Reubroycharoen, P.; Idem, R. Evaluating the CO2 Capture Performance Using a BEA-AMP Biblend Amine Solvent with Novel High-Performing Absorber and Desorber Catalysts in a Bench-Scale CO2 Capture Pilot Plant. Energ. Fuel 2019, 33, 3390–3402. [Google Scholar] [CrossRef]
  23. Afari, D.; Coker, J.; Narku-Tetteh, J.; Idem, R. Comparative Kinetic Studies of Solid Absorber Catalyst (K/MgO) and Solid Desorber Catalyst (HZSM-5)-Aided CO2 Absorption and Desorption from Aqueous Solutions of MEA and Blended Solutions of BEA-AMP and MEA-MDEA. Ind. Eng. Chem. Res. 2018, 57, 15824–15839. [Google Scholar] [CrossRef]
  24. Li, W.; Liang, H.; Wang, J.; Shao, L.; Chu, G.; Xiang, Y. CFD modeling on the chemical absorption of CO2 in a microporous tube-in-tube microchannel reactor. Fuel 2022, 327, 125064. [Google Scholar] [CrossRef]
  25. Li, W.; Liang, H.; Wang, J.; Feng, Z.; Si, C.; Shao, L.; Chu, G.; Xiang, Y. CFD simulation and experimental study of CO2 absorption in a rotating packed bed. Chem. Eng. Process 2024, 200, 109794. [Google Scholar] [CrossRef]
  26. Bozonc, A.; Sandu, V.; Cormos, C.; Cormos, A. 3D-CFD Modeling of Hollow-Fiber Membrane Contactor for CO2 Absorption Using MEA Solution. Membranes 2024, 14, 86. [Google Scholar] [CrossRef] [PubMed]
  27. Ghasem, N. Modeling and Simulation of the Simultaneous Absorption/Stripping of CO2 with Potassium Glycinate Solution in Membrane Contactor. Membranes 2020, 10, 72. [Google Scholar] [CrossRef]
  28. Yang, N.; Ding, Y.; Guo, L.; Zhu, X.; Wang, H.; Liao, Q. Simulation of enhanced CO2 mass transfer of nanofluid with Lattice Boltzmann method coupled cell automation probabilistic model. Chem. Eng. Res. Des. 2024, 203, 60–68. [Google Scholar] [CrossRef]
  29. Guo, K.; Liu, C.; Chen, S.; Liu, B. Modeling with statistical hydrodynamic quantities of mass transfer across gas–liquid interface with Rayleigh convection. Chem. Eng. Sci. 2015, 135, 33–44. [Google Scholar] [CrossRef]
  30. Ge, X.; Liu, B.; Liu, B.; Wang, H.; Yuan, X. Three-dimensional numerical simulation of gas-liquid interfacial mass transfer with Rayleigh convection using hybrid LBM-FDM and its mass transfer coefficient model. Chem. Eng. Sci. 2019, 197, 52–68. [Google Scholar]
  31. Vanka, S.; Leaf, G. Block-implicit multigrid solution of Navier-Stokes equations in primitive variables. J Comput. Phys. 1986, 65, 138–158. [Google Scholar] [CrossRef]
  32. Hou, S.; Zou, Q.; Chen, S.; Doolen, G.; Cogley, A.C. Simulation of cavity flow by the lattice Boltzmann method. J Comput. Phys. 1995, 118, 329–347. [Google Scholar] [CrossRef]
  33. Zhang, N.; Shi, H.; Wang, H.; Feng, Y.; Jin, J.; Tontiwachwuthikul, P.; Fang, M. Evaluating CO2 Capture Performance of Tri-solvent MEA-BEA-AMP with Heterogeneous catalysts in a Novel Bench-Scale Pilot Plant. ACS Omega 2023, 9, 1838–1849. [Google Scholar] [CrossRef] [PubMed]
  34. Shi, H.; Yang, X.; Feng, H.; Fu, J.; Zou, T.; Yao, J.; Wang, Z.; Jiang, L.; Tontiwachwuthikul, P. Evaluating Energy-Efficient Solutions of CO2 Capture within Tri-solvent MEA+BEA+AMP within 0.1+2+2–0.5+2+2 mol/L Combining Heterogeneous Acid–Base Catalysts. Ind. Eng. Chem. Res. 2021, 60, 7352–7366. [Google Scholar] [CrossRef]
  35. Shi, H.; Huang, M.; Huang, Y.; Cui, M.; Idem, R. CO2 absorption efficiency of various MEA-DEA blend with aid of CaCO3 and MgCO3 in a batch and semi-batch processes. Sep. Purif. Technol. 2019, 220, 102–113. [Google Scholar] [CrossRef]
  36. Nemati, M.; Sefid, M.; Karimipour, A.; Chamkha, A. Computational thermal performance analysis by LBM for cooling a hot oval object via magnetohydrodynamics non-newtonian free convection by using magneto-ferrofluid. J. Magn. Magn. Mater. 2023, 577, 170797. [Google Scholar] [CrossRef]
  37. Zameni-Ghalati, S.; Mehryar, R.; Imani, G. LBM simulation of pcm melting in semi-transparent cylindrical enclosure considering conduction heat transfer with the absorption and refraction of solar radiation. J. Therm. Anal. Calorim. 2025, 150, 5249–5269. [Google Scholar] [CrossRef]
  38. Zhang, H.; Gao, H.; Gao, X.; Yan, Y. Falling-Film Absorption Model Considering Surface Wave and Vibration Effects Based on Lattice Boltzmann Method. Energies 2022, 15, 7925. [Google Scholar] [CrossRef]
  39. Bhatnagar, P.; Gross, E.; Krook, M. A model for collision processes in gases. I. Small amplitude processes in charged and Neutral One-Component Systems. Phys. Rev. 1954, 94, 511–525. [Google Scholar] [CrossRef]
  40. He, X.; Luo, L. A priori derivation of the lattice Boltamann equation. Phys. Rev. E 1997, 55, R6333–R6336. [Google Scholar] [CrossRef]
  41. He, X.; Luo, L. Theory of the lattice Boltzmann method: From the ioltzmann equation to the lattice Boltzmann equation. Phys. Rev. E 1997, 56, 6811–6817. [Google Scholar]
  42. Qian, Y.; D’ Humieres, D.; Lallemand, P. Lattice BGK models for Navier-Stokes equation. Europhys. Lett. 1992, 17, 479–484. [Google Scholar]
  43. Zou, Q.; He, X. On pressure and velocity boundary conditions for the lattice Boltzmann BGK model. Phys. Fluids 1997, 9, 1591–1598. [Google Scholar] [CrossRef]
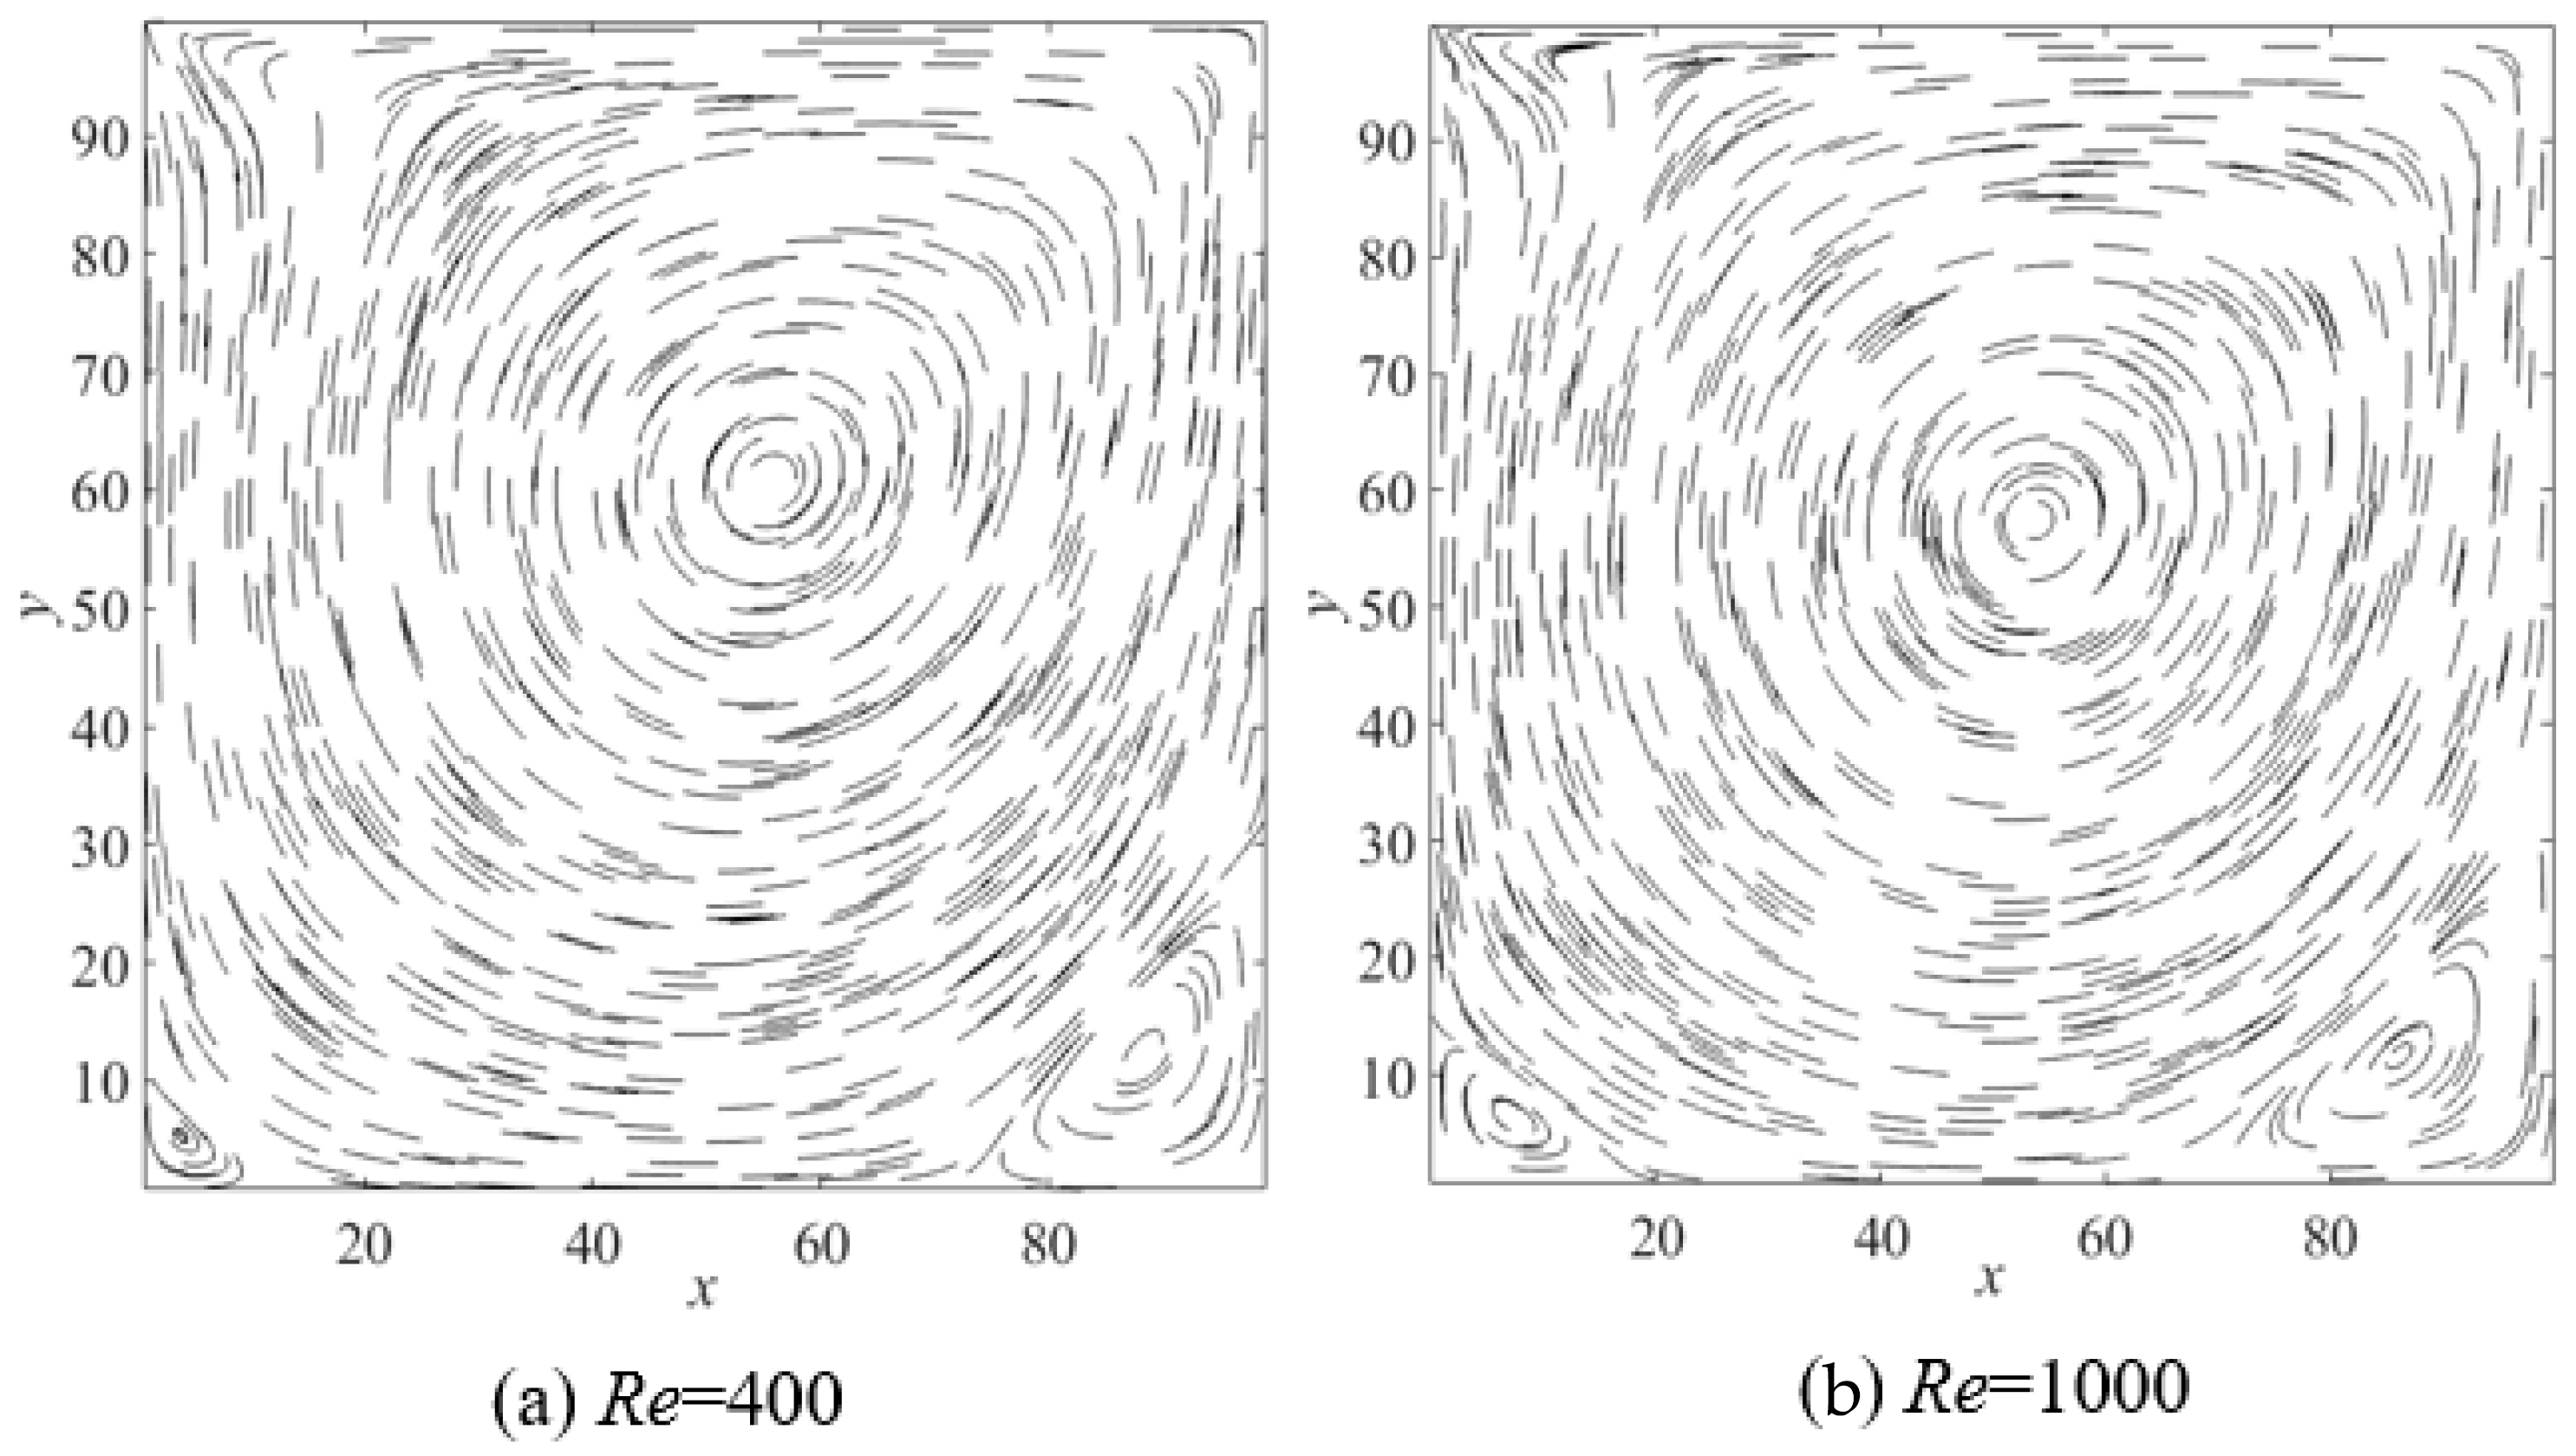
Figure 1. The flow patterns of standard lid-driven cavity flow, (a) Re = 400; (b) Re = 1000.
Catalysts 15 01093 g001
Figure 2. Schematic diagram of the absorption column (a), distribution of CO2 concentration (b), distribution of absorbent temperature (c).
Catalysts 15 01093 g002
Figure 3. The distribution of CO2 concentration in the gas mixture along the column height.
Catalysts 15 01093 g003
Figure 4. The distribution of absorbent temperature along the column height.
Catalysts 15 01093 g004
Figure 5. Schematic diagram of the catalyst section (a); velocity distribution of amine solution (b); distribution of CO2 concentration in the gas mixture (c) and absorbent temperature (d) after convergence (baseline operation conditions at 600 iterative steps).
Catalysts 15 01093 g005
Figure 6. The average temperature and the average CO2 concentration in the gas mixture at the rich-amine outlet under different iterative steps.
Catalysts 15 01093 g006
Figure 7. Velocity distribution of amine solution, distribution of CO2 concentration in the gas mixture, and absorbent temperature under different solution velocities.
Catalysts 15 01093 g007
Figure 8. The CO2 absorption rate and rise in absorbent temperature under different solution velocities.
Catalysts 15 01093 g008
Figure 9. The distribution of CO2 concentration in the gas mixture and absorbent temperature under different volume fractions of catalyst (the black particles are catalysts and the red ones are inert marbles).
Catalysts 15 01093 g009
Figure 10. The CO2 absorption rate and absorbent rise in temperature under different volume fractions of the catalyst.
Catalysts 15 01093 g010
Figure 11. The distribution of CO2 concentration in the gas mixture and absorbent temperature under different catalyst particle diameters.
Catalysts 15 01093 g011
Figure 12. The CO2 concentration absorption rate and absorbent rise in temperature under different catalyst particle diameters.
Catalysts 15 01093 g012
Figure 13. The distribution of CO2 concentration in the gas mixture and absorbent temperature under different absorbent–catalyst combinations. (The black circle represents the catalyst, and the red circle represents the inert small steel ball).
Catalysts 15 01093 g013
Figure 14. The CO2 concentration absorption rate and absorbent rise in temperature under different absorbent–catalyst combinations.
Catalysts 15 01093 g014
Figure 15. The standard bounce-back boundary condition (a) and the inlet/outlet boundary conditions (b) in the D2Q9 model. (The solid circle is the grid position of the calculation area, and the hollow circle is the boundary condition for the inlet and outlet of this grid position).
Catalysts 15 01093 g015
Figure 16. Schematic diagram of the computational procedure.
Catalysts 15 01093 g016
Table 1. Quantitative comparisons of the center positions of the primary and secondary vortices, the labels (a)–(c) indicate results from Refs. [31,32] and this work.
RePrimary VortexSecondary Vortex (Left)Secondary Vortex (Right)
xyxyxy
400a55.660.05.005.088.811.9
b56.160.85.55.189.012.6
c55.960.25.24.687.612.0
1000a54.456.37.58.186.311.0
b53.356.59.07.886.711.4
c53.256.78.57.987.010.8
Table 2. Model parameters.
ParameterValue
Dimensions of absorption column1200 mm × 50 mm
Space length of catalyst particles200 mm
2D-grid of computational domain2400 × 100; 400 × 100
Flow rate of mixture gas7 L/min
Component of mixture gas15%CO2, 85%N2
Temperature of lean amine25 °C
Inert marbles diameter6 mm
Porosity of the packing column50%
Table 3. Control group operation conditions.
ParameterValue
Catalyst particle diameters6, 7, 8, 9, 10 mm
Volume fractions of catalyst particle50%, 45%, 40%, 35%, 30%
Velocities of amine solution0.06, 0.07, 0.08, 0.09, 0.1 cm/s
Absorbent–catalyst combinationsCase 1, Case 2, Case 3, Case 4, Case 5
Baseline operation conditions6 mm; 50%; 0.09 cm/s; Case 1
Species of catalystsH-ZSM-5, γ-Al2O3, CaCO3
Table 4. Simulated selection of absorbent–catalyst combinations.
Classification NumberAbsorbent–Catalyst CombinationsInitial CO2 Absorption Rate Determined from Batch Experiments (mol CO2/L·min)Data Sources
Case 1MEA + BEA + AMP(0.4 + 2 + 2 mol/L) + H-ZSM-5/γ-Al2O3 (2:1)0.63Ref. [33]
Case 2MEA + BEA + AMP(0.3 + 2 + 2 mol/L) + CaCO30.61Ref. [34]
Case 3MEA + DEA(2 + 3 mol/L) + CaCO30.58Ref. [35]
Case 4MEA(5 mol/L) + H-ZSM-5/γ-Al2O3 (2:1)0.32Ref. [33]
Case 5MEA + BEA + AMP(0.3 + 2 + 2 mol/L), catalyst-free0.49Ref. [34]
Disclaimer/Publisher’s Note: The statements, opinions and data contained in all publications are solely those of the individual author(s) and contributor(s) and not of MDPI and/or the editor(s). MDPI and/or the editor(s) disclaim responsibility for any injury to people or property resulting from any ideas, methods, instructions or products referred to in the content.