Article

Effect of a Grinding Method in the Preparation of CuO-ZnO-Al2O3@HZSM-5 Catalyst for CO2 Hydrogenation

1
Engineering Research Center of Frontier Technologies for Low-Carbon Steelmaking, Ministry of Education, Shenyang 110819, China
2
Key Laboratory of Eco-Industry, Ministry of Ecology and Environment, Northeastern University, Shenyang 110819, China
3
Liaoning Province Engineering Research Center for Technologies of Low-Carbon Steelmaking, Northeastern University, Shenyang 110819, China
*
Authors to whom correspondence should be addressed.
Catalysts 2025, 15(11), 1068; https://doi.org/10.3390/catal15111068
Submission received: 19 October 2025 / Revised: 6 November 2025 / Accepted: 7 November 2025 / Published: 10 November 2025

Abstract

There are many obstacles to the industrial application of CO2 hydrogenation reduction technology, the most important of which is the high economic cost. The purpose of this study is to explore the interaction mechanism between the active component CuO-ZnO-Al2O3(CZA) and the zeolite carrier Zeolite Socony Mobil-5(ZSM-5), screen the simplified preparation method of catalysts with high catalytic performance, and further promote the industrial application of CO2 hydrogenation reduction technology. In this study, the effects of the gas velocity of the feedstock, the reaction temperature, the content of acidic sites in the carrier, the filling amount of active component, and the mixing mode of the active component and the carrier on catalytic CO2 hydrogenation reduction were investigated. The structure of the catalysts was analyzed by X-ray diffractometer (XRD), Brunauer-Emmett-Teller (BET), Fourier-transform infrared spectroscopy (FTIR), scanning electron microscope (SEM) and transmission electron microscopy (TEM). The catalyst surface properties were analyzed by X-ray photoelectron spectroscopy (XPS), ammonia temperature programmed desorption (NH3-TPD), hydrogen temperature programed reduction (H2-TPR) and other characterization methods. The research found that the grinding treatment led to the insertion of CZA between ZSM-5 zeolite particles in CZA@HZ5-20-GB, which was prepared via grinding both CZA and H-ZSM-5 with an Si/Al ratio of 20, inhibiting the action of strongly acidic sites in the zeolite, resulting in only CO and MeOH in the catalytic products, with no Dimethyl Ether (DME) generation.

1. Introduction

To alleviate the pressure of global carbon dioxide emissions, the application of carbon dioxide capture and utilization technologies is indispensable [1]. As the main source of carbon dioxide emissions, industry urgently needs efficient, low-cost and technologically mature carbon dioxide utilization technologies to achieve carbon dioxide reduction [2]. Compared with CO2 photocatalytic and CO2 electro-catalytic technologies, CO2 hydrogenation is currently the most mature process and has already achieved industrial demonstration [3]. The CuO-ZnO-Al2O3(CZA) catalyst was initially widely used as a traditional commercial catalyst for hydrogenation of syngas to methanol [4]. However, it has disadvantages such as high selectivity for CO and easy sintering deactivation in the process of CO2 hydrogenation catalysis [5]. To improve this phenomenon, some researchers have chosen to combine the CZA catalyst with a carrier to increase the dispersion of CZA and reduce the deactivation caused by Cu agglomeration sintering [6,7,8]. The selection of carriers is diverse, including MOFs (metal–organic frameworks) [9,10], SAPO-34 [11,12,13], ZSM-5 [14], etc. However, the preparation cost of MOFs is relatively high, and SAPO-34 zeolite generally has a relatively low lifespan [13]. ZSM-5 zeolite has the characteristics of a very wide range of Si/Al ratios and diverse distribution of acidic sites, which enables it to be widely applied in multiple directions such as CO2 hydrogenation conversion to DME [6,15,16,17,18,19], light olefins [12,20,21,22,23], and aromatic hydrocarbons [14,24,25]. For this reason, ZSM-5 zeolite has gradually attracted much attention as the carrier of CO2 hydrogenation conversion catalysts.
However, the role played by ZSM-5 zeolite in the CO2 catalytic hydrogenation process is highly controversial. The indicators for evaluating the performance of catalysts include conversion rate, selectivity, yield, etc. Some scholars believe that ZSM-5 zeolite can promote the CO2 conversion rate [26], while others think that ZSM-5 zeolite has no effect on the CO2 conversion rate [18]. Under similar reaction temperatures and pressures, the distribution of the products converted from CO2 varies greatly. Some studies only involve CO, MeOH and DME as catalytic products [17,27]. Some studies have further added CH4, C2H6, C2H4, etc. [14,28,29,30]. Even if some research products are of the same type, the selectivity of the products can vary greatly. These phenomena have brought great inconvenience to researchers in exploring the application of ZSM-5 zeolite in the field of CO2 hydrogenation. Therefore, exploring the role of ZSM-5 zeolite in the CO2 hydrogenation reaction remains of great significance.
To eliminate the influence of metal oxides altering the structure of ZSM-5 zeolite on the CO2 hydrogenation performance, many researchers conducted performance tests by physically mixing metal oxides with ZSM-5 zeolite. The physical mixing methods mainly involve two categories: (1) Metal oxides and ZSM-5 zeolite are respectively made into particles and mixed in the form of particles to test performance. (2) After grinding and mixing the metal oxide with ZSM-5 zeolite powder evenly, the particles are made for performance testing. Regrettably, most researchers took the physically mixed catalyst as the reference sample [31,32,33] and did not conduct a detailed analysis of its catalytic mechanism.
In this study, multiple factors including the gas velocity of the feedstock, reaction temperature, the content of acidic sites in the carrier, the filling amount of active component, and the mixing mode of the active component and the carrier were tested for their influences on the results of the CO2 hydrogenation reaction. Combining various characterization methods such as XRD, BET, SEM, TEM, XPS, H2-TPR, and NH3-TPD, the influence of the appearance morphology and internal characteristics of the catalyst on the mechanism of CO2 hydrogenation reaction was deeply analyzed.

2. Results and Discussion

Catalysts were prepared by mixing CZA catalyst with HZSM-5 zeolite with three different Si/Al ratios and using three different methods of mixing. They will be named CZA@HZ5-x-MM, where x may be 20, 30 or 40, depending on the Si/Al ratio, and MM may be nothing if CZA and zeolite were not mixed before adding them to the reactor, PM if the powders of both catalysts were mixed but not grounded, and GB if both solids were grounded and pelletized. Details are given in Section 3.

2.1. Characterizations

Figure 1a shows the crystal structure of the catalysts as tested by XRD. The characteristic peaks of HZSM-5(ICDD PDF No.44-0003), CuO (ICDD PDF No.48-1548) and ZnO (ICDD PDF No.36-1451) were simultaneously present in CZA@HZ5-20-GB and CZA@HZ5-20-PM catalysts. These proved that the catalysts CZA@HZ5-20-GB and CZA@HZ5-20-PM simultaneously contain ZSM-5 zeolite and CuO-ZnO-Al2O3 metal oxides. We name the reduced catalysts respectively as CZA-H, CZA@HZ5-20-PM-H and CZA@HZ5-20-GB-H. It can be clearly observed that there are distinct Cu0 (ICDD PDF No.04-0836) characteristic peaks in the reduced catalyst. Fourier transform infrared transmission spectroscopy analysis (Figure 1d) of the catalysts proved that the catalysts CZA@HZ5-20-GB and CZA@HZ5-20-PM simultaneously contained the characteristic peaks of metal oxides (~500 cm−1) and MFI zeolites [34] (~1229, ~1120, ~778, ~560, and ~457 cm−1). The N2 adsorption and desorption isotherms and pore size distribution diagrams of the catalysts more intuitively demonstrate the influence of grinding treatment on the internal pore structure of the catalysts. When P/P0 < 0.1 (Figure 1b), the N2 adsorption isotherms of CZA@HZ5-20-GB and CZA@HZ5-20-PM almost coincide. At the same time, the micropore size distribution diagrams (Figure 1e) of both are almost the same as the micropore volumes calculated based on the NLDFT model (Table 1). It is indicated that the grinding treatment will not destroy the microporous structure contained in ZSM-5 zeolite. However, by observing the data of P/P0 within the range of 0.7 to 1.0 (Figure 1d), it can be found that the grinding treatment significantly reduced the porosity of the catalyst near 30 to 100 nm.
In order to observe the distribution of CZA catalyst and HZSM-5 zeolite more intuitively, we conducted SEM and elemental mapping on the catalysts of HZ5-20 (Figure 2a), CZA (Figure 2b), CZA@HZ5-20-GB (Figure 2c), and CZA@HZ5-20-PM (Figure 2d). It can be observed that HZSM-5 zeolite is composed of small particles agglomerated one after another. The CZA catalyst, on the other hand, is composed of small pieces interwoven together. By observing the elemental mapping of the catalysts CZA@HZ5-20-GB and CZA@HZ5-20-PM, it can be found that the distribution of Cu and Zn elements in the catalyst CZA@HZ5-20-PM is clearly distinct from that of Si element, but in the CZA@HZ5-20-GB catalyst, the distribution of the three elements intersects with each other.
Obviously, SEM can only observe the general morphology of the catalyst particles and cannot closely examine the contact between HZSM-5 zeolite and CZA catalyst within a single catalytic particle. For this purpose, we conducted TEM tests on the catalysts and carried out mapping and lattice analysis. The results are shown in Figure 3. By magnifying the CZA catalyst after dispersion treatment (Figure 3a), it can be observed that the CZA catalyst has no regular morphology and the elements are evenly dispersed. Lattice analysis (Figure 3d–f) of the catalyst shows that there are obvious crystal planes of CuO (1,1,1) (d = 0.232 nm), CuO (1,1,−1) (d = 0.252 nm), and ZnO (1,0,1) (d = 0.248 nm) in the catalyst. The catalyst CZA@HZ5-20-PM contains two morphologies: particles of about 100~200 nm and an irregular structure (Figure 3c). Combined with the results of the mapping, it can be found that the regular particles are HZSM-5 zeolite, and the substances with irregular structures are CZA catalysts. The two had almost no contact. From the TEM image of the catalyst CZA@HZ5-20-GB (Figure 3b), it can be clearly observed that the grinding process inserted the CZA catalyst into the middle of the HZSM-5 zeolite particles. Based on the characterization results of BET and pore size analysis, the formation of an approximately 100 nm pore size in HZ5-20 zeolite is attributed to the voids between zeolite particles rather than the internal channels of the zeolite. Grinding treatment causes CZA to occupy part of the voids of zeolite particles, which also explains why the pore volume of the CZA@HZ5-20-GB catalyst is much smaller than that of the CZA@HZ5-20-PM catalyst in the range of 30 to 100 nm.

2.2. Catalytic Performance Test of Catalysts

The factors influencing catalytic performance are multi-dimensional, including catalytic reaction conditions (temperature, pressure, flow rate, etc.), the type and dosage of the catalysts, etc. This study successively explored the influence laws of the gas velocity of the feedstock, the reaction temperature, the content of acidic sites in the carrier, the filling amount of active component, and the mixing mode of the active component and the carrier on the catalytic performance. The schematic diagram of the catalytic reactor applied in this study is shown in Figure S1.

2.2.1. Gas Velocity

The test results of the influence of the gas velocity of the feedstock gas on the performance of CO2 hydrogenation reaction are shown in Figure S2. Similarly to most research results [35], the higher the gas velocity of the feedstock gas, the lower the CO2 conversion rate, and the lower the selectivity of CO and DME.

2.2.2. Reaction Temperature

When exploring the influence law of catalytic reaction temperature on catalytic performance, we discovered an interesting thing: CH4 and C2H6 were newly added to the catalytic products, although their yields were very low (As shown in Figure S3). It is well known that increasing the catalytic reaction temperature will significantly promote the occurrence of the reverse water gas reaction, which leads to an increase in the selectivity of CO with the increase in reaction temperature. The research on the generation route of CH4 shows that the further hydrogenation of CO produces CH4, which is completely different from the MeOH synthesis route [36]. Therefore, the main reason for methane formation is that high temperature leads to the reduction of Cu in the CZA catalyst to large particles of Cu0, which promotes the further hydrogenation of CO to form methane. Taking into account the catalytic test results comprehensively, although the increase in reaction temperature significantly enhances the conversion rate of CO2 (from 8.12% at 250 °C to 25.06% at 350 °C), the selectivity of CO in the reaction products rises to over 90%, and additional products such as CH4 are generated. Therefore, the catalytic temperature selected for the performance test of the catalyst screening in the following steps is the lowest, 250 °C.

2.2.3. Acidic Sites

The influence of the content of acidic sites in the carrier on the catalytic performance was determined by preparing HZSM-5 zeolite with different Si/Al ratios. In this study, HZSM-5 zeolites with Si/Al ratios of 20/30/40 were prepared and mechanically mixed with CZA catalyst for performance testing. Specific catalytic test results are listed in Figure S4. According to the performance test results, CZA@HZ5-30 catalyst has a slightly higher CO2 conversion rate than the other two catalysts, but it also has the highest CO selectivity. When the evaluation index of a catalyst focuses on the yield and space–time yield, it can be found that under the action of HZ5-20 zeolite, the catalyst is more conducive to promoting the formation of MeOH and DME. This is mainly attributed to the nature and content of acidic sites in HZSM-5 zeolite. It is well known that there are usually two types of acidic sites in HZSM-5 zeolite, namely weak acid sites and the strong acid sites [12]. Therefore, NH3-TPD was also used in this study as a test procedure to detect the properties of acidic sites in samples. Figure S5 shows the NH3-TPD test results of HZSM-5 zeolite, and Table S1 shows the content and distribution of different types of acidic sites. According to NH3 calibration data of mass spectrometry, HZ5-20 zeolite has the highest number of acidic sites, reaching 1.61 mmol/g. The number of acidic sites of HZ5-30 zeolite and HZ5-40 zeolite is only 0.64 mmol/g and 0.37 mmol/g, respectively. This is also why the proportion of MeOH and DME in the catalytic products of HZ5-20 zeolite is much higher than that of the other two zeolites. The ratio of space–time yields of the reaction products increased from 0.2 to 0.5 (Figure S4d: CZA@HZ5-20: STY(MeOH+DME)/STYCO = 0.5; CZA@HZ5-30: STY(MeOH+DME)/STYCO = 0.2; CZA@HZ5-40: STY(MeOH+DME)/STYCO = 0.2). Therefore, the number of acidic sites in HZSM-5 zeolite contributes to the production of MeOH and DME as reaction products. Similarly, because the area of peak α and peak β in HZ5-20 zeolite is the largest, the inhibition effect on CO production and the promotion effect on DME production are the strongest [37].

2.2.4. Filling Amount of Active Component

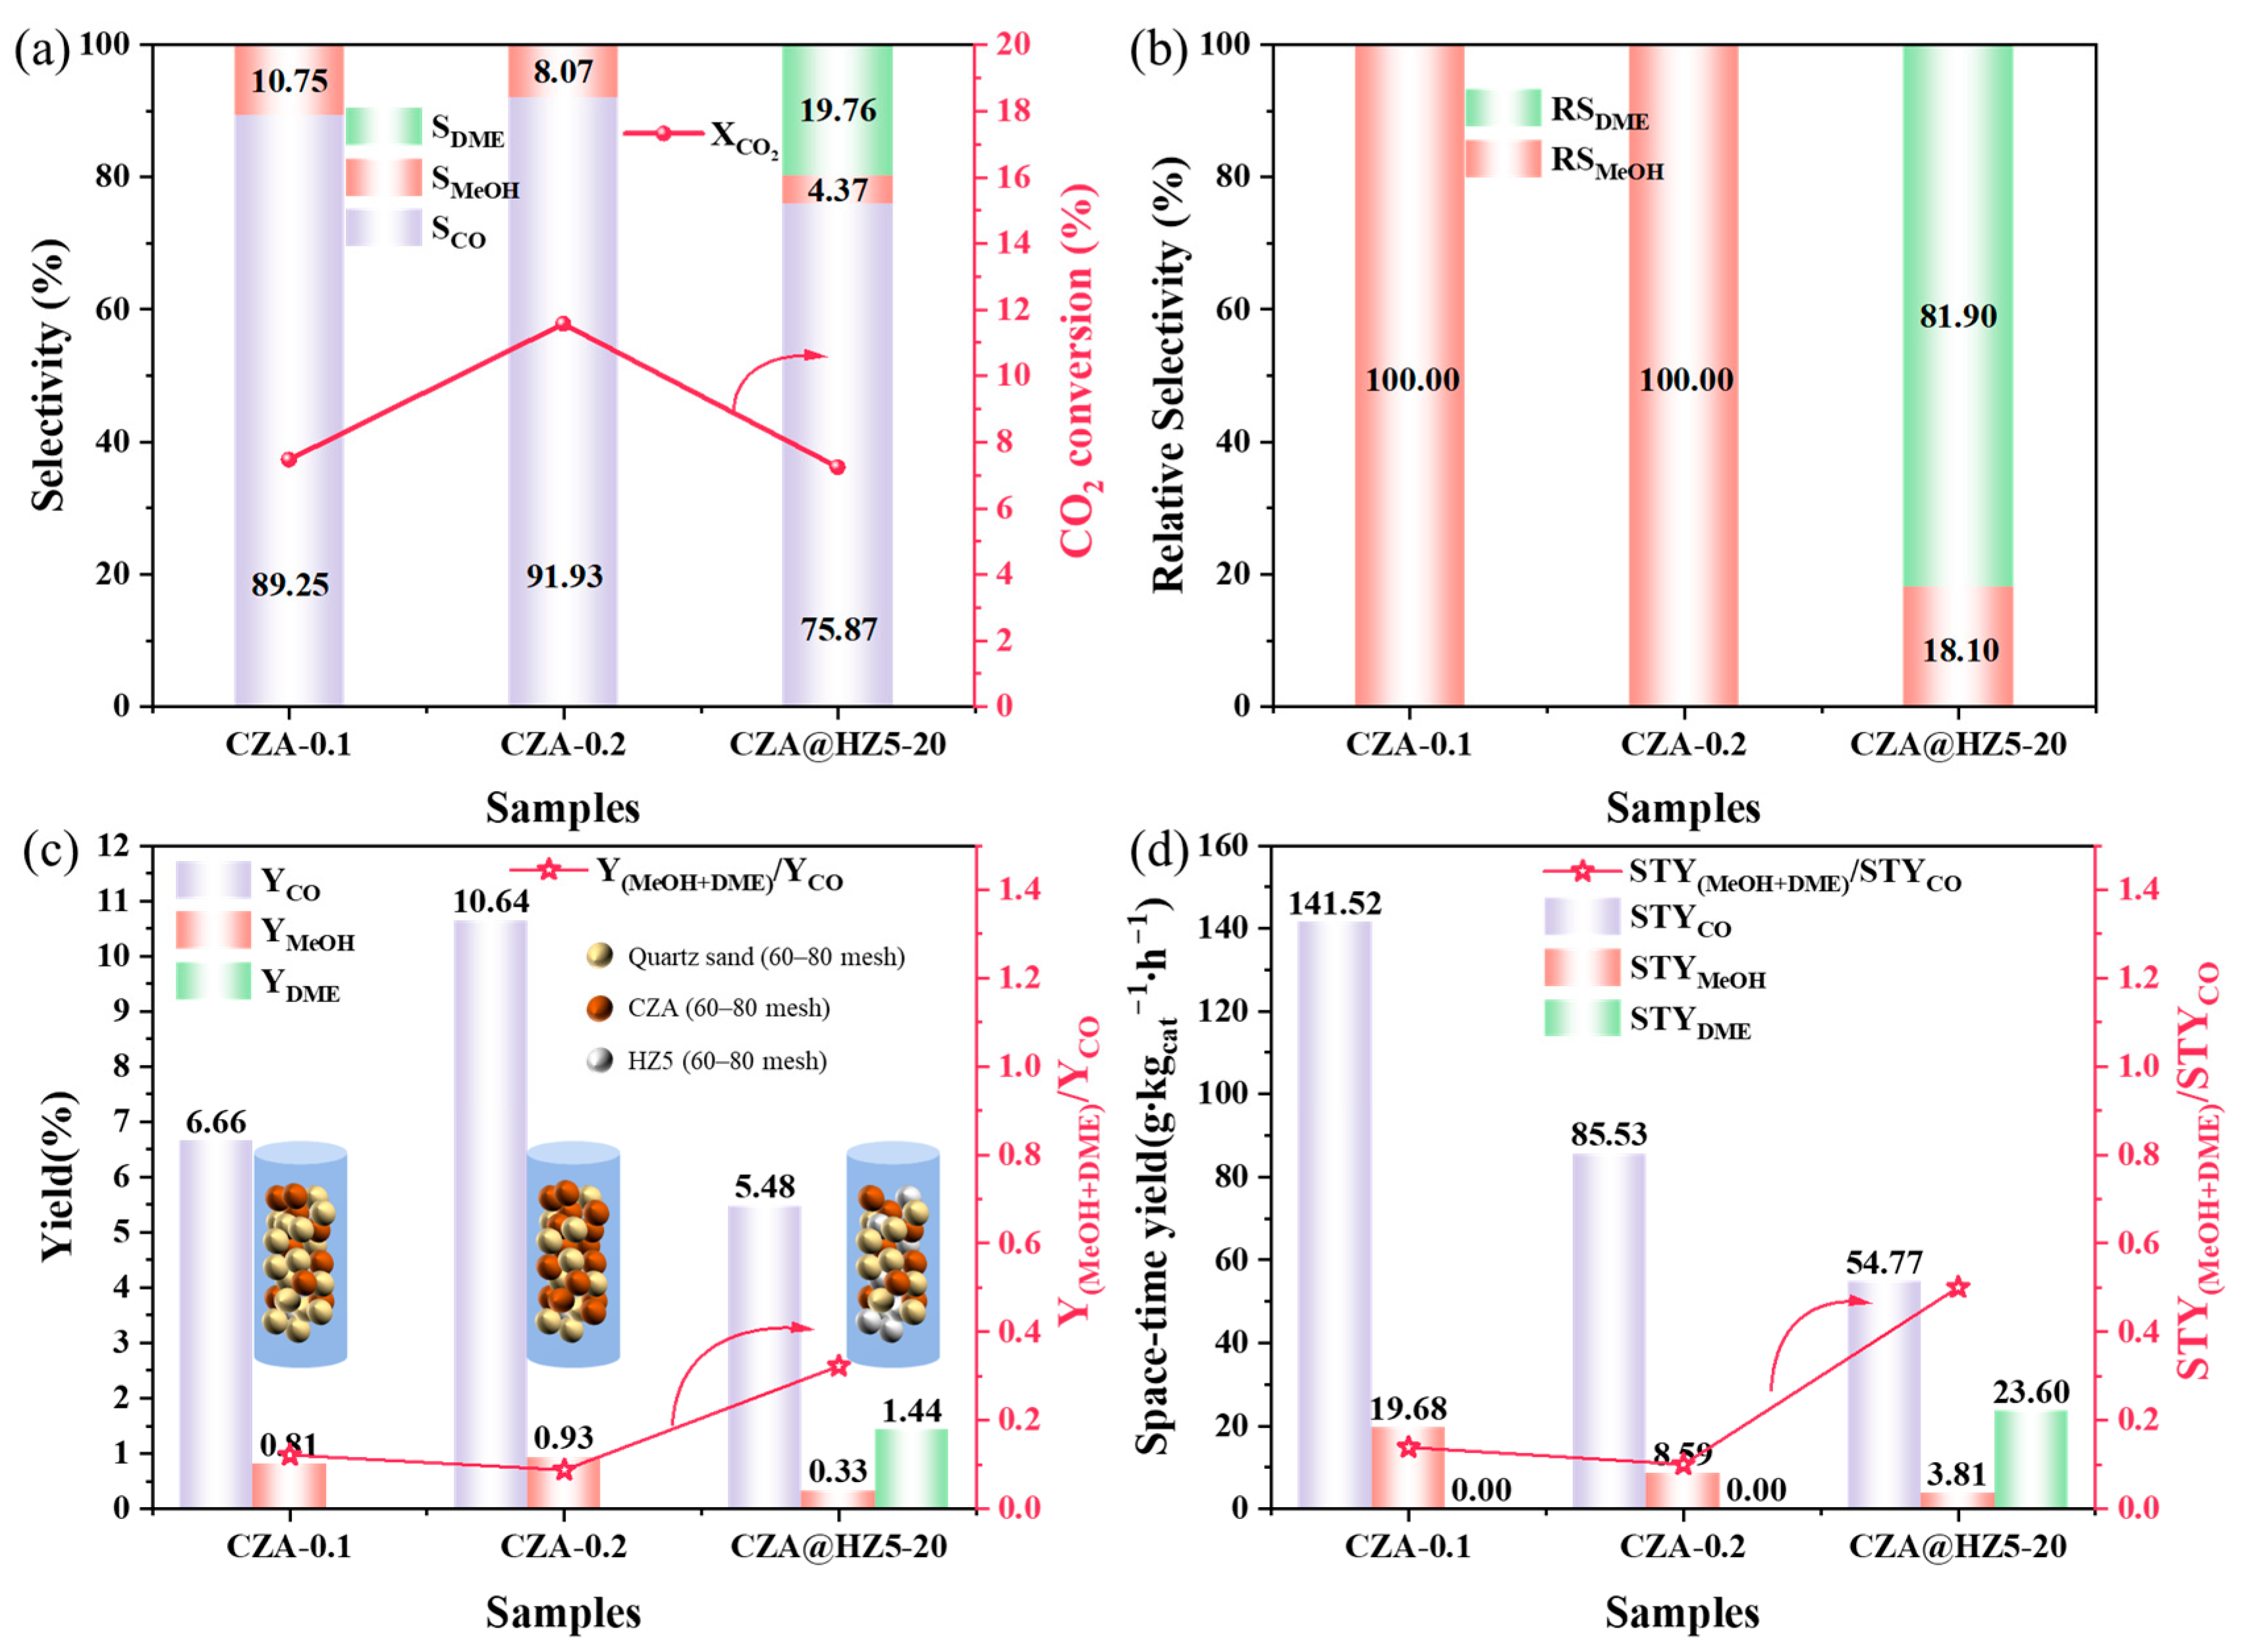
In order to explore the effect of the filling amount of the active component on the performance of catalysts, the performance of catalysts CZA-0.1 (0.1 g CZA catalyst + quartz sand, 60~80 mesh), CZA-0.2 (0.2 g CZA catalyst + quartz sand, 60~80 mesh) and CZA@HZ5-20 (0.1 g CZA catalyst + 0.1 g HZSM-5 zeolite + quartz sand, 60~80 mesh) at 250 °C and 3 MPa was respectively tested in this study. The volume flow rate of feedstock gas was controlled at 10 mL/min. In order to ensure the consistency of other reaction conditions, the filling volume of the reaction column was controlled by adjusting the quartz sand filling amount during the catalyst filling process. The loading diagram of the catalyst is shown in Figure 4c.
The catalytic properties of the catalysts are listed in Table 2. Through comparative analysis, it was found that when the reaction pressure, reaction temperature and reaction flow rate were the same, the increase in CZA catalyst loading significantly improved the conversion of CO2 and then led to a substantial increase in CO yield. It is worth mentioning that the reaction product selectivity of CZA-0.1 and CZA-0.2 is basically the same, which is mainly due to the same internal structure of the catalysts, resulting in similar distribution of Zn/Cu interfacial sites existing for formate hydrogenation and low-coordinated copper sites existing for reverse water–gas shift (RWGS) reaction [38]. Formate hydrogenation is regarded as the rate-determining step of methanol production [39] and RWGS reaction leads to the formation of CO. Although the yields of CO and methanol obtained by the CZA-0.2 catalyst are higher than those obtained by the CZA-0.1 catalyst, this is due to the higher CO2 conversion rate of the CZA-0.2 catalyst. When the evaluation index of the product was replaced by the space–time yield, it was found that the STYMeOH and STYCO of CZA-0.2 catalyst (STYMeOH = 8.59 g∙kgcat−1∙h−1; STYCO = 85.53 g∙kgcat−1∙h−1) were much lower than those of CZA-0.1 catalyst (STYMeOH = 19.68 g∙kgcat−1∙h−1; STYCO = 141.52 g∙kgcat−1∙h−1). Therefore, only increasing the use of catalyst cannot bring about an improvement in the space–time yield of the target product.
When 0.1 g of CZA in the catalyst is replaced by 0.1 g of HZSM-5-20 zeolite, it can be found that the CO2 conversion rate of CZA@HZ5-20 catalyst is basically the same as that of CZA-0.1 catalyst. However, compared with the nearly 90% selectivity of CO in the catalytic products of CZA-0.1 catalyst, CZA@HZ5-20 catalyst reduces the CO selectivity to less than 76%. This is mainly due to the fact that the acidic sites of HZSM-5 zeolite can promote the conversion of MeOH to DME, and the consumption of MeOH also promotes the transfer of CO2 hydrogenation products to MeOH to a certain extent [40]. Figure 4 shows the detailed catalytic parameters of the catalysts CZA-0.1, CZA-0.2 and CZA@HZ5-20. According to Figure 4b, it can be seen that DME is the main catalytic product of CZA@HZ5-20 catalyst without considering the by-product CO. Compared with CZA-0.1 catalyst, the ratio of the sum of MeOH and DME yields (Y(MeOH+DME)) in the catalytic products of CZA@HZ5-20 catalyst to the by-product CO yields (YCO) increases by 2 times (Figure 4c: CZA-0.1: YMeOH/YCO = 0.1; CZA@HZ5-20: Y(MeOH+DME)/YCO = 0.3). The ratio of space–time yields of their reaction products increased from 0.1 to 0.5 (Figure 4d: CZA-0.1: STYMeOH/STYCO = 0.1; CZA@HZ5-20: STY(MeOH+DME)/STYCO = 0.5). Therefore, the strong acidic sites in HZSM-5 zeolite contribute to the production of MeOH and DME as reaction products.

2.2.5. Physical Mixing Mode of the Active Component and the Carrier

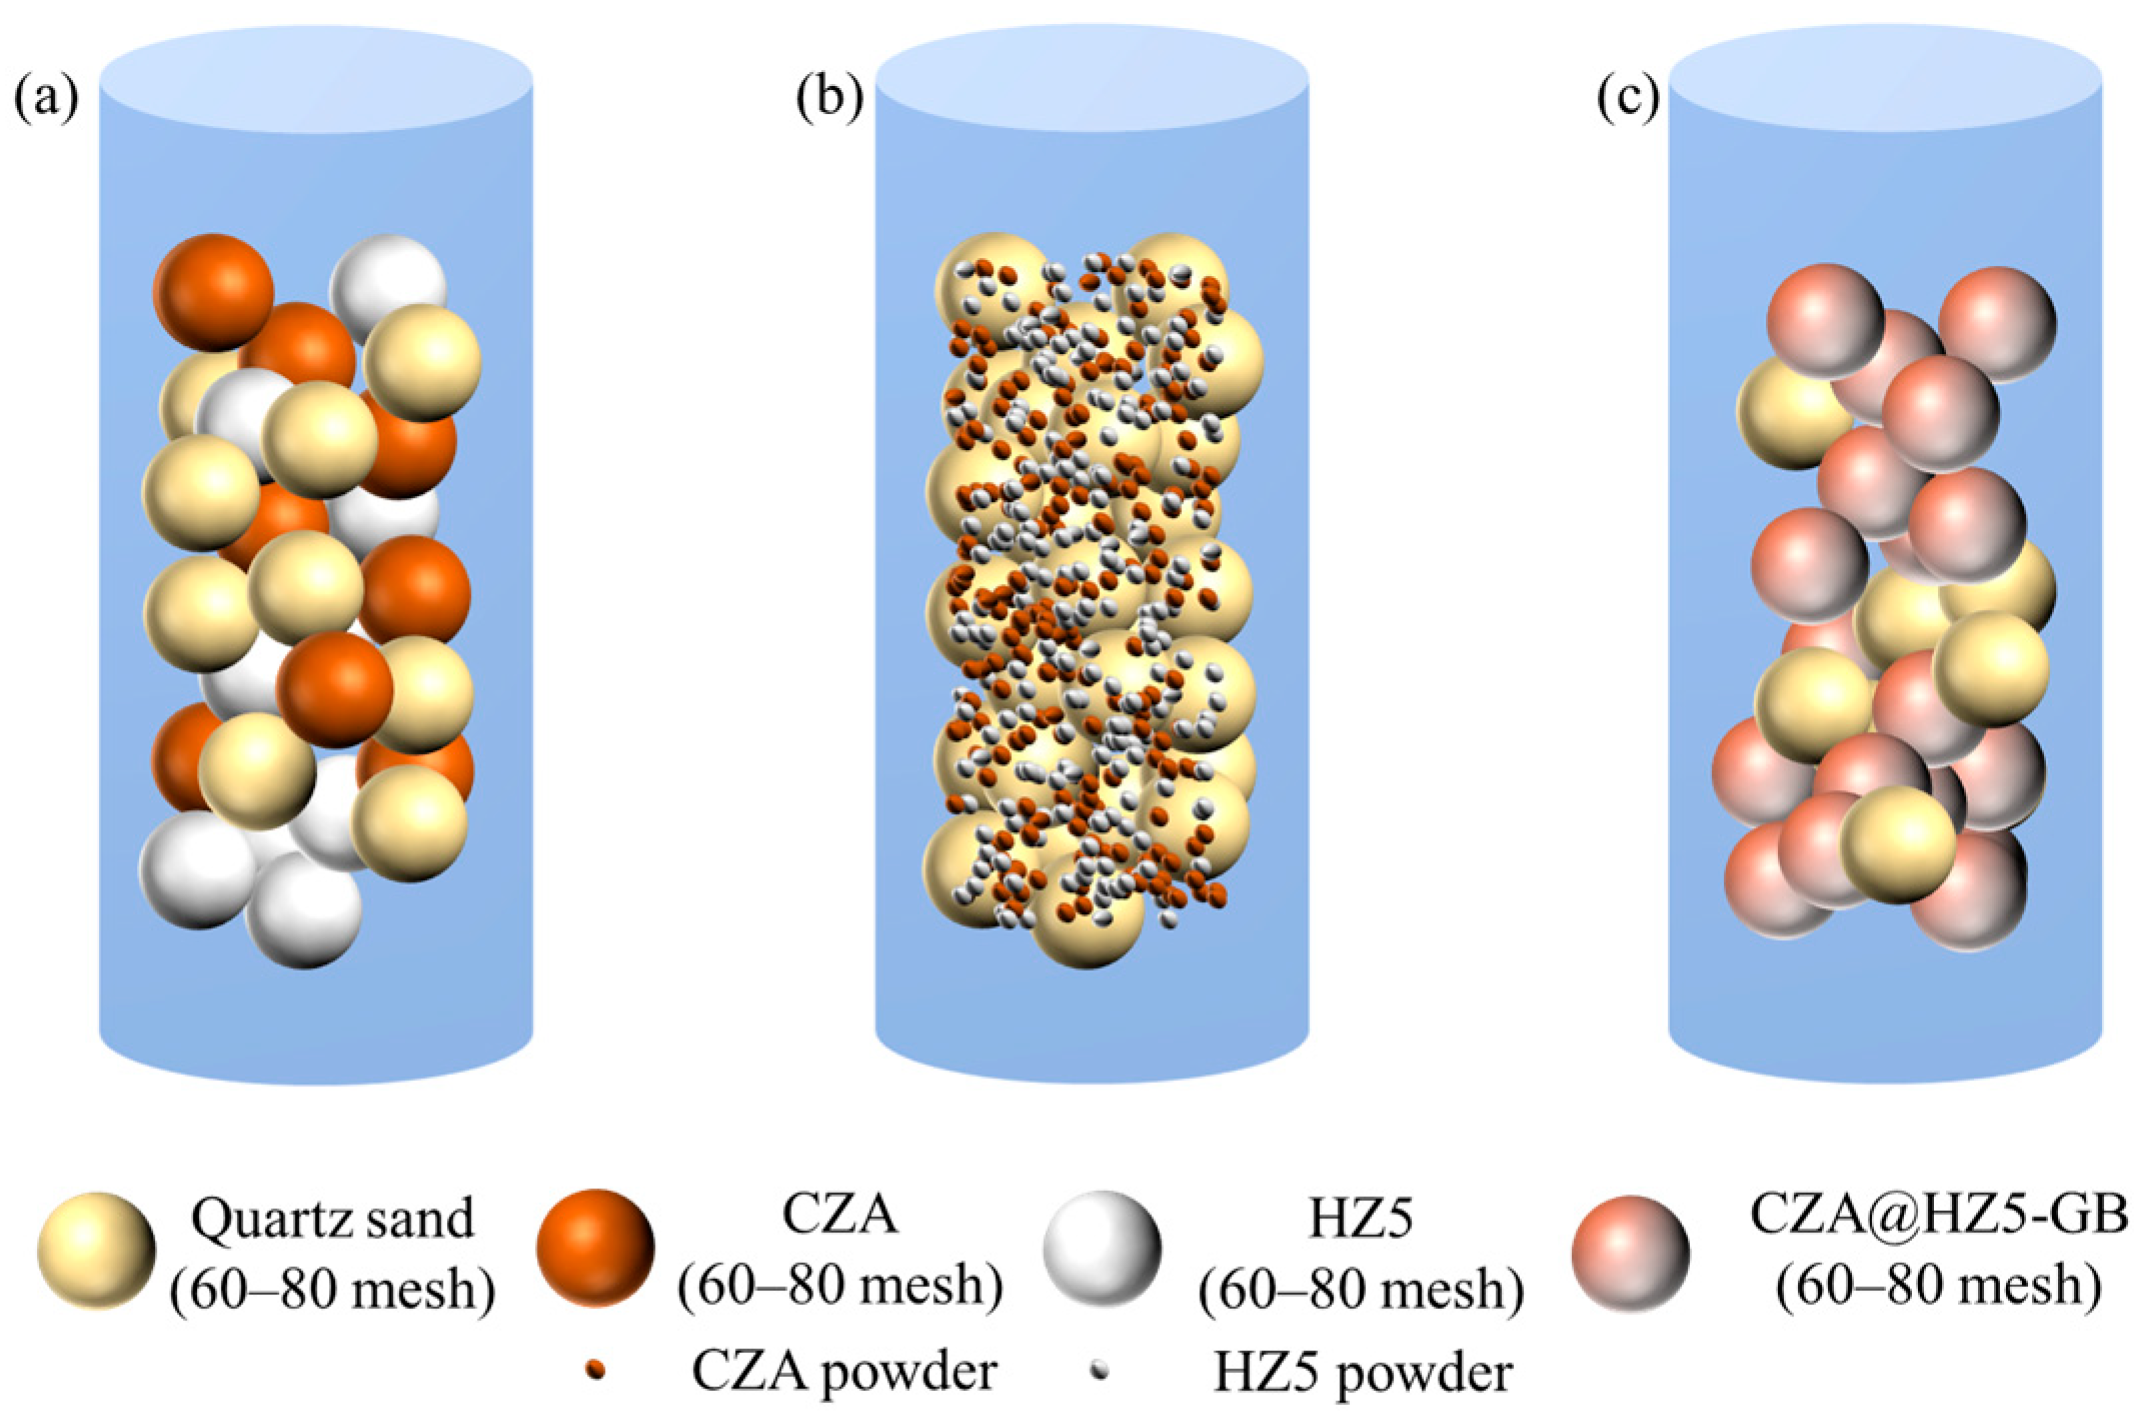
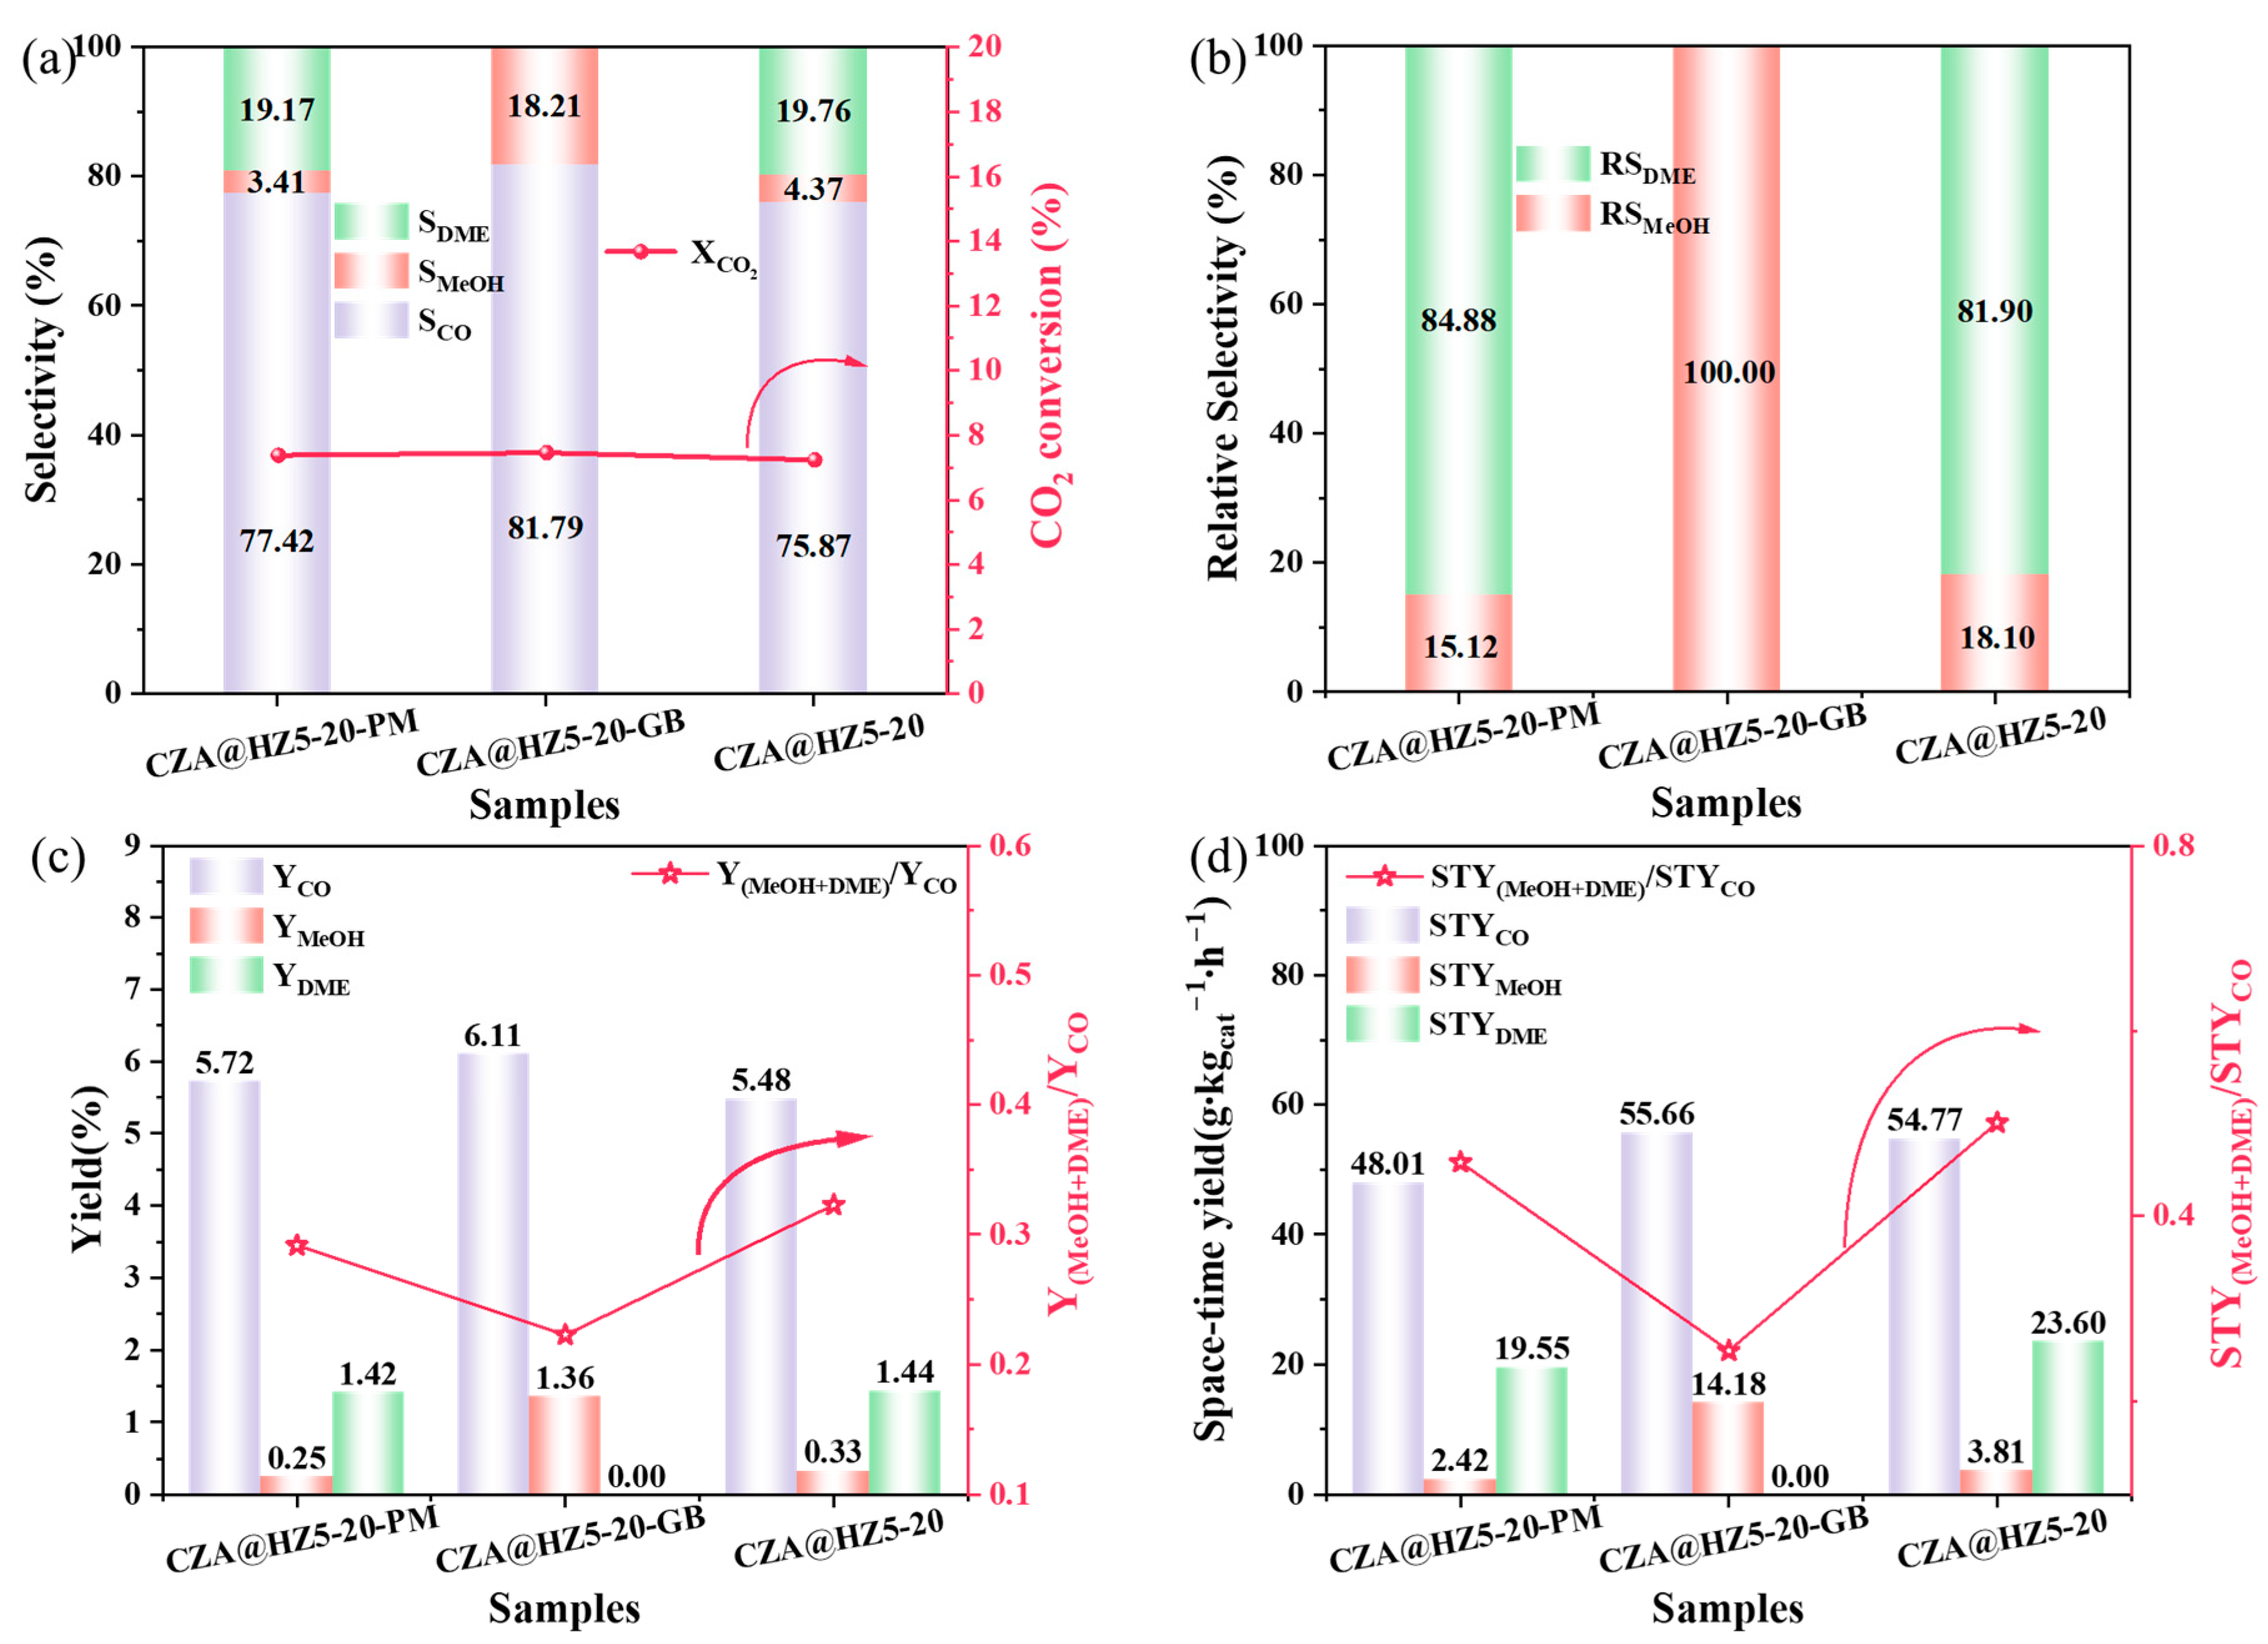
In order to explore the influence of the combination of CZA catalyst and HZSM-5 zeolite on the performance of the catalyst, we controlled the total filling amount of the catalyst at 0.2 g. The filling method is shown in Figure 5, and the catalytic test conditions are exactly the same. The catalytic test results are presented in Table 3 and Figure 6. By comparing the performance of the catalysts CZA@HZ5-20 and CZA@HZ5-20-PM, it can be found that the performance indicators of the two catalysts are not much different, indicating that granulation treatment of the catalysts does not affect the performance of the catalysts. Meanwhile, when there is no molecular-level contact between CZA and HZSM-5 zeolites, the distance reduction caused solely by the small size of the catalyst particles will not affect the performance of the catalyst. According to the TEM element scanning images in Figure 3, it can be found that the grinding method realizes the contact between the nanoparticles of CZA and HZSM-5 zeolite, which has a significant impact on their catalytic products. The catalytic products of CZA@HZ5-20-GB were only CO and MeOH. By comparing and observing the catalytic results of other researchers using HZSM-5 zeolite in the CO2 hydrogenation reaction (Table S2), DME was basically produced in all of them. To explore the causes of these phenomena, we further characterized the catalyst with H2-TPR, NH3-TPD, and XPS, and conducted further analysis of the catalytic mechanism.

2.3. Study on Catalytic Mechanism of Catalysts

The reducibility of the catalyst, as an important parameter of the catalyst characteristics, was first tested by the H2-TPR method. Figure 7 shows that the peaks of H2 consumption for each catalyst are 263.4 °C (CZA@HZ5-20-GB), 267.9 °C (CZA@HZ5-20-PM), and 277.9 °C (CZA) respectively. The H2 consumed by the catalyst is mainly used to reduce CuO to Cu+ and further to Cu0 [41]. When CuO combines with ZnO and Al2O3, the H2 reduction of the catalyst will shift towards the direction of higher temperature [42]. The H2 consumption peaks of the catalysts CZA@HZ5-20-GB and CZA@HZ5-20-PM are close, mainly because the content and state of CZA are the same in both. The area of the H2 consumption peak of the CZA catalyst is much larger than that of other catalysts because the test mass of CZA is twice the CZA content in other catalysts. As a result, the peak value of the H2 consumption of the CZA catalyst shifts towards high temperatures, and the complete reduction temperature also increases.
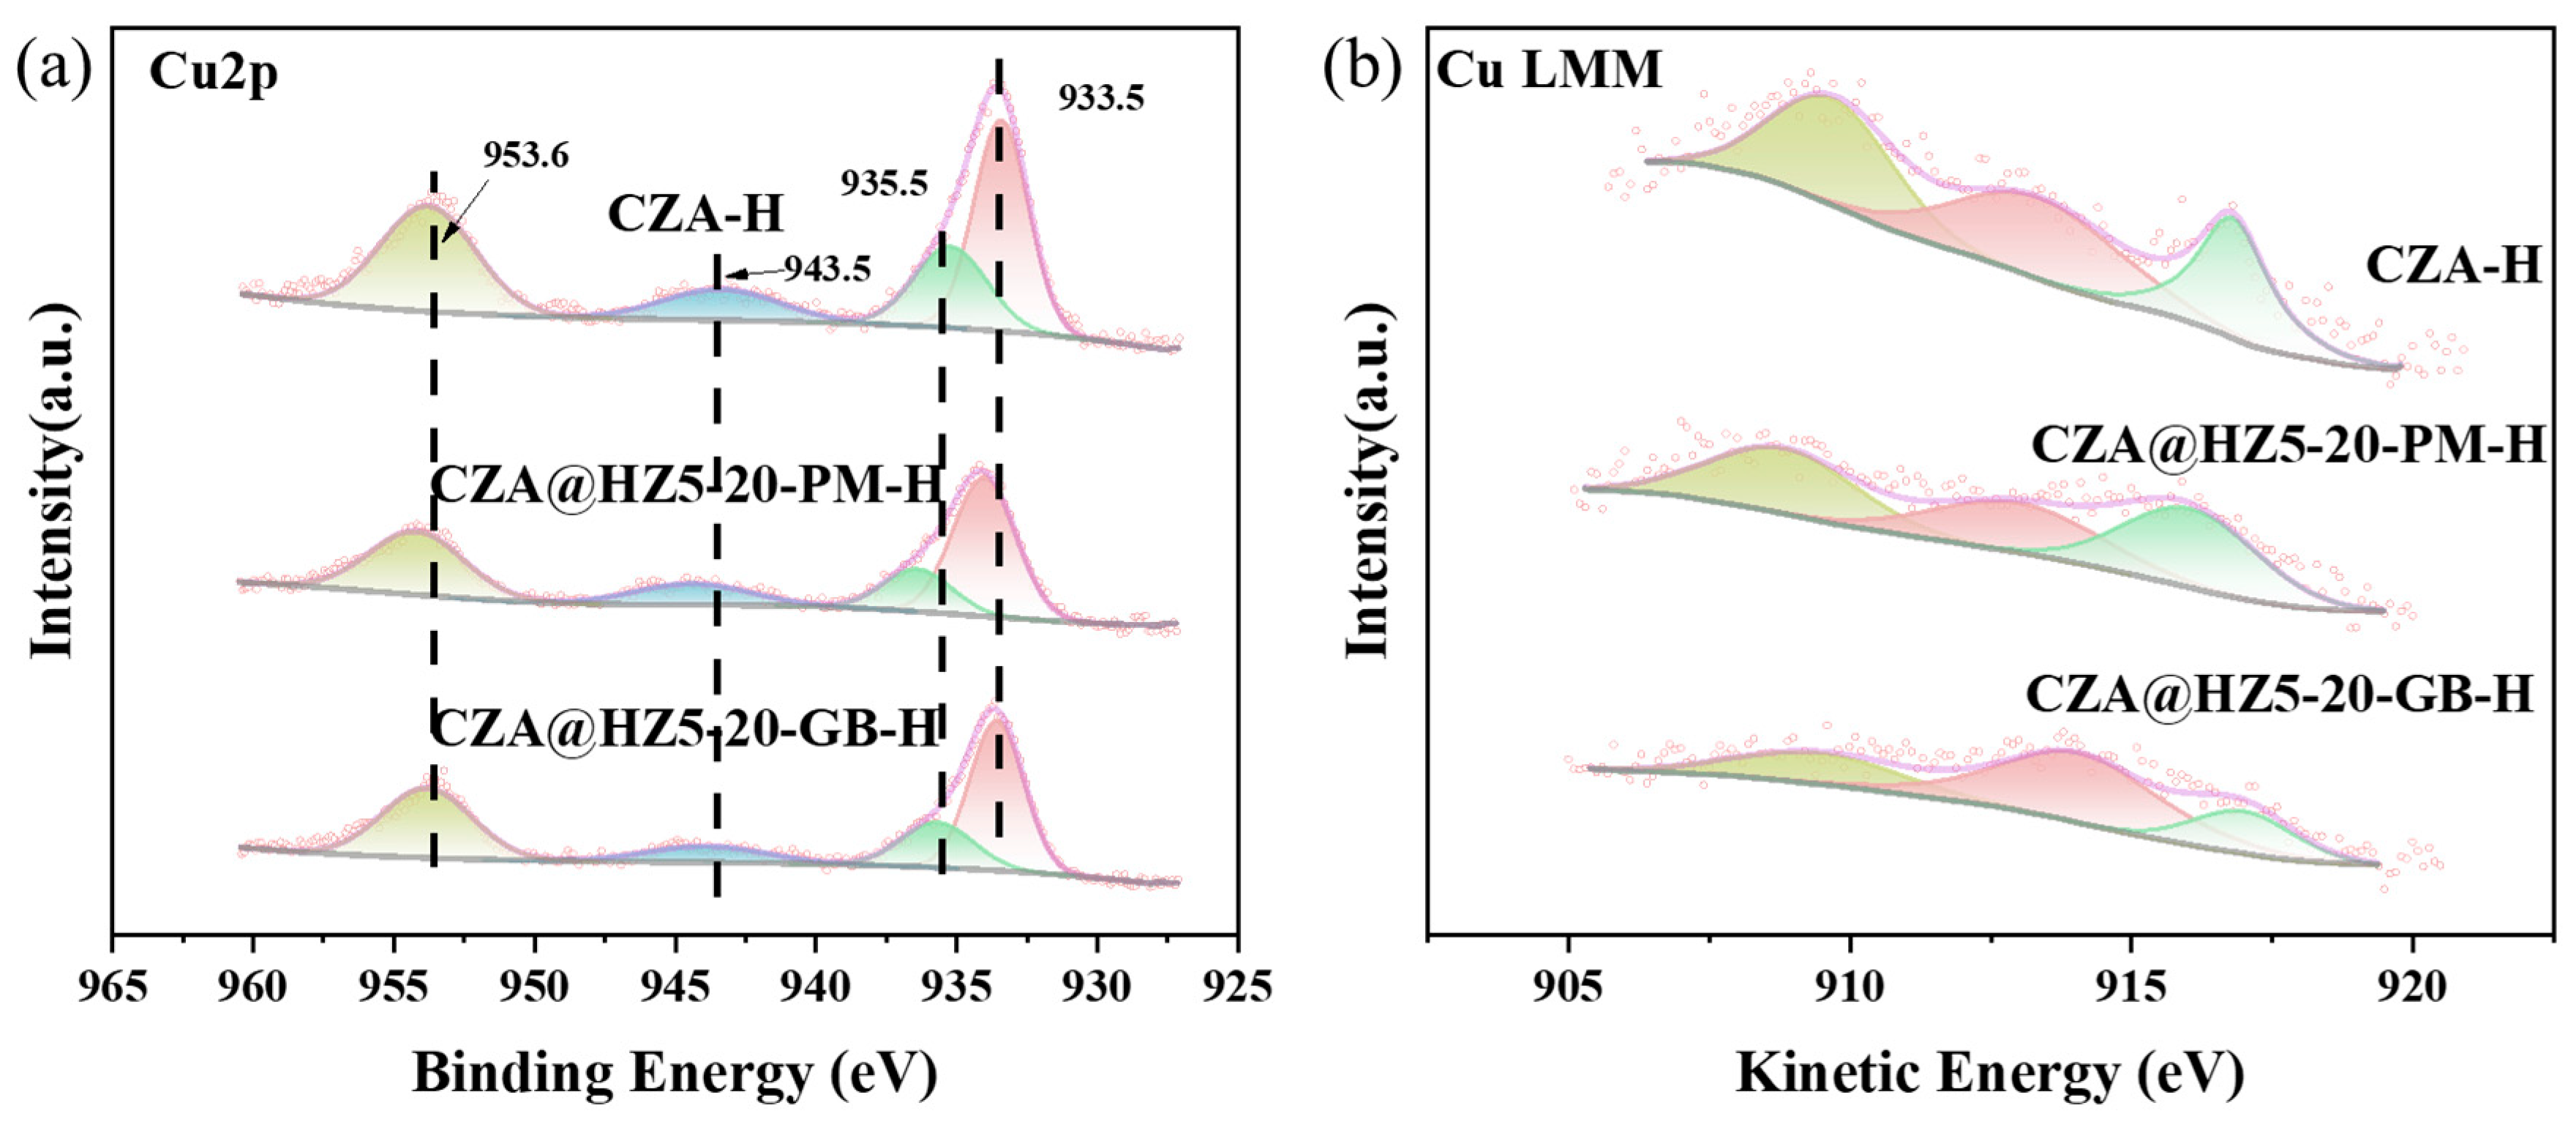
XPS test analysis was conducted on the reduced catalysts, with the main purpose of understanding the valence state of Cu element and the framework structure of zeolite. Figure 8a shows the fine spectrum of Cu, the main active component in the catalyst. The Cu2p1/2 peak at the binding energy of ~953.6 eV and the Cu2p3/2 peak at the binding energy of ~933.5 eV exist in all catalysts [43]. Through the fitting analysis of the Cu2p3/2 peak of the catalyst, this peak can be further divided into two main peaks: ~935.5 eV ascribed to Cu2+ species and ~933.5 eV ascribed to Cu+ and Cu0 species [44]. In addition, the peak at the binding energy of ~943.5 eV is the satellite peak and is regarded as Cu2+ [43]. It can be observed that the area of the Cu2+ peak of CZA@HZ5-20-GB catalyst is the smallest, indicating that the proportion of reduced Cu in the sample is the highest. Combined with the previous H2-TPR and TEM tests we conducted on the catalysts, this point has also been confirmed. To further understand the valence state of the reduced Cu species, we tested the Auger spectra of Cu (Figure 8b). Through the fitting analysis of the Cu LMM spectrum, each catalyst can be fitted into three peaks: the peak of kinetic energy at ~909 eV is considered to represent the transition state Cuδ+, the peak of kinetic energy at ~913 eV is considered to represent Cu+, and the peak of kinetic energy at ~917 eV is considered to represent Cu0 [44]. By comparison, it was found that the proportion of Cu+ was the highest and the proportion of Cu0 was the lowest in the CZA@HZ5-20-GB catalyst treated by grinding. This might be due to the grinding causing some of the CZA catalyst to combine with the HZSM-5 zeolite framework, where Cu2+ cannot be reduced to Cu0 but can only be reduced to Cu+.
Zn2p fine spectra of catalysts are shown in Figure 9a. All catalysts contain peaks of Zn2p1/2 at ~1046.1 eV and Zn2p3/2 at ~1023.1 eV [6]. The Al2p peak (Figure 9b) in the CZA catalyst is composed of the Al2O3 characteristic peak at ~73.9 eV and the Al-O-Cu characteristic peak at ~77.8 eV [45]. However, the Al2p peak in HZSM-5 zeolite exists only at ~75.0 eV, which is attributed to the Si-O-Al-O- chain in the zeolite skeleton [41,46]. The value of binding energy at 103.1 eV in Si2p spectra (Figure 9c) is ascribed to silica in zeolite structures [47,48]. From the XPS characterization of the catalyst, it was further proved that the zeolite framework structure of ZSM-5 was not damaged, but the state of the reduced Cu was completely different.
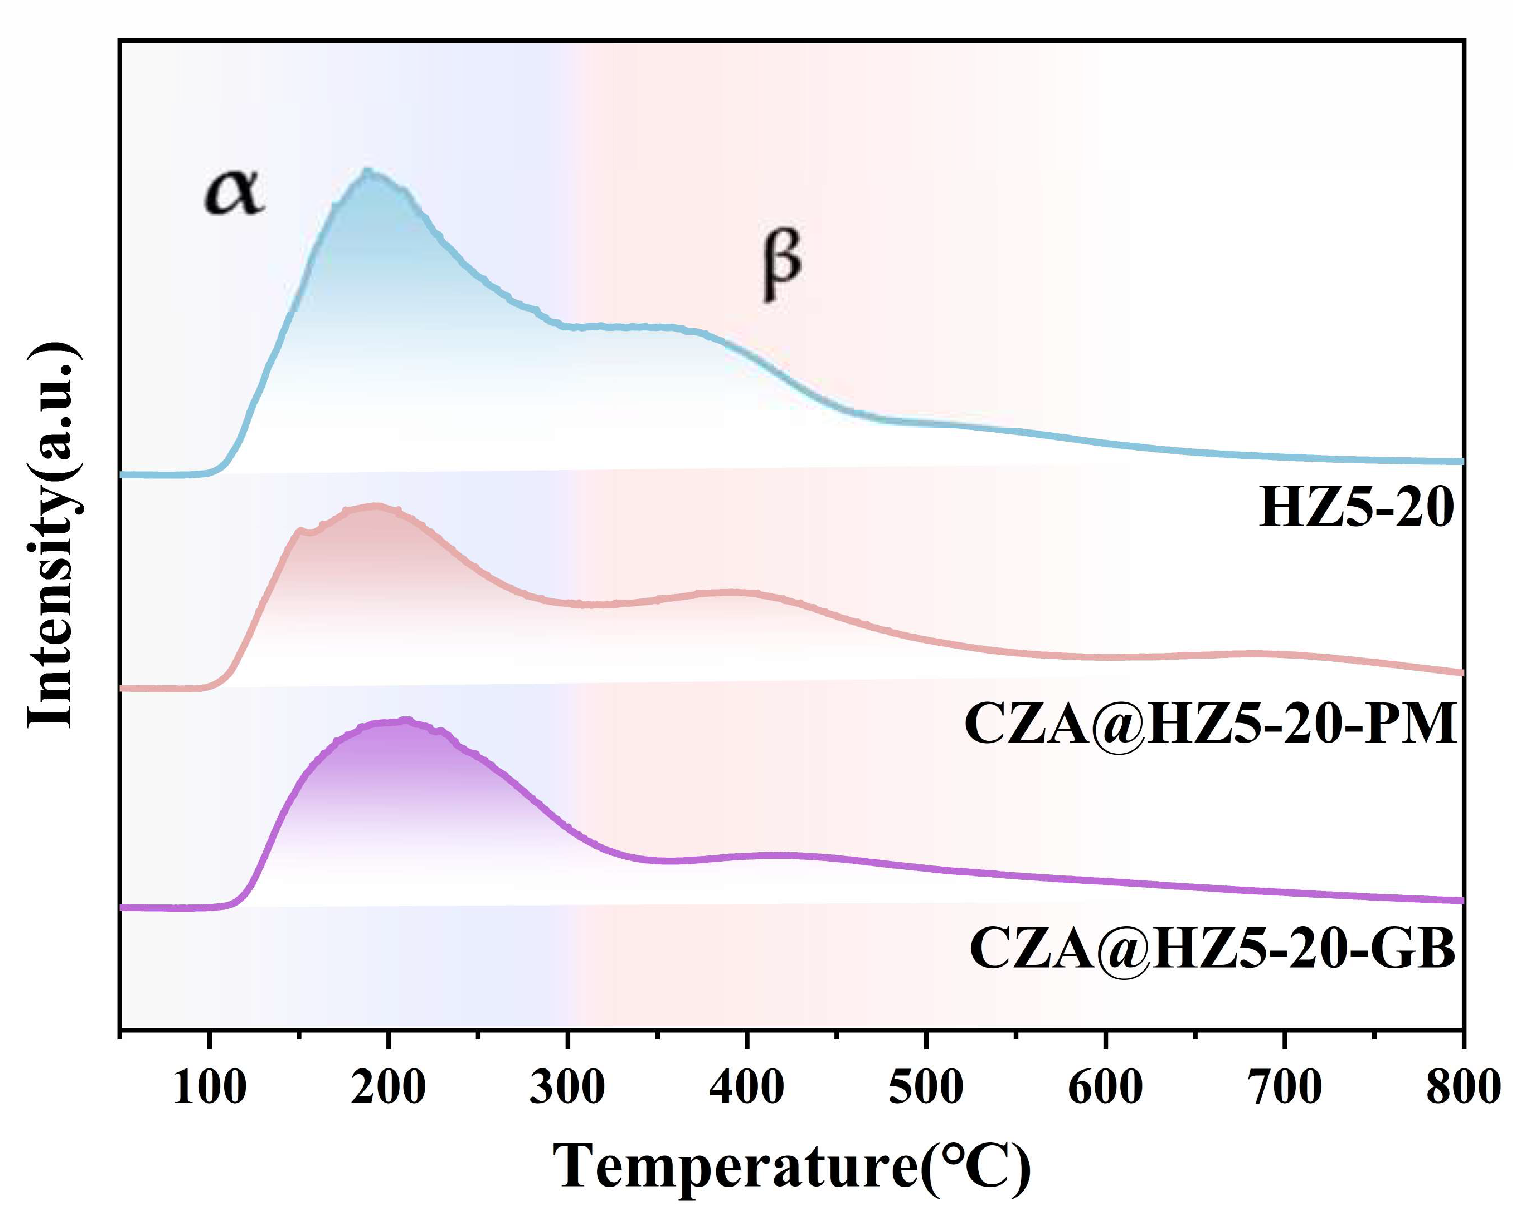
The distribution of acidic sites of the catalyst was tested by NH3-TPD (Figure 10). The number and distribution of acidic sites are listed in Table 4. It is well known that there are usually two types of acidic sites in HZSM-5 zeolite, namely weak acid sites and the strong acid sites [12]. Apparently, the distribution of weak acid sites and strong acid sites in CZA@HZ5-20-PM catalyst was almost the same as that in HZ5-20 catalyst, indicating that powder mixing treatment had no effect on the acidic sites of the catalyst. The content of weakly acidic sites in the grinding-treated catalyst CZA@HZ5-20-GB changed little, but the number of strongly acidic sites decreased significantly. Combining the previous BET characterization results and TEM test results, the grinding method led to the interpenetration of CZA particles and HZSM-5 particles, reducing the mesoporous pores in the catalyst. Studies show that reducible oxides such as ZnO and In2O3 are partially reduced to monovalent substances like In+ or [ZnOH]+ in the reaction atmosphere. These substances can easily migrate to the zeolite and irreversibly neutralize the Bronsted acid site on the closely contacting bifunctional catalyst [49]. Similarly, in this study, the catalyst CZA@HZ5-20-GB caused the strong acidic sites in the zeolite to be occupied by CuO due to the close contact space provided by the grinding treatment. The significant reduction and inactivation of strong acid sites directly resulted in the absence of DME in the product of CZA@HZ5-20-GB catalyst.

3. Materials and Methods

3.1. Sample Preparation

(1) CZA catalyst
Copper nitrate, zinc nitrate, aluminum nitrate, and sodium bicarbonate were purchased from Sinopharm. The detailed preparation process was as follows: ① Configure 1 M metal salt solution A. Solution A was configured to 100 mL, where the molar ratio of Cu2+/Zn2+/Al3+ was 6/3/2. ② Prepare 1M of precipitant solution B (250mL) with sodium bicarbonate. ③ The CuO-ZnO-Al2O3 catalyst was prepared by traditional reverse coprecipitation [6], in which solution A was slowly added to solution B in a water bath at 55 °C. ④ The resulting precipitated solution was further aged at room temperature for 2 h and then washed with deionized water. ⑤ The dried sample was further calcined in a muffle furnace at 450 °C for 4 h. The resulting catalyst was named CZA.
(2) HZSM-5 zeolite
Tetraethyl orthosilicate (TEOS) and aluminum isopropyl alcohol purchased from Sinopharm were used as silicon source and aluminum source respectively for the preparation of ZSM-5 zeolite. Tetrapropyl ammonium hydroxide (TPAOH, 25 wt.% in H2O) purchased from Sinopharm was used as a template agent. At the same time, sodium chloride and ammonium nitrate purchased from Sinopharm were also used in the preparation of ZSM-5 zeolite. In this study, ZSM-5 zeolites with different Si/Al ratios (20/30/40) were prepared by the hydrothermal method. The detailed feeding ratio was 30TEOS:7.3TPAOH:1.5 (1/0.75)Al:500H2O:2NaCl. The specific preparation process was as follows [50]:
① Aluminum isopropyl alcohol was first dissolved in water and stirred for about 20 min to form a uniform suspension. ② TPAOH was added into the solution, which was stirred for 30 min until the solution was transparent. ③ After NaCl was added to the solution as a structural guide agent, the solution continued to be stirred until it was clarified. ④ When TEOS was added to the solution, the solution was milky white. The solution was stirred at room temperature for 10 h. ⑤ The solution was then heated to 85 °C and maintained for 20 min in order to remove alcohol from the solution. ⑥ After adding deionized water to the solution to its volume before alcohol removal, we transferred the solution to a Teflon reactor. ⑦ Next, the Teflon reactor was transferred to an oven at 170 °C for 72 h. ⑧ After the hydrothermal reaction, the samples were washed in deionized water, dried, and then calcined in a muffle furnace at 550 °C for 6 h. ⑨ Ion exchange was then performed to replace Na+ with NH4+ by mixing every sample in 50 mL of 1.0 M NH4Cl solution at 50 °C for 8 h. The procedure was repeated twice to ensure complete ion exchange. ⑩ The ion-exchanged samples were again collected by centrifugation and washed in deionized water three times, dried at 120 °C overnight and calcined at 550 °C for 5 h to obtain the final H+-type ZSM-5 samples. The obtained samples were named HZ5-20, HZ5-30, and HZ5-40.
(3) CZA@HZ5 catalysts
Three kinds of physically mixed CZA catalyst and HZSM-5 zeolite were studied in this paper. ① The first one was to press CZA and HZSM-5 zeolite into 60–80-mesh particles and mix the two particles of the same weight. The prepared catalyst was named CZA@HZ5-20 (Figure 5a). ② The second one was to directly shake and evenly mix the powder of CZA and HZSM-5 zeolite of the same mass. The prepared catalyst was named CZA@HZ5-PM (Figure 5b). ③ The CZA powder and ZSM-5 powder at a 1:1 mass ratio were placed in a mortar and ground until the color was uniform. The obtained sample was pressed into 60–80-mesh particles, and the third catalyst named CZA@HZ5-GB was prepared (Figure 5c).

3.2. Characterization Methods

A powder X-ray diffractometer equipped with a Cu anticathode (D8 ADVANCE, Bruker) and Fourier infrared spectrometer (Cary 660 FTIR, Agilent) was used to measure the crystal structure and skeleton structure of catalysts. Physical adsorption apparatus (BSD-PS1/2/4, Beishide) was used to obtain the relevant parameters of specific surface area and pore size distribution of catalysts. The microstructure and element distribution of the catalysts were obtained using a scanning electron microscope (GeminiSEM 300, ZEISS, Göttingen, Germany) and transmission electron microscopy (F200S, FEI Talos). Elemental distribution and valence states for each catalyst was analyzed by ex situ X-ray photoelectron spectroscopy (XPS, Thermo Scientific K-Alpha, Waltham, MA, USA) with Al Kα (hν = 1486.6 eV) radiation. The catalysts were reduced by H2 prior to analyses. Catalyst reduction took place in the reactor under catalytic conditions of 300 °C, 4 h, and a H2 flow rate of 40 mL/min. C1 s (284.8 eV) was used as a reference for the calibration of binding energies.
A chemisorption instrument (BSD-Chem C200) equipped with a thermal conductivity detector (TCD) was used to test hydrogen temperature-programmed reduction (H2-TPR) curves of catalysts. The testing process was roughly as follows: (1) Each catalyst (~0.1 g) was placed into a U-shaped quartz tube and purged by argon at 473 K for 2 h to baseline stabilization, aiming at removing moisture and adsorbed water. (2) The temperature of the catalyst was then cooled to 323 K. (3) The catalyst was heated from 323 K to 1073 K (with a ramp rate of 5 K·min−1) in 5% H2 flow (balanced with Ar), during which the H2 consumption was measured by the TCD. A chemisorption instrument (BSD-Chem C200) equipped with mass was used to test NH3 temperature-programmed desorption (NH3-TPD) curves of catalysts. The testing process was roughly as follows: (1) Each catalyst (~0.1 g) was placed into a U-shaped quartz tube and heated from room temperature to 573 K with the heating rate of 10 K·min−1. At the same time, 5% H2 flow (balanced with Ar) (30 mL·min−1) was passed into the U-tube to reduce the catalyst and remain at 573 K for 1 h. (2) The 5% H2 flow (balanced with Ar) was replaced by He gas until the baseline was stable, while the temperature was naturally cooled to 393 K. (3) Then, 10% NH3 (balanced with He) gas (30 mL·min−1) was passed through the catalyst for 1 h to make sure the catalyst reacted completely with NH3. (4) He gas was again switched back to purge the catalyst until the baseline was stable. (5) The temperature rose to 1073 K at a heating rate of 5 K·min−1 for desorption. The data was detected by online mass spectrometry.

3.3. Performance Testing

In order to avoid the reaction gas ratio deviation caused by the reaction pressure building process, the feedstock gas was directly selected as a H2/CO2 (3:1) mixture. The reaction temperature and pressure were controlled by a three-stage furnace and backpressure regulator, respectively. Products were monitored online by a gas chromatograph (GC, GC-2014C, Shimadzu, Kyoto, Japan) equipped with a thermal conductivity detector (TCD, Kyoto, Japan) and a flame ionization detector (FID, Kyoto, Japan), and the outlet flowrate was measured by a digital bubble flowmeter.
In a typical measurement, the catalyst was evenly mixed with quartz sand and placed in the center of the reactor. The catalyst was reduced in situ in the reactor, and the reduction condition was maintained at 300 °C for 4 h, and the H2 flow rate was controlled at 40 mL/min. The reaction gas was switched to a mixture gas (H2:CO2 = 3:1), the pressure was increased to 3 MPa, the reaction temperature and the flow rate of the mixture gas were controlled to the target value, and the reaction results were collected and calculated after the performance of the catalyst was stable. The formulas for calculating relevant performance indicators were as follows:
The CO2 conversion (%) was calculated as
X C O 2 = F i n × P C O 2 , i n F o u t × P C O 2 , o u t F i n × P C O 2 , i n × 100 %
where Fin (mL·min−1) is the inlet flowrate, PCO2,in (%) is the molar fraction of CO2 in the inlet, Fout (mL·min−1) is the outlet flowrate and PCO2,out (%) is the molar fraction of CO2 in the outlet.
The selectivity of product (%) was calculated as
S i = P i , o u t × C i P i , o u t × C i
where i is the product of CO, MeOH, DME, CH4 or C2H6. Pi,out (%) is the molar fraction of product i in the outlet. Ci is the carbon number of product i.
The relative selectivity of product (%) was calculated as
R S i = S i S i S C O
where i is the product.
The yield (%) of product i was calculated as
Y i = X C O 2 × S i × 100 %
where i is the product.
The space–time yield (g∙kgcat−1∙h−1) in unit mass of a catalyst of product i was calculated as
S T Y i = F i n × P C O 2 , i n × X C O 2 × S i × M i × 60 m c a t × 22.4
where i is the product. Mi (g/mol) is the mole weight of product i. mcat (g) is the mass of the catalyst.
The carbon balance of each catalyst was confirmed before and after reactions (within 100 ± 1%).

4. Conclusions

This study analyzed the mechanisms by which various factors affect the catalytic results from multiple perspectives, including the gas velocity of the feedstock, the reaction temperature, the content of acidic sites in the carrier, the filling amount of active component, and the mixing mode of the active component and the carrier. The conclusion is as follows: (1) The increase in the catalytic reaction temperature will significantly enhance the CO2 conversion rate, but the reverse water–gas reaction is also greatly promoted. When the temperature reaches 350 °C, CO further converts to CH4 and even reacts with the adsorbed H* on the surface of the catalyst to produce C2H6. The temperature of the catalytic reaction can affect the type of catalytic products. (2) The CO2 conversion rate is positively correlated with the dosage of CZA. The addition of HZSM-5 zeolite carrier does not increase the conversion rate of CO2, but it promotes the catalytic reaction in the direction of MeOH and DME, significantly reducing the selectivity of CO in the product. (3) The uniform grinding treatment of CZA powder and HZSM-5 powder can cause the inactivation of strongly acidic sites in HZSM-5 zeolite due to element migration, but it cannot affect the content and activity of weakly acidic sites. This has a direct impact on the distribution of catalytic products, mainly including no DME generation and significantly improved MeOH selectivity.

Supplementary Materials

The following supporting information can be downloaded at https://www.mdpi.com/article/10.3390/catal15111068/s1: Figure S1: Schematic diagram of the reaction device; Figure S2: Performance of catalyst CZA@HZ5-30 in CO2 hydrogenation with different gas velocities (250℃, 3 MPa, 0.1 g CZA+0.1g HZ5-30): (a) CO2 conversion of catalysts and selectivity of catalyst CZA@HZ5-30 with different gas velocities; (b) relative selectivity of products without CO; (c) the yield of the different catalytic products and the ratio of the yield of the target products (products without CO, Y(MeOH+DME+CH4+C2H6)) to the yield of the by-product (CO, YCO); (d) the space–time yield of different catalytic products and the ratio of the space–time yield of the target products (products without CO, STY(MeOH+DME+CH4+C2H6)) to the space–time yield of the by-product (CO, STYCO); Figure S3: Performance of catalyst CZA@HZ5-20 in CO2 hydrogenation with different temperatures (3 MPa, 40 mL/min, 0.2 g CZA+0.2g HZ5-20): (a) CO2 conversion of catalysts and selectivity of catalyst CZA@HZ5-20 with different temperatures; (b) relative selectivity of products without CO; (c) the yield of the different catalytic products and the ratio of the yield of the target products (products without CO, Y(MeOH+DME+CH4+C2H6)) to the yield of the by-product (CO, YCO); (d) the space–time yield of different catalytic products and the ratio of the space–time yield of the target products (products without CO, STY(MeOH+DME+CH4+C2H6)) to the space–time yield of the by-product (CO, STYCO); Figure S4: Performance of catalysts CZA@HZ5-20, CZA@HZ5-30, CZA@HZ5-40 in CO2 hydrogenation (250℃, 3 MPa, 10 mL/min): (a) CO2 conversion of catalysts and selectivity of different products; (b) relative selectivity of products without CO; (c) the yield of the different catalytic products; (d) the space–time yield of different catalytic products; Figure S5: NH3-TPD of HZ5-20, HZ5-30 and HZ5-40 zeolite; Table S1: Acid sites content and distribution of HZSM-5 zeolite; Table S2: Comparison of catalytic performances with other reported HZSM-5 catalysts for CO2 hydrogenation reaction [15,17,18,51,52].

Author Contributions

Conceptualization, H.J., T.D. and Y.W.; methodology, H.J. and Y.W.; validation, H.J., Y.L. and R.X.; formal analysis, H.J., Z.S. and B.Y.; writing—original draft preparation, H.J.; writing—review and editing, P.C. and Y.W.; supervision, Y.W.; funding acquisition, T.D. and Y.W. All authors have read and agreed to the published version of the manuscript.

Funding

This research was funded by the National Natural Science Foundation of China (No. U24A20195 and 52270177) and the Liaoning Province Science and Technology Plan Joint Program (Key Research and Development Program Project) (No. 2023JH2/101800058).

Data Availability Statement

Our data can only be obtained by contacting us by email.

Conflicts of Interest

The authors declare no conflicts of interest.

References

  1. Gür, T.M. Carbon Dioxide Emissions, Capture, Storage and Utilization: Review of Materials, Processes and Technologies. Prog. Energy Combust. Sci. 2022, 89, 100965. [Google Scholar] [CrossRef]
  2. Overa, S.; Feric, T.G.; Park, A.H.A.; Jiao, F. Tandem and Hybrid Processes for Carbon Dioxide Utilization. Joule 2021, 5, 8–13. [Google Scholar] [CrossRef]
  3. Nie, X. Application Prospect of Carbon Dioxide Hydrogenation to Methanol Technology in the New Electric Power Systems. AJEE 2024, 12, 17–25. [Google Scholar] [CrossRef]
  4. Lin, T.C.; Bhan, A. Rates and Reversibility of CO2 Hydrogenation on Cu-Based Catalysts. J. Catal. 2024, 429, 115214. [Google Scholar] [CrossRef]
  5. Sun, J.; Liu, F.; Salahuddin, U.; Wu, M.; Zhu, C.; Lu, X.; Zhang, B.; Zhao, B.; Xie, Z.; Ding, Y.; et al. Optimization and Understanding of ZnO Nanoarray Supported Cu-ZnO-Al2O3 Catalyst for Enhanced CO2 -Methanol Conversion at Low Temperature and Pressure. Chem. Eng. J. 2023, 455, 140559. [Google Scholar] [CrossRef]
  6. Liu, Z.; An, X.; Song, M.; Wang, Z.; Wei, Y.; Mintova, S.; Giordano, G.; Yan, Z. Dry Gel Assisting Crystallization of Bifunctional CuO–ZnO–Al2O3/SiO2–Al2O3 Catalysts for CO2 Hydrogenation. Biomass Bioenergy 2022, 163, 106525. [Google Scholar] [CrossRef]
  7. Cui, X.; Luo, M.; Yang, Z.; Rahman, R.; Li, Z.; Yang, W.; Xia, L. Efficient Cu–Zn–Al/LDH Catalysts for CO2 -to-Methanol Conversion. Energy Fuels 2025, 39, 2675–2687. [Google Scholar] [CrossRef]
  8. Li, X.; Eliasson, H.; Dachraoui, W.; Erni, R. Growth and Mobility of Copper in Industrial Cu/ZnO/Al2O3 Hydrogenation Catalyst Investigated by in Situ Gas-Cell Scanning Transmission Electron Microscopy. Appl. Surf. Sci. 2025, 688, 162321. [Google Scholar] [CrossRef]
  9. Shao, S.; Cui, C.; Tang, Z.; Li, G. Recent Advances in Metal-Organic Frameworks for Catalytic CO2 Hydrogenation to Diverse Products. Nano Res. 2022, 15, 10110–10133. [Google Scholar] [CrossRef]
  10. Bao, C.; Li, Y.T.; Zhang, Q.; Hu, T.L. Copper Nanoparticles Supported on Metal-Organic Framework with Topological Defects for CO2 Hydrogenation to Methanol. J. Colloid Interface Sci. 2025, 686, 1147–1156. [Google Scholar] [CrossRef]
  11. Chen, J.; Wang, X.; Wu, D.; Zhang, J.; Ma, Q.; Gao, X.; Lai, X.; Xia, H.; Fan, S.; Zhao, T.S. Hydrogenation of CO2 to Light Olefins on CuZnZr@(Zn-)SAPO-34 Catalysts: Strategy for Product Distribution. Fuel 2019, 239, 44–52. [Google Scholar] [CrossRef]
  12. Zhu, D.; Wang, Z.; Meng, F.; Zhao, B.; Kanitkar, S.; Tang, Y. Catalytic Conversion of Chloromethane to Olefins and Aromatics Over Zeolite Catalysts. Catal. Lett. 2021, 151, 1038–1048. [Google Scholar] [CrossRef]
  13. Wang, C.; Yang, L.; Gao, M.; Shao, X.; Dai, W.; Wu, G.; Guan, N.; Xu, Z.; Ye, M.; Li, L. Directional Construction of Active Naphthalenic Species within SAPO-34 Crystals toward More Efficient Methanol-to-Olefin Conversion. J. Am. Chem. Soc. 2022, 144, 21408–21416. [Google Scholar] [CrossRef]
  14. Ali, M.; Zafar, F.; Shen, D.; Wang, X.; Wook Bae, J. Contributions of ZSM-5 Morphology over Hybridized ZnO-ZrO2/ZSM-5 for Direct CO2 Hydrogenation Activity to Aromatics. Fuel 2024, 378, 132925. [Google Scholar] [CrossRef]
  15. Kosari, M.; Lee, K.; Wang, C.; Rimaz, S.; Zhou, S.; Hondo, E.; Xi, S.; Seayad, A.M.; Zeng, H.C.; Borgna, A. Optimizing Hollow ZSM-5 Spheres (hZSM5) Morphology and Its Intrinsic Acidity for Hydrogenation of CO2 to DME with Copper–Aluminum. Chem. Eng. J. 2023, 470, 144196. [Google Scholar] [CrossRef]
  16. Bonura, G.; Cordaro, M.; Cannilla, C.; Mezzapica, A.; Spadaro, L.; Arena, F.; Frusteri, F. Catalytic Behaviour of a Bifunctional System for the One Step Synthesis of DME by CO2 Hydrogenation. Catal. Today 2014, 228, 51–57. [Google Scholar] [CrossRef]
  17. Mohamed, A.T.; Ahmad, Y.H.; Anwer, A.H.; Soliman, A.; Saad, M.A.H.; Aroua, M.K.; Al-Qaradawi, S.Y.; Benamor, A. CO2 Conversion to Dimethyl Ether on Cu/ZnO/Al2O3-ZSM-5 Tandem Catalysts in a Double-Bed Reactor: Tuning the ZSM-5 Catalyst Acidity and Porosity. Energy Fuels 2025, 39, 2059–2074. [Google Scholar] [CrossRef]
  18. Ren, S.; Fan, X.; Shang, Z.; Shoemaker, W.R.; Ma, L.; Wu, T.; Li, S.; Klinghoffer, N.B.; Yu, M.; Liang, X. Enhanced Catalytic Performance of Zr Modified CuO/ZnO/Al2O3 Catalyst for Methanol and DME Synthesis via CO2 Hydrogenation. J. CO2 Util. 2020, 36, 82–95. [Google Scholar] [CrossRef]
  19. Yang, G.; Tsubaki, N.; Shamoto, J.; Yoneyama, Y.; Zhang, Y. Confinement Effect and Synergistic Function of H-ZSM-5/Cu-ZnO-Al2O3 Capsule Catalyst for One-Step Controlled Synthesis. J. Am. Chem. Soc. 2010, 132, 8129–8136. [Google Scholar] [CrossRef]
  20. Dokania, A.; Dutta Chowdhury, A.; Ramirez, A.; Telalovic, S.; Abou-Hamad, E.; Gevers, L.; Ruiz-Martinez, J.; Gascon, J. Acidity Modification of ZSM-5 for Enhanced Production of Light Olefins from CO2. J. Catal. 2020, 381, 347–354. [Google Scholar] [CrossRef]
  21. Ojelade, O.A.; Zaman, S.F. A Review on CO2 Hydrogenation to Lower Olefins: Understanding the Structure-Property Relationships in Heterogeneous Catalytic Systems. J. CO2 Util. 2021, 47, 101506. [Google Scholar] [CrossRef]
  22. Ding, X.; Duan, J.; Jia, M.; Fan, H.; Lyu, Y.; Fu, J.; Liu, X. Advanced Zeolite-Based Catalysts for CO2 Hydrogenation to Targeted High-Value Chemicals and Fuels. Chem. Asian J. 2025, 20, e202401703. [Google Scholar] [CrossRef]
  23. Li, W.; Wang, K.; Zhan, G.; Huang, J.; Li, Q. Design and Synthesis of Bioinspired ZnZrOx&Bio-ZSM-5 Integrated Nanocatalysts to Boost CO2 Hydrogenation to Light Olefins. ACS Sustain. Chem. Eng. 2021, 9, 6446–6458. [Google Scholar] [CrossRef]
  24. Liu, J.; Yang, C.; Li, S.; Zhang, J.; Bu, X.; Wang, H.; Ji, T.; Li, J.; Chang, C.R.; Shi, Y.; et al. Low-Temperature CO2 Hydrogenation to Aromatics over ZnZrO Integrated with Boron-Modified ZSM-5. Appl. Catal. B Environ. Energy 2025, 377, 125523. [Google Scholar] [CrossRef]
  25. Xin, Q.; Guo, H.; Wang, Y.; Xiao, L.; Wang, W.; Wu, W. Indium-Promoted ZnZrOx/Nano-ZSM-5 for Efficient Conversion of CO2 to Aromatics with High Selectivity. J. Environ. Chem. Eng. 2022, 10, 108032. [Google Scholar] [CrossRef]
  26. Guo, Y.; Zhao, Z. Ethanol as a Binder to Fabricate a Highly-Efficient Capsule-Structured CuO−ZnO−Al2O3@HZSM-5 Catalyst for Direct Production of Dimethyl Ether from Syngas. ChemCatChem 2020, 12, 999–1006. [Google Scholar] [CrossRef]
  27. Sun, Y.; Han, X.; Zhao, Z. Direct Coating Copper–Zinc–Aluminum Oxalate with H-ZSM-5 to Fabricate a Highly Efficient Capsule-Structured Bifunctional Catalyst for Dimethyl Ether Production from Syngas. Catal. Sci. Technol. 2019, 9, 3763–3770. [Google Scholar] [CrossRef]
  28. Sibi, M.G.; Verma, D.; Kim, J. Direct Conversion of CO2 into Aromatics over Multifunctional Heterogeneous Catalysts. Catal. Rev. 2024, 66, 863–922. [Google Scholar] [CrossRef]
  29. Lin, M.; Jiang, D.; Yan, Y.; Zhan, L.; Song, X.; Li, R.; Wu, Y. Selective Regulation of Products for Guaiacol Hydrodeoxygenation by Adjusting Type and Acidity of Supports. Bioresour. Technol. 2024, 413, 131478. [Google Scholar] [CrossRef] [PubMed]
  30. Guo, S.; Fan, S.; Wang, H.; Wang, S.; Qin, Z.; Dong, M.; Fan, W.; Wang, J. Selective Conversion of CO2 to Trimethylbenzene and Ethene by Hydrogenation over a Bifunctional ZnCrOx/H-ZSM-5 Composite Catalyst. ACS Catal. 2024, 14, 271–282. [Google Scholar] [CrossRef]
  31. Wang, Y.; Liu, S.; Wang, J.; Liu, F.; Ma, J.; Yao, M.; Geng, S.; Cao, J.; Li, Z. Direct Conversion of Carbon Dioxide into Light Olefins over ZnZrOx/ZSM-5@n-ZrO2 Tandem Catalyst. Fuel 2024, 357, 129727. [Google Scholar] [CrossRef]
  32. García-Trenco, A.; Martínez, A. A Rational Strategy for Preparing Cu–ZnO/H-ZSM-5 Hybrid Catalysts with Enhanced Stability during the One-Step Conversion of Syngas to Dimethyl Ether (DME). Appl. Catal. A Gen. 2015, 493, 40–49. [Google Scholar] [CrossRef]
  33. Baracchini, G.; Machoke, A.G.F.; Klumpp, M.; Wen, R.; Arnold, P.; Schwieger, W.; Dittmeyer, R. Structured Catalysts for the Direct Synthesis of Dimethyl Ether from Synthesis Gas: A Comparison of Core@shell versus Hybrid Catalyst Configuration. Catal. Today 2020, 342, 46–58. [Google Scholar] [CrossRef]
  34. Jia, H.; Du, T.; Fang, X.; Gong, H.; Qiu, Z.; Li, Y.; Wang, Y. Synthesis of Template-Free ZSM-5 from Rice Husk Ash at Low Temperatures and Its CO2 Adsorption Performance. ACS Omega 2021, 6, 3961–3972. [Google Scholar] [CrossRef]
  35. Chen, Z.; Liu, Z.; Xu, X. Clarifying the Methanol Synthesis Mechanism via CO2 Hydrogenation on the Cu(111) Surface: Insights from Accurate Doubly Hybrid Density Functionals. ACS Catal. 2025, 15, 5039–5045. [Google Scholar] [CrossRef]
  36. Ren, H.; Xu, C.H.; Zhao, H.-Y.; Wang, Y.-X.; Liu, J.; Liu, J.Y. Methanol Synthesis from CO2 Hydrogenation over Cu/γ-Al2O3 Catalysts Modified by ZnO, ZrO2 and MgO. J. Ind. Eng. Chem. 2015, 28, 261–267. [Google Scholar] [CrossRef]
  37. Jiang, Q.; Liu, Y.; Dintzer, T.; Luo, J.; Parkhomenko, K.; Roger, A.C. Tuning the Highly Dispersed Metallic Cu Species via Manipulating Brønsted Acid Sites of Mesoporous Aluminosilicate Support for CO2 Hydrogenation Reactions. Appl. Catal. B Environ. 2020, 269, 118804. [Google Scholar] [CrossRef]
  38. Van Schagen, T.N.; Keestra, H.; Brilman, D.W.F. Improved Kinetic Model for Methanol Synthesis with Cu/ZnO/Al2O3 Catalysts Based on an Extensive State-of-the-Art Dataset. Chem. Eng. J. 2025, 507, 159953. [Google Scholar] [CrossRef]
  39. Grabow, L.C.; Mavrikakis, M. Mechanism of Methanol Synthesis on Cu through CO2 and CO Hydrogenation. ACS Catal. 2011, 1, 365–384. [Google Scholar] [CrossRef]
  40. Krim, K.; Sachse, A.; Le Valant, A.; Pouilloux, Y.; Hocine, S. One Step Dimethyl Ether (DME) Synthesis from CO2 Hydrogenation over Hybrid Catalysts Containing Cu/ZnO/Al2O3 and Nano-Sized Hollow ZSM-5 Zeolites. Catal. Lett. 2023, 153, 83–94. [Google Scholar] [CrossRef]
  41. Varimalla, S.; Manda, K.; Boggala, S.; Nappuni, R.C.; Inkollu, S.; Aytam, H.P.; Akula, V. Effect of Method of Preparation of Ni and/or Cu Supported on ZSM-5 Catalysts for the Aqueous Phase Hydrogenation of Levulinic Acid to γ-Valerolactone. Catal. Today 2024, 441, 114916. [Google Scholar] [CrossRef]
  42. Fang, X.; Men, Y.; Wu, F.; Zhao, Q.; Singh, R.; Xiao, P.; Liu, L.; Du, T.; Webley, P.A. Highly Dispersed Cu-ZnO-ZrO2 Nanoparticles on Hydrotalcite Adsorbent as Efficient Composite Catalysts for CO2 Hydrogenation to Methanol. Korean J. Chem. Eng. 2021, 38, 747–755. [Google Scholar] [CrossRef]
  43. Xue, H.; Meng, T.; Liu, F.; Guo, X.; Wang, S.; Mao, D. Enhanced Resistance to Calcium Poisoning on Zr-Modified Cu/ZSM-5 Catalysts for the Selective Catalytic Reduction of NO with NH3. RSC Adv. 2019, 9, 38477–38485. [Google Scholar] [CrossRef]
  44. Han, Y.; Wang, Y.; Wang, Y.; Hu, Y.; Nian, Y.; Li, W.; Zhang, J. Pyrrolidone Ligand Improved Cu-based Catalysts with High Performance for Acetylene Hydrochlorination. Appl. Organom. Chem. 2021, 35, e6066. [Google Scholar] [CrossRef]
  45. Kamsuwan, T.; Guntida, A.; Praserthdam, P.; Jongsomjit, B. Differences in Deterioration Behaviors of Cu/ZnO/Al2O3 Catalysts with Different Cu Contents toward Hydrogenation of CO and CO2. ACS Omega 2022, 7, 25783–25797. [Google Scholar] [CrossRef] [PubMed]
  46. Jia, H.; Du, T.; Li, Y.; Wang, H.; Yue, Q.; Zhou, L.; Wang, Y. Preparation of Catalyst for CO2 Hydrogenation Reaction Based on the Idea of Element Sharing and Preliminary Exploration of Catalytic Mechanism. Environ. Sci. Pollut. Res. 2024, 31, 48014–48026. [Google Scholar] [CrossRef]
  47. Adasho Achomo, M.; Kumar, A.; Muthukumar, P.; Peela, N.R. Experimental Studies on Hydrogen Production from Steam Reforming of Methanol Integrated with Metal Hydride-Based Hydrogen Purification System. Int. J. Hydrog. Energy 2024, 76, 28–43. [Google Scholar] [CrossRef]
  48. Ojeda, M.; Osterman, N.; Dražić, G.; Fele Žilnik, L.; Meden, A.; Kwapinski, W.; Balu, A.M.; Likozar, B.; Novak Tušar, N. Conversion of Palmitic Acid Over Bi-Functional Ni/ZSM-5 Catalyst: Effect of Stoichiometric Ni/Al Molar Ratio. Top. Catal. 2018, 61, 1757–1768. [Google Scholar] [CrossRef]
  49. Xu, D.; Fan, H.; Liu, K.; Hou, G.; Qin, C.; Xu, Y.; Li, R.; Wang, J.; Ding, M. Impacts of Interaction between Active Components on Catalyst Deactivation over KFe/ZSM-5 Bifunctional Catalyst. ACS Sustain. Chem. Eng. 2023, 11, 10441–10452. [Google Scholar] [CrossRef]
  50. Wan, Z.; Wu, W.; Li, G.K.; Wang, C.; Yang, H.; Zhang, D. Effect of SiO2/Al2O3 Ratio on the Performance of Nanocrystal ZSM-5 Zeolite Catalysts in Methanol to Gasoline Conversion. Appl. Catal. A Gen. 2016, 523, 312–320. [Google Scholar] [CrossRef]
  51. Sun, K.; Lu, W.; Wang, M.; Xu, X. Low-temperature synthesis of DME from CO2/H2 over Pd-modified CuO–ZnO–Al2O3–ZrO2/HZSM-5 catalysts. Catal. Commun. 2004, 5, 367–370. [Google Scholar] [CrossRef]
  52. Hu, Y.; Zhang, Y.; Du, J.; Li, C.; Wang, K.; Liu, L.; Yu, X.; Wang, K.; Liu, N. The influence of composition on the functionality of hybrid CuO–ZnO–Al2O3/HZSM-5 for the synthesis of DME from CO2 hydrogenation. RSC Adv. 2018, 8, 30387–30395. [Google Scholar] [CrossRef] [PubMed]
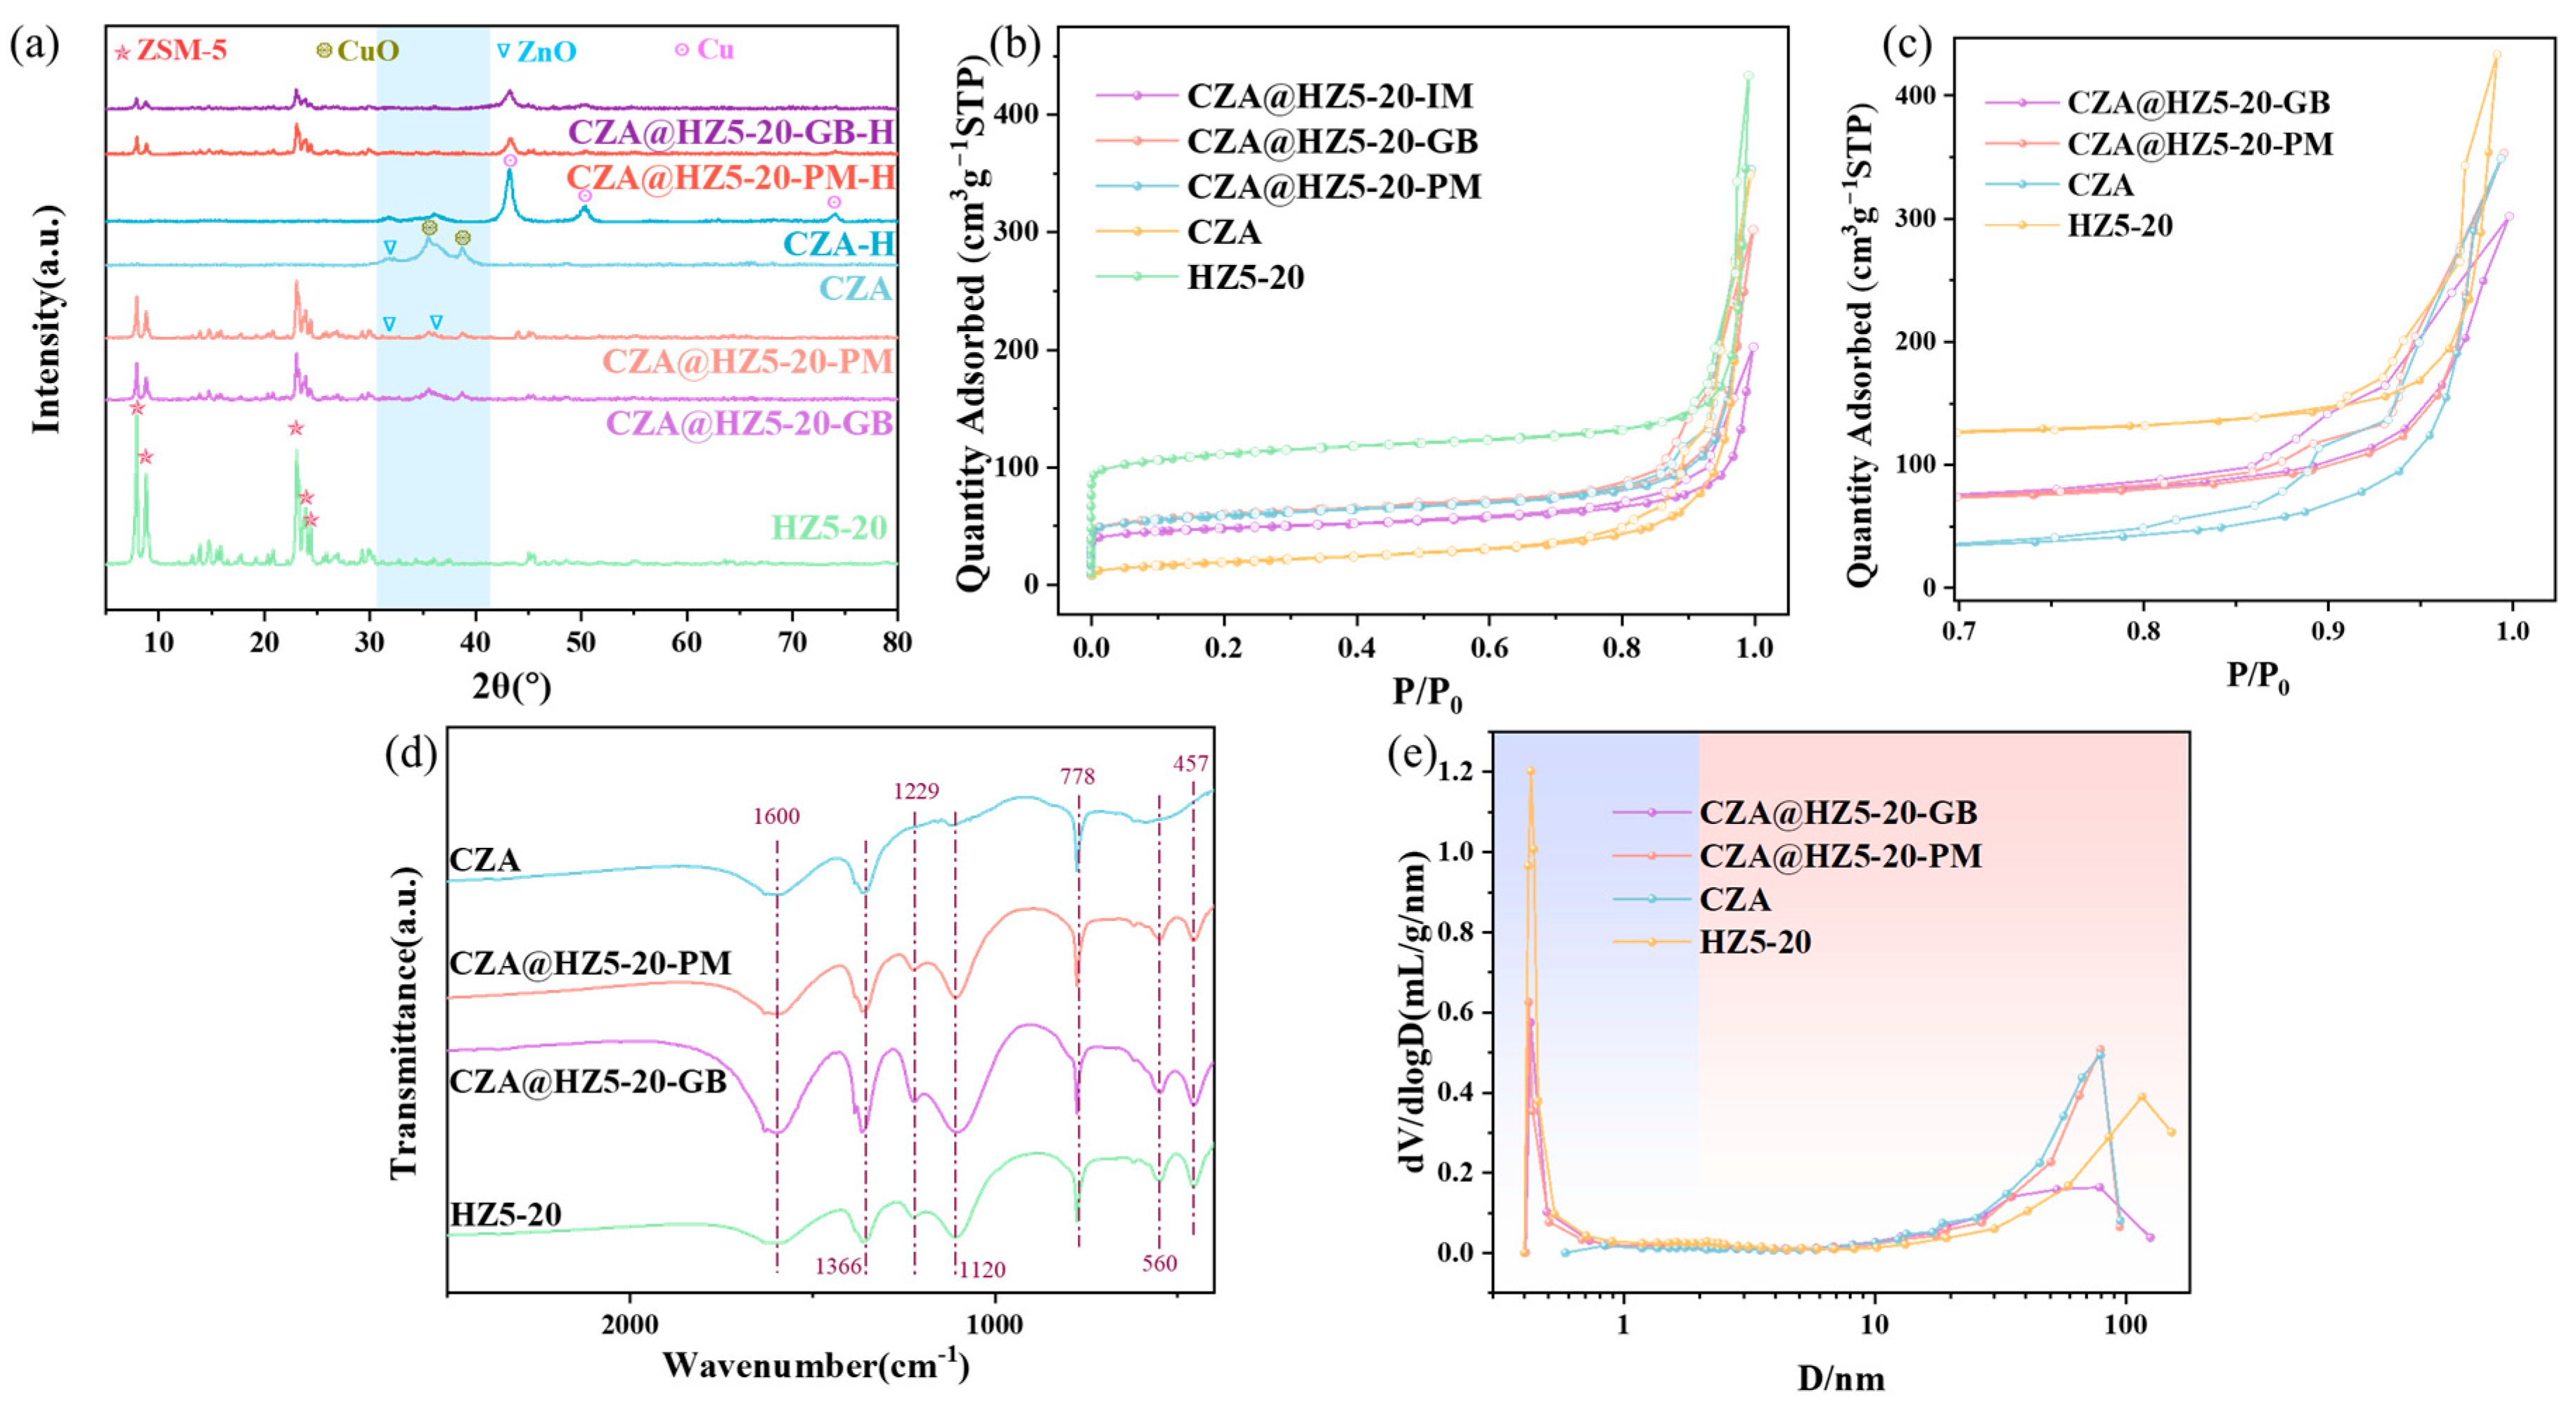
Figure 1. Structural characterization of catalysts (HZ5-20, CZA@HZ5-20-GB, CZA@HZ5-20-PM, CZA): (a) XRD pattern; (b) N2 adsorption–desorption isotherm; (c) local magnification of the N2 adsorption–desorption isotherm; (d) FTIR spectra; (e) pore size distribution.
Catalysts 15 01068 g001
Figure 2. SEM images and surface mapping of catalysts: (a) HZ5-20; (b) CZA; (c) CZA@HZ5-20-GB; (d) CZA@HZ5-20-PM.
Catalysts 15 01068 g002
Figure 3. TEM images and surface mapping of catalysts: (a,d) CZA; (b,e) CZA@HZ5-20-GB; (c,f) CZA@HZ5-20-PM.
Catalysts 15 01068 g003
Figure 4. Performance of catalysts CZA-0.1, CZA-0.2, CZA@HZ5-20 in CO2 hydrogenation (250 °C, 3 MPa, 10 mL/min): (a) CO2 conversion of catalysts and selectivity of different products; (b) relative selectivity of products without CO; (c) the yield of the different catalytic products and the ratio of the yield of the target products (products without CO, Y(MeOH+DME+CH4+C2H6)) to the yield of the by-product (CO, YCO); (d) the space–time yield of different catalytic products and the ratio of the space–time yield of the target products (products without CO, STY(MeOH+DME+CH4+C2H6)) to the space–time yield of the by-product (CO, STYCO). The red arrow indicates that the value of the red line corresponds to the red coordinate axis on the right.
Catalysts 15 01068 g004
Figure 5. Catalyst loading state diagram: (a) CZA@HZ5; (b) CZA@HZ5-PM; (c) CZA@HZ5-GB.
Catalysts 15 01068 g005
Figure 6. Performance of catalysts CZA@HZ5-20, CZA@HZ5-20-GB, CZA@HZ5-20-PM in CO2 hydrogenation (250 °C, 3 MPa, 10 mL/min): (a) CO2 conversion of catalysts and selectivity of different products; (b) relative selectivity of products without CO; (c) the yield of the different catalytic products; (d) the space–time yield of different catalytic products. The red arrow indicates that the value of the red line corresponds to the red coordinate axis on the right.
Catalysts 15 01068 g006
Figure 7. H2-TPR of catalysts.
Catalysts 15 01068 g007
Figure 8. XPS results: (a) Cu2p fine spectra of catalysts; (b) Cu LMM fine spectra of catalysts.
Catalysts 15 01068 g008
Figure 9. XPS results: (a) Zn2p fine spectra of catalysts; (b) Al2p fine spectra of catalysts; (c) Si2p fine spectra of catalysts.
Catalysts 15 01068 g009
Figure 10. NH3-TPD of catalysts.
Catalysts 15 01068 g010
Table 1. Textural properties of samples.
CatalystsSBET
(m2/g)
t-Plot SMicro
(m2/g)
Vtotal
(cm3/g)
Vmicropore
(cm3/g)
Rmicropore
(%)
HZ5-20348.4220.80.54710.171531.35
CZA@HZ5-20-GB189.5138.50.38530.091823.83
CZA@HZ5-20-PM186.8104.60.45370.090019.84
CZA66.713.90.44800.02896.45
Note: SBET = BET surface area, which was calculated using the BET method; t-Plot SMicro = micropore area, which was determined using the t-plot method. Vtotal = total pore volume, which was calculated using the NLDFT model; Vmicropore = micropore volume (D ≤ 2 nm), which was calculated using the NLDFT model. Rmicropore represents the proportion of micropore volume to total pore volume.
Table 2. Catalytic properties of catalysts CZA-0.1, CZA-0.2, and CZA@HZ5-20.
SamplesXCO2
(%)
Selectivity (%)Yield (%)Space–Time Yield (g∙kgcat−1∙h−1)
MeOHDMECOMeOHDMECOMeOHDMECO
CZA-0.1 7.47 10.75 0.00 89.25 0.81 0.00 6.66 19.68 0.00 141.52
CZA-0.2 11.57 8.07 0.00 91.93 0.93 0.00 10.64 8.59 0.00 85.53
CZA@HZ5-20 7.24 4.37 19.76 75.87 0.33 1.44 5.48 3.81 23.60 54.77
Table 3. Catalytic properties of catalysts CZA@HZ5-20-PM, CZA@HZ5-20-GB, and CZA@HZ5-20.
SamplesXCO2
(%)
Selectivity (%)Yield (%)Space–Time Yield (g∙kgcat−1∙h−1)
MeOHDMECOMeOHDMECOMeOHDMECO
CZA@HZ5-20-PM 7.39 3.41 19.17 77.42 0.25 1.42 5.72 2.42 19.55 48.01
CZA@HZ5-20-GB 7.46 18.21 0.00 81.79 1.36 0.00 6.11 14.18 0.00 55.66
CZA@HZ5-20 7.24 4.37 19.76 75.87 0.33 1.44 5.48 3.81 23.60 54.77
Table 4. Acid site content and distribution of HZSM-5 zeolite.
SamplesPeak α (%)DANH3-α (mmol/g)Peak β (%)DANH3-β (mmol/g)
CZA@HZ5-20-GB 68.00 0.68 32.00 0.32
CZA@HZ5-20-PM 58.18 0.64 41.82 0.46
HZ5-20 58.91 0.95 41.09 0.66
Note: Peak α represents the NH3 desorption peak of catalyst at lower temperature. Peak β represents the NH3 desorption peak of catalyst at higher temperature; DANH3-α (mmol/g) represents the NH3 desorption amount of unit mass sample at lower temperatures (calibrated by mass spectrometry); DANH3-β (mmol/g) represents the NH3 desorption amount of unit mass sample at higher temperatures (calibrated by mass spectrometry).
Disclaimer/Publisher’s Note: The statements, opinions and data contained in all publications are solely those of the individual author(s) and contributor(s) and not of MDPI and/or the editor(s). MDPI and/or the editor(s) disclaim responsibility for any injury to people or property resulting from any ideas, methods, instructions or products referred to in the content.